Georgetown Quitman County unified government, GA Map & Demographics
Georgetown Quitman County unified government Overview
$22,189
PER CAPITA INCOME
$59,500
AVG FAMILY INCOME
$38,889
AVG HOUSEHOLD INCOME
16.1%
WAGE / INCOME GAP [ % ]
83.9¢/ $1
WAGE / INCOME GAP [ $ ]
$18,175
FAMILY INCOME DEFICIT
0.47
INEQUALITY / GINI INDEX
2,180
TOTAL POPULATION
1,179
MALE POPULATION
1,001
FEMALE POPULATION
117.78
MALES / 100 FEMALES
84.90
FEMALES / 100 MALES
59.1
MEDIAN AGE
3.2
AVG FAMILY SIZE
2.3
AVG HOUSEHOLD SIZE
687
LABOR FORCE [ PEOPLE ]
35.1%
PERCENT IN LABOR FORCE
23.5%
UNEMPLOYMENT RATE
Income in Georgetown Quitman County unified government
Income Overview in Georgetown Quitman County unified government
Per Capita Income in Georgetown Quitman County unified government is $22,189, while median incomes of families and households are $59,500 and $38,889 respectively.
| Characteristic | Number | Measure |
| Per Capita Income | 2,180 | $22,189 |
| Median Family Income | 536 | $59,500 |
| Mean Family Income | 536 | $71,750 |
| Median Household Income | 958 | $38,889 |
| Mean Household Income | 958 | $51,307 |
| Income Deficit | 536 | $18,175 |
| Wage / Income Gap (%) | 2,180 | 16.12% |
| Wage / Income Gap ($) | 2,180 | 83.88¢ per $1 |
| Gini / Inequality Index | 2,180 | 0.47 |
Earnings by Sex in Georgetown Quitman County unified government
Average Earnings in Georgetown Quitman County unified government are $28,342, $28,967 for men and $24,297 for women, a difference of 16.1%.
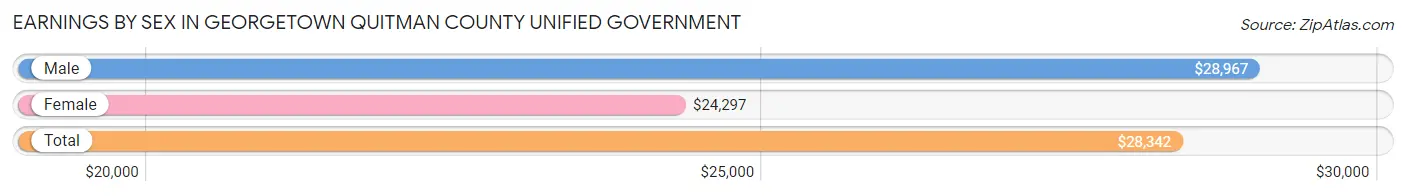
| Sex | Number | Average Earnings |
| Male | 320 (50.1%) | $28,967 |
| Female | 319 (49.9%) | $24,297 |
| Total | 639 (100.0%) | $28,342 |
Earnings by Sex by Income Bracket in Georgetown Quitman County unified government
The most common earnings brackets in Georgetown Quitman County unified government are $25,000 to $29,999 for men (63 | 19.7%) and $17,500 to $19,999 for women (58 | 18.2%).
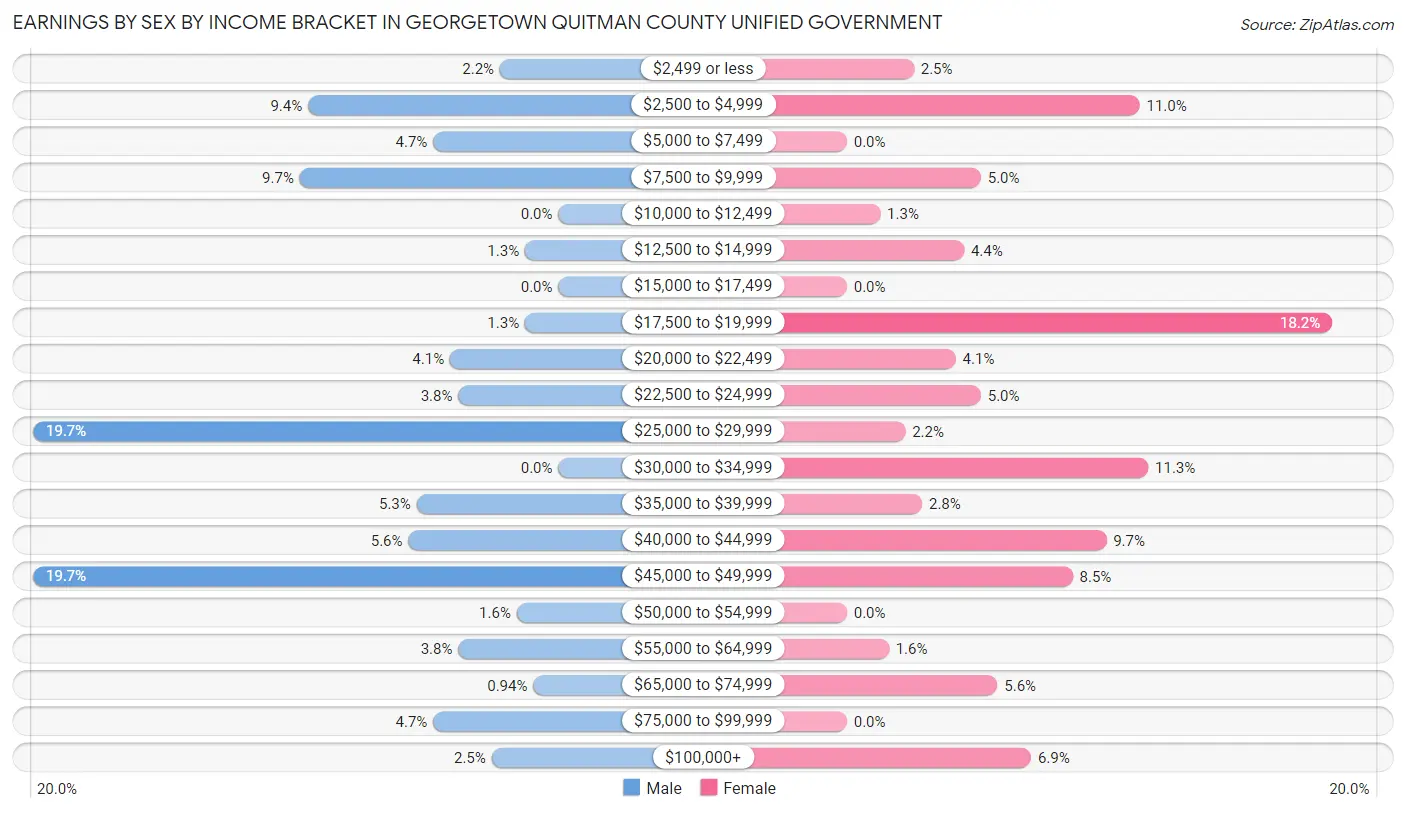
| Income | Male | Female |
| $2,499 or less | 7 (2.2%) | 8 (2.5%) |
| $2,500 to $4,999 | 30 (9.4%) | 35 (11.0%) |
| $5,000 to $7,499 | 15 (4.7%) | 0 (0.0%) |
| $7,500 to $9,999 | 31 (9.7%) | 16 (5.0%) |
| $10,000 to $12,499 | 0 (0.0%) | 4 (1.3%) |
| $12,500 to $14,999 | 4 (1.3%) | 14 (4.4%) |
| $15,000 to $17,499 | 0 (0.0%) | 0 (0.0%) |
| $17,500 to $19,999 | 4 (1.3%) | 58 (18.2%) |
| $20,000 to $22,499 | 13 (4.1%) | 13 (4.1%) |
| $22,500 to $24,999 | 12 (3.7%) | 16 (5.0%) |
| $25,000 to $29,999 | 63 (19.7%) | 7 (2.2%) |
| $30,000 to $34,999 | 0 (0.0%) | 36 (11.3%) |
| $35,000 to $39,999 | 17 (5.3%) | 9 (2.8%) |
| $40,000 to $44,999 | 18 (5.6%) | 31 (9.7%) |
| $45,000 to $49,999 | 63 (19.7%) | 27 (8.5%) |
| $50,000 to $54,999 | 5 (1.6%) | 0 (0.0%) |
| $55,000 to $64,999 | 12 (3.7%) | 5 (1.6%) |
| $65,000 to $74,999 | 3 (0.9%) | 18 (5.6%) |
| $75,000 to $99,999 | 15 (4.7%) | 0 (0.0%) |
| $100,000+ | 8 (2.5%) | 22 (6.9%) |
| Total | 320 (100.0%) | 319 (100.0%) |
Earnings by Sex by Educational Attainment in Georgetown Quitman County unified government
Average earnings in Georgetown Quitman County unified government are $29,647 for men and $31,786 for women, a difference of 6.7%. Men with an educational attainment of college or associate's degree enjoy the highest average annual earnings of $29,344, while those with high school diploma education earn the least with $26,618. Women with an educational attainment of less than high school earn the most with the average annual earnings of $40,179, while those with college or associate's degree education have the smallest earnings of $19,591.
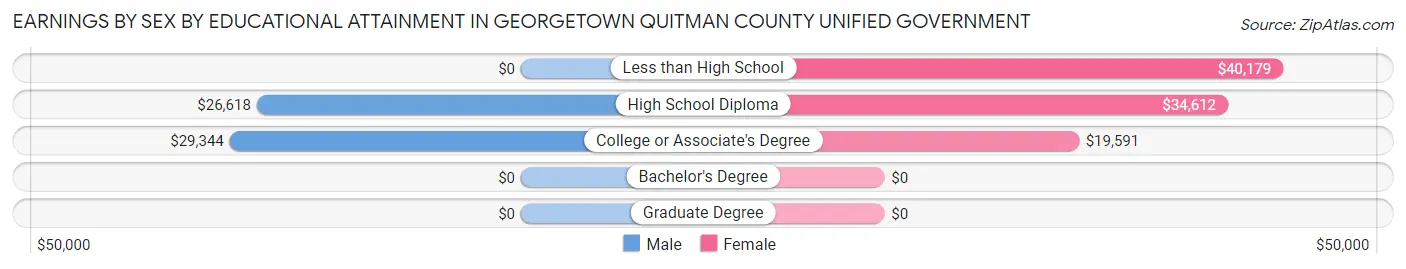
| Educational Attainment | Male Income | Female Income |
| Less than High School | - | - |
| High School Diploma | $26,618 | $34,612 |
| College or Associate's Degree | $29,344 | $19,591 |
| Bachelor's Degree | - | - |
| Graduate Degree | - | - |
| Total | $29,647 | $31,786 |
Family Income in Georgetown Quitman County unified government
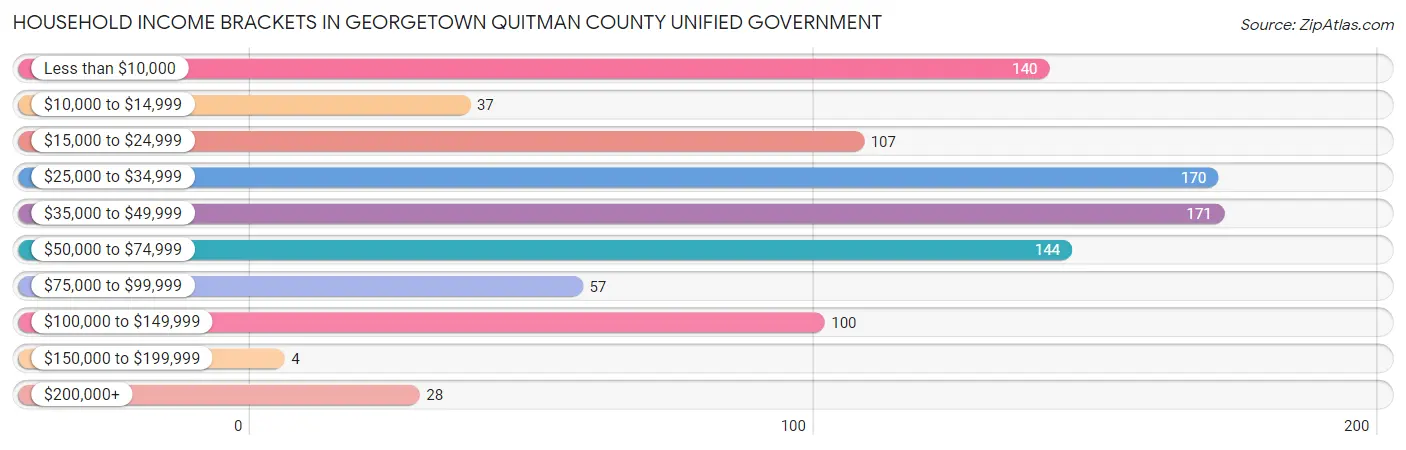
Family Income Brackets in Georgetown Quitman County unified government
According to the Georgetown Quitman County unified government family income data, there are 129 families falling into the $50,000 to $74,999 income range, which is the most common income bracket and makes up 24.1% of all families. Conversely, the $150,000 to $199,999 income bracket is the least frequent group with only 4 families (0.7%) belonging to this category.
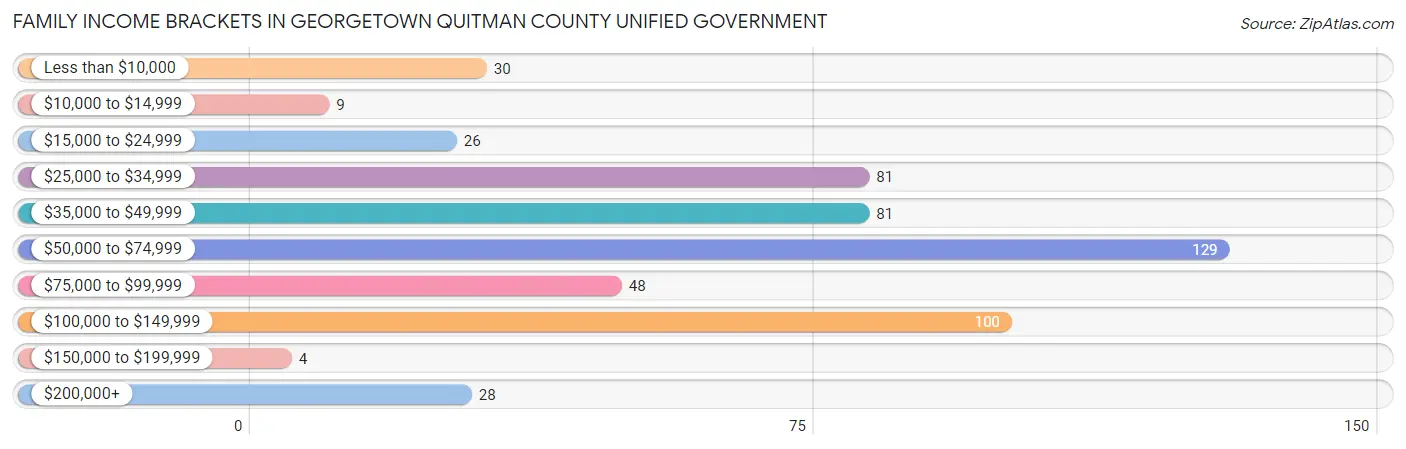
| Income Bracket | # Families | % Families |
| Less than $10,000 | 30 | 5.6% |
| $10,000 to $14,999 | 9 | 1.7% |
| $15,000 to $24,999 | 26 | 4.9% |
| $25,000 to $34,999 | 81 | 15.1% |
| $35,000 to $49,999 | 81 | 15.1% |
| $50,000 to $74,999 | 129 | 24.1% |
| $75,000 to $99,999 | 48 | 9.0% |
| $100,000 to $149,999 | 100 | 18.7% |
| $150,000 to $199,999 | 4 | 0.7% |
| $200,000+ | 28 | 5.2% |
Family Income by Famaliy Size in Georgetown Quitman County unified government
6-person families (20 | 3.7%) account for the highest median family income in Georgetown Quitman County unified government with $63,333 per family, while 2-person families (382 | 71.3%) have the highest median income of $26,834 per family member.
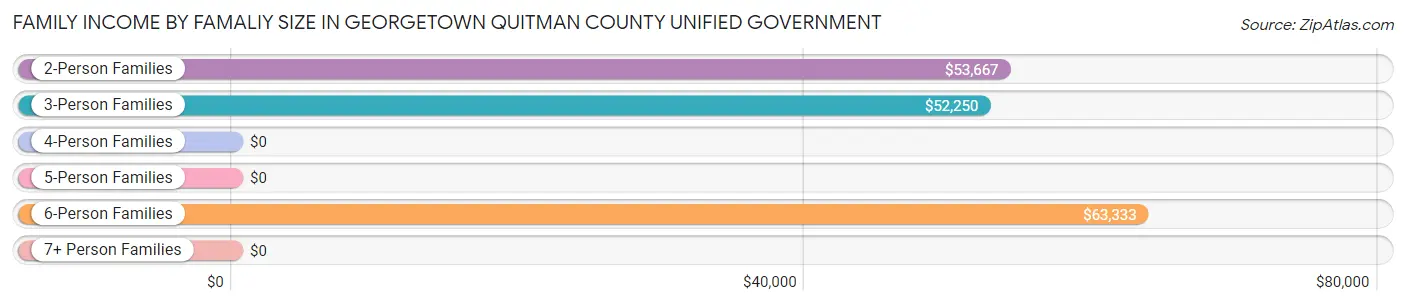
| Income Bracket | # Families | Median Income |
| 2-Person Families | 382 (71.3%) | $53,667 |
| 3-Person Families | 77 (14.4%) | $52,250 |
| 4-Person Families | 42 (7.8%) | $0 |
| 5-Person Families | 10 (1.9%) | $0 |
| 6-Person Families | 20 (3.7%) | $63,333 |
| 7+ Person Families | 5 (0.9%) | $0 |
| Total | 536 (100.0%) | $59,500 |
Family Income by Number of Earners in Georgetown Quitman County unified government
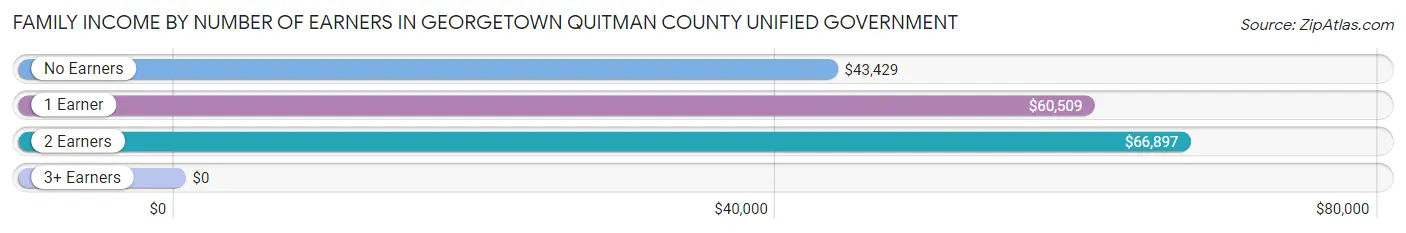
| Number of Earners | # Families | Median Income |
| No Earners | 283 (52.8%) | $43,429 |
| 1 Earner | 105 (19.6%) | $60,509 |
| 2 Earners | 136 (25.4%) | $66,897 |
| 3+ Earners | 12 (2.2%) | $0 |
| Total | 536 (100.0%) | $59,500 |
Household Income in Georgetown Quitman County unified government
Household Income Brackets in Georgetown Quitman County unified government
With 171 households falling in the category, the $35,000 to $49,999 income range is the most frequent in Georgetown Quitman County unified government, accounting for 17.8% of all households. In contrast, only 4 households (0.4%) fall into the $150,000 to $199,999 income bracket, making it the least populous group.
| Income Bracket | # Households | % Households |
| Less than $10,000 | 140 | 14.6% |
| $10,000 to $14,999 | 37 | 3.9% |
| $15,000 to $24,999 | 107 | 11.2% |
| $25,000 to $34,999 | 170 | 17.7% |
| $35,000 to $49,999 | 171 | 17.8% |
| $50,000 to $74,999 | 144 | 15.0% |
| $75,000 to $99,999 | 57 | 5.9% |
| $100,000 to $149,999 | 100 | 10.4% |
| $150,000 to $199,999 | 4 | 0.4% |
| $200,000+ | 28 | 2.9% |
Household Income by Householder Age in Georgetown Quitman County unified government
The median household income in Georgetown Quitman County unified government is $38,889, with the highest median household income of $42,841 found in the 65+ years age bracket for the primary householder. A total of 536 households (55.9%) fall into this category. Meanwhile, the 15 to 24 years age bracket for the primary householder has the lowest median household income of $0, with 4 households (0.4%) in this group.
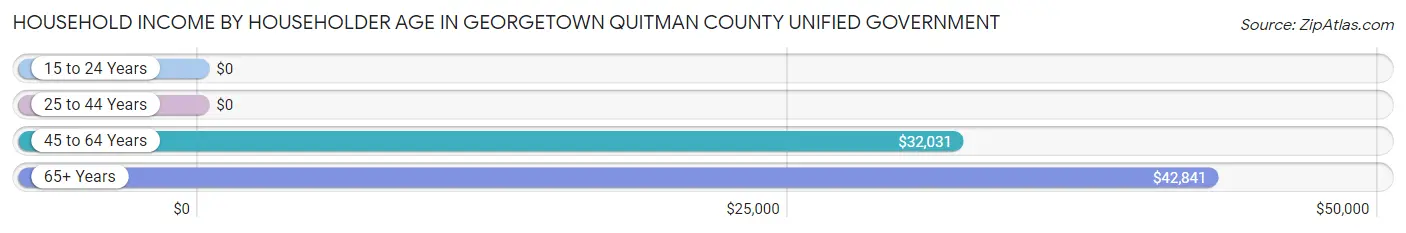
| Income Bracket | # Households | Median Income |
| 15 to 24 Years | 4 (0.4%) | $0 |
| 25 to 44 Years | 113 (11.8%) | $0 |
| 45 to 64 Years | 305 (31.8%) | $32,031 |
| 65+ Years | 536 (55.9%) | $42,841 |
| Total | 958 (100.0%) | $38,889 |
Poverty in Georgetown Quitman County unified government
Income Below Poverty by Sex and Age in Georgetown Quitman County unified government
With 18.0% poverty level for males and 12.1% for females among the residents of Georgetown Quitman County unified government, 5 year old males and 5 year old females are the most vulnerable to poverty, with 30 males (100.0%) and 4 females (100.0%) in their respective age groups living below the poverty level.
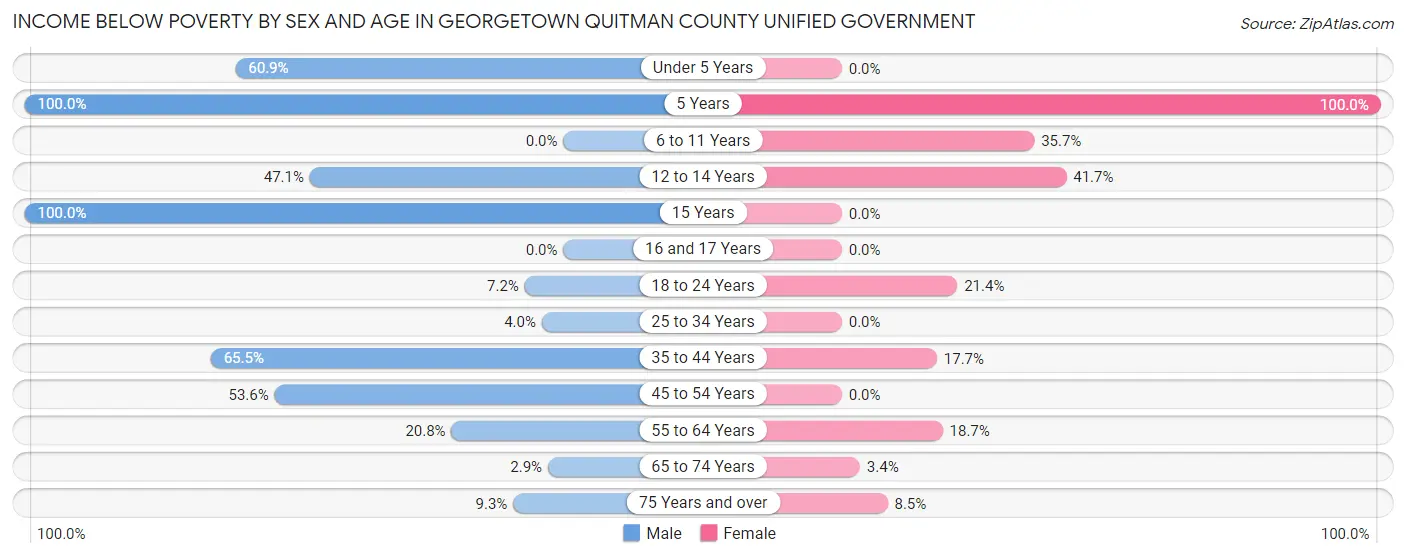
| Age Bracket | Male | Female |
| Under 5 Years | 14 (60.9%) | 0 (0.0%) |
| 5 Years | 30 (100.0%) | 4 (100.0%) |
| 6 to 11 Years | 0 (0.0%) | 10 (35.7%) |
| 12 to 14 Years | 8 (47.1%) | 5 (41.7%) |
| 15 Years | 5 (100.0%) | 0 (0.0%) |
| 16 and 17 Years | 0 (0.0%) | 0 (0.0%) |
| 18 to 24 Years | 14 (7.2%) | 12 (21.4%) |
| 25 to 34 Years | 7 (4.0%) | 0 (0.0%) |
| 35 to 44 Years | 36 (65.4%) | 9 (17.6%) |
| 45 to 54 Years | 52 (53.6%) | 0 (0.0%) |
| 55 to 64 Years | 27 (20.8%) | 58 (18.7%) |
| 65 to 74 Years | 8 (2.9%) | 5 (3.4%) |
| 75 Years and over | 11 (9.3%) | 18 (8.5%) |
| Total | 212 (18.0%) | 121 (12.1%) |
Income Above Poverty by Sex and Age in Georgetown Quitman County unified government
According to the poverty statistics in Georgetown Quitman County unified government, males aged 6 to 11 years and females aged under 5 years are the age groups that are most secure financially, with 100.0% of males and 100.0% of females in these age groups living above the poverty line.
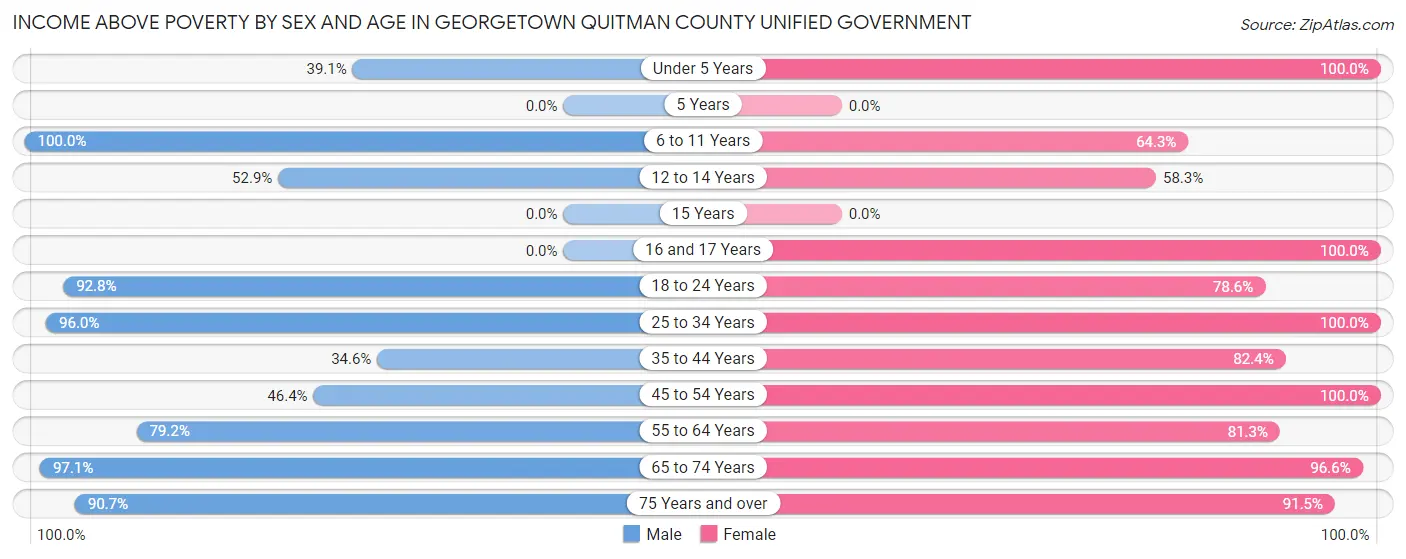
| Age Bracket | Male | Female |
| Under 5 Years | 9 (39.1%) | 50 (100.0%) |
| 5 Years | 0 (0.0%) | 0 (0.0%) |
| 6 to 11 Years | 54 (100.0%) | 18 (64.3%) |
| 12 to 14 Years | 9 (52.9%) | 7 (58.3%) |
| 15 Years | 0 (0.0%) | 0 (0.0%) |
| 16 and 17 Years | 0 (0.0%) | 16 (100.0%) |
| 18 to 24 Years | 181 (92.8%) | 44 (78.6%) |
| 25 to 34 Years | 168 (96.0%) | 34 (100.0%) |
| 35 to 44 Years | 19 (34.5%) | 42 (82.4%) |
| 45 to 54 Years | 45 (46.4%) | 79 (100.0%) |
| 55 to 64 Years | 103 (79.2%) | 252 (81.3%) |
| 65 to 74 Years | 272 (97.1%) | 144 (96.6%) |
| 75 Years and over | 107 (90.7%) | 194 (91.5%) |
| Total | 967 (82.0%) | 880 (87.9%) |
Income Below Poverty Among Married-Couple Families in Georgetown Quitman County unified government
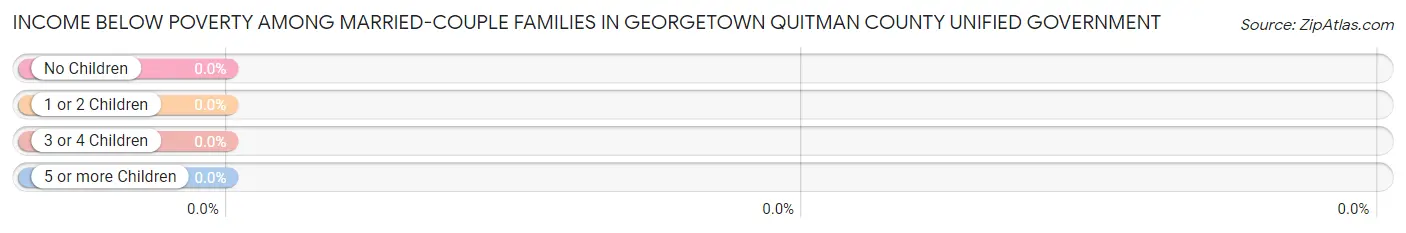
| Children | Above Poverty | Below Poverty |
| No Children | 372 (100.0%) | 0 (0.0%) |
| 1 or 2 Children | 16 (100.0%) | 0 (0.0%) |
| 3 or 4 Children | 11 (100.0%) | 0 (0.0%) |
| 5 or more Children | 0 (0.0%) | 0 (0.0%) |
| Total | 399 (100.0%) | 0 (0.0%) |
Income Below Poverty Among Single-Parent Households in Georgetown Quitman County unified government
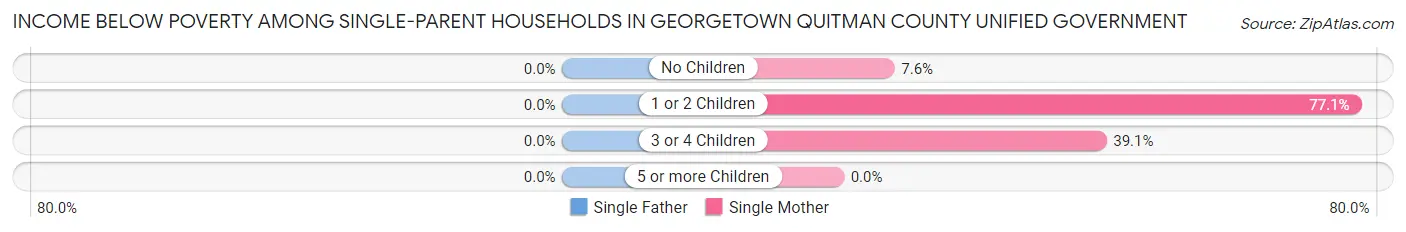
| Children | Single Father | Single Mother |
| No Children | 0 (0.0%) | 4 (7.5%) |
| 1 or 2 Children | 0 (0.0%) | 27 (77.1%) |
| 3 or 4 Children | 0 (0.0%) | 9 (39.1%) |
| 5 or more Children | 0 (0.0%) | 0 (0.0%) |
| Total | 0 (0.0%) | 40 (36.0%) |
Income Below Poverty Among Married-Couple vs Single-Parent Households in Georgetown Quitman County unified government
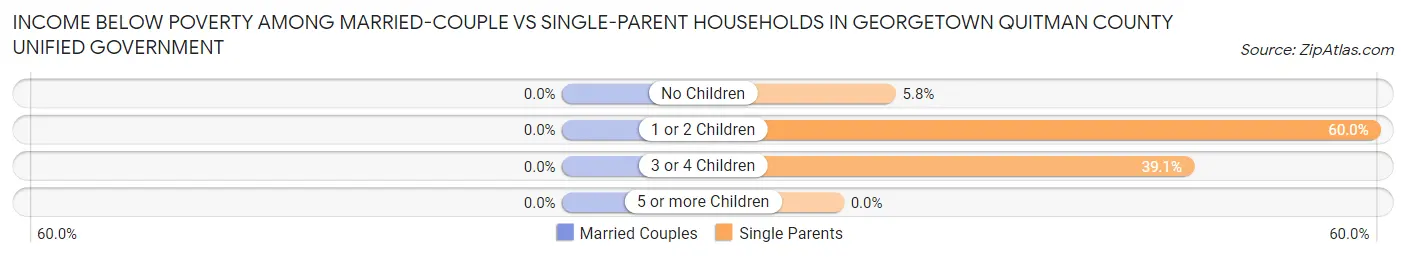
| Children | Married-Couple Families | Single-Parent Households |
| No Children | 0 (0.0%) | 4 (5.8%) |
| 1 or 2 Children | 0 (0.0%) | 27 (60.0%) |
| 3 or 4 Children | 0 (0.0%) | 9 (39.1%) |
| 5 or more Children | 0 (0.0%) | 0 (0.0%) |
| Total | 0 (0.0%) | 40 (29.2%) |
Race in Georgetown Quitman County unified government
The most populous races in Georgetown Quitman County unified government are Black / African American (1,146 | 52.6%), White / Caucasian (953 | 43.7%), and Hispanic or Latino (83 | 3.8%).
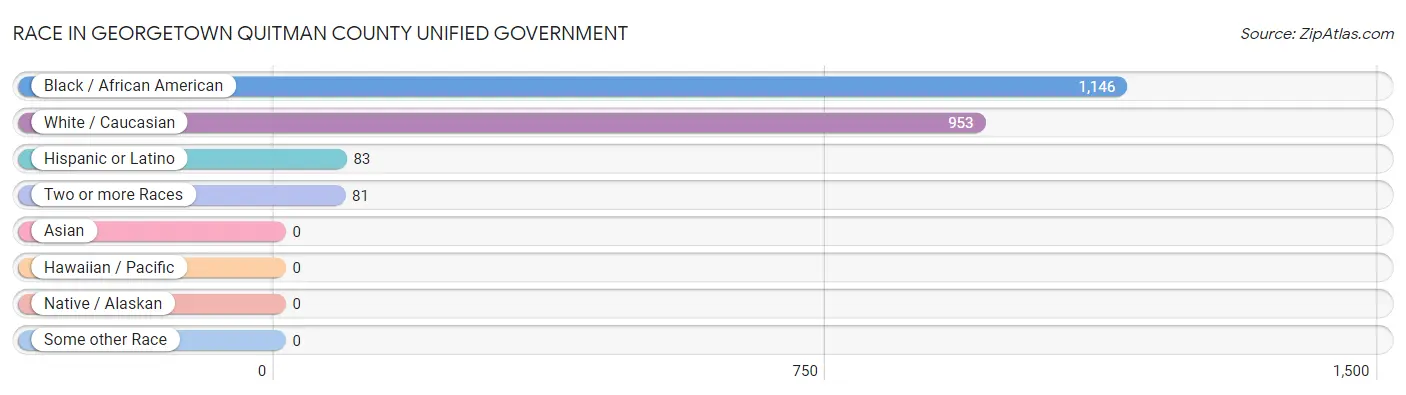
| Race | # Population | % Population |
| Asian | 0 | 0.0% |
| Black / African American | 1,146 | 52.6% |
| Hawaiian / Pacific | 0 | 0.0% |
| Hispanic or Latino | 83 | 3.8% |
| Native / Alaskan | 0 | 0.0% |
| White / Caucasian | 953 | 43.7% |
| Two or more Races | 81 | 3.7% |
| Some other Race | 0 | 0.0% |
| Total | 2,180 | 100.0% |
Ancestry in Georgetown Quitman County unified government
The most populous ancestries reported in Georgetown Quitman County unified government are American (410 | 18.8%), English (159 | 7.3%), Irish (149 | 6.8%), German (81 | 3.7%), and Dutch (59 | 2.7%), together accounting for 39.4% of all Georgetown Quitman County unified government residents.

| Ancestry | # Population | % Population |
| American | 410 | 18.8% |
| Colombian | 32 | 1.5% |
| Cree | 26 | 1.2% |
| Dutch | 59 | 2.7% |
| English | 159 | 7.3% |
| French | 16 | 0.7% |
| German | 81 | 3.7% |
| Irish | 149 | 6.8% |
| Italian | 4 | 0.2% |
| Nigerian | 4 | 0.2% |
| Norwegian | 8 | 0.4% |
| Polish | 3 | 0.1% |
| Puerto Rican | 51 | 2.3% |
| Scotch-Irish | 21 | 1.0% |
| South American | 32 | 1.5% |
| Subsaharan African | 4 | 0.2% |
| Welsh | 9 | 0.4% | View All 17 Rows |
Immigrants in Georgetown Quitman County unified government
The most numerous immigrant groups reported in Georgetown Quitman County unified government came from Colombia (32 | 1.5%), Latin America (32 | 1.5%), South America (32 | 1.5%), Africa (4 | 0.2%), and Nigeria (4 | 0.2%), together accounting for 4.8% of all Georgetown Quitman County unified government residents.
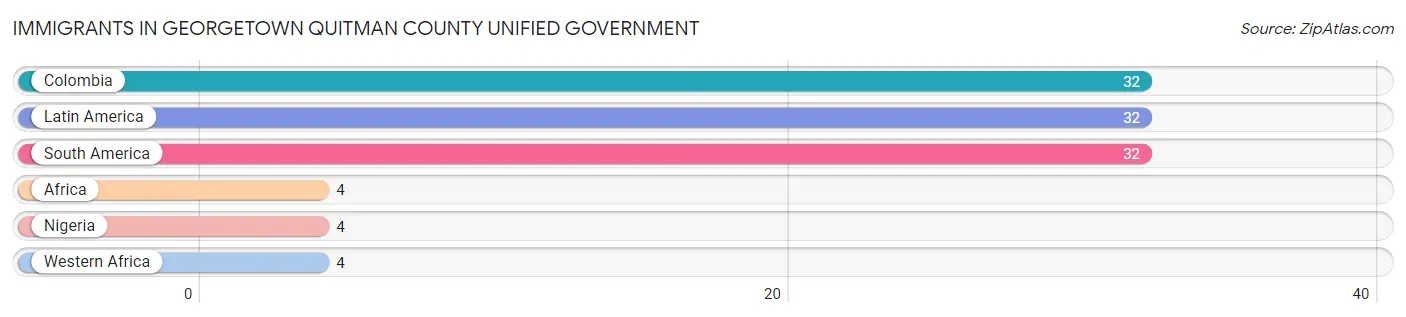
| Immigration Origin | # Population | % Population |
| Africa | 4 | 0.2% |
| Colombia | 32 | 1.5% |
| Latin America | 32 | 1.5% |
| Nigeria | 4 | 0.2% |
| South America | 32 | 1.5% |
| Western Africa | 4 | 0.2% | View All 6 Rows |
Sex and Age in Georgetown Quitman County unified government
Sex and Age in Georgetown Quitman County unified government
The most populous age groups in Georgetown Quitman County unified government are 20 to 24 Years (195 | 16.5%) for men and 60 to 64 Years (158 | 15.8%) for women.
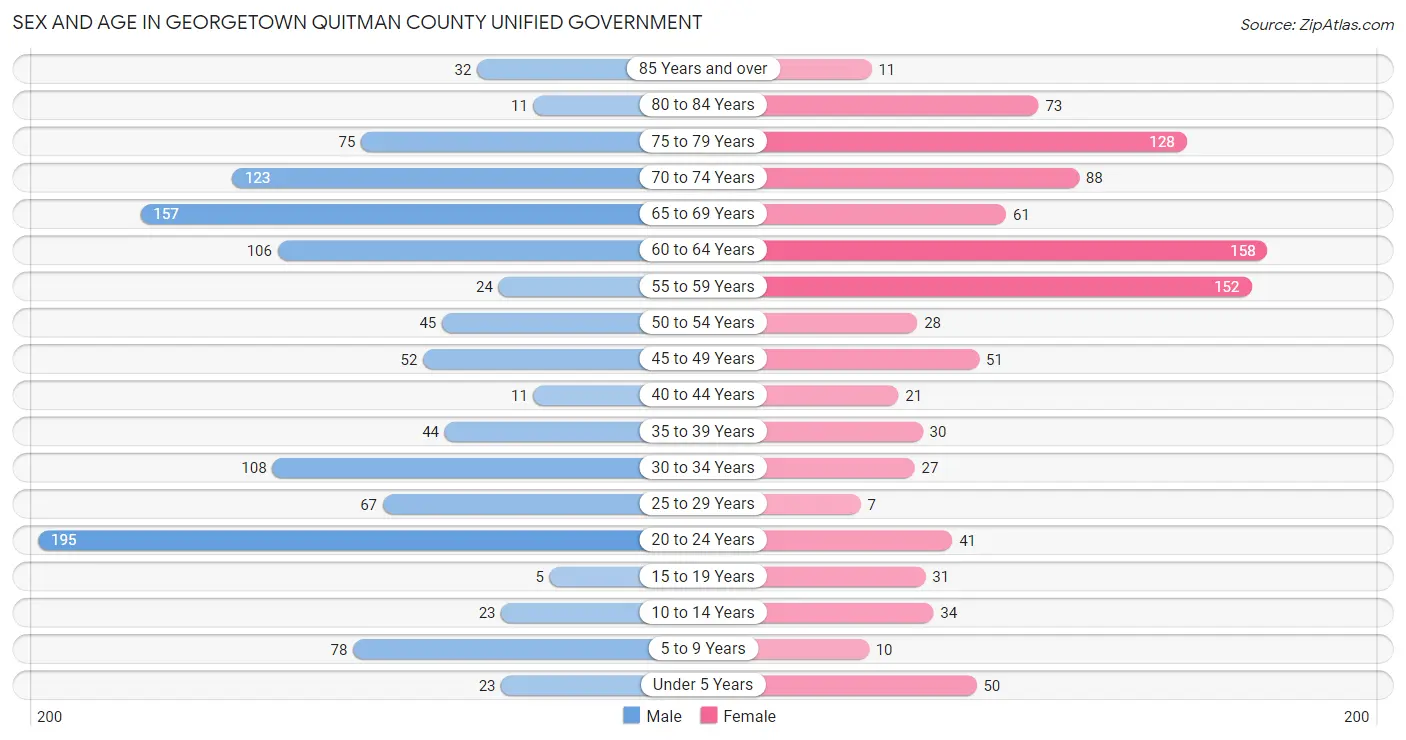
| Age Bracket | Male | Female |
| Under 5 Years | 23 (1.9%) | 50 (5.0%) |
| 5 to 9 Years | 78 (6.6%) | 10 (1.0%) |
| 10 to 14 Years | 23 (1.9%) | 34 (3.4%) |
| 15 to 19 Years | 5 (0.4%) | 31 (3.1%) |
| 20 to 24 Years | 195 (16.5%) | 41 (4.1%) |
| 25 to 29 Years | 67 (5.7%) | 7 (0.7%) |
| 30 to 34 Years | 108 (9.2%) | 27 (2.7%) |
| 35 to 39 Years | 44 (3.7%) | 30 (3.0%) |
| 40 to 44 Years | 11 (0.9%) | 21 (2.1%) |
| 45 to 49 Years | 52 (4.4%) | 51 (5.1%) |
| 50 to 54 Years | 45 (3.8%) | 28 (2.8%) |
| 55 to 59 Years | 24 (2.0%) | 152 (15.2%) |
| 60 to 64 Years | 106 (9.0%) | 158 (15.8%) |
| 65 to 69 Years | 157 (13.3%) | 61 (6.1%) |
| 70 to 74 Years | 123 (10.4%) | 88 (8.8%) |
| 75 to 79 Years | 75 (6.4%) | 128 (12.8%) |
| 80 to 84 Years | 11 (0.9%) | 73 (7.3%) |
| 85 Years and over | 32 (2.7%) | 11 (1.1%) |
| Total | 1,179 (100.0%) | 1,001 (100.0%) |
Families and Households in Georgetown Quitman County unified government
Median Family Size in Georgetown Quitman County unified government
The median family size in Georgetown Quitman County unified government is 3.19 persons per family, with single female/mother families (111 | 20.7%) accounting for the largest median family size of 5.19 persons per family. On the other hand, married-couple families (399 | 74.4%) represent the smallest median family size with 2.54 persons per family.
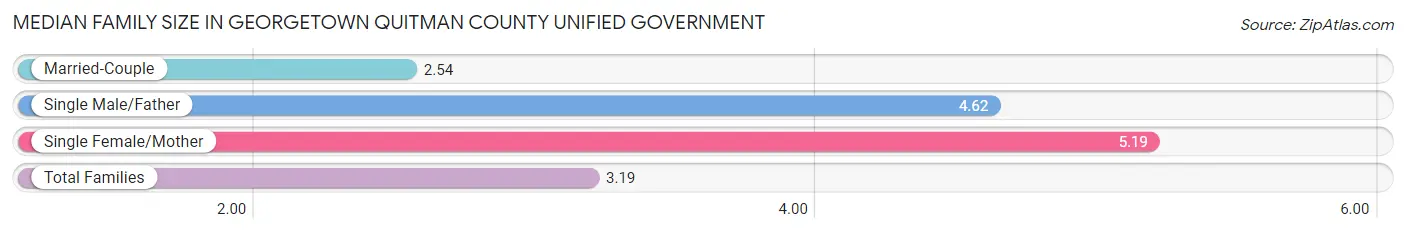
| Family Type | # Families | Family Size |
| Married-Couple | 399 (74.4%) | 2.54 |
| Single Male/Father | 26 (4.9%) | 4.62 |
| Single Female/Mother | 111 (20.7%) | 5.19 |
| Total Families | 536 (100.0%) | 3.19 |
Median Household Size in Georgetown Quitman County unified government
The median household size in Georgetown Quitman County unified government is 2.28 persons per household, with single female/mother households (111 | 11.6%) accounting for the largest median household size of 5.33 persons per household. non-family households (422 | 44.1%) represent the smallest median household size with 1.07 persons per household.
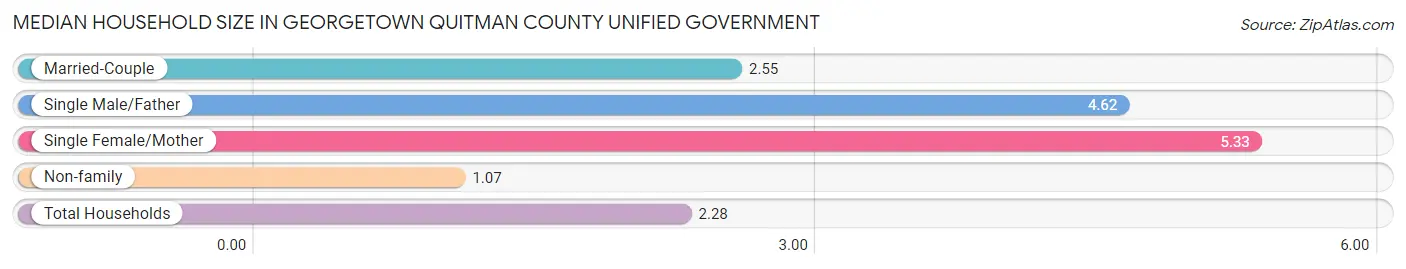
| Household Type | # Households | Household Size |
| Married-Couple | 399 (41.6%) | 2.55 |
| Single Male/Father | 26 (2.7%) | 4.62 |
| Single Female/Mother | 111 (11.6%) | 5.33 |
| Non-family | 422 (44.1%) | 1.07 |
| Total Households | 958 (100.0%) | 2.28 |
Household Size by Marriage Status in Georgetown Quitman County unified government
Out of a total of 958 households in Georgetown Quitman County unified government, 536 (55.9%) are family households, while 422 (44.1%) are nonfamily households. The most numerous type of family households are 2-person households, comprising 382, and the most common type of nonfamily households are 1-person households, comprising 394.
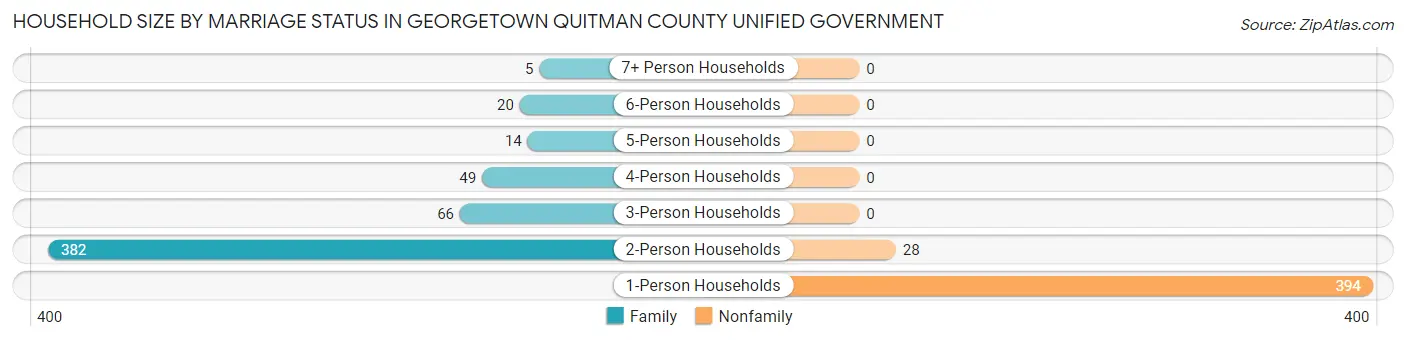
| Household Size | Family Households | Nonfamily Households |
| 1-Person Households | - | 394 (41.1%) |
| 2-Person Households | 382 (39.9%) | 28 (2.9%) |
| 3-Person Households | 66 (6.9%) | 0 (0.0%) |
| 4-Person Households | 49 (5.1%) | 0 (0.0%) |
| 5-Person Households | 14 (1.5%) | 0 (0.0%) |
| 6-Person Households | 20 (2.1%) | 0 (0.0%) |
| 7+ Person Households | 5 (0.5%) | 0 (0.0%) |
| Total | 536 (55.9%) | 422 (44.1%) |
Female Fertility in Georgetown Quitman County unified government
Fertility by Age in Georgetown Quitman County unified government
Average fertility rate in Georgetown Quitman County unified government is 48.0 births per 1,000 women. Women in the age bracket of 20 to 34 years have the highest fertility rate with 133.0 births per 1,000 women. Women in the age bracket of 20 to 34 years acount for 100.0% of all women with births.
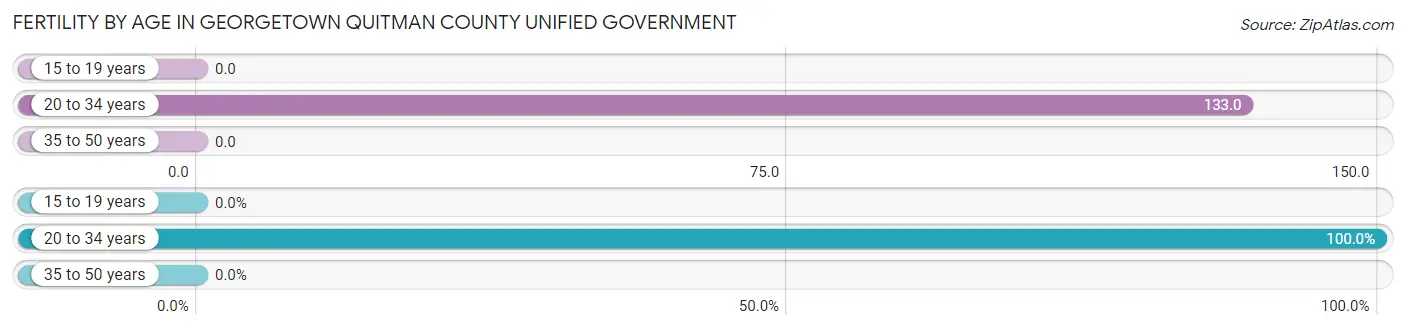
| Age Bracket | Women with Births | Births / 1,000 Women |
| 15 to 19 years | 0 (0.0%) | 0.0 |
| 20 to 34 years | 10 (100.0%) | 133.0 |
| 35 to 50 years | 0 (0.0%) | 0.0 |
| Total | 10 (100.0%) | 48.0 |
Fertility by Age by Marriage Status in Georgetown Quitman County unified government
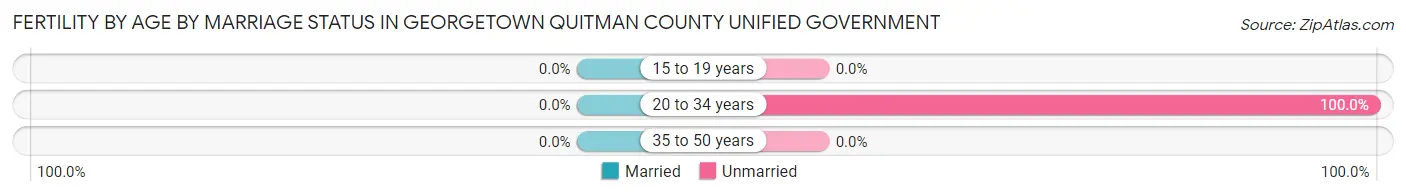
| Age Bracket | Married | Unmarried |
| 15 to 19 years | 0 (0.0%) | 0 (0.0%) |
| 20 to 34 years | 0 (0.0%) | 10 (100.0%) |
| 35 to 50 years | 0 (0.0%) | 0 (0.0%) |
| Total | 0 (0.0%) | 10 (100.0%) |
Fertility by Education in Georgetown Quitman County unified government
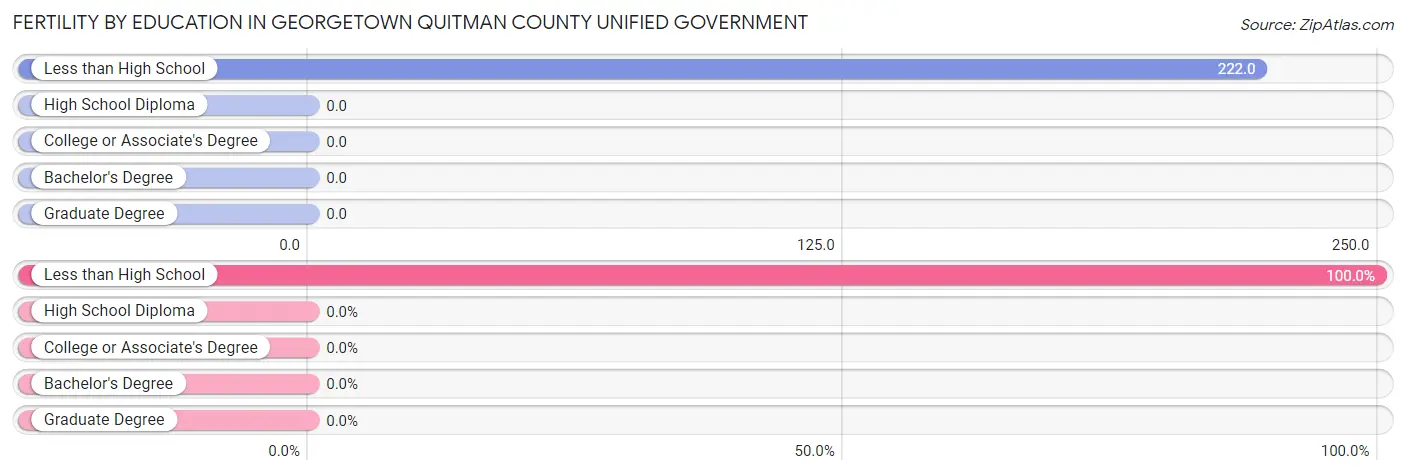
| Educational Attainment | Women with Births | Births / 1,000 Women |
| Less than High School | 10 (100.0%) | 222.0 |
| High School Diploma | 0 (0.0%) | 0.0 |
| College or Associate's Degree | 0 (0.0%) | 0.0 |
| Bachelor's Degree | 0 (0.0%) | 0.0 |
| Graduate Degree | 0 (0.0%) | 0.0 |
| Total | 10 (100.0%) | 48.0 |
Fertility by Education by Marriage Status in Georgetown Quitman County unified government
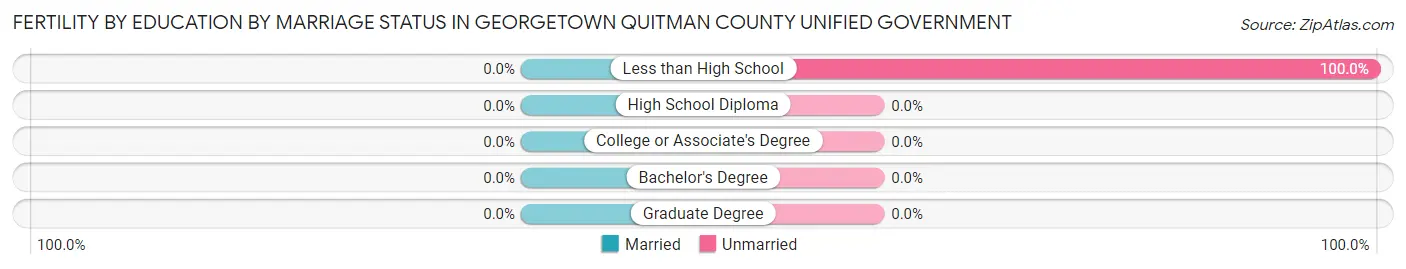
| Educational Attainment | Married | Unmarried |
| Less than High School | 0 (0.0%) | 10 (100.0%) |
| High School Diploma | 0 (0.0%) | 0 (0.0%) |
| College or Associate's Degree | 0 (0.0%) | 0 (0.0%) |
| Bachelor's Degree | 0 (0.0%) | 0 (0.0%) |
| Graduate Degree | 0 (0.0%) | 0 (0.0%) |
| Total | 0 (0.0%) | 10 (100.0%) |
Employment Characteristics in Georgetown Quitman County unified government
Employment by Class of Employer in Georgetown Quitman County unified government
Among the 525 employed individuals in Georgetown Quitman County unified government, private company employees (380 | 72.4%), federal government employees (58 | 11.1%), and local government employees (32 | 6.1%) make up the most common classes of employment.
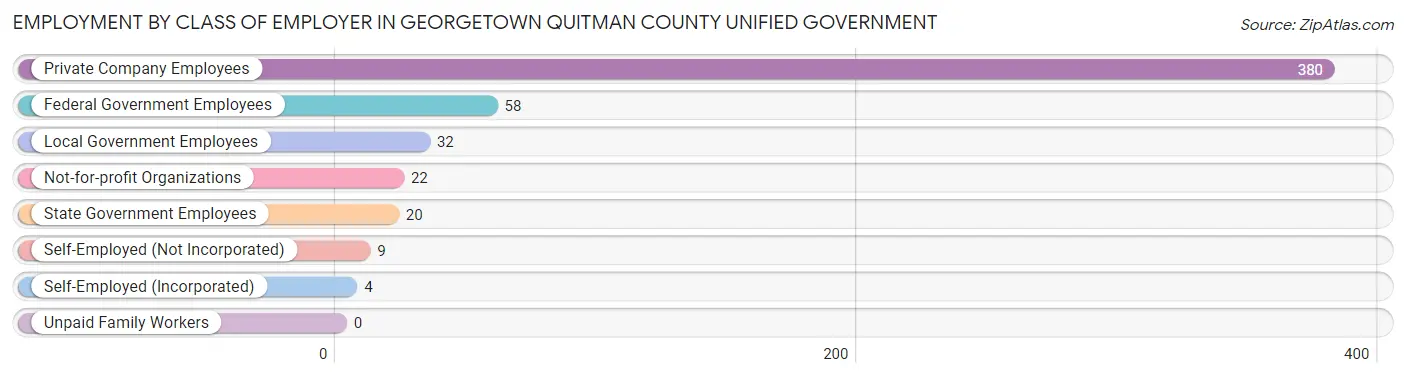
| Employer Class | # Employees | % Employees |
| Private Company Employees | 380 | 72.4% |
| Self-Employed (Incorporated) | 4 | 0.8% |
| Self-Employed (Not Incorporated) | 9 | 1.7% |
| Not-for-profit Organizations | 22 | 4.2% |
| Local Government Employees | 32 | 6.1% |
| State Government Employees | 20 | 3.8% |
| Federal Government Employees | 58 | 11.1% |
| Unpaid Family Workers | 0 | 0.0% |
| Total | 525 | 100.0% |
Employment Status by Age in Georgetown Quitman County unified government
According to the labor force statistics for Georgetown Quitman County unified government, out of the total population over 16 years of age (1,957), 35.1% or 687 individuals are in the labor force, with 23.5% or 161 of them unemployed. The age group with the highest labor force participation rate is 20 to 24 years, with 80.9% or 191 individuals in the labor force. Within the labor force, the 20 to 24 years age range has the highest percentage of unemployed individuals, with 81.7% or 156 of them being unemployed.
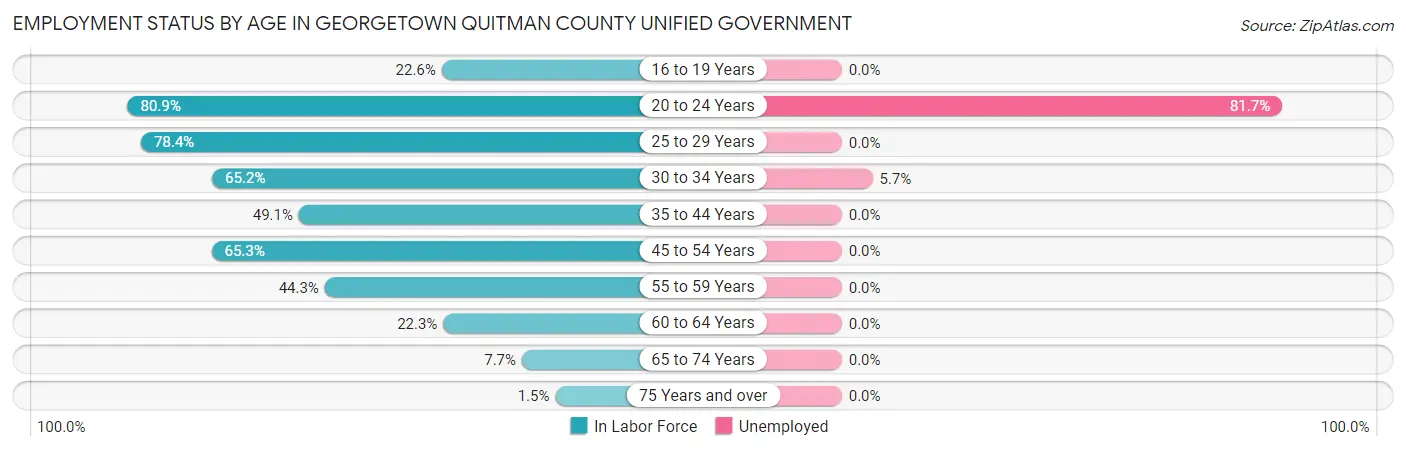
| Age Bracket | In Labor Force | Unemployed |
| 16 to 19 Years | 7 (22.6%) | 0 (0.0%) |
| 20 to 24 Years | 191 (80.9%) | 156 (81.7%) |
| 25 to 29 Years | 58 (78.4%) | 0 (0.0%) |
| 30 to 34 Years | 88 (65.2%) | 5 (5.7%) |
| 35 to 44 Years | 52 (49.1%) | 0 (0.0%) |
| 45 to 54 Years | 115 (65.3%) | 0 (0.0%) |
| 55 to 59 Years | 78 (44.3%) | 0 (0.0%) |
| 60 to 64 Years | 59 (22.3%) | 0 (0.0%) |
| 65 to 74 Years | 33 (7.7%) | 0 (0.0%) |
| 75 Years and over | 5 (1.5%) | 0 (0.0%) |
| Total | 687 (35.1%) | 161 (23.5%) |
Employment Status by Educational Attainment in Georgetown Quitman County unified government
According to labor force statistics for Georgetown Quitman County unified government, 48.3% of individuals (450) out of the total population between 25 and 64 years of age (931) are in the labor force, with 1.1% or 5 of them being unemployed. The group with the highest labor force participation rate are those with the educational attainment of college / associate degree, with 70.8% or 153 individuals in the labor force. Within the labor force, individuals with bachelor's degree or higher education have the highest percentage of unemployment, with 8.8% or 5 of them being unemployed.
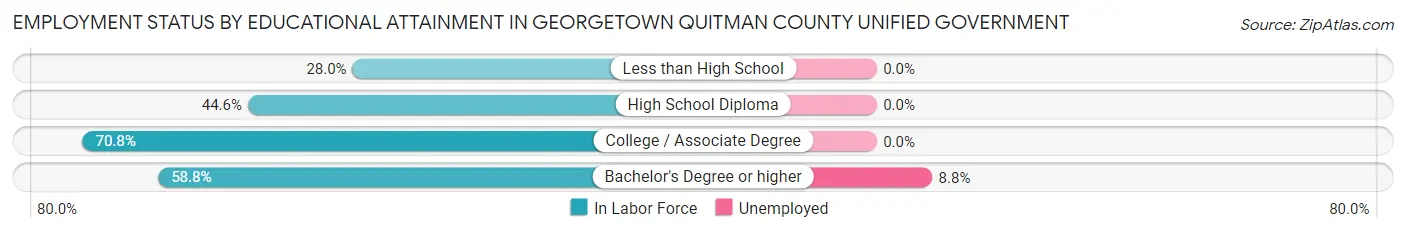
| Educational Attainment | In Labor Force | Unemployed |
| Less than High School | 60 (28.0%) | 0 (0.0%) |
| High School Diploma | 180 (44.6%) | 0 (0.0%) |
| College / Associate Degree | 153 (70.8%) | 0 (0.0%) |
| Bachelor's Degree or higher | 57 (58.8%) | 9 (8.8%) |
| Total | 450 (48.3%) | 10 (1.1%) |
Employment Occupations by Sex in Georgetown Quitman County unified government
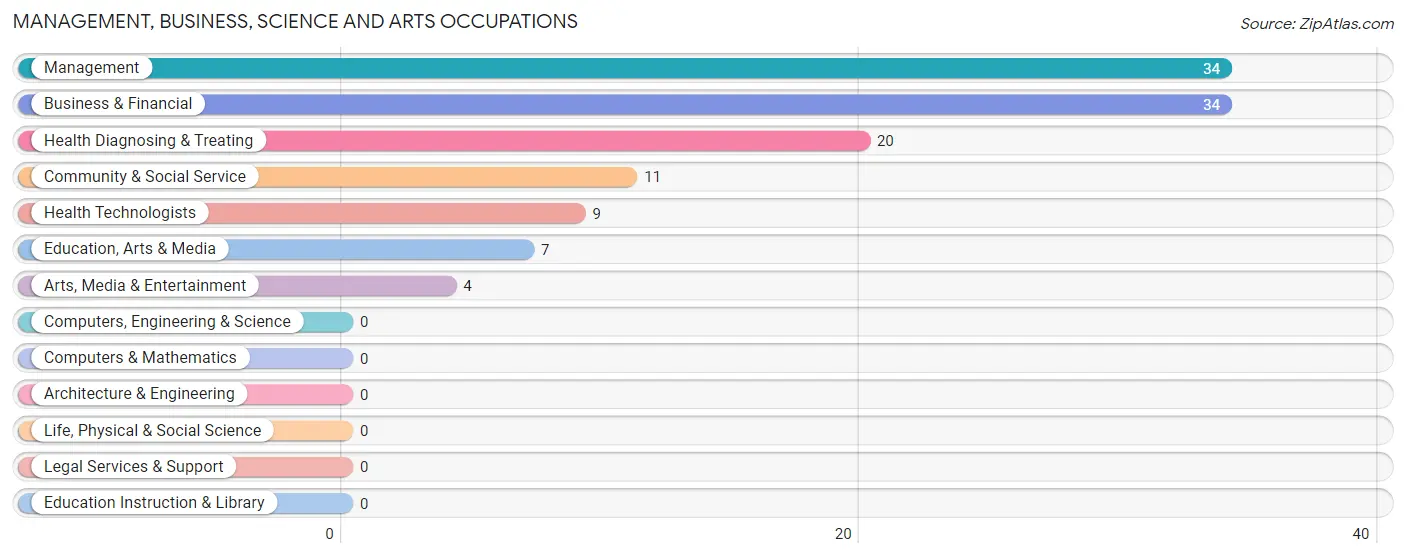
Management, Business, Science and Arts Occupations
The most common Management, Business, Science and Arts occupations in Georgetown Quitman County unified government are Management (34 | 6.5%), Business & Financial (34 | 6.5%), Health Diagnosing & Treating (20 | 3.8%), Community & Social Service (11 | 2.1%), and Health Technologists (9 | 1.7%).
Management, Business, Science and Arts Occupations by Sex
Within the Management, Business, Science and Arts occupations in Georgetown Quitman County unified government, the most male-oriented occupations are Business & Financial (100.0%), Health Technologists (44.4%), and Management (23.5%), while the most female-oriented occupations are Community & Social Service (100.0%), Education, Arts & Media (100.0%), and Arts, Media & Entertainment (100.0%).
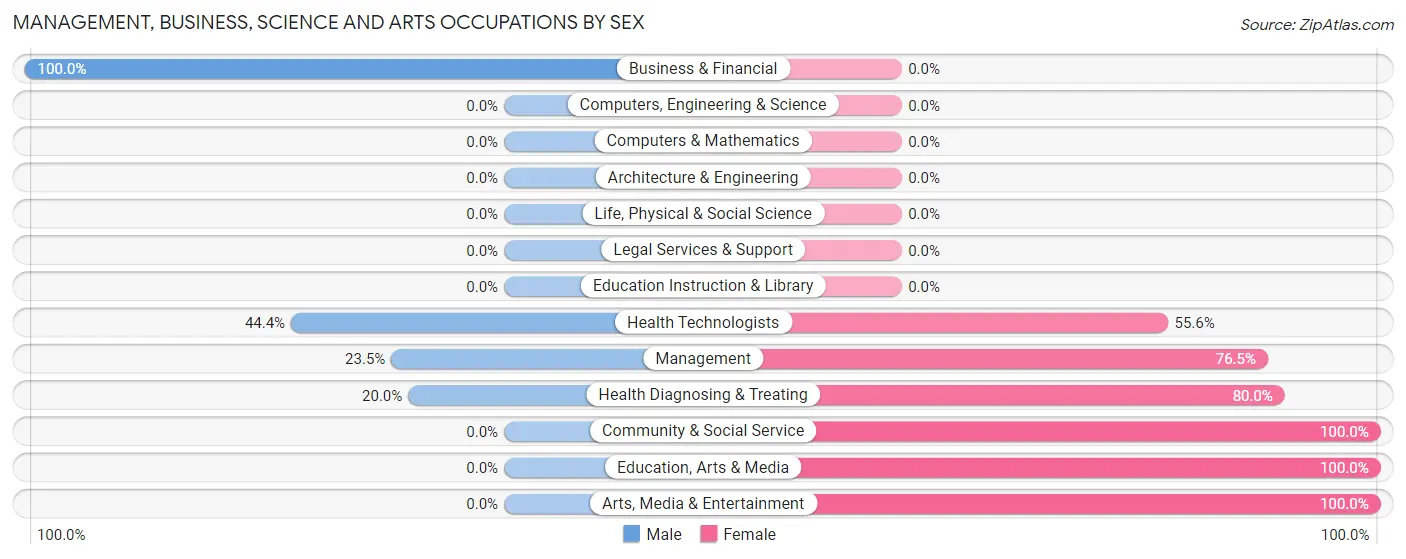
| Occupation | Male | Female |
| Management | 8 (23.5%) | 26 (76.5%) |
| Business & Financial | 34 (100.0%) | 0 (0.0%) |
| Computers, Engineering & Science | 0 (0.0%) | 0 (0.0%) |
| Computers & Mathematics | 0 (0.0%) | 0 (0.0%) |
| Architecture & Engineering | 0 (0.0%) | 0 (0.0%) |
| Life, Physical & Social Science | 0 (0.0%) | 0 (0.0%) |
| Community & Social Service | 0 (0.0%) | 11 (100.0%) |
| Education, Arts & Media | 0 (0.0%) | 7 (100.0%) |
| Legal Services & Support | 0 (0.0%) | 0 (0.0%) |
| Education Instruction & Library | 0 (0.0%) | 0 (0.0%) |
| Arts, Media & Entertainment | 0 (0.0%) | 4 (100.0%) |
| Health Diagnosing & Treating | 4 (20.0%) | 16 (80.0%) |
| Health Technologists | 4 (44.4%) | 5 (55.6%) |
| Total (Category) | 46 (46.5%) | 53 (53.5%) |
| Total (Overall) | 221 (42.1%) | 304 (57.9%) |
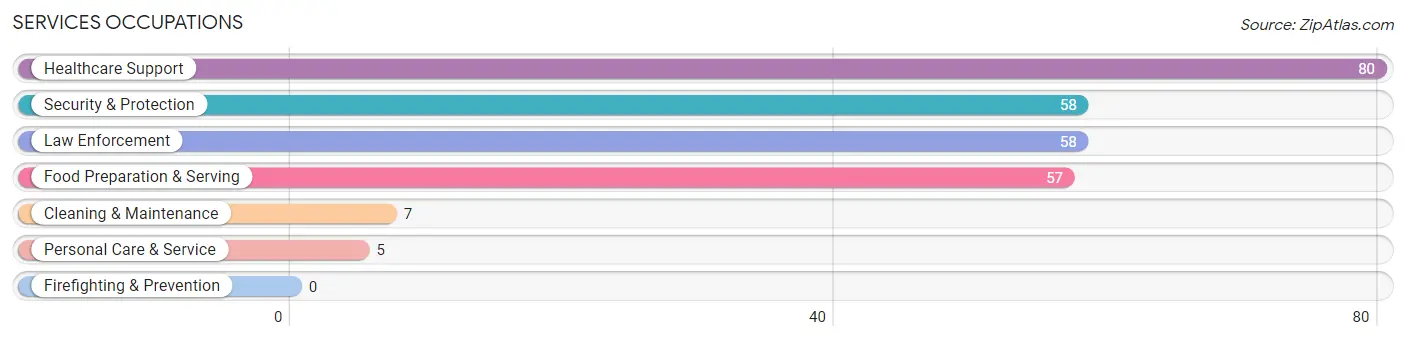
Services Occupations
The most common Services occupations in Georgetown Quitman County unified government are Healthcare Support (80 | 15.2%), Security & Protection (58 | 11.1%), Law Enforcement (58 | 11.1%), Food Preparation & Serving (57 | 10.9%), and Cleaning & Maintenance (7 | 1.3%).
Services Occupations by Sex
Within the Services occupations in Georgetown Quitman County unified government, the most male-oriented occupations are Cleaning & Maintenance (100.0%), Food Preparation & Serving (70.2%), and Security & Protection (32.8%), while the most female-oriented occupations are Healthcare Support (100.0%), Personal Care & Service (100.0%), and Security & Protection (67.2%).
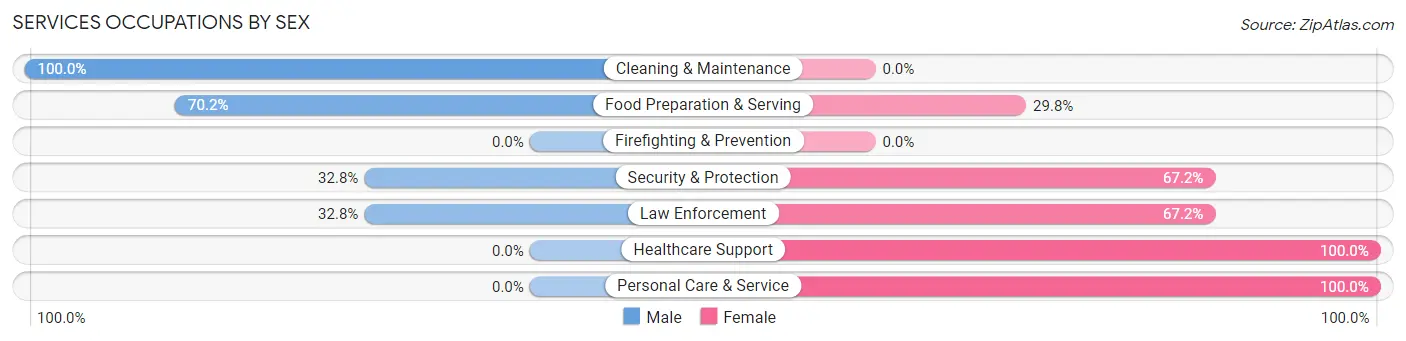
| Occupation | Male | Female |
| Healthcare Support | 0 (0.0%) | 80 (100.0%) |
| Security & Protection | 19 (32.8%) | 39 (67.2%) |
| Firefighting & Prevention | 0 (0.0%) | 0 (0.0%) |
| Law Enforcement | 19 (32.8%) | 39 (67.2%) |
| Food Preparation & Serving | 40 (70.2%) | 17 (29.8%) |
| Cleaning & Maintenance | 7 (100.0%) | 0 (0.0%) |
| Personal Care & Service | 0 (0.0%) | 5 (100.0%) |
| Total (Category) | 66 (31.9%) | 141 (68.1%) |
| Total (Overall) | 221 (42.1%) | 304 (57.9%) |
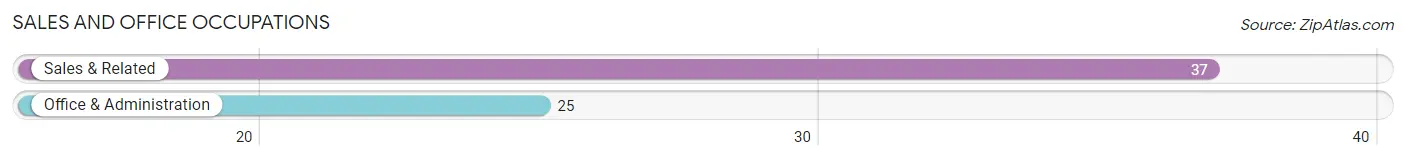
Sales and Office Occupations
The most common Sales and Office occupations in Georgetown Quitman County unified government are Sales & Related (37 | 7.0%), and Office & Administration (25 | 4.8%).
Sales and Office Occupations by Sex
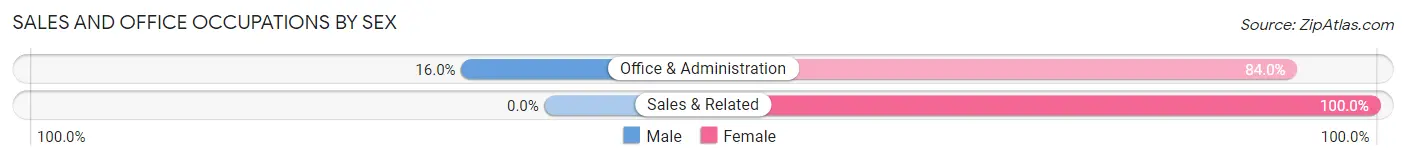
| Occupation | Male | Female |
| Sales & Related | 0 (0.0%) | 37 (100.0%) |
| Office & Administration | 4 (16.0%) | 21 (84.0%) |
| Total (Category) | 4 (6.5%) | 58 (93.5%) |
| Total (Overall) | 221 (42.1%) | 304 (57.9%) |
Natural Resources, Construction and Maintenance Occupations
The most common Natural Resources, Construction and Maintenance occupations in Georgetown Quitman County unified government are Construction & Extraction (24 | 4.6%), and Installation, Maintenance & Repair (11 | 2.1%).
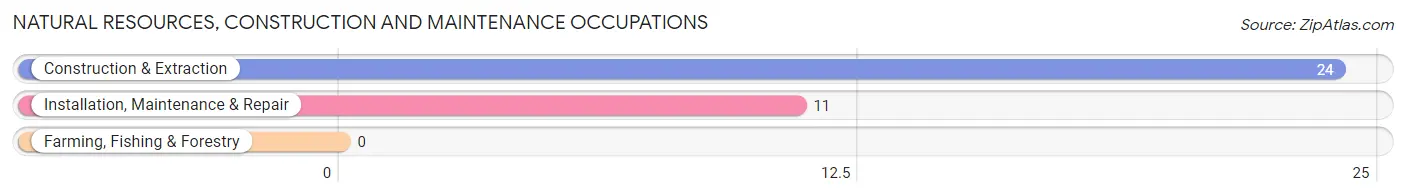
Natural Resources, Construction and Maintenance Occupations by Sex
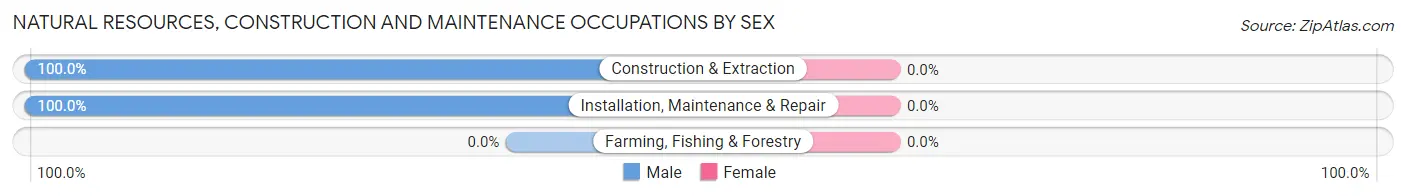
| Occupation | Male | Female |
| Farming, Fishing & Forestry | 0 (0.0%) | 0 (0.0%) |
| Construction & Extraction | 24 (100.0%) | 0 (0.0%) |
| Installation, Maintenance & Repair | 11 (100.0%) | 0 (0.0%) |
| Total (Category) | 35 (100.0%) | 0 (0.0%) |
| Total (Overall) | 221 (42.1%) | 304 (57.9%) |
Production, Transportation and Moving Occupations
The most common Production, Transportation and Moving occupations in Georgetown Quitman County unified government are Material Moving (67 | 12.8%), Production (42 | 8.0%), and Transportation (13 | 2.5%).
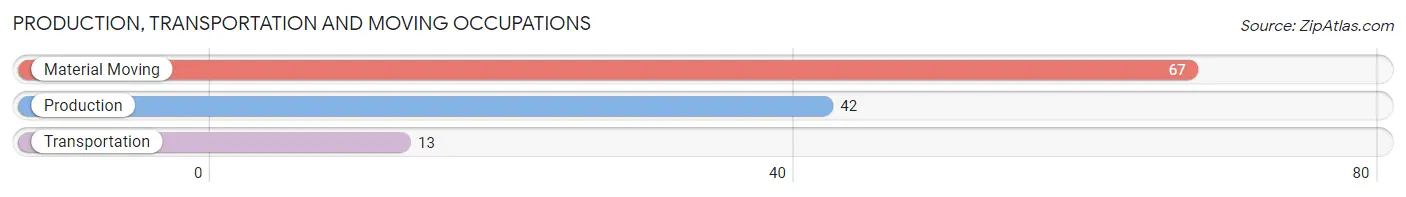
Production, Transportation and Moving Occupations by Sex
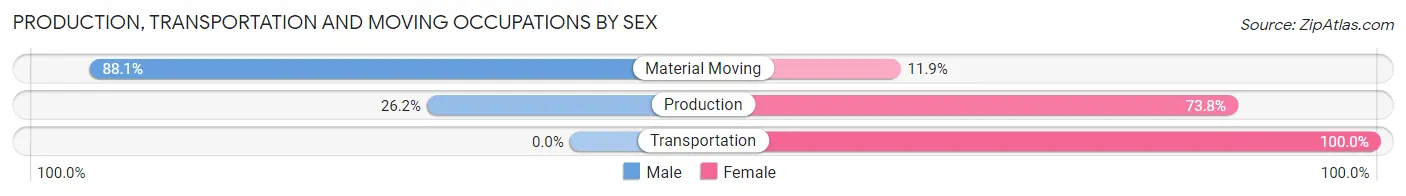
| Occupation | Male | Female |
| Production | 11 (26.2%) | 31 (73.8%) |
| Transportation | 0 (0.0%) | 13 (100.0%) |
| Material Moving | 59 (88.1%) | 8 (11.9%) |
| Total (Category) | 70 (57.4%) | 52 (42.6%) |
| Total (Overall) | 221 (42.1%) | 304 (57.9%) |
Employment Industries by Sex in Georgetown Quitman County unified government
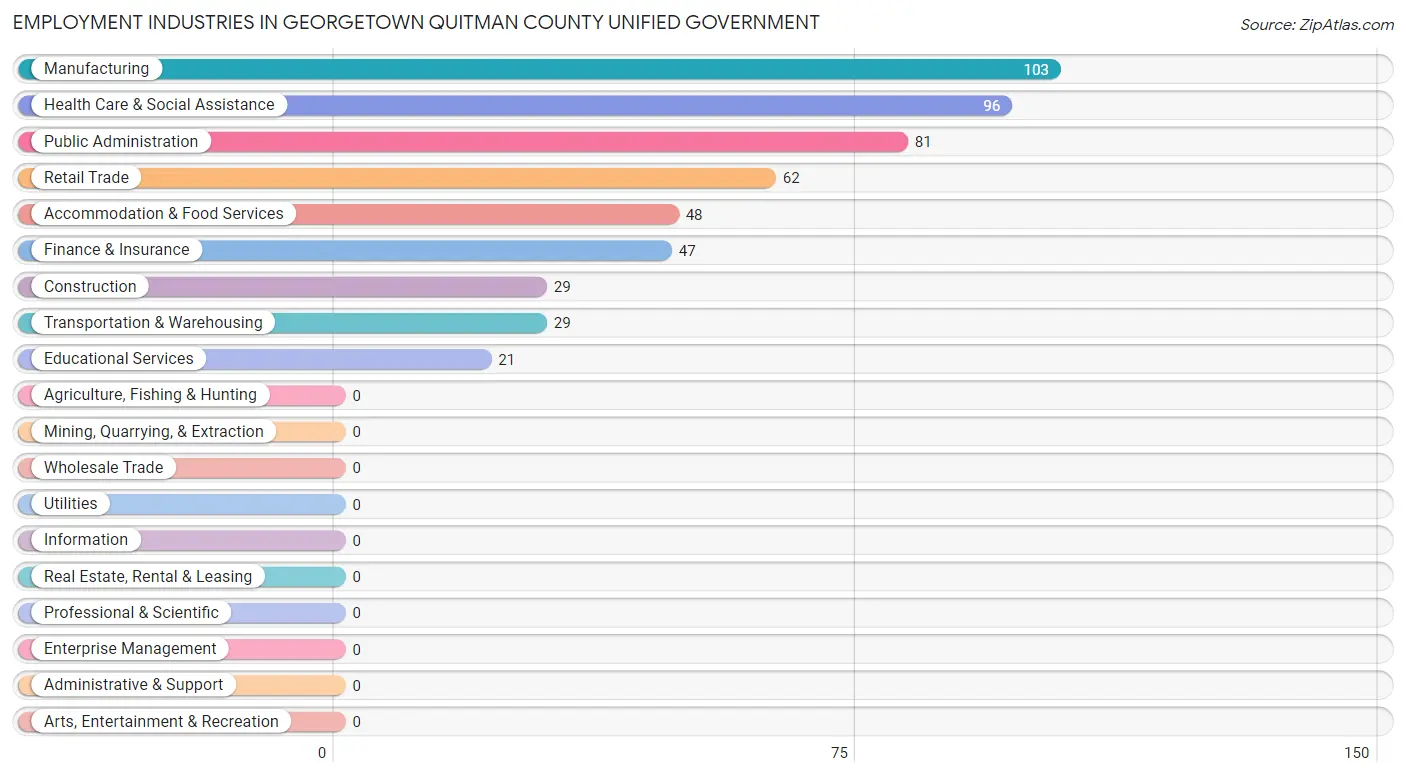
Employment Industries in Georgetown Quitman County unified government
The major employment industries in Georgetown Quitman County unified government include Manufacturing (103 | 19.6%), Health Care & Social Assistance (96 | 18.3%), Public Administration (81 | 15.4%), Retail Trade (62 | 11.8%), and Accommodation & Food Services (48 | 9.1%).
Employment Industries by Sex in Georgetown Quitman County unified government
The Georgetown Quitman County unified government industries that see more men than women are Construction (100.0%), Accommodation & Food Services (83.3%), and Transportation & Warehousing (72.4%), whereas the industries that tend to have a higher number of women are Health Care & Social Assistance (95.8%), Retail Trade (79.0%), and Public Administration (72.8%).
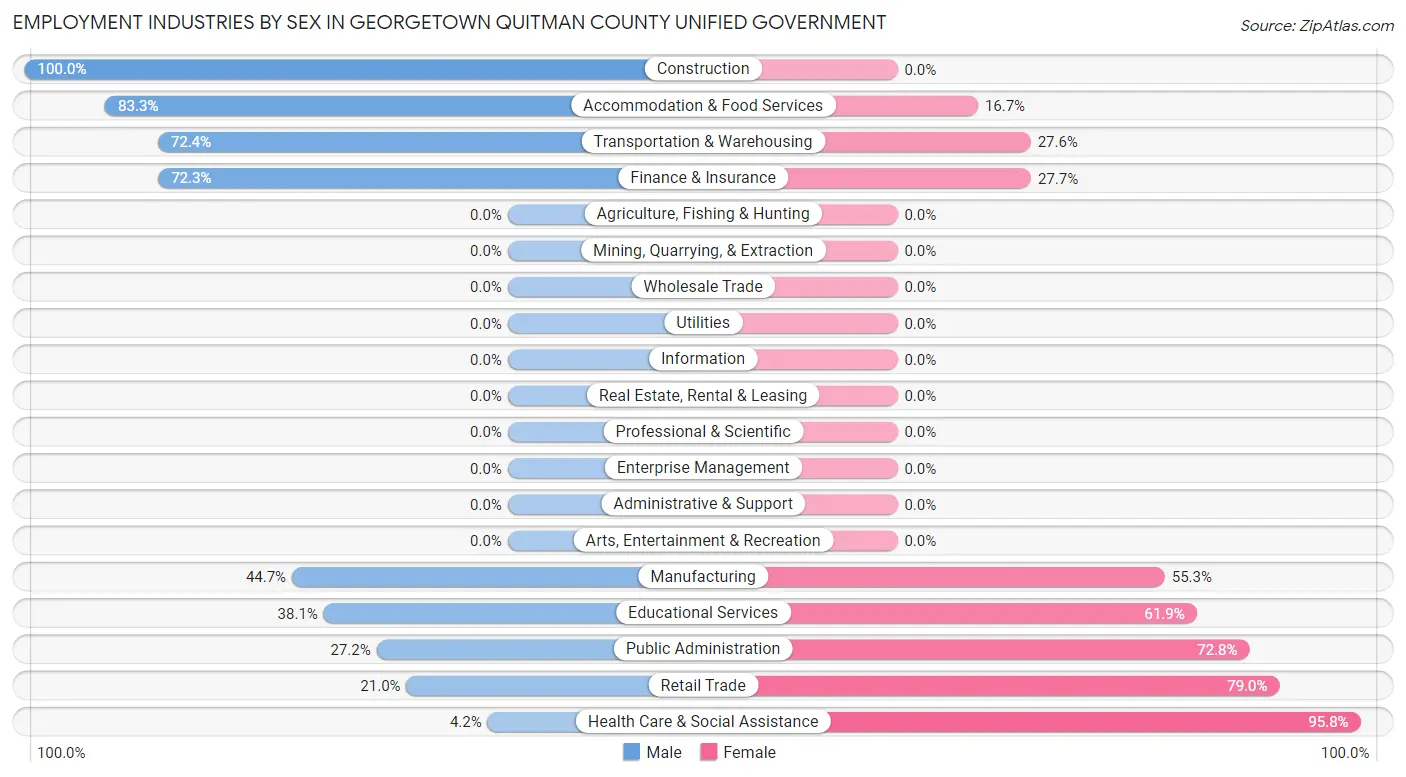
| Industry | Male | Female |
| Agriculture, Fishing & Hunting | 0 (0.0%) | 0 (0.0%) |
| Mining, Quarrying, & Extraction | 0 (0.0%) | 0 (0.0%) |
| Construction | 29 (100.0%) | 0 (0.0%) |
| Manufacturing | 46 (44.7%) | 57 (55.3%) |
| Wholesale Trade | 0 (0.0%) | 0 (0.0%) |
| Retail Trade | 13 (21.0%) | 49 (79.0%) |
| Transportation & Warehousing | 21 (72.4%) | 8 (27.6%) |
| Utilities | 0 (0.0%) | 0 (0.0%) |
| Information | 0 (0.0%) | 0 (0.0%) |
| Finance & Insurance | 34 (72.3%) | 13 (27.7%) |
| Real Estate, Rental & Leasing | 0 (0.0%) | 0 (0.0%) |
| Professional & Scientific | 0 (0.0%) | 0 (0.0%) |
| Enterprise Management | 0 (0.0%) | 0 (0.0%) |
| Administrative & Support | 0 (0.0%) | 0 (0.0%) |
| Educational Services | 8 (38.1%) | 13 (61.9%) |
| Health Care & Social Assistance | 4 (4.2%) | 92 (95.8%) |
| Arts, Entertainment & Recreation | 0 (0.0%) | 0 (0.0%) |
| Accommodation & Food Services | 40 (83.3%) | 8 (16.7%) |
| Public Administration | 22 (27.2%) | 59 (72.8%) |
| Total | 221 (42.1%) | 304 (57.9%) |
Education in Georgetown Quitman County unified government
School Enrollment in Georgetown Quitman County unified government
The most common levels of schooling among the 223 students in Georgetown Quitman County unified government are elementary school (62 | 27.8%), middle school (49 | 22.0%), and college / undergraduate (39 | 17.5%).
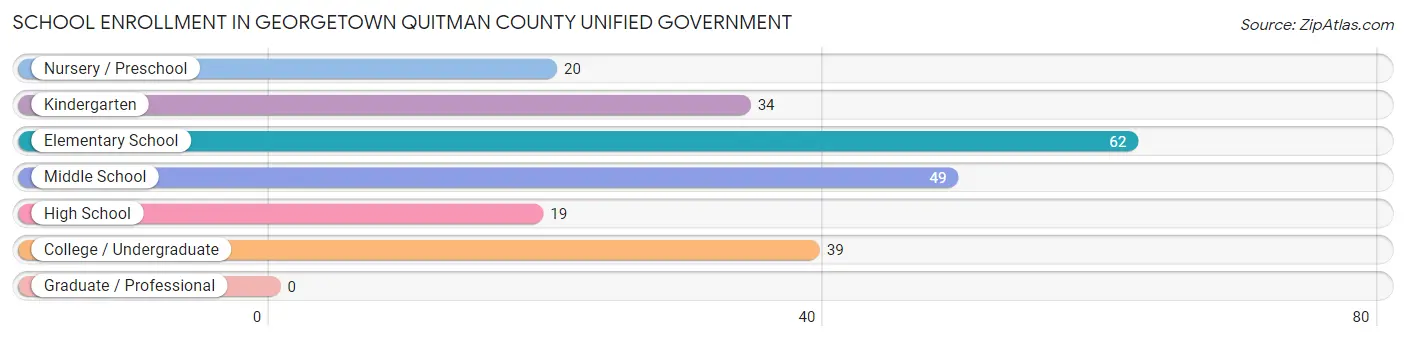
| School Level | # Students | % Students |
| Nursery / Preschool | 20 | 9.0% |
| Kindergarten | 34 | 15.2% |
| Elementary School | 62 | 27.8% |
| Middle School | 49 | 22.0% |
| High School | 19 | 8.5% |
| College / Undergraduate | 39 | 17.5% |
| Graduate / Professional | 0 | 0.0% |
| Total | 223 | 100.0% |
School Enrollment by Age by Funding Source in Georgetown Quitman County unified government
Out of a total of 223 students who are enrolled in schools in Georgetown Quitman County unified government, 6 (2.7%) attend a private institution, while the remaining 217 (97.3%) are enrolled in public schools. The age group of 5 to 9 year old has the highest likelihood of being enrolled in private schools, with 6 (6.8% in the age bracket) enrolled. Conversely, the age group of 3 to 4 year olds has the lowest likelihood of being enrolled in a private school, with 20 (100.0% in the age bracket) attending a public institution.
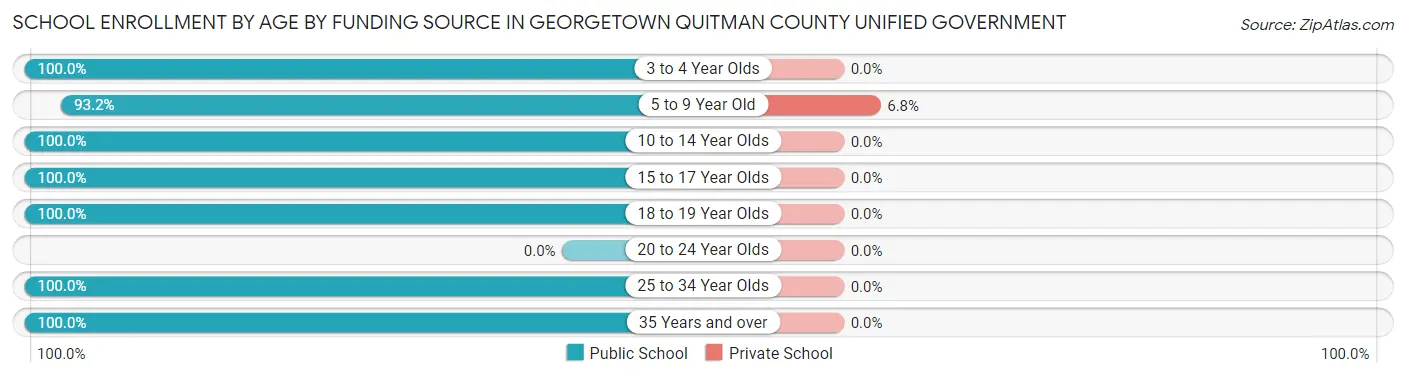
| Age Bracket | Public School | Private School |
| 3 to 4 Year Olds | 20 (100.0%) | 0 (0.0%) |
| 5 to 9 Year Old | 82 (93.2%) | 6 (6.8%) |
| 10 to 14 Year Olds | 57 (100.0%) | 0 (0.0%) |
| 15 to 17 Year Olds | 21 (100.0%) | 0 (0.0%) |
| 18 to 19 Year Olds | 15 (100.0%) | 0 (0.0%) |
| 20 to 24 Year Olds | 0 (0.0%) | 0 (0.0%) |
| 25 to 34 Year Olds | 5 (100.0%) | 0 (0.0%) |
| 35 Years and over | 17 (100.0%) | 0 (0.0%) |
| Total | 217 (97.3%) | 6 (2.7%) |
Educational Attainment by Field of Study in Georgetown Quitman County unified government
Business (58 | 31.4%), education (48 | 26.0%), arts & humanities (25 | 13.5%), social sciences (20 | 10.8%), and physical & health sciences (16 | 8.6%) are the most common fields of study among 185 individuals in Georgetown Quitman County unified government who have obtained a bachelor's degree or higher.
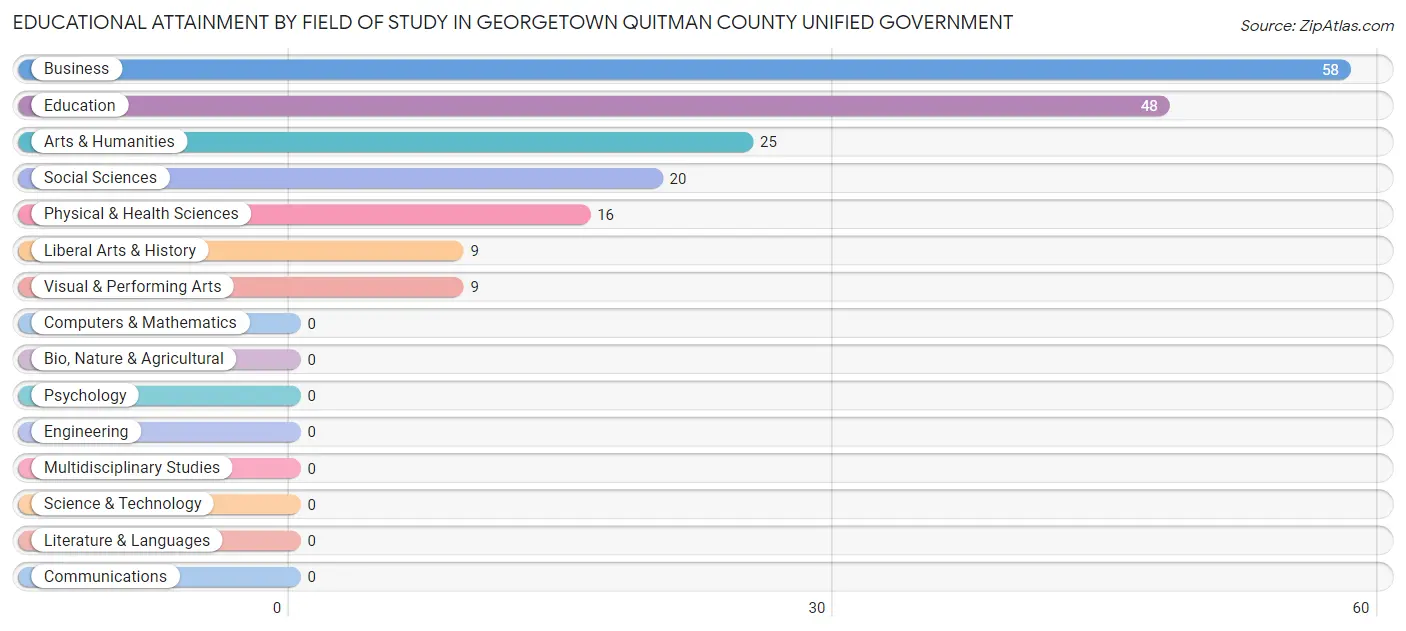
| Field of Study | # Graduates | % Graduates |
| Computers & Mathematics | 0 | 0.0% |
| Bio, Nature & Agricultural | 0 | 0.0% |
| Physical & Health Sciences | 16 | 8.6% |
| Psychology | 0 | 0.0% |
| Social Sciences | 20 | 10.8% |
| Engineering | 0 | 0.0% |
| Multidisciplinary Studies | 0 | 0.0% |
| Science & Technology | 0 | 0.0% |
| Business | 58 | 31.4% |
| Education | 48 | 26.0% |
| Literature & Languages | 0 | 0.0% |
| Liberal Arts & History | 9 | 4.9% |
| Visual & Performing Arts | 9 | 4.9% |
| Communications | 0 | 0.0% |
| Arts & Humanities | 25 | 13.5% |
| Total | 185 | 100.0% |
Transportation & Commute in Georgetown Quitman County unified government
Vehicle Availability by Sex in Georgetown Quitman County unified government
The most prevalent vehicle ownership categories in Georgetown Quitman County unified government are males with 1 vehicle (81, accounting for 36.6%) and females with 1 vehicle (79, making up 26.6%).
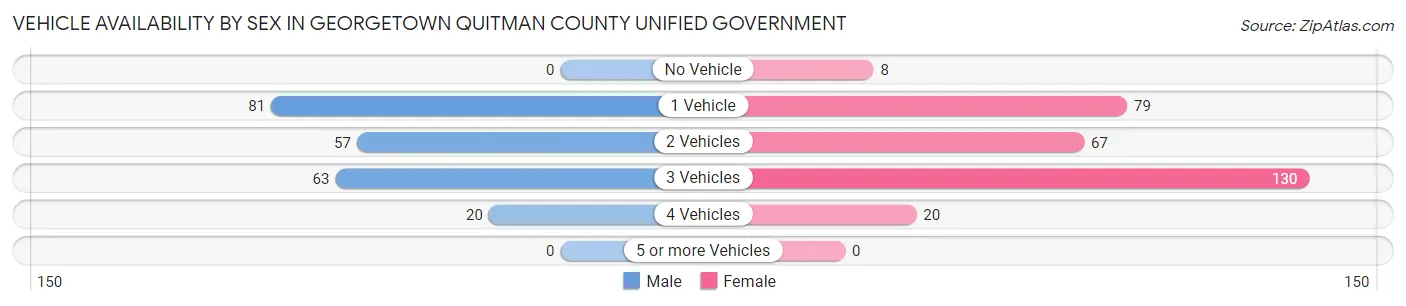
| Vehicles Available | Male | Female |
| No Vehicle | 0 (0.0%) | 8 (2.6%) |
| 1 Vehicle | 81 (36.6%) | 79 (26.0%) |
| 2 Vehicles | 57 (25.8%) | 67 (22.0%) |
| 3 Vehicles | 63 (28.5%) | 130 (42.8%) |
| 4 Vehicles | 20 (9.0%) | 20 (6.6%) |
| 5 or more Vehicles | 0 (0.0%) | 0 (0.0%) |
| Total | 221 (100.0%) | 304 (100.0%) |
Commute Time in Georgetown Quitman County unified government
The most frequently occuring commute durations in Georgetown Quitman County unified government are 20 to 24 minutes (177 commuters, 34.2%), 45 to 59 minutes (109 commuters, 21.1%), and 10 to 14 minutes (54 commuters, 10.4%).
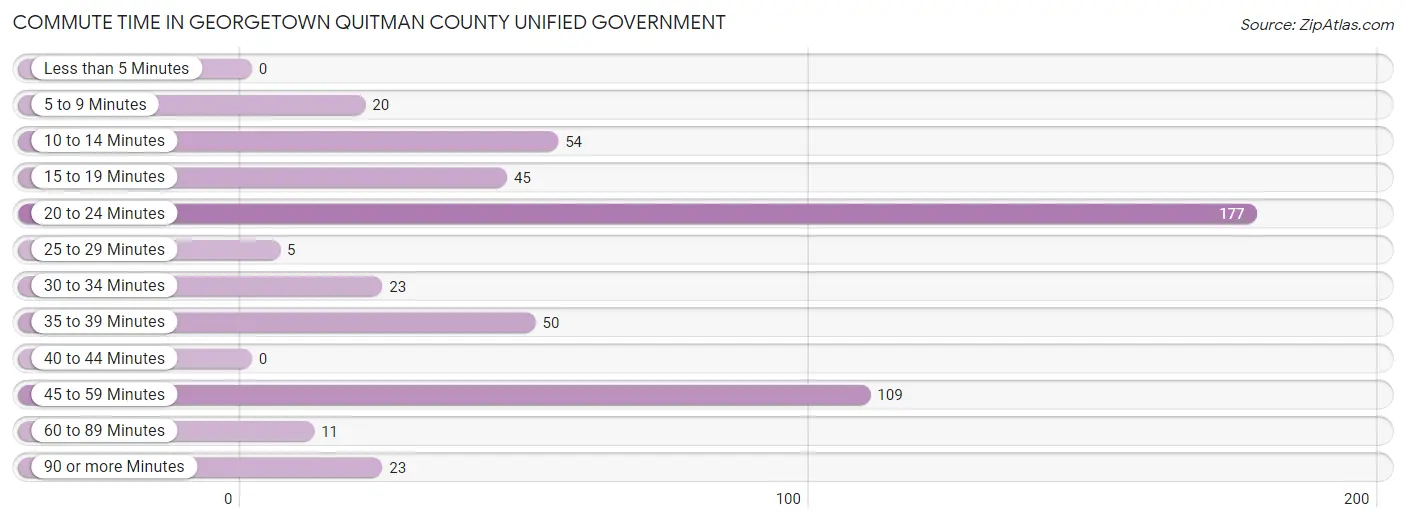
| Commute Time | # Commuters | % Commuters |
| Less than 5 Minutes | 0 | 0.0% |
| 5 to 9 Minutes | 20 | 3.9% |
| 10 to 14 Minutes | 54 | 10.4% |
| 15 to 19 Minutes | 45 | 8.7% |
| 20 to 24 Minutes | 177 | 34.2% |
| 25 to 29 Minutes | 5 | 1.0% |
| 30 to 34 Minutes | 23 | 4.4% |
| 35 to 39 Minutes | 50 | 9.7% |
| 40 to 44 Minutes | 0 | 0.0% |
| 45 to 59 Minutes | 109 | 21.1% |
| 60 to 89 Minutes | 11 | 2.1% |
| 90 or more Minutes | 23 | 4.4% |
Commute Time by Sex in Georgetown Quitman County unified government
The most common commute times in Georgetown Quitman County unified government are 20 to 24 minutes (120 commuters, 55.6%) for males and 45 to 59 minutes (68 commuters, 22.6%) for females.
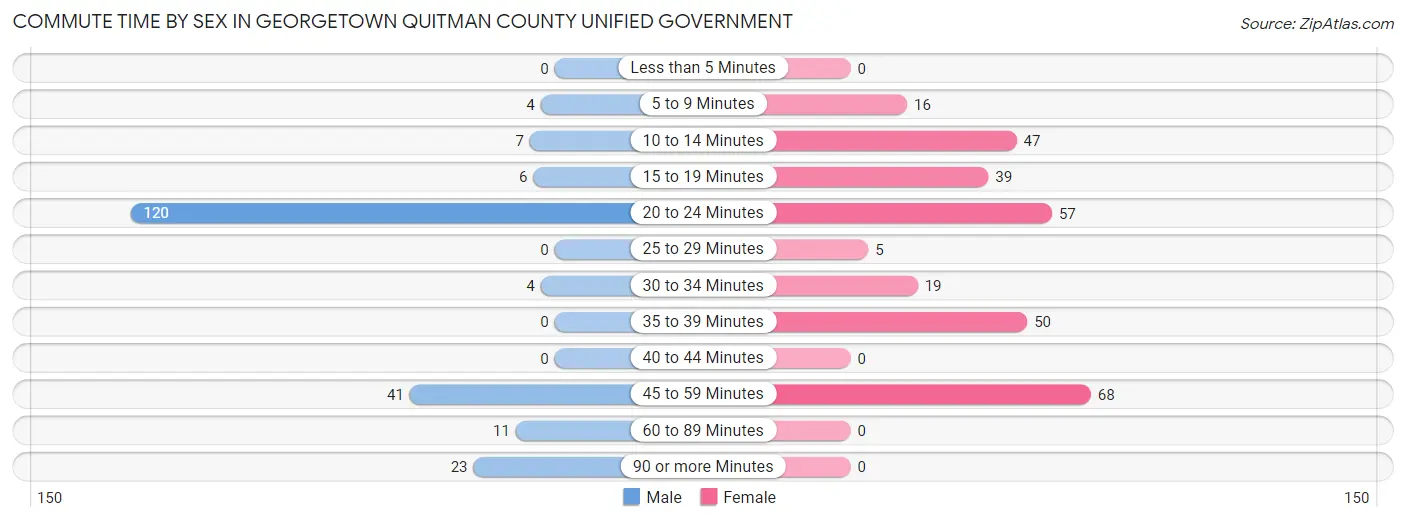
| Commute Time | Male | Female |
| Less than 5 Minutes | 0 (0.0%) | 0 (0.0%) |
| 5 to 9 Minutes | 4 (1.8%) | 16 (5.3%) |
| 10 to 14 Minutes | 7 (3.2%) | 47 (15.6%) |
| 15 to 19 Minutes | 6 (2.8%) | 39 (13.0%) |
| 20 to 24 Minutes | 120 (55.6%) | 57 (18.9%) |
| 25 to 29 Minutes | 0 (0.0%) | 5 (1.7%) |
| 30 to 34 Minutes | 4 (1.8%) | 19 (6.3%) |
| 35 to 39 Minutes | 0 (0.0%) | 50 (16.6%) |
| 40 to 44 Minutes | 0 (0.0%) | 0 (0.0%) |
| 45 to 59 Minutes | 41 (19.0%) | 68 (22.6%) |
| 60 to 89 Minutes | 11 (5.1%) | 0 (0.0%) |
| 90 or more Minutes | 23 (10.6%) | 0 (0.0%) |
Time of Departure to Work by Sex in Georgetown Quitman County unified government
The most frequent times of departure to work in Georgetown Quitman County unified government are 12:00 AM to 4:59 AM (46, 21.3%) for males and 7:00 AM to 7:29 AM (80, 26.6%) for females.
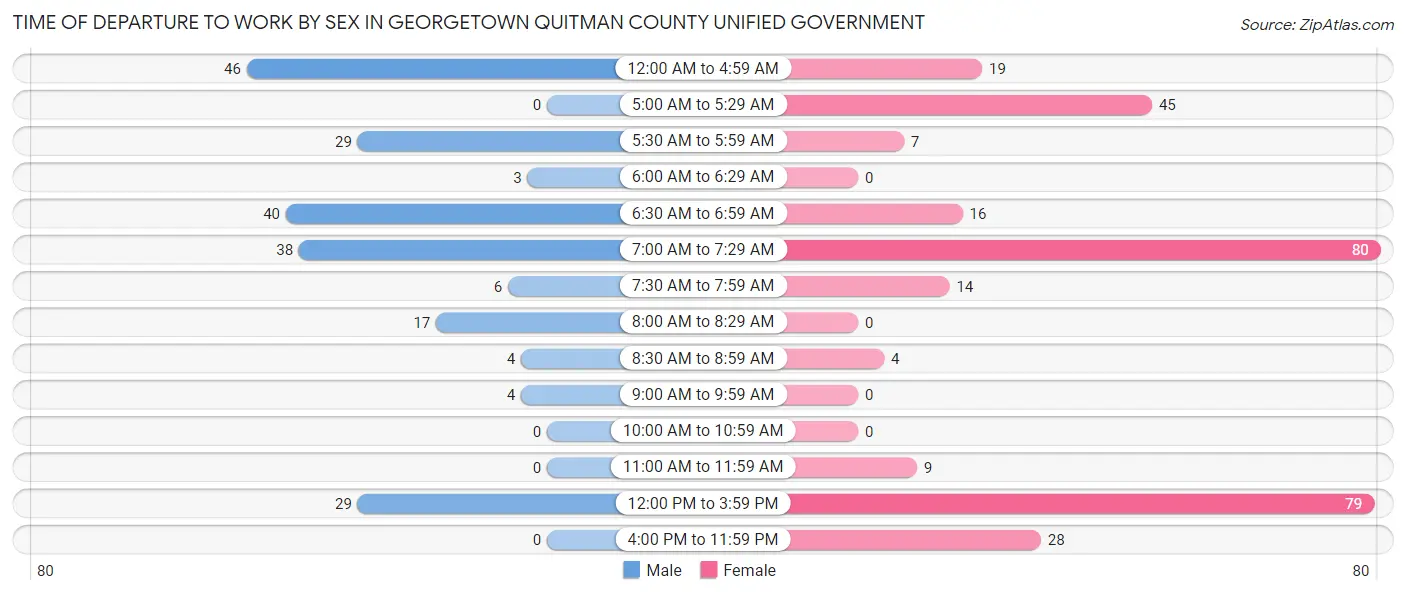
| Time of Departure | Male | Female |
| 12:00 AM to 4:59 AM | 46 (21.3%) | 19 (6.3%) |
| 5:00 AM to 5:29 AM | 0 (0.0%) | 45 (14.9%) |
| 5:30 AM to 5:59 AM | 29 (13.4%) | 7 (2.3%) |
| 6:00 AM to 6:29 AM | 3 (1.4%) | 0 (0.0%) |
| 6:30 AM to 6:59 AM | 40 (18.5%) | 16 (5.3%) |
| 7:00 AM to 7:29 AM | 38 (17.6%) | 80 (26.6%) |
| 7:30 AM to 7:59 AM | 6 (2.8%) | 14 (4.6%) |
| 8:00 AM to 8:29 AM | 17 (7.9%) | 0 (0.0%) |
| 8:30 AM to 8:59 AM | 4 (1.8%) | 4 (1.3%) |
| 9:00 AM to 9:59 AM | 4 (1.8%) | 0 (0.0%) |
| 10:00 AM to 10:59 AM | 0 (0.0%) | 0 (0.0%) |
| 11:00 AM to 11:59 AM | 0 (0.0%) | 9 (3.0%) |
| 12:00 PM to 3:59 PM | 29 (13.4%) | 79 (26.3%) |
| 4:00 PM to 11:59 PM | 0 (0.0%) | 28 (9.3%) |
| Total | 216 (100.0%) | 301 (100.0%) |
Housing Occupancy in Georgetown Quitman County unified government
Occupancy by Ownership in Georgetown Quitman County unified government
Of the total 958 dwellings in Georgetown Quitman County unified government, owner-occupied units account for 773 (80.7%), while renter-occupied units make up 185 (19.3%).
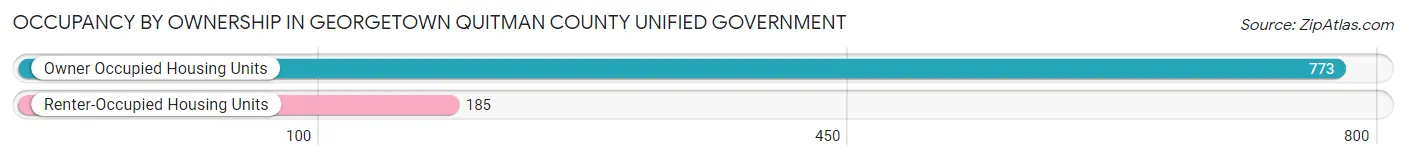
| Occupancy | # Housing Units | % Housing Units |
| Owner Occupied Housing Units | 773 | 80.7% |
| Renter-Occupied Housing Units | 185 | 19.3% |
| Total Occupied Housing Units | 958 | 100.0% |
Occupancy by Household Size in Georgetown Quitman County unified government
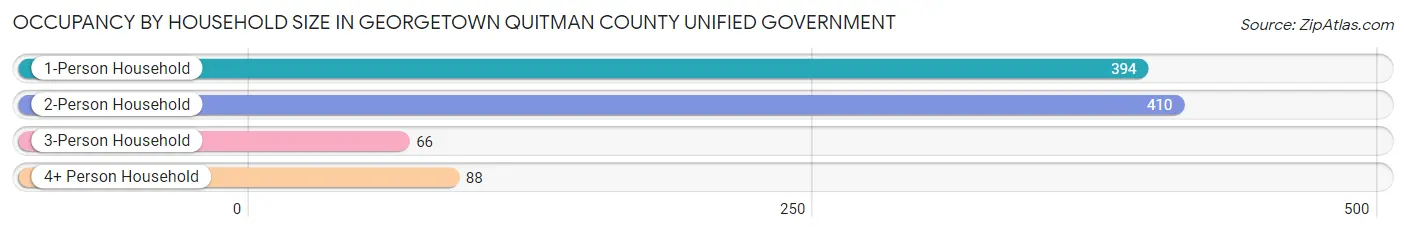
| Household Size | # Housing Units | % Housing Units |
| 1-Person Household | 394 | 41.1% |
| 2-Person Household | 410 | 42.8% |
| 3-Person Household | 66 | 6.9% |
| 4+ Person Household | 88 | 9.2% |
| Total Housing Units | 958 | 100.0% |
Occupancy by Ownership by Household Size in Georgetown Quitman County unified government
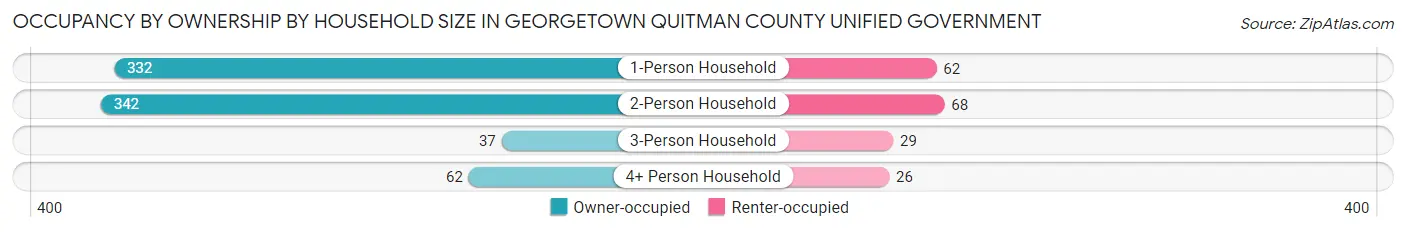
| Household Size | Owner-occupied | Renter-occupied |
| 1-Person Household | 332 (84.3%) | 62 (15.7%) |
| 2-Person Household | 342 (83.4%) | 68 (16.6%) |
| 3-Person Household | 37 (56.1%) | 29 (43.9%) |
| 4+ Person Household | 62 (70.5%) | 26 (29.5%) |
| Total Housing Units | 773 (80.7%) | 185 (19.3%) |
Occupancy by Educational Attainment in Georgetown Quitman County unified government
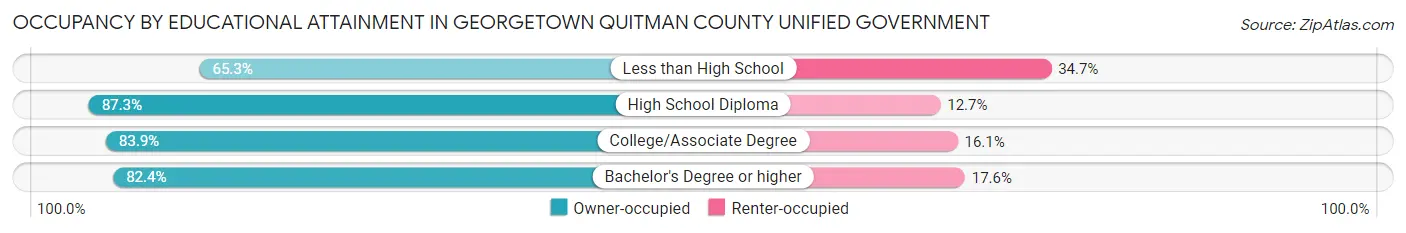
| Household Size | Owner-occupied | Renter-occupied |
| Less than High School | 143 (65.3%) | 76 (34.7%) |
| High School Diploma | 295 (87.3%) | 43 (12.7%) |
| College/Associate Degree | 260 (83.9%) | 50 (16.1%) |
| Bachelor's Degree or higher | 75 (82.4%) | 16 (17.6%) |
Occupancy by Age of Householder in Georgetown Quitman County unified government
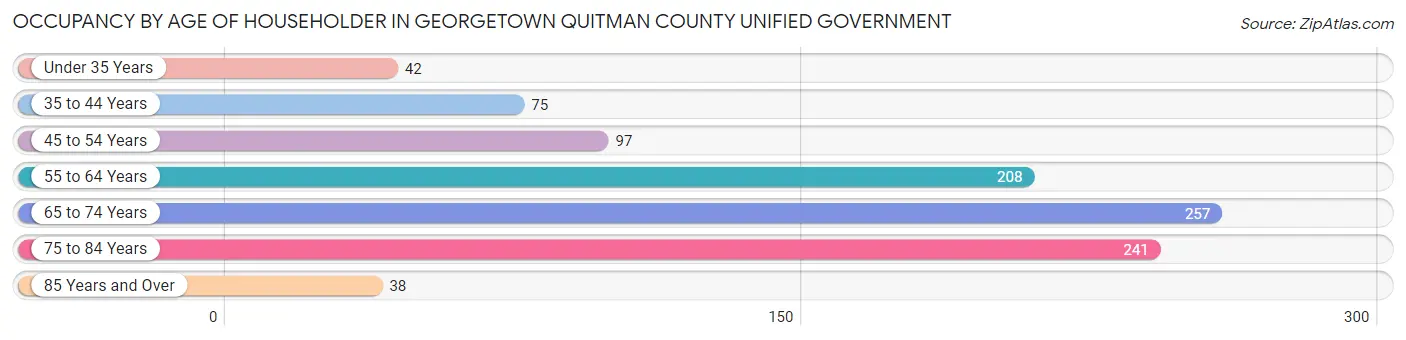
| Age Bracket | # Households | % Households |
| Under 35 Years | 42 | 4.4% |
| 35 to 44 Years | 75 | 7.8% |
| 45 to 54 Years | 97 | 10.1% |
| 55 to 64 Years | 208 | 21.7% |
| 65 to 74 Years | 257 | 26.8% |
| 75 to 84 Years | 241 | 25.2% |
| 85 Years and Over | 38 | 4.0% |
| Total | 958 | 100.0% |
Housing Finances in Georgetown Quitman County unified government
Median Income by Occupancy in Georgetown Quitman County unified government
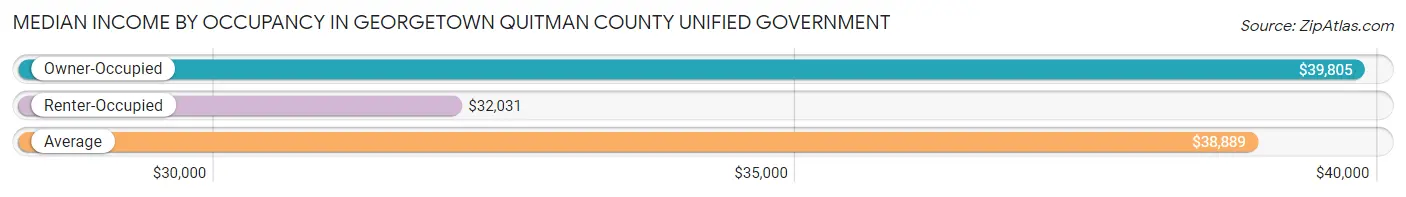
| Occupancy Type | # Households | Median Income |
| Owner-Occupied | 773 (80.7%) | $39,805 |
| Renter-Occupied | 185 (19.3%) | $32,031 |
| Average | 958 (100.0%) | $38,889 |
Occupancy by Householder Income Bracket in Georgetown Quitman County unified government
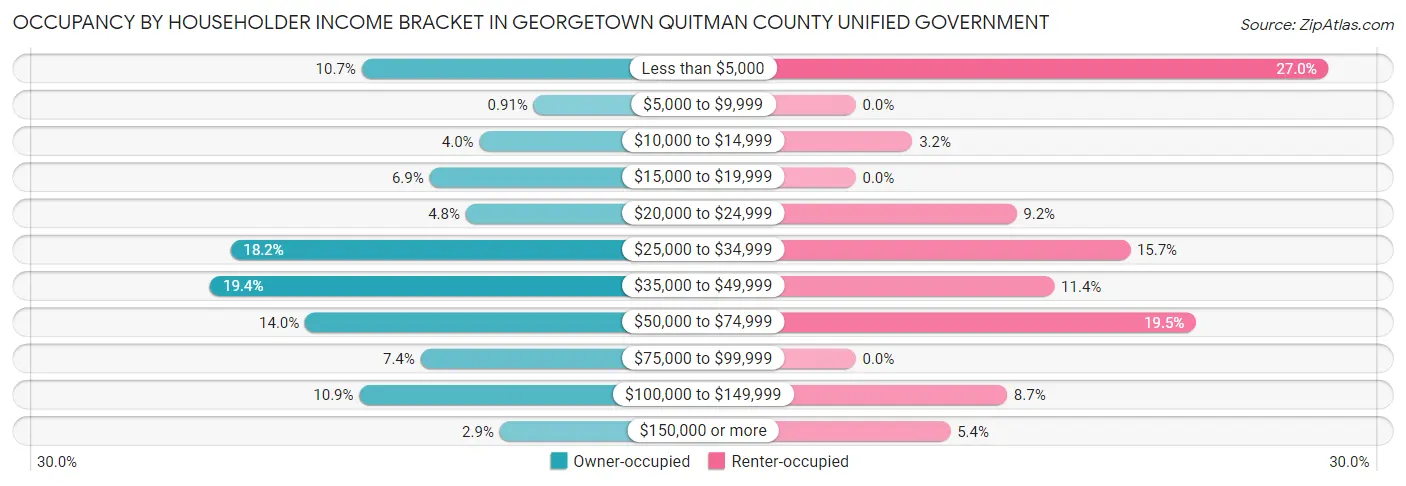
| Income Bracket | Owner-occupied | Renter-occupied |
| Less than $5,000 | 83 (10.7%) | 50 (27.0%) |
| $5,000 to $9,999 | 7 (0.9%) | 0 (0.0%) |
| $10,000 to $14,999 | 31 (4.0%) | 6 (3.2%) |
| $15,000 to $19,999 | 53 (6.9%) | 0 (0.0%) |
| $20,000 to $24,999 | 37 (4.8%) | 17 (9.2%) |
| $25,000 to $34,999 | 141 (18.2%) | 29 (15.7%) |
| $35,000 to $49,999 | 150 (19.4%) | 21 (11.4%) |
| $50,000 to $74,999 | 108 (14.0%) | 36 (19.5%) |
| $75,000 to $99,999 | 57 (7.4%) | 0 (0.0%) |
| $100,000 to $149,999 | 84 (10.9%) | 16 (8.6%) |
| $150,000 or more | 22 (2.9%) | 10 (5.4%) |
| Total | 773 (100.0%) | 185 (100.0%) |
Monthly Housing Cost Tiers in Georgetown Quitman County unified government
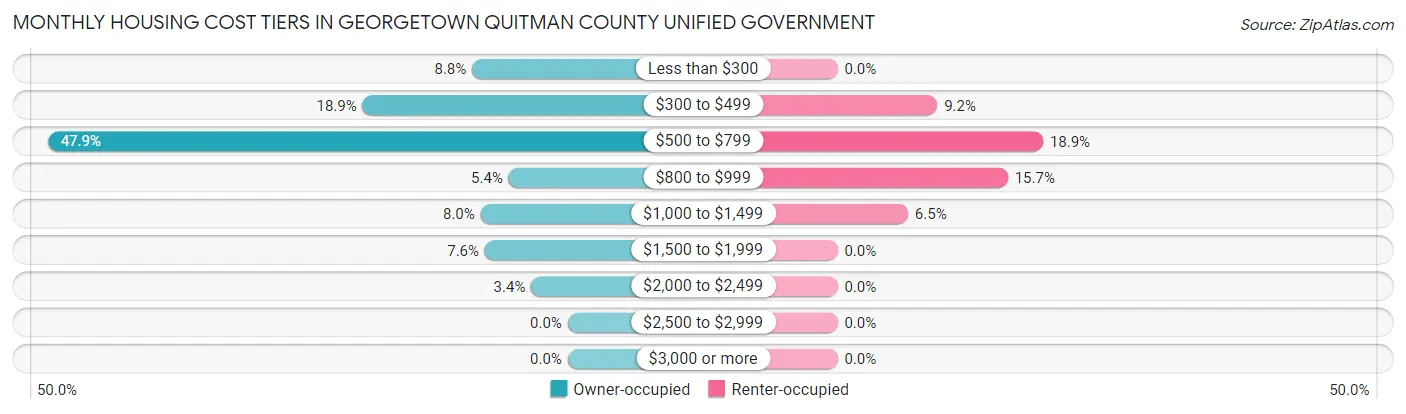
| Monthly Cost | Owner-occupied | Renter-occupied |
| Less than $300 | 68 (8.8%) | 0 (0.0%) |
| $300 to $499 | 146 (18.9%) | 17 (9.2%) |
| $500 to $799 | 370 (47.9%) | 35 (18.9%) |
| $800 to $999 | 42 (5.4%) | 29 (15.7%) |
| $1,000 to $1,499 | 62 (8.0%) | 12 (6.5%) |
| $1,500 to $1,999 | 59 (7.6%) | 0 (0.0%) |
| $2,000 to $2,499 | 26 (3.4%) | 0 (0.0%) |
| $2,500 to $2,999 | 0 (0.0%) | 0 (0.0%) |
| $3,000 or more | 0 (0.0%) | 0 (0.0%) |
| Total | 773 (100.0%) | 185 (100.0%) |
Physical Housing Characteristics in Georgetown Quitman County unified government
Housing Structures in Georgetown Quitman County unified government
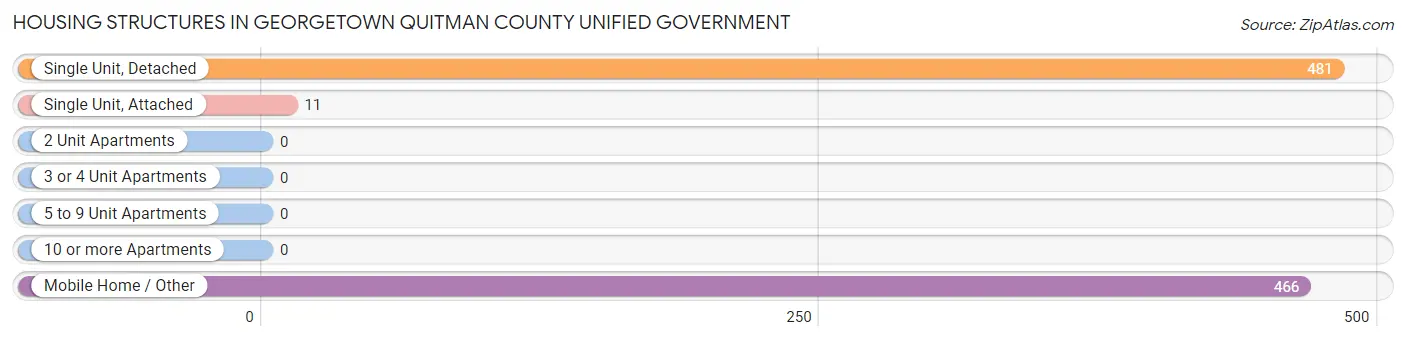
| Structure Type | # Housing Units | % Housing Units |
| Single Unit, Detached | 481 | 50.2% |
| Single Unit, Attached | 11 | 1.1% |
| 2 Unit Apartments | 0 | 0.0% |
| 3 or 4 Unit Apartments | 0 | 0.0% |
| 5 to 9 Unit Apartments | 0 | 0.0% |
| 10 or more Apartments | 0 | 0.0% |
| Mobile Home / Other | 466 | 48.6% |
| Total | 958 | 100.0% |
Housing Structures by Occupancy in Georgetown Quitman County unified government
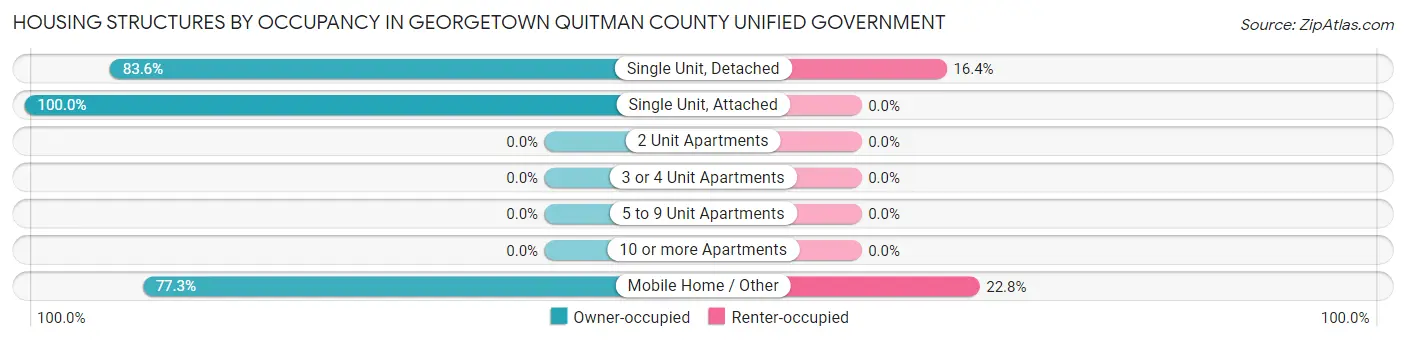
| Structure Type | Owner-occupied | Renter-occupied |
| Single Unit, Detached | 402 (83.6%) | 79 (16.4%) |
| Single Unit, Attached | 11 (100.0%) | 0 (0.0%) |
| 2 Unit Apartments | 0 (0.0%) | 0 (0.0%) |
| 3 or 4 Unit Apartments | 0 (0.0%) | 0 (0.0%) |
| 5 to 9 Unit Apartments | 0 (0.0%) | 0 (0.0%) |
| 10 or more Apartments | 0 (0.0%) | 0 (0.0%) |
| Mobile Home / Other | 360 (77.2%) | 106 (22.8%) |
| Total | 773 (80.7%) | 185 (19.3%) |
Housing Structures by Number of Rooms in Georgetown Quitman County unified government
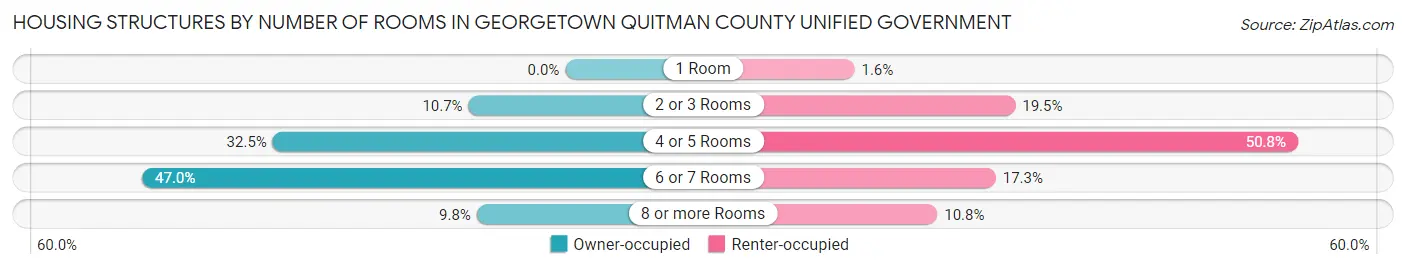
| Number of Rooms | Owner-occupied | Renter-occupied |
| 1 Room | 0 (0.0%) | 3 (1.6%) |
| 2 or 3 Rooms | 83 (10.7%) | 36 (19.5%) |
| 4 or 5 Rooms | 251 (32.5%) | 94 (50.8%) |
| 6 or 7 Rooms | 363 (47.0%) | 32 (17.3%) |
| 8 or more Rooms | 76 (9.8%) | 20 (10.8%) |
| Total | 773 (100.0%) | 185 (100.0%) |
Housing Structure by Heating Type in Georgetown Quitman County unified government
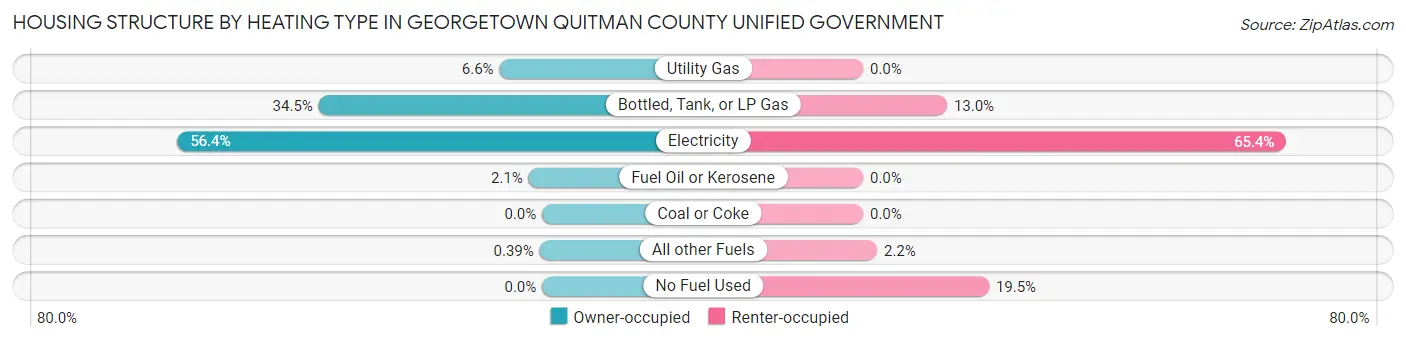
| Heating Type | Owner-occupied | Renter-occupied |
| Utility Gas | 51 (6.6%) | 0 (0.0%) |
| Bottled, Tank, or LP Gas | 267 (34.5%) | 24 (13.0%) |
| Electricity | 436 (56.4%) | 121 (65.4%) |
| Fuel Oil or Kerosene | 16 (2.1%) | 0 (0.0%) |
| Coal or Coke | 0 (0.0%) | 0 (0.0%) |
| All other Fuels | 3 (0.4%) | 4 (2.2%) |
| No Fuel Used | 0 (0.0%) | 36 (19.5%) |
| Total | 773 (100.0%) | 185 (100.0%) |
Household Vehicle Usage in Georgetown Quitman County unified government
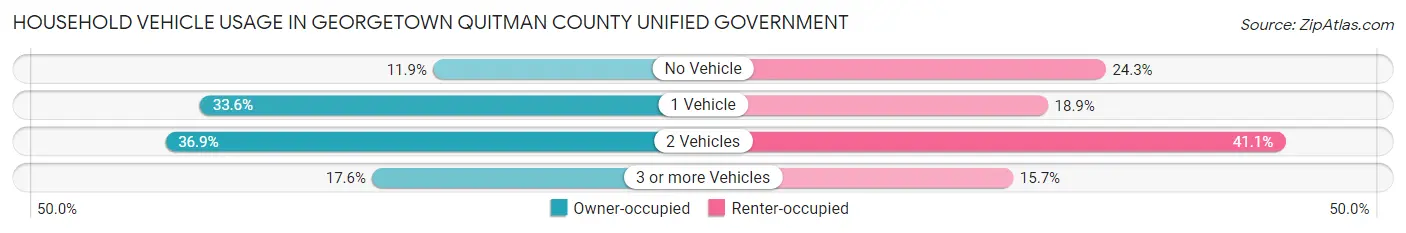
| Vehicles per Household | Owner-occupied | Renter-occupied |
| No Vehicle | 92 (11.9%) | 45 (24.3%) |
| 1 Vehicle | 260 (33.6%) | 35 (18.9%) |
| 2 Vehicles | 285 (36.9%) | 76 (41.1%) |
| 3 or more Vehicles | 136 (17.6%) | 29 (15.7%) |
| Total | 773 (100.0%) | 185 (100.0%) |
Real Estate & Mortgages in Georgetown Quitman County unified government
Real Estate and Mortgage Overview in Georgetown Quitman County unified government
| Characteristic | Without Mortgage | With Mortgage |
| Housing Units | 519 | 254 |
| Median Property Value | $85,300 | $0 |
| Median Household Income | $34,846 | $0 |
| Monthly Housing Costs | $551 | $0 |
| Real Estate Taxes | $579 | $12 |
Property Value by Mortgage Status in Georgetown Quitman County unified government
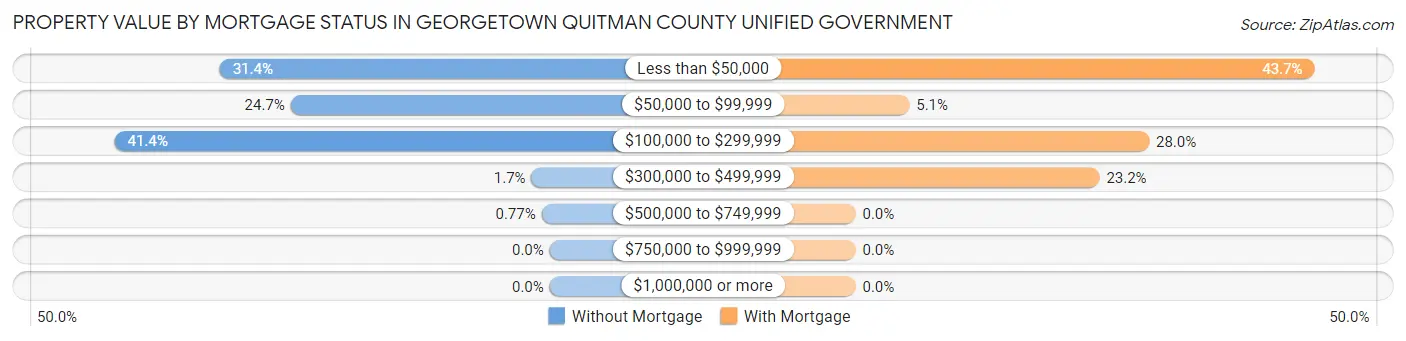
| Property Value | Without Mortgage | With Mortgage |
| Less than $50,000 | 163 (31.4%) | 111 (43.7%) |
| $50,000 to $99,999 | 128 (24.7%) | 13 (5.1%) |
| $100,000 to $299,999 | 215 (41.4%) | 71 (28.0%) |
| $300,000 to $499,999 | 9 (1.7%) | 59 (23.2%) |
| $500,000 to $749,999 | 4 (0.8%) | 0 (0.0%) |
| $750,000 to $999,999 | 0 (0.0%) | 0 (0.0%) |
| $1,000,000 or more | 0 (0.0%) | 0 (0.0%) |
| Total | 519 (100.0%) | 254 (100.0%) |
Household Income by Mortgage Status in Georgetown Quitman County unified government
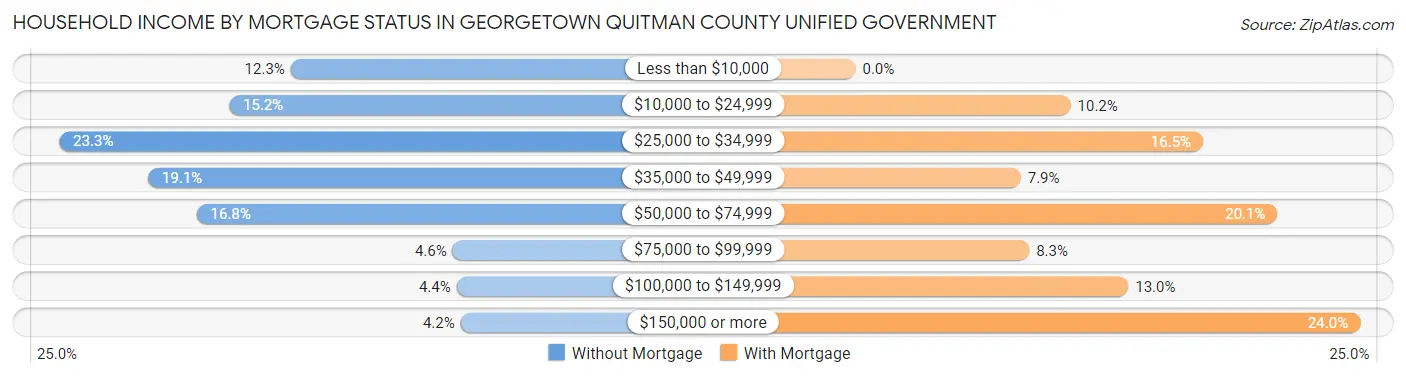
| Household Income | Without Mortgage | With Mortgage |
| Less than $10,000 | 64 (12.3%) | 0 (0.0%) |
| $10,000 to $24,999 | 79 (15.2%) | 26 (10.2%) |
| $25,000 to $34,999 | 121 (23.3%) | 42 (16.5%) |
| $35,000 to $49,999 | 99 (19.1%) | 20 (7.9%) |
| $50,000 to $74,999 | 87 (16.8%) | 51 (20.1%) |
| $75,000 to $99,999 | 24 (4.6%) | 21 (8.3%) |
| $100,000 to $149,999 | 23 (4.4%) | 33 (13.0%) |
| $150,000 or more | 22 (4.2%) | 61 (24.0%) |
| Total | 519 (100.0%) | 254 (100.0%) |
Property Value to Household Income Ratio in Georgetown Quitman County unified government
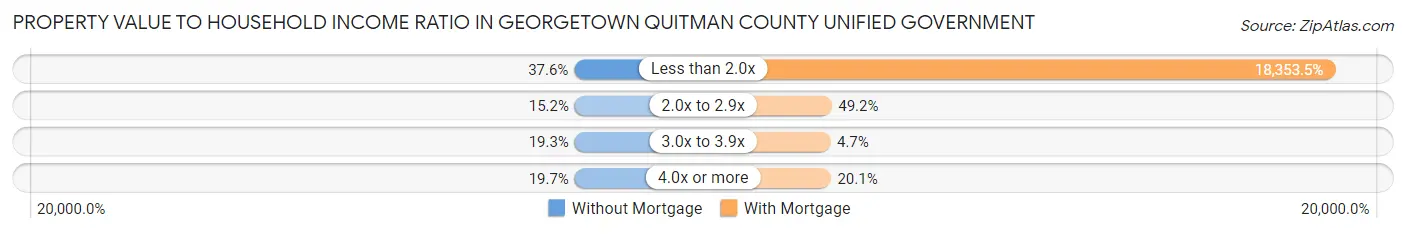
| Value-to-Income Ratio | Without Mortgage | With Mortgage |
| Less than 2.0x | 195 (37.6%) | 46,618 (18,353.5%) |
| 2.0x to 2.9x | 79 (15.2%) | 125 (49.2%) |
| 3.0x to 3.9x | 100 (19.3%) | 12 (4.7%) |
| 4.0x or more | 102 (19.7%) | 51 (20.1%) |
| Total | 519 (100.0%) | 254 (100.0%) |
Real Estate Taxes by Mortgage Status in Georgetown Quitman County unified government
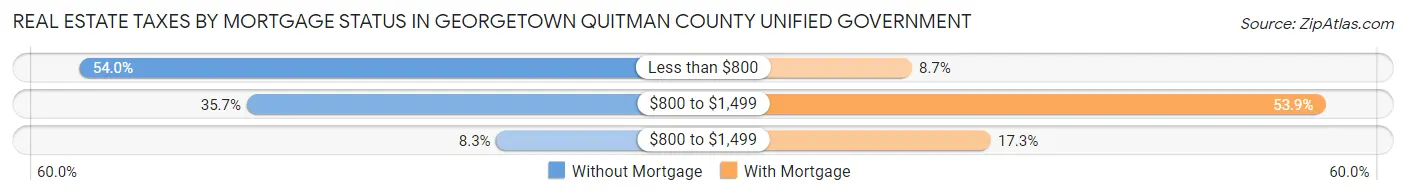
| Property Taxes | Without Mortgage | With Mortgage |
| Less than $800 | 280 (53.9%) | 22 (8.7%) |
| $800 to $1,499 | 185 (35.6%) | 137 (53.9%) |
| $800 to $1,499 | 43 (8.3%) | 44 (17.3%) |
| Total | 519 (100.0%) | 254 (100.0%) |
Health & Disability in Georgetown Quitman County unified government
Health Insurance Coverage by Age in Georgetown Quitman County unified government
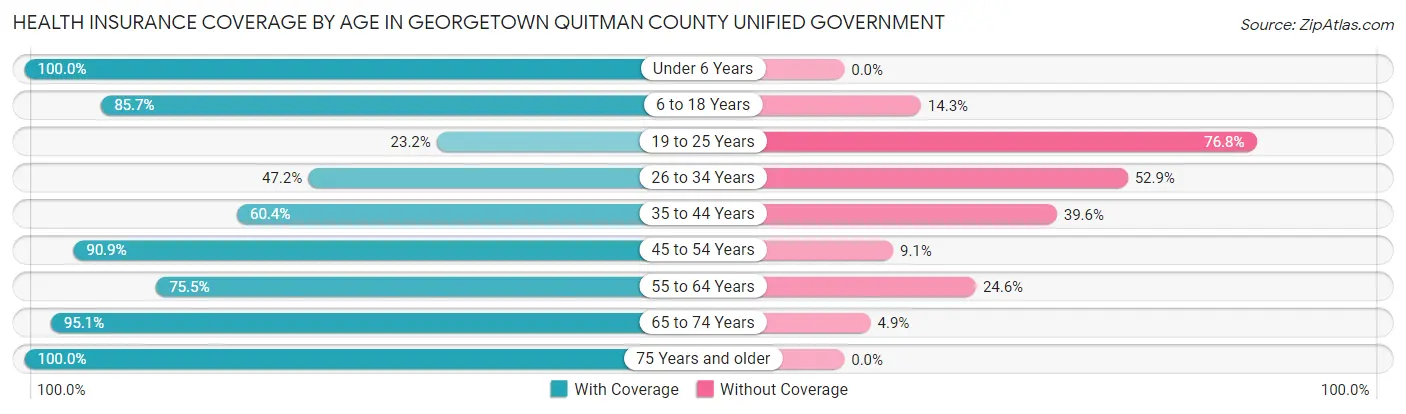
| Age Bracket | With Coverage | Without Coverage |
| Under 6 Years | 107 (100.0%) | 0 (0.0%) |
| 6 to 18 Years | 120 (85.7%) | 20 (14.3%) |
| 19 to 25 Years | 60 (23.2%) | 199 (76.8%) |
| 26 to 34 Years | 91 (47.1%) | 102 (52.8%) |
| 35 to 44 Years | 64 (60.4%) | 42 (39.6%) |
| 45 to 54 Years | 160 (90.9%) | 16 (9.1%) |
| 55 to 64 Years | 332 (75.4%) | 108 (24.5%) |
| 65 to 74 Years | 408 (95.1%) | 21 (4.9%) |
| 75 Years and older | 330 (100.0%) | 0 (0.0%) |
| Total | 1,672 (76.7%) | 508 (23.3%) |
Health Insurance Coverage by Citizenship Status in Georgetown Quitman County unified government
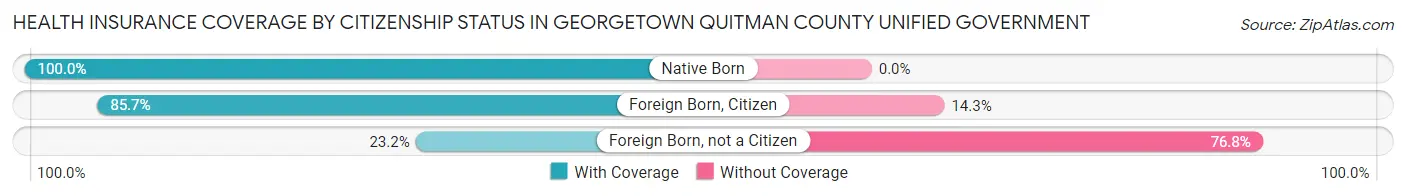
| Citizenship Status | With Coverage | Without Coverage |
| Native Born | 107 (100.0%) | 0 (0.0%) |
| Foreign Born, Citizen | 120 (85.7%) | 20 (14.3%) |
| Foreign Born, not a Citizen | 60 (23.2%) | 199 (76.8%) |
Health Insurance Coverage by Household Income in Georgetown Quitman County unified government
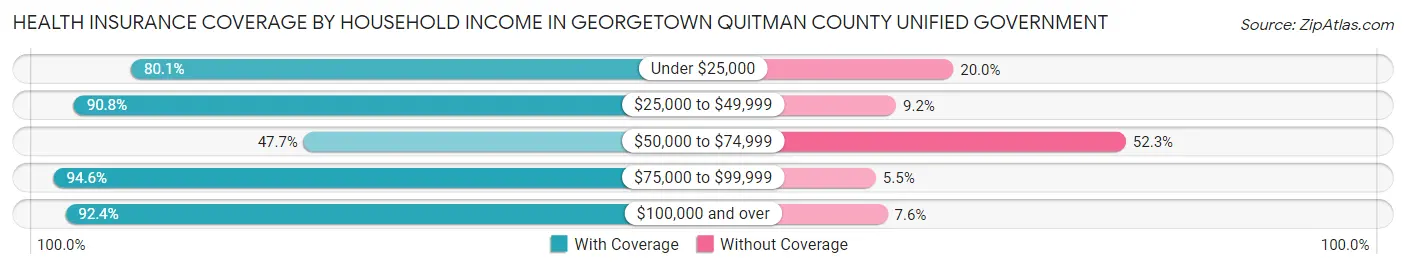
| Household Income | With Coverage | Without Coverage |
| Under $25,000 | 353 (80.0%) | 88 (20.0%) |
| $25,000 to $49,999 | 531 (90.8%) | 54 (9.2%) |
| $50,000 to $74,999 | 302 (47.7%) | 331 (52.3%) |
| $75,000 to $99,999 | 208 (94.6%) | 12 (5.4%) |
| $100,000 and over | 278 (92.4%) | 23 (7.6%) |
Public vs Private Health Insurance Coverage by Age in Georgetown Quitman County unified government
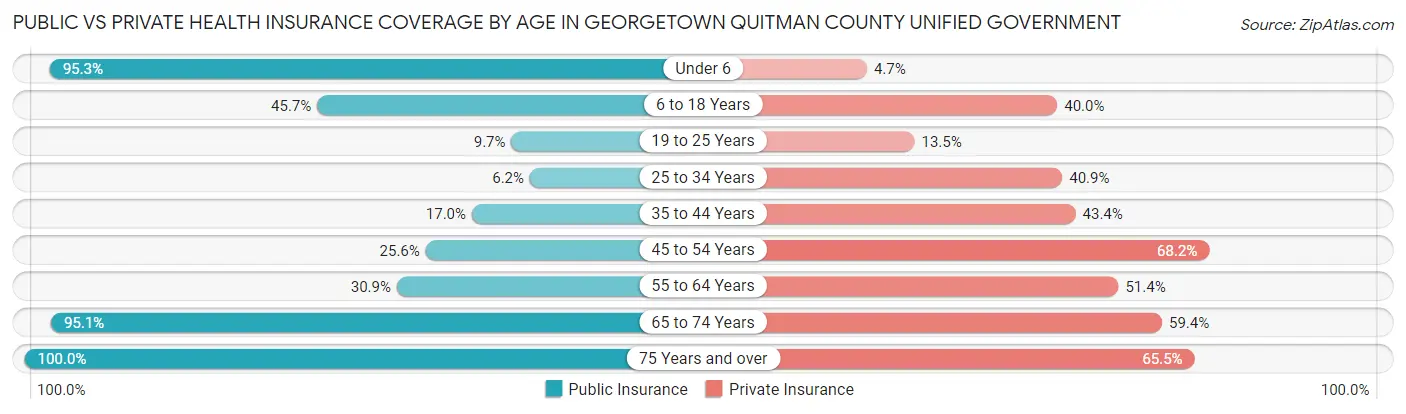
| Age Bracket | Public Insurance | Private Insurance |
| Under 6 | 102 (95.3%) | 5 (4.7%) |
| 6 to 18 Years | 64 (45.7%) | 56 (40.0%) |
| 19 to 25 Years | 25 (9.7%) | 35 (13.5%) |
| 25 to 34 Years | 12 (6.2%) | 79 (40.9%) |
| 35 to 44 Years | 18 (17.0%) | 46 (43.4%) |
| 45 to 54 Years | 45 (25.6%) | 120 (68.2%) |
| 55 to 64 Years | 136 (30.9%) | 226 (51.4%) |
| 65 to 74 Years | 408 (95.1%) | 255 (59.4%) |
| 75 Years and over | 330 (100.0%) | 216 (65.4%) |
| Total | 1,140 (52.3%) | 1,038 (47.6%) |
Disability Status by Sex by Age in Georgetown Quitman County unified government
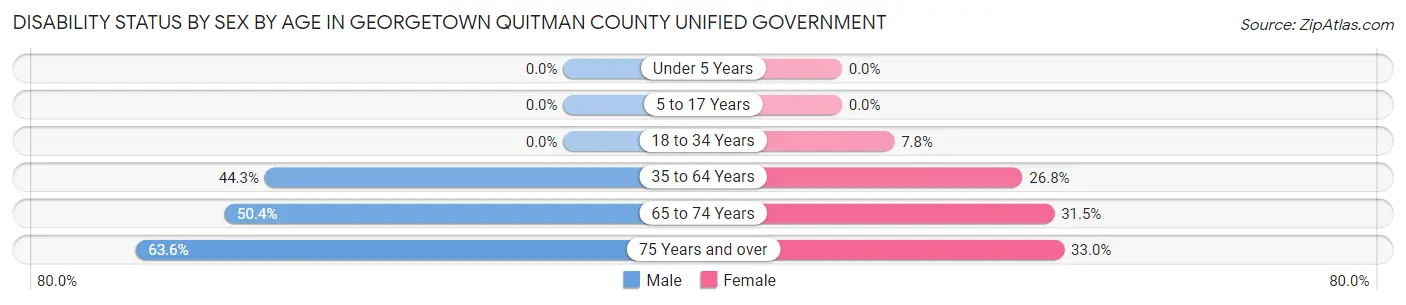
| Age Bracket | Male | Female |
| Under 5 Years | 0 (0.0%) | 0 (0.0%) |
| 5 to 17 Years | 0 (0.0%) | 0 (0.0%) |
| 18 to 34 Years | 0 (0.0%) | 7 (7.8%) |
| 35 to 64 Years | 125 (44.3%) | 118 (26.8%) |
| 65 to 74 Years | 141 (50.4%) | 47 (31.5%) |
| 75 Years and over | 75 (63.6%) | 70 (33.0%) |
Disability Class by Sex by Age in Georgetown Quitman County unified government
Disability Class: Hearing Difficulty
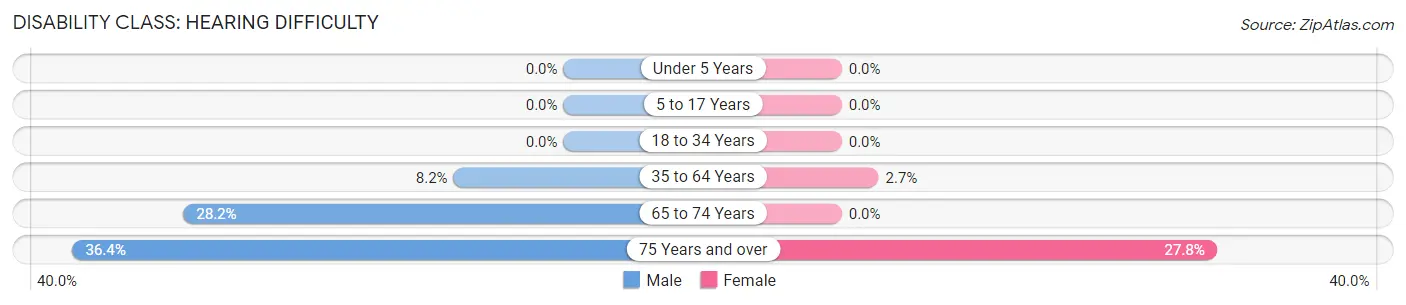
| Age Bracket | Male | Female |
| Under 5 Years | 0 (0.0%) | 0 (0.0%) |
| 5 to 17 Years | 0 (0.0%) | 0 (0.0%) |
| 18 to 34 Years | 0 (0.0%) | 0 (0.0%) |
| 35 to 64 Years | 23 (8.2%) | 12 (2.7%) |
| 65 to 74 Years | 79 (28.2%) | 0 (0.0%) |
| 75 Years and over | 43 (36.4%) | 59 (27.8%) |
Disability Class: Vision Difficulty
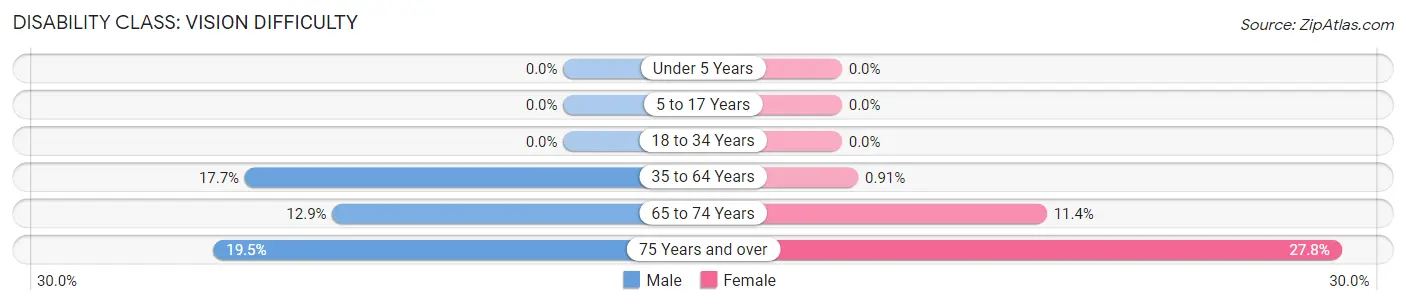
| Age Bracket | Male | Female |
| Under 5 Years | 0 (0.0%) | 0 (0.0%) |
| 5 to 17 Years | 0 (0.0%) | 0 (0.0%) |
| 18 to 34 Years | 0 (0.0%) | 0 (0.0%) |
| 35 to 64 Years | 50 (17.7%) | 4 (0.9%) |
| 65 to 74 Years | 36 (12.9%) | 17 (11.4%) |
| 75 Years and over | 23 (19.5%) | 59 (27.8%) |
Disability Class: Cognitive Difficulty
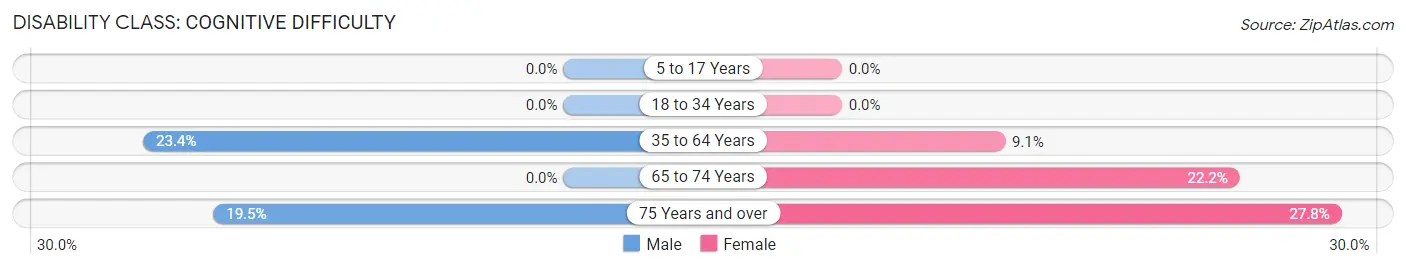
| Age Bracket | Male | Female |
| 5 to 17 Years | 0 (0.0%) | 0 (0.0%) |
| 18 to 34 Years | 0 (0.0%) | 0 (0.0%) |
| 35 to 64 Years | 66 (23.4%) | 40 (9.1%) |
| 65 to 74 Years | 0 (0.0%) | 33 (22.2%) |
| 75 Years and over | 23 (19.5%) | 59 (27.8%) |
Disability Class: Ambulatory Difficulty
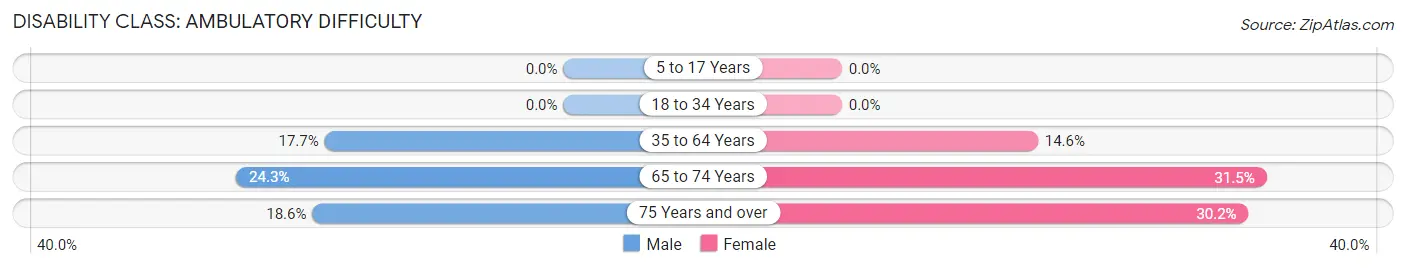
| Age Bracket | Male | Female |
| 5 to 17 Years | 0 (0.0%) | 0 (0.0%) |
| 18 to 34 Years | 0 (0.0%) | 0 (0.0%) |
| 35 to 64 Years | 50 (17.7%) | 64 (14.5%) |
| 65 to 74 Years | 68 (24.3%) | 47 (31.5%) |
| 75 Years and over | 22 (18.6%) | 64 (30.2%) |
Disability Class: Self-Care Difficulty
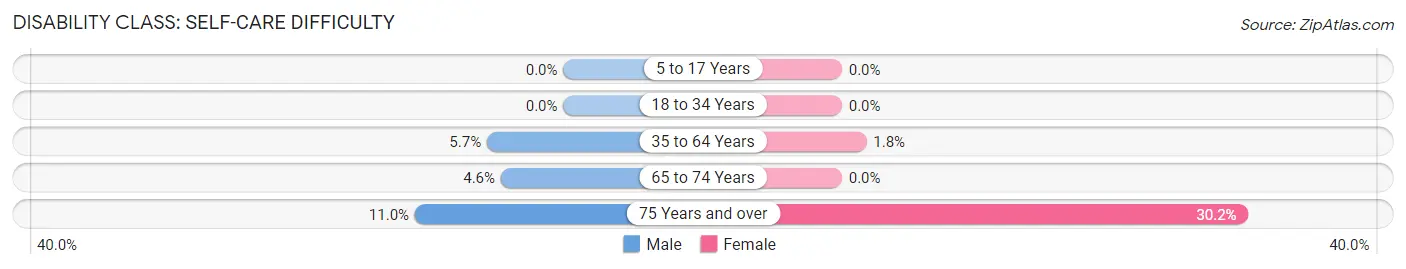
| Age Bracket | Male | Female |
| 5 to 17 Years | 0 (0.0%) | 0 (0.0%) |
| 18 to 34 Years | 0 (0.0%) | 0 (0.0%) |
| 35 to 64 Years | 16 (5.7%) | 8 (1.8%) |
| 65 to 74 Years | 13 (4.6%) | 0 (0.0%) |
| 75 Years and over | 13 (11.0%) | 64 (30.2%) |
Technology Access in Georgetown Quitman County unified government
Computing Device Access in Georgetown Quitman County unified government
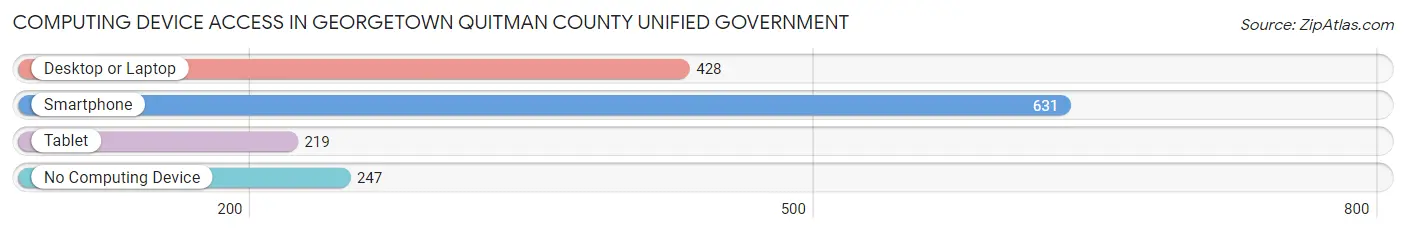
| Device Type | # Households | % Households |
| Desktop or Laptop | 428 | 44.7% |
| Smartphone | 631 | 65.9% |
| Tablet | 219 | 22.9% |
| No Computing Device | 247 | 25.8% |
| Total | 958 | 100.0% |
Internet Access in Georgetown Quitman County unified government
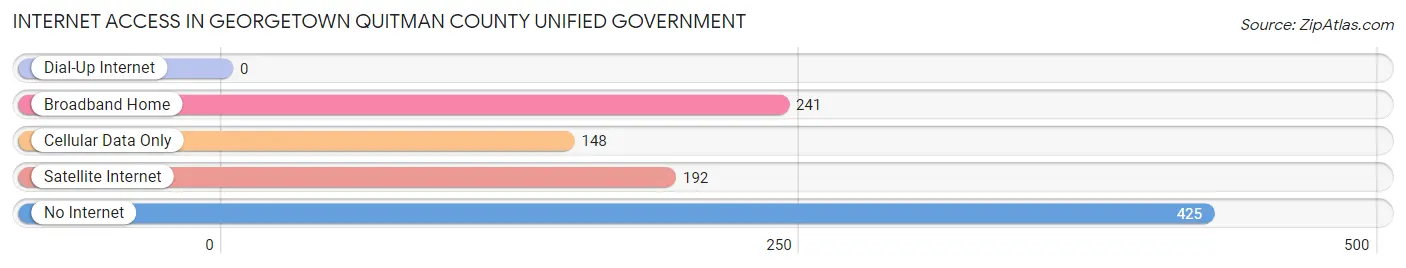
| Internet Type | # Households | % Households |
| Dial-Up Internet | 0 | 0.0% |
| Broadband Home | 241 | 25.2% |
| Cellular Data Only | 148 | 15.4% |
| Satellite Internet | 192 | 20.0% |
| No Internet | 425 | 44.4% |
| Total | 958 | 100.0% |
Georgetown Quitman County unified government Summary
Georgetown Quitman County Unified Government, Georgia is a unified government located in the southwestern corner of the state. It is comprised of the cities of Georgetown and Quitman, as well as the unincorporated areas of the county. The county seat is Georgetown. The population of the unified government was estimated to be 8,845 in 2019.
Geography
Georgetown Quitman County Unified Government is located in the southwestern corner of Georgia, bordering the states of Alabama and Florida. It is situated in the Coastal Plain region of the state, and is bordered by Decatur County to the north, Miller County to the east, Seminole County to the south, and Early County to the west. The terrain of the county is mostly flat, with some rolling hills in the northern part of the county. The county is drained by the Chattahoochee River, which forms the western boundary of the county.
The climate of the county is humid subtropical, with hot, humid summers and mild winters. The average annual temperature is around 70°F, with average highs in the summer reaching the mid-90s and average lows in the winter reaching the mid-30s. The average annual precipitation is around 50 inches, with most of it falling in the summer months.
Economy
The economy of Georgetown Quitman County Unified Government is largely based on agriculture and forestry. The county is home to several large farms, which produce a variety of crops, including cotton, corn, soybeans, and peanuts. The county is also home to several timber companies, which harvest timber from the county’s forests.
In addition to agriculture and forestry, the county is home to several manufacturing companies, which produce a variety of products, including furniture, textiles, and paper products. The county is also home to several retail stores, which sell a variety of goods, including clothing, electronics, and home goods.
Demographics
As of the 2019 census, the population of Georgetown Quitman County Unified Government was estimated to be 8,845. The population is made up of a diverse mix of races and ethnicities, with the largest group being African American (47.3%), followed by White (44.2%), Hispanic (4.7%), and Asian (2.2%). The median household income in the county is $35,845, and the median age is 38.
Conclusion
Georgetown Quitman County Unified Government, Georgia is a unified government located in the southwestern corner of the state. It is comprised of the cities of Georgetown and Quitman, as well as the unincorporated areas of the county. The county is largely rural, with a diverse mix of races and ethnicities. The economy of the county is largely based on agriculture and forestry, with some manufacturing and retail businesses. The population of the county was estimated to be 8,845 in 2019.
Common Questions
What is Per Capita Income in Georgetown Quitman County unified government?
Per Capita income in Georgetown Quitman County unified government is $22,189.
What is the Median Family Income in Georgetown Quitman County unified government?
Median Family Income in Georgetown Quitman County unified government is $59,500.
What is the Median Household income in Georgetown Quitman County unified government?
Median Household Income in Georgetown Quitman County unified government is $38,889.
What is Income or Wage Gap in Georgetown Quitman County unified government?
Income or Wage Gap in Georgetown Quitman County unified government is 16.1%.
Women in Georgetown Quitman County unified government earn 83.9 cents for every dollar earned by a man.
What is Family Income Deficit in Georgetown Quitman County unified government?
Family Income Deficit in Georgetown Quitman County unified government is $18,175.
Families that are below poverty line in Georgetown Quitman County unified government earn $18,175 less on average than the poverty threshold level.
What is Inequality or Gini Index in Georgetown Quitman County unified government?
Inequality or Gini Index in Georgetown Quitman County unified government is 0.47.
What is the Total Population of Georgetown Quitman County unified government?
Total Population of Georgetown Quitman County unified government is 2,180.
What is the Total Male Population of Georgetown Quitman County unified government?
Total Male Population of Georgetown Quitman County unified government is 1,179.
What is the Total Female Population of Georgetown Quitman County unified government?
Total Female Population of Georgetown Quitman County unified government is 1,001.
What is the Ratio of Males per 100 Females in Georgetown Quitman County unified government?
There are 117.78 Males per 100 Females in Georgetown Quitman County unified government.
What is the Ratio of Females per 100 Males in Georgetown Quitman County unified government?
There are 84.90 Females per 100 Males in Georgetown Quitman County unified government.
What is the Median Population Age in Georgetown Quitman County unified government?
Median Population Age in Georgetown Quitman County unified government is 59.1 Years.
What is the Average Family Size in Georgetown Quitman County unified government
Average Family Size in Georgetown Quitman County unified government is 3.2 People.
What is the Average Household Size in Georgetown Quitman County unified government
Average Household Size in Georgetown Quitman County unified government is 2.3 People.
How Large is the Labor Force in Georgetown Quitman County unified government?
There are 687 People in the Labor Forcein in Georgetown Quitman County unified government.
What is the Percentage of People in the Labor Force in Georgetown Quitman County unified government?
35.1% of People are in the Labor Force in Georgetown Quitman County unified government.
What is the Unemployment Rate in Georgetown Quitman County unified government?
Unemployment Rate in Georgetown Quitman County unified government is 23.5%.