Zip Codes with the Highest Percentage of Population Employed in Security & Protection in Buford, GA
RELATED REPORTS & OPTIONS
Security & Protection
Buford
Compare Zip Codes
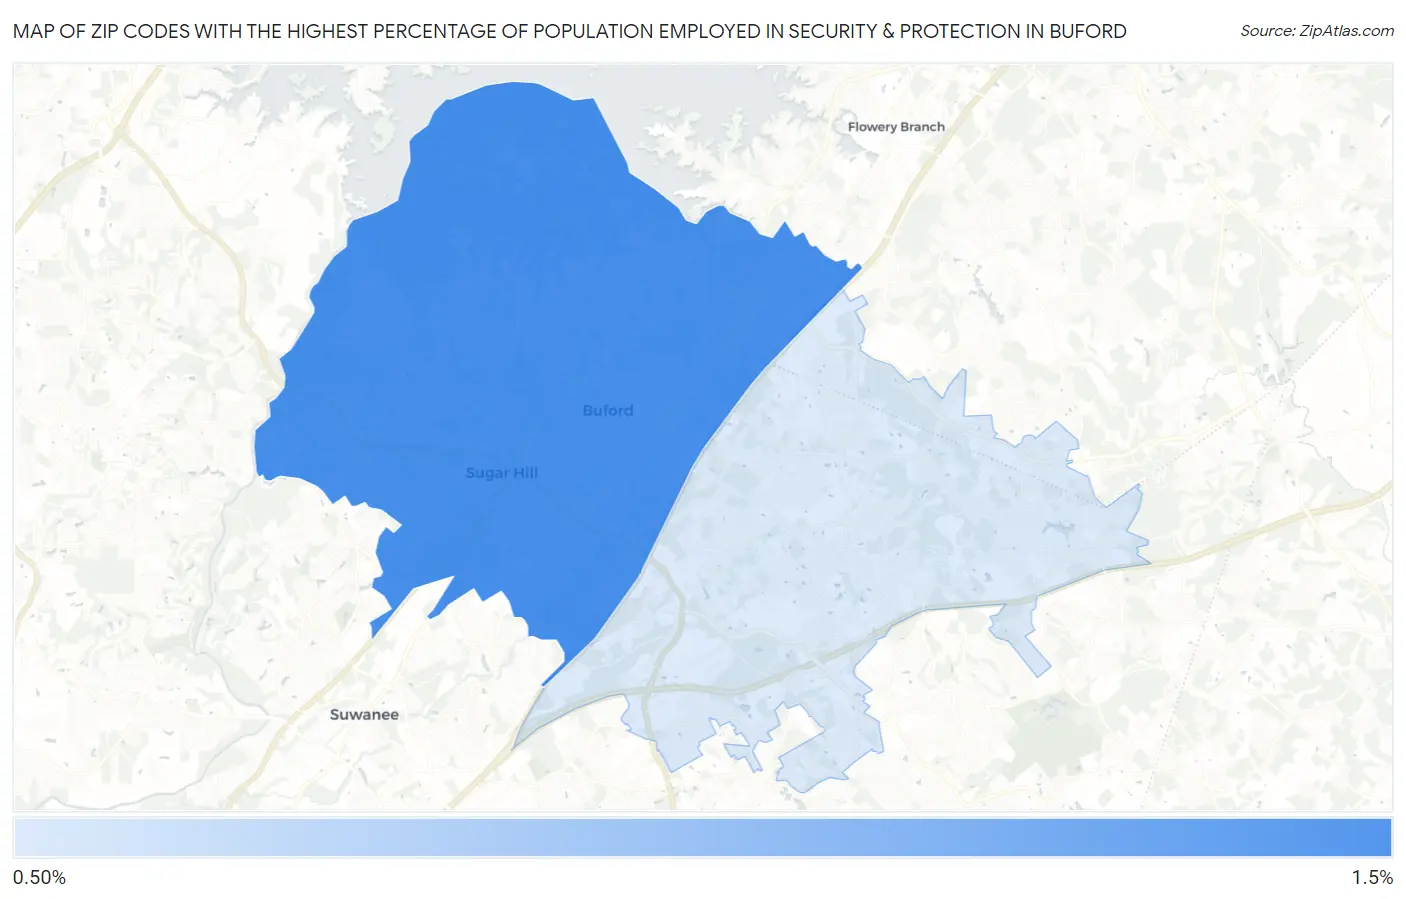
Map of Zip Codes with the Highest Percentage of Population Employed in Security & Protection in Buford
0.94%
1.4%
Zip Codes with the Highest Percentage of Population Employed in Security & Protection in Buford, GA
| Zip Code | % Employed | vs State | vs National | |
| 1. | 30518 | 1.4% | 2.2%(-0.802)#466 | 2.1%(-0.779)#17,187 |
| 2. | 30519 | 0.94% | 2.2%(-1.24)#535 | 2.1%(-1.21)#20,528 |
1
Common Questions
What are the Top Zip Codes with the Highest Percentage of Population Employed in Security & Protection in Buford, GA?
Top Zip Codes with the Highest Percentage of Population Employed in Security & Protection in Buford, GA are:
What zip code has the Highest Percentage of Population Employed in Security & Protection in Buford, GA?
30518 has the Highest Percentage of Population Employed in Security & Protection in Buford, GA with 1.4%.
What is the Percentage of Population Employed in Security & Protection in Buford, GA?
Percentage of Population Employed in Security & Protection in Buford is 3.4%.
What is the Percentage of Population Employed in Security & Protection in Georgia?
Percentage of Population Employed in Security & Protection in Georgia is 2.2%.
What is the Percentage of Population Employed in Security & Protection in the United States?
Percentage of Population Employed in Security & Protection in the United States is 2.1%.