Fairmount, GA Map & Demographics
Fairmount Map
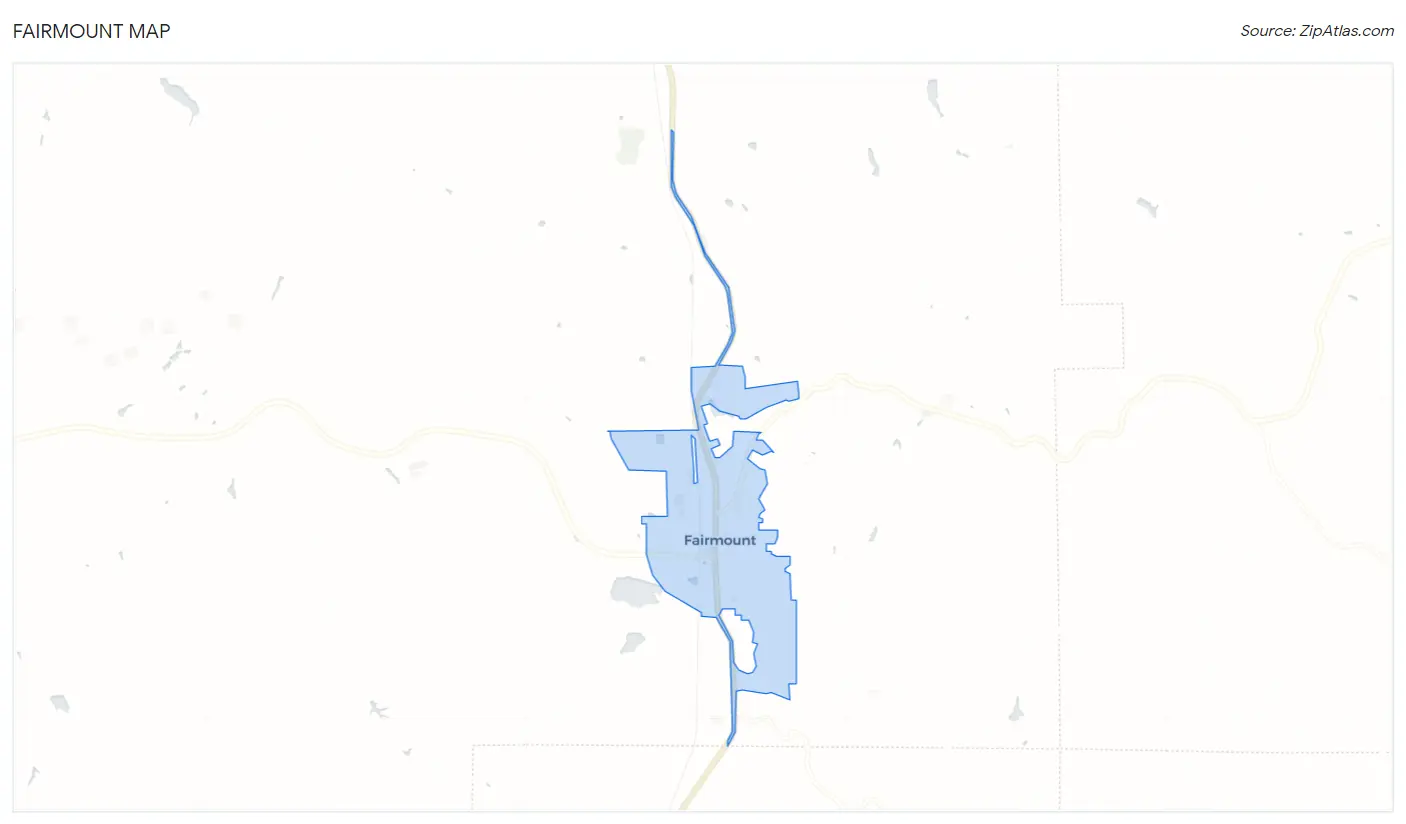
Fairmount Overview
$23,858
PER CAPITA INCOME
$67,083
AVG FAMILY INCOME
$61,042
AVG HOUSEHOLD INCOME
7.3%
WAGE / INCOME GAP [ % ]
92.7¢/ $1
WAGE / INCOME GAP [ $ ]
0.41
INEQUALITY / GINI INDEX
1,213
TOTAL POPULATION
590
MALE POPULATION
623
FEMALE POPULATION
94.70
MALES / 100 FEMALES
105.59
FEMALES / 100 MALES
37.9
MEDIAN AGE
3.3
AVG FAMILY SIZE
2.8
AVG HOUSEHOLD SIZE
516
LABOR FORCE [ PEOPLE ]
50.7%
PERCENT IN LABOR FORCE
3.7%
UNEMPLOYMENT RATE
Fairmount Zip Codes
Income in Fairmount
Income Overview in Fairmount
Per Capita Income in Fairmount is $23,858, while median incomes of families and households are $67,083 and $61,042 respectively.
| Characteristic | Number | Measure |
| Per Capita Income | 1,213 | $23,858 |
| Median Family Income | 293 | $67,083 |
| Mean Family Income | 293 | $82,402 |
| Median Household Income | 437 | $61,042 |
| Mean Household Income | 437 | $63,756 |
| Income Deficit | 293 | $0 |
| Wage / Income Gap (%) | 1,213 | 7.32% |
| Wage / Income Gap ($) | 1,213 | 92.68¢ per $1 |
| Gini / Inequality Index | 1,213 | 0.41 |
Earnings by Sex in Fairmount
Average Earnings in Fairmount are $31,285, $31,498 for men and $29,191 for women, a difference of 7.3%.
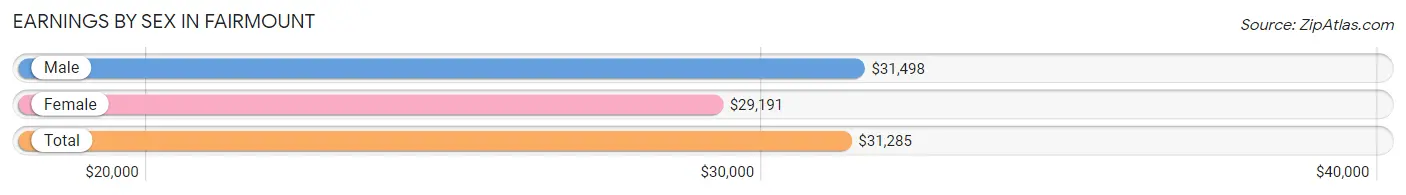
| Sex | Number | Average Earnings |
| Male | 303 (57.8%) | $31,498 |
| Female | 221 (42.2%) | $29,191 |
| Total | 524 (100.0%) | $31,285 |
Earnings by Sex by Income Bracket in Fairmount
The most common earnings brackets in Fairmount are $30,000 to $34,999 for men (104 | 34.3%) and $2,499 or less for women (28 | 12.7%).
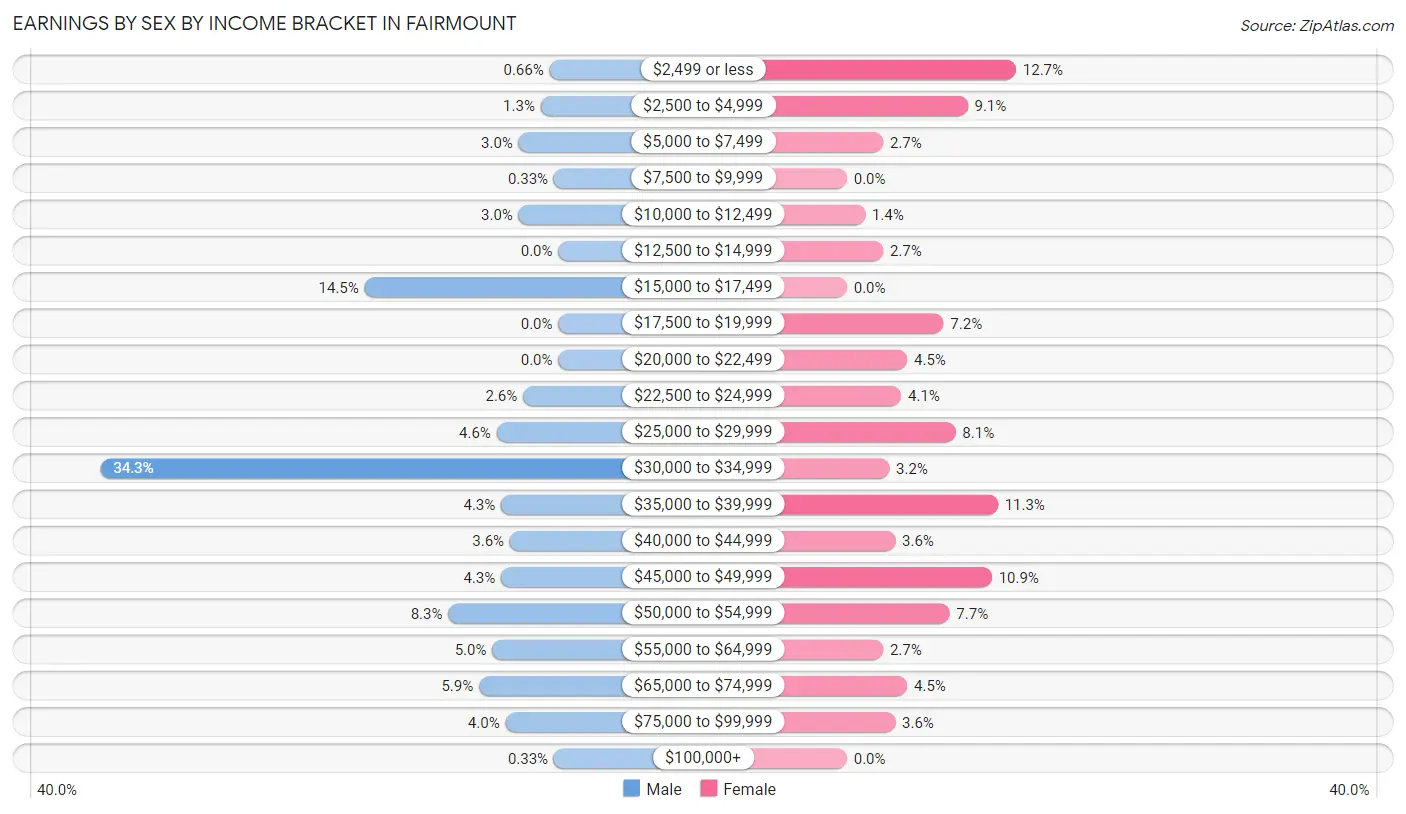
| Income | Male | Female |
| $2,499 or less | 2 (0.7%) | 28 (12.7%) |
| $2,500 to $4,999 | 4 (1.3%) | 20 (9.0%) |
| $5,000 to $7,499 | 9 (3.0%) | 6 (2.7%) |
| $7,500 to $9,999 | 1 (0.3%) | 0 (0.0%) |
| $10,000 to $12,499 | 9 (3.0%) | 3 (1.4%) |
| $12,500 to $14,999 | 0 (0.0%) | 6 (2.7%) |
| $15,000 to $17,499 | 44 (14.5%) | 0 (0.0%) |
| $17,500 to $19,999 | 0 (0.0%) | 16 (7.2%) |
| $20,000 to $22,499 | 0 (0.0%) | 10 (4.5%) |
| $22,500 to $24,999 | 8 (2.6%) | 9 (4.1%) |
| $25,000 to $29,999 | 14 (4.6%) | 18 (8.1%) |
| $30,000 to $34,999 | 104 (34.3%) | 7 (3.2%) |
| $35,000 to $39,999 | 13 (4.3%) | 25 (11.3%) |
| $40,000 to $44,999 | 11 (3.6%) | 8 (3.6%) |
| $45,000 to $49,999 | 13 (4.3%) | 24 (10.9%) |
| $50,000 to $54,999 | 25 (8.3%) | 17 (7.7%) |
| $55,000 to $64,999 | 15 (5.0%) | 6 (2.7%) |
| $65,000 to $74,999 | 18 (5.9%) | 10 (4.5%) |
| $75,000 to $99,999 | 12 (4.0%) | 8 (3.6%) |
| $100,000+ | 1 (0.3%) | 0 (0.0%) |
| Total | 303 (100.0%) | 221 (100.0%) |
Earnings by Sex by Educational Attainment in Fairmount
Average earnings in Fairmount are $31,907 for men and $36,534 for women, a difference of 12.7%. Men with an educational attainment of college or associate's degree enjoy the highest average annual earnings of $72,083, while those with bachelor's degree education earn the least with $16,603. Women with an educational attainment of less than high school earn the most with the average annual earnings of $46,641, while those with college or associate's degree education have the smallest earnings of $28,333.
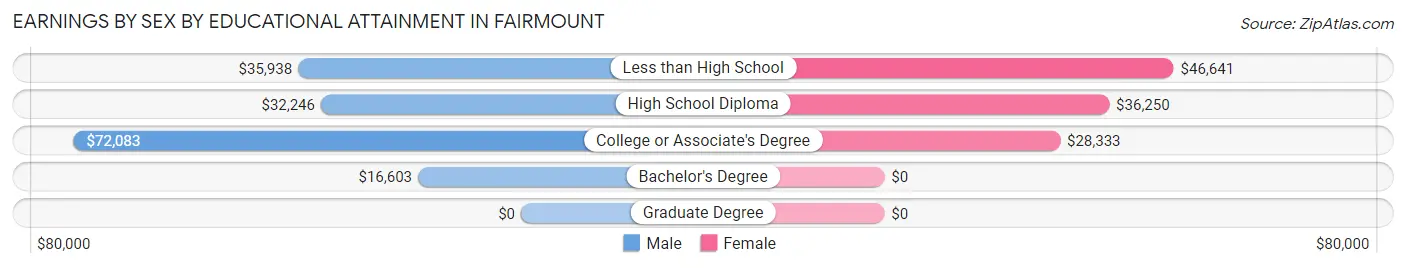
| Educational Attainment | Male Income | Female Income |
| Less than High School | $35,938 | $46,641 |
| High School Diploma | $32,246 | $36,250 |
| College or Associate's Degree | $72,083 | $28,333 |
| Bachelor's Degree | $16,603 | $0 |
| Graduate Degree | - | - |
| Total | $31,907 | $36,534 |
Family Income in Fairmount
Family Income Brackets in Fairmount
According to the Fairmount family income data, there are 116 families falling into the $50,000 to $74,999 income range, which is the most common income bracket and makes up 39.6% of all families.
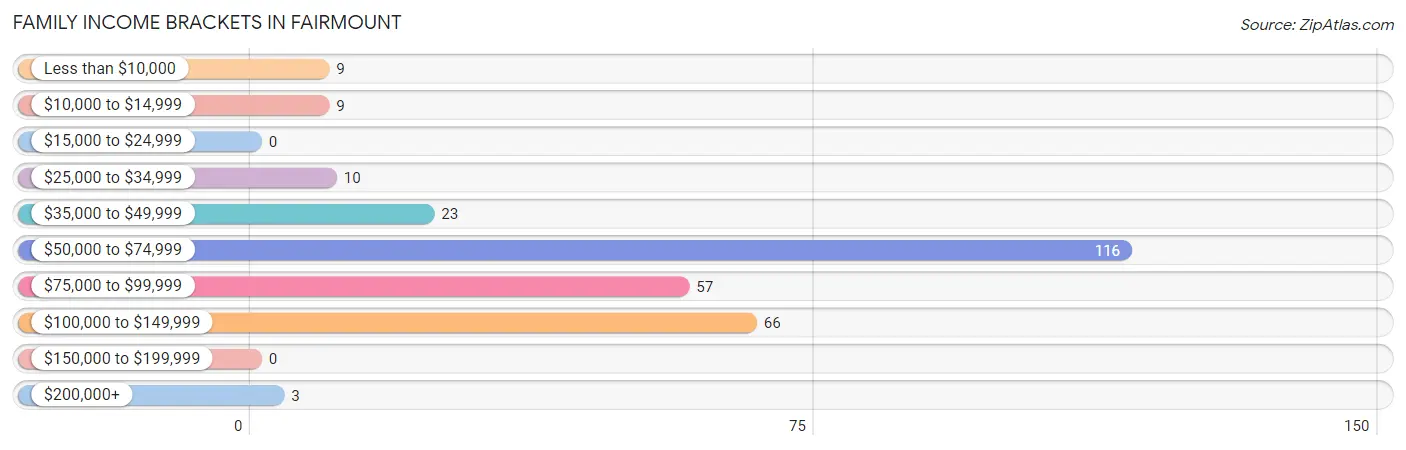
| Income Bracket | # Families | % Families |
| Less than $10,000 | 9 | 3.1% |
| $10,000 to $14,999 | 9 | 3.1% |
| $15,000 to $24,999 | 0 | 0.0% |
| $25,000 to $34,999 | 10 | 3.4% |
| $35,000 to $49,999 | 23 | 7.8% |
| $50,000 to $74,999 | 116 | 39.6% |
| $75,000 to $99,999 | 57 | 19.5% |
| $100,000 to $149,999 | 66 | 22.5% |
| $150,000 to $199,999 | 0 | 0.0% |
| $200,000+ | 3 | 1.0% |
Family Income by Famaliy Size in Fairmount
3-person families (70 | 23.9%) account for the highest median family income in Fairmount with $87,500 per family, while 3-person families (70 | 23.9%) have the highest median income of $29,167 per family member.
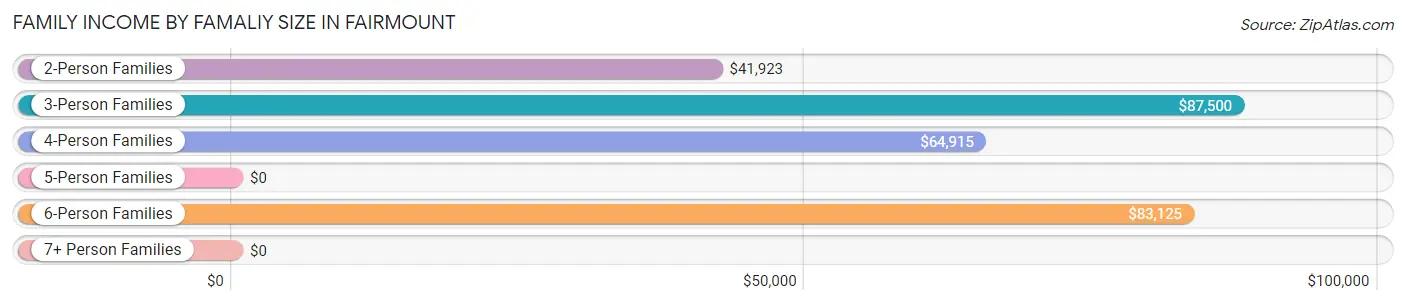
| Income Bracket | # Families | Median Income |
| 2-Person Families | 82 (28.0%) | $41,923 |
| 3-Person Families | 70 (23.9%) | $87,500 |
| 4-Person Families | 114 (38.9%) | $64,915 |
| 5-Person Families | 4 (1.4%) | $0 |
| 6-Person Families | 8 (2.7%) | $83,125 |
| 7+ Person Families | 15 (5.1%) | $0 |
| Total | 293 (100.0%) | $67,083 |
Family Income by Number of Earners in Fairmount
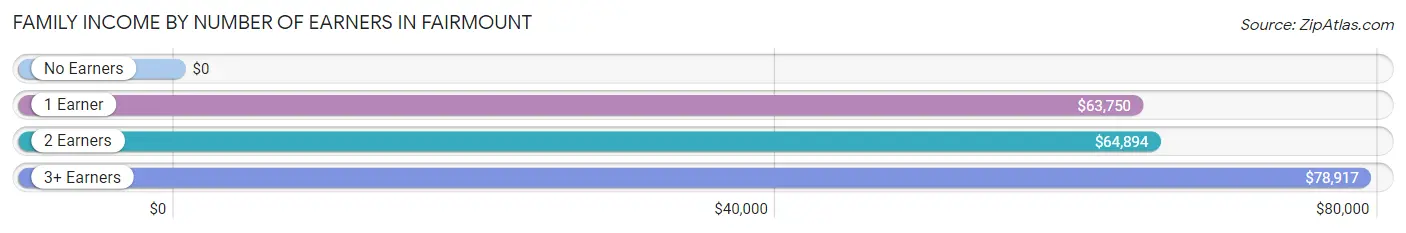
| Number of Earners | # Families | Median Income |
| No Earners | 35 (11.9%) | $0 |
| 1 Earner | 96 (32.8%) | $63,750 |
| 2 Earners | 133 (45.4%) | $64,894 |
| 3+ Earners | 29 (9.9%) | $78,917 |
| Total | 293 (100.0%) | $67,083 |
Household Income in Fairmount
Household Income Brackets in Fairmount
With 138 households falling in the category, the $50,000 to $74,999 income range is the most frequent in Fairmount, accounting for 31.6% of all households.
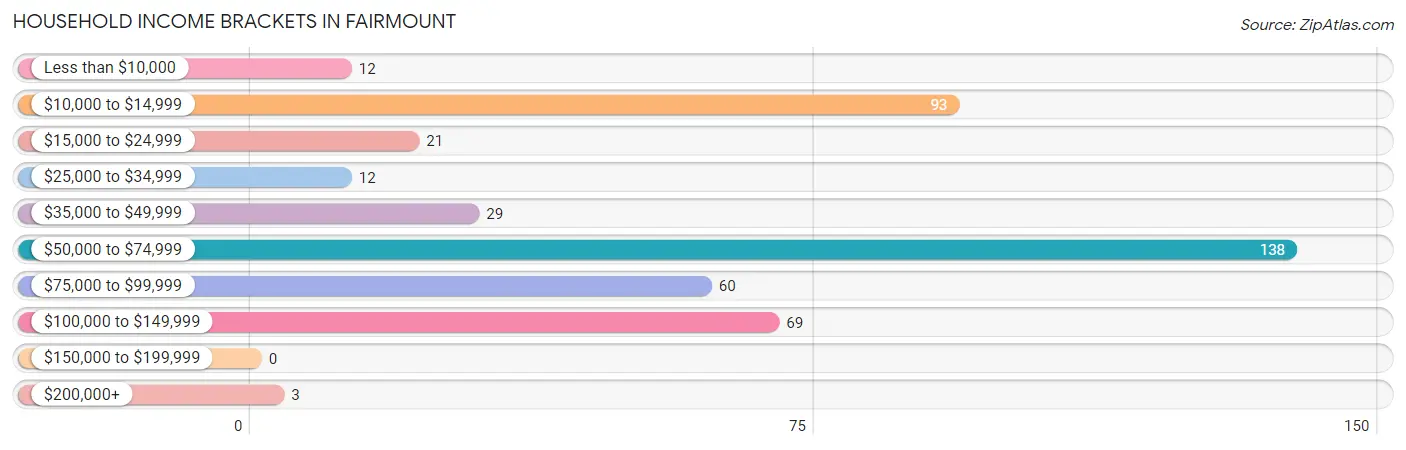
| Income Bracket | # Households | % Households |
| Less than $10,000 | 12 | 2.7% |
| $10,000 to $14,999 | 93 | 21.3% |
| $15,000 to $24,999 | 21 | 4.8% |
| $25,000 to $34,999 | 12 | 2.7% |
| $35,000 to $49,999 | 29 | 6.6% |
| $50,000 to $74,999 | 138 | 31.6% |
| $75,000 to $99,999 | 60 | 13.7% |
| $100,000 to $149,999 | 69 | 15.8% |
| $150,000 to $199,999 | 0 | 0.0% |
| $200,000+ | 3 | 0.7% |
Household Income by Householder Age in Fairmount
The median household income in Fairmount is $61,042, with the highest median household income of $68,958 found in the 45 to 64 years age bracket for the primary householder. A total of 105 households (24.0%) fall into this category. Meanwhile, the 65+ years age bracket for the primary householder has the lowest median household income of $0, with 172 households (39.4%) in this group.
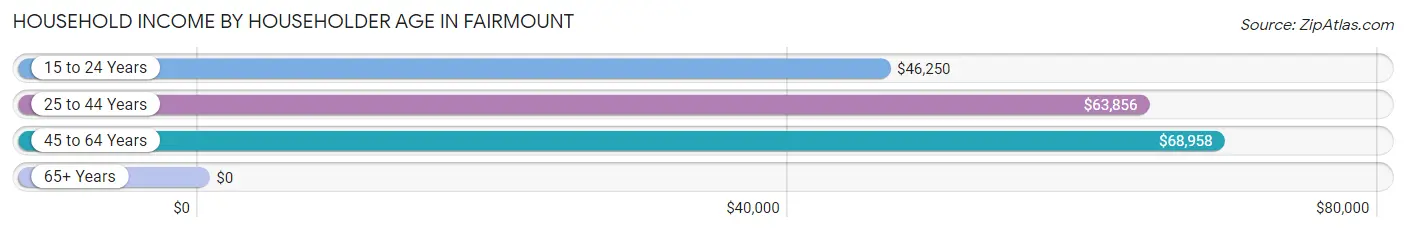
| Income Bracket | # Households | Median Income |
| 15 to 24 Years | 6 (1.4%) | $46,250 |
| 25 to 44 Years | 154 (35.2%) | $63,856 |
| 45 to 64 Years | 105 (24.0%) | $68,958 |
| 65+ Years | 172 (39.4%) | $0 |
| Total | 437 (100.0%) | $61,042 |
Poverty in Fairmount
Income Below Poverty by Sex and Age in Fairmount
With 3.9% poverty level for males and 28.7% for females among the residents of Fairmount, 6 to 11 year old males and 65 to 74 year old females are the most vulnerable to poverty, with 3 males (15.0%) and 70 females (56.0%) in their respective age groups living below the poverty level.
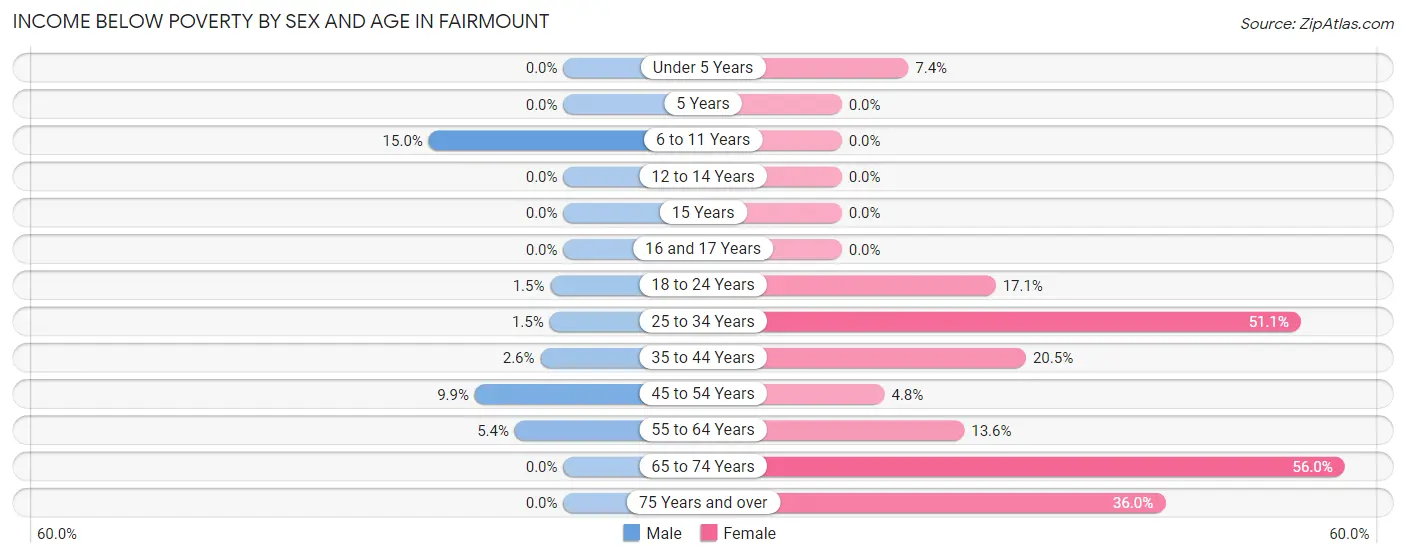
| Age Bracket | Male | Female |
| Under 5 Years | 0 (0.0%) | 2 (7.4%) |
| 5 Years | 0 (0.0%) | 0 (0.0%) |
| 6 to 11 Years | 3 (15.0%) | 0 (0.0%) |
| 12 to 14 Years | 0 (0.0%) | 0 (0.0%) |
| 15 Years | 0 (0.0%) | 0 (0.0%) |
| 16 and 17 Years | 0 (0.0%) | 0 (0.0%) |
| 18 to 24 Years | 1 (1.5%) | 12 (17.1%) |
| 25 to 34 Years | 1 (1.5%) | 69 (51.1%) |
| 35 to 44 Years | 2 (2.6%) | 8 (20.5%) |
| 45 to 54 Years | 14 (9.9%) | 3 (4.8%) |
| 55 to 64 Years | 2 (5.4%) | 6 (13.6%) |
| 65 to 74 Years | 0 (0.0%) | 70 (56.0%) |
| 75 Years and over | 0 (0.0%) | 9 (36.0%) |
| Total | 23 (3.9%) | 179 (28.7%) |
Income Above Poverty by Sex and Age in Fairmount
According to the poverty statistics in Fairmount, males aged under 5 years and females aged 5 years are the age groups that are most secure financially, with 100.0% of males and 100.0% of females in these age groups living above the poverty line.
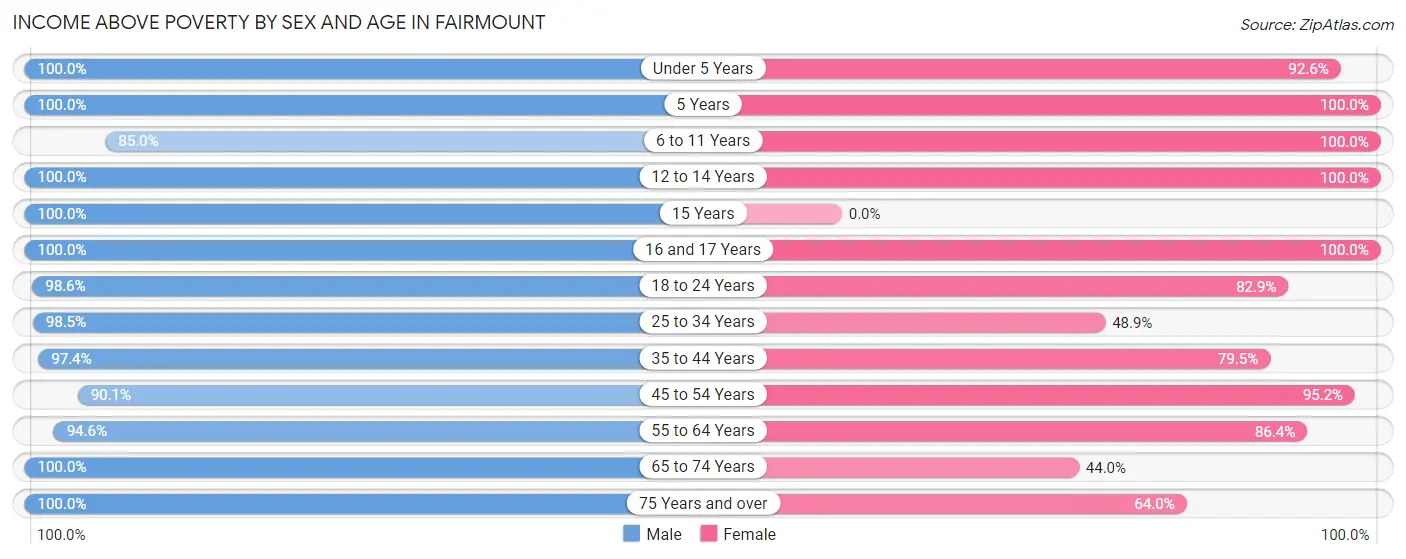
| Age Bracket | Male | Female |
| Under 5 Years | 47 (100.0%) | 25 (92.6%) |
| 5 Years | 33 (100.0%) | 5 (100.0%) |
| 6 to 11 Years | 17 (85.0%) | 30 (100.0%) |
| 12 to 14 Years | 5 (100.0%) | 9 (100.0%) |
| 15 Years | 16 (100.0%) | 0 (0.0%) |
| 16 and 17 Years | 6 (100.0%) | 51 (100.0%) |
| 18 to 24 Years | 68 (98.6%) | 58 (82.9%) |
| 25 to 34 Years | 64 (98.5%) | 66 (48.9%) |
| 35 to 44 Years | 76 (97.4%) | 31 (79.5%) |
| 45 to 54 Years | 128 (90.1%) | 60 (95.2%) |
| 55 to 64 Years | 35 (94.6%) | 38 (86.4%) |
| 65 to 74 Years | 60 (100.0%) | 55 (44.0%) |
| 75 Years and over | 8 (100.0%) | 16 (64.0%) |
| Total | 563 (96.1%) | 444 (71.3%) |
Income Below Poverty Among Married-Couple Families in Fairmount
The poverty statistics for married-couple families in Fairmount show that 1.8% or 3 of the total 170 families live below the poverty line. Families with no children have the highest poverty rate of 2.7%, comprising of 3 families. On the other hand, families with 1 or 2 children have the lowest poverty rate of 0.0%, which includes 0 families.
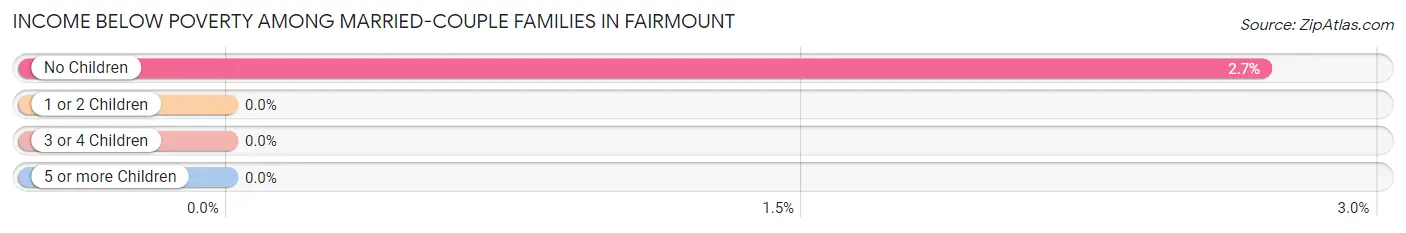
| Children | Above Poverty | Below Poverty |
| No Children | 108 (97.3%) | 3 (2.7%) |
| 1 or 2 Children | 38 (100.0%) | 0 (0.0%) |
| 3 or 4 Children | 21 (100.0%) | 0 (0.0%) |
| 5 or more Children | 0 (0.0%) | 0 (0.0%) |
| Total | 167 (98.2%) | 3 (1.8%) |
Income Below Poverty Among Single-Parent Households in Fairmount
According to the poverty data in Fairmount, 1.6% or 1 single-father households and 23.7% or 14 single-mother households are living below the poverty line. Among single-father households, those with 1 or 2 children have the highest poverty rate, with 1 households (1.6%) experiencing poverty. Likewise, among single-mother households, those with no children have the highest poverty rate, with 6 households (28.6%) falling below the poverty line.
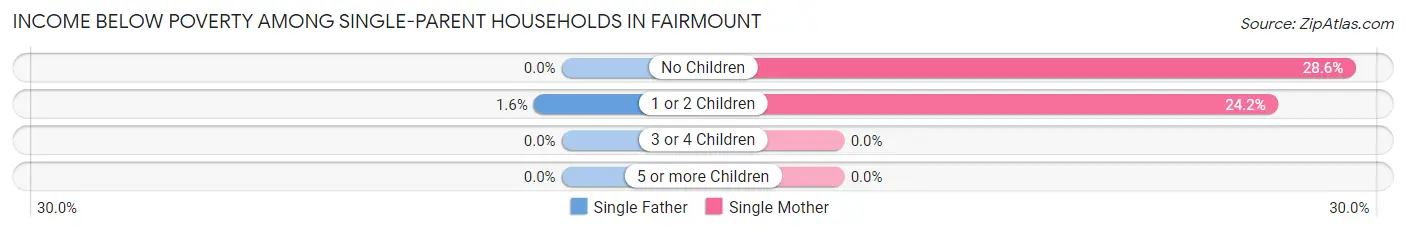
| Children | Single Father | Single Mother |
| No Children | 0 (0.0%) | 6 (28.6%) |
| 1 or 2 Children | 1 (1.6%) | 8 (24.2%) |
| 3 or 4 Children | 0 (0.0%) | 0 (0.0%) |
| 5 or more Children | 0 (0.0%) | 0 (0.0%) |
| Total | 1 (1.6%) | 14 (23.7%) |
Income Below Poverty Among Married-Couple vs Single-Parent Households in Fairmount
The poverty data for Fairmount shows that 3 of the married-couple family households (1.8%) and 15 of the single-parent households (12.2%) are living below the poverty level. Within the married-couple family households, those with no children have the highest poverty rate, with 3 households (2.7%) falling below the poverty line. Among the single-parent households, those with no children have the highest poverty rate, with 6 household (28.6%) living below poverty.
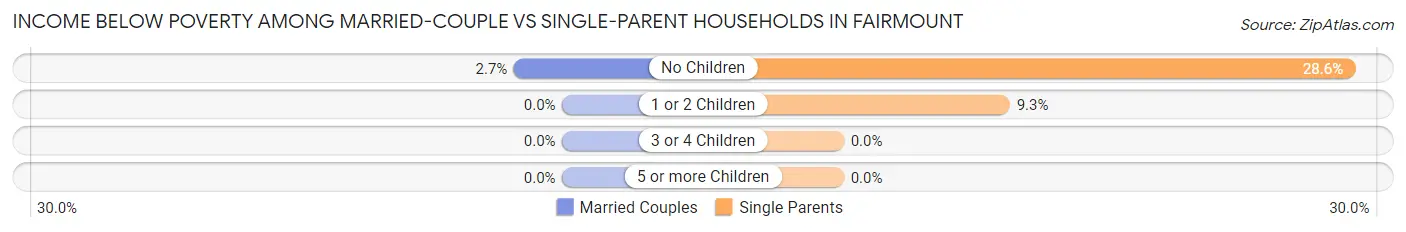
| Children | Married-Couple Families | Single-Parent Households |
| No Children | 3 (2.7%) | 6 (28.6%) |
| 1 or 2 Children | 0 (0.0%) | 9 (9.3%) |
| 3 or 4 Children | 0 (0.0%) | 0 (0.0%) |
| 5 or more Children | 0 (0.0%) | 0 (0.0%) |
| Total | 3 (1.8%) | 15 (12.2%) |
Race in Fairmount
The most populous races in Fairmount are White / Caucasian (811 | 66.9%), Black / African American (326 | 26.9%), and Two or more Races (58 | 4.8%).
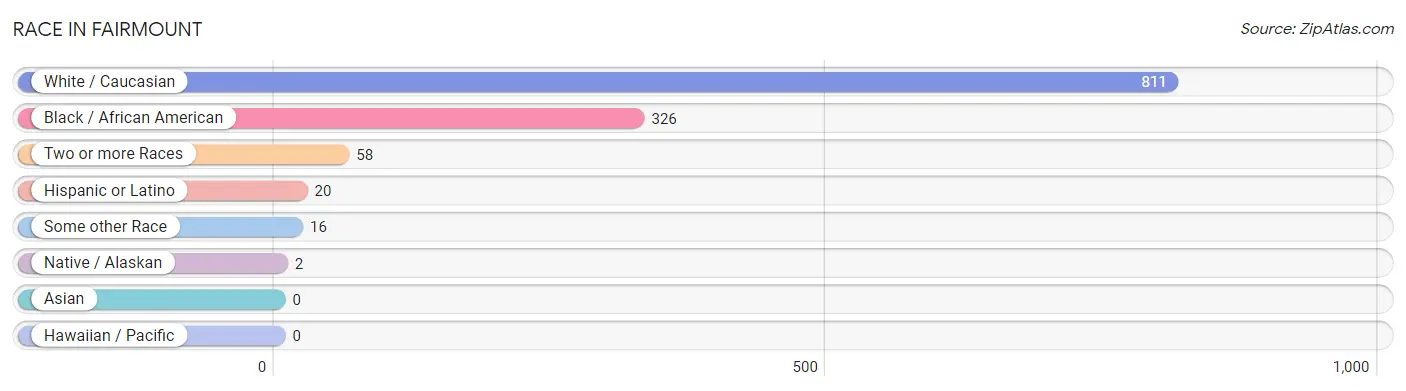
| Race | # Population | % Population |
| Asian | 0 | 0.0% |
| Black / African American | 326 | 26.9% |
| Hawaiian / Pacific | 0 | 0.0% |
| Hispanic or Latino | 20 | 1.7% |
| Native / Alaskan | 2 | 0.2% |
| White / Caucasian | 811 | 66.9% |
| Two or more Races | 58 | 4.8% |
| Some other Race | 16 | 1.3% |
| Total | 1,213 | 100.0% |
Ancestry in Fairmount
The most populous ancestries reported in Fairmount are Irish (80 | 6.6%), English (74 | 6.1%), American (65 | 5.4%), Cherokee (51 | 4.2%), and Scottish (43 | 3.5%), together accounting for 25.8% of all Fairmount residents.
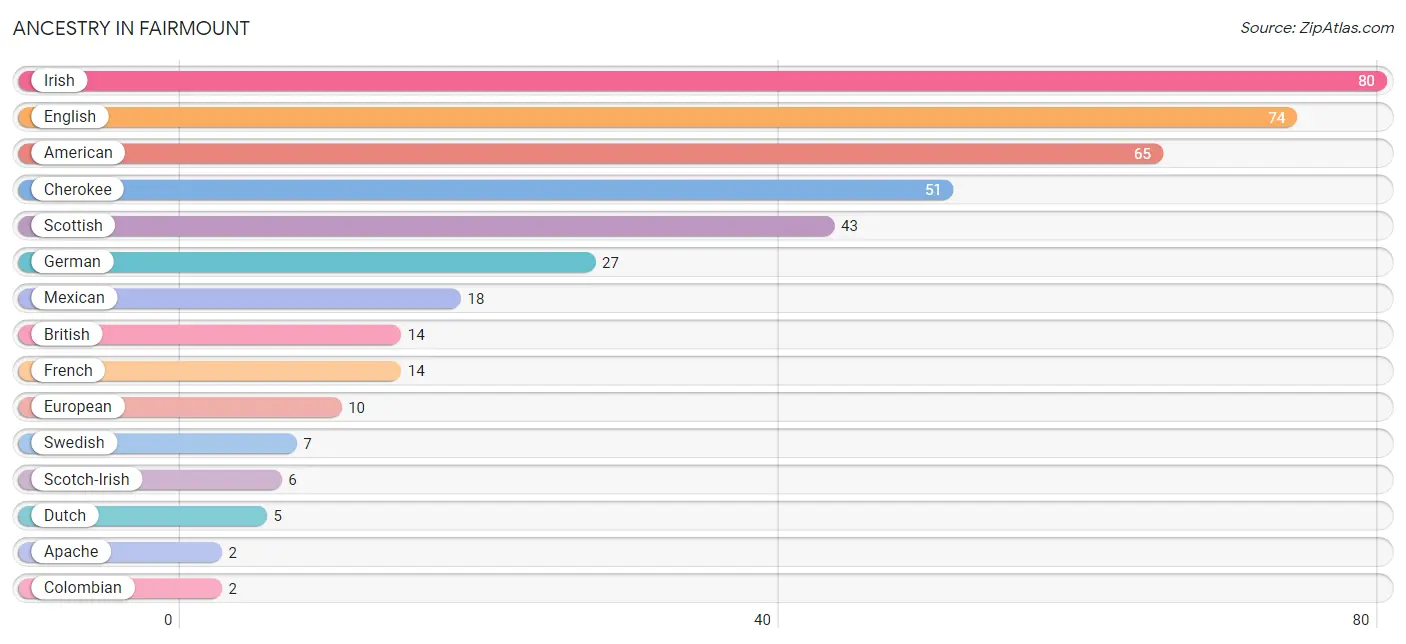
| Ancestry | # Population | % Population |
| American | 65 | 5.4% |
| Apache | 2 | 0.2% |
| British | 14 | 1.1% |
| Cherokee | 51 | 4.2% |
| Colombian | 2 | 0.2% |
| Dutch | 5 | 0.4% |
| English | 74 | 6.1% |
| European | 10 | 0.8% |
| Finnish | 2 | 0.2% |
| French | 14 | 1.1% |
| German | 27 | 2.2% |
| Hopi | 2 | 0.2% |
| Irish | 80 | 6.6% |
| Mexican | 18 | 1.5% |
| Norwegian | 1 | 0.1% |
| Scotch-Irish | 6 | 0.5% |
| Scottish | 43 | 3.5% |
| South American | 2 | 0.2% |
| Swedish | 7 | 0.6% |
| Welsh | 2 | 0.2% | View All 20 Rows |
Immigrants in Fairmount
The most numerous immigrant groups reported in Fairmount came from Central America (7 | 0.6%), Latin America (7 | 0.6%), and Mexico (7 | 0.6%), together accounting for 1.7% of all Fairmount residents.
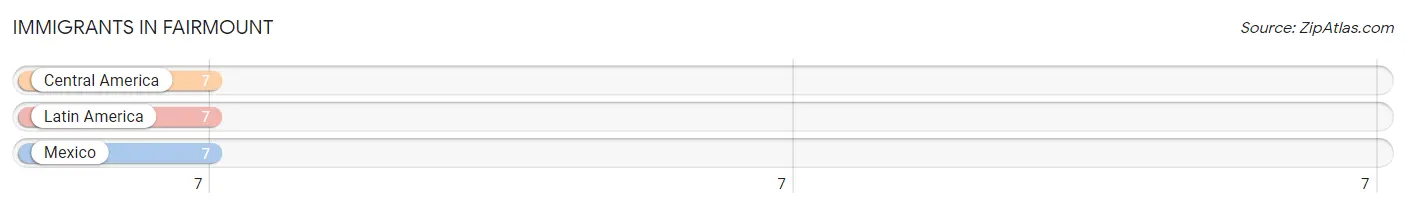
| Immigration Origin | # Population | % Population |
| Central America | 7 | 0.6% |
| Latin America | 7 | 0.6% |
| Mexico | 7 | 0.6% | View All 3 Rows |
Sex and Age in Fairmount
Sex and Age in Fairmount
The most populous age groups in Fairmount are 50 to 54 Years (93 | 15.8%) for men and 25 to 29 Years (117 | 18.8%) for women.
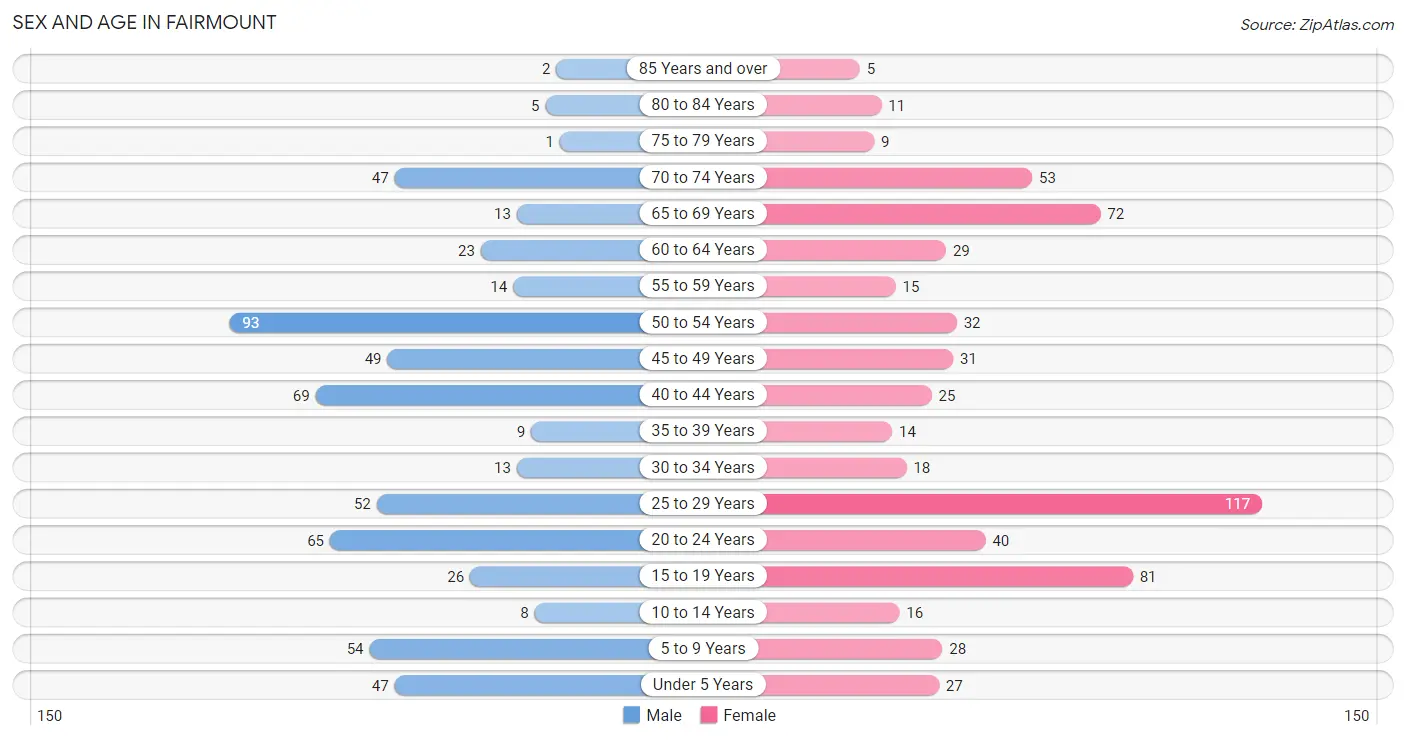
| Age Bracket | Male | Female |
| Under 5 Years | 47 (8.0%) | 27 (4.3%) |
| 5 to 9 Years | 54 (9.1%) | 28 (4.5%) |
| 10 to 14 Years | 8 (1.4%) | 16 (2.6%) |
| 15 to 19 Years | 26 (4.4%) | 81 (13.0%) |
| 20 to 24 Years | 65 (11.0%) | 40 (6.4%) |
| 25 to 29 Years | 52 (8.8%) | 117 (18.8%) |
| 30 to 34 Years | 13 (2.2%) | 18 (2.9%) |
| 35 to 39 Years | 9 (1.5%) | 14 (2.2%) |
| 40 to 44 Years | 69 (11.7%) | 25 (4.0%) |
| 45 to 49 Years | 49 (8.3%) | 31 (5.0%) |
| 50 to 54 Years | 93 (15.8%) | 32 (5.1%) |
| 55 to 59 Years | 14 (2.4%) | 15 (2.4%) |
| 60 to 64 Years | 23 (3.9%) | 29 (4.6%) |
| 65 to 69 Years | 13 (2.2%) | 72 (11.6%) |
| 70 to 74 Years | 47 (8.0%) | 53 (8.5%) |
| 75 to 79 Years | 1 (0.2%) | 9 (1.4%) |
| 80 to 84 Years | 5 (0.9%) | 11 (1.8%) |
| 85 Years and over | 2 (0.3%) | 5 (0.8%) |
| Total | 590 (100.0%) | 623 (100.0%) |
Families and Households in Fairmount
Median Family Size in Fairmount
The median family size in Fairmount is 3.32 persons per family, with married-couple families (170 | 58.0%) accounting for the largest median family size of 3.65 persons per family. On the other hand, single female/mother families (59 | 20.1%) represent the smallest median family size with 2.69 persons per family.
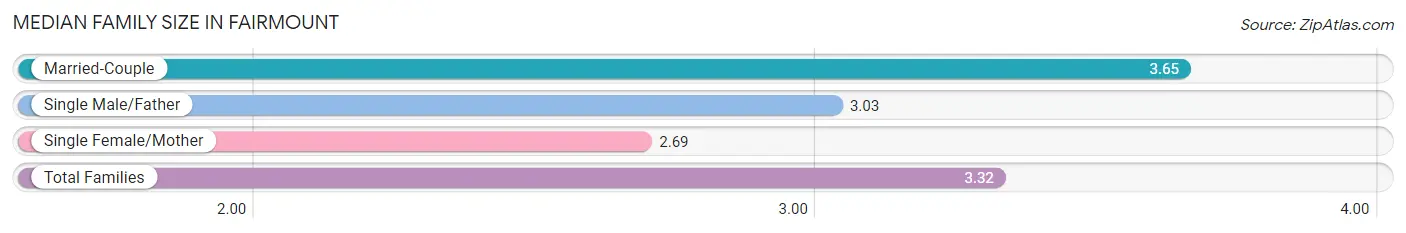
| Family Type | # Families | Family Size |
| Married-Couple | 170 (58.0%) | 3.65 |
| Single Male/Father | 64 (21.8%) | 3.03 |
| Single Female/Mother | 59 (20.1%) | 2.69 |
| Total Families | 293 (100.0%) | 3.32 |
Median Household Size in Fairmount
The median household size in Fairmount is 2.78 persons per household, with single male/father households (64 | 14.6%) accounting for the largest median household size of 4.14 persons per household. non-family households (144 | 33.0%) represent the smallest median household size with 1.04 persons per household.
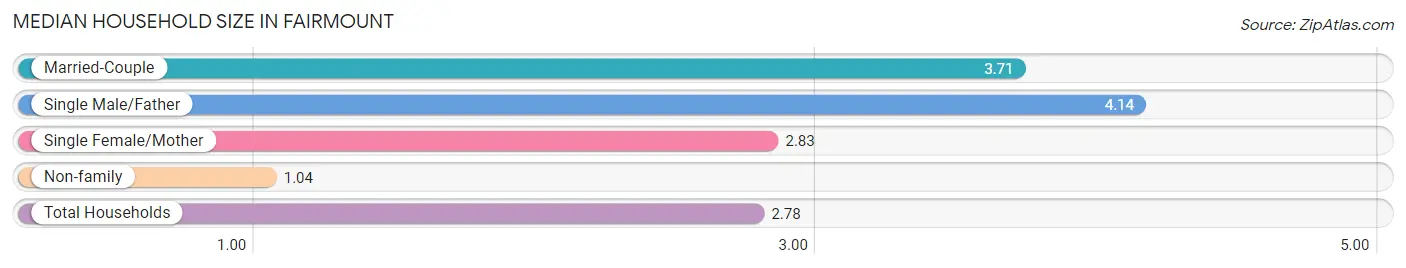
| Household Type | # Households | Household Size |
| Married-Couple | 170 (38.9%) | 3.71 |
| Single Male/Father | 64 (14.6%) | 4.14 |
| Single Female/Mother | 59 (13.5%) | 2.83 |
| Non-family | 144 (33.0%) | 1.04 |
| Total Households | 437 (100.0%) | 2.78 |
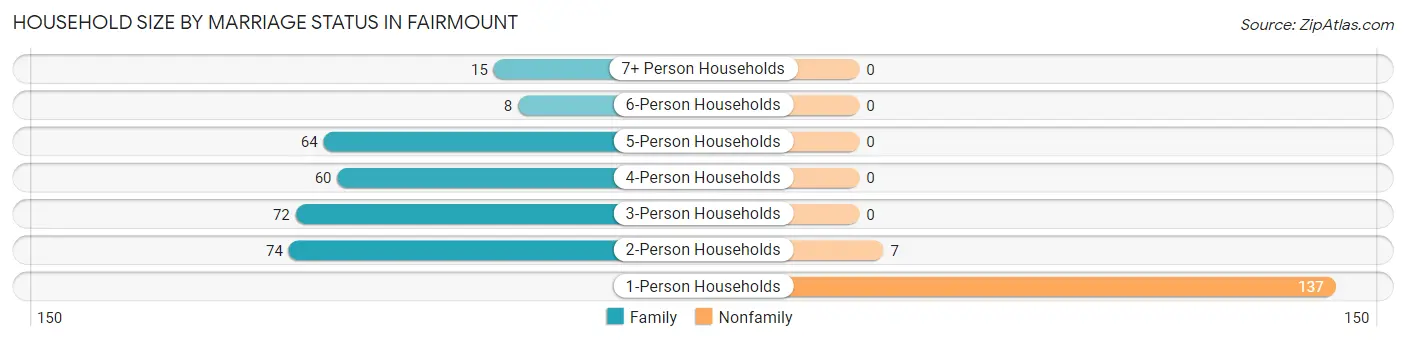
Household Size by Marriage Status in Fairmount
Out of a total of 437 households in Fairmount, 293 (67.0%) are family households, while 144 (33.0%) are nonfamily households. The most numerous type of family households are 2-person households, comprising 74, and the most common type of nonfamily households are 1-person households, comprising 137.
| Household Size | Family Households | Nonfamily Households |
| 1-Person Households | - | 137 (31.4%) |
| 2-Person Households | 74 (16.9%) | 7 (1.6%) |
| 3-Person Households | 72 (16.5%) | 0 (0.0%) |
| 4-Person Households | 60 (13.7%) | 0 (0.0%) |
| 5-Person Households | 64 (14.6%) | 0 (0.0%) |
| 6-Person Households | 8 (1.8%) | 0 (0.0%) |
| 7+ Person Households | 15 (3.4%) | 0 (0.0%) |
| Total | 293 (67.0%) | 144 (33.0%) |
Female Fertility in Fairmount
Fertility by Age in Fairmount
Average fertility rate in Fairmount is 15.0 births per 1,000 women. Women in the age bracket of 20 to 34 years have the highest fertility rate with 29.0 births per 1,000 women. Women in the age bracket of 20 to 34 years acount for 100.0% of all women with births.
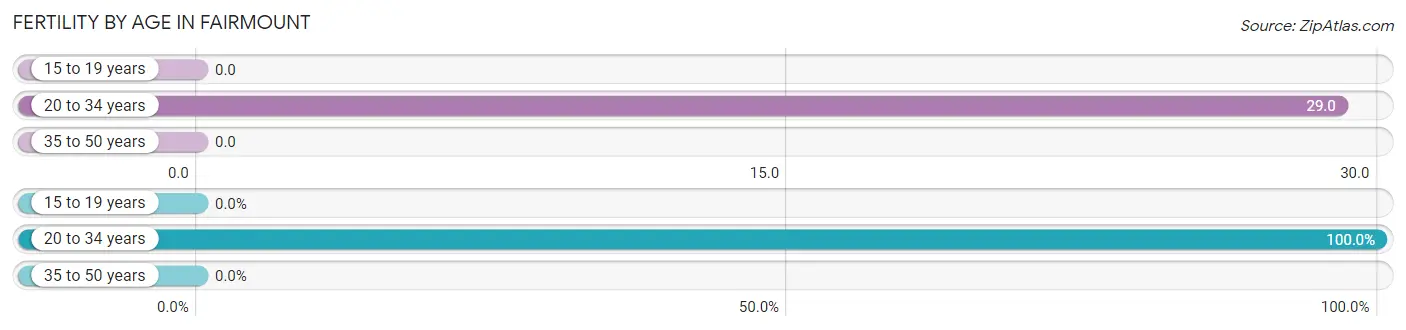
| Age Bracket | Women with Births | Births / 1,000 Women |
| 15 to 19 years | 0 (0.0%) | 0.0 |
| 20 to 34 years | 5 (100.0%) | 29.0 |
| 35 to 50 years | 0 (0.0%) | 0.0 |
| Total | 5 (100.0%) | 15.0 |
Fertility by Age by Marriage Status in Fairmount
40.0% of women with births (5) in Fairmount are married. The highest percentage of unmarried women with births falls into 20 to 34 years age bracket with 60.0% of them unmarried at the time of birth, while the lowest percentage of unmarried women with births belong to 20 to 34 years age bracket with 60.0% of them unmarried.
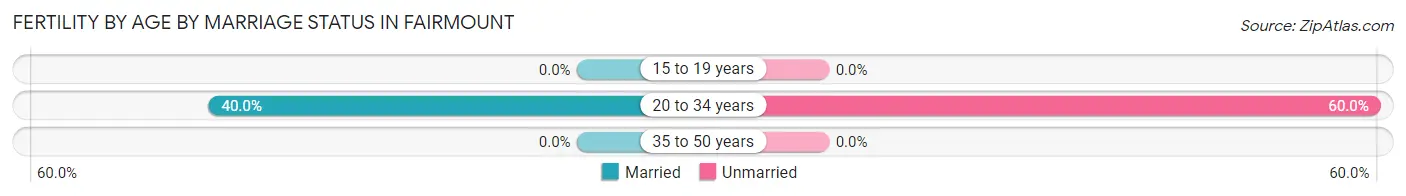
| Age Bracket | Married | Unmarried |
| 15 to 19 years | 0 (0.0%) | 0 (0.0%) |
| 20 to 34 years | 2 (40.0%) | 3 (60.0%) |
| 35 to 50 years | 0 (0.0%) | 0 (0.0%) |
| Total | 2 (40.0%) | 3 (60.0%) |
Fertility by Education in Fairmount
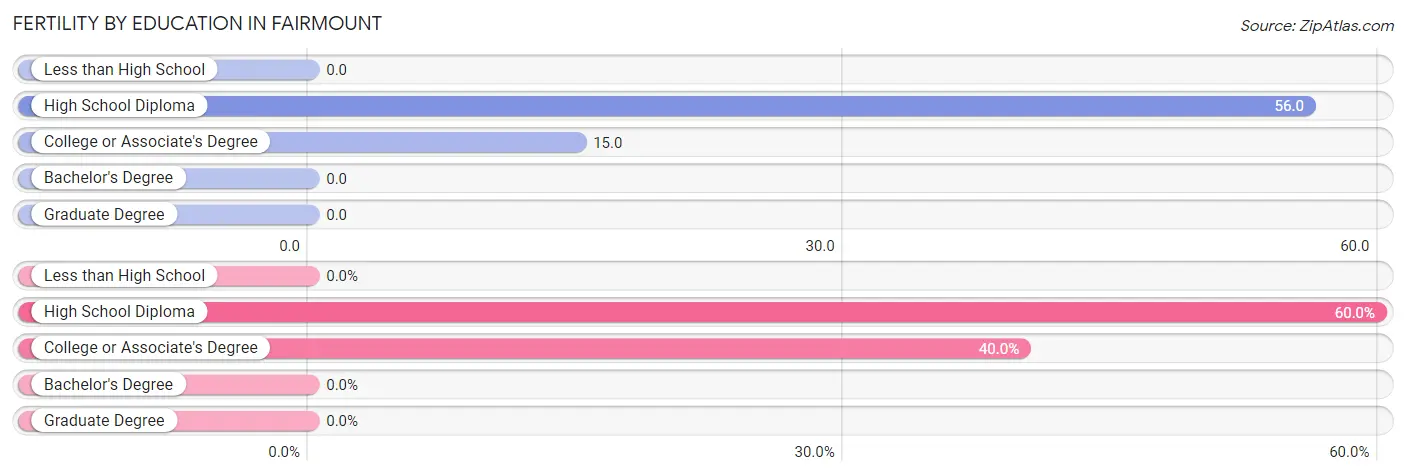
| Educational Attainment | Women with Births | Births / 1,000 Women |
| Less than High School | 0 (0.0%) | 0.0 |
| High School Diploma | 3 (60.0%) | 56.0 |
| College or Associate's Degree | 2 (40.0%) | 15.0 |
| Bachelor's Degree | 0 (0.0%) | 0.0 |
| Graduate Degree | 0 (0.0%) | 0.0 |
| Total | 5 (100.0%) | 15.0 |
Fertility by Education by Marriage Status in Fairmount
60.0% of women with births in Fairmount are unmarried. Women with the educational attainment of college or associate's degree are most likely to be married with 100.0% of them married at childbirth, while women with the educational attainment of high school diploma are least likely to be married with 100.0% of them unmarried at childbirth.
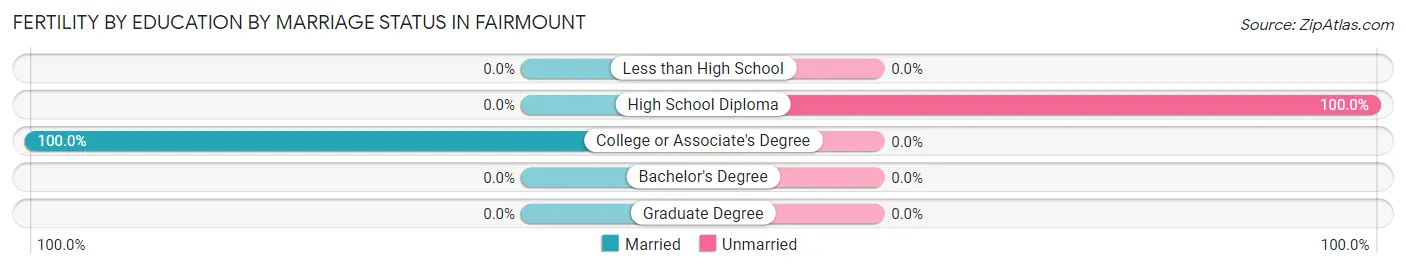
| Educational Attainment | Married | Unmarried |
| Less than High School | 0 (0.0%) | 0 (0.0%) |
| High School Diploma | 0 (0.0%) | 3 (100.0%) |
| College or Associate's Degree | 2 (100.0%) | 0 (0.0%) |
| Bachelor's Degree | 0 (0.0%) | 0 (0.0%) |
| Graduate Degree | 0 (0.0%) | 0 (0.0%) |
| Total | 2 (40.0%) | 3 (60.0%) |
Employment Characteristics in Fairmount
Employment by Class of Employer in Fairmount
Among the 477 employed individuals in Fairmount, private company employees (355 | 74.4%), state government employees (57 | 11.9%), and local government employees (33 | 6.9%) make up the most common classes of employment.
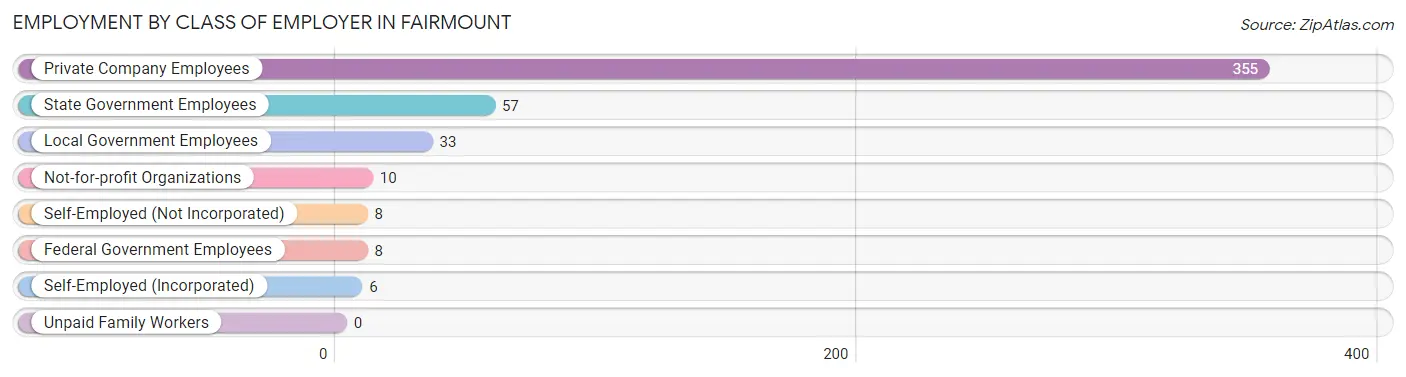
| Employer Class | # Employees | % Employees |
| Private Company Employees | 355 | 74.4% |
| Self-Employed (Incorporated) | 6 | 1.3% |
| Self-Employed (Not Incorporated) | 8 | 1.7% |
| Not-for-profit Organizations | 10 | 2.1% |
| Local Government Employees | 33 | 6.9% |
| State Government Employees | 57 | 11.9% |
| Federal Government Employees | 8 | 1.7% |
| Unpaid Family Workers | 0 | 0.0% |
| Total | 477 | 100.0% |
Employment Status by Age in Fairmount
According to the labor force statistics for Fairmount, out of the total population over 16 years of age (1,017), 50.7% or 516 individuals are in the labor force, with 3.7% or 19 of them unemployed. The age group with the highest labor force participation rate is 30 to 34 years, with 93.5% or 29 individuals in the labor force. Within the labor force, the 25 to 29 years age range has the highest percentage of unemployed individuals, with 8.8% or 9 of them being unemployed.
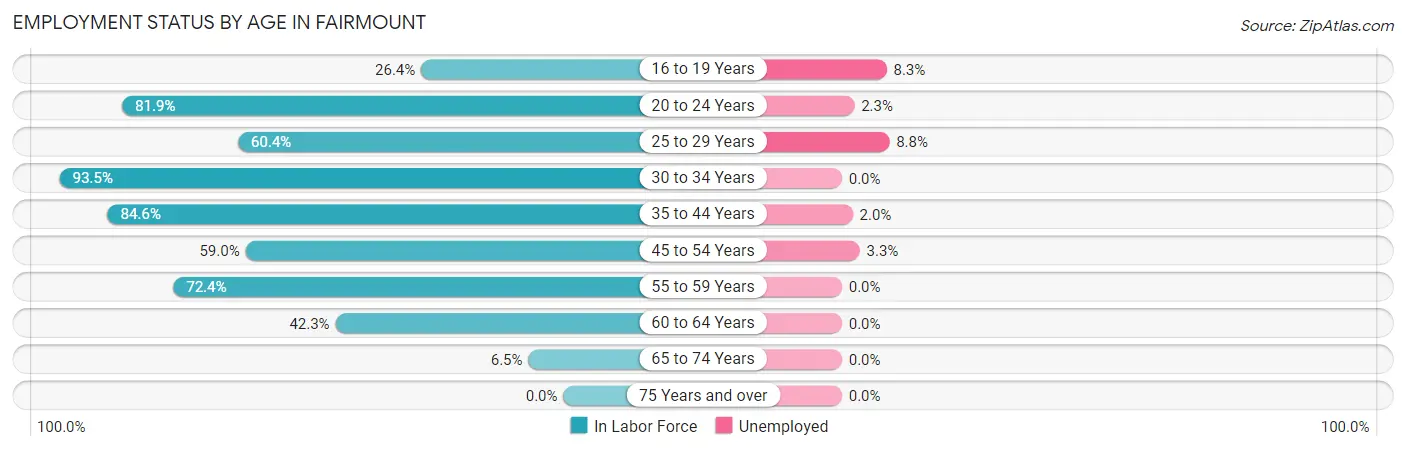
| Age Bracket | In Labor Force | Unemployed |
| 16 to 19 Years | 24 (26.4%) | 2 (8.3%) |
| 20 to 24 Years | 86 (81.9%) | 2 (2.3%) |
| 25 to 29 Years | 102 (60.4%) | 9 (8.8%) |
| 30 to 34 Years | 29 (93.5%) | 0 (0.0%) |
| 35 to 44 Years | 99 (84.6%) | 2 (2.0%) |
| 45 to 54 Years | 121 (59.0%) | 4 (3.3%) |
| 55 to 59 Years | 21 (72.4%) | 0 (0.0%) |
| 60 to 64 Years | 22 (42.3%) | 0 (0.0%) |
| 65 to 74 Years | 12 (6.5%) | 0 (0.0%) |
| 75 Years and over | 0 (0.0%) | 0 (0.0%) |
| Total | 516 (50.7%) | 19 (3.7%) |
Employment Status by Educational Attainment in Fairmount
According to labor force statistics for Fairmount, 65.3% of individuals (394) out of the total population between 25 and 64 years of age (603) are in the labor force, with 3.8% or 15 of them being unemployed. The group with the highest labor force participation rate are those with the educational attainment of bachelor's degree or higher, with 91.4% or 74 individuals in the labor force. Within the labor force, individuals with college / associate degree education have the highest percentage of unemployment, with 6.9% or 6 of them being unemployed.
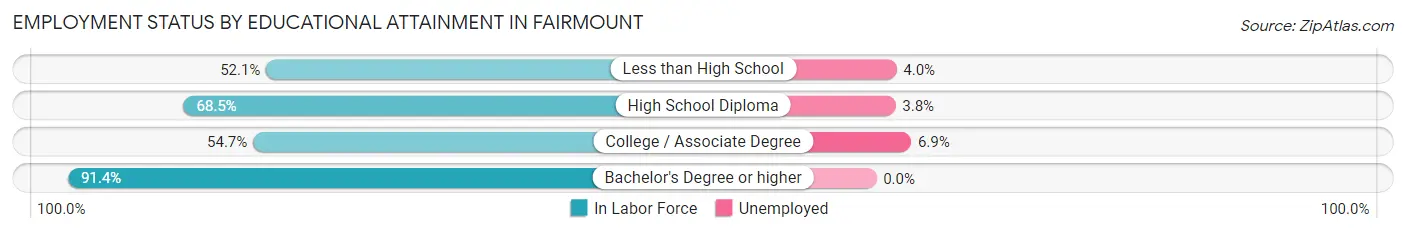
| Educational Attainment | In Labor Force | Unemployed |
| Less than High School | 50 (52.1%) | 4 (4.0%) |
| High School Diploma | 183 (68.5%) | 10 (3.8%) |
| College / Associate Degree | 87 (54.7%) | 11 (6.9%) |
| Bachelor's Degree or higher | 74 (91.4%) | 0 (0.0%) |
| Total | 394 (65.3%) | 23 (3.8%) |
Employment Occupations by Sex in Fairmount
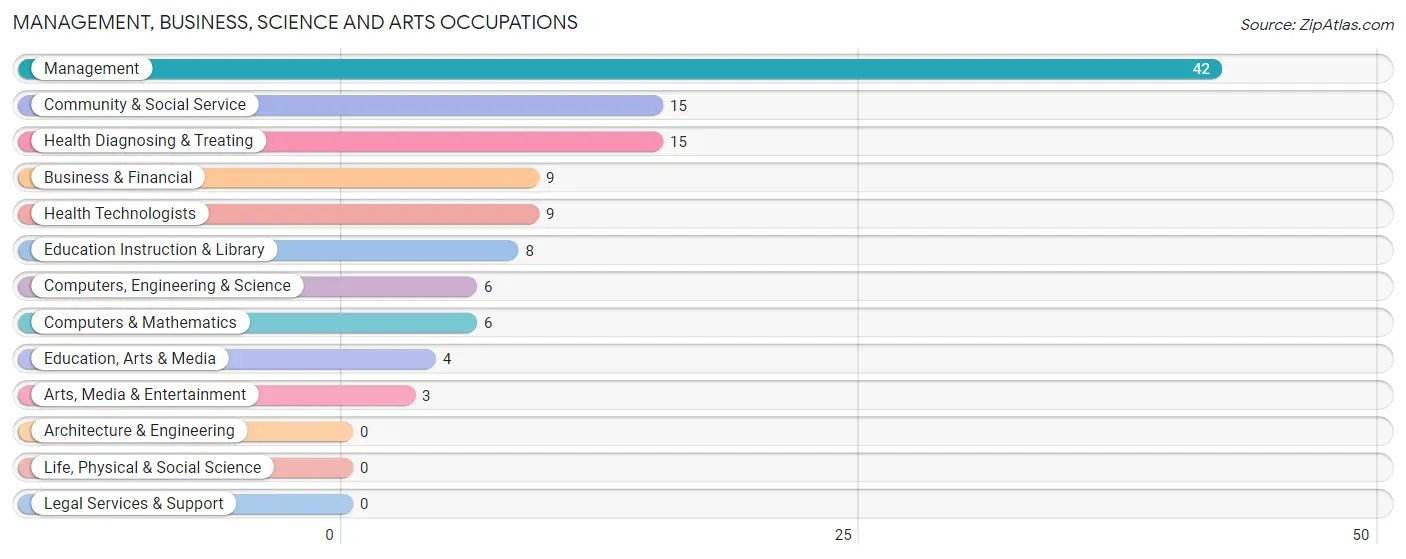
Management, Business, Science and Arts Occupations
The most common Management, Business, Science and Arts occupations in Fairmount are Management (42 | 8.5%), Community & Social Service (15 | 3.0%), Health Diagnosing & Treating (15 | 3.0%), Business & Financial (9 | 1.8%), and Health Technologists (9 | 1.8%).
Management, Business, Science and Arts Occupations by Sex
Within the Management, Business, Science and Arts occupations in Fairmount, the most male-oriented occupations are Computers, Engineering & Science (100.0%), Computers & Mathematics (100.0%), and Arts, Media & Entertainment (100.0%), while the most female-oriented occupations are Education Instruction & Library (100.0%), Health Diagnosing & Treating (100.0%), and Health Technologists (100.0%).
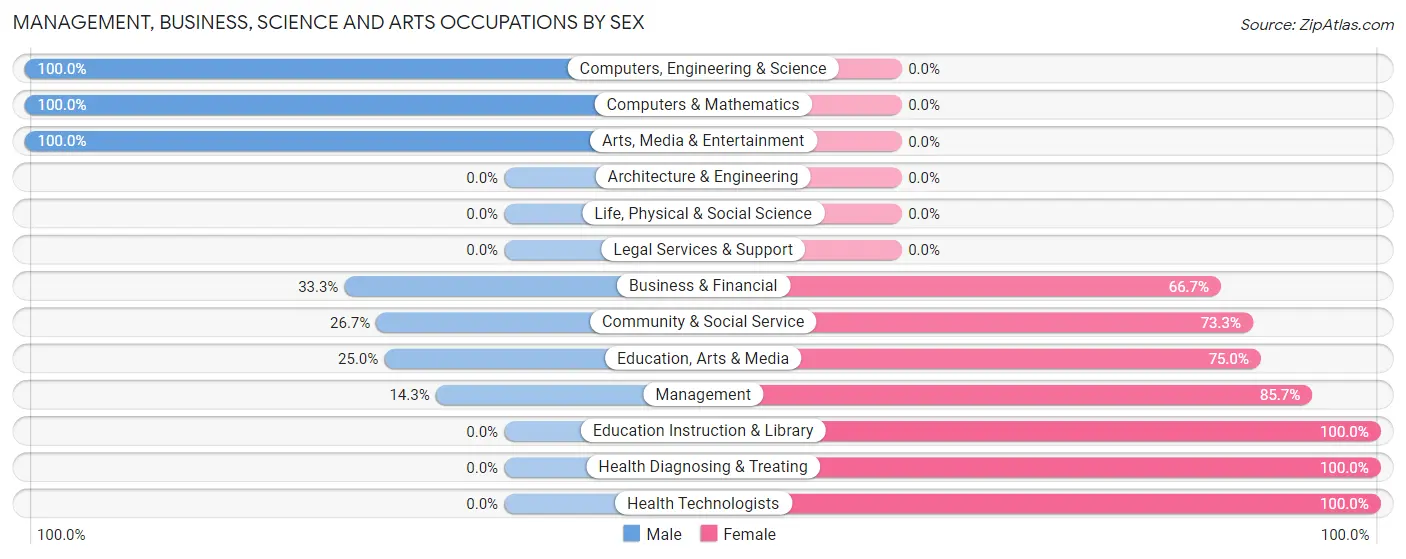
| Occupation | Male | Female |
| Management | 6 (14.3%) | 36 (85.7%) |
| Business & Financial | 3 (33.3%) | 6 (66.7%) |
| Computers, Engineering & Science | 6 (100.0%) | 0 (0.0%) |
| Computers & Mathematics | 6 (100.0%) | 0 (0.0%) |
| Architecture & Engineering | 0 (0.0%) | 0 (0.0%) |
| Life, Physical & Social Science | 0 (0.0%) | 0 (0.0%) |
| Community & Social Service | 4 (26.7%) | 11 (73.3%) |
| Education, Arts & Media | 1 (25.0%) | 3 (75.0%) |
| Legal Services & Support | 0 (0.0%) | 0 (0.0%) |
| Education Instruction & Library | 0 (0.0%) | 8 (100.0%) |
| Arts, Media & Entertainment | 3 (100.0%) | 0 (0.0%) |
| Health Diagnosing & Treating | 0 (0.0%) | 15 (100.0%) |
| Health Technologists | 0 (0.0%) | 9 (100.0%) |
| Total (Category) | 19 (21.8%) | 68 (78.2%) |
| Total (Overall) | 289 (58.2%) | 208 (41.8%) |
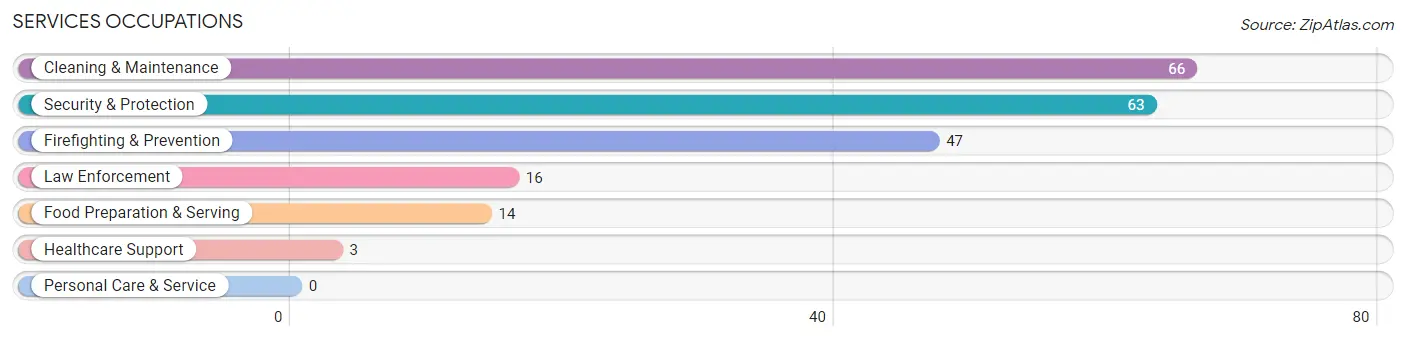
Services Occupations
The most common Services occupations in Fairmount are Cleaning & Maintenance (66 | 13.3%), Security & Protection (63 | 12.7%), Firefighting & Prevention (47 | 9.5%), Law Enforcement (16 | 3.2%), and Food Preparation & Serving (14 | 2.8%).
Services Occupations by Sex
Within the Services occupations in Fairmount, the most male-oriented occupations are Security & Protection (100.0%), Firefighting & Prevention (100.0%), and Law Enforcement (100.0%), while the most female-oriented occupations are Healthcare Support (100.0%), Food Preparation & Serving (64.3%), and Cleaning & Maintenance (3.0%).
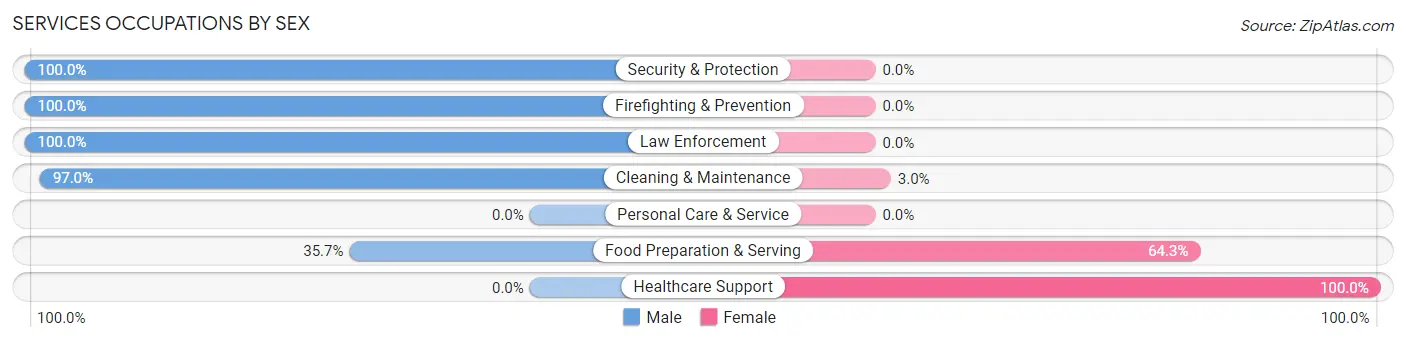
| Occupation | Male | Female |
| Healthcare Support | 0 (0.0%) | 3 (100.0%) |
| Security & Protection | 63 (100.0%) | 0 (0.0%) |
| Firefighting & Prevention | 47 (100.0%) | 0 (0.0%) |
| Law Enforcement | 16 (100.0%) | 0 (0.0%) |
| Food Preparation & Serving | 5 (35.7%) | 9 (64.3%) |
| Cleaning & Maintenance | 64 (97.0%) | 2 (3.0%) |
| Personal Care & Service | 0 (0.0%) | 0 (0.0%) |
| Total (Category) | 132 (90.4%) | 14 (9.6%) |
| Total (Overall) | 289 (58.2%) | 208 (41.8%) |
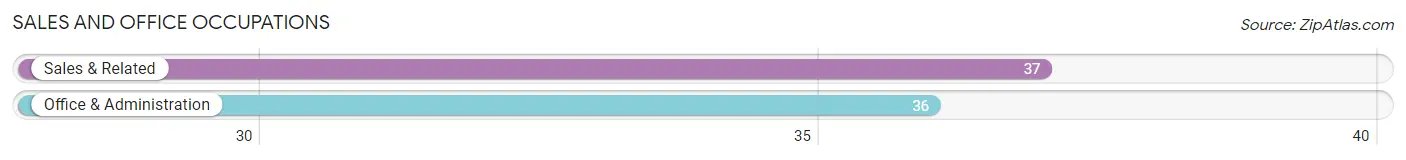
Sales and Office Occupations
The most common Sales and Office occupations in Fairmount are Sales & Related (37 | 7.4%), and Office & Administration (36 | 7.2%).
Sales and Office Occupations by Sex
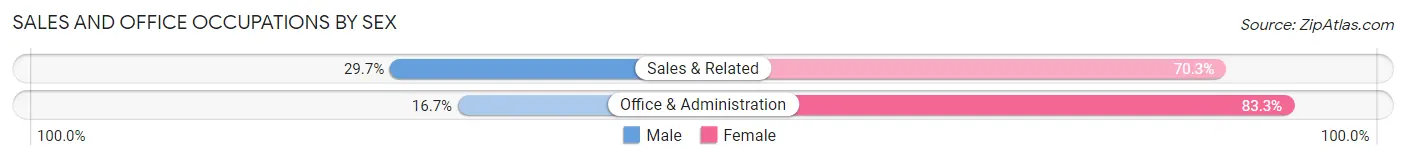
| Occupation | Male | Female |
| Sales & Related | 11 (29.7%) | 26 (70.3%) |
| Office & Administration | 6 (16.7%) | 30 (83.3%) |
| Total (Category) | 17 (23.3%) | 56 (76.7%) |
| Total (Overall) | 289 (58.2%) | 208 (41.8%) |
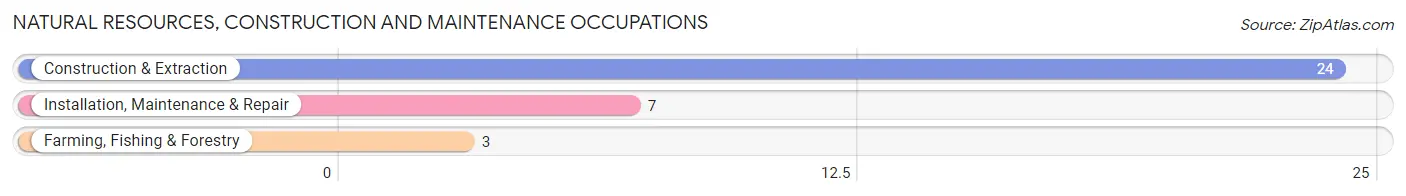
Natural Resources, Construction and Maintenance Occupations
The most common Natural Resources, Construction and Maintenance occupations in Fairmount are Construction & Extraction (24 | 4.8%), Installation, Maintenance & Repair (7 | 1.4%), and Farming, Fishing & Forestry (3 | 0.6%).
Natural Resources, Construction and Maintenance Occupations by Sex
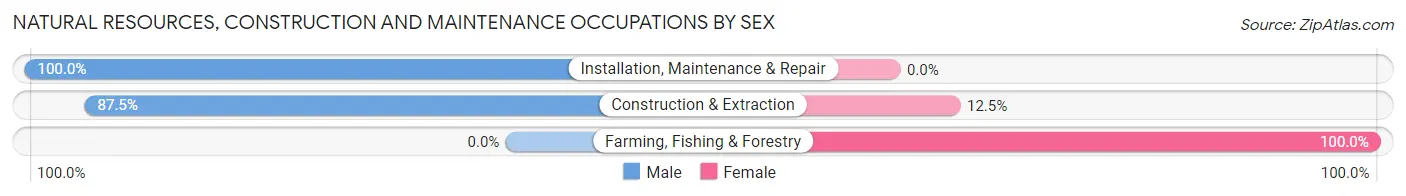
| Occupation | Male | Female |
| Farming, Fishing & Forestry | 0 (0.0%) | 3 (100.0%) |
| Construction & Extraction | 21 (87.5%) | 3 (12.5%) |
| Installation, Maintenance & Repair | 7 (100.0%) | 0 (0.0%) |
| Total (Category) | 28 (82.4%) | 6 (17.6%) |
| Total (Overall) | 289 (58.2%) | 208 (41.8%) |
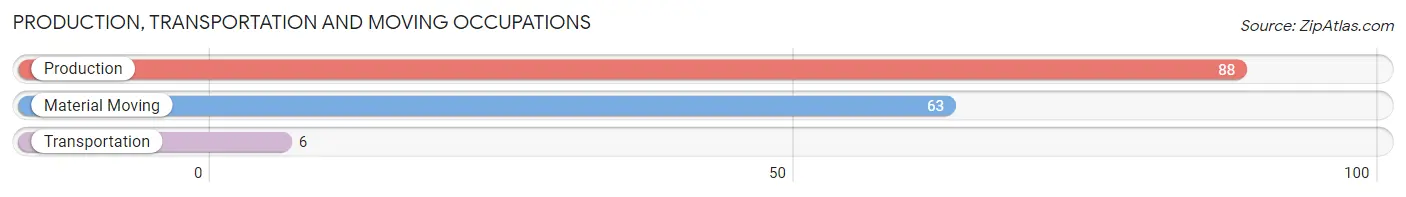
Production, Transportation and Moving Occupations
The most common Production, Transportation and Moving occupations in Fairmount are Production (88 | 17.7%), Material Moving (63 | 12.7%), and Transportation (6 | 1.2%).
Production, Transportation and Moving Occupations by Sex
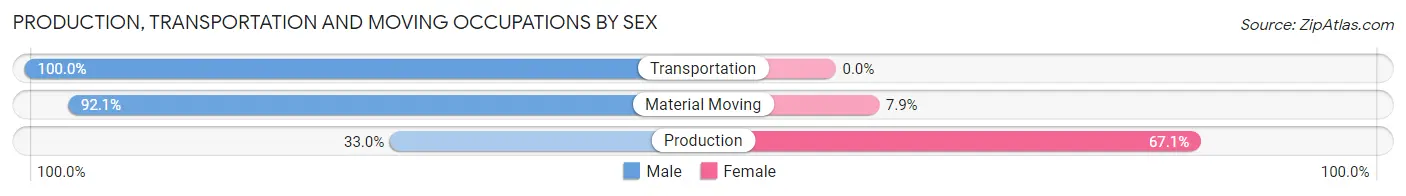
| Occupation | Male | Female |
| Production | 29 (33.0%) | 59 (67.0%) |
| Transportation | 6 (100.0%) | 0 (0.0%) |
| Material Moving | 58 (92.1%) | 5 (7.9%) |
| Total (Category) | 93 (59.2%) | 64 (40.8%) |
| Total (Overall) | 289 (58.2%) | 208 (41.8%) |
Employment Industries by Sex in Fairmount
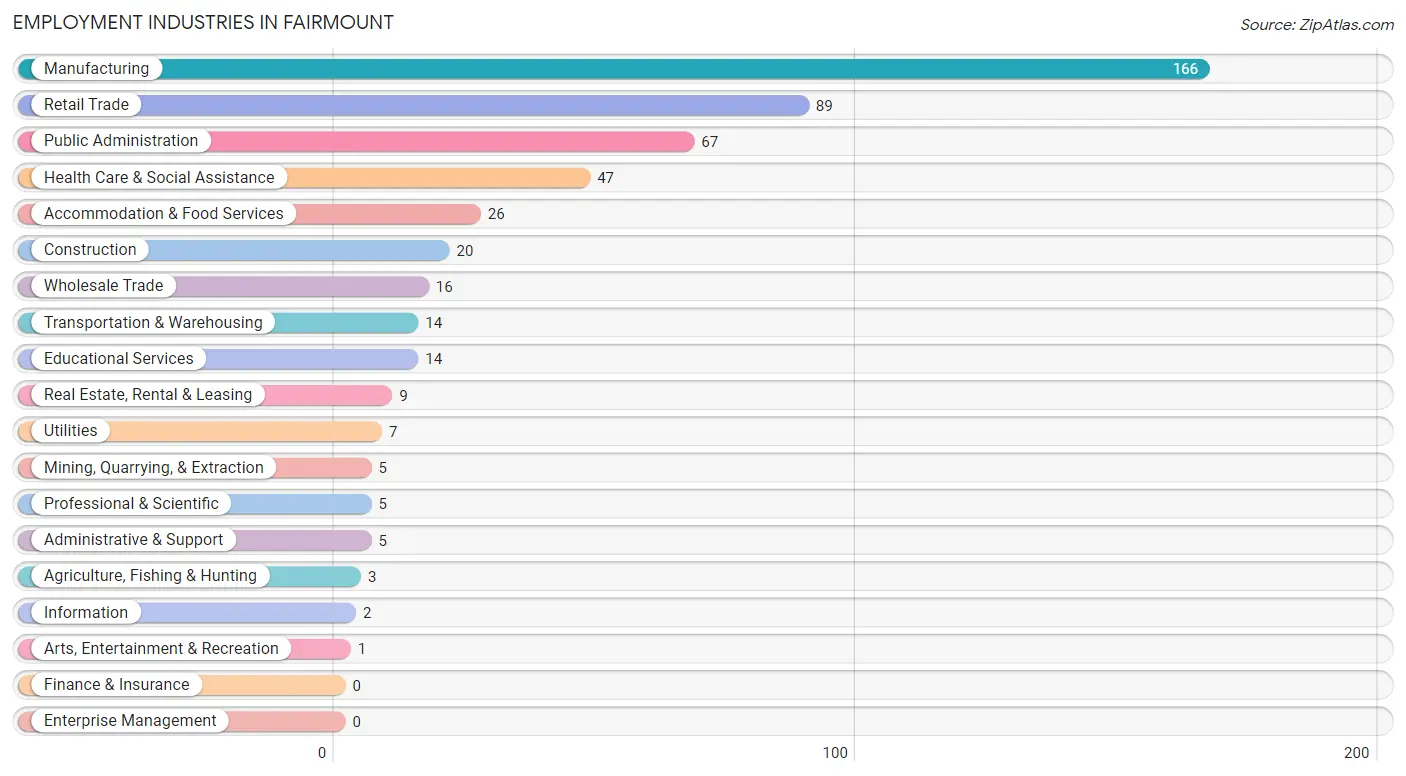
Employment Industries in Fairmount
The major employment industries in Fairmount include Manufacturing (166 | 33.4%), Retail Trade (89 | 17.9%), Public Administration (67 | 13.5%), Health Care & Social Assistance (47 | 9.5%), and Accommodation & Food Services (26 | 5.2%).
Employment Industries by Sex in Fairmount
The Fairmount industries that see more men than women are Agriculture, Fishing & Hunting (100.0%), Mining, Quarrying, & Extraction (100.0%), and Utilities (100.0%), whereas the industries that tend to have a higher number of women are Educational Services (100.0%), Accommodation & Food Services (80.8%), and Health Care & Social Assistance (76.6%).
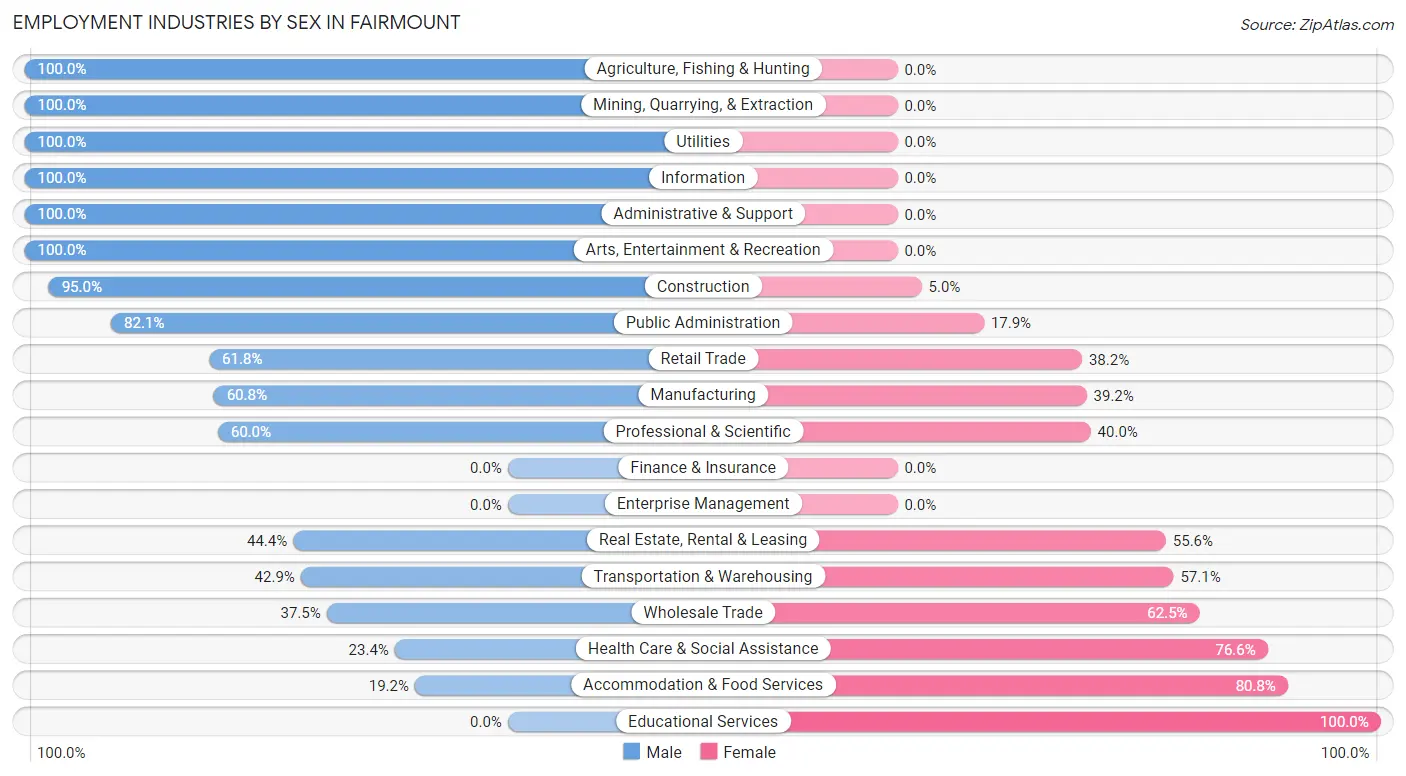
| Industry | Male | Female |
| Agriculture, Fishing & Hunting | 3 (100.0%) | 0 (0.0%) |
| Mining, Quarrying, & Extraction | 5 (100.0%) | 0 (0.0%) |
| Construction | 19 (95.0%) | 1 (5.0%) |
| Manufacturing | 101 (60.8%) | 65 (39.2%) |
| Wholesale Trade | 6 (37.5%) | 10 (62.5%) |
| Retail Trade | 55 (61.8%) | 34 (38.2%) |
| Transportation & Warehousing | 6 (42.9%) | 8 (57.1%) |
| Utilities | 7 (100.0%) | 0 (0.0%) |
| Information | 2 (100.0%) | 0 (0.0%) |
| Finance & Insurance | 0 (0.0%) | 0 (0.0%) |
| Real Estate, Rental & Leasing | 4 (44.4%) | 5 (55.6%) |
| Professional & Scientific | 3 (60.0%) | 2 (40.0%) |
| Enterprise Management | 0 (0.0%) | 0 (0.0%) |
| Administrative & Support | 5 (100.0%) | 0 (0.0%) |
| Educational Services | 0 (0.0%) | 14 (100.0%) |
| Health Care & Social Assistance | 11 (23.4%) | 36 (76.6%) |
| Arts, Entertainment & Recreation | 1 (100.0%) | 0 (0.0%) |
| Accommodation & Food Services | 5 (19.2%) | 21 (80.8%) |
| Public Administration | 55 (82.1%) | 12 (17.9%) |
| Total | 289 (58.2%) | 208 (41.8%) |
Education in Fairmount
School Enrollment in Fairmount
The most common levels of schooling among the 159 students in Fairmount are elementary school (77 | 48.4%), middle school (32 | 20.1%), and college / undergraduate (25 | 15.7%).
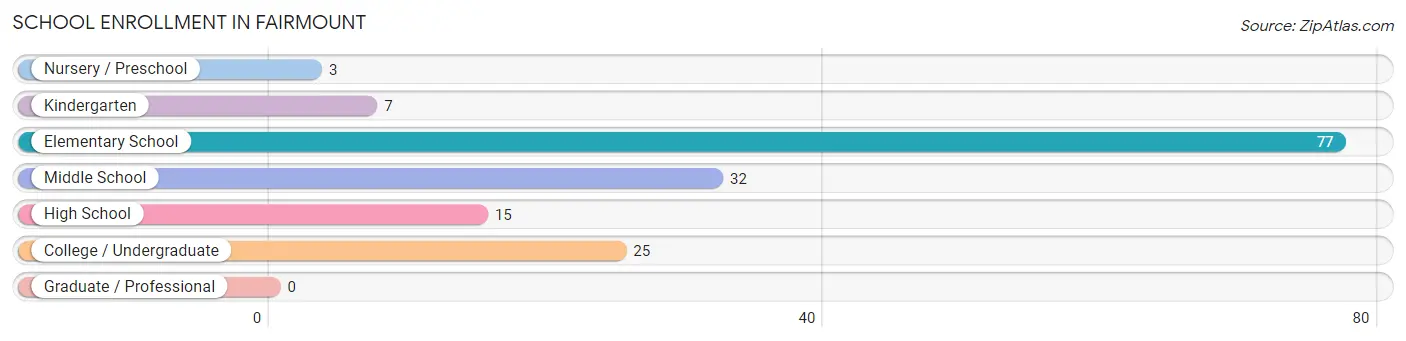
| School Level | # Students | % Students |
| Nursery / Preschool | 3 | 1.9% |
| Kindergarten | 7 | 4.4% |
| Elementary School | 77 | 48.4% |
| Middle School | 32 | 20.1% |
| High School | 15 | 9.4% |
| College / Undergraduate | 25 | 15.7% |
| Graduate / Professional | 0 | 0.0% |
| Total | 159 | 100.0% |
School Enrollment by Age by Funding Source in Fairmount
Out of a total of 159 students who are enrolled in schools in Fairmount, 9 (5.7%) attend a private institution, while the remaining 150 (94.3%) are enrolled in public schools. The age group of 20 to 24 year olds has the highest likelihood of being enrolled in private schools, with 4 (44.4% in the age bracket) enrolled. Conversely, the age group of 3 to 4 year olds has the lowest likelihood of being enrolled in a private school, with 3 (100.0% in the age bracket) attending a public institution.
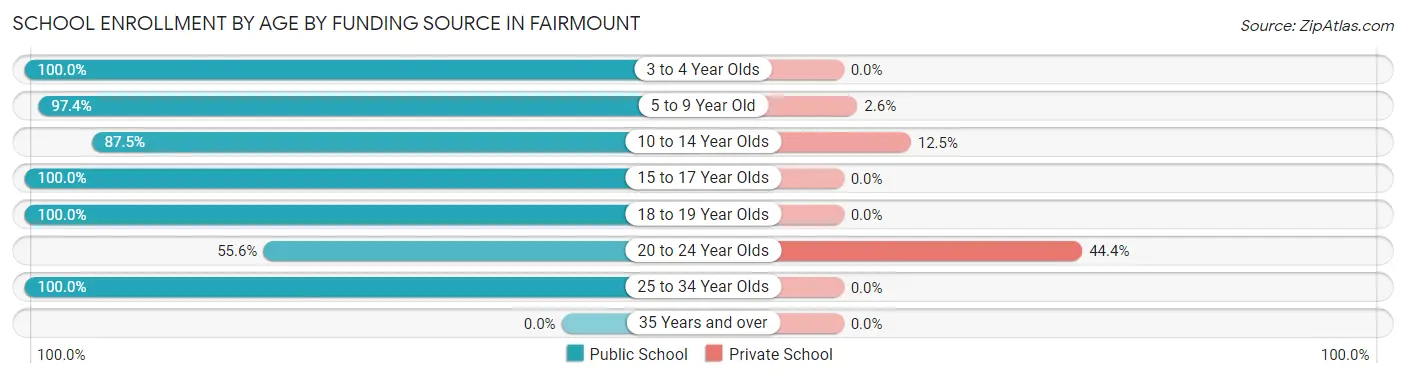
| Age Bracket | Public School | Private School |
| 3 to 4 Year Olds | 3 (100.0%) | 0 (0.0%) |
| 5 to 9 Year Old | 76 (97.4%) | 2 (2.6%) |
| 10 to 14 Year Olds | 21 (87.5%) | 3 (12.5%) |
| 15 to 17 Year Olds | 24 (100.0%) | 0 (0.0%) |
| 18 to 19 Year Olds | 13 (100.0%) | 0 (0.0%) |
| 20 to 24 Year Olds | 5 (55.6%) | 4 (44.4%) |
| 25 to 34 Year Olds | 8 (100.0%) | 0 (0.0%) |
| 35 Years and over | 0 (0.0%) | 0 (0.0%) |
| Total | 150 (94.3%) | 9 (5.7%) |
Educational Attainment by Field of Study in Fairmount
Science & technology (39 | 48.1%), social sciences (9 | 11.1%), bio, nature & agricultural (8 | 9.9%), education (8 | 9.9%), and arts & humanities (7 | 8.6%) are the most common fields of study among 81 individuals in Fairmount who have obtained a bachelor's degree or higher.
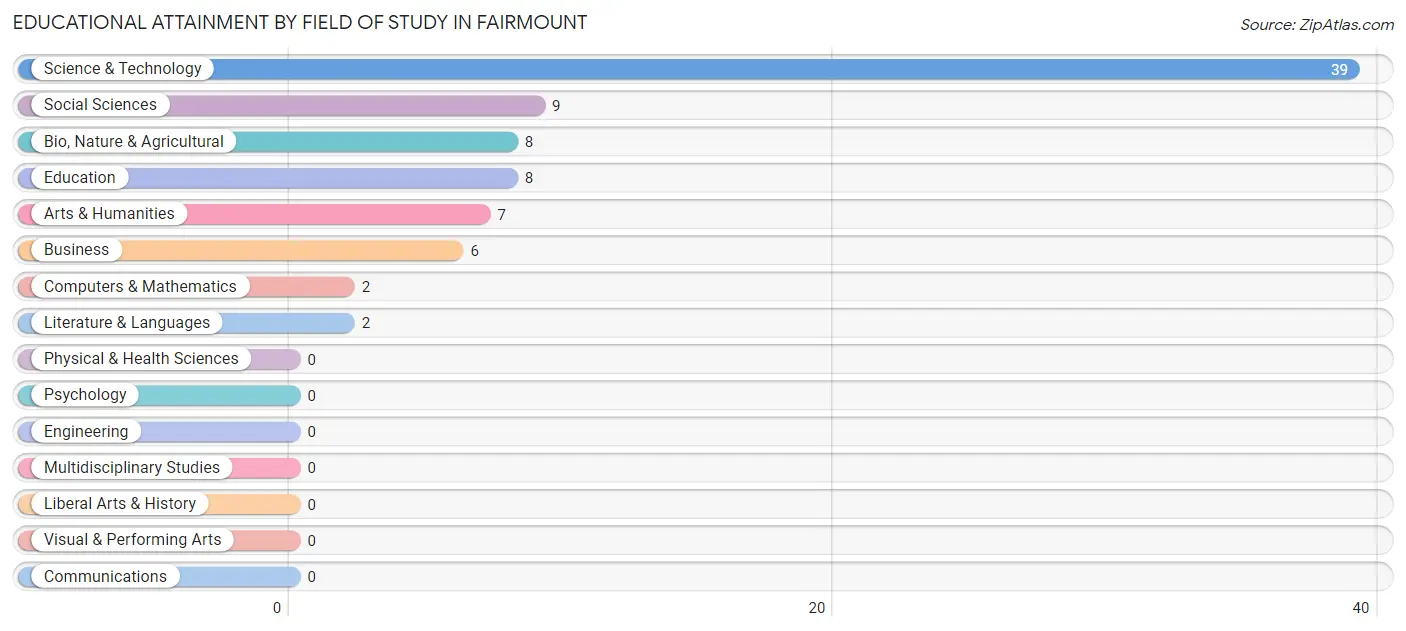
| Field of Study | # Graduates | % Graduates |
| Computers & Mathematics | 2 | 2.5% |
| Bio, Nature & Agricultural | 8 | 9.9% |
| Physical & Health Sciences | 0 | 0.0% |
| Psychology | 0 | 0.0% |
| Social Sciences | 9 | 11.1% |
| Engineering | 0 | 0.0% |
| Multidisciplinary Studies | 0 | 0.0% |
| Science & Technology | 39 | 48.1% |
| Business | 6 | 7.4% |
| Education | 8 | 9.9% |
| Literature & Languages | 2 | 2.5% |
| Liberal Arts & History | 0 | 0.0% |
| Visual & Performing Arts | 0 | 0.0% |
| Communications | 0 | 0.0% |
| Arts & Humanities | 7 | 8.6% |
| Total | 81 | 100.0% |
Transportation & Commute in Fairmount
Vehicle Availability by Sex in Fairmount
The most prevalent vehicle ownership categories in Fairmount are males with 3 vehicles (206, accounting for 71.3%) and females with 3 vehicles (37, making up 109.6%).
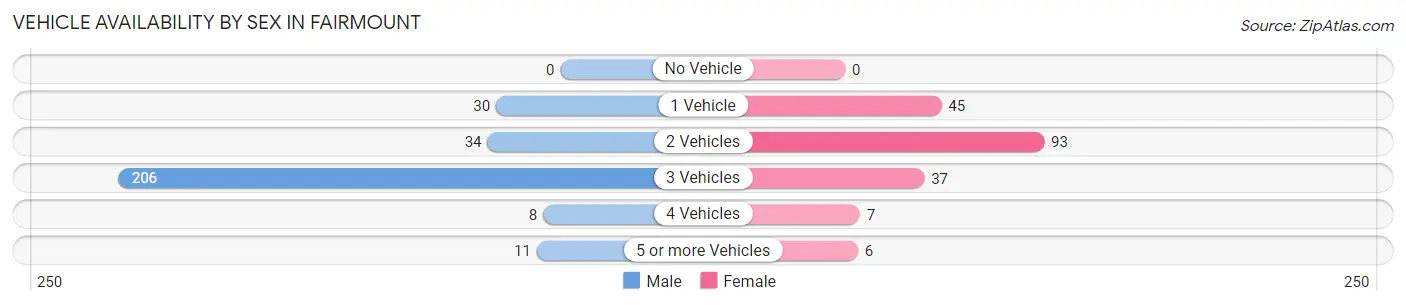
| Vehicles Available | Male | Female |
| No Vehicle | 0 (0.0%) | 0 (0.0%) |
| 1 Vehicle | 30 (10.4%) | 45 (23.9%) |
| 2 Vehicles | 34 (11.8%) | 93 (49.5%) |
| 3 Vehicles | 206 (71.3%) | 37 (19.7%) |
| 4 Vehicles | 8 (2.8%) | 7 (3.7%) |
| 5 or more Vehicles | 11 (3.8%) | 6 (3.2%) |
| Total | 289 (100.0%) | 188 (100.0%) |
Commute Time in Fairmount
The most frequently occuring commute durations in Fairmount are 10 to 14 minutes (124 commuters, 26.4%), 30 to 34 minutes (69 commuters, 14.7%), and 45 to 59 minutes (68 commuters, 14.5%).
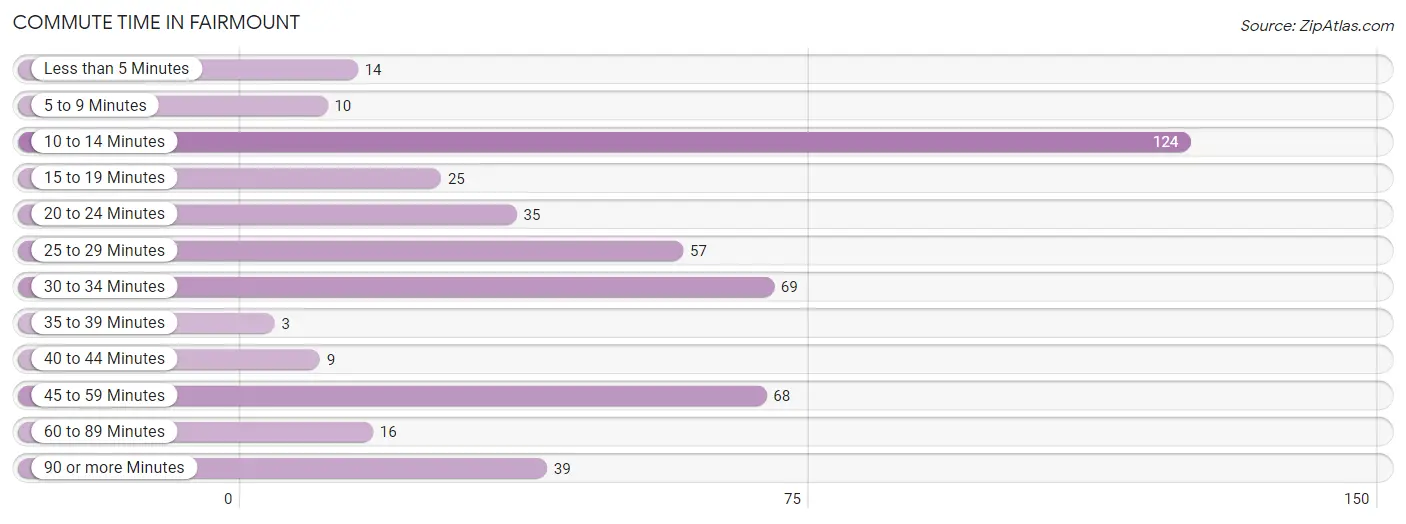
| Commute Time | # Commuters | % Commuters |
| Less than 5 Minutes | 14 | 3.0% |
| 5 to 9 Minutes | 10 | 2.1% |
| 10 to 14 Minutes | 124 | 26.4% |
| 15 to 19 Minutes | 25 | 5.3% |
| 20 to 24 Minutes | 35 | 7.5% |
| 25 to 29 Minutes | 57 | 12.1% |
| 30 to 34 Minutes | 69 | 14.7% |
| 35 to 39 Minutes | 3 | 0.6% |
| 40 to 44 Minutes | 9 | 1.9% |
| 45 to 59 Minutes | 68 | 14.5% |
| 60 to 89 Minutes | 16 | 3.4% |
| 90 or more Minutes | 39 | 8.3% |
Commute Time by Sex in Fairmount
The most common commute times in Fairmount are 10 to 14 minutes (110 commuters, 38.1%) for males and 25 to 29 minutes (45 commuters, 25.0%) for females.
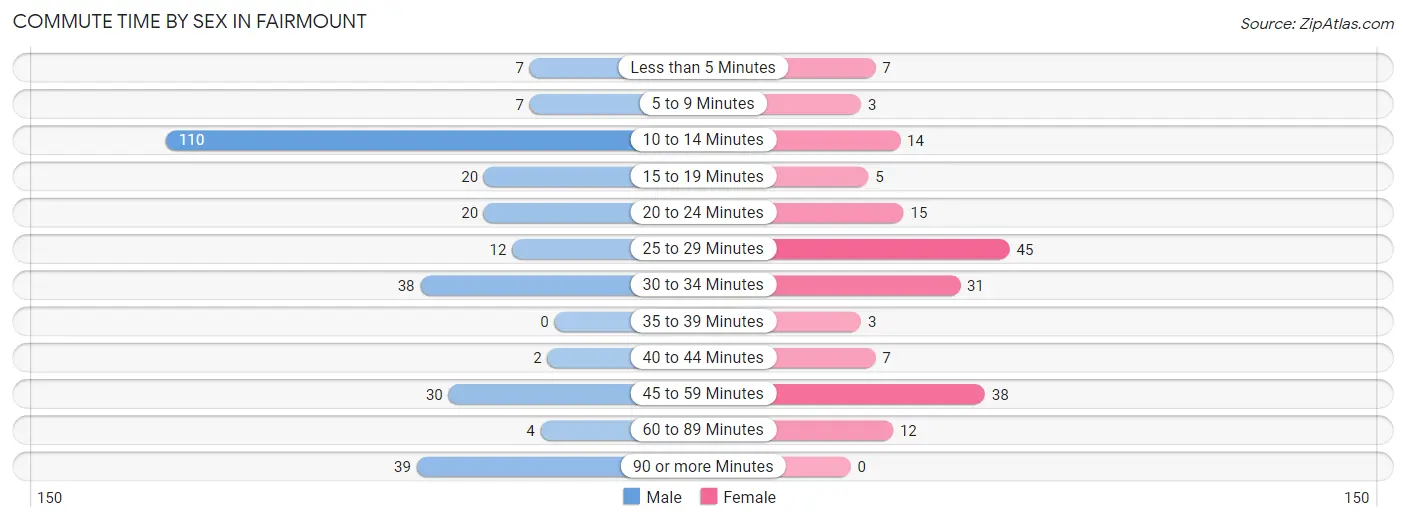
| Commute Time | Male | Female |
| Less than 5 Minutes | 7 (2.4%) | 7 (3.9%) |
| 5 to 9 Minutes | 7 (2.4%) | 3 (1.7%) |
| 10 to 14 Minutes | 110 (38.1%) | 14 (7.8%) |
| 15 to 19 Minutes | 20 (6.9%) | 5 (2.8%) |
| 20 to 24 Minutes | 20 (6.9%) | 15 (8.3%) |
| 25 to 29 Minutes | 12 (4.2%) | 45 (25.0%) |
| 30 to 34 Minutes | 38 (13.2%) | 31 (17.2%) |
| 35 to 39 Minutes | 0 (0.0%) | 3 (1.7%) |
| 40 to 44 Minutes | 2 (0.7%) | 7 (3.9%) |
| 45 to 59 Minutes | 30 (10.4%) | 38 (21.1%) |
| 60 to 89 Minutes | 4 (1.4%) | 12 (6.7%) |
| 90 or more Minutes | 39 (13.5%) | 0 (0.0%) |
Time of Departure to Work by Sex in Fairmount
The most frequent times of departure to work in Fairmount are 7:00 AM to 7:29 AM (118, 40.8%) for males and 4:00 PM to 11:59 PM (35, 19.4%) for females.
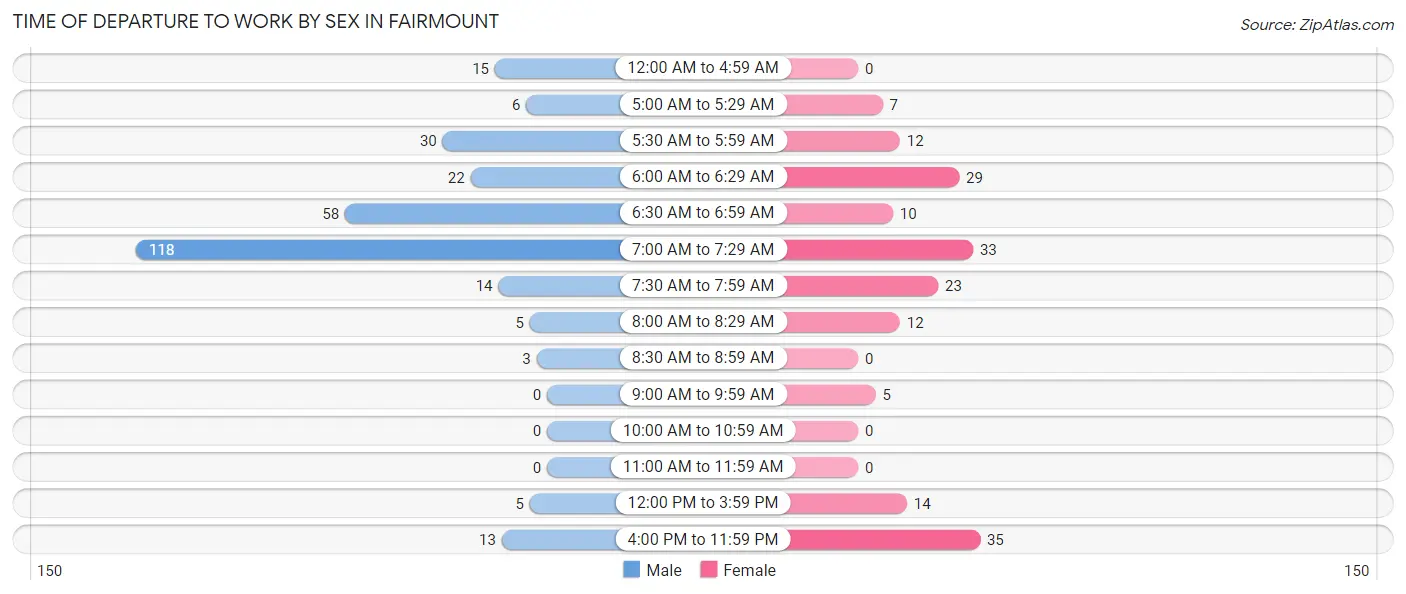
| Time of Departure | Male | Female |
| 12:00 AM to 4:59 AM | 15 (5.2%) | 0 (0.0%) |
| 5:00 AM to 5:29 AM | 6 (2.1%) | 7 (3.9%) |
| 5:30 AM to 5:59 AM | 30 (10.4%) | 12 (6.7%) |
| 6:00 AM to 6:29 AM | 22 (7.6%) | 29 (16.1%) |
| 6:30 AM to 6:59 AM | 58 (20.1%) | 10 (5.6%) |
| 7:00 AM to 7:29 AM | 118 (40.8%) | 33 (18.3%) |
| 7:30 AM to 7:59 AM | 14 (4.8%) | 23 (12.8%) |
| 8:00 AM to 8:29 AM | 5 (1.7%) | 12 (6.7%) |
| 8:30 AM to 8:59 AM | 3 (1.0%) | 0 (0.0%) |
| 9:00 AM to 9:59 AM | 0 (0.0%) | 5 (2.8%) |
| 10:00 AM to 10:59 AM | 0 (0.0%) | 0 (0.0%) |
| 11:00 AM to 11:59 AM | 0 (0.0%) | 0 (0.0%) |
| 12:00 PM to 3:59 PM | 5 (1.7%) | 14 (7.8%) |
| 4:00 PM to 11:59 PM | 13 (4.5%) | 35 (19.4%) |
| Total | 289 (100.0%) | 180 (100.0%) |
Housing Occupancy in Fairmount
Occupancy by Ownership in Fairmount
Of the total 437 dwellings in Fairmount, owner-occupied units account for 271 (62.0%), while renter-occupied units make up 166 (38.0%).
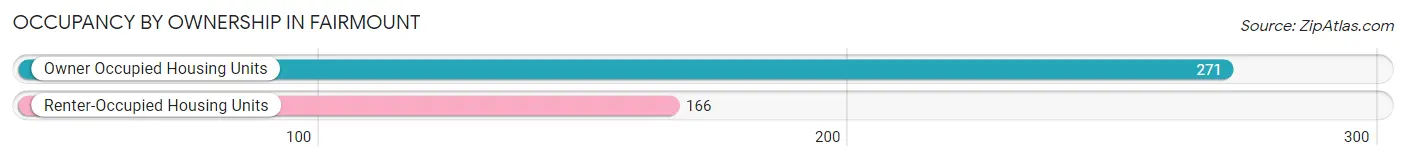
| Occupancy | # Housing Units | % Housing Units |
| Owner Occupied Housing Units | 271 | 62.0% |
| Renter-Occupied Housing Units | 166 | 38.0% |
| Total Occupied Housing Units | 437 | 100.0% |
Occupancy by Household Size in Fairmount
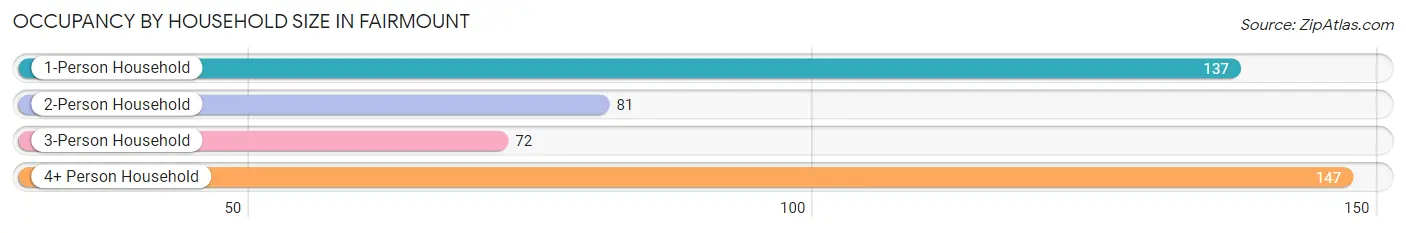
| Household Size | # Housing Units | % Housing Units |
| 1-Person Household | 137 | 31.4% |
| 2-Person Household | 81 | 18.5% |
| 3-Person Household | 72 | 16.5% |
| 4+ Person Household | 147 | 33.6% |
| Total Housing Units | 437 | 100.0% |
Occupancy by Ownership by Household Size in Fairmount
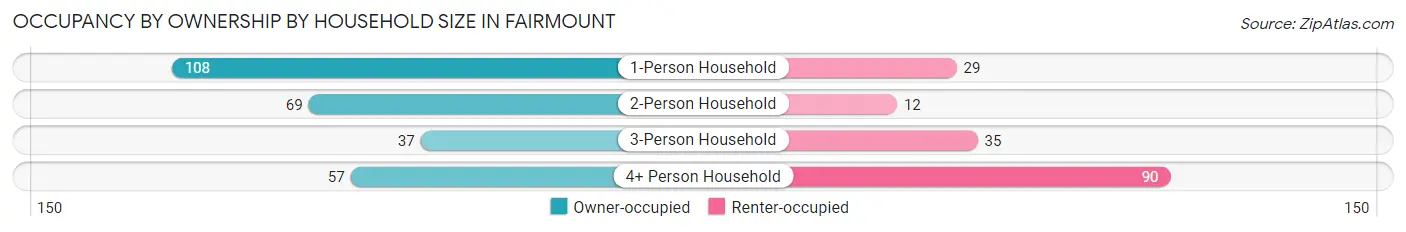
| Household Size | Owner-occupied | Renter-occupied |
| 1-Person Household | 108 (78.8%) | 29 (21.2%) |
| 2-Person Household | 69 (85.2%) | 12 (14.8%) |
| 3-Person Household | 37 (51.4%) | 35 (48.6%) |
| 4+ Person Household | 57 (38.8%) | 90 (61.2%) |
| Total Housing Units | 271 (62.0%) | 166 (38.0%) |
Occupancy by Educational Attainment in Fairmount
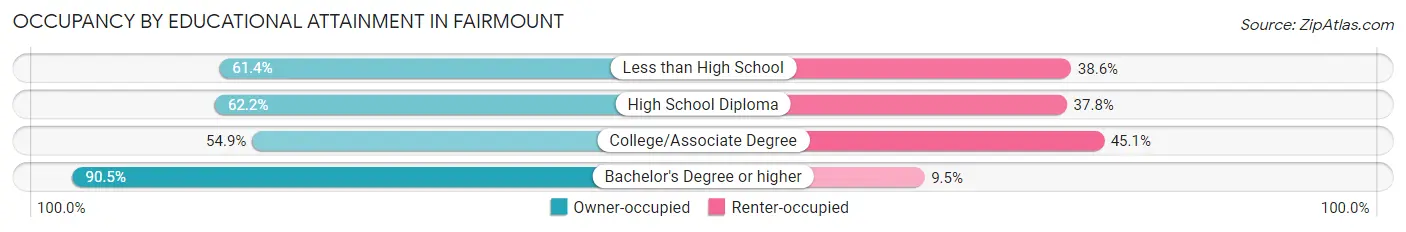
| Household Size | Owner-occupied | Renter-occupied |
| Less than High School | 62 (61.4%) | 39 (38.6%) |
| High School Diploma | 145 (62.2%) | 88 (37.8%) |
| College/Associate Degree | 45 (54.9%) | 37 (45.1%) |
| Bachelor's Degree or higher | 19 (90.5%) | 2 (9.5%) |
Occupancy by Age of Householder in Fairmount
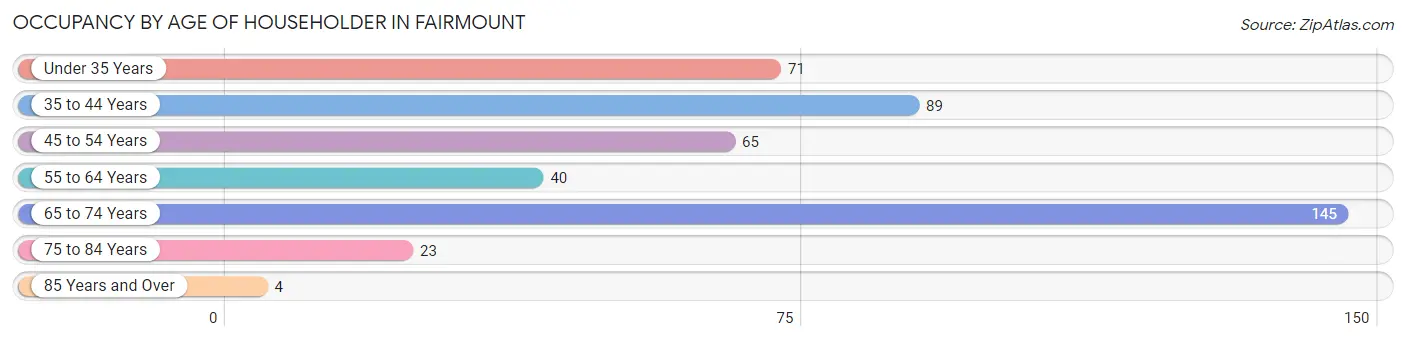
| Age Bracket | # Households | % Households |
| Under 35 Years | 71 | 16.3% |
| 35 to 44 Years | 89 | 20.4% |
| 45 to 54 Years | 65 | 14.9% |
| 55 to 64 Years | 40 | 9.1% |
| 65 to 74 Years | 145 | 33.2% |
| 75 to 84 Years | 23 | 5.3% |
| 85 Years and Over | 4 | 0.9% |
| Total | 437 | 100.0% |
Housing Finances in Fairmount
Median Income by Occupancy in Fairmount
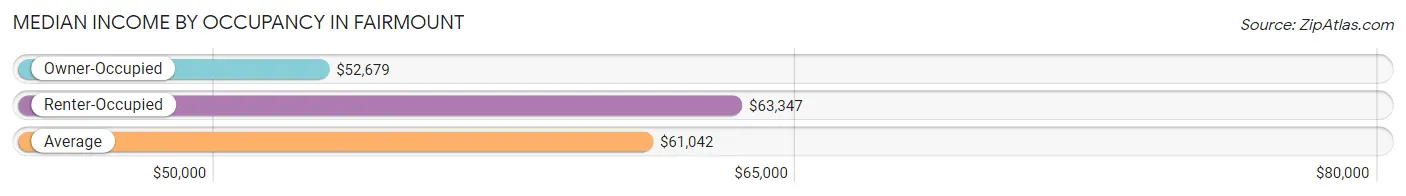
| Occupancy Type | # Households | Median Income |
| Owner-Occupied | 271 (62.0%) | $52,679 |
| Renter-Occupied | 166 (38.0%) | $63,347 |
| Average | 437 (100.0%) | $61,042 |
Occupancy by Householder Income Bracket in Fairmount
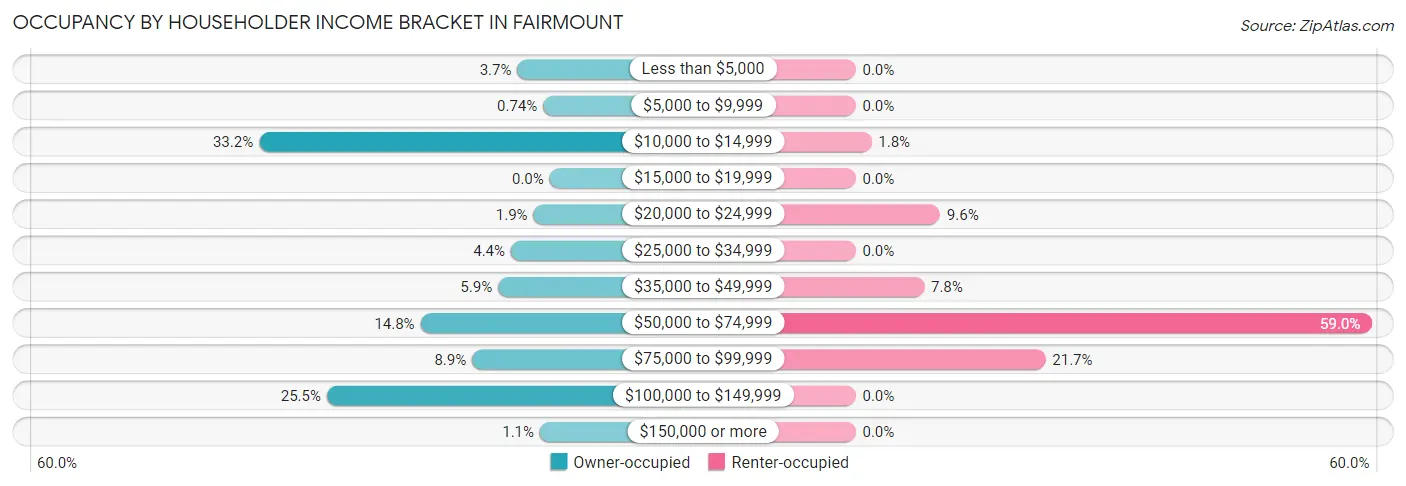
| Income Bracket | Owner-occupied | Renter-occupied |
| Less than $5,000 | 10 (3.7%) | 0 (0.0%) |
| $5,000 to $9,999 | 2 (0.7%) | 0 (0.0%) |
| $10,000 to $14,999 | 90 (33.2%) | 3 (1.8%) |
| $15,000 to $19,999 | 0 (0.0%) | 0 (0.0%) |
| $20,000 to $24,999 | 5 (1.8%) | 16 (9.6%) |
| $25,000 to $34,999 | 12 (4.4%) | 0 (0.0%) |
| $35,000 to $49,999 | 16 (5.9%) | 13 (7.8%) |
| $50,000 to $74,999 | 40 (14.8%) | 98 (59.0%) |
| $75,000 to $99,999 | 24 (8.9%) | 36 (21.7%) |
| $100,000 to $149,999 | 69 (25.5%) | 0 (0.0%) |
| $150,000 or more | 3 (1.1%) | 0 (0.0%) |
| Total | 271 (100.0%) | 166 (100.0%) |
Monthly Housing Cost Tiers in Fairmount
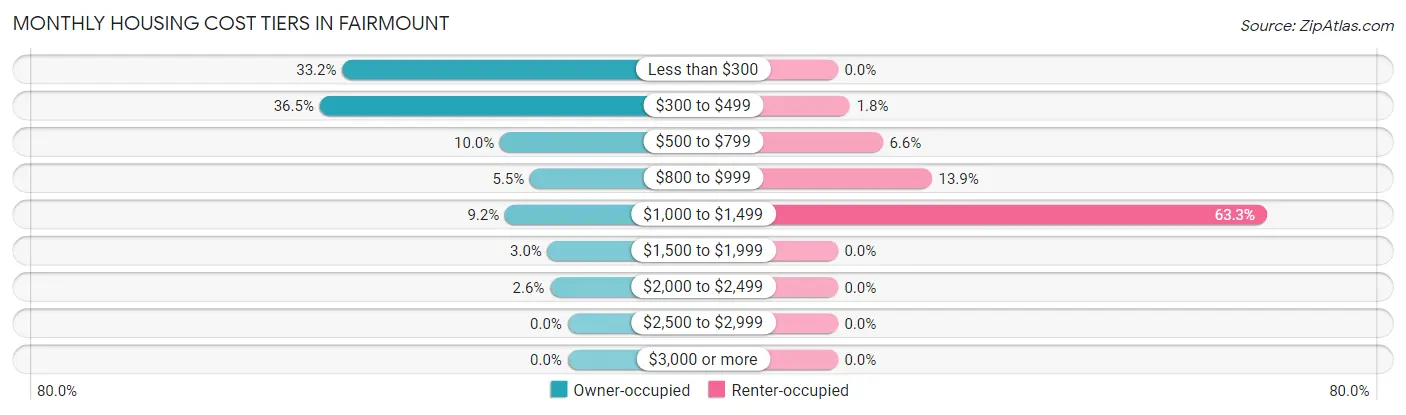
| Monthly Cost | Owner-occupied | Renter-occupied |
| Less than $300 | 90 (33.2%) | 0 (0.0%) |
| $300 to $499 | 99 (36.5%) | 3 (1.8%) |
| $500 to $799 | 27 (10.0%) | 11 (6.6%) |
| $800 to $999 | 15 (5.5%) | 23 (13.9%) |
| $1,000 to $1,499 | 25 (9.2%) | 105 (63.2%) |
| $1,500 to $1,999 | 8 (2.9%) | 0 (0.0%) |
| $2,000 to $2,499 | 7 (2.6%) | 0 (0.0%) |
| $2,500 to $2,999 | 0 (0.0%) | 0 (0.0%) |
| $3,000 or more | 0 (0.0%) | 0 (0.0%) |
| Total | 271 (100.0%) | 166 (100.0%) |
Physical Housing Characteristics in Fairmount
Housing Structures in Fairmount
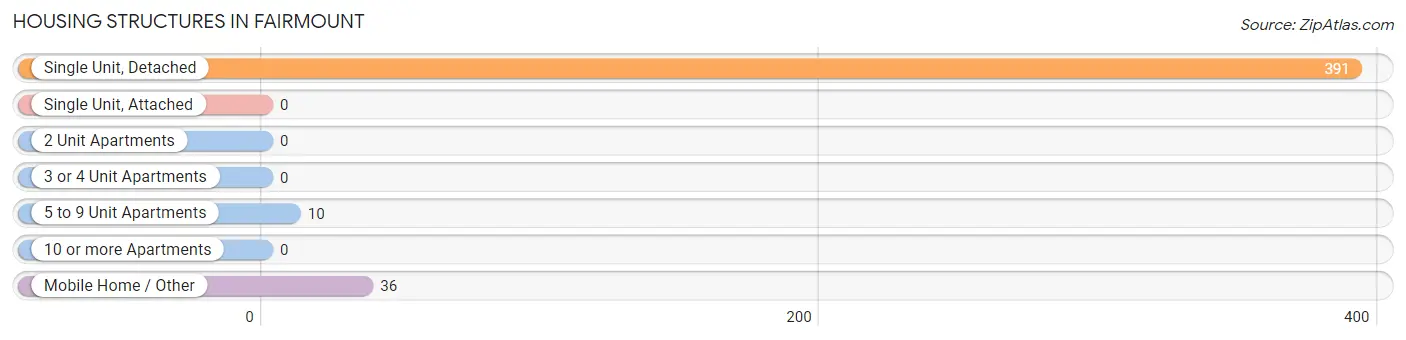
| Structure Type | # Housing Units | % Housing Units |
| Single Unit, Detached | 391 | 89.5% |
| Single Unit, Attached | 0 | 0.0% |
| 2 Unit Apartments | 0 | 0.0% |
| 3 or 4 Unit Apartments | 0 | 0.0% |
| 5 to 9 Unit Apartments | 10 | 2.3% |
| 10 or more Apartments | 0 | 0.0% |
| Mobile Home / Other | 36 | 8.2% |
| Total | 437 | 100.0% |
Housing Structures by Occupancy in Fairmount
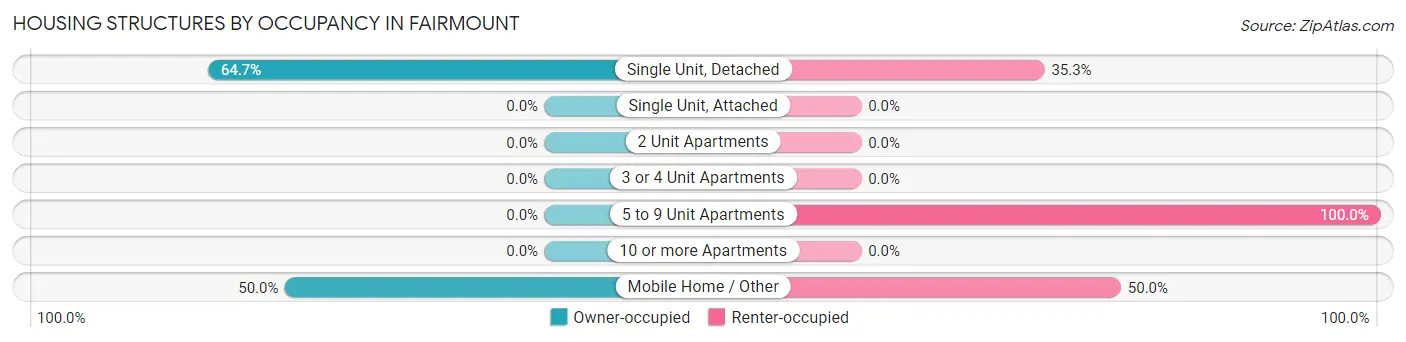
| Structure Type | Owner-occupied | Renter-occupied |
| Single Unit, Detached | 253 (64.7%) | 138 (35.3%) |
| Single Unit, Attached | 0 (0.0%) | 0 (0.0%) |
| 2 Unit Apartments | 0 (0.0%) | 0 (0.0%) |
| 3 or 4 Unit Apartments | 0 (0.0%) | 0 (0.0%) |
| 5 to 9 Unit Apartments | 0 (0.0%) | 10 (100.0%) |
| 10 or more Apartments | 0 (0.0%) | 0 (0.0%) |
| Mobile Home / Other | 18 (50.0%) | 18 (50.0%) |
| Total | 271 (62.0%) | 166 (38.0%) |
Housing Structures by Number of Rooms in Fairmount
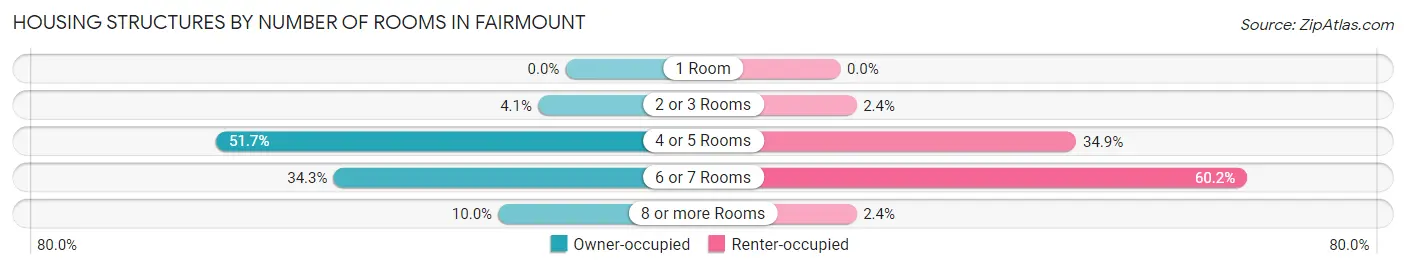
| Number of Rooms | Owner-occupied | Renter-occupied |
| 1 Room | 0 (0.0%) | 0 (0.0%) |
| 2 or 3 Rooms | 11 (4.1%) | 4 (2.4%) |
| 4 or 5 Rooms | 140 (51.7%) | 58 (34.9%) |
| 6 or 7 Rooms | 93 (34.3%) | 100 (60.2%) |
| 8 or more Rooms | 27 (10.0%) | 4 (2.4%) |
| Total | 271 (100.0%) | 166 (100.0%) |
Housing Structure by Heating Type in Fairmount
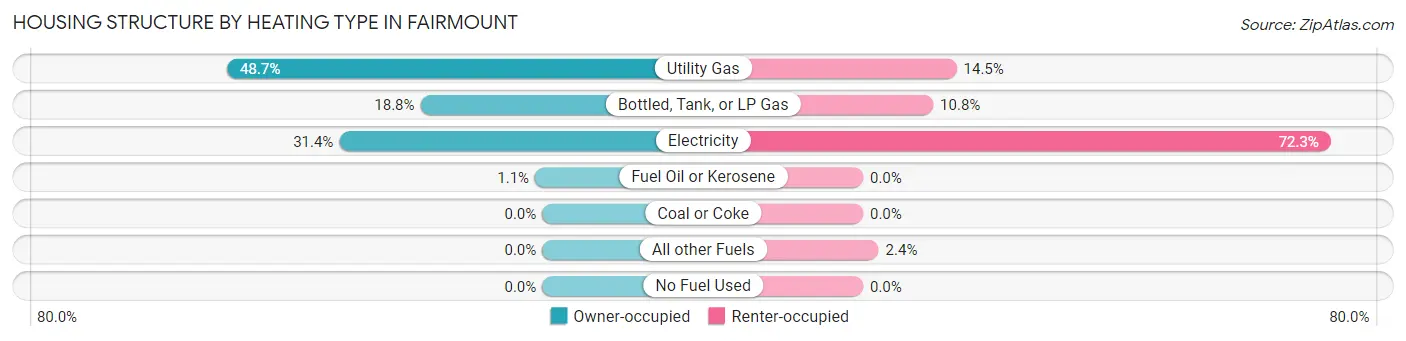
| Heating Type | Owner-occupied | Renter-occupied |
| Utility Gas | 132 (48.7%) | 24 (14.5%) |
| Bottled, Tank, or LP Gas | 51 (18.8%) | 18 (10.8%) |
| Electricity | 85 (31.4%) | 120 (72.3%) |
| Fuel Oil or Kerosene | 3 (1.1%) | 0 (0.0%) |
| Coal or Coke | 0 (0.0%) | 0 (0.0%) |
| All other Fuels | 0 (0.0%) | 4 (2.4%) |
| No Fuel Used | 0 (0.0%) | 0 (0.0%) |
| Total | 271 (100.0%) | 166 (100.0%) |
Household Vehicle Usage in Fairmount
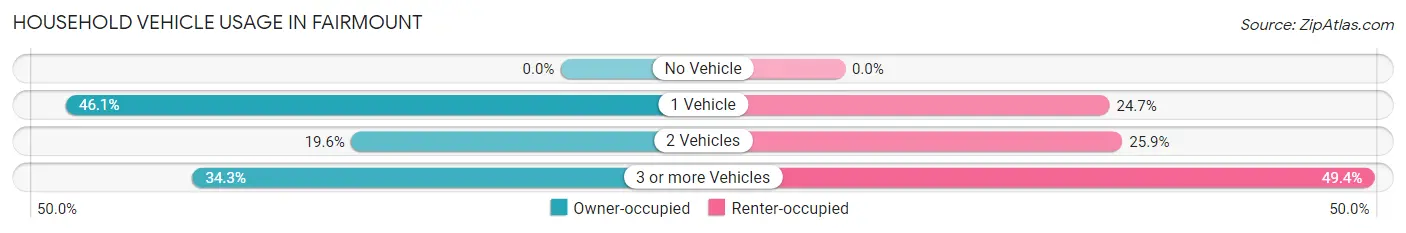
| Vehicles per Household | Owner-occupied | Renter-occupied |
| No Vehicle | 0 (0.0%) | 0 (0.0%) |
| 1 Vehicle | 125 (46.1%) | 41 (24.7%) |
| 2 Vehicles | 53 (19.6%) | 43 (25.9%) |
| 3 or more Vehicles | 93 (34.3%) | 82 (49.4%) |
| Total | 271 (100.0%) | 166 (100.0%) |
Real Estate & Mortgages in Fairmount
Real Estate and Mortgage Overview in Fairmount
| Characteristic | Without Mortgage | With Mortgage |
| Housing Units | 204 | 67 |
| Median Property Value | $87,800 | $174,100 |
| Median Household Income | - | - |
| Monthly Housing Costs | $338 | $0 |
| Real Estate Taxes | $840 | $1 |
Property Value by Mortgage Status in Fairmount
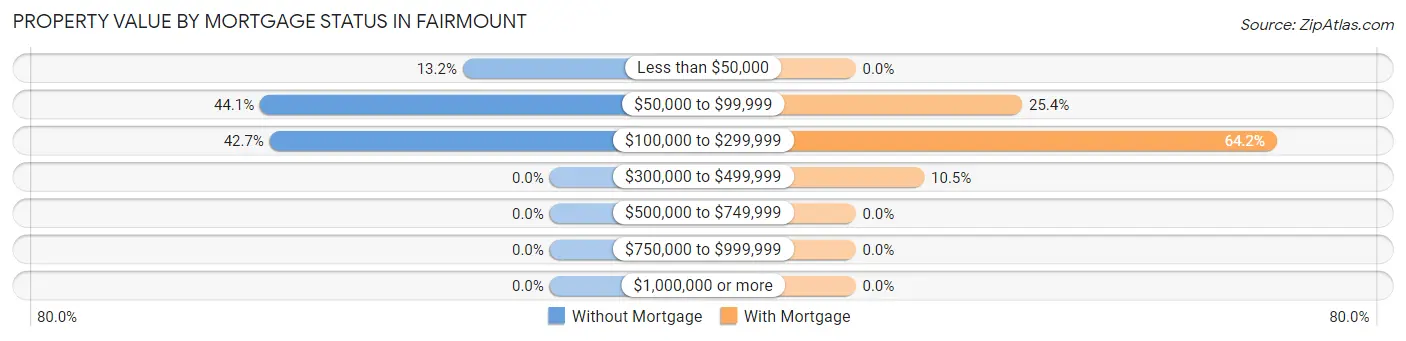
| Property Value | Without Mortgage | With Mortgage |
| Less than $50,000 | 27 (13.2%) | 0 (0.0%) |
| $50,000 to $99,999 | 90 (44.1%) | 17 (25.4%) |
| $100,000 to $299,999 | 87 (42.6%) | 43 (64.2%) |
| $300,000 to $499,999 | 0 (0.0%) | 7 (10.4%) |
| $500,000 to $749,999 | 0 (0.0%) | 0 (0.0%) |
| $750,000 to $999,999 | 0 (0.0%) | 0 (0.0%) |
| $1,000,000 or more | 0 (0.0%) | 0 (0.0%) |
| Total | 204 (100.0%) | 67 (100.0%) |
Household Income by Mortgage Status in Fairmount
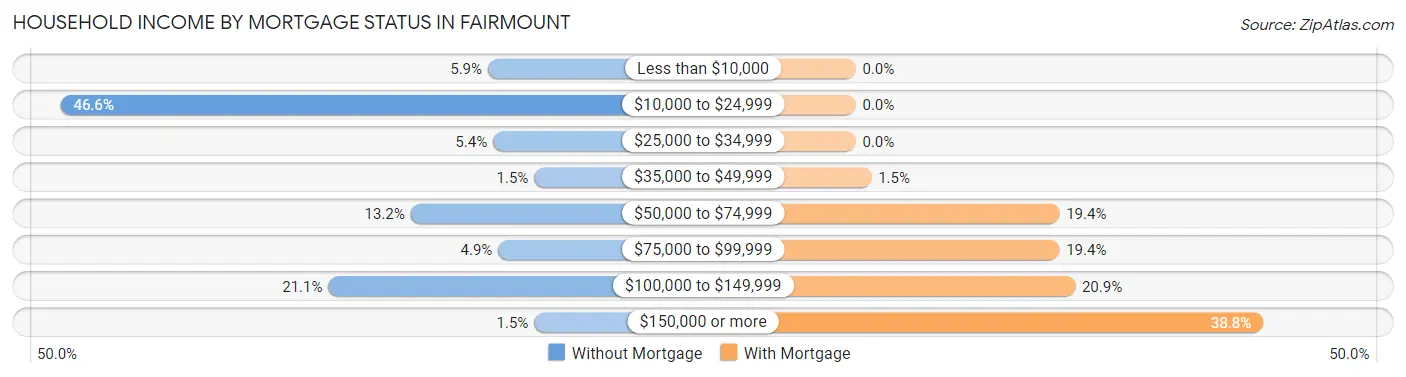
| Household Income | Without Mortgage | With Mortgage |
| Less than $10,000 | 12 (5.9%) | 0 (0.0%) |
| $10,000 to $24,999 | 95 (46.6%) | 0 (0.0%) |
| $25,000 to $34,999 | 11 (5.4%) | 0 (0.0%) |
| $35,000 to $49,999 | 3 (1.5%) | 1 (1.5%) |
| $50,000 to $74,999 | 27 (13.2%) | 13 (19.4%) |
| $75,000 to $99,999 | 10 (4.9%) | 13 (19.4%) |
| $100,000 to $149,999 | 43 (21.1%) | 14 (20.9%) |
| $150,000 or more | 3 (1.5%) | 26 (38.8%) |
| Total | 204 (100.0%) | 67 (100.0%) |
Property Value to Household Income Ratio in Fairmount
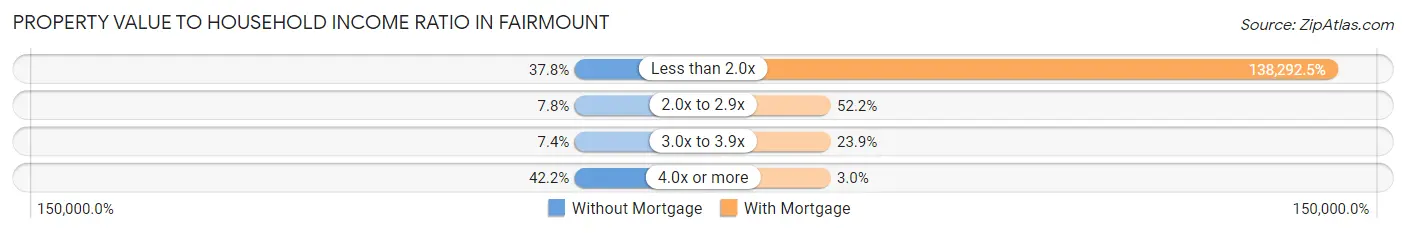
| Value-to-Income Ratio | Without Mortgage | With Mortgage |
| Less than 2.0x | 77 (37.8%) | 92,656 (138,292.5%) |
| 2.0x to 2.9x | 16 (7.8%) | 35 (52.2%) |
| 3.0x to 3.9x | 15 (7.3%) | 16 (23.9%) |
| 4.0x or more | 86 (42.2%) | 2 (3.0%) |
| Total | 204 (100.0%) | 67 (100.0%) |
Real Estate Taxes by Mortgage Status in Fairmount
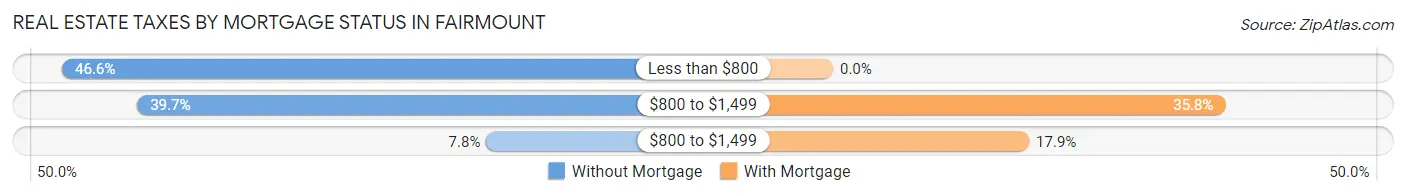
| Property Taxes | Without Mortgage | With Mortgage |
| Less than $800 | 95 (46.6%) | 0 (0.0%) |
| $800 to $1,499 | 81 (39.7%) | 24 (35.8%) |
| $800 to $1,499 | 16 (7.8%) | 12 (17.9%) |
| Total | 204 (100.0%) | 67 (100.0%) |
Health & Disability in Fairmount
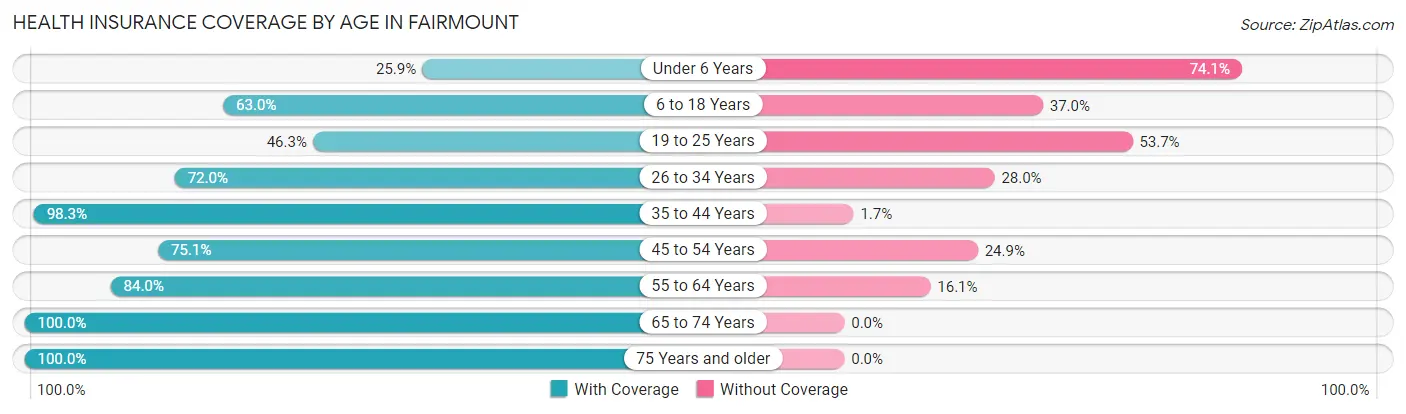
Health Insurance Coverage by Age in Fairmount
| Age Bracket | With Coverage | Without Coverage |
| Under 6 Years | 29 (25.9%) | 83 (74.1%) |
| 6 to 18 Years | 97 (63.0%) | 57 (37.0%) |
| 19 to 25 Years | 93 (46.3%) | 108 (53.7%) |
| 26 to 34 Years | 90 (72.0%) | 35 (28.0%) |
| 35 to 44 Years | 115 (98.3%) | 2 (1.7%) |
| 45 to 54 Years | 154 (75.1%) | 51 (24.9%) |
| 55 to 64 Years | 68 (84.0%) | 13 (16.1%) |
| 65 to 74 Years | 185 (100.0%) | 0 (0.0%) |
| 75 Years and older | 33 (100.0%) | 0 (0.0%) |
| Total | 864 (71.2%) | 349 (28.8%) |
Health Insurance Coverage by Citizenship Status in Fairmount
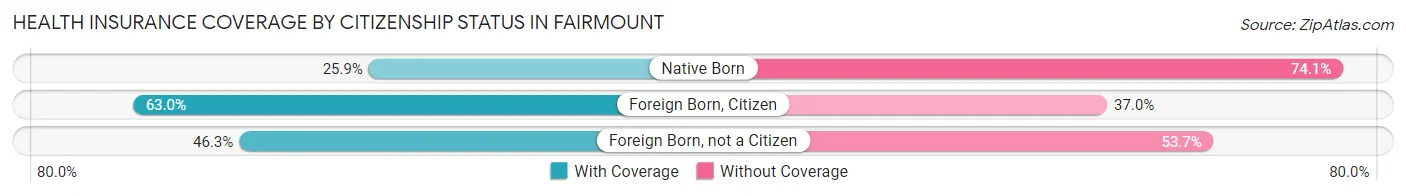
| Citizenship Status | With Coverage | Without Coverage |
| Native Born | 29 (25.9%) | 83 (74.1%) |
| Foreign Born, Citizen | 97 (63.0%) | 57 (37.0%) |
| Foreign Born, not a Citizen | 93 (46.3%) | 108 (53.7%) |
Health Insurance Coverage by Household Income in Fairmount
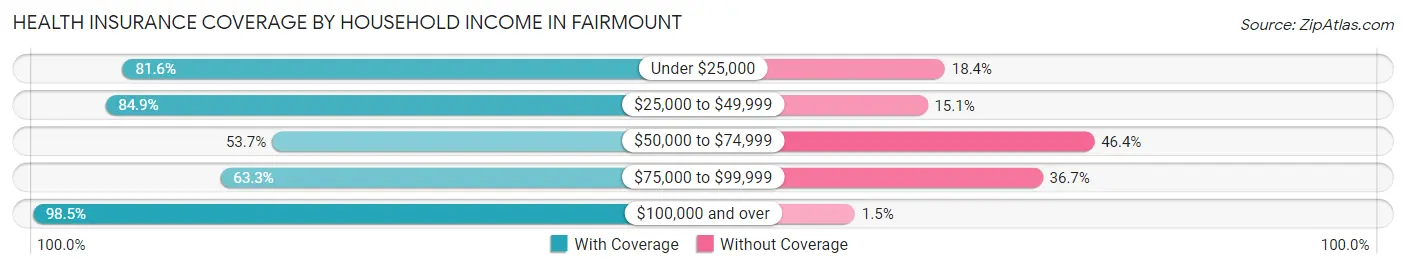
| Household Income | With Coverage | Without Coverage |
| Under $25,000 | 120 (81.6%) | 27 (18.4%) |
| $25,000 to $49,999 | 73 (84.9%) | 13 (15.1%) |
| $50,000 to $74,999 | 235 (53.6%) | 203 (46.4%) |
| $75,000 to $99,999 | 176 (63.3%) | 102 (36.7%) |
| $100,000 and over | 260 (98.5%) | 4 (1.5%) |
Public vs Private Health Insurance Coverage by Age in Fairmount
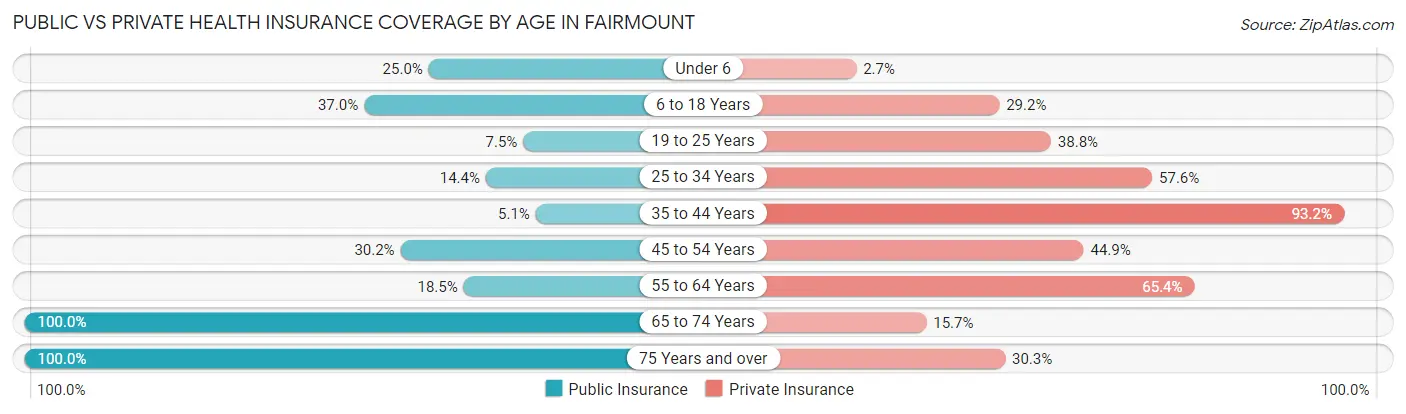
| Age Bracket | Public Insurance | Private Insurance |
| Under 6 | 28 (25.0%) | 3 (2.7%) |
| 6 to 18 Years | 57 (37.0%) | 45 (29.2%) |
| 19 to 25 Years | 15 (7.5%) | 78 (38.8%) |
| 25 to 34 Years | 18 (14.4%) | 72 (57.6%) |
| 35 to 44 Years | 6 (5.1%) | 109 (93.2%) |
| 45 to 54 Years | 62 (30.2%) | 92 (44.9%) |
| 55 to 64 Years | 15 (18.5%) | 53 (65.4%) |
| 65 to 74 Years | 185 (100.0%) | 29 (15.7%) |
| 75 Years and over | 33 (100.0%) | 10 (30.3%) |
| Total | 419 (34.5%) | 491 (40.5%) |
Disability Status by Sex by Age in Fairmount
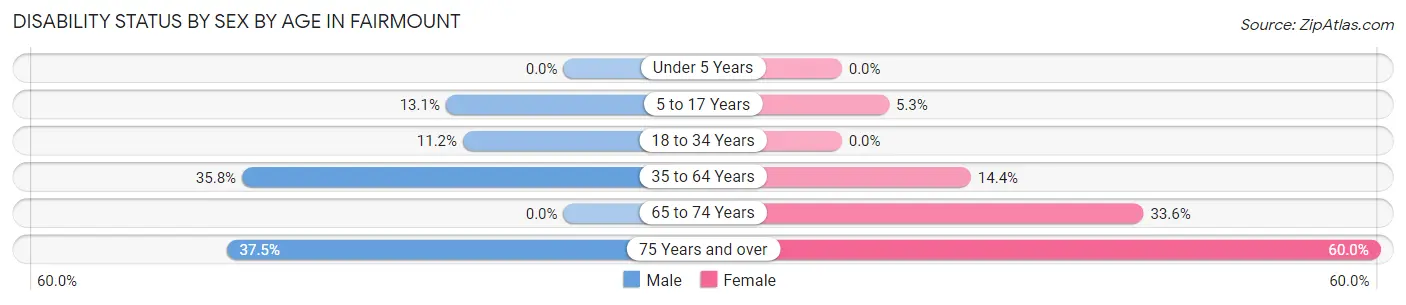
| Age Bracket | Male | Female |
| Under 5 Years | 0 (0.0%) | 0 (0.0%) |
| 5 to 17 Years | 11 (13.1%) | 5 (5.3%) |
| 18 to 34 Years | 15 (11.2%) | 0 (0.0%) |
| 35 to 64 Years | 92 (35.8%) | 21 (14.4%) |
| 65 to 74 Years | 0 (0.0%) | 42 (33.6%) |
| 75 Years and over | 3 (37.5%) | 15 (60.0%) |
Disability Class by Sex by Age in Fairmount
Disability Class: Hearing Difficulty
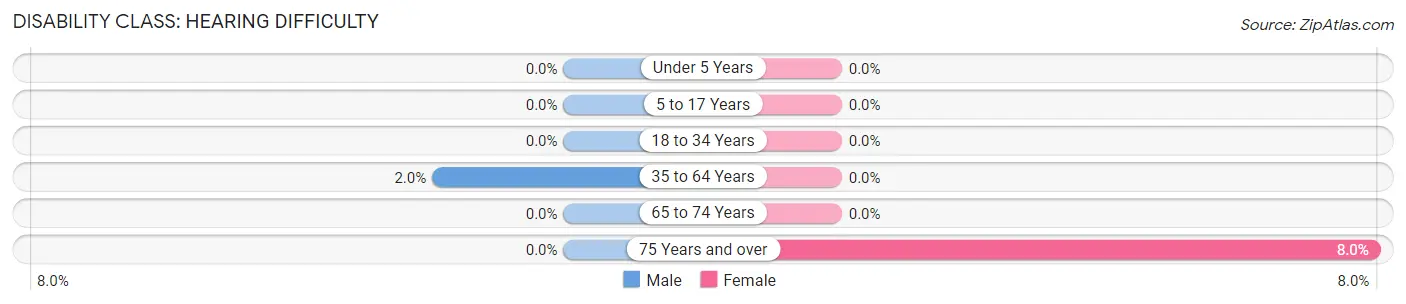
| Age Bracket | Male | Female |
| Under 5 Years | 0 (0.0%) | 0 (0.0%) |
| 5 to 17 Years | 0 (0.0%) | 0 (0.0%) |
| 18 to 34 Years | 0 (0.0%) | 0 (0.0%) |
| 35 to 64 Years | 5 (1.9%) | 0 (0.0%) |
| 65 to 74 Years | 0 (0.0%) | 0 (0.0%) |
| 75 Years and over | 0 (0.0%) | 2 (8.0%) |
Disability Class: Vision Difficulty
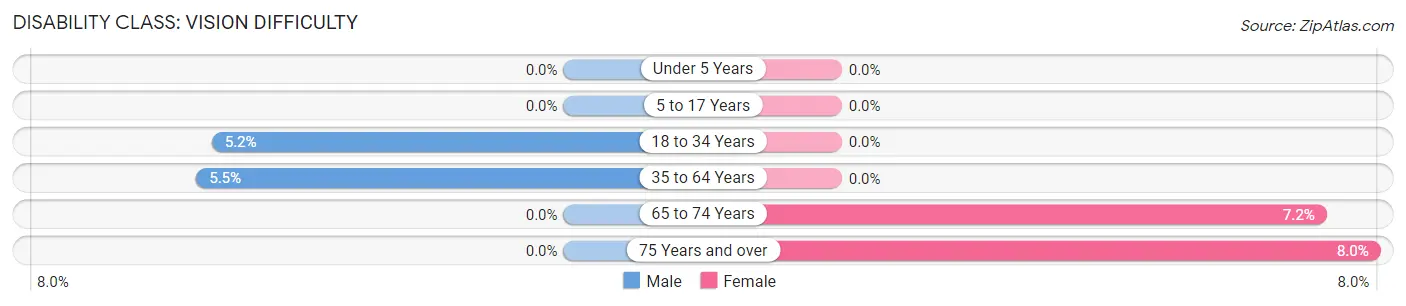
| Age Bracket | Male | Female |
| Under 5 Years | 0 (0.0%) | 0 (0.0%) |
| 5 to 17 Years | 0 (0.0%) | 0 (0.0%) |
| 18 to 34 Years | 7 (5.2%) | 0 (0.0%) |
| 35 to 64 Years | 14 (5.4%) | 0 (0.0%) |
| 65 to 74 Years | 0 (0.0%) | 9 (7.2%) |
| 75 Years and over | 0 (0.0%) | 2 (8.0%) |
Disability Class: Cognitive Difficulty
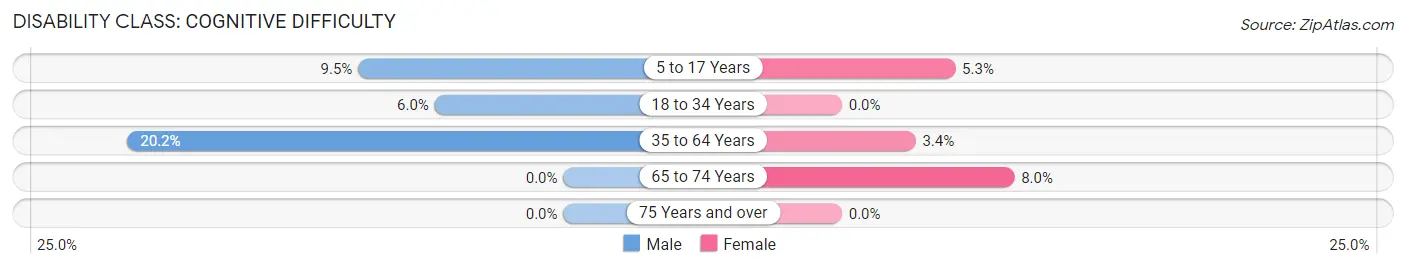
| Age Bracket | Male | Female |
| 5 to 17 Years | 8 (9.5%) | 5 (5.3%) |
| 18 to 34 Years | 8 (6.0%) | 0 (0.0%) |
| 35 to 64 Years | 52 (20.2%) | 5 (3.4%) |
| 65 to 74 Years | 0 (0.0%) | 10 (8.0%) |
| 75 Years and over | 0 (0.0%) | 0 (0.0%) |
Disability Class: Ambulatory Difficulty
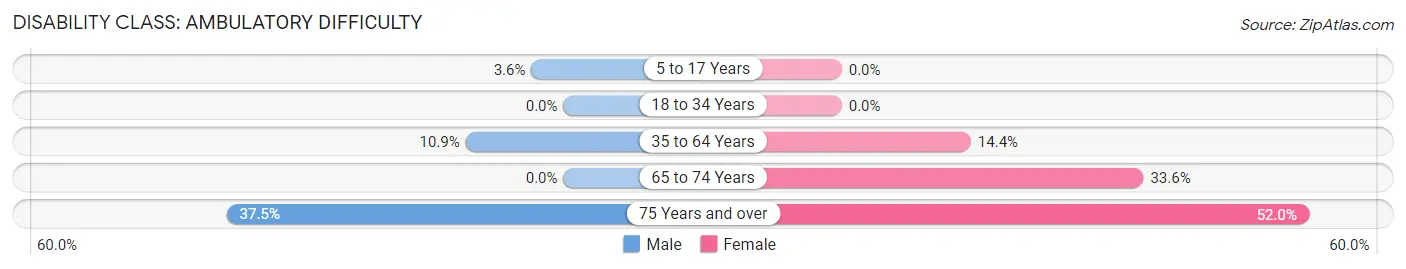
| Age Bracket | Male | Female |
| 5 to 17 Years | 3 (3.6%) | 0 (0.0%) |
| 18 to 34 Years | 0 (0.0%) | 0 (0.0%) |
| 35 to 64 Years | 28 (10.9%) | 21 (14.4%) |
| 65 to 74 Years | 0 (0.0%) | 42 (33.6%) |
| 75 Years and over | 3 (37.5%) | 13 (52.0%) |
Disability Class: Self-Care Difficulty
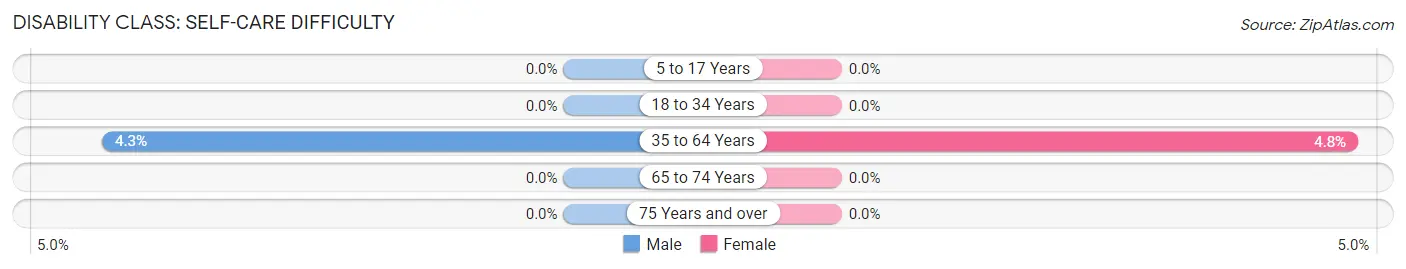
| Age Bracket | Male | Female |
| 5 to 17 Years | 0 (0.0%) | 0 (0.0%) |
| 18 to 34 Years | 0 (0.0%) | 0 (0.0%) |
| 35 to 64 Years | 11 (4.3%) | 7 (4.8%) |
| 65 to 74 Years | 0 (0.0%) | 0 (0.0%) |
| 75 Years and over | 0 (0.0%) | 0 (0.0%) |
Technology Access in Fairmount
Computing Device Access in Fairmount
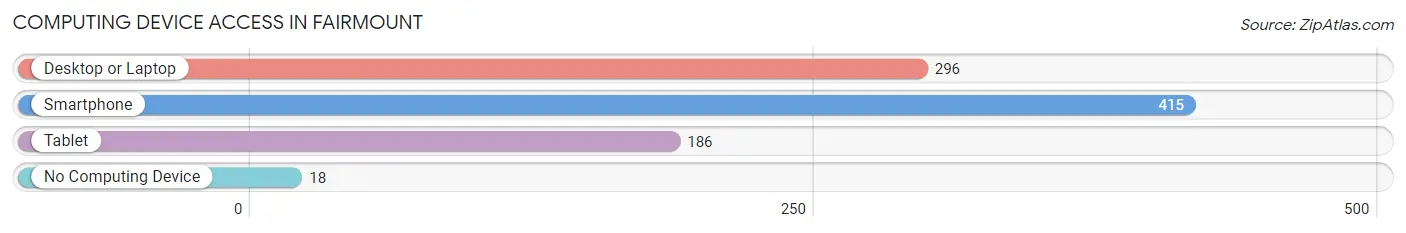
| Device Type | # Households | % Households |
| Desktop or Laptop | 296 | 67.7% |
| Smartphone | 415 | 95.0% |
| Tablet | 186 | 42.6% |
| No Computing Device | 18 | 4.1% |
| Total | 437 | 100.0% |
Internet Access in Fairmount
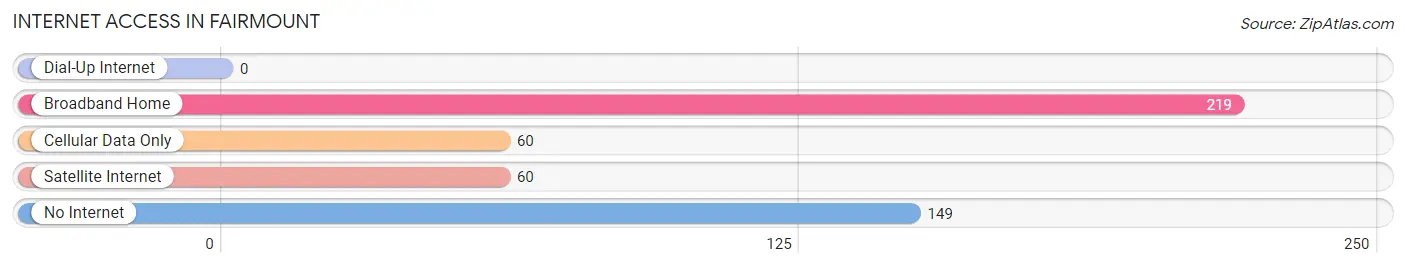
| Internet Type | # Households | % Households |
| Dial-Up Internet | 0 | 0.0% |
| Broadband Home | 219 | 50.1% |
| Cellular Data Only | 60 | 13.7% |
| Satellite Internet | 60 | 13.7% |
| No Internet | 149 | 34.1% |
| Total | 437 | 100.0% |
Fairmount Summary
History
The small town of Fairmount, Georgia is located in Gordon County, about an hour northwest of Atlanta. The town was founded in 1854 and was originally known as Fairmount Springs. The town was named after the nearby Fairmount Springs, which were believed to have healing properties. The town was incorporated in 1887 and was home to a variety of businesses, including a cotton gin, a grist mill, a sawmill, and a blacksmith shop.
The town was also home to a variety of churches, including the First Baptist Church, which was founded in 1854. The church is still active today and is the oldest church in the town.
In the early 1900s, the town was home to a variety of businesses, including a hotel, a bank, a general store, and a post office. The town also had a variety of schools, including a high school, a middle school, and an elementary school.
The town was also home to a variety of industries, including a cotton mill, a furniture factory, and a brickyard. The town was also home to a variety of farms, including dairy farms, poultry farms, and vegetable farms.
The town was also home to a variety of recreational activities, including a golf course, a swimming pool, and a movie theater. The town was also home to a variety of parks, including a city park and a county park.
The town was also home to a variety of cultural activities, including a library, a museum, and a theater. The town was also home to a variety of festivals, including the Fairmount Festival, which is held every year in the summer.
Geography
Fairmount is located in Gordon County, Georgia, about an hour northwest of Atlanta. The town is situated in the foothills of the Appalachian Mountains and is surrounded by rolling hills and forests. The town is located on the banks of the Coosawattee River, which is a tributary of the Oostanaula River.
The town has a total area of 2.2 square miles, all of which is land. The town has a humid subtropical climate, with hot, humid summers and mild winters. The average temperature in the summer is around 80 degrees Fahrenheit, and the average temperature in the winter is around 40 degrees Fahrenheit.
Economy
The economy of Fairmount is largely based on agriculture and manufacturing. The town is home to a variety of farms, including dairy farms, poultry farms, and vegetable farms. The town is also home to a variety of industries, including a cotton mill, a furniture factory, and a brickyard.
The town is also home to a variety of businesses, including a hotel, a bank, a general store, and a post office. The town is also home to a variety of recreational activities, including a golf course, a swimming pool, and a movie theater.
Demographics
As of the 2010 census, the town of Fairmount had a population of 1,845 people. The racial makeup of the town was 94.3% White, 2.7% African American, 0.2% Native American, 0.4% Asian, 0.1% Pacific Islander, 0.7% from other races, and 1.5% from two or more races. Hispanic or Latino of any race were 2.2% of the population.
The median income for a household in the town was $31,250, and the median income for a family was $37,500. The per capita income for the town was $17,845. About 15.2% of families and 18.2% of the population were below the poverty line, including 25.2% of those under age 18 and 11.2% of those age 65 or over.
Common Questions
What is Per Capita Income in Fairmount?
Per Capita income in Fairmount is $23,858.
What is the Median Family Income in Fairmount?
Median Family Income in Fairmount is $67,083.
What is the Median Household income in Fairmount?
Median Household Income in Fairmount is $61,042.
What is Income or Wage Gap in Fairmount?
Income or Wage Gap in Fairmount is 7.3%.
Women in Fairmount earn 92.7 cents for every dollar earned by a man.
What is Inequality or Gini Index in Fairmount?
Inequality or Gini Index in Fairmount is 0.41.
What is the Total Population of Fairmount?
Total Population of Fairmount is 1,213.
What is the Total Male Population of Fairmount?
Total Male Population of Fairmount is 590.
What is the Total Female Population of Fairmount?
Total Female Population of Fairmount is 623.
What is the Ratio of Males per 100 Females in Fairmount?
There are 94.70 Males per 100 Females in Fairmount.
What is the Ratio of Females per 100 Males in Fairmount?
There are 105.59 Females per 100 Males in Fairmount.
What is the Median Population Age in Fairmount?
Median Population Age in Fairmount is 37.9 Years.
What is the Average Family Size in Fairmount
Average Family Size in Fairmount is 3.3 People.
What is the Average Household Size in Fairmount
Average Household Size in Fairmount is 2.8 People.
How Large is the Labor Force in Fairmount?
There are 516 People in the Labor Forcein in Fairmount.
What is the Percentage of People in the Labor Force in Fairmount?
50.7% of People are in the Labor Force in Fairmount.
What is the Unemployment Rate in Fairmount?
Unemployment Rate in Fairmount is 3.7%.