Zip Codes with the Highest Percentage of Population Employed in Security & Protection in Marietta, GA
RELATED REPORTS & OPTIONS
Security & Protection
Marietta
Compare Zip Codes
Map of Zip Codes with the Highest Percentage of Population Employed in Security & Protection in Marietta
0.63%
2.3%
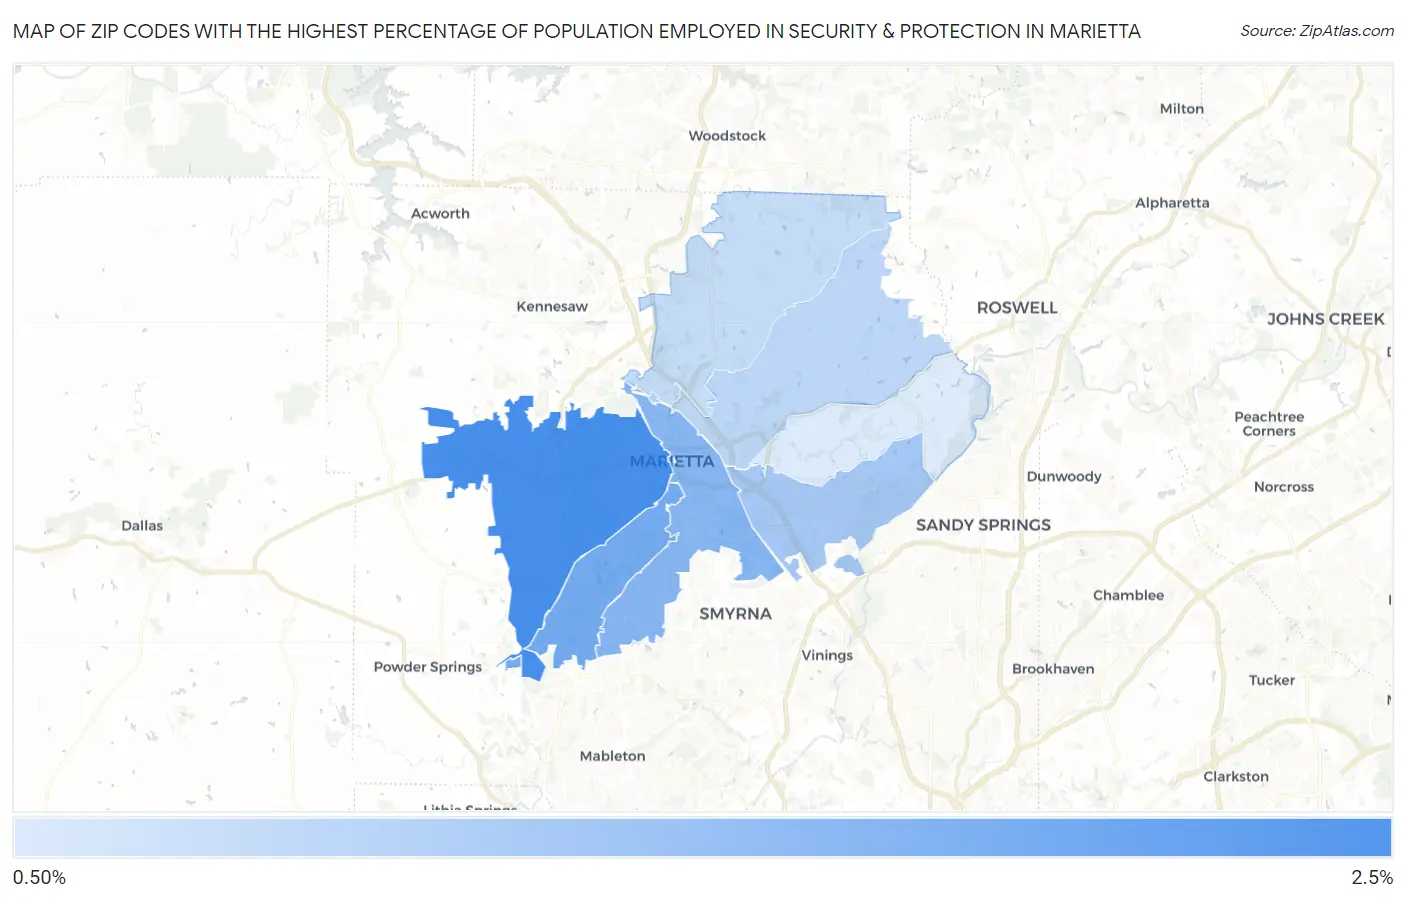
Zip Codes with the Highest Percentage of Population Employed in Security & Protection in Marietta, GA
| Zip Code | % Employed | vs State | vs National | |
| 1. | 30064 | 2.3% | 2.2% (+0.099)#315 | 2.1% (+0.122)#10,835 |
| 2. | 30008 | 1.8% | 2.2% (-0.416)#411 | 2.1% (-0.393)#14,260 |
| 3. | 30060 | 1.6% | 2.2% (-0.614)#440 | 2.1% (-0.591)#15,747 |
| 4. | 30067 | 1.2% | 2.2% (-0.947)#487 | 2.1% (-0.924)#18,320 |
| 5. | 30062 | 0.98% | 2.2% (-1.19)#529 | 2.1% (-1.16)#20,173 |
| 6. | 30066 | 0.87% | 2.2% (-1.30)#543 | 2.1% (-1.28)#20,956 |
| 7. | 30068 | 0.63% | 2.2% (-1.55)#572 | 2.1% (-1.52)#22,515 |
1
Common Questions
What are the Top 5 Zip Codes with the Highest Percentage of Population Employed in Security & Protection in Marietta, GA?
Top 5 Zip Codes with the Highest Percentage of Population Employed in Security & Protection in Marietta, GA are:
What zip code has the Highest Percentage of Population Employed in Security & Protection in Marietta, GA?
30064 has the Highest Percentage of Population Employed in Security & Protection in Marietta, GA with 2.3%.
What is the Percentage of Population Employed in Security & Protection in Marietta, GA?
Percentage of Population Employed in Security & Protection in Marietta is 2.1%.
What is the Percentage of Population Employed in Security & Protection in Georgia?
Percentage of Population Employed in Security & Protection in Georgia is 2.2%.
What is the Percentage of Population Employed in Security & Protection in the United States?
Percentage of Population Employed in Security & Protection in the United States is 2.1%.