Winder, GA Map & Demographics
Winder Map
Winder Overview
$28,458
PER CAPITA INCOME
$68,093
AVG FAMILY INCOME
$57,365
AVG HOUSEHOLD INCOME
9.3%
WAGE / INCOME GAP [ % ]
90.7¢/ $1
WAGE / INCOME GAP [ $ ]
$13,626
FAMILY INCOME DEFICIT
0.43
INEQUALITY / GINI INDEX
18,414
TOTAL POPULATION
8,829
MALE POPULATION
9,585
FEMALE POPULATION
92.11
MALES / 100 FEMALES
108.56
FEMALES / 100 MALES
36.4
MEDIAN AGE
3.2
AVG FAMILY SIZE
2.7
AVG HOUSEHOLD SIZE
9,189
LABOR FORCE [ PEOPLE ]
64.5%
PERCENT IN LABOR FORCE
5.8%
UNEMPLOYMENT RATE
Winder Zip Codes
Income in Winder
Income Overview in Winder
Per Capita Income in Winder is $28,458, while median incomes of families and households are $68,093 and $57,365 respectively.
| Characteristic | Number | Measure |
| Per Capita Income | 18,414 | $28,458 |
| Median Family Income | 4,577 | $68,093 |
| Mean Family Income | 4,577 | $84,486 |
| Median Household Income | 6,762 | $57,365 |
| Mean Household Income | 6,762 | $75,856 |
| Income Deficit | 4,577 | $13,626 |
| Wage / Income Gap (%) | 18,414 | 9.26% |
| Wage / Income Gap ($) | 18,414 | 90.74¢ per $1 |
| Gini / Inequality Index | 18,414 | 0.43 |
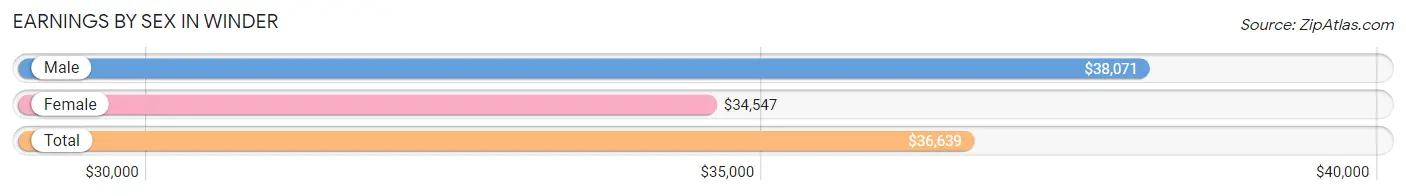
Earnings by Sex in Winder
Average Earnings in Winder are $36,639, $38,071 for men and $34,547 for women, a difference of 9.3%.
| Sex | Number | Average Earnings |
| Male | 4,962 (53.0%) | $38,071 |
| Female | 4,404 (47.0%) | $34,547 |
| Total | 9,366 (100.0%) | $36,639 |
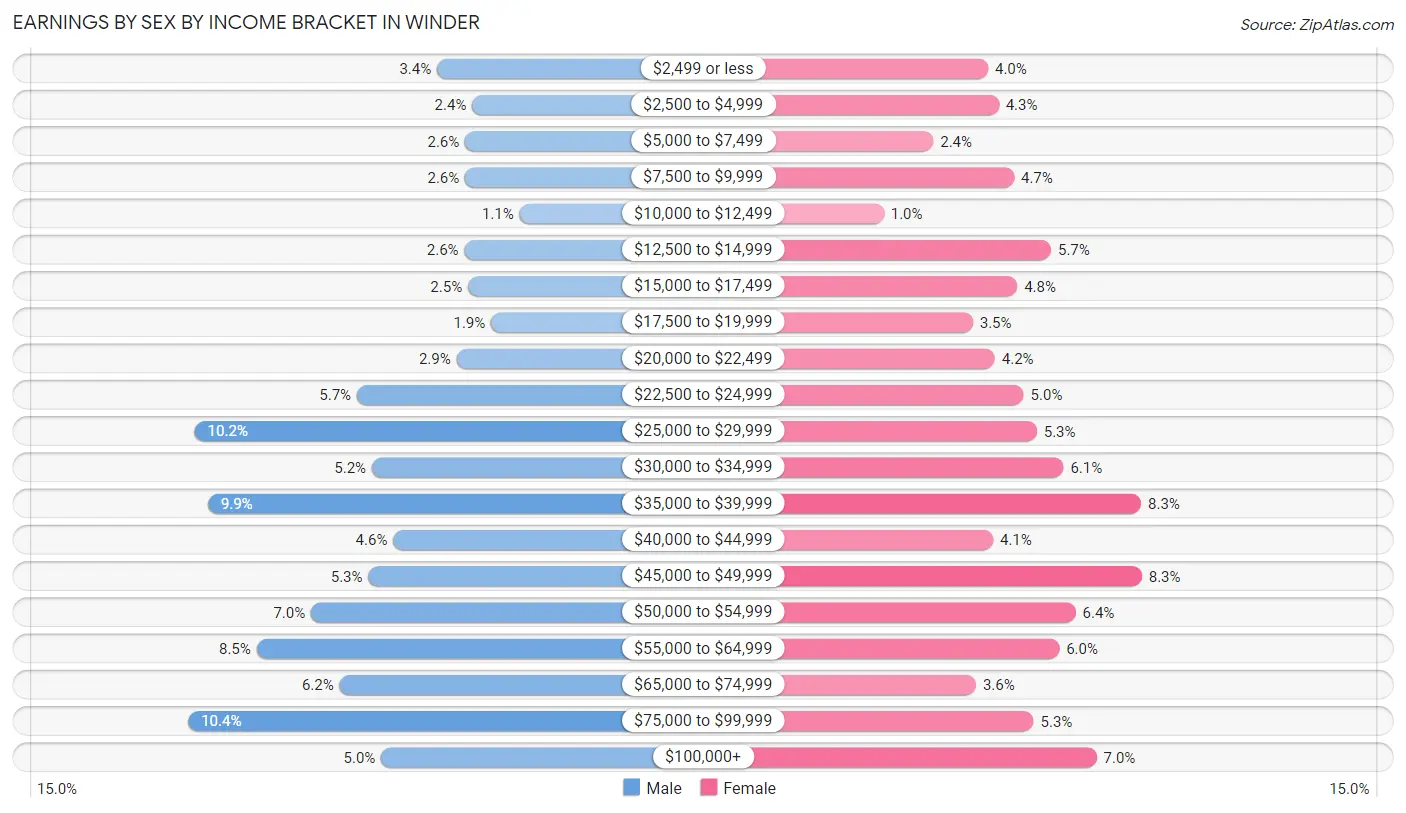
Earnings by Sex by Income Bracket in Winder
The most common earnings brackets in Winder are $75,000 to $99,999 for men (516 | 10.4%) and $45,000 to $49,999 for women (365 | 8.3%).
| Income | Male | Female |
| $2,499 or less | 169 (3.4%) | 175 (4.0%) |
| $2,500 to $4,999 | 120 (2.4%) | 188 (4.3%) |
| $5,000 to $7,499 | 130 (2.6%) | 107 (2.4%) |
| $7,500 to $9,999 | 130 (2.6%) | 207 (4.7%) |
| $10,000 to $12,499 | 54 (1.1%) | 46 (1.0%) |
| $12,500 to $14,999 | 131 (2.6%) | 253 (5.7%) |
| $15,000 to $17,499 | 126 (2.5%) | 211 (4.8%) |
| $17,500 to $19,999 | 94 (1.9%) | 156 (3.5%) |
| $20,000 to $22,499 | 142 (2.9%) | 183 (4.2%) |
| $22,500 to $24,999 | 281 (5.7%) | 219 (5.0%) |
| $25,000 to $29,999 | 507 (10.2%) | 235 (5.3%) |
| $30,000 to $34,999 | 260 (5.2%) | 268 (6.1%) |
| $35,000 to $39,999 | 489 (9.9%) | 364 (8.3%) |
| $40,000 to $44,999 | 230 (4.6%) | 181 (4.1%) |
| $45,000 to $49,999 | 265 (5.3%) | 365 (8.3%) |
| $50,000 to $54,999 | 345 (7.0%) | 283 (6.4%) |
| $55,000 to $64,999 | 421 (8.5%) | 263 (6.0%) |
| $65,000 to $74,999 | 305 (6.1%) | 160 (3.6%) |
| $75,000 to $99,999 | 516 (10.4%) | 231 (5.2%) |
| $100,000+ | 247 (5.0%) | 309 (7.0%) |
| Total | 4,962 (100.0%) | 4,404 (100.0%) |
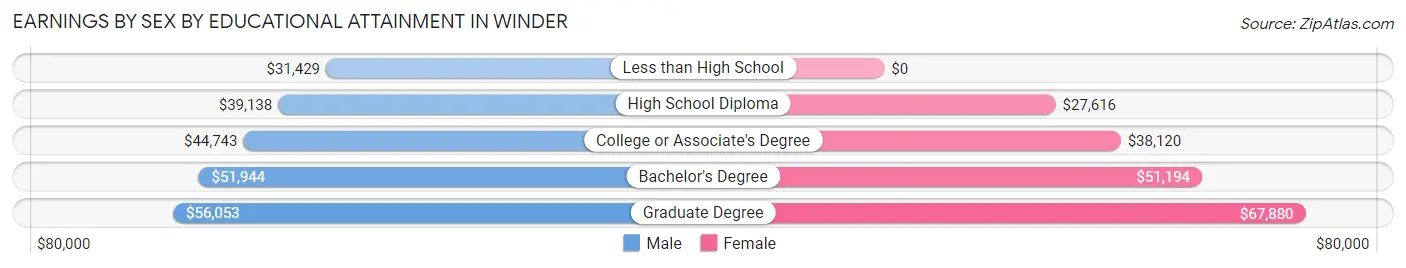
Earnings by Sex by Educational Attainment in Winder
Average earnings in Winder are $41,103 for men and $38,408 for women, a difference of 6.6%. Men with an educational attainment of graduate degree enjoy the highest average annual earnings of $56,053, while those with less than high school education earn the least with $31,429. Women with an educational attainment of graduate degree earn the most with the average annual earnings of $67,880, while those with high school diploma education have the smallest earnings of $27,616.
| Educational Attainment | Male Income | Female Income |
| Less than High School | $31,429 | $0 |
| High School Diploma | $39,138 | $27,616 |
| College or Associate's Degree | $44,743 | $38,120 |
| Bachelor's Degree | $51,944 | $51,194 |
| Graduate Degree | $56,053 | $67,880 |
| Total | $41,103 | $38,408 |
Family Income in Winder
Family Income Brackets in Winder
According to the Winder family income data, there are 966 families falling into the $50,000 to $74,999 income range, which is the most common income bracket and makes up 21.1% of all families. Conversely, the $10,000 to $14,999 income bracket is the least frequent group with only 188 families (4.1%) belonging to this category.
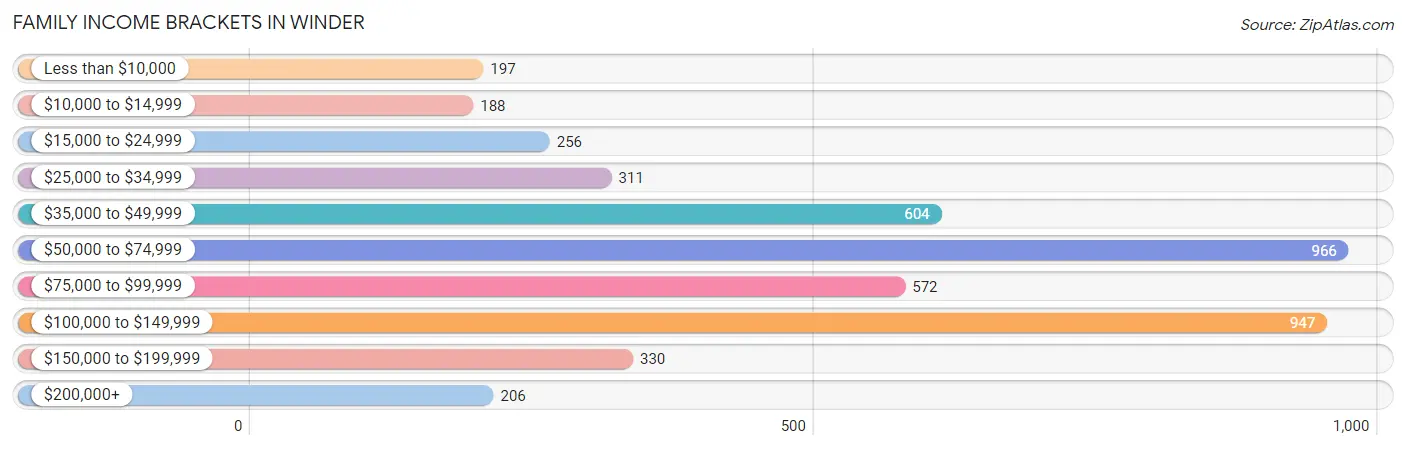
| Income Bracket | # Families | % Families |
| Less than $10,000 | 197 | 4.3% |
| $10,000 to $14,999 | 188 | 4.1% |
| $15,000 to $24,999 | 256 | 5.6% |
| $25,000 to $34,999 | 311 | 6.8% |
| $35,000 to $49,999 | 604 | 13.2% |
| $50,000 to $74,999 | 966 | 21.1% |
| $75,000 to $99,999 | 572 | 12.5% |
| $100,000 to $149,999 | 947 | 20.7% |
| $150,000 to $199,999 | 330 | 7.2% |
| $200,000+ | 206 | 4.5% |
Family Income by Famaliy Size in Winder
7+ person families (95 | 2.1%) account for the highest median family income in Winder with $116,406 per family, while 2-person families (1,927 | 42.1%) have the highest median income of $31,162 per family member.
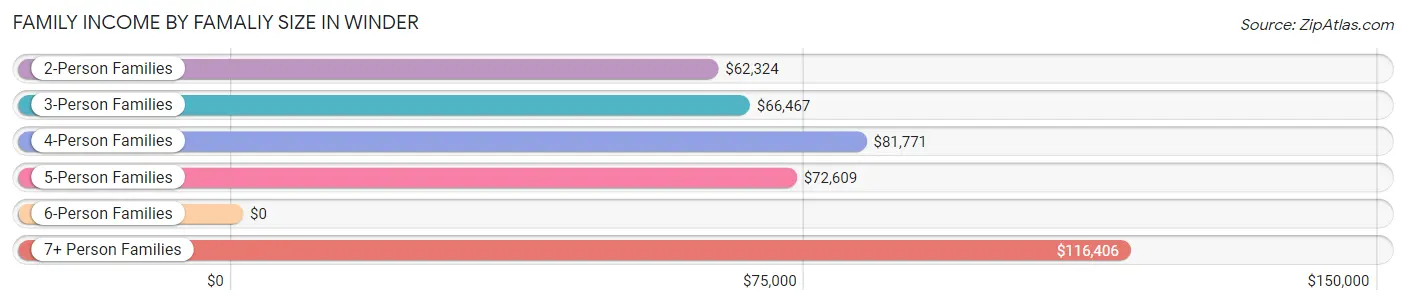
| Income Bracket | # Families | Median Income |
| 2-Person Families | 1,927 (42.1%) | $62,324 |
| 3-Person Families | 1,017 (22.2%) | $66,467 |
| 4-Person Families | 797 (17.4%) | $81,771 |
| 5-Person Families | 628 (13.7%) | $72,609 |
| 6-Person Families | 113 (2.5%) | $0 |
| 7+ Person Families | 95 (2.1%) | $116,406 |
| Total | 4,577 (100.0%) | $68,093 |
Family Income by Number of Earners in Winder
The median family income in Winder is $68,093, with families comprising 2 earners (1,772) having the highest median family income of $101,792, while families with no earners (714) have the lowest median family income of $35,946, accounting for 38.7% and 15.6% of families, respectively.
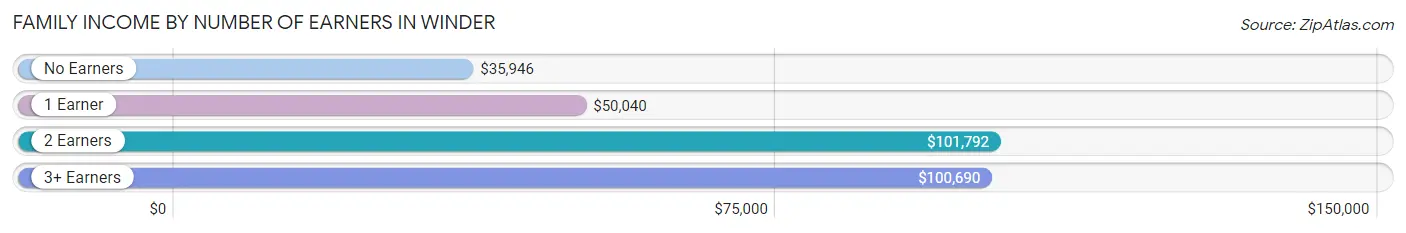
| Number of Earners | # Families | Median Income |
| No Earners | 714 (15.6%) | $35,946 |
| 1 Earner | 1,535 (33.5%) | $50,040 |
| 2 Earners | 1,772 (38.7%) | $101,792 |
| 3+ Earners | 556 (12.1%) | $100,690 |
| Total | 4,577 (100.0%) | $68,093 |
Household Income in Winder
Household Income Brackets in Winder
With 1,271 households falling in the category, the $50,000 to $74,999 income range is the most frequent in Winder, accounting for 18.8% of all households. In contrast, only 270 households (4.0%) fall into the $200,000+ income bracket, making it the least populous group.
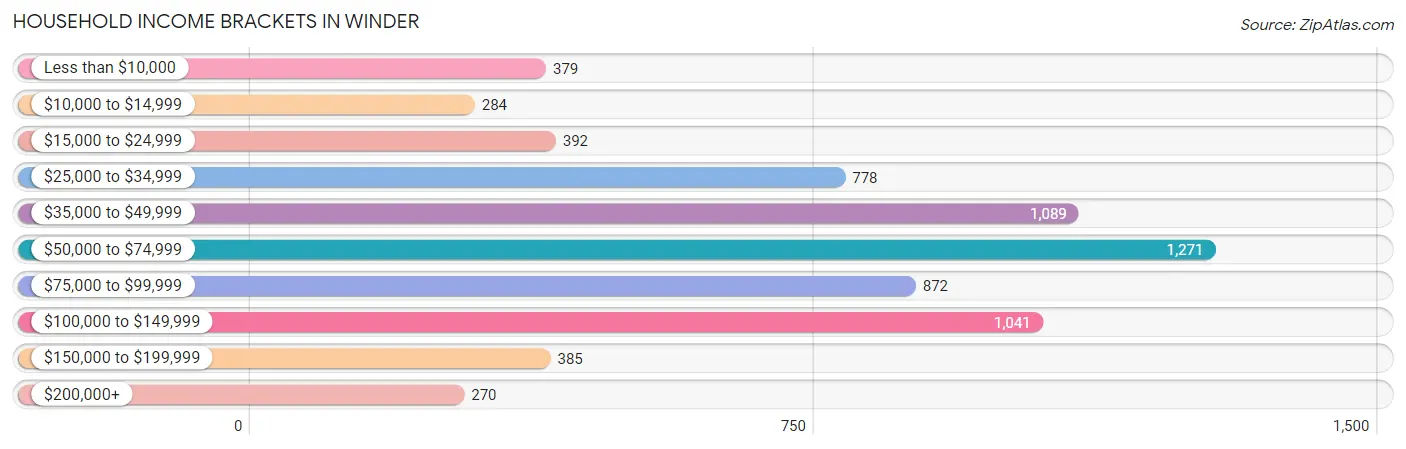
| Income Bracket | # Households | % Households |
| Less than $10,000 | 379 | 5.6% |
| $10,000 to $14,999 | 284 | 4.2% |
| $15,000 to $24,999 | 392 | 5.8% |
| $25,000 to $34,999 | 778 | 11.5% |
| $35,000 to $49,999 | 1,089 | 16.1% |
| $50,000 to $74,999 | 1,271 | 18.8% |
| $75,000 to $99,999 | 872 | 12.9% |
| $100,000 to $149,999 | 1,041 | 15.4% |
| $150,000 to $199,999 | 385 | 5.7% |
| $200,000+ | 270 | 4.0% |
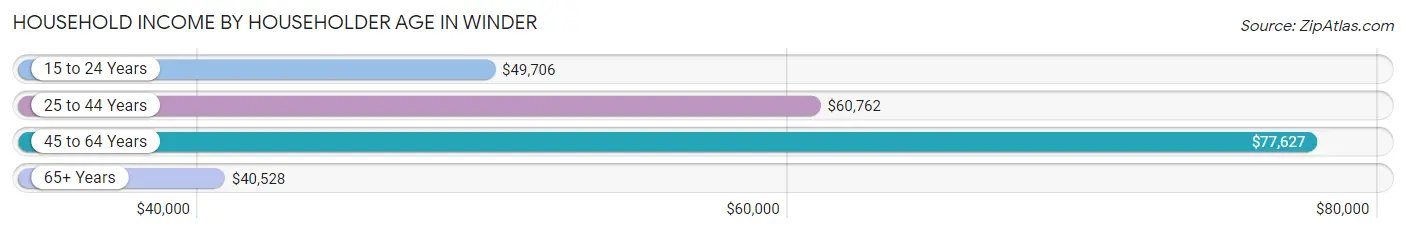
Household Income by Householder Age in Winder
The median household income in Winder is $57,365, with the highest median household income of $77,627 found in the 45 to 64 years age bracket for the primary householder. A total of 2,295 households (33.9%) fall into this category. Meanwhile, the 65+ years age bracket for the primary householder has the lowest median household income of $40,528, with 1,616 households (23.9%) in this group.
| Income Bracket | # Households | Median Income |
| 15 to 24 Years | 202 (3.0%) | $49,706 |
| 25 to 44 Years | 2,649 (39.2%) | $60,762 |
| 45 to 64 Years | 2,295 (33.9%) | $77,627 |
| 65+ Years | 1,616 (23.9%) | $40,528 |
| Total | 6,762 (100.0%) | $57,365 |
Poverty in Winder
Income Below Poverty by Sex and Age in Winder
With 12.7% poverty level for males and 15.5% for females among the residents of Winder, 16 and 17 year old males and 12 to 14 year old females are the most vulnerable to poverty, with 45 males (33.1%) and 93 females (27.6%) in their respective age groups living below the poverty level.
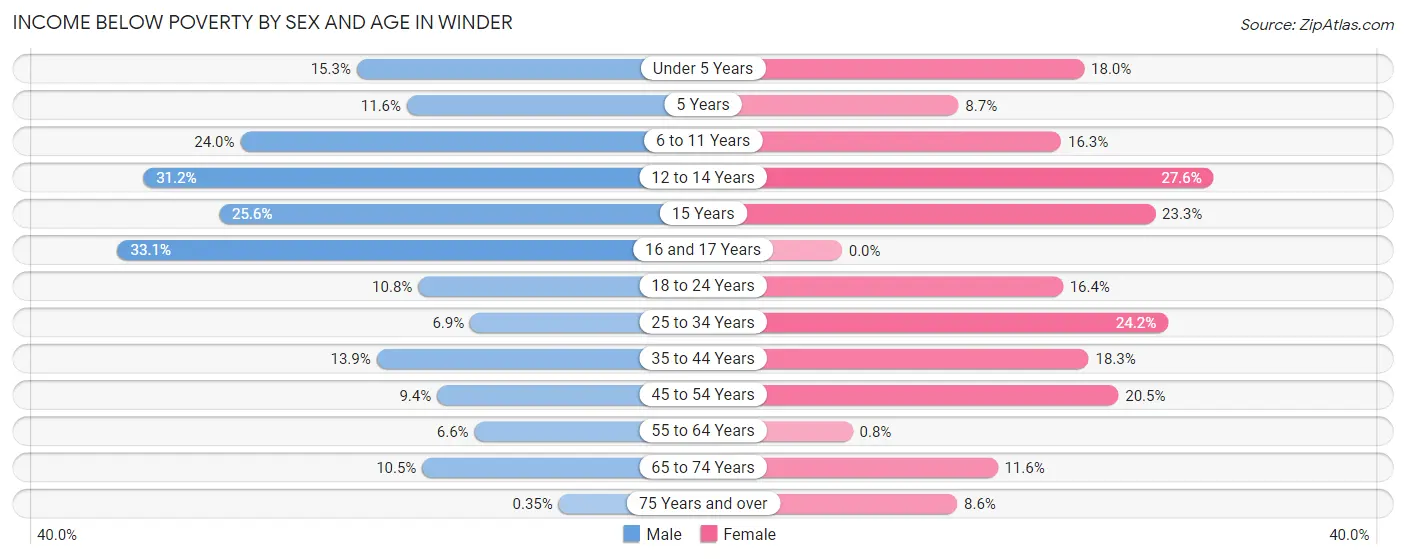
| Age Bracket | Male | Female |
| Under 5 Years | 75 (15.3%) | 109 (18.0%) |
| 5 Years | 23 (11.6%) | 20 (8.7%) |
| 6 to 11 Years | 170 (24.0%) | 133 (16.3%) |
| 12 to 14 Years | 121 (31.2%) | 93 (27.6%) |
| 15 Years | 57 (25.6%) | 10 (23.3%) |
| 16 and 17 Years | 45 (33.1%) | 0 (0.0%) |
| 18 to 24 Years | 83 (10.8%) | 113 (16.4%) |
| 25 to 34 Years | 90 (6.9%) | 326 (24.2%) |
| 35 to 44 Years | 202 (13.9%) | 250 (18.3%) |
| 45 to 54 Years | 97 (9.4%) | 249 (20.5%) |
| 55 to 64 Years | 65 (6.6%) | 8 (0.8%) |
| 65 to 74 Years | 70 (10.5%) | 101 (11.6%) |
| 75 Years and over | 1 (0.4%) | 48 (8.6%) |
| Total | 1,099 (12.7%) | 1,460 (15.5%) |
Income Above Poverty by Sex and Age in Winder
According to the poverty statistics in Winder, males aged 75 years and over and females aged 16 and 17 years are the age groups that are most secure financially, with 99.7% of males and 100.0% of females in these age groups living above the poverty line.
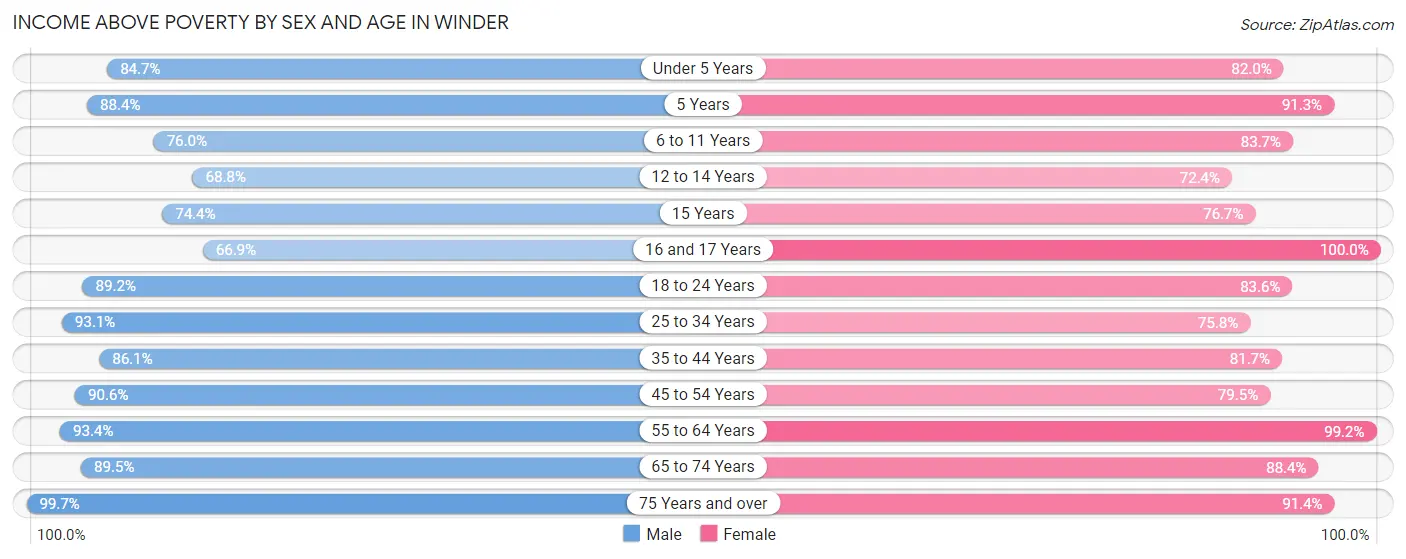
| Age Bracket | Male | Female |
| Under 5 Years | 414 (84.7%) | 497 (82.0%) |
| 5 Years | 175 (88.4%) | 211 (91.3%) |
| 6 to 11 Years | 539 (76.0%) | 684 (83.7%) |
| 12 to 14 Years | 267 (68.8%) | 244 (72.4%) |
| 15 Years | 166 (74.4%) | 33 (76.7%) |
| 16 and 17 Years | 91 (66.9%) | 363 (100.0%) |
| 18 to 24 Years | 687 (89.2%) | 576 (83.6%) |
| 25 to 34 Years | 1,209 (93.1%) | 1,020 (75.8%) |
| 35 to 44 Years | 1,254 (86.1%) | 1,115 (81.7%) |
| 45 to 54 Years | 937 (90.6%) | 964 (79.5%) |
| 55 to 64 Years | 920 (93.4%) | 989 (99.2%) |
| 65 to 74 Years | 598 (89.5%) | 773 (88.4%) |
| 75 Years and over | 286 (99.7%) | 513 (91.4%) |
| Total | 7,543 (87.3%) | 7,982 (84.5%) |
Income Below Poverty Among Married-Couple Families in Winder
The poverty statistics for married-couple families in Winder show that 1.1% or 35 of the total 3,098 families live below the poverty line. Families with no children have the highest poverty rate of 2.1%, comprising of 35 families. On the other hand, families with 1 or 2 children have the lowest poverty rate of 0.0%, which includes 0 families.
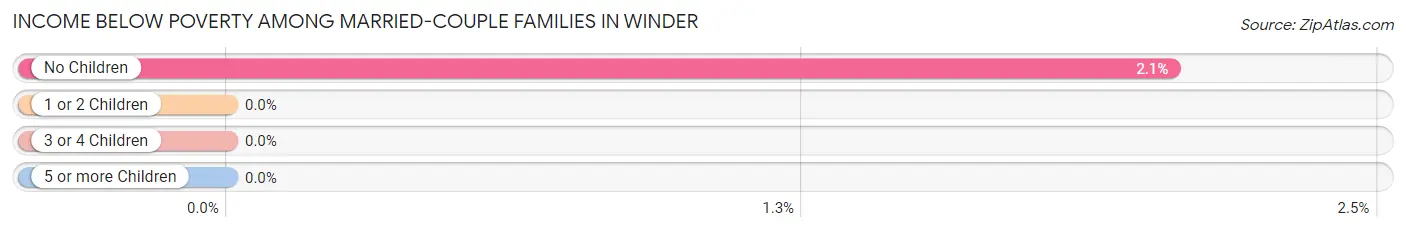
| Children | Above Poverty | Below Poverty |
| No Children | 1,669 (98.0%) | 35 (2.1%) |
| 1 or 2 Children | 1,004 (100.0%) | 0 (0.0%) |
| 3 or 4 Children | 340 (100.0%) | 0 (0.0%) |
| 5 or more Children | 50 (100.0%) | 0 (0.0%) |
| Total | 3,063 (98.9%) | 35 (1.1%) |
Income Below Poverty Among Single-Parent Households in Winder
According to the poverty data in Winder, 30.1% or 128 single-father households and 34.8% or 367 single-mother households are living below the poverty line. Among single-father households, those with 5 or more children have the highest poverty rate, with 40 households (100.0%) experiencing poverty. Likewise, among single-mother households, those with 3 or 4 children have the highest poverty rate, with 86 households (50.3%) falling below the poverty line.
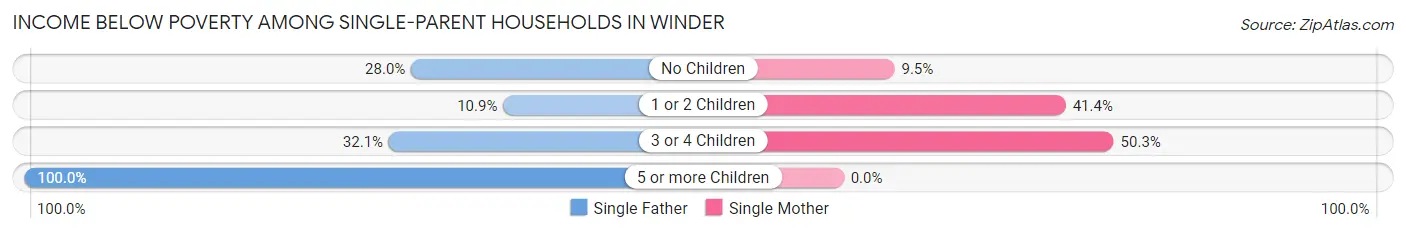
| Children | Single Father | Single Mother |
| No Children | 56 (28.0%) | 25 (9.5%) |
| 1 or 2 Children | 14 (10.8%) | 256 (41.4%) |
| 3 or 4 Children | 18 (32.1%) | 86 (50.3%) |
| 5 or more Children | 40 (100.0%) | 0 (0.0%) |
| Total | 128 (30.1%) | 367 (34.8%) |
Income Below Poverty Among Married-Couple vs Single-Parent Households in Winder
The poverty data for Winder shows that 35 of the married-couple family households (1.1%) and 495 of the single-parent households (33.5%) are living below the poverty level. Within the married-couple family households, those with no children have the highest poverty rate, with 35 households (2.1%) falling below the poverty line. Among the single-parent households, those with 5 or more children have the highest poverty rate, with 40 household (100.0%) living below poverty.
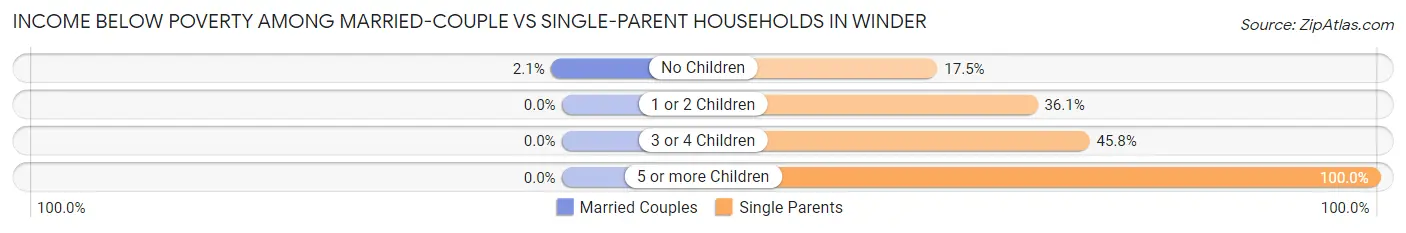
| Children | Married-Couple Families | Single-Parent Households |
| No Children | 35 (2.1%) | 81 (17.5%) |
| 1 or 2 Children | 0 (0.0%) | 270 (36.1%) |
| 3 or 4 Children | 0 (0.0%) | 104 (45.8%) |
| 5 or more Children | 0 (0.0%) | 40 (100.0%) |
| Total | 35 (1.1%) | 495 (33.5%) |
Race in Winder
The most populous races in Winder are White / Caucasian (11,171 | 60.7%), Black / African American (3,786 | 20.6%), and Hispanic or Latino (2,822 | 15.3%).
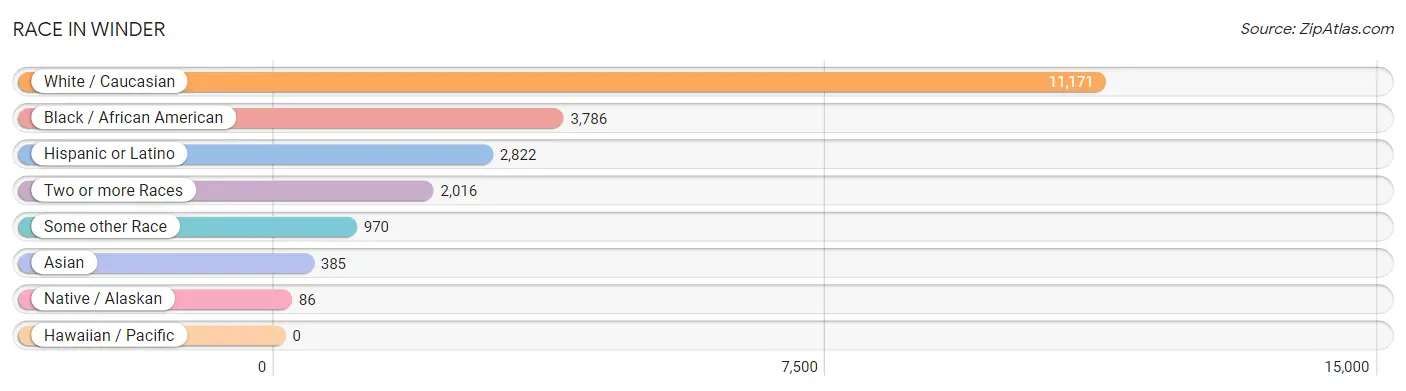
| Race | # Population | % Population |
| Asian | 385 | 2.1% |
| Black / African American | 3,786 | 20.6% |
| Hawaiian / Pacific | 0 | 0.0% |
| Hispanic or Latino | 2,822 | 15.3% |
| Native / Alaskan | 86 | 0.5% |
| White / Caucasian | 11,171 | 60.7% |
| Two or more Races | 2,016 | 11.0% |
| Some other Race | 970 | 5.3% |
| Total | 18,414 | 100.0% |
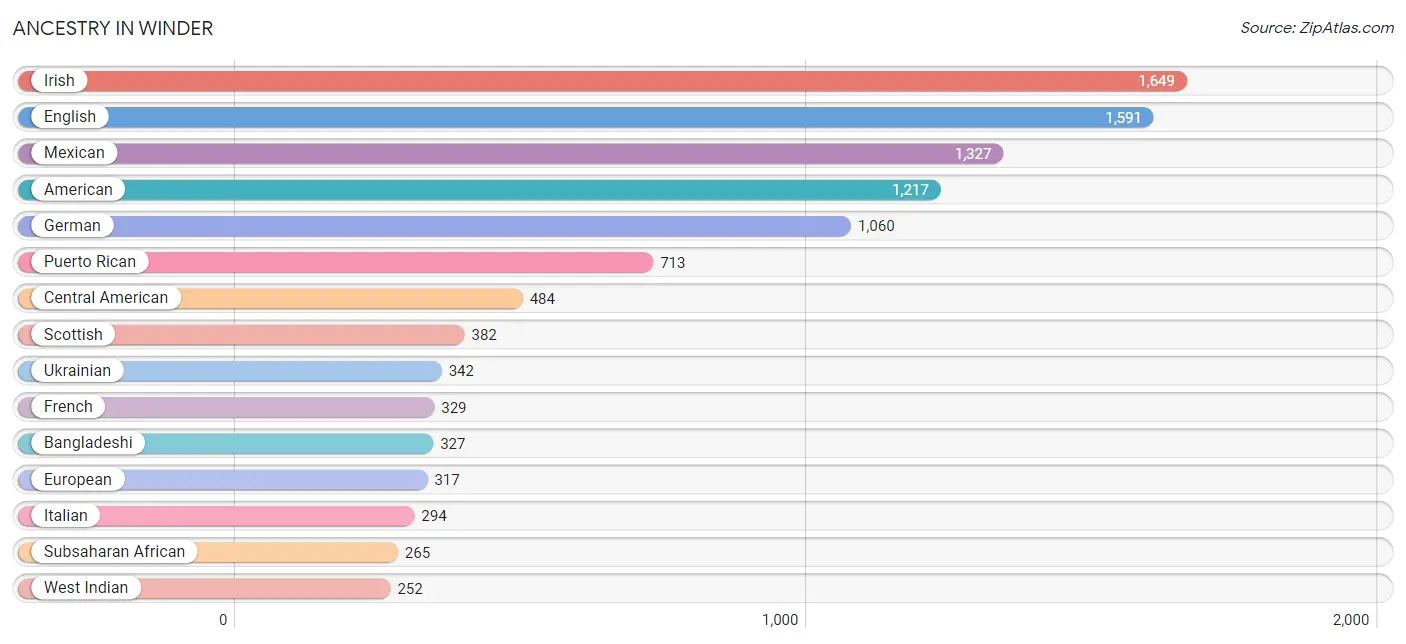
Ancestry in Winder
The most populous ancestries reported in Winder are Irish (1,649 | 9.0%), English (1,591 | 8.6%), Mexican (1,327 | 7.2%), American (1,217 | 6.6%), and German (1,060 | 5.8%), together accounting for 37.2% of all Winder residents.
| Ancestry | # Population | % Population |
| African | 141 | 0.8% |
| American | 1,217 | 6.6% |
| Argentinean | 14 | 0.1% |
| Bangladeshi | 327 | 1.8% |
| Bhutanese | 31 | 0.2% |
| British | 61 | 0.3% |
| Central American | 484 | 2.6% |
| Central American Indian | 124 | 0.7% |
| Cherokee | 5 | 0.0% |
| Colombian | 29 | 0.2% |
| Cuban | 52 | 0.3% |
| Czech | 22 | 0.1% |
| Danish | 21 | 0.1% |
| Dominican | 131 | 0.7% |
| Dutch | 35 | 0.2% |
| Ecuadorian | 10 | 0.1% |
| English | 1,591 | 8.6% |
| European | 317 | 1.7% |
| Finnish | 10 | 0.1% |
| French | 329 | 1.8% |
| French Canadian | 22 | 0.1% |
| German | 1,060 | 5.8% |
| Guatemalan | 227 | 1.2% |
| Guyanese | 4 | 0.0% |
| Honduran | 225 | 1.2% |
| Hungarian | 15 | 0.1% |
| Indian (Asian) | 6 | 0.0% |
| Irish | 1,649 | 9.0% |
| Italian | 294 | 1.6% |
| Jamaican | 85 | 0.5% |
| Japanese | 6 | 0.0% |
| Korean | 28 | 0.2% |
| Latvian | 12 | 0.1% |
| Lithuanian | 33 | 0.2% |
| Malaysian | 15 | 0.1% |
| Mexican | 1,327 | 7.2% |
| Mexican American Indian | 82 | 0.4% |
| Nicaraguan | 32 | 0.2% |
| Nigerian | 44 | 0.2% |
| Northern European | 11 | 0.1% |
| Norwegian | 60 | 0.3% |
| Pennsylvania German | 3 | 0.0% |
| Polish | 191 | 1.0% |
| Portuguese | 19 | 0.1% |
| Puerto Rican | 713 | 3.9% |
| Russian | 57 | 0.3% |
| Samoan | 5 | 0.0% |
| Scandinavian | 32 | 0.2% |
| Scotch-Irish | 181 | 1.0% |
| Scottish | 382 | 2.1% |
| Slovak | 8 | 0.0% |
| South American | 87 | 0.5% |
| Sri Lankan | 19 | 0.1% |
| Subsaharan African | 265 | 1.4% |
| Swedish | 17 | 0.1% |
| Thai | 4 | 0.0% |
| Trinidadian and Tobagonian | 125 | 0.7% |
| Ukrainian | 342 | 1.9% |
| Uruguayan | 13 | 0.1% |
| Venezuelan | 21 | 0.1% |
| Welsh | 69 | 0.4% |
| West Indian | 252 | 1.4% | View All 62 Rows |
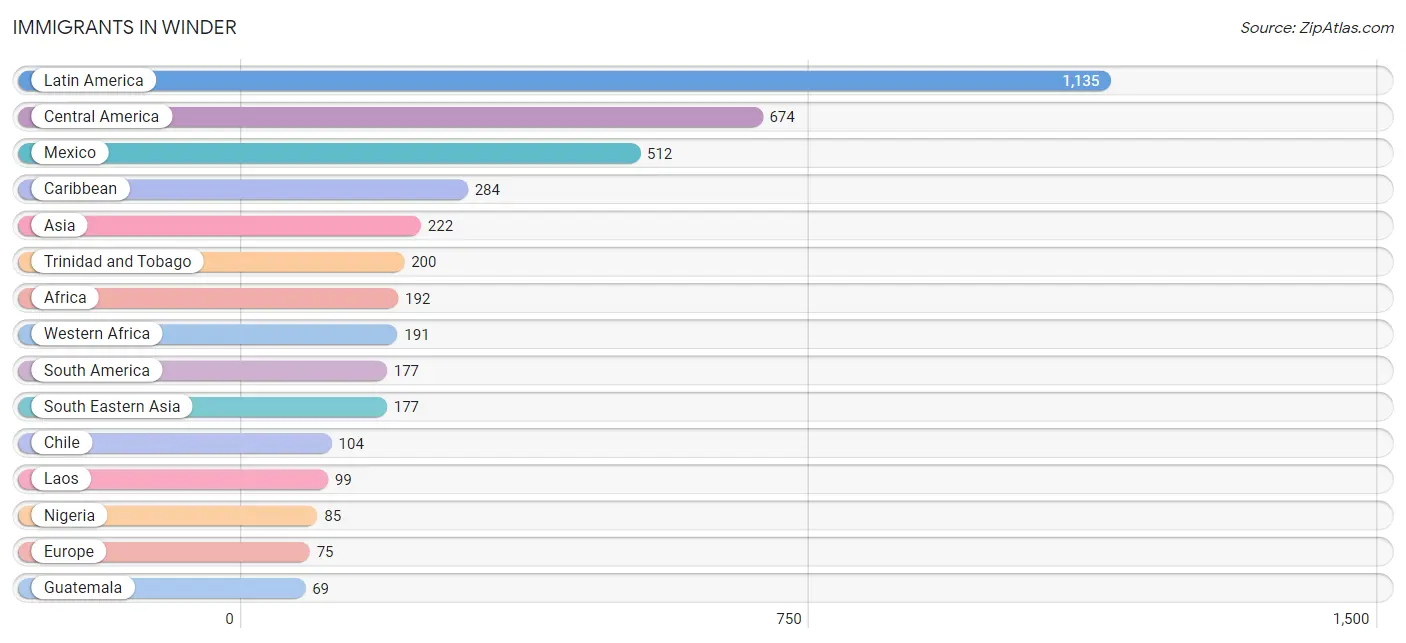
Immigrants in Winder
The most numerous immigrant groups reported in Winder came from Latin America (1,135 | 6.2%), Central America (674 | 3.7%), Mexico (512 | 2.8%), Caribbean (284 | 1.5%), and Asia (222 | 1.2%), together accounting for 15.3% of all Winder residents.
| Immigration Origin | # Population | % Population |
| Africa | 192 | 1.0% |
| Asia | 222 | 1.2% |
| Bosnia and Herzegovina | 10 | 0.1% |
| Canada | 37 | 0.2% |
| Caribbean | 284 | 1.5% |
| Central America | 674 | 3.7% |
| Chile | 104 | 0.6% |
| Colombia | 29 | 0.2% |
| Cuba | 21 | 0.1% |
| Eastern Africa | 1 | 0.0% |
| Eastern Europe | 50 | 0.3% |
| Ecuador | 10 | 0.1% |
| England | 8 | 0.0% |
| Europe | 75 | 0.4% |
| Ghana | 37 | 0.2% |
| Guatemala | 69 | 0.4% |
| Honduras | 61 | 0.3% |
| Jamaica | 19 | 0.1% |
| Kazakhstan | 45 | 0.2% |
| Laos | 99 | 0.5% |
| Latin America | 1,135 | 6.2% |
| Mexico | 512 | 2.8% |
| Nicaragua | 32 | 0.2% |
| Nigeria | 85 | 0.5% |
| Northern Europe | 8 | 0.0% |
| Philippines | 10 | 0.1% |
| Poland | 18 | 0.1% |
| South America | 177 | 1.0% |
| South Central Asia | 45 | 0.2% |
| South Eastern Asia | 177 | 1.0% |
| Southern Europe | 17 | 0.1% |
| Spain | 17 | 0.1% |
| Thailand | 60 | 0.3% |
| Trinidad and Tobago | 200 | 1.1% |
| Ukraine | 22 | 0.1% |
| Uruguay | 13 | 0.1% |
| Venezuela | 21 | 0.1% |
| Vietnam | 8 | 0.0% |
| West Indies | 44 | 0.2% |
| Western Africa | 191 | 1.0% | View All 40 Rows |
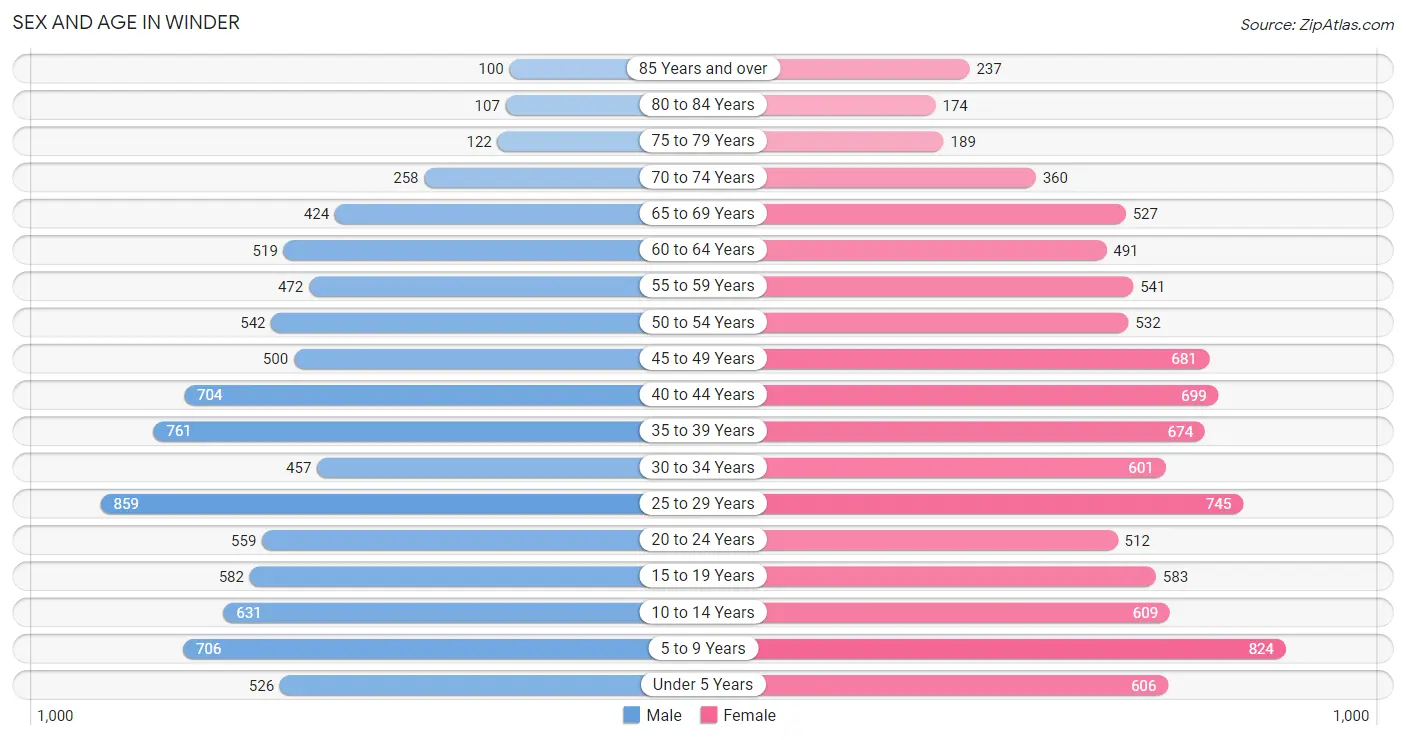
Sex and Age in Winder
Sex and Age in Winder
The most populous age groups in Winder are 25 to 29 Years (859 | 9.7%) for men and 5 to 9 Years (824 | 8.6%) for women.
| Age Bracket | Male | Female |
| Under 5 Years | 526 (6.0%) | 606 (6.3%) |
| 5 to 9 Years | 706 (8.0%) | 824 (8.6%) |
| 10 to 14 Years | 631 (7.1%) | 609 (6.4%) |
| 15 to 19 Years | 582 (6.6%) | 583 (6.1%) |
| 20 to 24 Years | 559 (6.3%) | 512 (5.3%) |
| 25 to 29 Years | 859 (9.7%) | 745 (7.8%) |
| 30 to 34 Years | 457 (5.2%) | 601 (6.3%) |
| 35 to 39 Years | 761 (8.6%) | 674 (7.0%) |
| 40 to 44 Years | 704 (8.0%) | 699 (7.3%) |
| 45 to 49 Years | 500 (5.7%) | 681 (7.1%) |
| 50 to 54 Years | 542 (6.1%) | 532 (5.6%) |
| 55 to 59 Years | 472 (5.3%) | 541 (5.6%) |
| 60 to 64 Years | 519 (5.9%) | 491 (5.1%) |
| 65 to 69 Years | 424 (4.8%) | 527 (5.5%) |
| 70 to 74 Years | 258 (2.9%) | 360 (3.8%) |
| 75 to 79 Years | 122 (1.4%) | 189 (2.0%) |
| 80 to 84 Years | 107 (1.2%) | 174 (1.8%) |
| 85 Years and over | 100 (1.1%) | 237 (2.5%) |
| Total | 8,829 (100.0%) | 9,585 (100.0%) |
Families and Households in Winder
Median Family Size in Winder
The median family size in Winder is 3.19 persons per family, with single female/mother families (1,054 | 23.0%) accounting for the largest median family size of 3.23 persons per family. On the other hand, married-couple families (3,098 | 67.7%) represent the smallest median family size with 3.17 persons per family.

| Family Type | # Families | Family Size |
| Married-Couple | 3,098 (67.7%) | 3.17 |
| Single Male/Father | 425 (9.3%) | 3.19 |
| Single Female/Mother | 1,054 (23.0%) | 3.23 |
| Total Families | 4,577 (100.0%) | 3.19 |
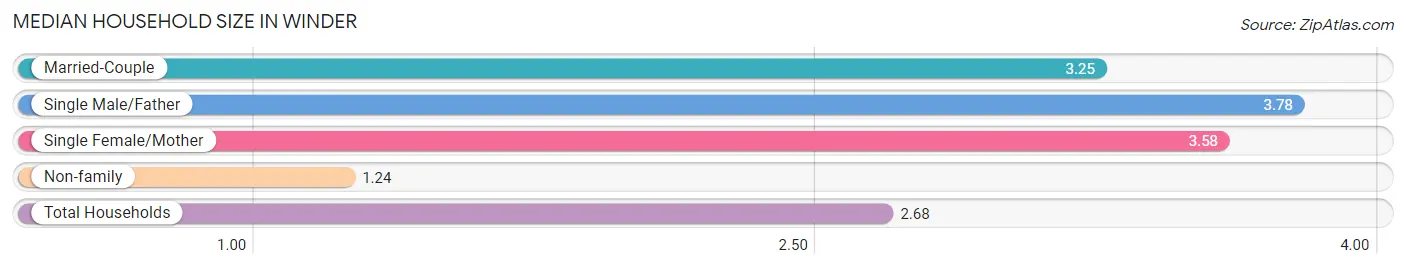
Median Household Size in Winder
The median household size in Winder is 2.68 persons per household, with single male/father households (425 | 6.3%) accounting for the largest median household size of 3.78 persons per household. non-family households (2,185 | 32.3%) represent the smallest median household size with 1.24 persons per household.
| Household Type | # Households | Household Size |
| Married-Couple | 3,098 (45.8%) | 3.25 |
| Single Male/Father | 425 (6.3%) | 3.78 |
| Single Female/Mother | 1,054 (15.6%) | 3.58 |
| Non-family | 2,185 (32.3%) | 1.24 |
| Total Households | 6,762 (100.0%) | 2.68 |
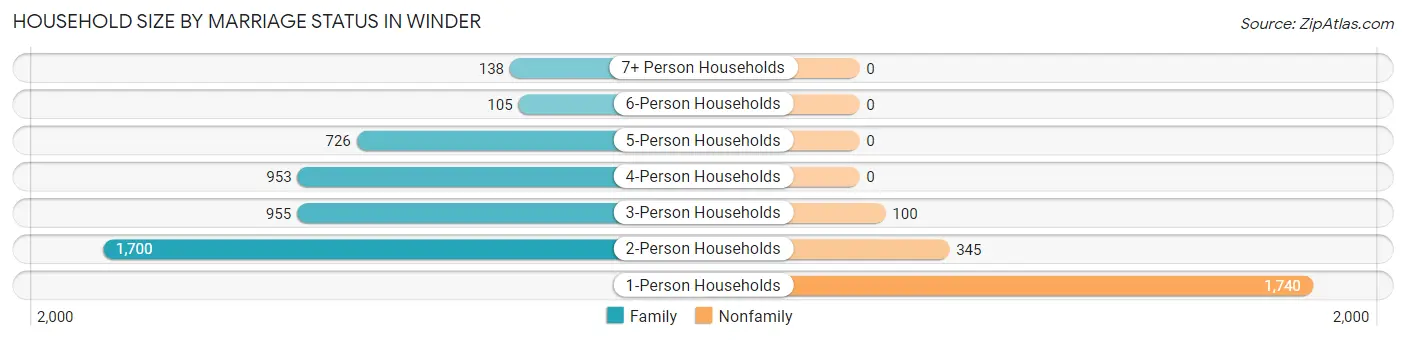
Household Size by Marriage Status in Winder
Out of a total of 6,762 households in Winder, 4,577 (67.7%) are family households, while 2,185 (32.3%) are nonfamily households. The most numerous type of family households are 2-person households, comprising 1,700, and the most common type of nonfamily households are 1-person households, comprising 1,740.
| Household Size | Family Households | Nonfamily Households |
| 1-Person Households | - | 1,740 (25.7%) |
| 2-Person Households | 1,700 (25.1%) | 345 (5.1%) |
| 3-Person Households | 955 (14.1%) | 100 (1.5%) |
| 4-Person Households | 953 (14.1%) | 0 (0.0%) |
| 5-Person Households | 726 (10.7%) | 0 (0.0%) |
| 6-Person Households | 105 (1.5%) | 0 (0.0%) |
| 7+ Person Households | 138 (2.0%) | 0 (0.0%) |
| Total | 4,577 (67.7%) | 2,185 (32.3%) |
Female Fertility in Winder
Fertility by Age in Winder
Average fertility rate in Winder is 37.0 births per 1,000 women. Women in the age bracket of 20 to 34 years have the highest fertility rate with 90.0 births per 1,000 women. Women in the age bracket of 20 to 34 years acount for 100.0% of all women with births.
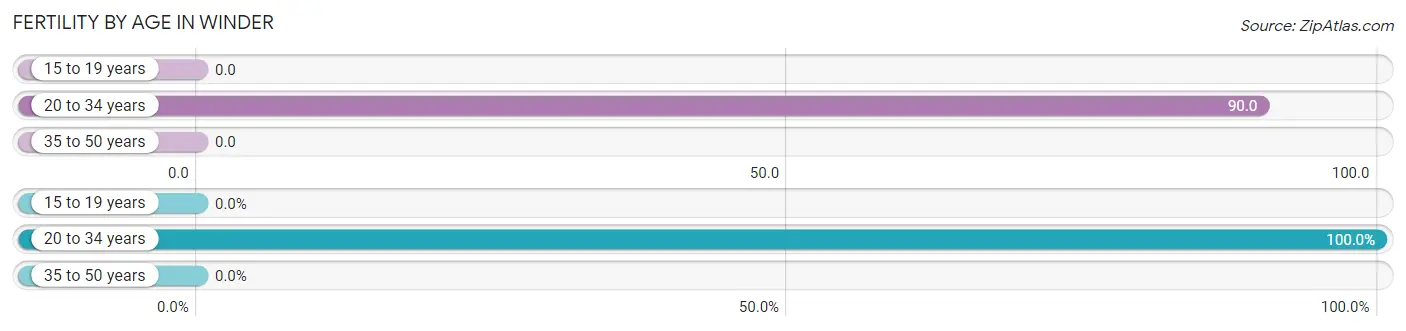
| Age Bracket | Women with Births | Births / 1,000 Women |
| 15 to 19 years | 0 (0.0%) | 0.0 |
| 20 to 34 years | 168 (100.0%) | 90.0 |
| 35 to 50 years | 0 (0.0%) | 0.0 |
| Total | 168 (100.0%) | 37.0 |
Fertility by Age by Marriage Status in Winder
70.2% of women with births (168) in Winder are married. The highest percentage of unmarried women with births falls into 20 to 34 years age bracket with 29.8% of them unmarried at the time of birth, while the lowest percentage of unmarried women with births belong to 20 to 34 years age bracket with 29.8% of them unmarried.
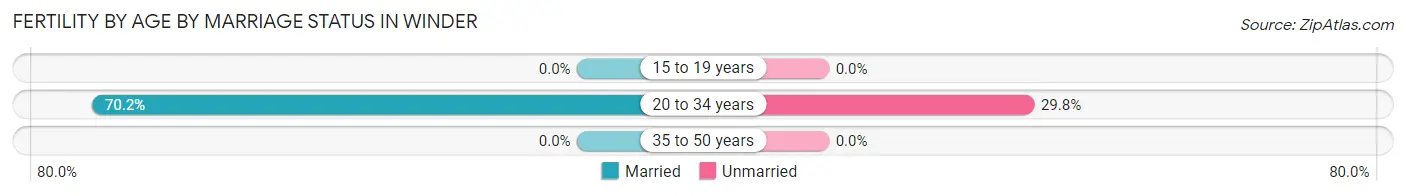
| Age Bracket | Married | Unmarried |
| 15 to 19 years | 0 (0.0%) | 0 (0.0%) |
| 20 to 34 years | 118 (70.2%) | 50 (29.8%) |
| 35 to 50 years | 0 (0.0%) | 0 (0.0%) |
| Total | 118 (70.2%) | 50 (29.8%) |
Fertility by Education in Winder
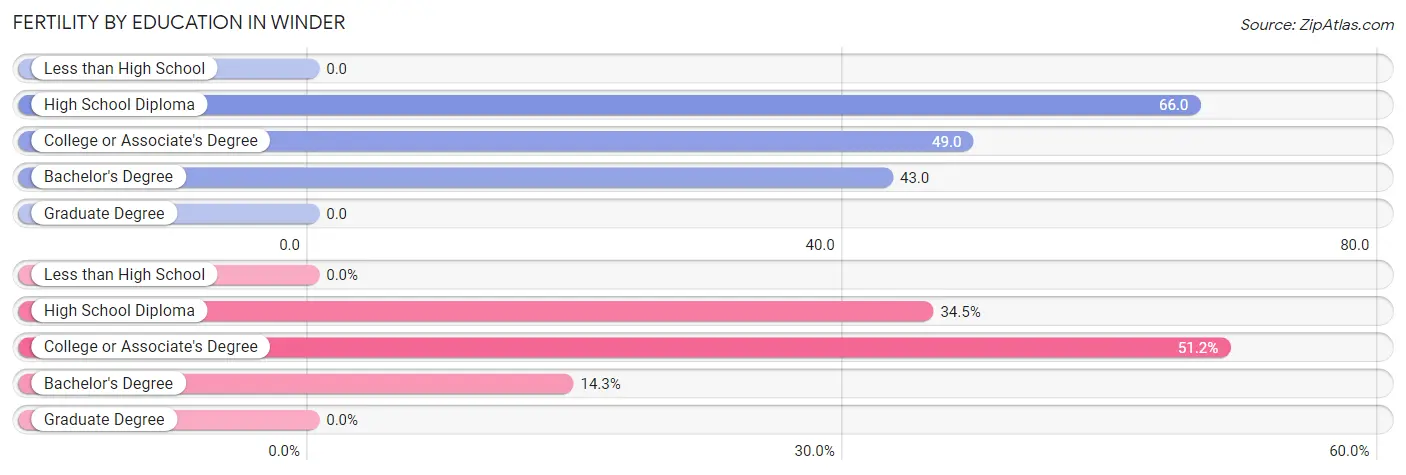
| Educational Attainment | Women with Births | Births / 1,000 Women |
| Less than High School | 0 (0.0%) | 0.0 |
| High School Diploma | 58 (34.5%) | 66.0 |
| College or Associate's Degree | 86 (51.2%) | 49.0 |
| Bachelor's Degree | 24 (14.3%) | 43.0 |
| Graduate Degree | 0 (0.0%) | 0.0 |
| Total | 168 (100.0%) | 37.0 |
Fertility by Education by Marriage Status in Winder
29.8% of women with births in Winder are unmarried. Women with the educational attainment of college or associate's degree are most likely to be married with 100.0% of them married at childbirth, while women with the educational attainment of high school diploma are least likely to be married with 86.2% of them unmarried at childbirth.
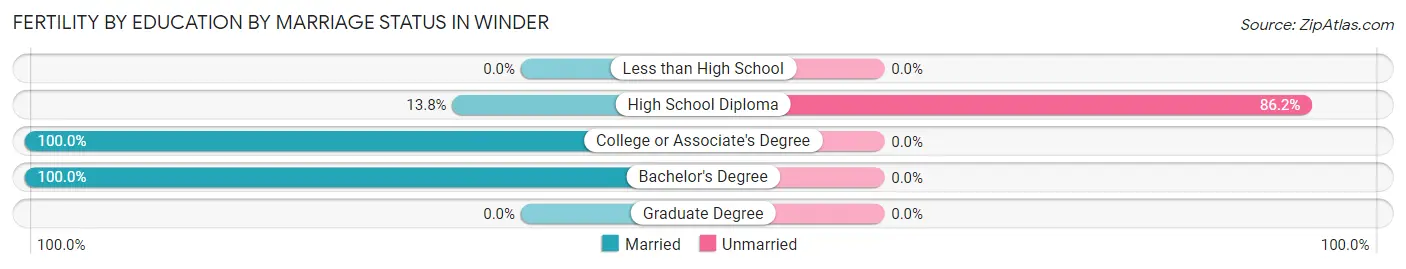
| Educational Attainment | Married | Unmarried |
| Less than High School | 0 (0.0%) | 0 (0.0%) |
| High School Diploma | 8 (13.8%) | 50 (86.2%) |
| College or Associate's Degree | 86 (100.0%) | 0 (0.0%) |
| Bachelor's Degree | 24 (100.0%) | 0 (0.0%) |
| Graduate Degree | 0 (0.0%) | 0 (0.0%) |
| Total | 118 (70.2%) | 50 (29.8%) |
Employment Characteristics in Winder
Employment by Class of Employer in Winder
Among the 8,348 employed individuals in Winder, private company employees (6,023 | 72.2%), local government employees (1,013 | 12.1%), and not-for-profit organizations (387 | 4.6%) make up the most common classes of employment.
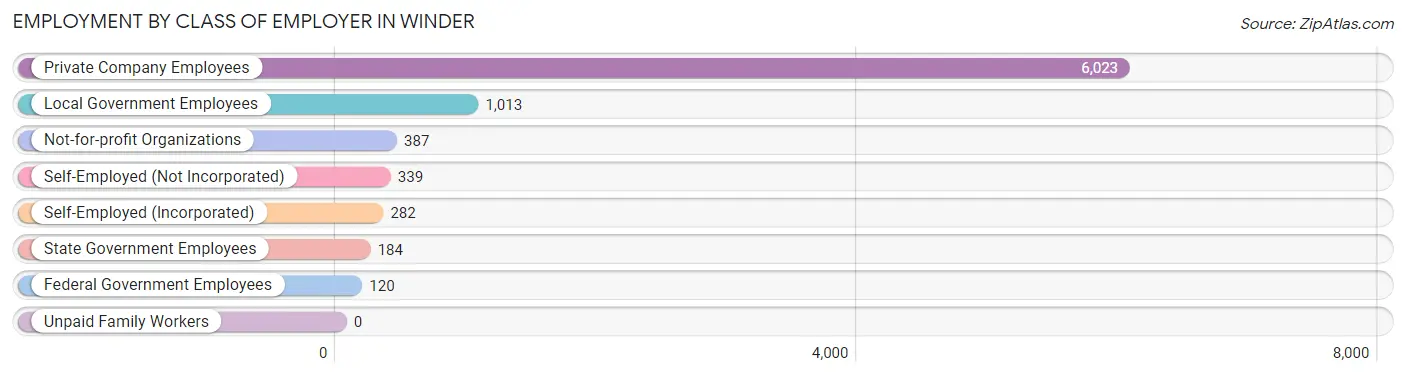
| Employer Class | # Employees | % Employees |
| Private Company Employees | 6,023 | 72.2% |
| Self-Employed (Incorporated) | 282 | 3.4% |
| Self-Employed (Not Incorporated) | 339 | 4.1% |
| Not-for-profit Organizations | 387 | 4.6% |
| Local Government Employees | 1,013 | 12.1% |
| State Government Employees | 184 | 2.2% |
| Federal Government Employees | 120 | 1.4% |
| Unpaid Family Workers | 0 | 0.0% |
| Total | 8,348 | 100.0% |
Employment Status by Age in Winder
According to the labor force statistics for Winder, out of the total population over 16 years of age (14,246), 64.5% or 9,189 individuals are in the labor force, with 5.8% or 533 of them unemployed. The age group with the highest labor force participation rate is 25 to 29 years, with 90.3% or 1,448 individuals in the labor force. Within the labor force, the 30 to 34 years age range has the highest percentage of unemployed individuals, with 16.9% or 148 of them being unemployed.
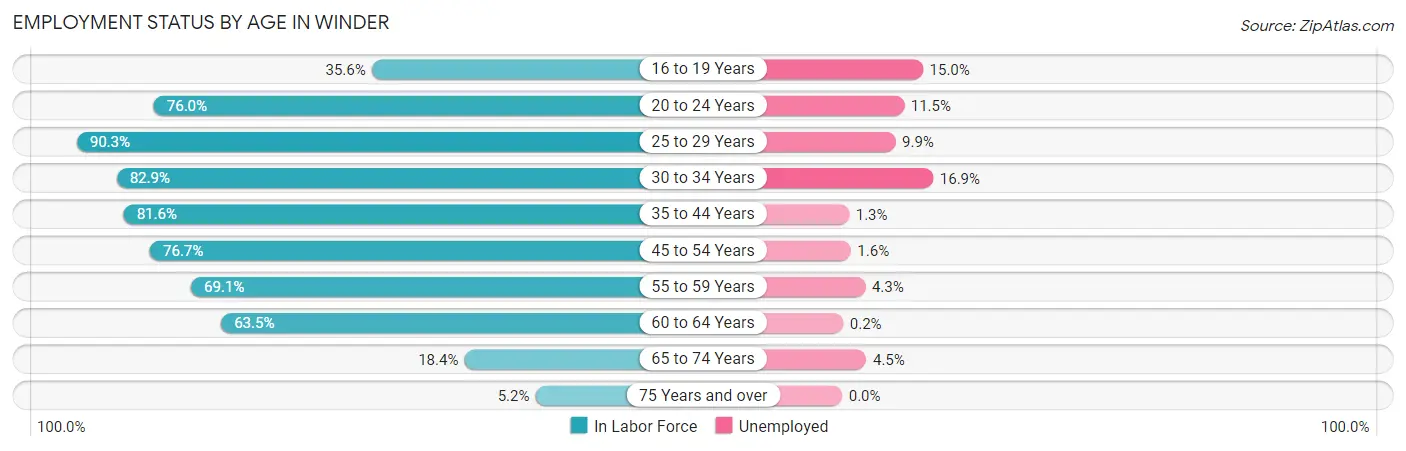
| Age Bracket | In Labor Force | Unemployed |
| 16 to 19 Years | 320 (35.6%) | 48 (15.0%) |
| 20 to 24 Years | 814 (76.0%) | 94 (11.5%) |
| 25 to 29 Years | 1,448 (90.3%) | 143 (9.9%) |
| 30 to 34 Years | 877 (82.9%) | 148 (16.9%) |
| 35 to 44 Years | 2,316 (81.6%) | 30 (1.3%) |
| 45 to 54 Years | 1,730 (76.7%) | 28 (1.6%) |
| 55 to 59 Years | 700 (69.1%) | 30 (4.3%) |
| 60 to 64 Years | 641 (63.5%) | 1 (0.2%) |
| 65 to 74 Years | 289 (18.4%) | 13 (4.5%) |
| 75 Years and over | 48 (5.2%) | 0 (0.0%) |
| Total | 9,189 (64.5%) | 533 (5.8%) |
Employment Status by Educational Attainment in Winder
According to labor force statistics for Winder, 78.9% of individuals (7,715) out of the total population between 25 and 64 years of age (9,778) are in the labor force, with 4.9% or 378 of them being unemployed. The group with the highest labor force participation rate are those with the educational attainment of bachelor's degree or higher, with 88.4% or 1,775 individuals in the labor force. Within the labor force, individuals with less than high school education have the highest percentage of unemployment, with 21.9% or 134 of them being unemployed.
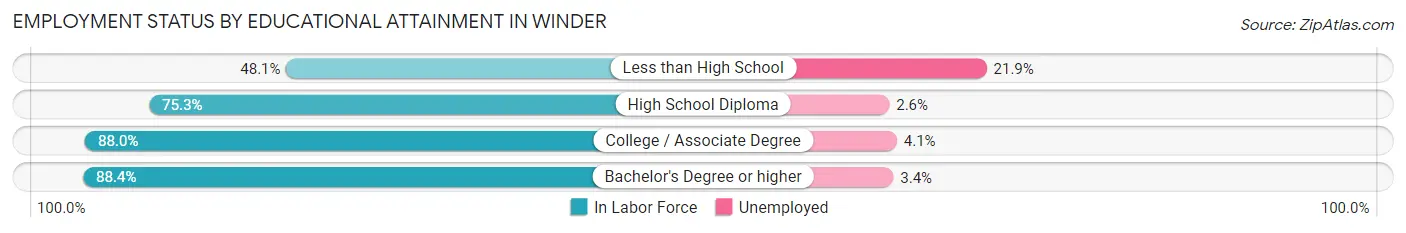
| Educational Attainment | In Labor Force | Unemployed |
| Less than High School | 613 (48.1%) | 279 (21.9%) |
| High School Diploma | 2,321 (75.3%) | 80 (2.6%) |
| College / Associate Degree | 3,004 (88.0%) | 140 (4.1%) |
| Bachelor's Degree or higher | 1,775 (88.4%) | 68 (3.4%) |
| Total | 7,715 (78.9%) | 479 (4.9%) |
Employment Occupations by Sex in Winder
Management, Business, Science and Arts Occupations
The most common Management, Business, Science and Arts occupations in Winder are Community & Social Service (745 | 8.6%), Management (580 | 6.7%), Business & Financial (528 | 6.1%), Education Instruction & Library (446 | 5.2%), and Computers, Engineering & Science (343 | 4.0%).
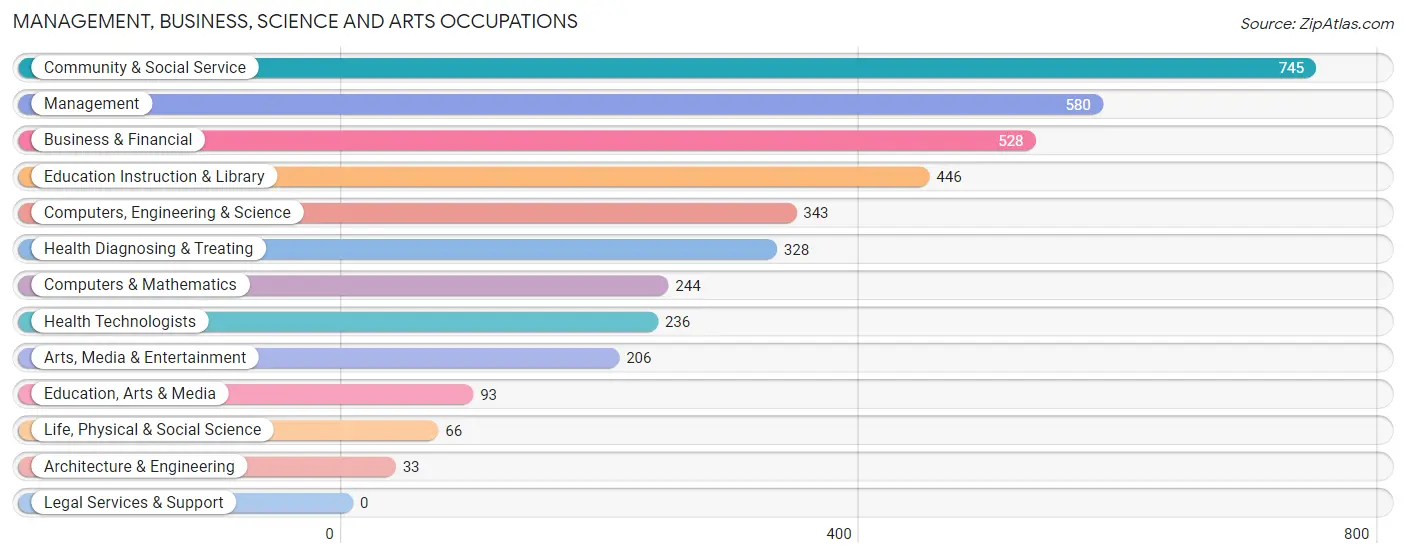
Management, Business, Science and Arts Occupations by Sex
Within the Management, Business, Science and Arts occupations in Winder, the most male-oriented occupations are Architecture & Engineering (100.0%), Education, Arts & Media (90.3%), and Life, Physical & Social Science (80.3%), while the most female-oriented occupations are Health Technologists (100.0%), Health Diagnosing & Treating (96.7%), and Education Instruction & Library (78.7%).
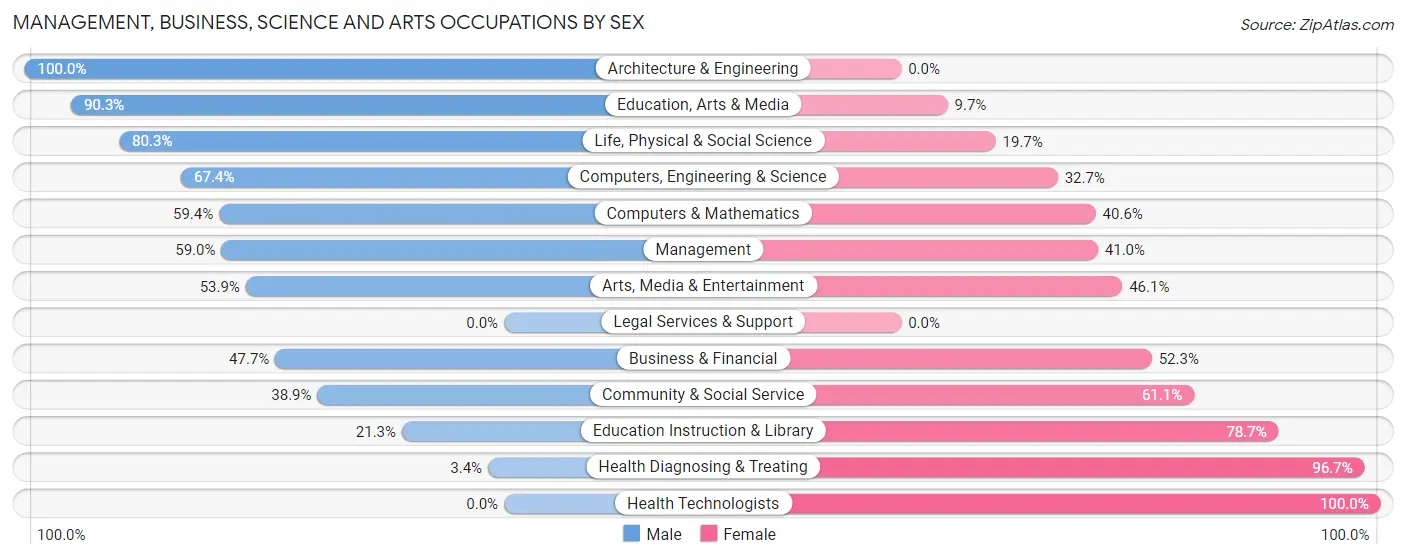
| Occupation | Male | Female |
| Management | 342 (59.0%) | 238 (41.0%) |
| Business & Financial | 252 (47.7%) | 276 (52.3%) |
| Computers, Engineering & Science | 231 (67.3%) | 112 (32.7%) |
| Computers & Mathematics | 145 (59.4%) | 99 (40.6%) |
| Architecture & Engineering | 33 (100.0%) | 0 (0.0%) |
| Life, Physical & Social Science | 53 (80.3%) | 13 (19.7%) |
| Community & Social Service | 290 (38.9%) | 455 (61.1%) |
| Education, Arts & Media | 84 (90.3%) | 9 (9.7%) |
| Legal Services & Support | 0 (0.0%) | 0 (0.0%) |
| Education Instruction & Library | 95 (21.3%) | 351 (78.7%) |
| Arts, Media & Entertainment | 111 (53.9%) | 95 (46.1%) |
| Health Diagnosing & Treating | 11 (3.4%) | 317 (96.7%) |
| Health Technologists | 0 (0.0%) | 236 (100.0%) |
| Total (Category) | 1,126 (44.6%) | 1,398 (55.4%) |
| Total (Overall) | 4,608 (53.3%) | 4,042 (46.7%) |
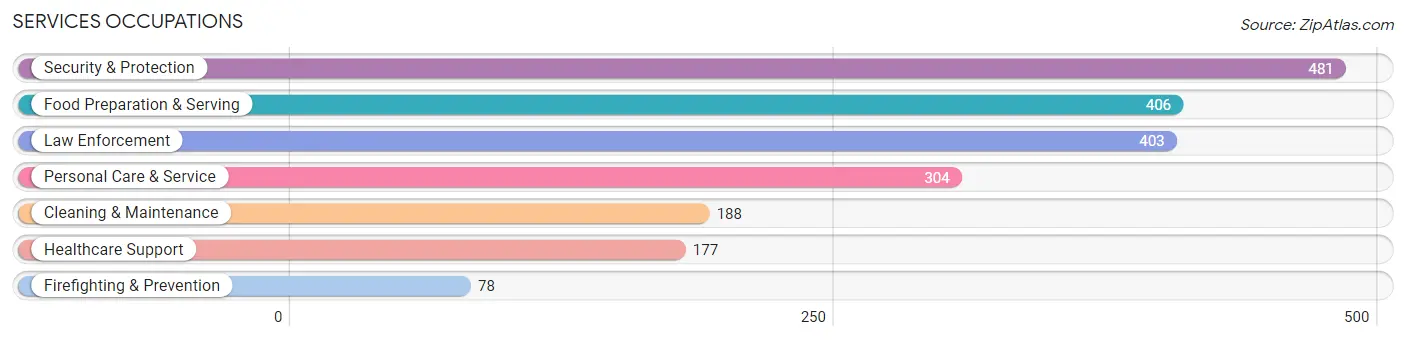
Services Occupations
The most common Services occupations in Winder are Security & Protection (481 | 5.6%), Food Preparation & Serving (406 | 4.7%), Law Enforcement (403 | 4.7%), Personal Care & Service (304 | 3.5%), and Cleaning & Maintenance (188 | 2.2%).
Services Occupations by Sex
Within the Services occupations in Winder, the most male-oriented occupations are Law Enforcement (89.8%), Security & Protection (89.0%), and Firefighting & Prevention (84.6%), while the most female-oriented occupations are Healthcare Support (97.7%), Personal Care & Service (88.2%), and Food Preparation & Serving (67.0%).
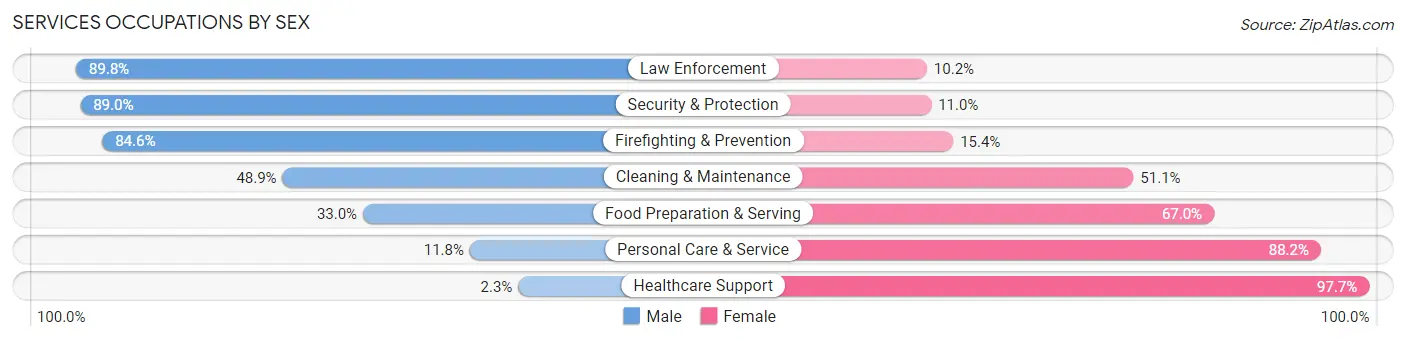
| Occupation | Male | Female |
| Healthcare Support | 4 (2.3%) | 173 (97.7%) |
| Security & Protection | 428 (89.0%) | 53 (11.0%) |
| Firefighting & Prevention | 66 (84.6%) | 12 (15.4%) |
| Law Enforcement | 362 (89.8%) | 41 (10.2%) |
| Food Preparation & Serving | 134 (33.0%) | 272 (67.0%) |
| Cleaning & Maintenance | 92 (48.9%) | 96 (51.1%) |
| Personal Care & Service | 36 (11.8%) | 268 (88.2%) |
| Total (Category) | 694 (44.6%) | 862 (55.4%) |
| Total (Overall) | 4,608 (53.3%) | 4,042 (46.7%) |
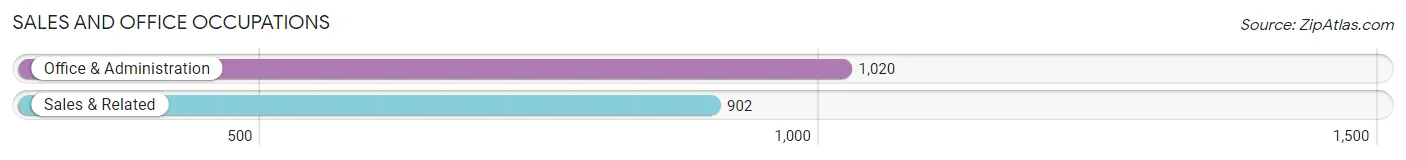
Sales and Office Occupations
The most common Sales and Office occupations in Winder are Office & Administration (1,020 | 11.8%), and Sales & Related (902 | 10.4%).
Sales and Office Occupations by Sex
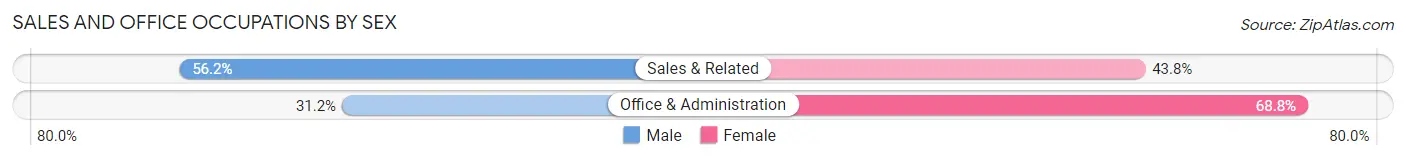
| Occupation | Male | Female |
| Sales & Related | 507 (56.2%) | 395 (43.8%) |
| Office & Administration | 318 (31.2%) | 702 (68.8%) |
| Total (Category) | 825 (42.9%) | 1,097 (57.1%) |
| Total (Overall) | 4,608 (53.3%) | 4,042 (46.7%) |
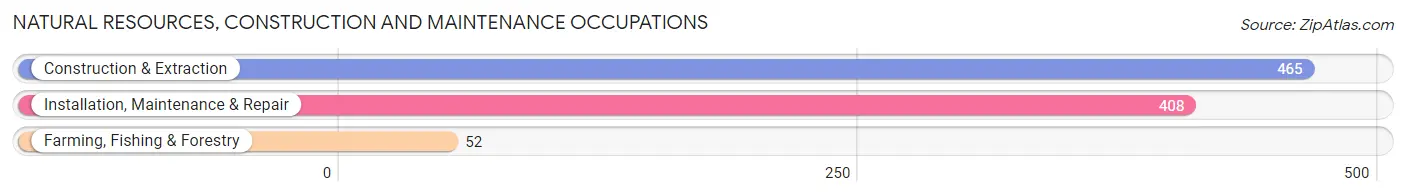
Natural Resources, Construction and Maintenance Occupations
The most common Natural Resources, Construction and Maintenance occupations in Winder are Construction & Extraction (465 | 5.4%), Installation, Maintenance & Repair (408 | 4.7%), and Farming, Fishing & Forestry (52 | 0.6%).
Natural Resources, Construction and Maintenance Occupations by Sex
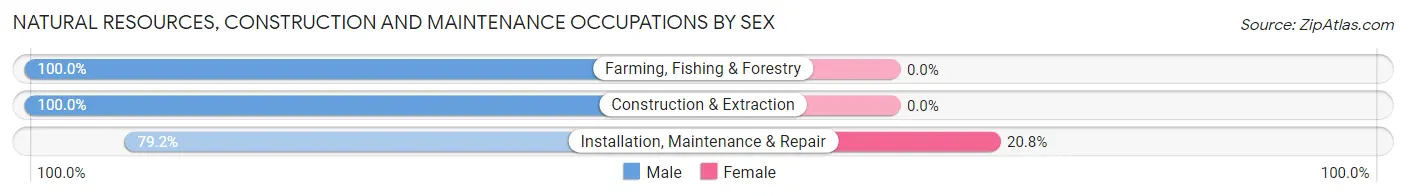
| Occupation | Male | Female |
| Farming, Fishing & Forestry | 52 (100.0%) | 0 (0.0%) |
| Construction & Extraction | 465 (100.0%) | 0 (0.0%) |
| Installation, Maintenance & Repair | 323 (79.2%) | 85 (20.8%) |
| Total (Category) | 840 (90.8%) | 85 (9.2%) |
| Total (Overall) | 4,608 (53.3%) | 4,042 (46.7%) |
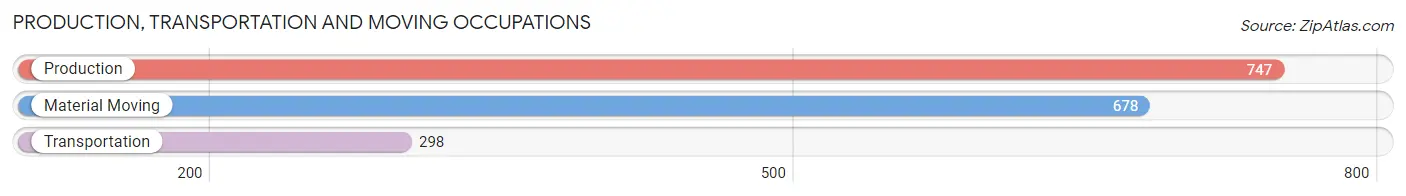
Production, Transportation and Moving Occupations
The most common Production, Transportation and Moving occupations in Winder are Production (747 | 8.6%), Material Moving (678 | 7.8%), and Transportation (298 | 3.5%).
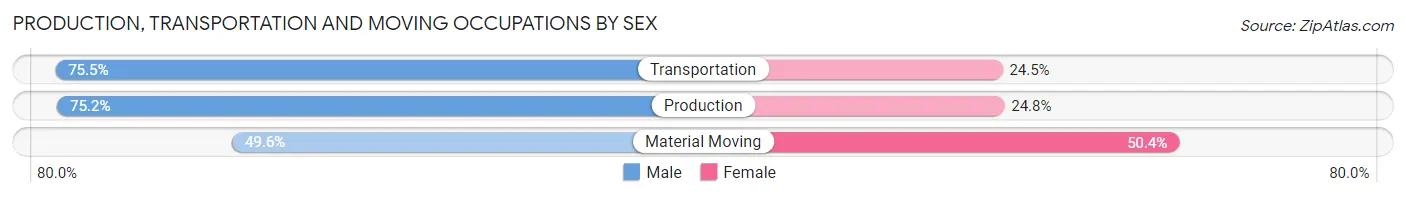
Production, Transportation and Moving Occupations by Sex
| Occupation | Male | Female |
| Production | 562 (75.2%) | 185 (24.8%) |
| Transportation | 225 (75.5%) | 73 (24.5%) |
| Material Moving | 336 (49.6%) | 342 (50.4%) |
| Total (Category) | 1,123 (65.2%) | 600 (34.8%) |
| Total (Overall) | 4,608 (53.3%) | 4,042 (46.7%) |
Employment Industries by Sex in Winder
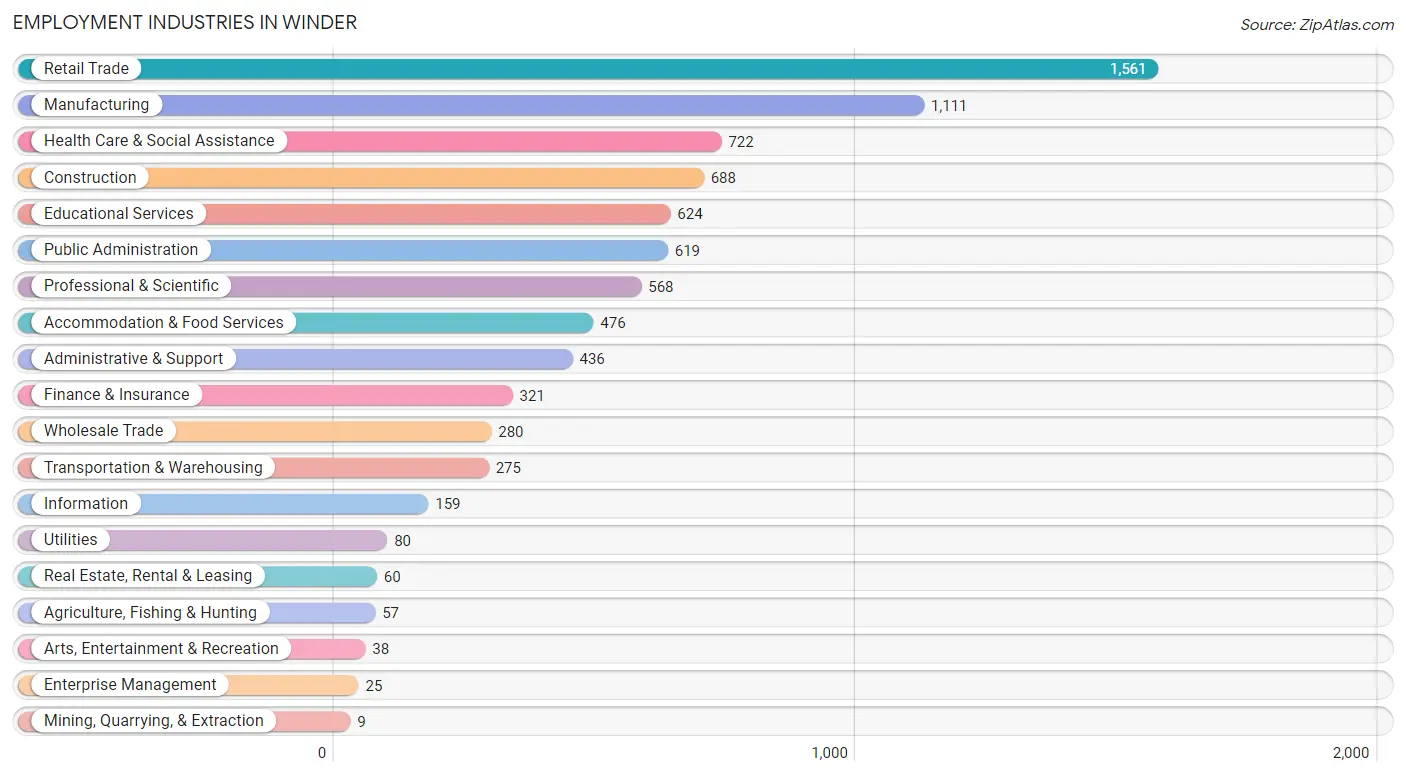
Employment Industries in Winder
The major employment industries in Winder include Retail Trade (1,561 | 18.0%), Manufacturing (1,111 | 12.8%), Health Care & Social Assistance (722 | 8.4%), Construction (688 | 8.0%), and Educational Services (624 | 7.2%).
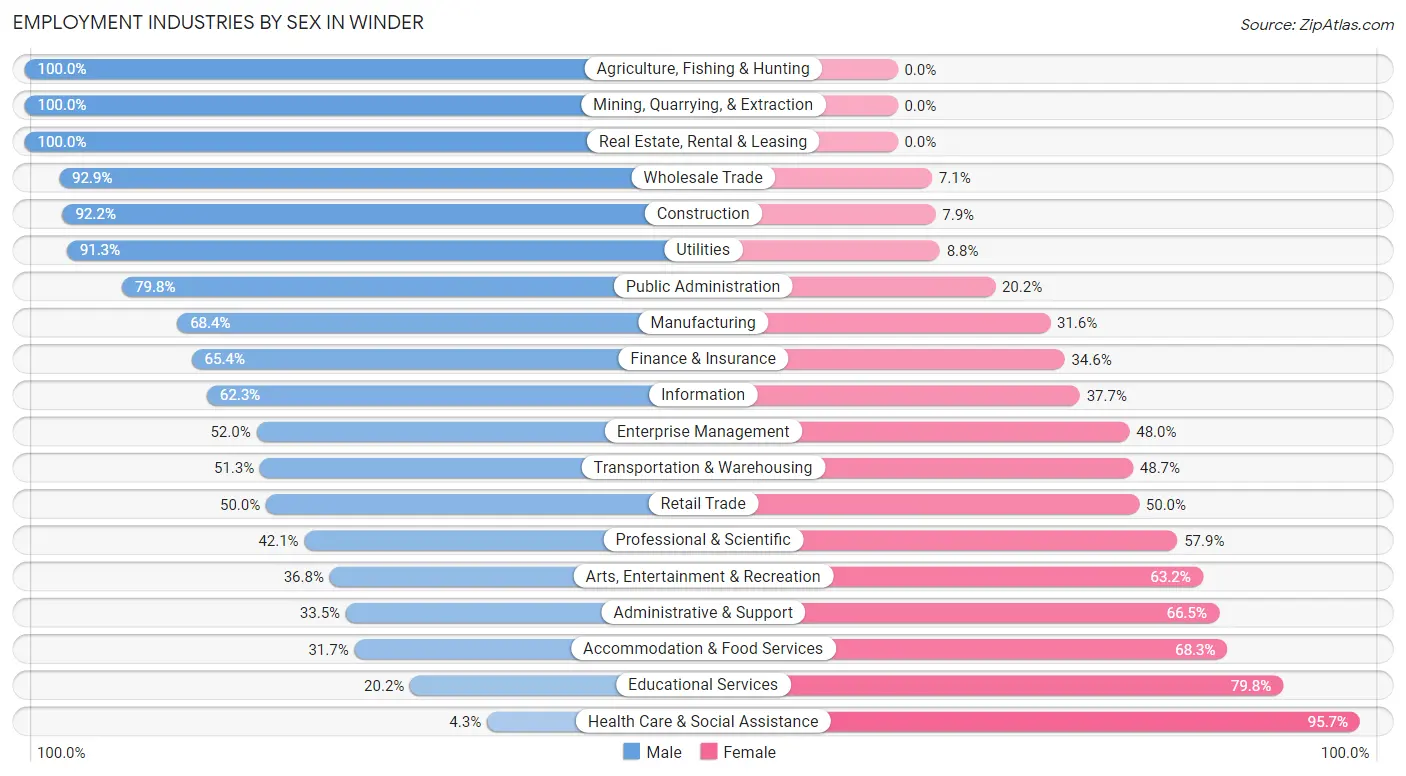
Employment Industries by Sex in Winder
The Winder industries that see more men than women are Agriculture, Fishing & Hunting (100.0%), Mining, Quarrying, & Extraction (100.0%), and Real Estate, Rental & Leasing (100.0%), whereas the industries that tend to have a higher number of women are Health Care & Social Assistance (95.7%), Educational Services (79.8%), and Accommodation & Food Services (68.3%).
| Industry | Male | Female |
| Agriculture, Fishing & Hunting | 57 (100.0%) | 0 (0.0%) |
| Mining, Quarrying, & Extraction | 9 (100.0%) | 0 (0.0%) |
| Construction | 634 (92.1%) | 54 (7.9%) |
| Manufacturing | 760 (68.4%) | 351 (31.6%) |
| Wholesale Trade | 260 (92.9%) | 20 (7.1%) |
| Retail Trade | 781 (50.0%) | 780 (50.0%) |
| Transportation & Warehousing | 141 (51.3%) | 134 (48.7%) |
| Utilities | 73 (91.2%) | 7 (8.7%) |
| Information | 99 (62.3%) | 60 (37.7%) |
| Finance & Insurance | 210 (65.4%) | 111 (34.6%) |
| Real Estate, Rental & Leasing | 60 (100.0%) | 0 (0.0%) |
| Professional & Scientific | 239 (42.1%) | 329 (57.9%) |
| Enterprise Management | 13 (52.0%) | 12 (48.0%) |
| Administrative & Support | 146 (33.5%) | 290 (66.5%) |
| Educational Services | 126 (20.2%) | 498 (79.8%) |
| Health Care & Social Assistance | 31 (4.3%) | 691 (95.7%) |
| Arts, Entertainment & Recreation | 14 (36.8%) | 24 (63.2%) |
| Accommodation & Food Services | 151 (31.7%) | 325 (68.3%) |
| Public Administration | 494 (79.8%) | 125 (20.2%) |
| Total | 4,608 (53.3%) | 4,042 (46.7%) |
Education in Winder
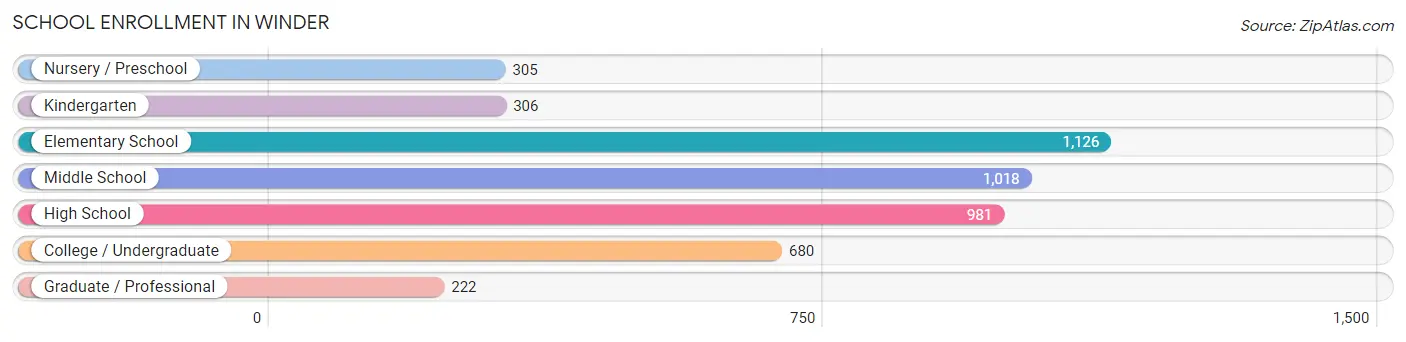
School Enrollment in Winder
The most common levels of schooling among the 4,638 students in Winder are elementary school (1,126 | 24.3%), middle school (1,018 | 22.0%), and high school (981 | 21.1%).
| School Level | # Students | % Students |
| Nursery / Preschool | 305 | 6.6% |
| Kindergarten | 306 | 6.6% |
| Elementary School | 1,126 | 24.3% |
| Middle School | 1,018 | 22.0% |
| High School | 981 | 21.1% |
| College / Undergraduate | 680 | 14.7% |
| Graduate / Professional | 222 | 4.8% |
| Total | 4,638 | 100.0% |
School Enrollment by Age by Funding Source in Winder
Out of a total of 4,638 students who are enrolled in schools in Winder, 696 (15.0%) attend a private institution, while the remaining 3,942 (85.0%) are enrolled in public schools. The age group of 3 to 4 year olds has the highest likelihood of being enrolled in private schools, with 145 (62.0% in the age bracket) enrolled. Conversely, the age group of 10 to 14 year olds has the lowest likelihood of being enrolled in a private school, with 1,198 (98.0% in the age bracket) attending a public institution.
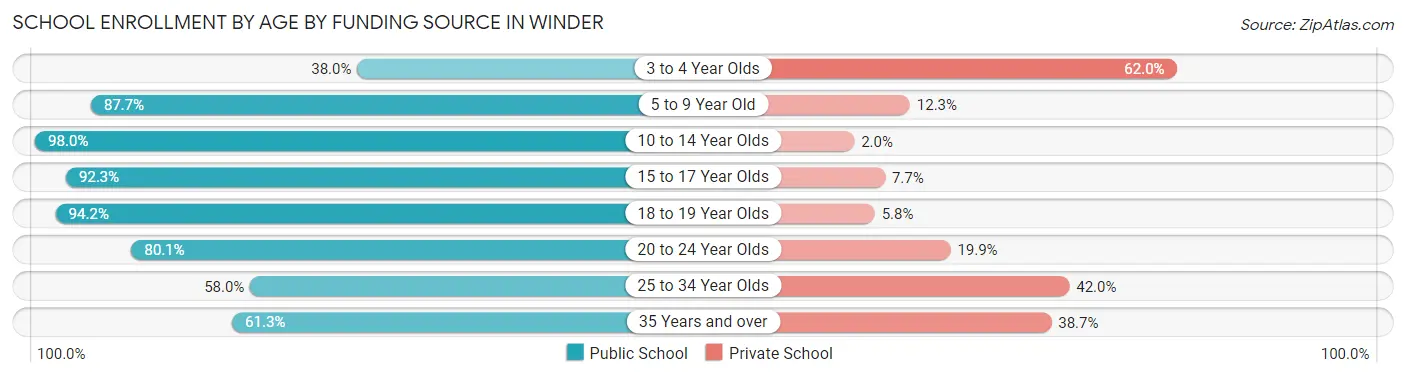
| Age Bracket | Public School | Private School |
| 3 to 4 Year Olds | 89 (38.0%) | 145 (62.0%) |
| 5 to 9 Year Old | 1,195 (87.7%) | 168 (12.3%) |
| 10 to 14 Year Olds | 1,198 (98.0%) | 24 (2.0%) |
| 15 to 17 Year Olds | 672 (92.3%) | 56 (7.7%) |
| 18 to 19 Year Olds | 163 (94.2%) | 10 (5.8%) |
| 20 to 24 Year Olds | 290 (80.1%) | 72 (19.9%) |
| 25 to 34 Year Olds | 69 (58.0%) | 50 (42.0%) |
| 35 Years and over | 268 (61.3%) | 169 (38.7%) |
| Total | 3,942 (85.0%) | 696 (15.0%) |
Educational Attainment by Field of Study in Winder
Education (596 | 22.5%), business (509 | 19.2%), psychology (250 | 9.4%), arts & humanities (225 | 8.5%), and science & technology (216 | 8.1%) are the most common fields of study among 2,653 individuals in Winder who have obtained a bachelor's degree or higher.
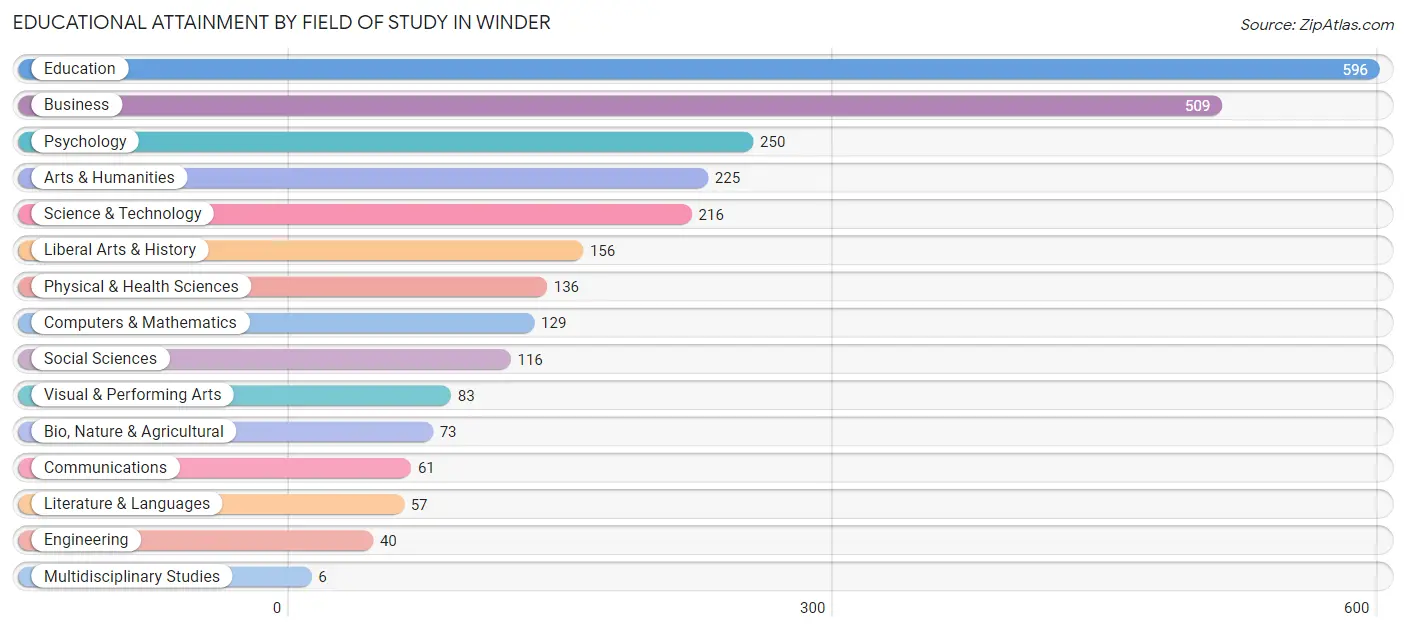
| Field of Study | # Graduates | % Graduates |
| Computers & Mathematics | 129 | 4.9% |
| Bio, Nature & Agricultural | 73 | 2.8% |
| Physical & Health Sciences | 136 | 5.1% |
| Psychology | 250 | 9.4% |
| Social Sciences | 116 | 4.4% |
| Engineering | 40 | 1.5% |
| Multidisciplinary Studies | 6 | 0.2% |
| Science & Technology | 216 | 8.1% |
| Business | 509 | 19.2% |
| Education | 596 | 22.5% |
| Literature & Languages | 57 | 2.1% |
| Liberal Arts & History | 156 | 5.9% |
| Visual & Performing Arts | 83 | 3.1% |
| Communications | 61 | 2.3% |
| Arts & Humanities | 225 | 8.5% |
| Total | 2,653 | 100.0% |
Transportation & Commute in Winder
Vehicle Availability by Sex in Winder
The most prevalent vehicle ownership categories in Winder are males with 2 vehicles (2,108, accounting for 47.0%) and females with 2 vehicles (1,710, making up 54.8%).
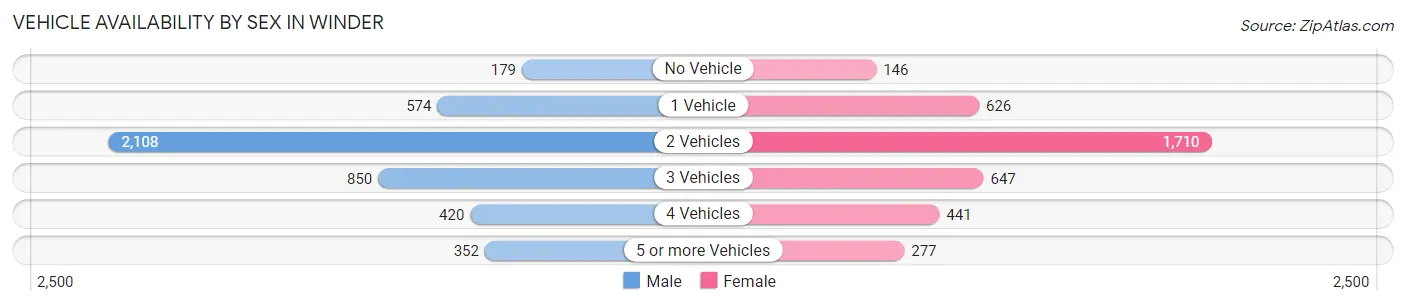
| Vehicles Available | Male | Female |
| No Vehicle | 179 (4.0%) | 146 (3.8%) |
| 1 Vehicle | 574 (12.8%) | 626 (16.3%) |
| 2 Vehicles | 2,108 (47.0%) | 1,710 (44.5%) |
| 3 Vehicles | 850 (19.0%) | 647 (16.8%) |
| 4 Vehicles | 420 (9.4%) | 441 (11.5%) |
| 5 or more Vehicles | 352 (7.9%) | 277 (7.2%) |
| Total | 4,483 (100.0%) | 3,847 (100.0%) |
Commute Time in Winder
The most frequently occuring commute durations in Winder are 30 to 34 minutes (1,476 commuters, 18.6%), 10 to 14 minutes (1,092 commuters, 13.7%), and 45 to 59 minutes (893 commuters, 11.2%).
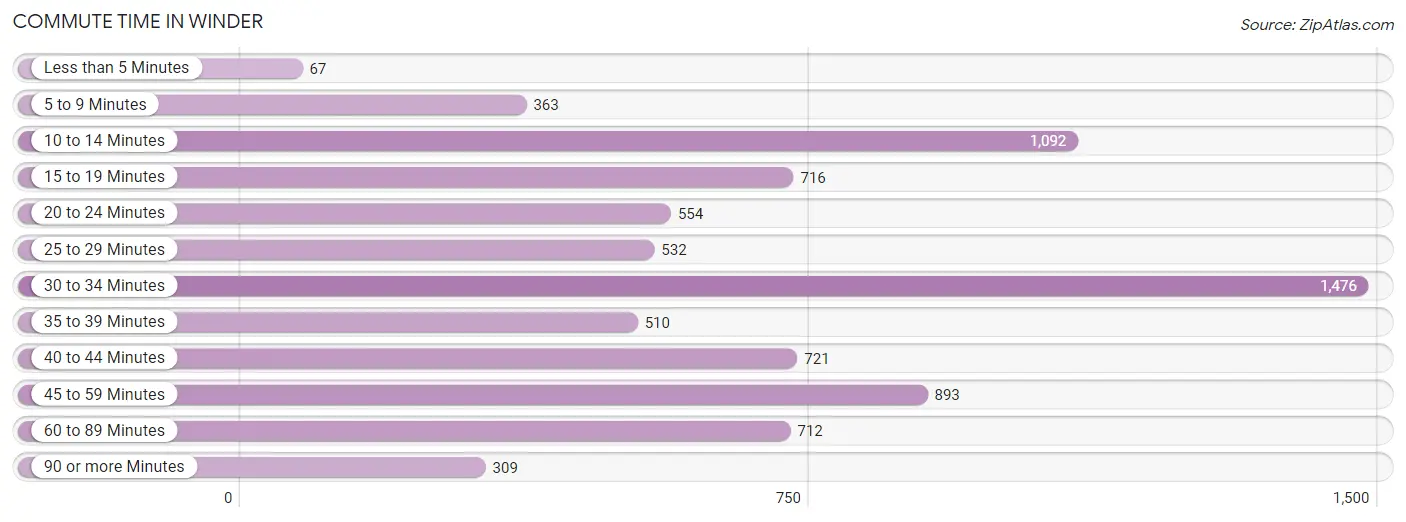
| Commute Time | # Commuters | % Commuters |
| Less than 5 Minutes | 67 | 0.8% |
| 5 to 9 Minutes | 363 | 4.6% |
| 10 to 14 Minutes | 1,092 | 13.7% |
| 15 to 19 Minutes | 716 | 9.0% |
| 20 to 24 Minutes | 554 | 7.0% |
| 25 to 29 Minutes | 532 | 6.7% |
| 30 to 34 Minutes | 1,476 | 18.6% |
| 35 to 39 Minutes | 510 | 6.4% |
| 40 to 44 Minutes | 721 | 9.1% |
| 45 to 59 Minutes | 893 | 11.2% |
| 60 to 89 Minutes | 712 | 9.0% |
| 90 or more Minutes | 309 | 3.9% |
Commute Time by Sex in Winder
The most common commute times in Winder are 30 to 34 minutes (709 commuters, 16.5%) for males and 30 to 34 minutes (767 commuters, 21.0%) for females.
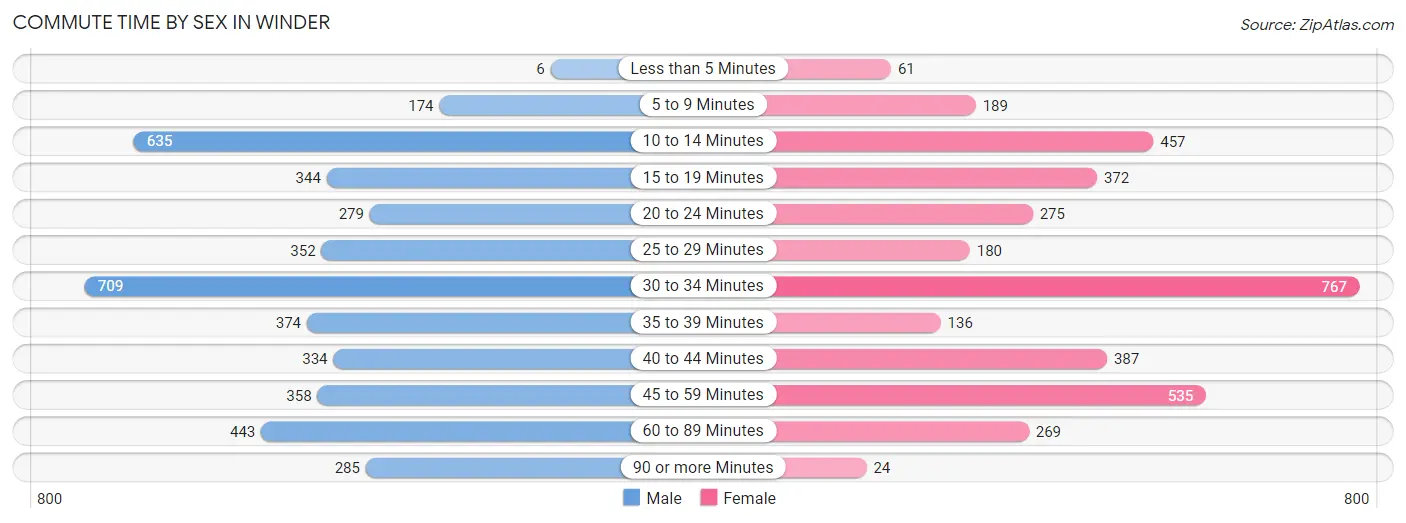
| Commute Time | Male | Female |
| Less than 5 Minutes | 6 (0.1%) | 61 (1.7%) |
| 5 to 9 Minutes | 174 (4.1%) | 189 (5.2%) |
| 10 to 14 Minutes | 635 (14.8%) | 457 (12.5%) |
| 15 to 19 Minutes | 344 (8.0%) | 372 (10.2%) |
| 20 to 24 Minutes | 279 (6.5%) | 275 (7.5%) |
| 25 to 29 Minutes | 352 (8.2%) | 180 (4.9%) |
| 30 to 34 Minutes | 709 (16.5%) | 767 (21.0%) |
| 35 to 39 Minutes | 374 (8.7%) | 136 (3.7%) |
| 40 to 44 Minutes | 334 (7.8%) | 387 (10.6%) |
| 45 to 59 Minutes | 358 (8.3%) | 535 (14.6%) |
| 60 to 89 Minutes | 443 (10.3%) | 269 (7.4%) |
| 90 or more Minutes | 285 (6.6%) | 24 (0.7%) |
Time of Departure to Work by Sex in Winder
The most frequent times of departure to work in Winder are 6:00 AM to 6:29 AM (643, 15.0%) for males and 7:00 AM to 7:29 AM (540, 14.8%) for females.
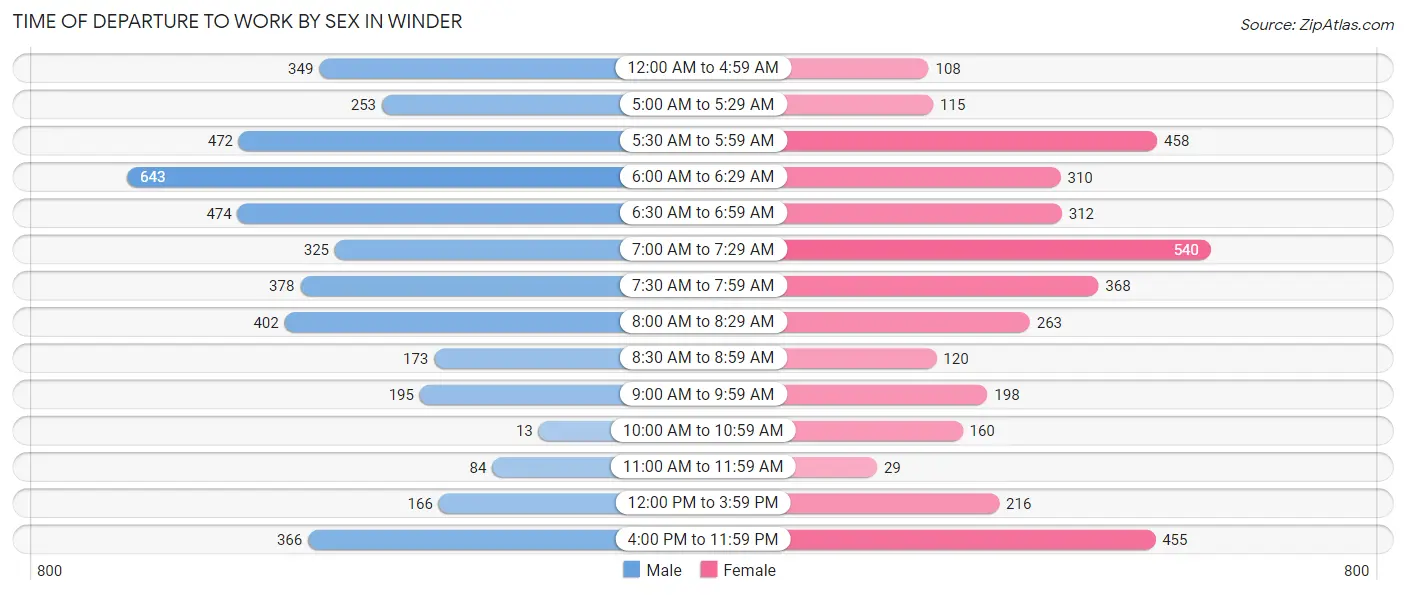
| Time of Departure | Male | Female |
| 12:00 AM to 4:59 AM | 349 (8.1%) | 108 (3.0%) |
| 5:00 AM to 5:29 AM | 253 (5.9%) | 115 (3.2%) |
| 5:30 AM to 5:59 AM | 472 (11.0%) | 458 (12.5%) |
| 6:00 AM to 6:29 AM | 643 (15.0%) | 310 (8.5%) |
| 6:30 AM to 6:59 AM | 474 (11.0%) | 312 (8.5%) |
| 7:00 AM to 7:29 AM | 325 (7.6%) | 540 (14.8%) |
| 7:30 AM to 7:59 AM | 378 (8.8%) | 368 (10.1%) |
| 8:00 AM to 8:29 AM | 402 (9.4%) | 263 (7.2%) |
| 8:30 AM to 8:59 AM | 173 (4.0%) | 120 (3.3%) |
| 9:00 AM to 9:59 AM | 195 (4.5%) | 198 (5.4%) |
| 10:00 AM to 10:59 AM | 13 (0.3%) | 160 (4.4%) |
| 11:00 AM to 11:59 AM | 84 (2.0%) | 29 (0.8%) |
| 12:00 PM to 3:59 PM | 166 (3.9%) | 216 (5.9%) |
| 4:00 PM to 11:59 PM | 366 (8.5%) | 455 (12.5%) |
| Total | 4,293 (100.0%) | 3,652 (100.0%) |
Housing Occupancy in Winder
Occupancy by Ownership in Winder
Of the total 6,762 dwellings in Winder, owner-occupied units account for 4,534 (67.0%), while renter-occupied units make up 2,228 (33.0%).
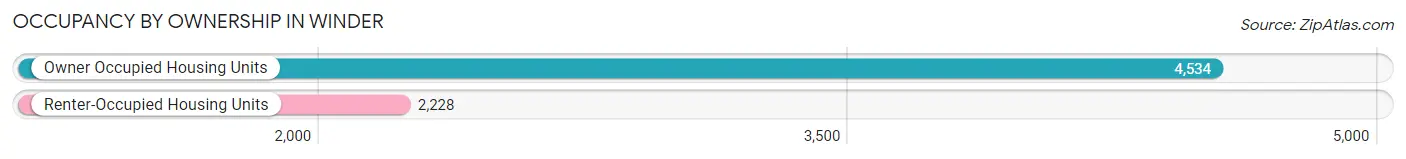
| Occupancy | # Housing Units | % Housing Units |
| Owner Occupied Housing Units | 4,534 | 67.0% |
| Renter-Occupied Housing Units | 2,228 | 33.0% |
| Total Occupied Housing Units | 6,762 | 100.0% |
Occupancy by Household Size in Winder
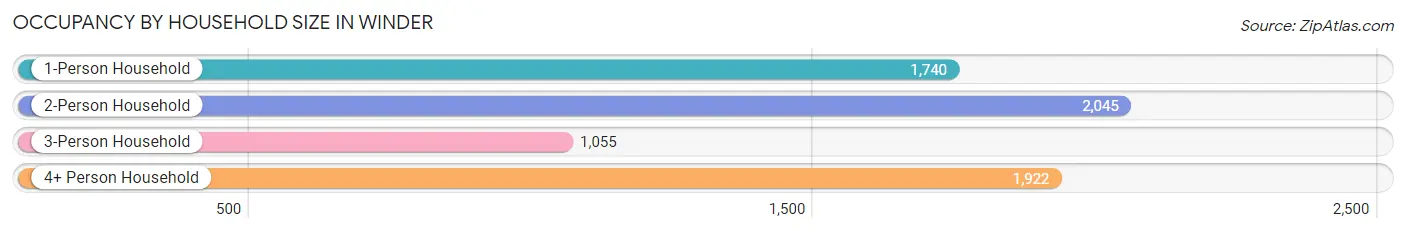
| Household Size | # Housing Units | % Housing Units |
| 1-Person Household | 1,740 | 25.7% |
| 2-Person Household | 2,045 | 30.2% |
| 3-Person Household | 1,055 | 15.6% |
| 4+ Person Household | 1,922 | 28.4% |
| Total Housing Units | 6,762 | 100.0% |
Occupancy by Ownership by Household Size in Winder
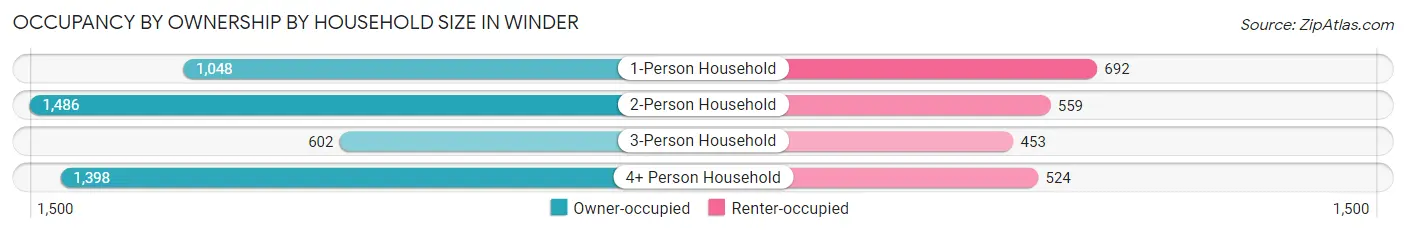
| Household Size | Owner-occupied | Renter-occupied |
| 1-Person Household | 1,048 (60.2%) | 692 (39.8%) |
| 2-Person Household | 1,486 (72.7%) | 559 (27.3%) |
| 3-Person Household | 602 (57.1%) | 453 (42.9%) |
| 4+ Person Household | 1,398 (72.7%) | 524 (27.3%) |
| Total Housing Units | 4,534 (67.0%) | 2,228 (33.0%) |
Occupancy by Educational Attainment in Winder
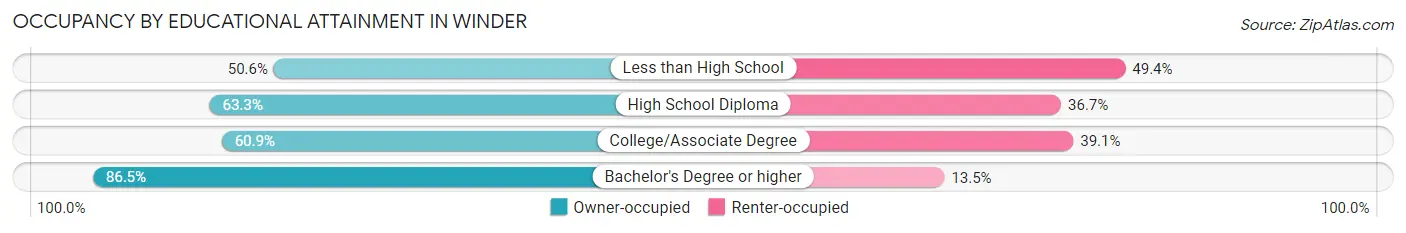
| Household Size | Owner-occupied | Renter-occupied |
| Less than High School | 384 (50.6%) | 375 (49.4%) |
| High School Diploma | 1,214 (63.3%) | 703 (36.7%) |
| College/Associate Degree | 1,423 (60.9%) | 913 (39.1%) |
| Bachelor's Degree or higher | 1,513 (86.5%) | 237 (13.5%) |
Occupancy by Age of Householder in Winder
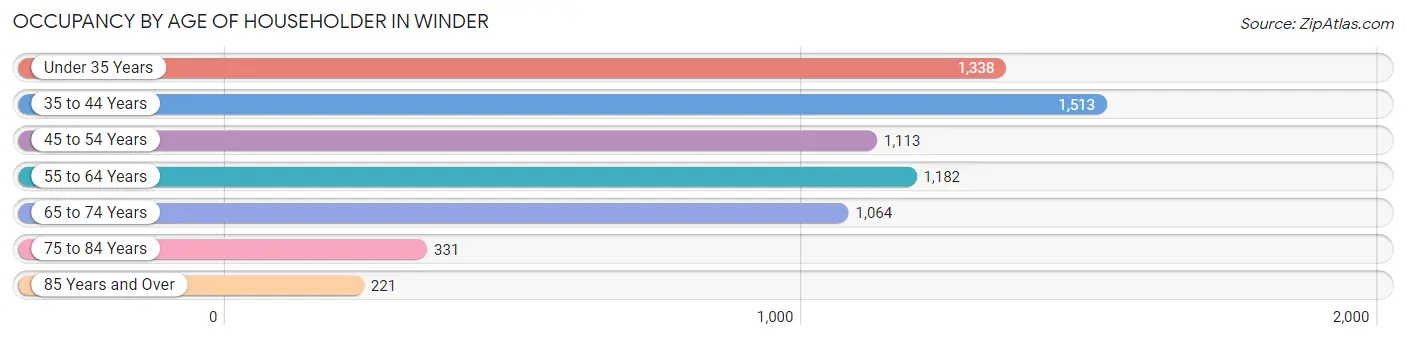
| Age Bracket | # Households | % Households |
| Under 35 Years | 1,338 | 19.8% |
| 35 to 44 Years | 1,513 | 22.4% |
| 45 to 54 Years | 1,113 | 16.5% |
| 55 to 64 Years | 1,182 | 17.5% |
| 65 to 74 Years | 1,064 | 15.7% |
| 75 to 84 Years | 331 | 4.9% |
| 85 Years and Over | 221 | 3.3% |
| Total | 6,762 | 100.0% |
Housing Finances in Winder
Median Income by Occupancy in Winder
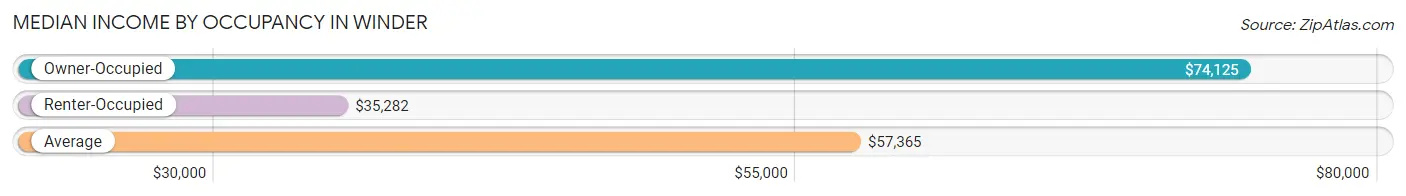
| Occupancy Type | # Households | Median Income |
| Owner-Occupied | 4,534 (67.0%) | $74,125 |
| Renter-Occupied | 2,228 (33.0%) | $35,282 |
| Average | 6,762 (100.0%) | $57,365 |
Occupancy by Householder Income Bracket in Winder
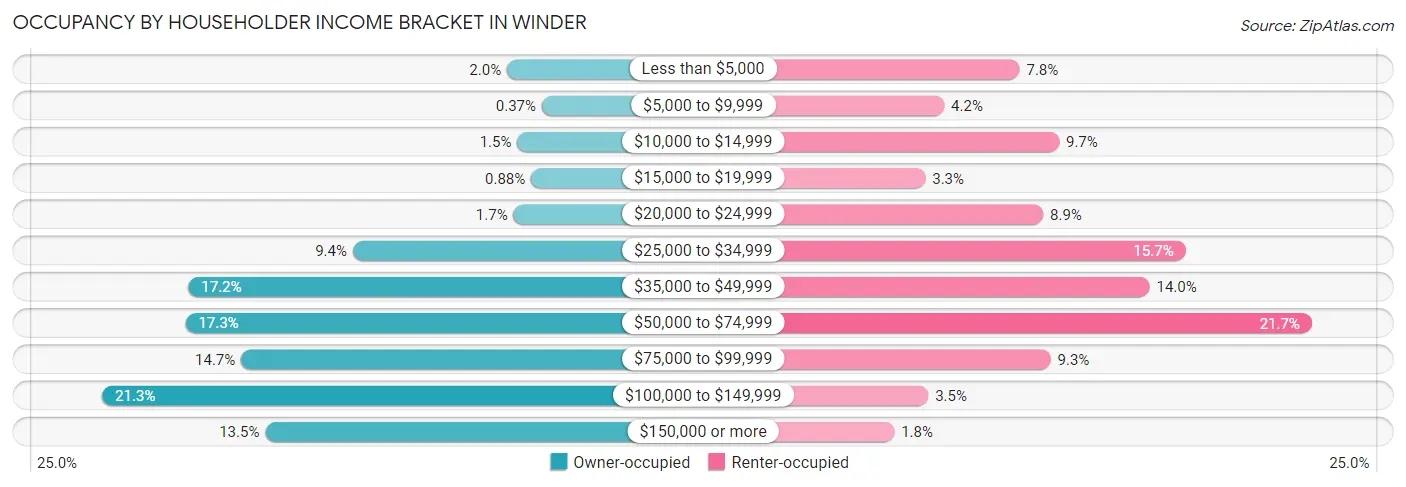
| Income Bracket | Owner-occupied | Renter-occupied |
| Less than $5,000 | 92 (2.0%) | 174 (7.8%) |
| $5,000 to $9,999 | 17 (0.4%) | 94 (4.2%) |
| $10,000 to $14,999 | 70 (1.5%) | 216 (9.7%) |
| $15,000 to $19,999 | 40 (0.9%) | 74 (3.3%) |
| $20,000 to $24,999 | 78 (1.7%) | 199 (8.9%) |
| $25,000 to $34,999 | 425 (9.4%) | 350 (15.7%) |
| $35,000 to $49,999 | 780 (17.2%) | 312 (14.0%) |
| $50,000 to $74,999 | 786 (17.3%) | 484 (21.7%) |
| $75,000 to $99,999 | 666 (14.7%) | 207 (9.3%) |
| $100,000 to $149,999 | 966 (21.3%) | 77 (3.5%) |
| $150,000 or more | 614 (13.5%) | 41 (1.8%) |
| Total | 4,534 (100.0%) | 2,228 (100.0%) |
Monthly Housing Cost Tiers in Winder
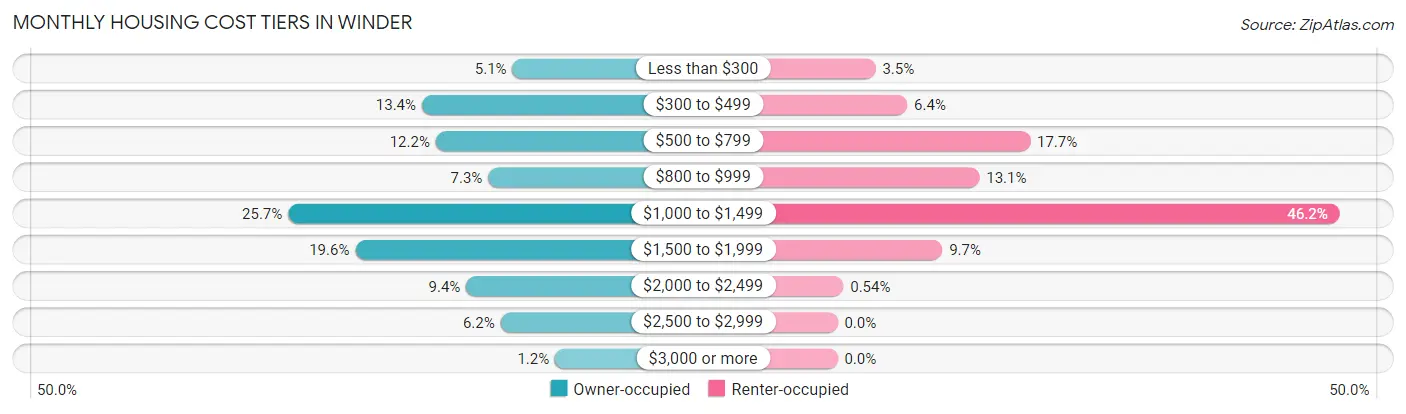
| Monthly Cost | Owner-occupied | Renter-occupied |
| Less than $300 | 231 (5.1%) | 78 (3.5%) |
| $300 to $499 | 609 (13.4%) | 143 (6.4%) |
| $500 to $799 | 551 (12.1%) | 395 (17.7%) |
| $800 to $999 | 332 (7.3%) | 291 (13.1%) |
| $1,000 to $1,499 | 1,167 (25.7%) | 1,030 (46.2%) |
| $1,500 to $1,999 | 887 (19.6%) | 215 (9.7%) |
| $2,000 to $2,499 | 424 (9.3%) | 12 (0.5%) |
| $2,500 to $2,999 | 280 (6.2%) | 0 (0.0%) |
| $3,000 or more | 53 (1.2%) | 0 (0.0%) |
| Total | 4,534 (100.0%) | 2,228 (100.0%) |
Physical Housing Characteristics in Winder
Housing Structures in Winder
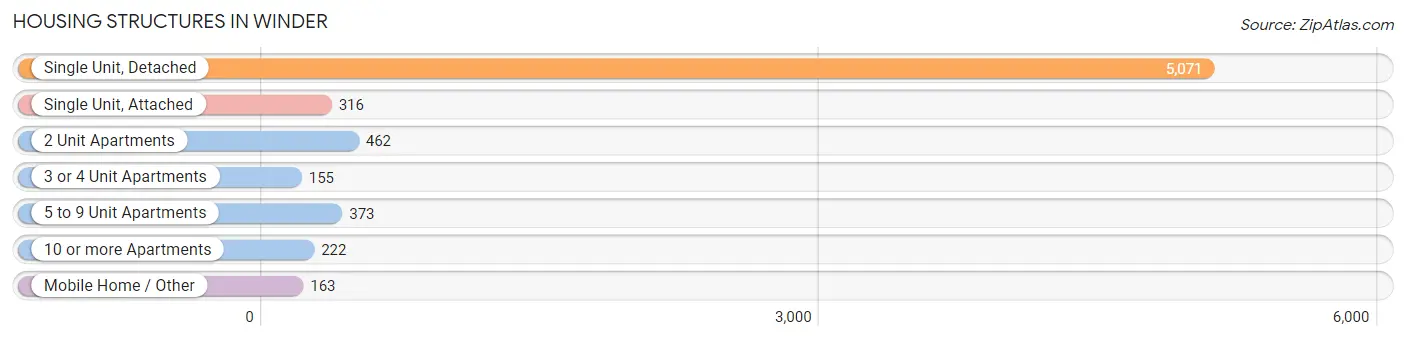
| Structure Type | # Housing Units | % Housing Units |
| Single Unit, Detached | 5,071 | 75.0% |
| Single Unit, Attached | 316 | 4.7% |
| 2 Unit Apartments | 462 | 6.8% |
| 3 or 4 Unit Apartments | 155 | 2.3% |
| 5 to 9 Unit Apartments | 373 | 5.5% |
| 10 or more Apartments | 222 | 3.3% |
| Mobile Home / Other | 163 | 2.4% |
| Total | 6,762 | 100.0% |
Housing Structures by Occupancy in Winder
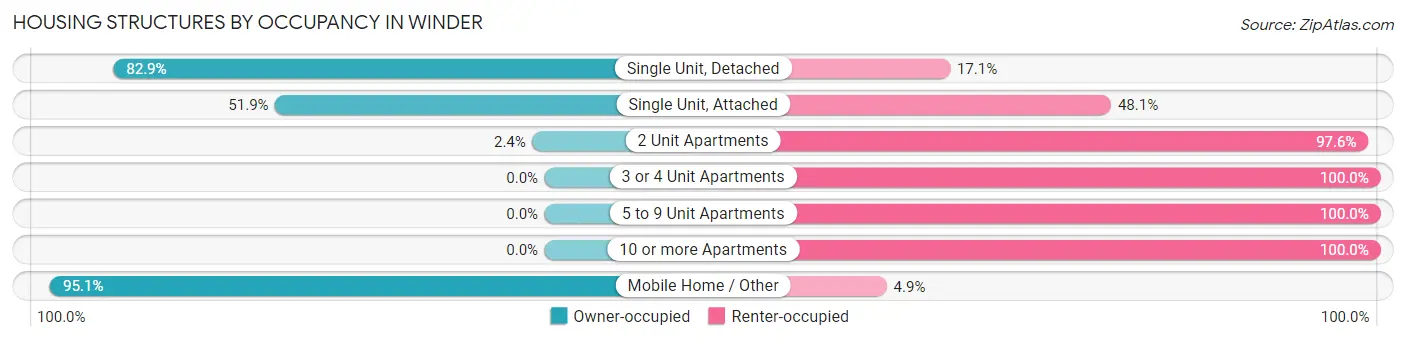
| Structure Type | Owner-occupied | Renter-occupied |
| Single Unit, Detached | 4,204 (82.9%) | 867 (17.1%) |
| Single Unit, Attached | 164 (51.9%) | 152 (48.1%) |
| 2 Unit Apartments | 11 (2.4%) | 451 (97.6%) |
| 3 or 4 Unit Apartments | 0 (0.0%) | 155 (100.0%) |
| 5 to 9 Unit Apartments | 0 (0.0%) | 373 (100.0%) |
| 10 or more Apartments | 0 (0.0%) | 222 (100.0%) |
| Mobile Home / Other | 155 (95.1%) | 8 (4.9%) |
| Total | 4,534 (67.0%) | 2,228 (33.0%) |
Housing Structures by Number of Rooms in Winder
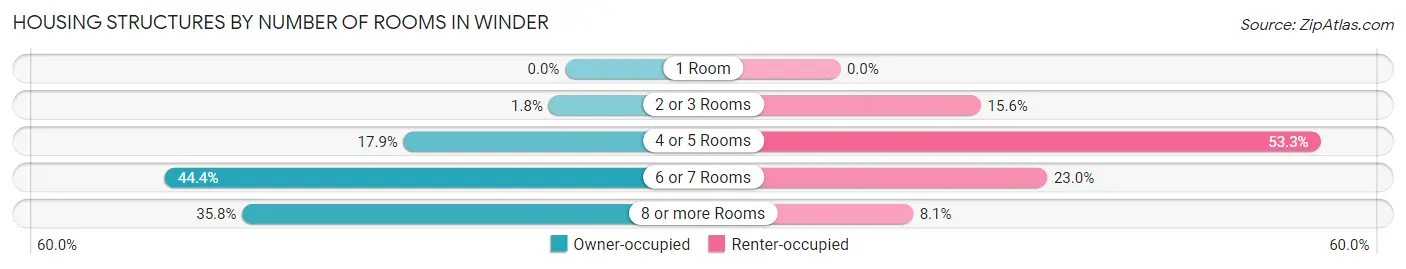
| Number of Rooms | Owner-occupied | Renter-occupied |
| 1 Room | 0 (0.0%) | 0 (0.0%) |
| 2 or 3 Rooms | 83 (1.8%) | 348 (15.6%) |
| 4 or 5 Rooms | 813 (17.9%) | 1,188 (53.3%) |
| 6 or 7 Rooms | 2,013 (44.4%) | 512 (23.0%) |
| 8 or more Rooms | 1,625 (35.8%) | 180 (8.1%) |
| Total | 4,534 (100.0%) | 2,228 (100.0%) |
Housing Structure by Heating Type in Winder
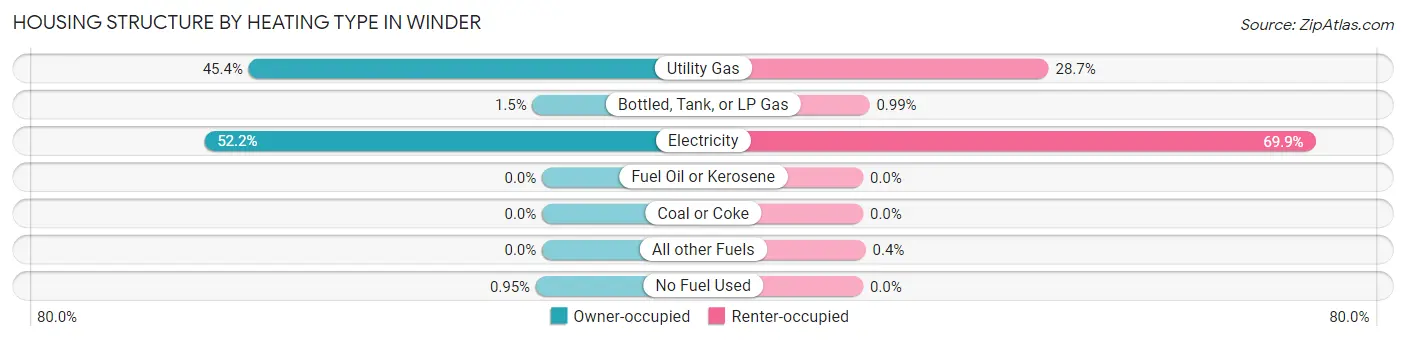
| Heating Type | Owner-occupied | Renter-occupied |
| Utility Gas | 2,056 (45.4%) | 639 (28.7%) |
| Bottled, Tank, or LP Gas | 67 (1.5%) | 22 (1.0%) |
| Electricity | 2,368 (52.2%) | 1,558 (69.9%) |
| Fuel Oil or Kerosene | 0 (0.0%) | 0 (0.0%) |
| Coal or Coke | 0 (0.0%) | 0 (0.0%) |
| All other Fuels | 0 (0.0%) | 9 (0.4%) |
| No Fuel Used | 43 (0.9%) | 0 (0.0%) |
| Total | 4,534 (100.0%) | 2,228 (100.0%) |
Household Vehicle Usage in Winder
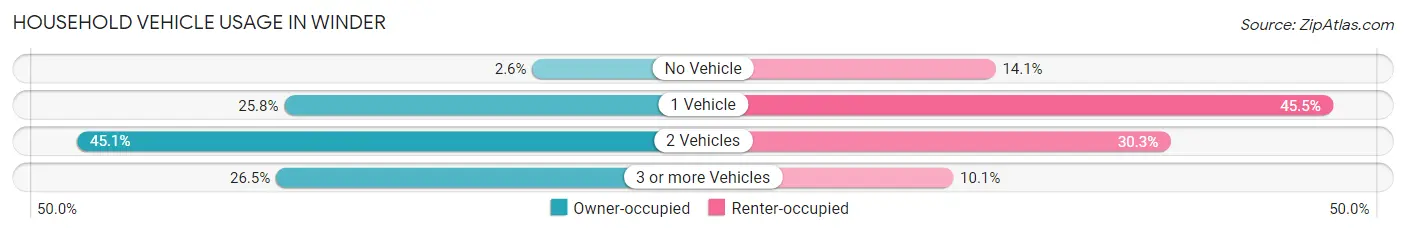
| Vehicles per Household | Owner-occupied | Renter-occupied |
| No Vehicle | 118 (2.6%) | 313 (14.1%) |
| 1 Vehicle | 1,168 (25.8%) | 1,014 (45.5%) |
| 2 Vehicles | 2,045 (45.1%) | 676 (30.3%) |
| 3 or more Vehicles | 1,203 (26.5%) | 225 (10.1%) |
| Total | 4,534 (100.0%) | 2,228 (100.0%) |
Real Estate & Mortgages in Winder
Real Estate and Mortgage Overview in Winder
| Characteristic | Without Mortgage | With Mortgage |
| Housing Units | 1,300 | 3,234 |
| Median Property Value | $204,700 | $236,500 |
| Median Household Income | $50,833 | $493 |
| Monthly Housing Costs | $462 | $53 |
| Real Estate Taxes | $1,604 | $103 |
Property Value by Mortgage Status in Winder
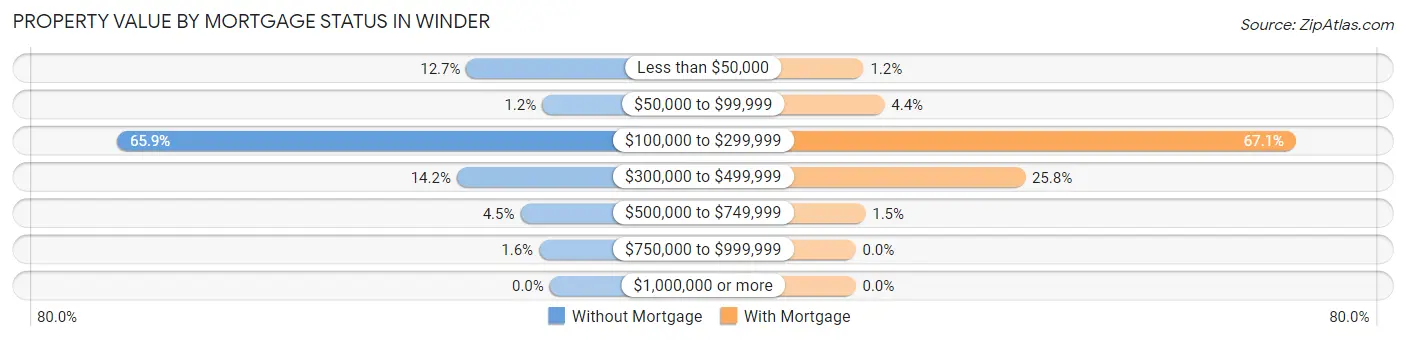
| Property Value | Without Mortgage | With Mortgage |
| Less than $50,000 | 165 (12.7%) | 39 (1.2%) |
| $50,000 to $99,999 | 15 (1.1%) | 142 (4.4%) |
| $100,000 to $299,999 | 857 (65.9%) | 2,170 (67.1%) |
| $300,000 to $499,999 | 184 (14.1%) | 835 (25.8%) |
| $500,000 to $749,999 | 58 (4.5%) | 48 (1.5%) |
| $750,000 to $999,999 | 21 (1.6%) | 0 (0.0%) |
| $1,000,000 or more | 0 (0.0%) | 0 (0.0%) |
| Total | 1,300 (100.0%) | 3,234 (100.0%) |
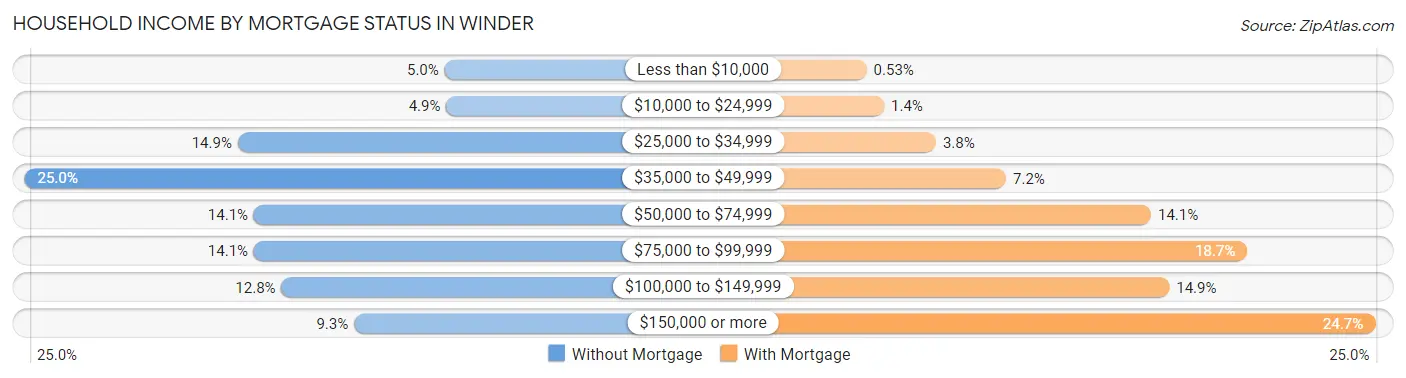
Household Income by Mortgage Status in Winder
| Household Income | Without Mortgage | With Mortgage |
| Less than $10,000 | 65 (5.0%) | 17 (0.5%) |
| $10,000 to $24,999 | 64 (4.9%) | 44 (1.4%) |
| $25,000 to $34,999 | 193 (14.8%) | 124 (3.8%) |
| $35,000 to $49,999 | 325 (25.0%) | 232 (7.2%) |
| $50,000 to $74,999 | 183 (14.1%) | 455 (14.1%) |
| $75,000 to $99,999 | 183 (14.1%) | 603 (18.6%) |
| $100,000 to $149,999 | 166 (12.8%) | 483 (14.9%) |
| $150,000 or more | 121 (9.3%) | 800 (24.7%) |
| Total | 1,300 (100.0%) | 3,234 (100.0%) |
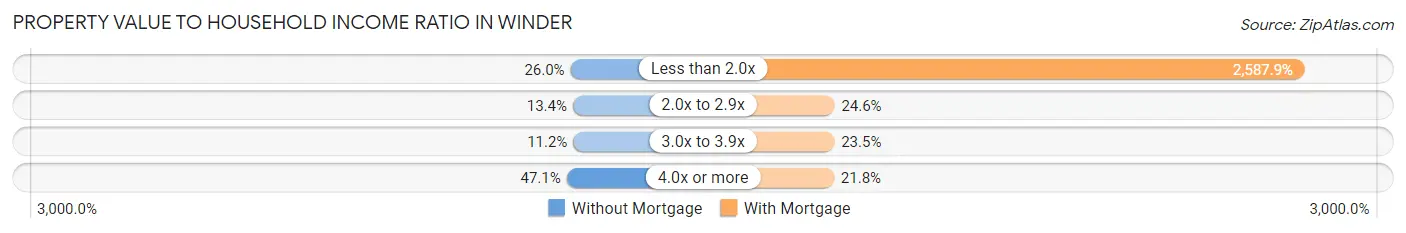
Property Value to Household Income Ratio in Winder
| Value-to-Income Ratio | Without Mortgage | With Mortgage |
| Less than 2.0x | 338 (26.0%) | 83,693 (2,587.9%) |
| 2.0x to 2.9x | 174 (13.4%) | 796 (24.6%) |
| 3.0x to 3.9x | 145 (11.2%) | 760 (23.5%) |
| 4.0x or more | 612 (47.1%) | 705 (21.8%) |
| Total | 1,300 (100.0%) | 3,234 (100.0%) |
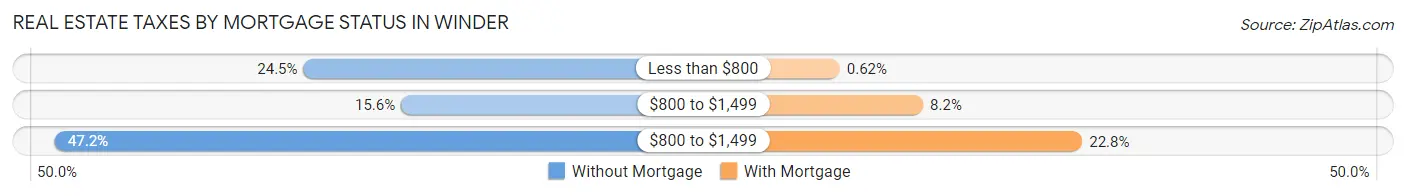
Real Estate Taxes by Mortgage Status in Winder
| Property Taxes | Without Mortgage | With Mortgage |
| Less than $800 | 319 (24.5%) | 20 (0.6%) |
| $800 to $1,499 | 203 (15.6%) | 266 (8.2%) |
| $800 to $1,499 | 614 (47.2%) | 736 (22.8%) |
| Total | 1,300 (100.0%) | 3,234 (100.0%) |
Health & Disability in Winder
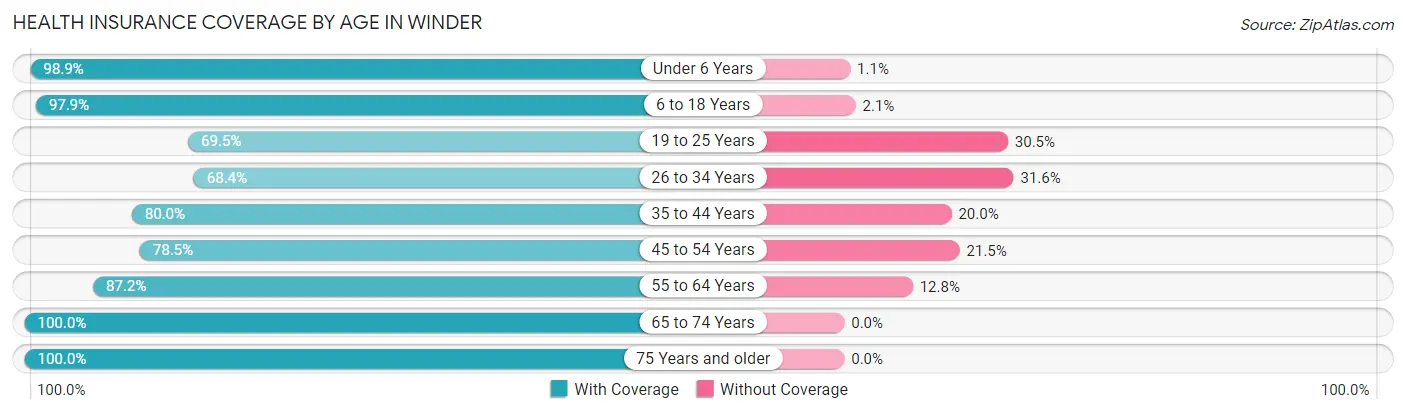
Health Insurance Coverage by Age in Winder
| Age Bracket | With Coverage | Without Coverage |
| Under 6 Years | 1,544 (98.9%) | 17 (1.1%) |
| 6 to 18 Years | 3,251 (97.9%) | 70 (2.1%) |
| 19 to 25 Years | 1,153 (69.5%) | 506 (30.5%) |
| 26 to 34 Years | 1,526 (68.4%) | 704 (31.6%) |
| 35 to 44 Years | 2,257 (80.0%) | 564 (20.0%) |
| 45 to 54 Years | 1,764 (78.5%) | 483 (21.5%) |
| 55 to 64 Years | 1,729 (87.2%) | 253 (12.8%) |
| 65 to 74 Years | 1,542 (100.0%) | 0 (0.0%) |
| 75 Years and older | 848 (100.0%) | 0 (0.0%) |
| Total | 15,614 (85.7%) | 2,597 (14.3%) |
Health Insurance Coverage by Citizenship Status in Winder
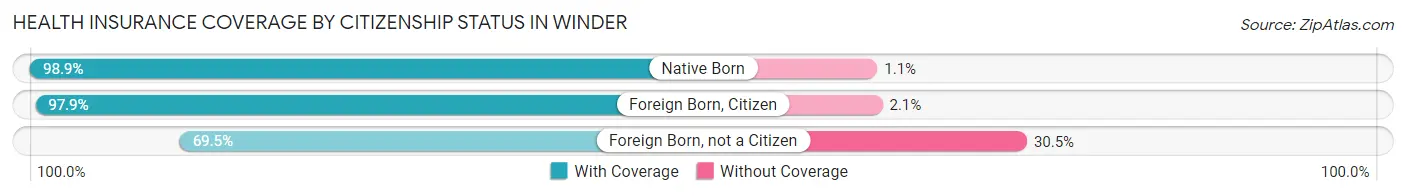
| Citizenship Status | With Coverage | Without Coverage |
| Native Born | 1,544 (98.9%) | 17 (1.1%) |
| Foreign Born, Citizen | 3,251 (97.9%) | 70 (2.1%) |
| Foreign Born, not a Citizen | 1,153 (69.5%) | 506 (30.5%) |
Health Insurance Coverage by Household Income in Winder
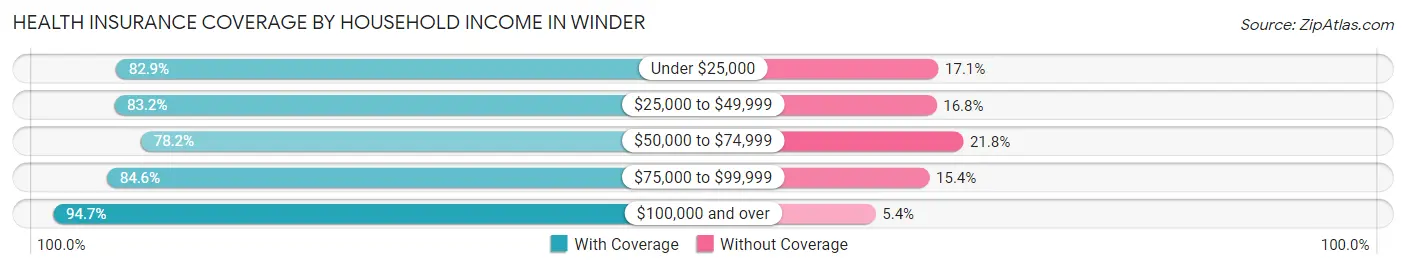
| Household Income | With Coverage | Without Coverage |
| Under $25,000 | 1,749 (82.9%) | 361 (17.1%) |
| $25,000 to $49,999 | 3,483 (83.2%) | 702 (16.8%) |
| $50,000 to $74,999 | 2,958 (78.2%) | 823 (21.8%) |
| $75,000 to $99,999 | 2,129 (84.6%) | 388 (15.4%) |
| $100,000 and over | 5,254 (94.7%) | 297 (5.3%) |
Public vs Private Health Insurance Coverage by Age in Winder
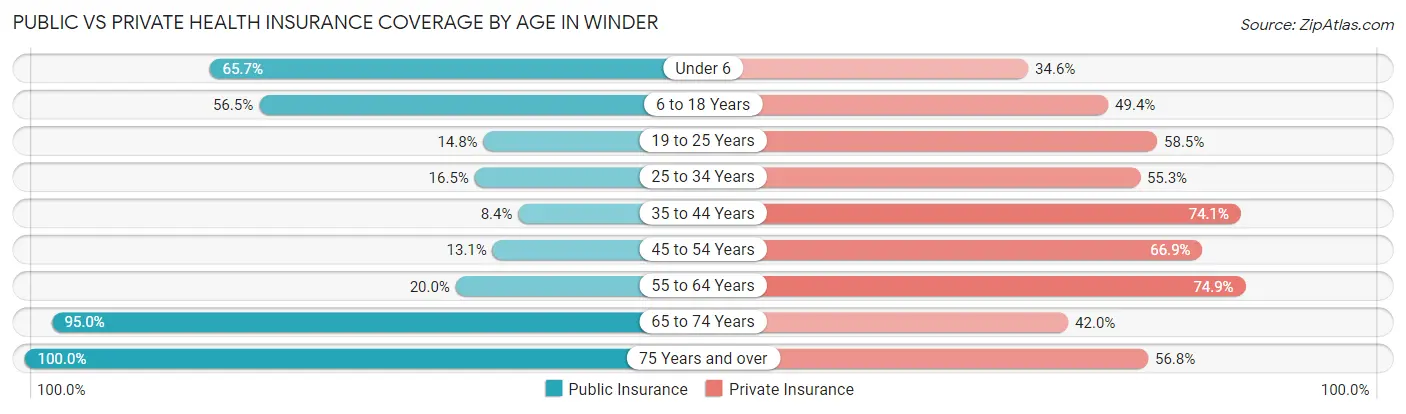
| Age Bracket | Public Insurance | Private Insurance |
| Under 6 | 1,025 (65.7%) | 540 (34.6%) |
| 6 to 18 Years | 1,876 (56.5%) | 1,642 (49.4%) |
| 19 to 25 Years | 246 (14.8%) | 971 (58.5%) |
| 25 to 34 Years | 367 (16.5%) | 1,234 (55.3%) |
| 35 to 44 Years | 236 (8.4%) | 2,089 (74.1%) |
| 45 to 54 Years | 295 (13.1%) | 1,504 (66.9%) |
| 55 to 64 Years | 396 (20.0%) | 1,485 (74.9%) |
| 65 to 74 Years | 1,465 (95.0%) | 648 (42.0%) |
| 75 Years and over | 848 (100.0%) | 482 (56.8%) |
| Total | 6,754 (37.1%) | 10,595 (58.2%) |
Disability Status by Sex by Age in Winder
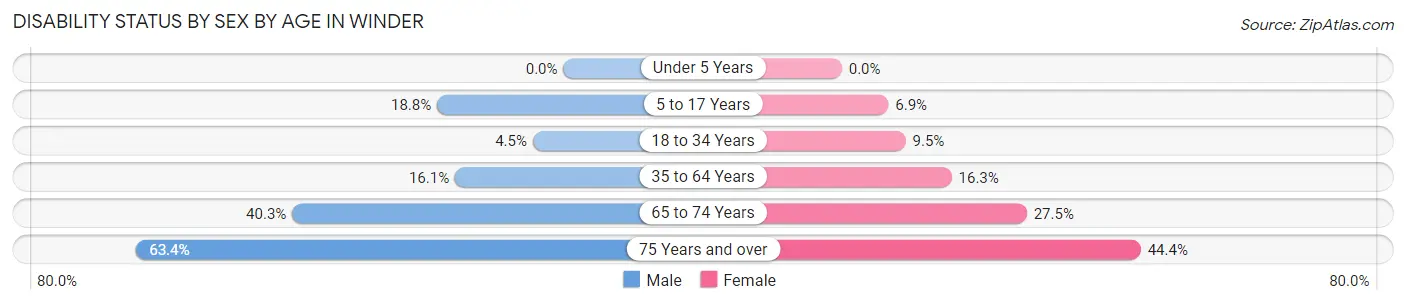
| Age Bracket | Male | Female |
| Under 5 Years | 0 (0.0%) | 0 (0.0%) |
| 5 to 17 Years | 318 (18.8%) | 127 (6.9%) |
| 18 to 34 Years | 94 (4.5%) | 193 (9.5%) |
| 35 to 64 Years | 559 (16.1%) | 583 (16.3%) |
| 65 to 74 Years | 269 (40.3%) | 240 (27.5%) |
| 75 Years and over | 182 (63.4%) | 249 (44.4%) |
Disability Class by Sex by Age in Winder
Disability Class: Hearing Difficulty
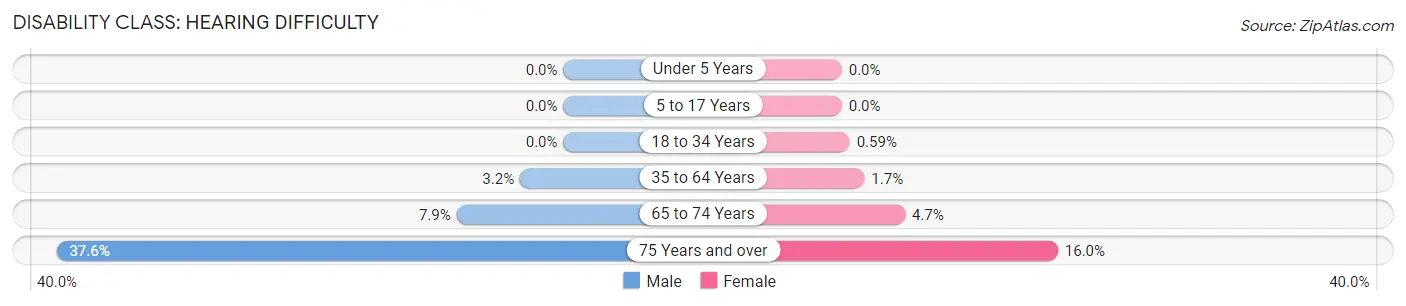
| Age Bracket | Male | Female |
| Under 5 Years | 0 (0.0%) | 0 (0.0%) |
| 5 to 17 Years | 0 (0.0%) | 0 (0.0%) |
| 18 to 34 Years | 0 (0.0%) | 12 (0.6%) |
| 35 to 64 Years | 112 (3.2%) | 60 (1.7%) |
| 65 to 74 Years | 53 (7.9%) | 41 (4.7%) |
| 75 Years and over | 108 (37.6%) | 90 (16.0%) |
Disability Class: Vision Difficulty
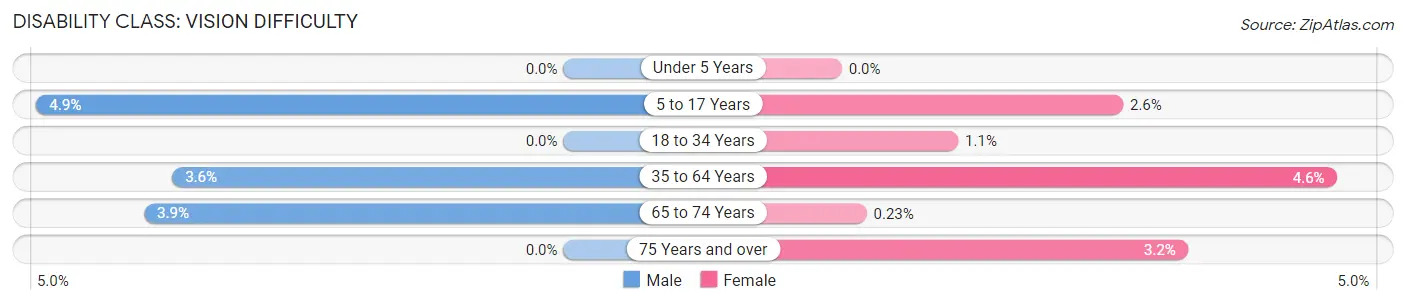
| Age Bracket | Male | Female |
| Under 5 Years | 0 (0.0%) | 0 (0.0%) |
| 5 to 17 Years | 83 (4.9%) | 48 (2.6%) |
| 18 to 34 Years | 0 (0.0%) | 22 (1.1%) |
| 35 to 64 Years | 126 (3.6%) | 164 (4.6%) |
| 65 to 74 Years | 26 (3.9%) | 2 (0.2%) |
| 75 Years and over | 0 (0.0%) | 18 (3.2%) |
Disability Class: Cognitive Difficulty
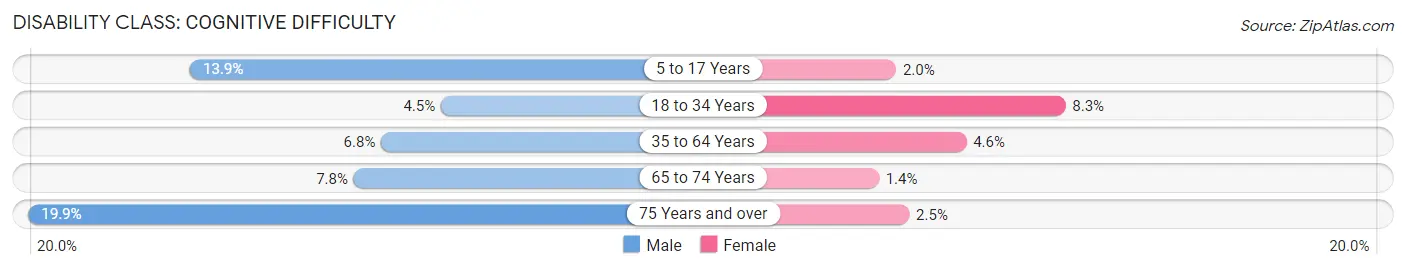
| Age Bracket | Male | Female |
| 5 to 17 Years | 235 (13.9%) | 37 (2.0%) |
| 18 to 34 Years | 94 (4.5%) | 169 (8.3%) |
| 35 to 64 Years | 235 (6.8%) | 165 (4.6%) |
| 65 to 74 Years | 52 (7.8%) | 12 (1.4%) |
| 75 Years and over | 57 (19.9%) | 14 (2.5%) |
Disability Class: Ambulatory Difficulty
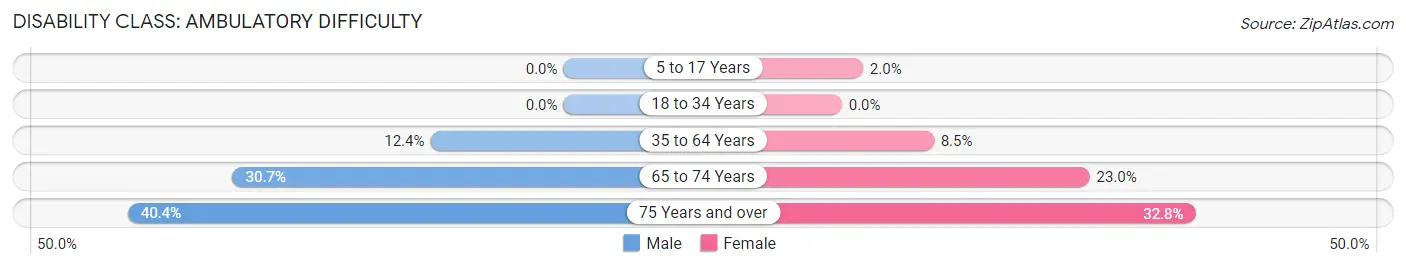
| Age Bracket | Male | Female |
| 5 to 17 Years | 0 (0.0%) | 36 (2.0%) |
| 18 to 34 Years | 0 (0.0%) | 0 (0.0%) |
| 35 to 64 Years | 429 (12.3%) | 305 (8.5%) |
| 65 to 74 Years | 205 (30.7%) | 201 (23.0%) |
| 75 Years and over | 116 (40.4%) | 184 (32.8%) |
Disability Class: Self-Care Difficulty
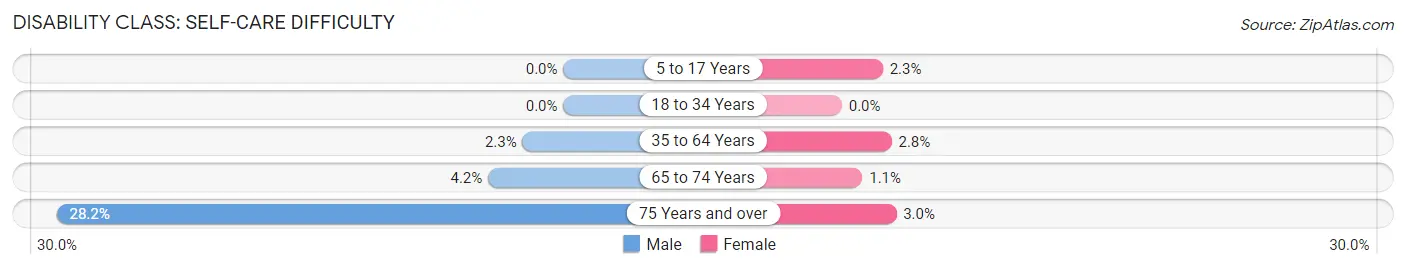
| Age Bracket | Male | Female |
| 5 to 17 Years | 0 (0.0%) | 42 (2.3%) |
| 18 to 34 Years | 0 (0.0%) | 0 (0.0%) |
| 35 to 64 Years | 79 (2.3%) | 99 (2.8%) |
| 65 to 74 Years | 28 (4.2%) | 10 (1.1%) |
| 75 Years and over | 81 (28.2%) | 17 (3.0%) |
Technology Access in Winder
Computing Device Access in Winder
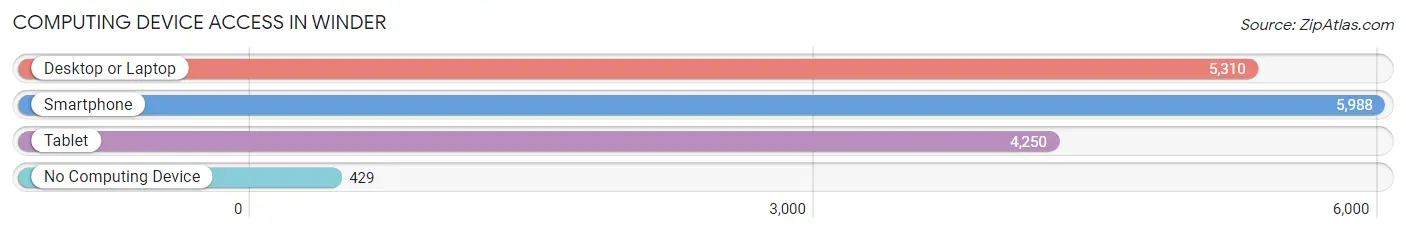
| Device Type | # Households | % Households |
| Desktop or Laptop | 5,310 | 78.5% |
| Smartphone | 5,988 | 88.5% |
| Tablet | 4,250 | 62.8% |
| No Computing Device | 429 | 6.3% |
| Total | 6,762 | 100.0% |
Internet Access in Winder
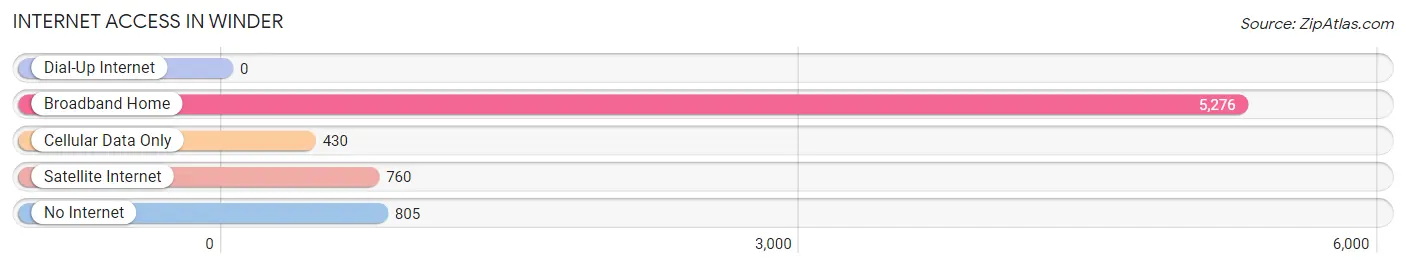
| Internet Type | # Households | % Households |
| Dial-Up Internet | 0 | 0.0% |
| Broadband Home | 5,276 | 78.0% |
| Cellular Data Only | 430 | 6.4% |
| Satellite Internet | 760 | 11.2% |
| No Internet | 805 | 11.9% |
| Total | 6,762 | 100.0% |
Winder Summary
Winder, Georgia is a city located in Barrow County, Georgia, United States. It is the county seat of Barrow County and is located approximately 50 miles northeast of Atlanta. The population of Winder was estimated to be 14,099 in 2019.
History
Winder was founded in 1869 and was named after John H. Winder, a prominent local citizen. The city was incorporated in 1882 and was the first city in Barrow County. The city was originally a railroad town, with the Georgia Railroad and Banking Company running through the city. The city was also home to the first cotton mill in Barrow County, which was built in 1883.
The city was home to a number of prominent citizens, including the first mayor of Winder, John H. Winder, and the first postmaster, William H. Winder. The city was also home to the first newspaper in Barrow County, the Winder News, which was founded in 1883.
Geography
Winder is located in the Piedmont region of Georgia, at an elevation of 845 feet. The city is located in the foothills of the Blue Ridge Mountains and is approximately 50 miles northeast of Atlanta. The city is located at the intersection of US Highway 29 and Georgia State Route 8.
The city is located in a humid subtropical climate zone, with hot, humid summers and mild winters. The average annual temperature is 61.3°F, with an average high of 79.2°F and an average low of 43.4°F. The average annual precipitation is 48.3 inches.
Economy
Winder is home to a number of businesses and industries, including manufacturing, retail, and healthcare. The city is home to a number of manufacturing companies, including Georgia-Pacific, which produces paper products, and the Winder-Barrow Industrial Park, which is home to a number of manufacturing companies.
The city is also home to a number of retail businesses, including a Walmart Supercenter, a Kroger grocery store, and a number of restaurants and shops. The city is also home to a number of healthcare facilities, including the Barrow Regional Medical Center and the Winder Medical Center.
Demographics
As of the 2019 census, the population of Winder was estimated to be 14,099. The racial makeup of the city was 79.2% White, 15.3% African American, 0.7% Asian, 0.2% Native American, 0.1% Pacific Islander, and 4.5% from other races. The median household income was $45,945, and the median family income was $54,945. The per capita income was $22,945.
Conclusion
Winder, Georgia is a city located in Barrow County, Georgia, United States. It is the county seat of Barrow County and is located approximately 50 miles northeast of Atlanta. The city was founded in 1869 and was named after John H. Winder, a prominent local citizen. The city is home to a number of businesses and industries, including manufacturing, retail, and healthcare. The population of Winder was estimated to be 14,099 in 2019. The racial makeup of the city was 79.2% White, 15.3% African American, 0.7% Asian, 0.2% Native American, 0.1% Pacific Islander, and 4.5% from other races. The median household income was $45,945, and the median family income was $54,945. The per capita income was $22,945.
Common Questions
What is Per Capita Income in Winder?
Per Capita income in Winder is $28,458.
What is the Median Family Income in Winder?
Median Family Income in Winder is $68,093.
What is the Median Household income in Winder?
Median Household Income in Winder is $57,365.
What is Income or Wage Gap in Winder?
Income or Wage Gap in Winder is 9.3%.
Women in Winder earn 90.7 cents for every dollar earned by a man.
What is Family Income Deficit in Winder?
Family Income Deficit in Winder is $13,626.
Families that are below poverty line in Winder earn $13,626 less on average than the poverty threshold level.
What is Inequality or Gini Index in Winder?
Inequality or Gini Index in Winder is 0.43.
What is the Total Population of Winder?
Total Population of Winder is 18,414.
What is the Total Male Population of Winder?
Total Male Population of Winder is 8,829.
What is the Total Female Population of Winder?
Total Female Population of Winder is 9,585.
What is the Ratio of Males per 100 Females in Winder?
There are 92.11 Males per 100 Females in Winder.
What is the Ratio of Females per 100 Males in Winder?
There are 108.56 Females per 100 Males in Winder.
What is the Median Population Age in Winder?
Median Population Age in Winder is 36.4 Years.
What is the Average Family Size in Winder
Average Family Size in Winder is 3.2 People.
What is the Average Household Size in Winder
Average Household Size in Winder is 2.7 People.
How Large is the Labor Force in Winder?
There are 9,189 People in the Labor Forcein in Winder.
What is the Percentage of People in the Labor Force in Winder?
64.5% of People are in the Labor Force in Winder.
What is the Unemployment Rate in Winder?
Unemployment Rate in Winder is 5.8%.