Ephesus, GA Map & Demographics
Ephesus Map
Ephesus Overview
$31,141
PER CAPITA INCOME
$73,750
AVG FAMILY INCOME
$66,875
AVG HOUSEHOLD INCOME
59.1%
WAGE / INCOME GAP [ % ]
40.9¢/ $1
WAGE / INCOME GAP [ $ ]
0.41
INEQUALITY / GINI INDEX
553
TOTAL POPULATION
311
MALE POPULATION
242
FEMALE POPULATION
128.51
MALES / 100 FEMALES
77.81
FEMALES / 100 MALES
29.9
MEDIAN AGE
3.2
AVG FAMILY SIZE
2.7
AVG HOUSEHOLD SIZE
279
LABOR FORCE [ PEOPLE ]
69.4%
PERCENT IN LABOR FORCE
4.3%
UNEMPLOYMENT RATE
Income in Ephesus
Income Overview in Ephesus
Per Capita Income in Ephesus is $31,141, while median incomes of families and households are $73,750 and $66,875 respectively.
| Characteristic | Number | Measure |
| Per Capita Income | 553 | $31,141 |
| Median Family Income | 152 | $73,750 |
| Mean Family Income | 152 | $74,324 |
| Median Household Income | 205 | $66,875 |
| Mean Household Income | 205 | $81,944 |
| Income Deficit | 152 | $0 |
| Wage / Income Gap (%) | 553 | 59.10% |
| Wage / Income Gap ($) | 553 | 40.90¢ per $1 |
| Gini / Inequality Index | 553 | 0.41 |
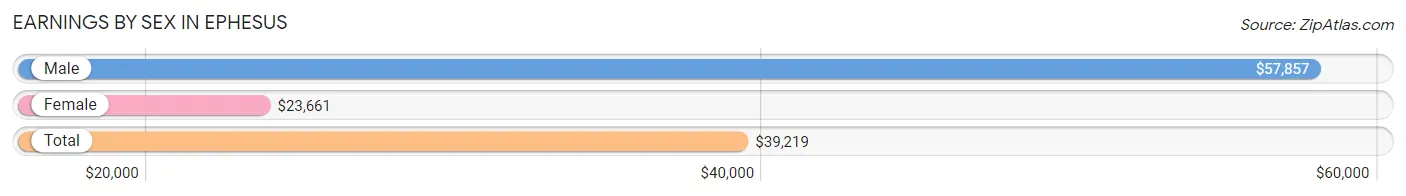
Earnings by Sex in Ephesus
Average Earnings in Ephesus are $39,219, $57,857 for men and $23,661 for women, a difference of 59.1%.
| Sex | Number | Average Earnings |
| Male | 178 (62.7%) | $57,857 |
| Female | 106 (37.3%) | $23,661 |
| Total | 284 (100.0%) | $39,219 |
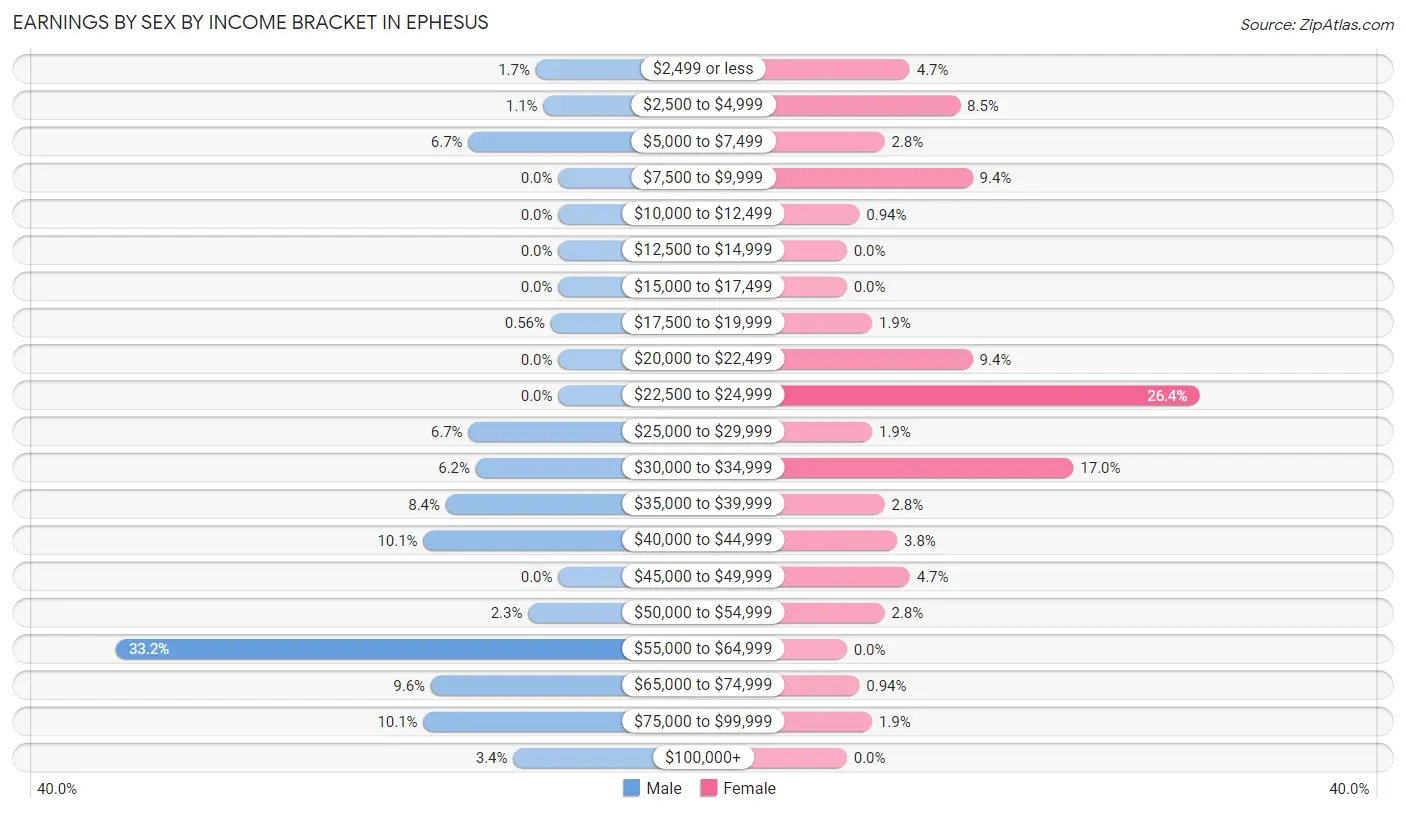
Earnings by Sex by Income Bracket in Ephesus
The most common earnings brackets in Ephesus are $55,000 to $64,999 for men (59 | 33.2%) and $22,500 to $24,999 for women (28 | 26.4%).
| Income | Male | Female |
| $2,499 or less | 3 (1.7%) | 5 (4.7%) |
| $2,500 to $4,999 | 2 (1.1%) | 9 (8.5%) |
| $5,000 to $7,499 | 12 (6.7%) | 3 (2.8%) |
| $7,500 to $9,999 | 0 (0.0%) | 10 (9.4%) |
| $10,000 to $12,499 | 0 (0.0%) | 1 (0.9%) |
| $12,500 to $14,999 | 0 (0.0%) | 0 (0.0%) |
| $15,000 to $17,499 | 0 (0.0%) | 0 (0.0%) |
| $17,500 to $19,999 | 1 (0.6%) | 2 (1.9%) |
| $20,000 to $22,499 | 0 (0.0%) | 10 (9.4%) |
| $22,500 to $24,999 | 0 (0.0%) | 28 (26.4%) |
| $25,000 to $29,999 | 12 (6.7%) | 2 (1.9%) |
| $30,000 to $34,999 | 11 (6.2%) | 18 (17.0%) |
| $35,000 to $39,999 | 15 (8.4%) | 3 (2.8%) |
| $40,000 to $44,999 | 18 (10.1%) | 4 (3.8%) |
| $45,000 to $49,999 | 0 (0.0%) | 5 (4.7%) |
| $50,000 to $54,999 | 4 (2.2%) | 3 (2.8%) |
| $55,000 to $64,999 | 59 (33.2%) | 0 (0.0%) |
| $65,000 to $74,999 | 17 (9.6%) | 1 (0.9%) |
| $75,000 to $99,999 | 18 (10.1%) | 2 (1.9%) |
| $100,000+ | 6 (3.4%) | 0 (0.0%) |
| Total | 178 (100.0%) | 106 (100.0%) |
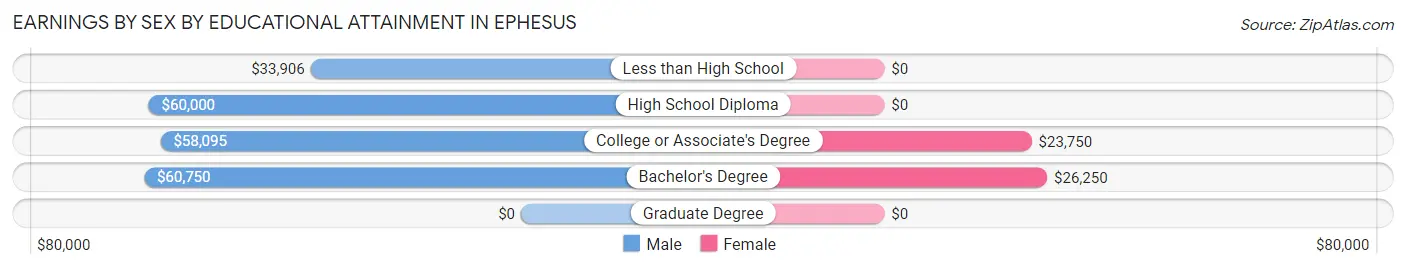
Earnings by Sex by Educational Attainment in Ephesus
Average earnings in Ephesus are $58,170 for men and $23,795 for women, a difference of 59.1%. Men with an educational attainment of bachelor's degree enjoy the highest average annual earnings of $60,750, while those with less than high school education earn the least with $33,906. Women with an educational attainment of bachelor's degree earn the most with the average annual earnings of $26,250, while those with college or associate's degree education have the smallest earnings of $23,750.
| Educational Attainment | Male Income | Female Income |
| Less than High School | $33,906 | $0 |
| High School Diploma | $60,000 | $0 |
| College or Associate's Degree | $58,095 | $23,750 |
| Bachelor's Degree | $60,750 | $26,250 |
| Graduate Degree | - | - |
| Total | $58,170 | $23,795 |
Family Income in Ephesus
Family Income Brackets in Ephesus
According to the Ephesus family income data, there are 52 families falling into the $75,000 to $99,999 income range, which is the most common income bracket and makes up 34.2% of all families.
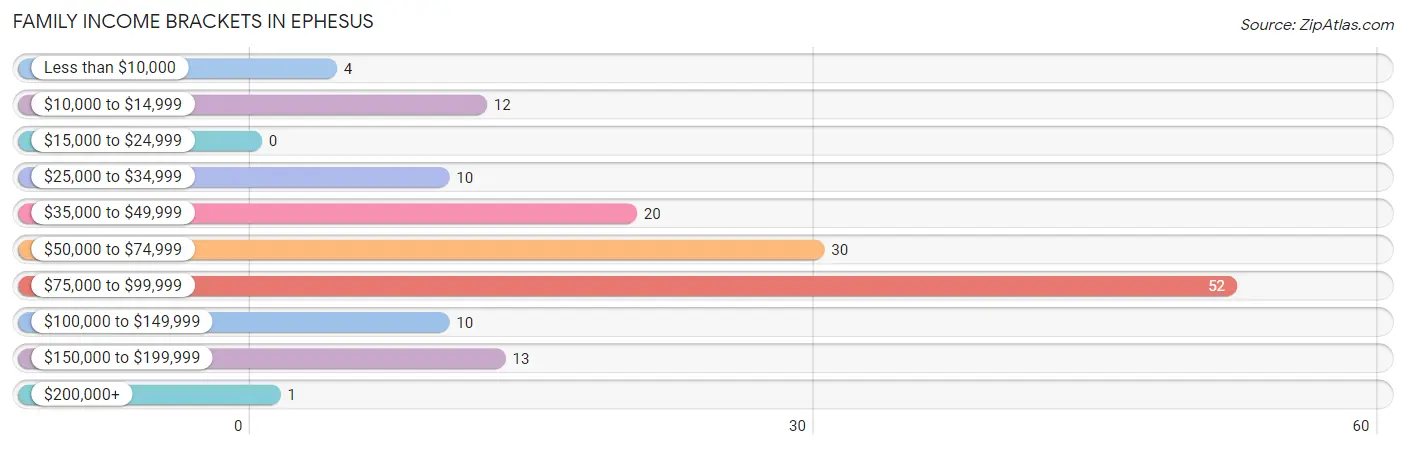
| Income Bracket | # Families | % Families |
| Less than $10,000 | 4 | 2.6% |
| $10,000 to $14,999 | 12 | 7.9% |
| $15,000 to $24,999 | 0 | 0.0% |
| $25,000 to $34,999 | 10 | 6.6% |
| $35,000 to $49,999 | 20 | 13.2% |
| $50,000 to $74,999 | 30 | 19.7% |
| $75,000 to $99,999 | 52 | 34.2% |
| $100,000 to $149,999 | 10 | 6.6% |
| $150,000 to $199,999 | 13 | 8.6% |
| $200,000+ | 1 | 0.7% |
Family Income by Famaliy Size in Ephesus
5-person families (41 | 27.0%) account for the highest median family income in Ephesus with $84,583 per family, while 2-person families (87 | 57.2%) have the highest median income of $27,344 per family member.
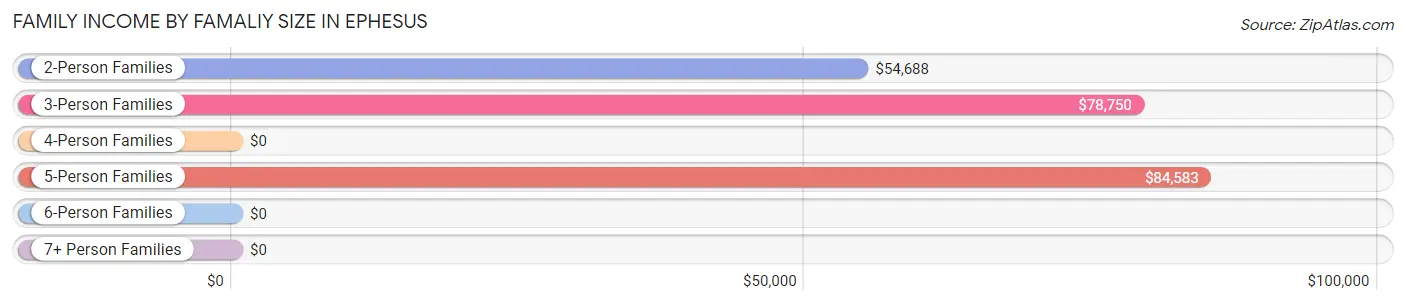
| Income Bracket | # Families | Median Income |
| 2-Person Families | 87 (57.2%) | $54,688 |
| 3-Person Families | 9 (5.9%) | $78,750 |
| 4-Person Families | 11 (7.2%) | $0 |
| 5-Person Families | 41 (27.0%) | $84,583 |
| 6-Person Families | 1 (0.7%) | $0 |
| 7+ Person Families | 3 (2.0%) | $0 |
| Total | 152 (100.0%) | $73,750 |
Family Income by Number of Earners in Ephesus
The median family income in Ephesus is $73,750, with families comprising 3+ earners (11) having the highest median family income of $159,107, while families with no earners (17) have the lowest median family income of $37,250, accounting for 7.2% and 11.2% of families, respectively.
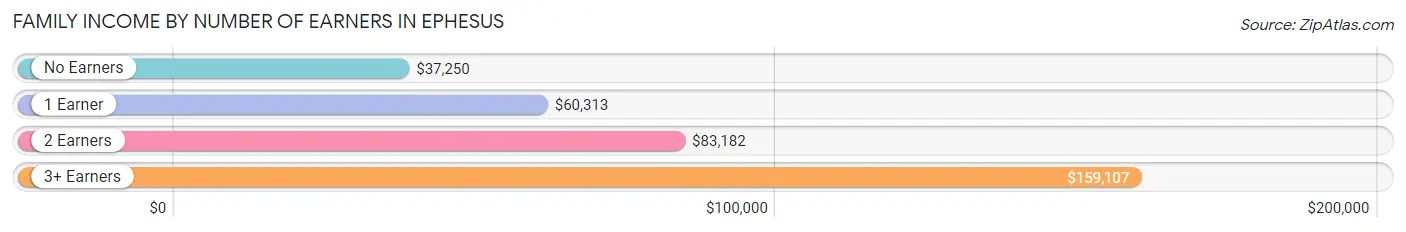
| Number of Earners | # Families | Median Income |
| No Earners | 17 (11.2%) | $37,250 |
| 1 Earner | 50 (32.9%) | $60,313 |
| 2 Earners | 74 (48.7%) | $83,182 |
| 3+ Earners | 11 (7.2%) | $159,107 |
| Total | 152 (100.0%) | $73,750 |
Household Income in Ephesus
Household Income Brackets in Ephesus
With 64 households falling in the category, the $75,000 to $99,999 income range is the most frequent in Ephesus, accounting for 31.2% of all households. In contrast, only 2 households (1.0%) fall into the $200,000+ income bracket, making it the least populous group.
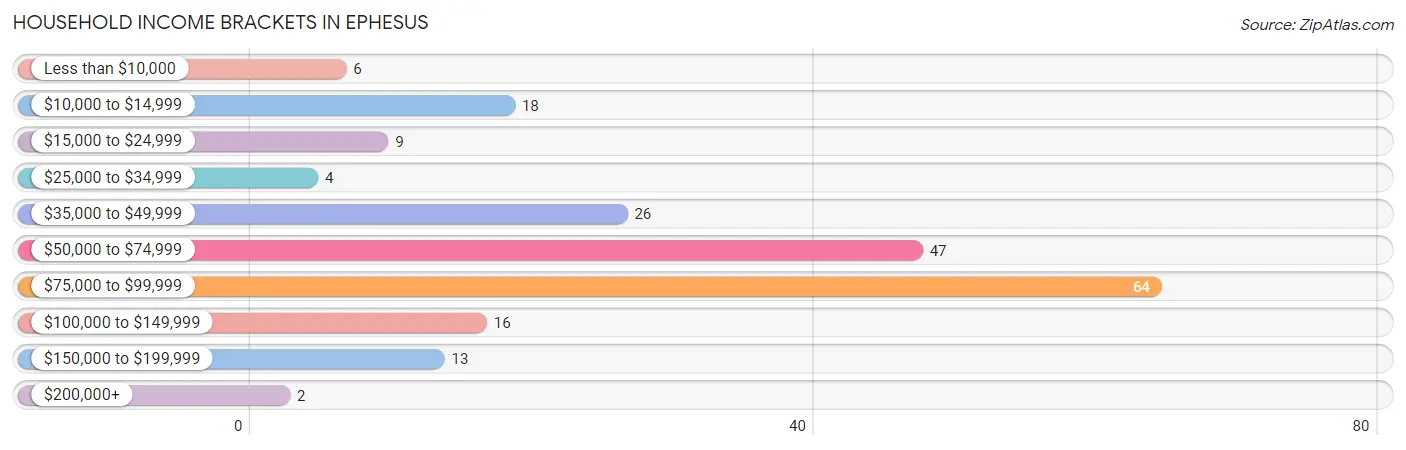
| Income Bracket | # Households | % Households |
| Less than $10,000 | 6 | 2.9% |
| $10,000 to $14,999 | 18 | 8.8% |
| $15,000 to $24,999 | 9 | 4.4% |
| $25,000 to $34,999 | 4 | 2.0% |
| $35,000 to $49,999 | 26 | 12.7% |
| $50,000 to $74,999 | 47 | 22.9% |
| $75,000 to $99,999 | 64 | 31.2% |
| $100,000 to $149,999 | 16 | 7.8% |
| $150,000 to $199,999 | 13 | 6.3% |
| $200,000+ | 2 | 1.0% |
Household Income by Householder Age in Ephesus
The median household income in Ephesus is $66,875, with the highest median household income of $83,869 found in the 25 to 44 years age bracket for the primary householder. A total of 53 households (25.9%) fall into this category. Meanwhile, the 15 to 24 years age bracket for the primary householder has the lowest median household income of $0, with 23 households (11.2%) in this group.
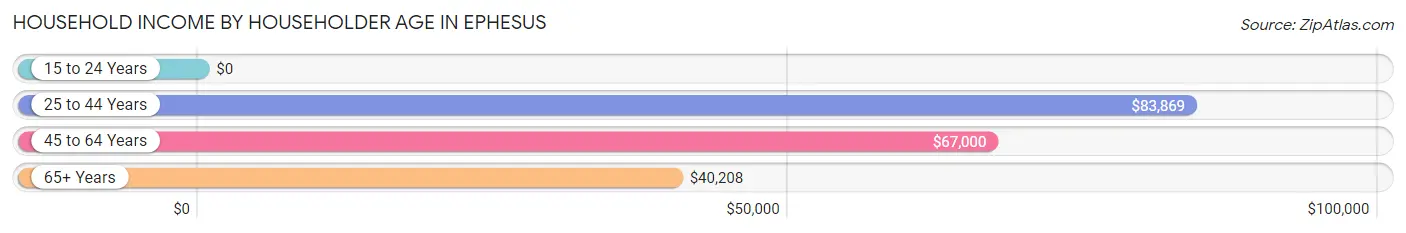
| Income Bracket | # Households | Median Income |
| 15 to 24 Years | 23 (11.2%) | $0 |
| 25 to 44 Years | 53 (25.9%) | $83,869 |
| 45 to 64 Years | 86 (41.9%) | $67,000 |
| 65+ Years | 43 (21.0%) | $40,208 |
| Total | 205 (100.0%) | $66,875 |
Poverty in Ephesus
Income Below Poverty by Sex and Age in Ephesus
With 11.6% poverty level for males and 12.4% for females among the residents of Ephesus, 12 to 14 year old males and 15 year old females are the most vulnerable to poverty, with 4 males (36.4%) and 2 females (100.0%) in their respective age groups living below the poverty level.
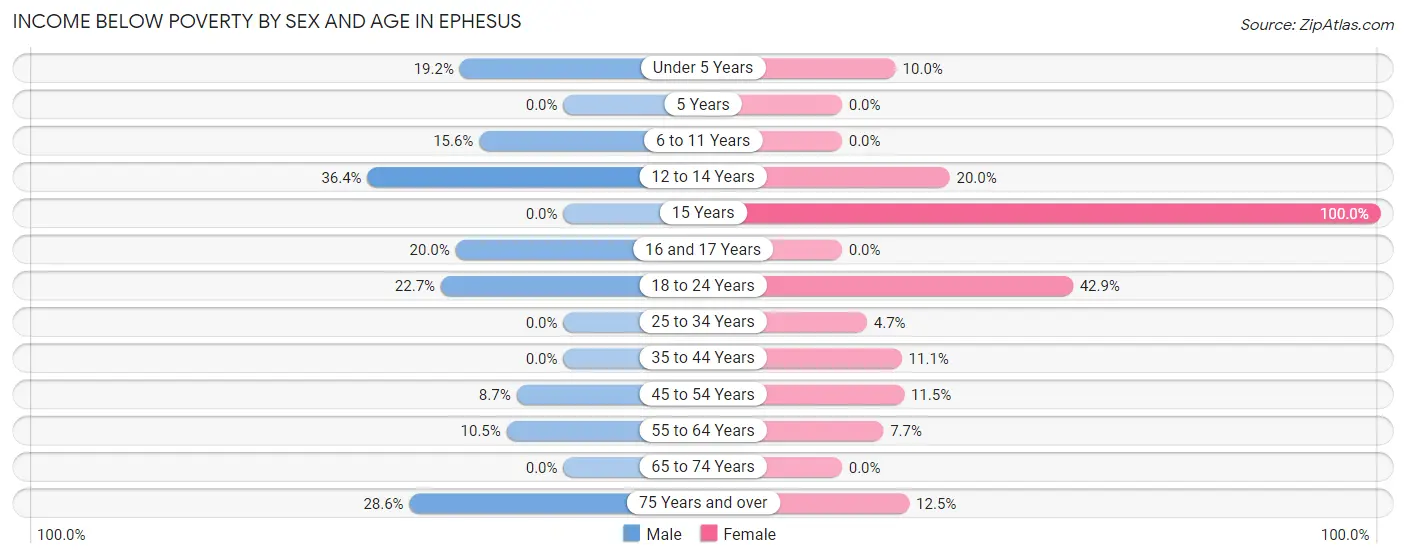
| Age Bracket | Male | Female |
| Under 5 Years | 5 (19.2%) | 4 (10.0%) |
| 5 Years | 0 (0.0%) | 0 (0.0%) |
| 6 to 11 Years | 5 (15.6%) | 0 (0.0%) |
| 12 to 14 Years | 4 (36.4%) | 1 (20.0%) |
| 15 Years | 0 (0.0%) | 2 (100.0%) |
| 16 and 17 Years | 2 (20.0%) | 0 (0.0%) |
| 18 to 24 Years | 10 (22.7%) | 12 (42.9%) |
| 25 to 34 Years | 0 (0.0%) | 2 (4.6%) |
| 35 to 44 Years | 0 (0.0%) | 2 (11.1%) |
| 45 to 54 Years | 4 (8.7%) | 3 (11.5%) |
| 55 to 64 Years | 4 (10.5%) | 2 (7.7%) |
| 65 to 74 Years | 0 (0.0%) | 0 (0.0%) |
| 75 Years and over | 2 (28.6%) | 2 (12.5%) |
| Total | 36 (11.6%) | 30 (12.4%) |
Income Above Poverty by Sex and Age in Ephesus
According to the poverty statistics in Ephesus, males aged 5 years and females aged 6 to 11 years are the age groups that are most secure financially, with 100.0% of males and 100.0% of females in these age groups living above the poverty line.
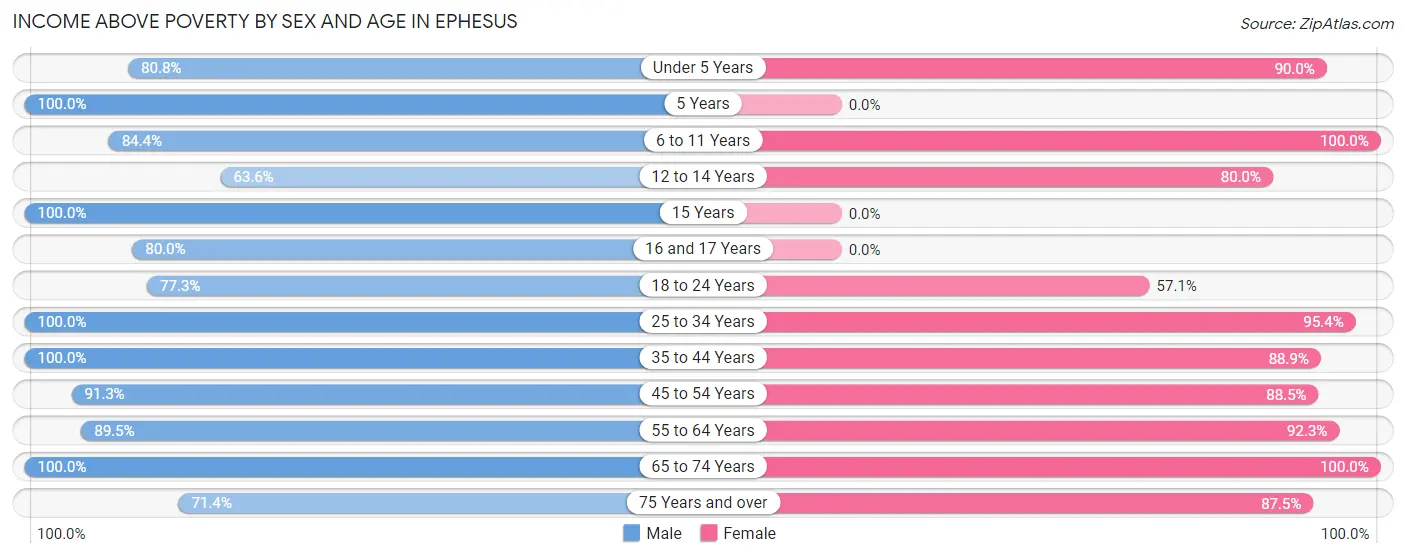
| Age Bracket | Male | Female |
| Under 5 Years | 21 (80.8%) | 36 (90.0%) |
| 5 Years | 9 (100.0%) | 0 (0.0%) |
| 6 to 11 Years | 27 (84.4%) | 23 (100.0%) |
| 12 to 14 Years | 7 (63.6%) | 4 (80.0%) |
| 15 Years | 3 (100.0%) | 0 (0.0%) |
| 16 and 17 Years | 8 (80.0%) | 0 (0.0%) |
| 18 to 24 Years | 34 (77.3%) | 16 (57.1%) |
| 25 to 34 Years | 40 (100.0%) | 41 (95.4%) |
| 35 to 44 Years | 18 (100.0%) | 16 (88.9%) |
| 45 to 54 Years | 42 (91.3%) | 23 (88.5%) |
| 55 to 64 Years | 34 (89.5%) | 24 (92.3%) |
| 65 to 74 Years | 27 (100.0%) | 15 (100.0%) |
| 75 Years and over | 5 (71.4%) | 14 (87.5%) |
| Total | 275 (88.4%) | 212 (87.6%) |
Income Below Poverty Among Married-Couple Families in Ephesus
The poverty statistics for married-couple families in Ephesus show that 9.3% or 12 of the total 129 families live below the poverty line. Families with 5 or more children have the highest poverty rate of 100.0%, comprising of 2 families. On the other hand, families with 1 or 2 children have the lowest poverty rate of 0.0%, which includes 0 families.
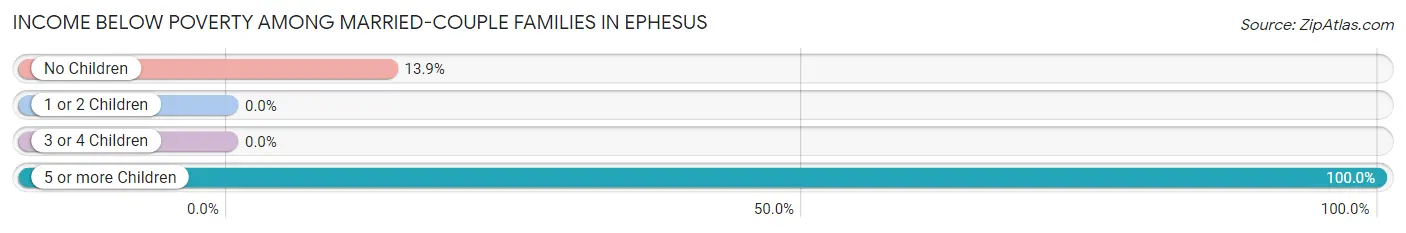
| Children | Above Poverty | Below Poverty |
| No Children | 62 (86.1%) | 10 (13.9%) |
| 1 or 2 Children | 23 (100.0%) | 0 (0.0%) |
| 3 or 4 Children | 32 (100.0%) | 0 (0.0%) |
| 5 or more Children | 0 (0.0%) | 2 (100.0%) |
| Total | 117 (90.7%) | 12 (9.3%) |
Income Below Poverty Among Single-Parent Households in Ephesus
According to the poverty data in Ephesus, 18.2% or 2 single-father households and 33.3% or 4 single-mother households are living below the poverty line. Among single-father households, those with 1 or 2 children have the highest poverty rate, with 2 households (20.0%) experiencing poverty. Likewise, among single-mother households, those with 1 or 2 children have the highest poverty rate, with 2 households (100.0%) falling below the poverty line.
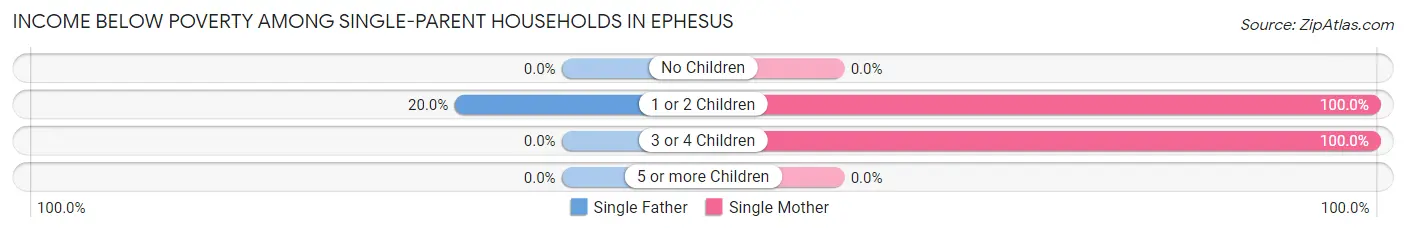
| Children | Single Father | Single Mother |
| No Children | 0 (0.0%) | 0 (0.0%) |
| 1 or 2 Children | 2 (20.0%) | 2 (100.0%) |
| 3 or 4 Children | 0 (0.0%) | 2 (100.0%) |
| 5 or more Children | 0 (0.0%) | 0 (0.0%) |
| Total | 2 (18.2%) | 4 (33.3%) |
Income Below Poverty Among Married-Couple vs Single-Parent Households in Ephesus
The poverty data for Ephesus shows that 12 of the married-couple family households (9.3%) and 6 of the single-parent households (26.1%) are living below the poverty level. Within the married-couple family households, those with 5 or more children have the highest poverty rate, with 2 households (100.0%) falling below the poverty line. Among the single-parent households, those with 3 or 4 children have the highest poverty rate, with 2 household (100.0%) living below poverty.
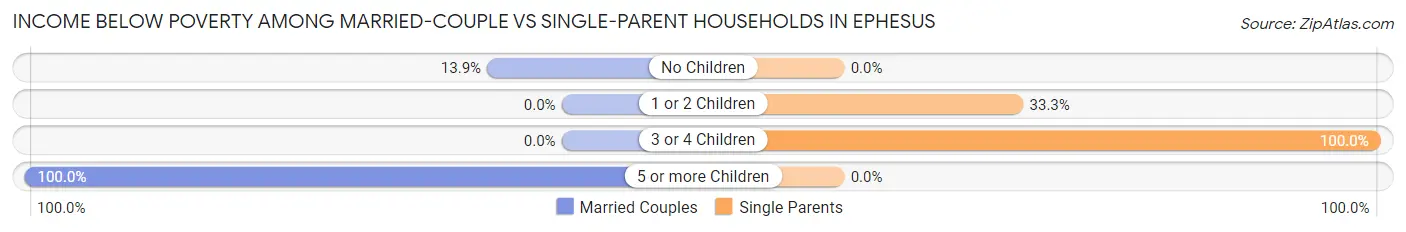
| Children | Married-Couple Families | Single-Parent Households |
| No Children | 10 (13.9%) | 0 (0.0%) |
| 1 or 2 Children | 0 (0.0%) | 4 (33.3%) |
| 3 or 4 Children | 0 (0.0%) | 2 (100.0%) |
| 5 or more Children | 2 (100.0%) | 0 (0.0%) |
| Total | 12 (9.3%) | 6 (26.1%) |
Race in Ephesus
The most populous races in Ephesus are White / Caucasian (548 | 99.1%), Two or more Races (3 | 0.5%), and Hawaiian / Pacific (2 | 0.4%).
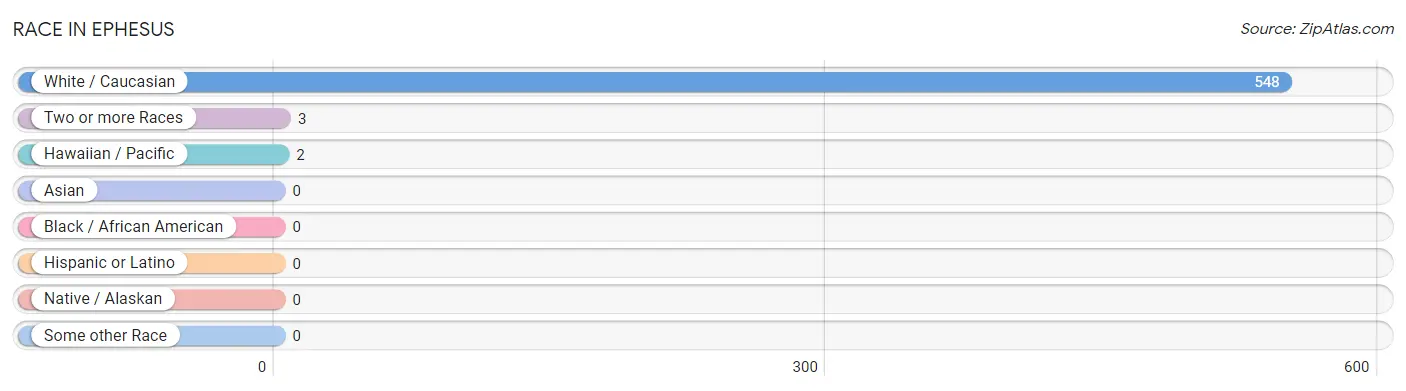
| Race | # Population | % Population |
| Asian | 0 | 0.0% |
| Black / African American | 0 | 0.0% |
| Hawaiian / Pacific | 2 | 0.4% |
| Hispanic or Latino | 0 | 0.0% |
| Native / Alaskan | 0 | 0.0% |
| White / Caucasian | 548 | 99.1% |
| Two or more Races | 3 | 0.5% |
| Some other Race | 0 | 0.0% |
| Total | 553 | 100.0% |
Ancestry in Ephesus
The most populous ancestries reported in Ephesus are American (193 | 34.9%), Irish (74 | 13.4%), German (43 | 7.8%), English (41 | 7.4%), and European (23 | 4.2%), together accounting for 67.6% of all Ephesus residents.
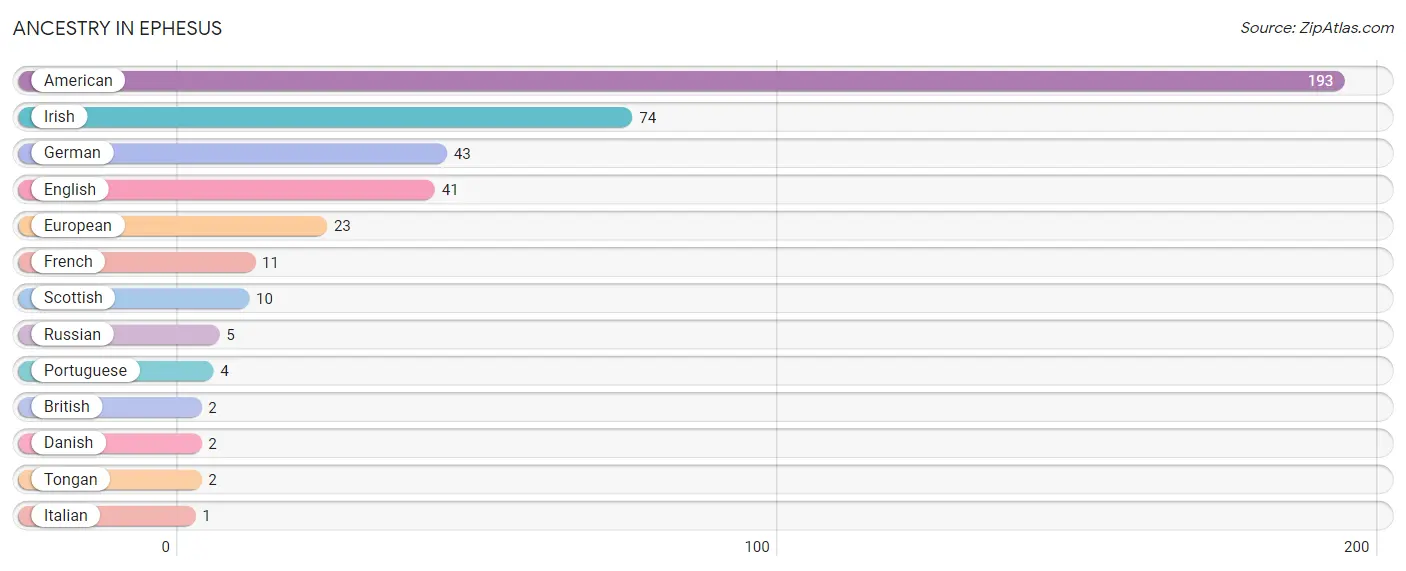
| Ancestry | # Population | % Population |
| American | 193 | 34.9% |
| British | 2 | 0.4% |
| Danish | 2 | 0.4% |
| English | 41 | 7.4% |
| European | 23 | 4.2% |
| French | 11 | 2.0% |
| German | 43 | 7.8% |
| Irish | 74 | 13.4% |
| Italian | 1 | 0.2% |
| Portuguese | 4 | 0.7% |
| Russian | 5 | 0.9% |
| Scottish | 10 | 1.8% |
| Tongan | 2 | 0.4% | View All 13 Rows |
Immigrants in Ephesus
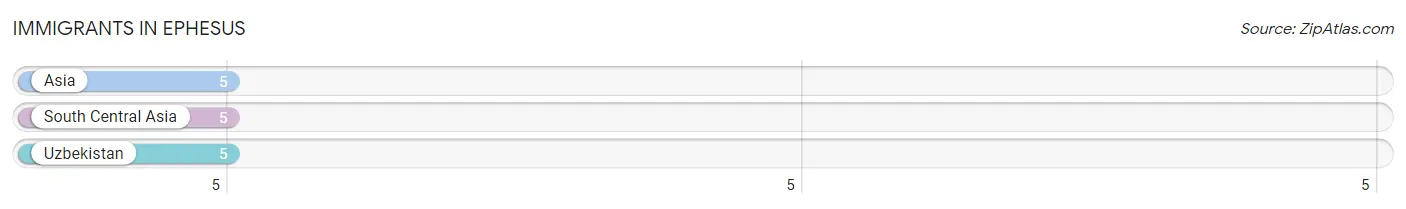
The most numerous immigrant groups reported in Ephesus came from Asia (5 | 0.9%), South Central Asia (5 | 0.9%), and Uzbekistan (5 | 0.9%), together accounting for 2.7% of all Ephesus residents.
| Immigration Origin | # Population | % Population |
| Asia | 5 | 0.9% |
| South Central Asia | 5 | 0.9% |
| Uzbekistan | 5 | 0.9% | View All 3 Rows |
Sex and Age in Ephesus
Sex and Age in Ephesus
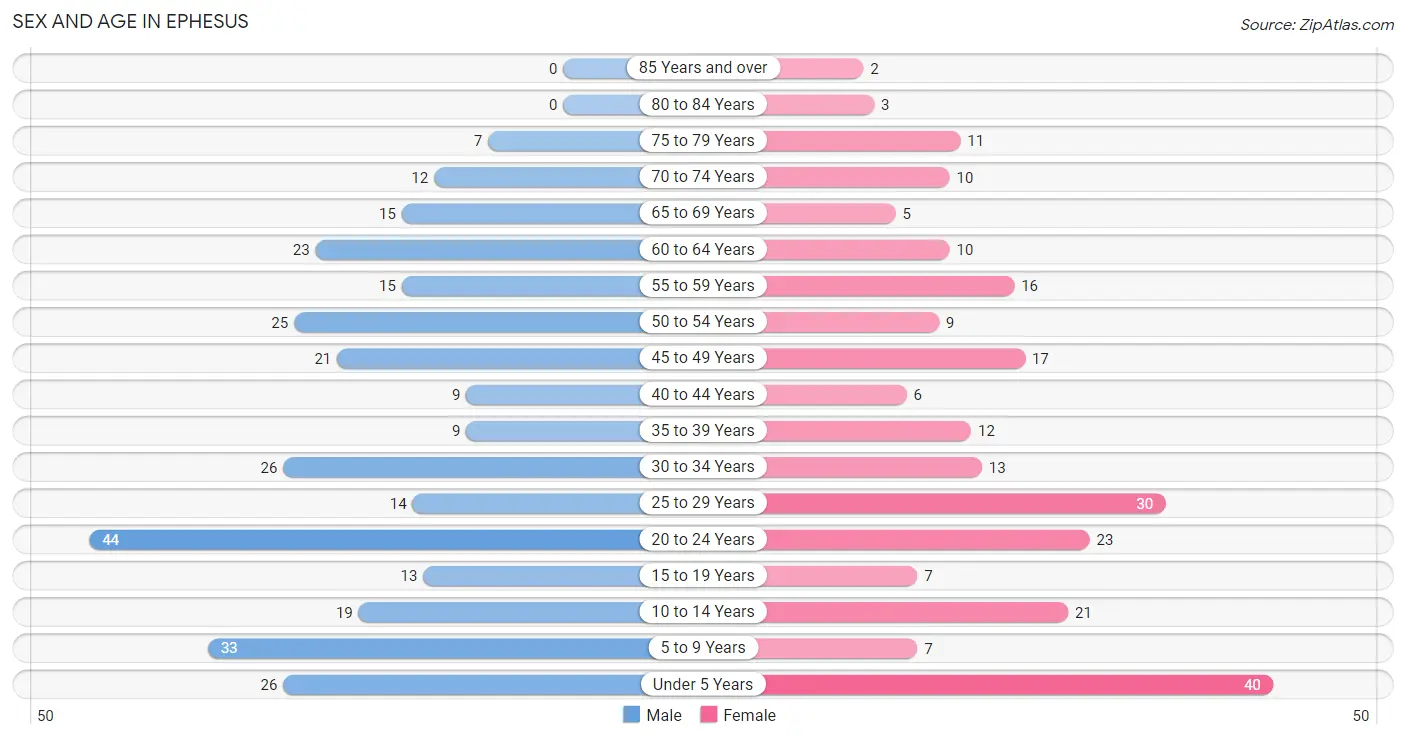
The most populous age groups in Ephesus are 20 to 24 Years (44 | 14.1%) for men and Under 5 Years (40 | 16.5%) for women.
| Age Bracket | Male | Female |
| Under 5 Years | 26 (8.4%) | 40 (16.5%) |
| 5 to 9 Years | 33 (10.6%) | 7 (2.9%) |
| 10 to 14 Years | 19 (6.1%) | 21 (8.7%) |
| 15 to 19 Years | 13 (4.2%) | 7 (2.9%) |
| 20 to 24 Years | 44 (14.1%) | 23 (9.5%) |
| 25 to 29 Years | 14 (4.5%) | 30 (12.4%) |
| 30 to 34 Years | 26 (8.4%) | 13 (5.4%) |
| 35 to 39 Years | 9 (2.9%) | 12 (5.0%) |
| 40 to 44 Years | 9 (2.9%) | 6 (2.5%) |
| 45 to 49 Years | 21 (6.8%) | 17 (7.0%) |
| 50 to 54 Years | 25 (8.0%) | 9 (3.7%) |
| 55 to 59 Years | 15 (4.8%) | 16 (6.6%) |
| 60 to 64 Years | 23 (7.4%) | 10 (4.1%) |
| 65 to 69 Years | 15 (4.8%) | 5 (2.1%) |
| 70 to 74 Years | 12 (3.9%) | 10 (4.1%) |
| 75 to 79 Years | 7 (2.2%) | 11 (4.5%) |
| 80 to 84 Years | 0 (0.0%) | 3 (1.2%) |
| 85 Years and over | 0 (0.0%) | 2 (0.8%) |
| Total | 311 (100.0%) | 242 (100.0%) |
Families and Households in Ephesus
Median Family Size in Ephesus
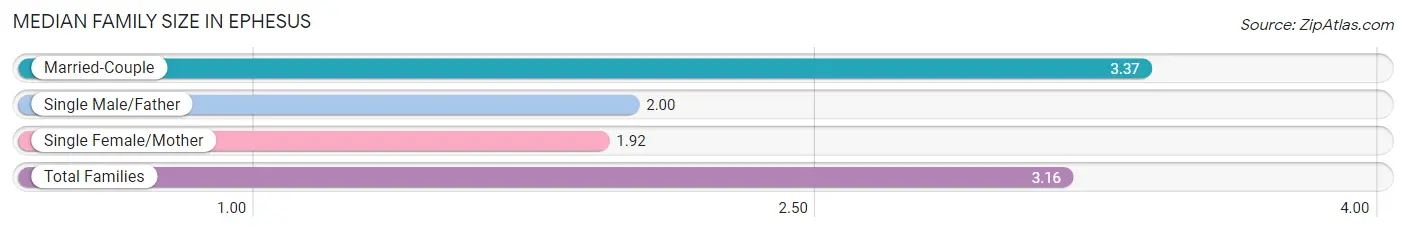
The median family size in Ephesus is 3.16 persons per family, with married-couple families (129 | 84.9%) accounting for the largest median family size of 3.37 persons per family. On the other hand, single female/mother families (12 | 7.9%) represent the smallest median family size with 1.92 persons per family.
| Family Type | # Families | Family Size |
| Married-Couple | 129 (84.9%) | 3.37 |
| Single Male/Father | 11 (7.2%) | 2.00 |
| Single Female/Mother | 12 (7.9%) | 1.92 |
| Total Families | 152 (100.0%) | 3.16 |
Median Household Size in Ephesus
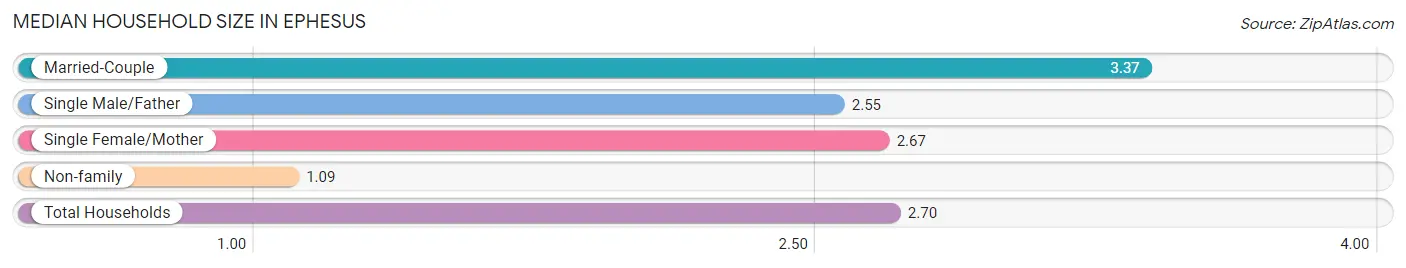
The median household size in Ephesus is 2.70 persons per household, with married-couple households (129 | 62.9%) accounting for the largest median household size of 3.37 persons per household. non-family households (53 | 25.9%) represent the smallest median household size with 1.09 persons per household.
| Household Type | # Households | Household Size |
| Married-Couple | 129 (62.9%) | 3.37 |
| Single Male/Father | 11 (5.4%) | 2.55 |
| Single Female/Mother | 12 (5.9%) | 2.67 |
| Non-family | 53 (25.9%) | 1.09 |
| Total Households | 205 (100.0%) | 2.70 |
Household Size by Marriage Status in Ephesus
Out of a total of 205 households in Ephesus, 152 (74.2%) are family households, while 53 (25.9%) are nonfamily households. The most numerous type of family households are 2-person households, comprising 72, and the most common type of nonfamily households are 1-person households, comprising 47.
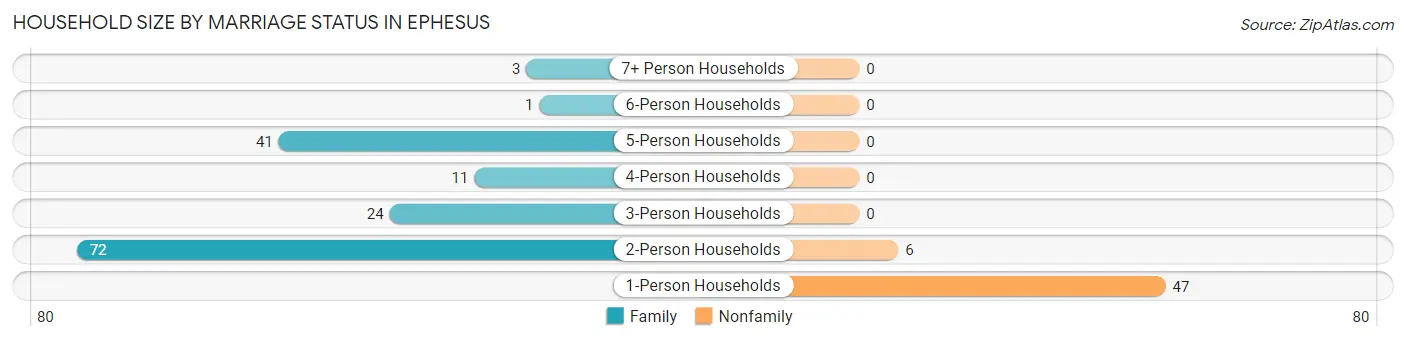
| Household Size | Family Households | Nonfamily Households |
| 1-Person Households | - | 47 (22.9%) |
| 2-Person Households | 72 (35.1%) | 6 (2.9%) |
| 3-Person Households | 24 (11.7%) | 0 (0.0%) |
| 4-Person Households | 11 (5.4%) | 0 (0.0%) |
| 5-Person Households | 41 (20.0%) | 0 (0.0%) |
| 6-Person Households | 1 (0.5%) | 0 (0.0%) |
| 7+ Person Households | 3 (1.5%) | 0 (0.0%) |
| Total | 152 (74.2%) | 53 (25.9%) |
Female Fertility in Ephesus
Fertility by Age in Ephesus
Average fertility rate in Ephesus is 191.0 births per 1,000 women. Women in the age bracket of 20 to 34 years have the highest fertility rate with 288.0 births per 1,000 women. Women in the age bracket of 20 to 34 years acount for 90.5% of all women with births.
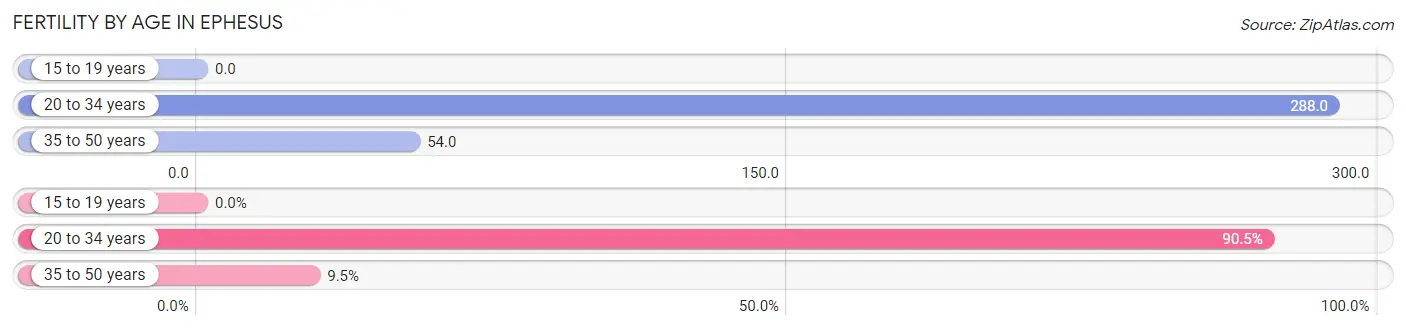
| Age Bracket | Women with Births | Births / 1,000 Women |
| 15 to 19 years | 0 (0.0%) | 0.0 |
| 20 to 34 years | 19 (90.5%) | 288.0 |
| 35 to 50 years | 2 (9.5%) | 54.0 |
| Total | 21 (100.0%) | 191.0 |
Fertility by Age by Marriage Status in Ephesus
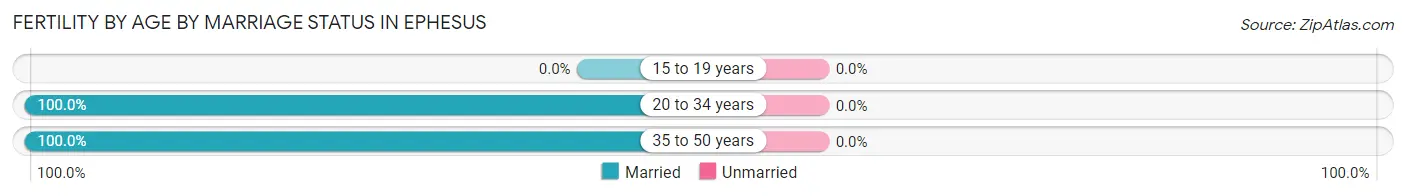
| Age Bracket | Married | Unmarried |
| 15 to 19 years | 0 (0.0%) | 0 (0.0%) |
| 20 to 34 years | 19 (100.0%) | 0 (0.0%) |
| 35 to 50 years | 2 (100.0%) | 0 (0.0%) |
| Total | 21 (100.0%) | 0 (0.0%) |
Fertility by Education in Ephesus
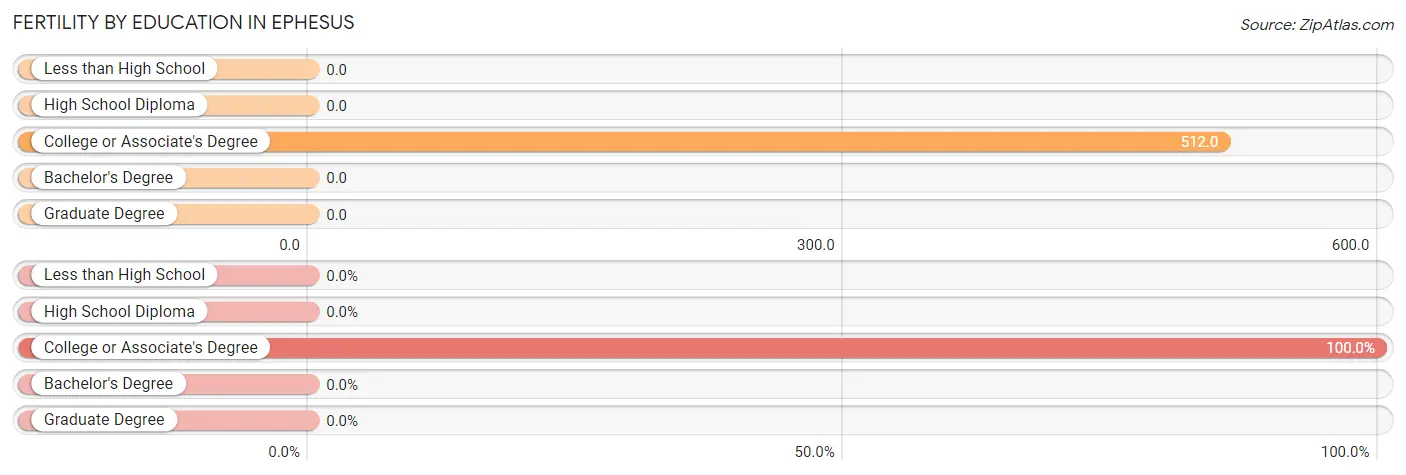
| Educational Attainment | Women with Births | Births / 1,000 Women |
| Less than High School | 0 (0.0%) | 0.0 |
| High School Diploma | 0 (0.0%) | 0.0 |
| College or Associate's Degree | 21 (100.0%) | 512.0 |
| Bachelor's Degree | 0 (0.0%) | 0.0 |
| Graduate Degree | 0 (0.0%) | 0.0 |
| Total | 21 (100.0%) | 191.0 |
Fertility by Education by Marriage Status in Ephesus
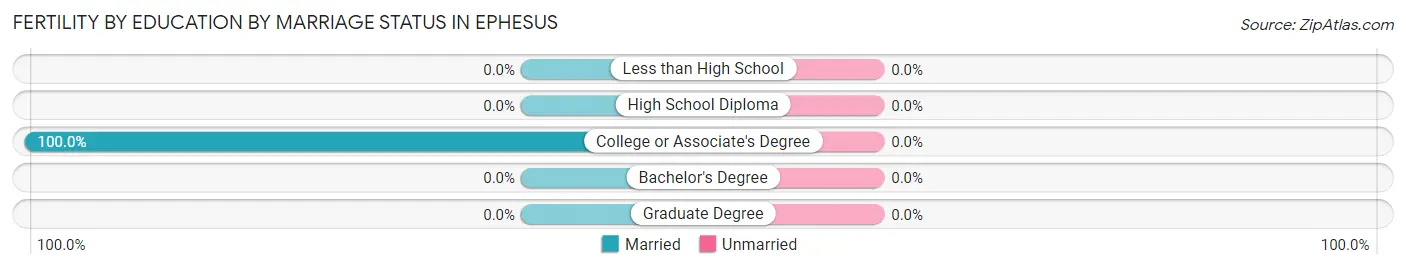
| Educational Attainment | Married | Unmarried |
| Less than High School | 0 (0.0%) | 0 (0.0%) |
| High School Diploma | 0 (0.0%) | 0 (0.0%) |
| College or Associate's Degree | 21 (100.0%) | 0 (0.0%) |
| Bachelor's Degree | 0 (0.0%) | 0 (0.0%) |
| Graduate Degree | 0 (0.0%) | 0 (0.0%) |
| Total | 21 (100.0%) | 0 (0.0%) |
Employment Characteristics in Ephesus
Employment by Class of Employer in Ephesus
Among the 250 employed individuals in Ephesus, private company employees (157 | 62.8%), local government employees (44 | 17.6%), and self-employed (not incorporated) (18 | 7.2%) make up the most common classes of employment.
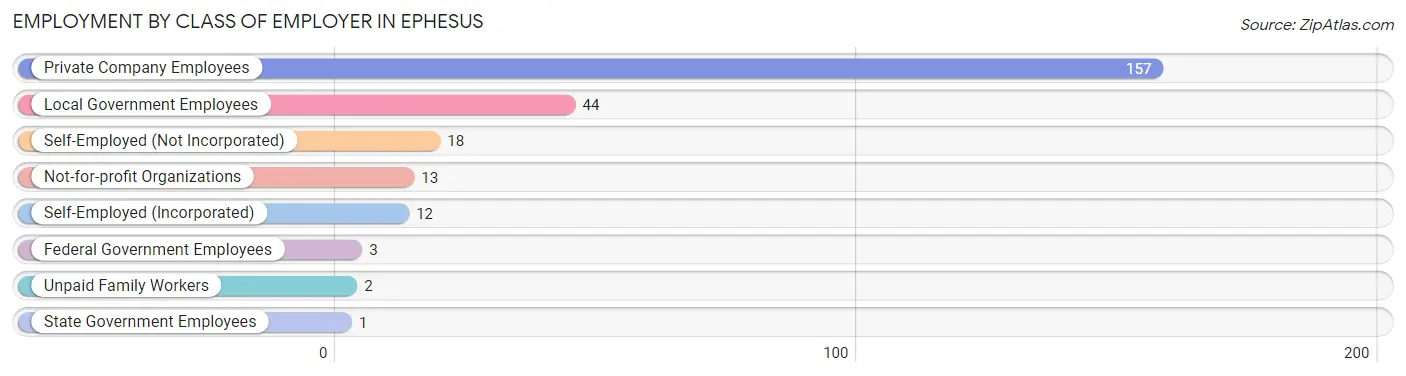
| Employer Class | # Employees | % Employees |
| Private Company Employees | 157 | 62.8% |
| Self-Employed (Incorporated) | 12 | 4.8% |
| Self-Employed (Not Incorporated) | 18 | 7.2% |
| Not-for-profit Organizations | 13 | 5.2% |
| Local Government Employees | 44 | 17.6% |
| State Government Employees | 1 | 0.4% |
| Federal Government Employees | 3 | 1.2% |
| Unpaid Family Workers | 2 | 0.8% |
| Total | 250 | 100.0% |
Employment Status by Age in Ephesus
According to the labor force statistics for Ephesus, out of the total population over 16 years of age (402), 69.4% or 279 individuals are in the labor force, with 4.3% or 12 of them unemployed. The age group with the highest labor force participation rate is 20 to 24 years, with 95.5% or 64 individuals in the labor force. Within the labor force, the 45 to 54 years age range has the highest percentage of unemployed individuals, with 15.8% or 9 of them being unemployed.
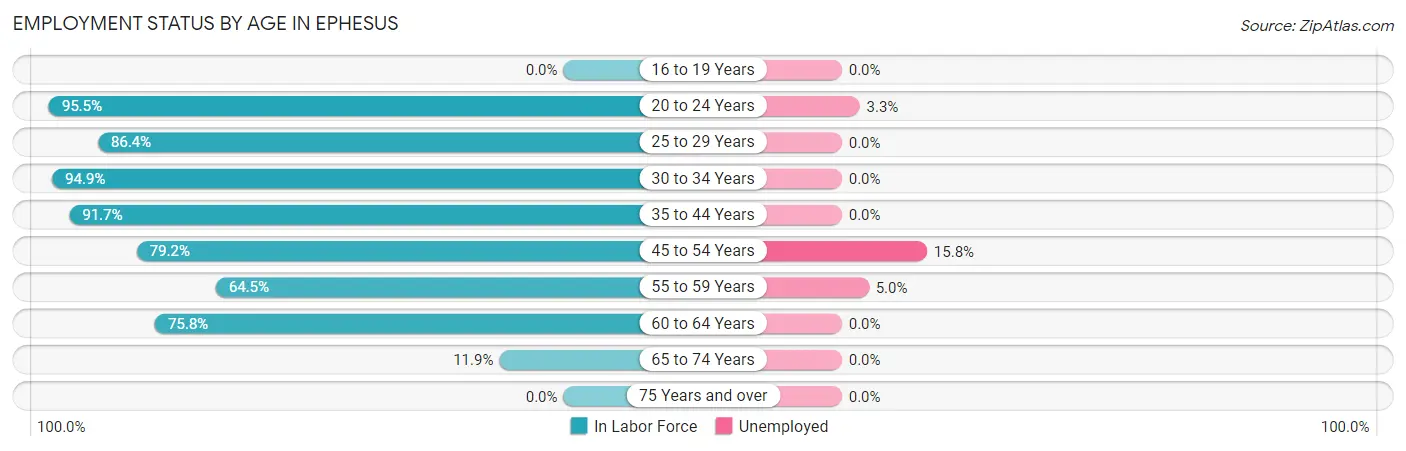
| Age Bracket | In Labor Force | Unemployed |
| 16 to 19 Years | 0 (0.0%) | 0 (0.0%) |
| 20 to 24 Years | 64 (95.5%) | 2 (3.3%) |
| 25 to 29 Years | 38 (86.4%) | 0 (0.0%) |
| 30 to 34 Years | 37 (94.9%) | 0 (0.0%) |
| 35 to 44 Years | 33 (91.7%) | 0 (0.0%) |
| 45 to 54 Years | 57 (79.2%) | 9 (15.8%) |
| 55 to 59 Years | 20 (64.5%) | 1 (5.0%) |
| 60 to 64 Years | 25 (75.8%) | 0 (0.0%) |
| 65 to 74 Years | 5 (11.9%) | 0 (0.0%) |
| 75 Years and over | 0 (0.0%) | 0 (0.0%) |
| Total | 279 (69.4%) | 12 (4.3%) |
Employment Status by Educational Attainment in Ephesus
According to labor force statistics for Ephesus, 82.4% of individuals (210) out of the total population between 25 and 64 years of age (255) are in the labor force, with 4.8% or 10 of them being unemployed. The group with the highest labor force participation rate are those with the educational attainment of bachelor's degree or higher, with 100.0% or 41 individuals in the labor force. Within the labor force, individuals with less than high school education have the highest percentage of unemployment, with 12.5% or 2 of them being unemployed.
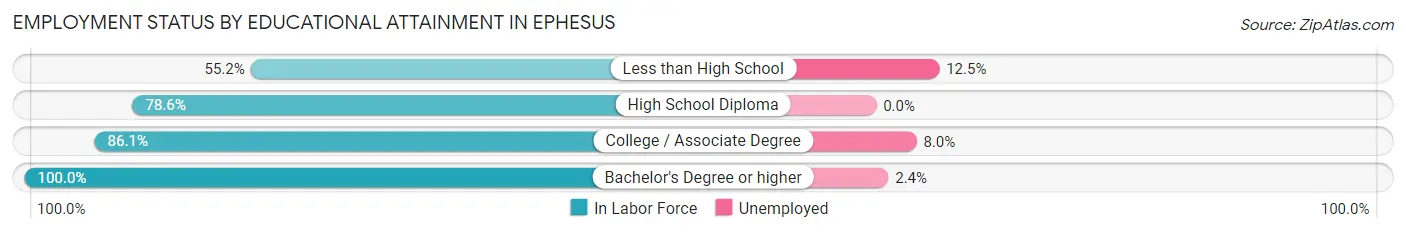
| Educational Attainment | In Labor Force | Unemployed |
| Less than High School | 16 (55.2%) | 4 (12.5%) |
| High School Diploma | 66 (78.6%) | 0 (0.0%) |
| College / Associate Degree | 87 (86.1%) | 8 (8.0%) |
| Bachelor's Degree or higher | 41 (100.0%) | 1 (2.4%) |
| Total | 210 (82.4%) | 12 (4.8%) |
Employment Occupations by Sex in Ephesus
Management, Business, Science and Arts Occupations
The most common Management, Business, Science and Arts occupations in Ephesus are Management (25 | 9.5%), Business & Financial (8 | 3.0%), Community & Social Service (8 | 3.0%), Education Instruction & Library (8 | 3.0%), and Health Diagnosing & Treating (5 | 1.9%).
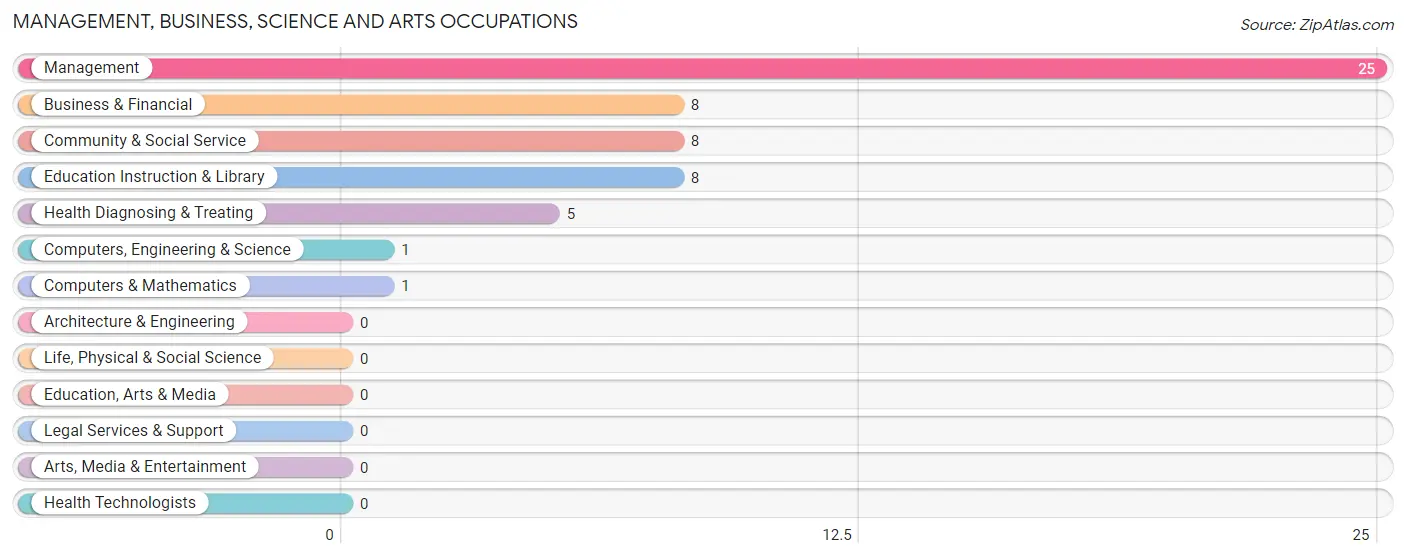
Management, Business, Science and Arts Occupations by Sex
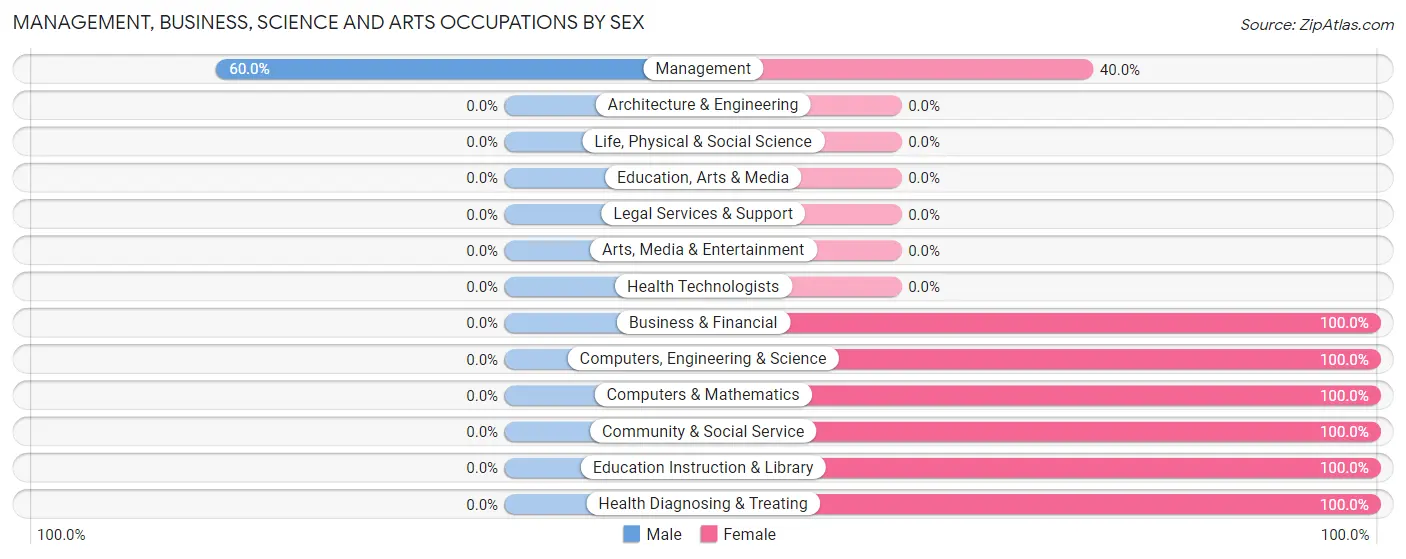
| Occupation | Male | Female |
| Management | 15 (60.0%) | 10 (40.0%) |
| Business & Financial | 0 (0.0%) | 8 (100.0%) |
| Computers, Engineering & Science | 0 (0.0%) | 1 (100.0%) |
| Computers & Mathematics | 0 (0.0%) | 1 (100.0%) |
| Architecture & Engineering | 0 (0.0%) | 0 (0.0%) |
| Life, Physical & Social Science | 0 (0.0%) | 0 (0.0%) |
| Community & Social Service | 0 (0.0%) | 8 (100.0%) |
| Education, Arts & Media | 0 (0.0%) | 0 (0.0%) |
| Legal Services & Support | 0 (0.0%) | 0 (0.0%) |
| Education Instruction & Library | 0 (0.0%) | 8 (100.0%) |
| Arts, Media & Entertainment | 0 (0.0%) | 0 (0.0%) |
| Health Diagnosing & Treating | 0 (0.0%) | 5 (100.0%) |
| Health Technologists | 0 (0.0%) | 0 (0.0%) |
| Total (Category) | 15 (31.9%) | 32 (68.1%) |
| Total (Overall) | 163 (61.7%) | 101 (38.3%) |
Services Occupations
The most common Services occupations in Ephesus are Security & Protection (26 | 9.9%), Law Enforcement (24 | 9.1%), Healthcare Support (21 | 8.0%), Personal Care & Service (6 | 2.3%), and Firefighting & Prevention (2 | 0.8%).
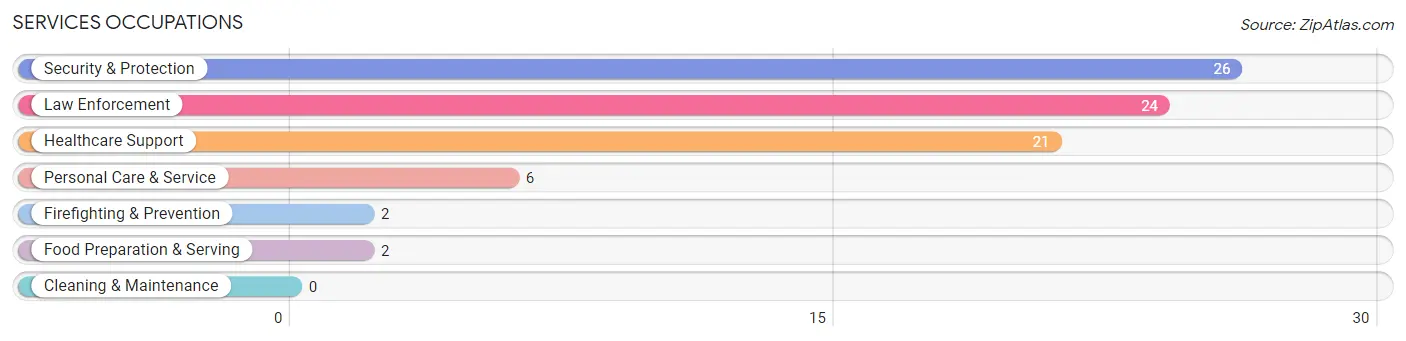
Services Occupations by Sex
Within the Services occupations in Ephesus, the most male-oriented occupations are Firefighting & Prevention (100.0%), Security & Protection (88.5%), and Law Enforcement (87.5%), while the most female-oriented occupations are Healthcare Support (100.0%), Food Preparation & Serving (100.0%), and Personal Care & Service (33.3%).
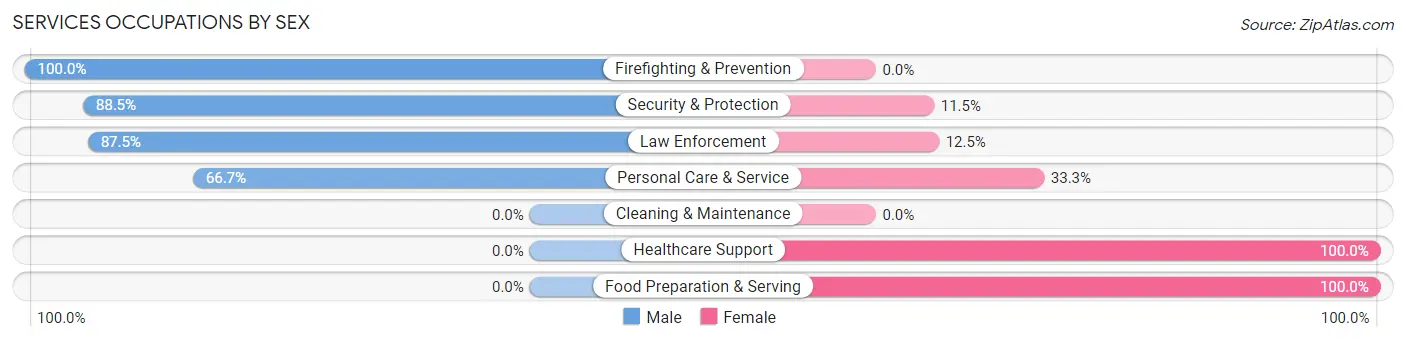
| Occupation | Male | Female |
| Healthcare Support | 0 (0.0%) | 21 (100.0%) |
| Security & Protection | 23 (88.5%) | 3 (11.5%) |
| Firefighting & Prevention | 2 (100.0%) | 0 (0.0%) |
| Law Enforcement | 21 (87.5%) | 3 (12.5%) |
| Food Preparation & Serving | 0 (0.0%) | 2 (100.0%) |
| Cleaning & Maintenance | 0 (0.0%) | 0 (0.0%) |
| Personal Care & Service | 4 (66.7%) | 2 (33.3%) |
| Total (Category) | 27 (49.1%) | 28 (50.9%) |
| Total (Overall) | 163 (61.7%) | 101 (38.3%) |
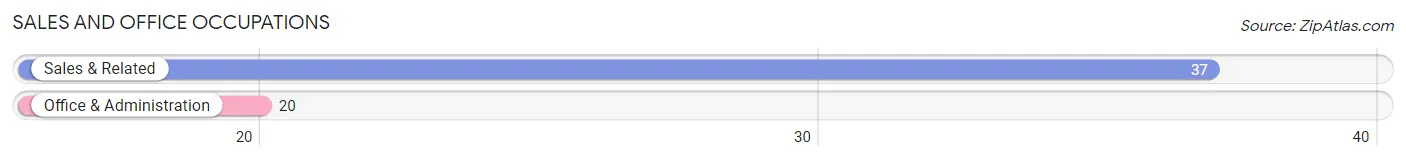
Sales and Office Occupations
The most common Sales and Office occupations in Ephesus are Sales & Related (37 | 14.0%), and Office & Administration (20 | 7.6%).
Sales and Office Occupations by Sex
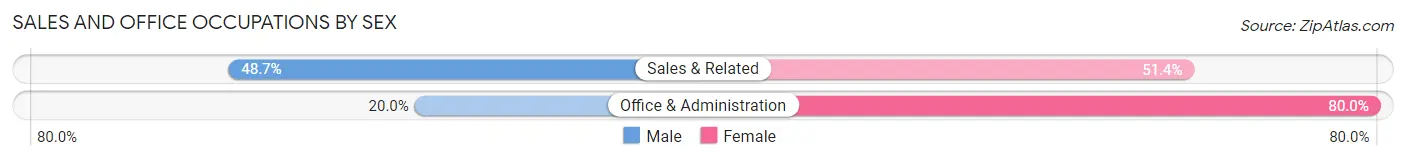
| Occupation | Male | Female |
| Sales & Related | 18 (48.6%) | 19 (51.3%) |
| Office & Administration | 4 (20.0%) | 16 (80.0%) |
| Total (Category) | 22 (38.6%) | 35 (61.4%) |
| Total (Overall) | 163 (61.7%) | 101 (38.3%) |
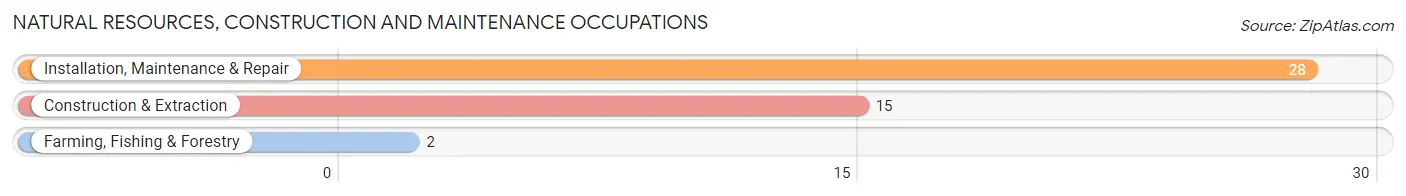
Natural Resources, Construction and Maintenance Occupations
The most common Natural Resources, Construction and Maintenance occupations in Ephesus are Installation, Maintenance & Repair (28 | 10.6%), Construction & Extraction (15 | 5.7%), and Farming, Fishing & Forestry (2 | 0.8%).
Natural Resources, Construction and Maintenance Occupations by Sex
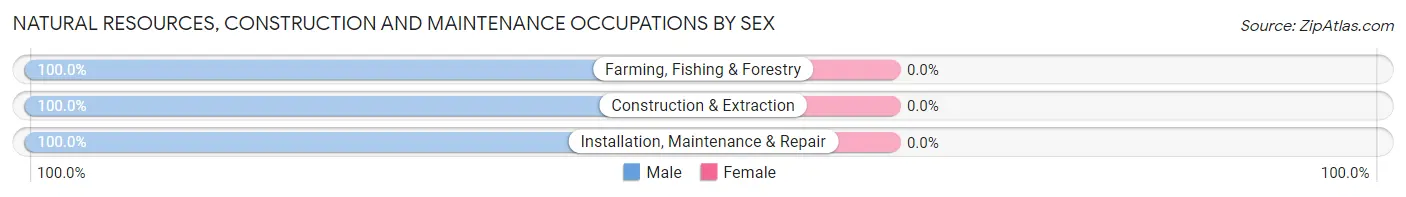
| Occupation | Male | Female |
| Farming, Fishing & Forestry | 2 (100.0%) | 0 (0.0%) |
| Construction & Extraction | 15 (100.0%) | 0 (0.0%) |
| Installation, Maintenance & Repair | 28 (100.0%) | 0 (0.0%) |
| Total (Category) | 45 (100.0%) | 0 (0.0%) |
| Total (Overall) | 163 (61.7%) | 101 (38.3%) |
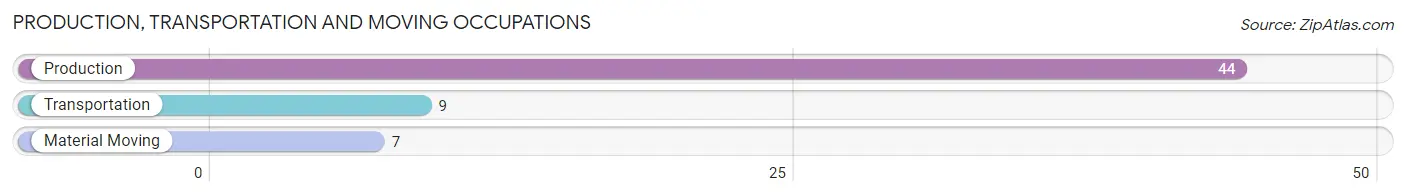
Production, Transportation and Moving Occupations
The most common Production, Transportation and Moving occupations in Ephesus are Production (44 | 16.7%), Transportation (9 | 3.4%), and Material Moving (7 | 2.6%).
Production, Transportation and Moving Occupations by Sex
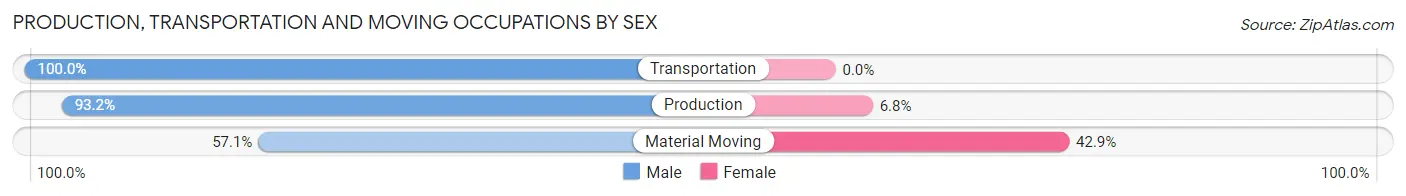
| Occupation | Male | Female |
| Production | 41 (93.2%) | 3 (6.8%) |
| Transportation | 9 (100.0%) | 0 (0.0%) |
| Material Moving | 4 (57.1%) | 3 (42.9%) |
| Total (Category) | 54 (90.0%) | 6 (10.0%) |
| Total (Overall) | 163 (61.7%) | 101 (38.3%) |
Employment Industries by Sex in Ephesus
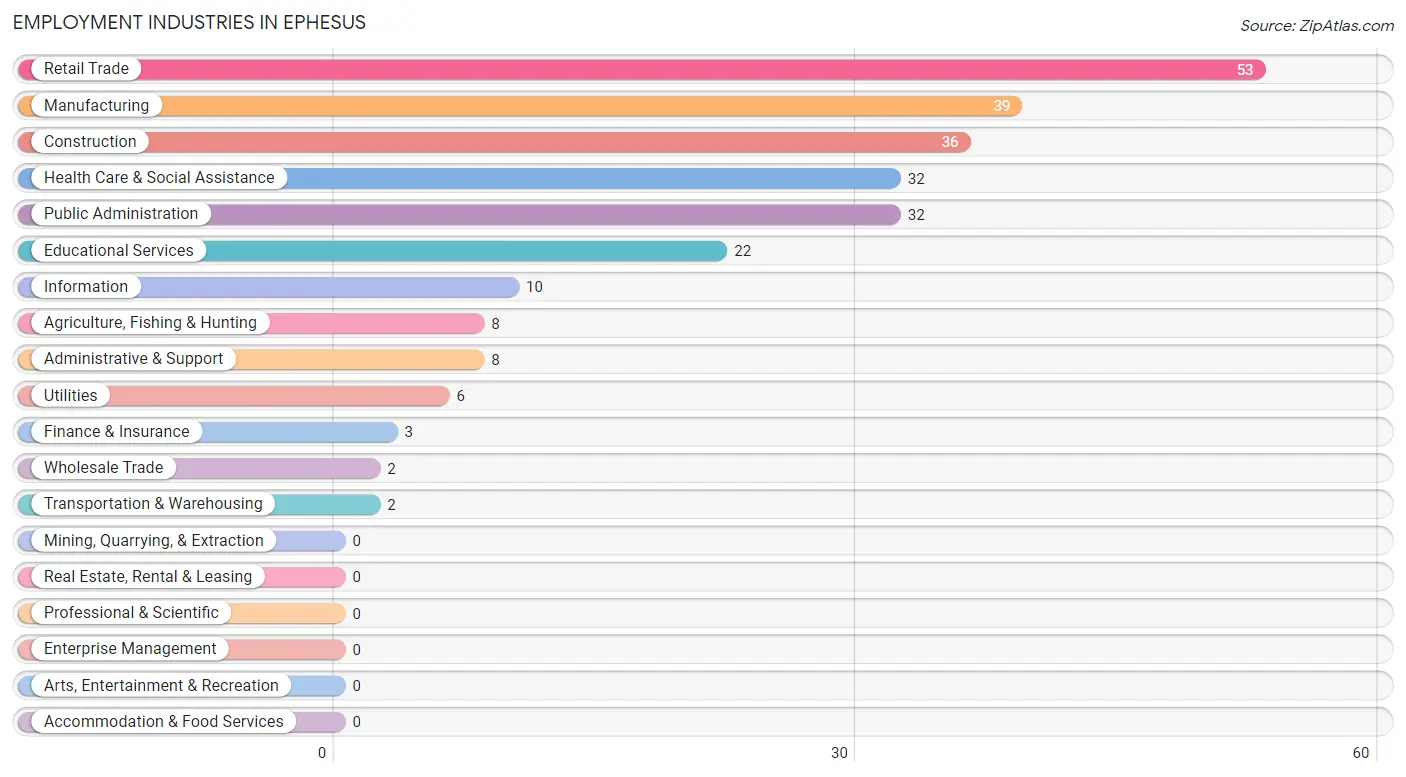
Employment Industries in Ephesus
The major employment industries in Ephesus include Retail Trade (53 | 20.1%), Manufacturing (39 | 14.8%), Construction (36 | 13.6%), Health Care & Social Assistance (32 | 12.1%), and Public Administration (32 | 12.1%).
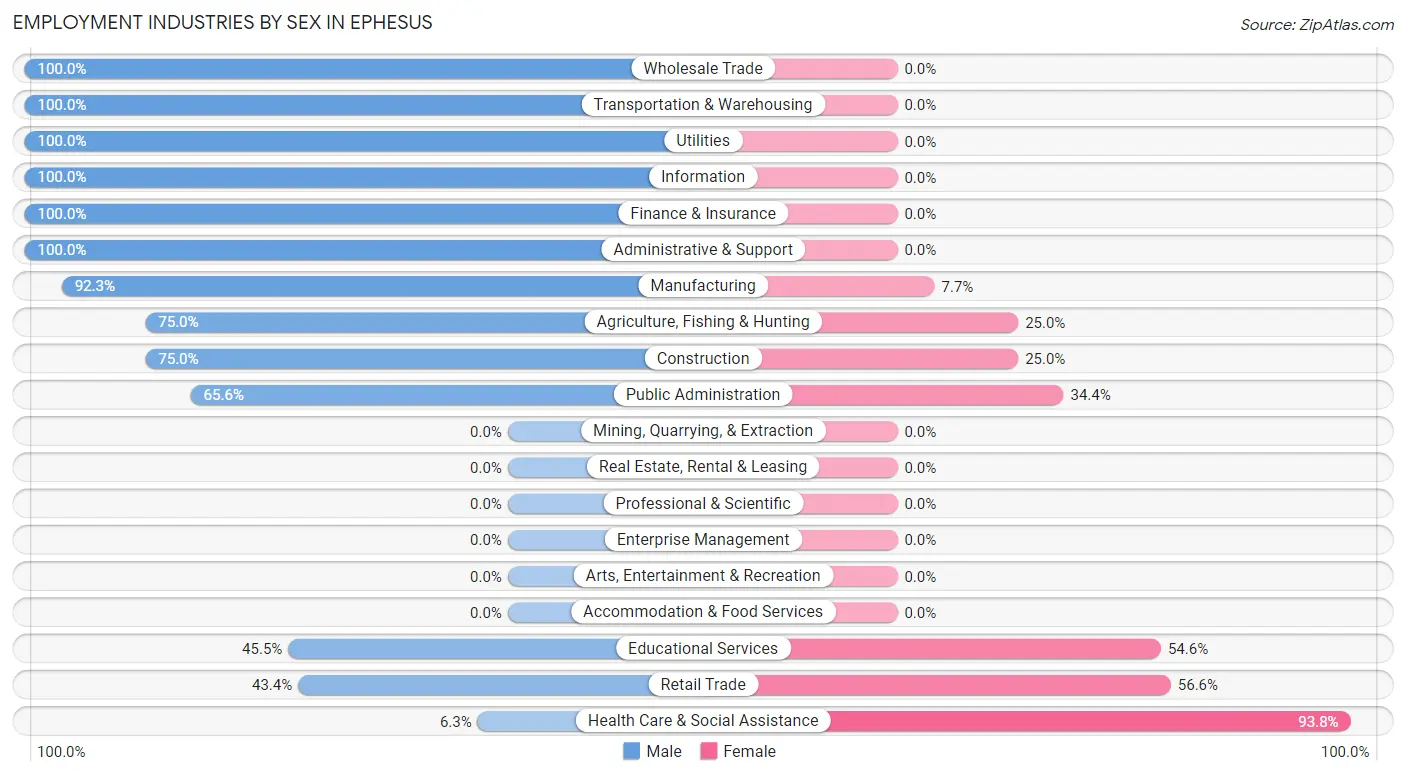
Employment Industries by Sex in Ephesus
The Ephesus industries that see more men than women are Wholesale Trade (100.0%), Transportation & Warehousing (100.0%), and Utilities (100.0%), whereas the industries that tend to have a higher number of women are Health Care & Social Assistance (93.8%), Retail Trade (56.6%), and Educational Services (54.5%).
| Industry | Male | Female |
| Agriculture, Fishing & Hunting | 6 (75.0%) | 2 (25.0%) |
| Mining, Quarrying, & Extraction | 0 (0.0%) | 0 (0.0%) |
| Construction | 27 (75.0%) | 9 (25.0%) |
| Manufacturing | 36 (92.3%) | 3 (7.7%) |
| Wholesale Trade | 2 (100.0%) | 0 (0.0%) |
| Retail Trade | 23 (43.4%) | 30 (56.6%) |
| Transportation & Warehousing | 2 (100.0%) | 0 (0.0%) |
| Utilities | 6 (100.0%) | 0 (0.0%) |
| Information | 10 (100.0%) | 0 (0.0%) |
| Finance & Insurance | 3 (100.0%) | 0 (0.0%) |
| Real Estate, Rental & Leasing | 0 (0.0%) | 0 (0.0%) |
| Professional & Scientific | 0 (0.0%) | 0 (0.0%) |
| Enterprise Management | 0 (0.0%) | 0 (0.0%) |
| Administrative & Support | 8 (100.0%) | 0 (0.0%) |
| Educational Services | 10 (45.5%) | 12 (54.5%) |
| Health Care & Social Assistance | 2 (6.2%) | 30 (93.8%) |
| Arts, Entertainment & Recreation | 0 (0.0%) | 0 (0.0%) |
| Accommodation & Food Services | 0 (0.0%) | 0 (0.0%) |
| Public Administration | 21 (65.6%) | 11 (34.4%) |
| Total | 163 (61.7%) | 101 (38.3%) |
Education in Ephesus
School Enrollment in Ephesus
The most common levels of schooling among the 122 students in Ephesus are middle school (37 | 30.3%), high school (23 | 18.9%), and kindergarten (21 | 17.2%).
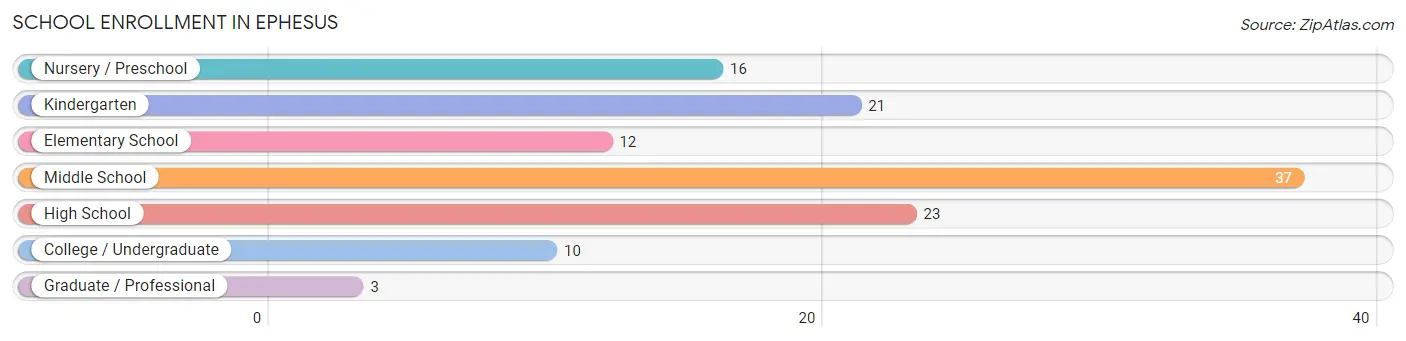
| School Level | # Students | % Students |
| Nursery / Preschool | 16 | 13.1% |
| Kindergarten | 21 | 17.2% |
| Elementary School | 12 | 9.8% |
| Middle School | 37 | 30.3% |
| High School | 23 | 18.9% |
| College / Undergraduate | 10 | 8.2% |
| Graduate / Professional | 3 | 2.5% |
| Total | 122 | 100.0% |
School Enrollment by Age by Funding Source in Ephesus
Out of a total of 122 students who are enrolled in schools in Ephesus, 21 (17.2%) attend a private institution, while the remaining 101 (82.8%) are enrolled in public schools. The age group of 18 to 19 year olds has the highest likelihood of being enrolled in private schools, with 3 (60.0% in the age bracket) enrolled. Conversely, the age group of 5 to 9 year old has the lowest likelihood of being enrolled in a private school, with 40 (100.0% in the age bracket) attending a public institution.
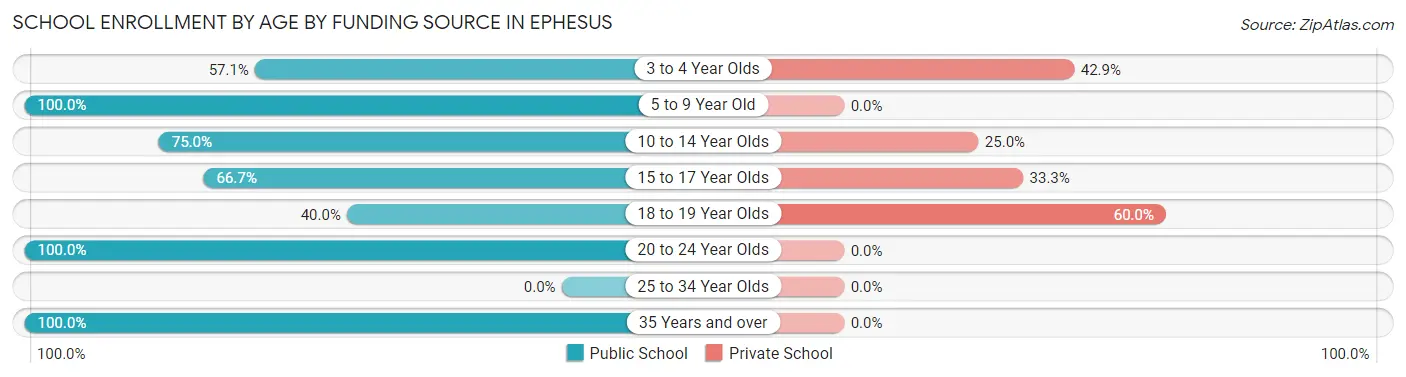
| Age Bracket | Public School | Private School |
| 3 to 4 Year Olds | 4 (57.1%) | 3 (42.9%) |
| 5 to 9 Year Old | 40 (100.0%) | 0 (0.0%) |
| 10 to 14 Year Olds | 30 (75.0%) | 10 (25.0%) |
| 15 to 17 Year Olds | 10 (66.7%) | 5 (33.3%) |
| 18 to 19 Year Olds | 2 (40.0%) | 3 (60.0%) |
| 20 to 24 Year Olds | 9 (100.0%) | 0 (0.0%) |
| 25 to 34 Year Olds | 0 (0.0%) | 0 (0.0%) |
| 35 Years and over | 6 (100.0%) | 0 (0.0%) |
| Total | 101 (82.8%) | 21 (17.2%) |
Educational Attainment by Field of Study in Ephesus
Education (16 | 30.8%), business (13 | 25.0%), bio, nature & agricultural (9 | 17.3%), physical & health sciences (7 | 13.5%), and computers & mathematics (4 | 7.7%) are the most common fields of study among 52 individuals in Ephesus who have obtained a bachelor's degree or higher.
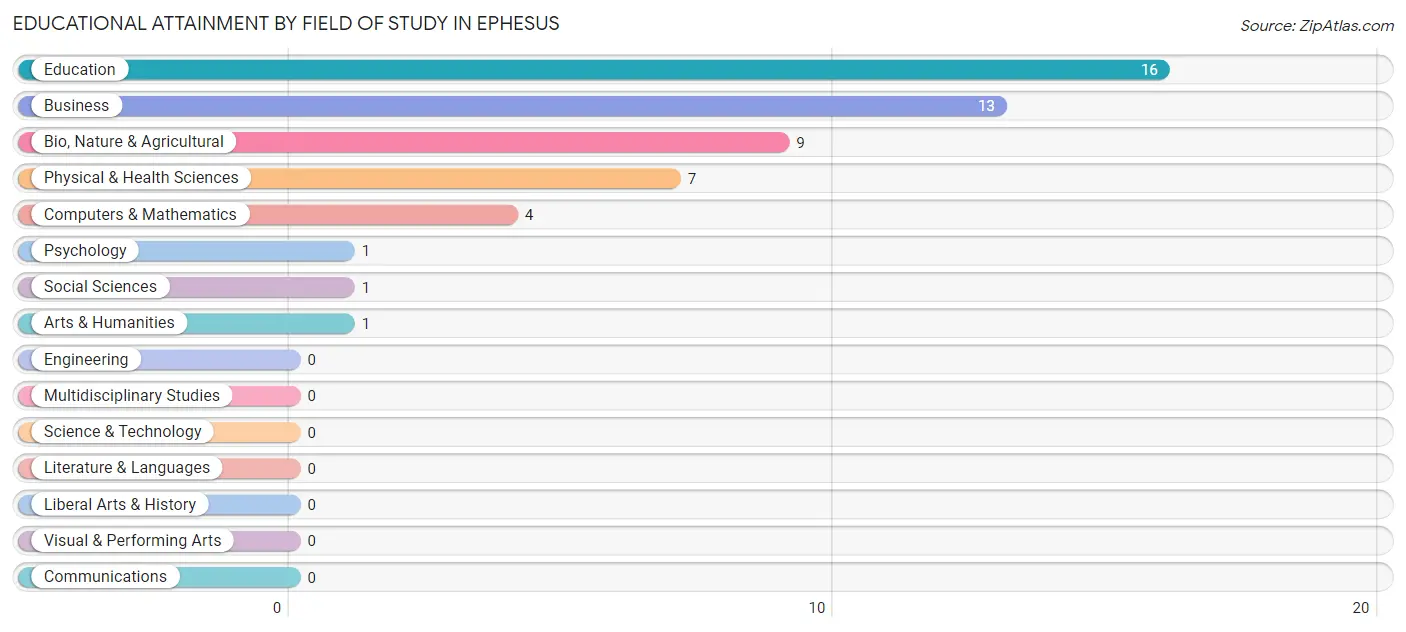
| Field of Study | # Graduates | % Graduates |
| Computers & Mathematics | 4 | 7.7% |
| Bio, Nature & Agricultural | 9 | 17.3% |
| Physical & Health Sciences | 7 | 13.5% |
| Psychology | 1 | 1.9% |
| Social Sciences | 1 | 1.9% |
| Engineering | 0 | 0.0% |
| Multidisciplinary Studies | 0 | 0.0% |
| Science & Technology | 0 | 0.0% |
| Business | 13 | 25.0% |
| Education | 16 | 30.8% |
| Literature & Languages | 0 | 0.0% |
| Liberal Arts & History | 0 | 0.0% |
| Visual & Performing Arts | 0 | 0.0% |
| Communications | 0 | 0.0% |
| Arts & Humanities | 1 | 1.9% |
| Total | 52 | 100.0% |
Transportation & Commute in Ephesus
Vehicle Availability by Sex in Ephesus
The most prevalent vehicle ownership categories in Ephesus are males with 2 vehicles (87, accounting for 54.7%) and females with 2 vehicles (48, making up 95.6%).
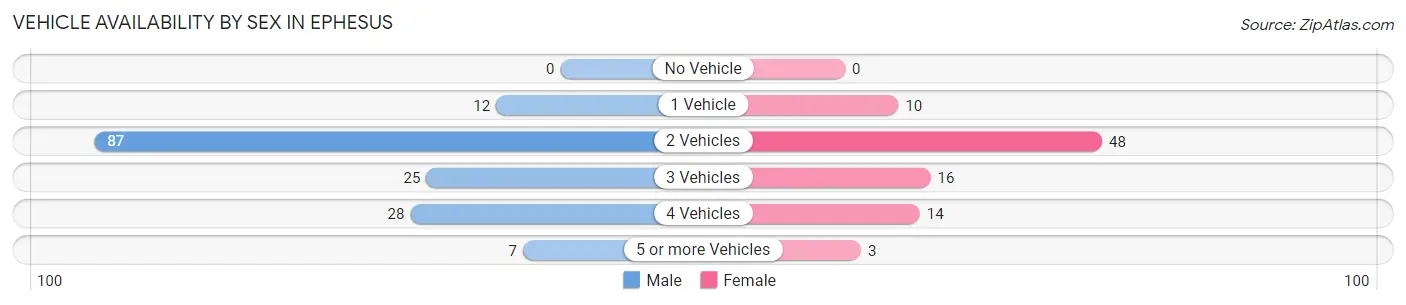
| Vehicles Available | Male | Female |
| No Vehicle | 0 (0.0%) | 0 (0.0%) |
| 1 Vehicle | 12 (7.5%) | 10 (11.0%) |
| 2 Vehicles | 87 (54.7%) | 48 (52.7%) |
| 3 Vehicles | 25 (15.7%) | 16 (17.6%) |
| 4 Vehicles | 28 (17.6%) | 14 (15.4%) |
| 5 or more Vehicles | 7 (4.4%) | 3 (3.3%) |
| Total | 159 (100.0%) | 91 (100.0%) |
Commute Time in Ephesus
The most frequently occuring commute durations in Ephesus are 30 to 34 minutes (44 commuters, 18.6%), 10 to 14 minutes (36 commuters, 15.2%), and 25 to 29 minutes (35 commuters, 14.8%).
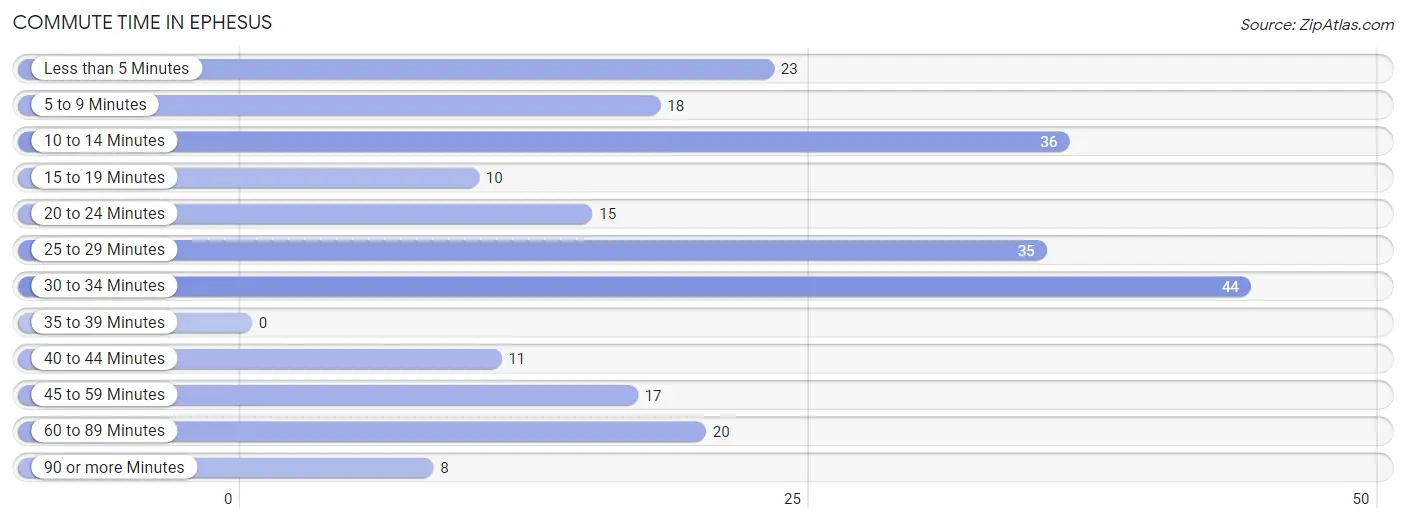
| Commute Time | # Commuters | % Commuters |
| Less than 5 Minutes | 23 | 9.7% |
| 5 to 9 Minutes | 18 | 7.6% |
| 10 to 14 Minutes | 36 | 15.2% |
| 15 to 19 Minutes | 10 | 4.2% |
| 20 to 24 Minutes | 15 | 6.3% |
| 25 to 29 Minutes | 35 | 14.8% |
| 30 to 34 Minutes | 44 | 18.6% |
| 35 to 39 Minutes | 0 | 0.0% |
| 40 to 44 Minutes | 11 | 4.6% |
| 45 to 59 Minutes | 17 | 7.2% |
| 60 to 89 Minutes | 20 | 8.4% |
| 90 or more Minutes | 8 | 3.4% |
Commute Time by Sex in Ephesus
The most common commute times in Ephesus are 30 to 34 minutes (37 commuters, 23.3%) for males and 25 to 29 minutes (20 commuters, 25.6%) for females.
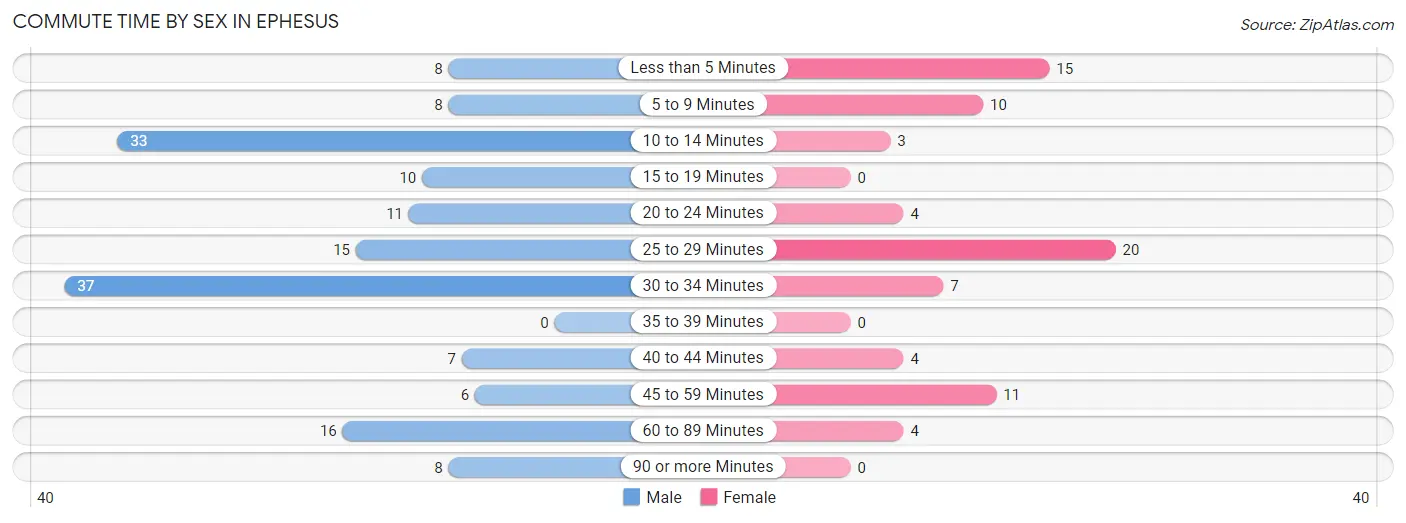
| Commute Time | Male | Female |
| Less than 5 Minutes | 8 (5.0%) | 15 (19.2%) |
| 5 to 9 Minutes | 8 (5.0%) | 10 (12.8%) |
| 10 to 14 Minutes | 33 (20.7%) | 3 (3.8%) |
| 15 to 19 Minutes | 10 (6.3%) | 0 (0.0%) |
| 20 to 24 Minutes | 11 (6.9%) | 4 (5.1%) |
| 25 to 29 Minutes | 15 (9.4%) | 20 (25.6%) |
| 30 to 34 Minutes | 37 (23.3%) | 7 (9.0%) |
| 35 to 39 Minutes | 0 (0.0%) | 0 (0.0%) |
| 40 to 44 Minutes | 7 (4.4%) | 4 (5.1%) |
| 45 to 59 Minutes | 6 (3.8%) | 11 (14.1%) |
| 60 to 89 Minutes | 16 (10.1%) | 4 (5.1%) |
| 90 or more Minutes | 8 (5.0%) | 0 (0.0%) |
Time of Departure to Work by Sex in Ephesus
The most frequent times of departure to work in Ephesus are 8:00 AM to 8:29 AM (31, 19.5%) for males and 9:00 AM to 9:59 AM (26, 33.3%) for females.
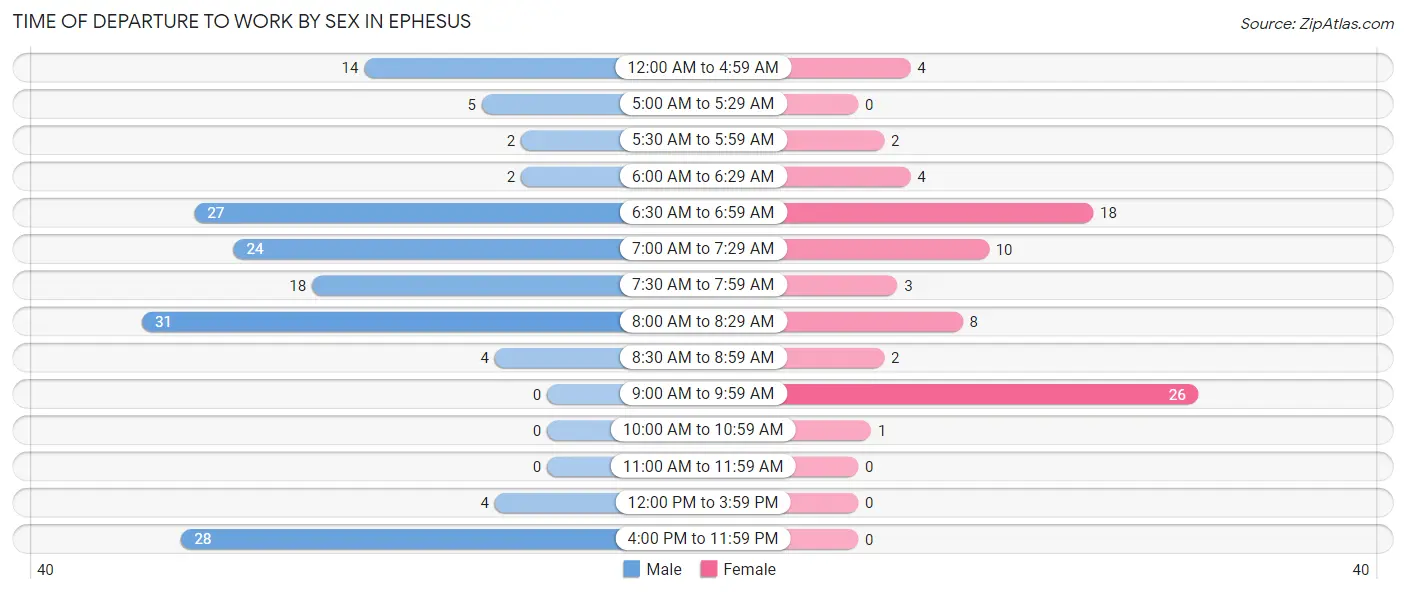
| Time of Departure | Male | Female |
| 12:00 AM to 4:59 AM | 14 (8.8%) | 4 (5.1%) |
| 5:00 AM to 5:29 AM | 5 (3.1%) | 0 (0.0%) |
| 5:30 AM to 5:59 AM | 2 (1.3%) | 2 (2.6%) |
| 6:00 AM to 6:29 AM | 2 (1.3%) | 4 (5.1%) |
| 6:30 AM to 6:59 AM | 27 (17.0%) | 18 (23.1%) |
| 7:00 AM to 7:29 AM | 24 (15.1%) | 10 (12.8%) |
| 7:30 AM to 7:59 AM | 18 (11.3%) | 3 (3.8%) |
| 8:00 AM to 8:29 AM | 31 (19.5%) | 8 (10.3%) |
| 8:30 AM to 8:59 AM | 4 (2.5%) | 2 (2.6%) |
| 9:00 AM to 9:59 AM | 0 (0.0%) | 26 (33.3%) |
| 10:00 AM to 10:59 AM | 0 (0.0%) | 1 (1.3%) |
| 11:00 AM to 11:59 AM | 0 (0.0%) | 0 (0.0%) |
| 12:00 PM to 3:59 PM | 4 (2.5%) | 0 (0.0%) |
| 4:00 PM to 11:59 PM | 28 (17.6%) | 0 (0.0%) |
| Total | 159 (100.0%) | 78 (100.0%) |
Housing Occupancy in Ephesus
Occupancy by Ownership in Ephesus
Of the total 205 dwellings in Ephesus, owner-occupied units account for 156 (76.1%), while renter-occupied units make up 49 (23.9%).
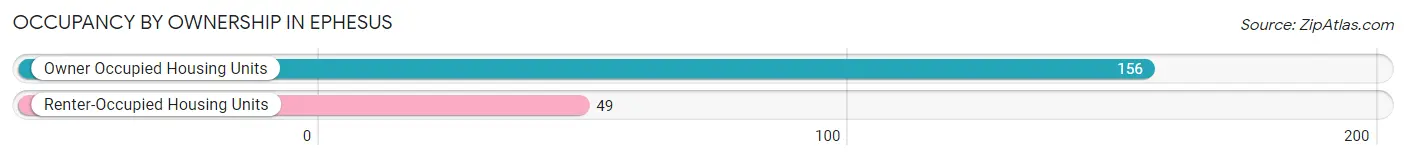
| Occupancy | # Housing Units | % Housing Units |
| Owner Occupied Housing Units | 156 | 76.1% |
| Renter-Occupied Housing Units | 49 | 23.9% |
| Total Occupied Housing Units | 205 | 100.0% |
Occupancy by Household Size in Ephesus
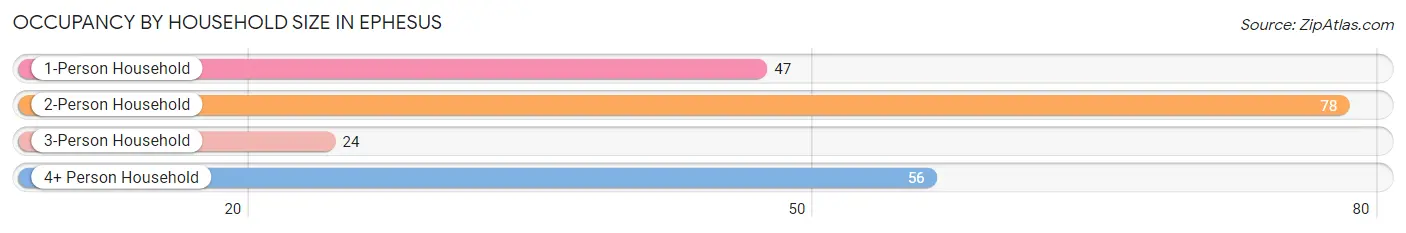
| Household Size | # Housing Units | % Housing Units |
| 1-Person Household | 47 | 22.9% |
| 2-Person Household | 78 | 38.1% |
| 3-Person Household | 24 | 11.7% |
| 4+ Person Household | 56 | 27.3% |
| Total Housing Units | 205 | 100.0% |
Occupancy by Ownership by Household Size in Ephesus
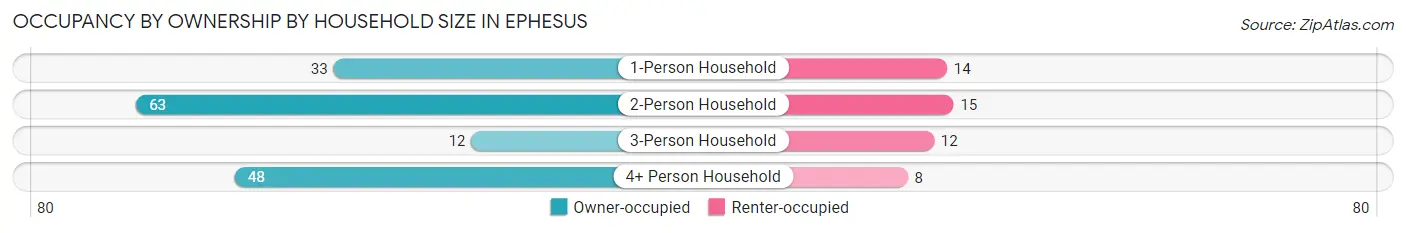
| Household Size | Owner-occupied | Renter-occupied |
| 1-Person Household | 33 (70.2%) | 14 (29.8%) |
| 2-Person Household | 63 (80.8%) | 15 (19.2%) |
| 3-Person Household | 12 (50.0%) | 12 (50.0%) |
| 4+ Person Household | 48 (85.7%) | 8 (14.3%) |
| Total Housing Units | 156 (76.1%) | 49 (23.9%) |
Occupancy by Educational Attainment in Ephesus
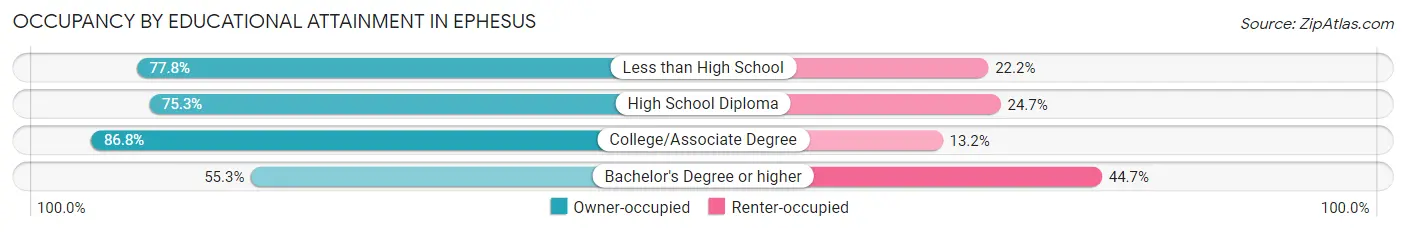
| Household Size | Owner-occupied | Renter-occupied |
| Less than High School | 14 (77.8%) | 4 (22.2%) |
| High School Diploma | 55 (75.3%) | 18 (24.7%) |
| College/Associate Degree | 66 (86.8%) | 10 (13.2%) |
| Bachelor's Degree or higher | 21 (55.3%) | 17 (44.7%) |
Occupancy by Age of Householder in Ephesus
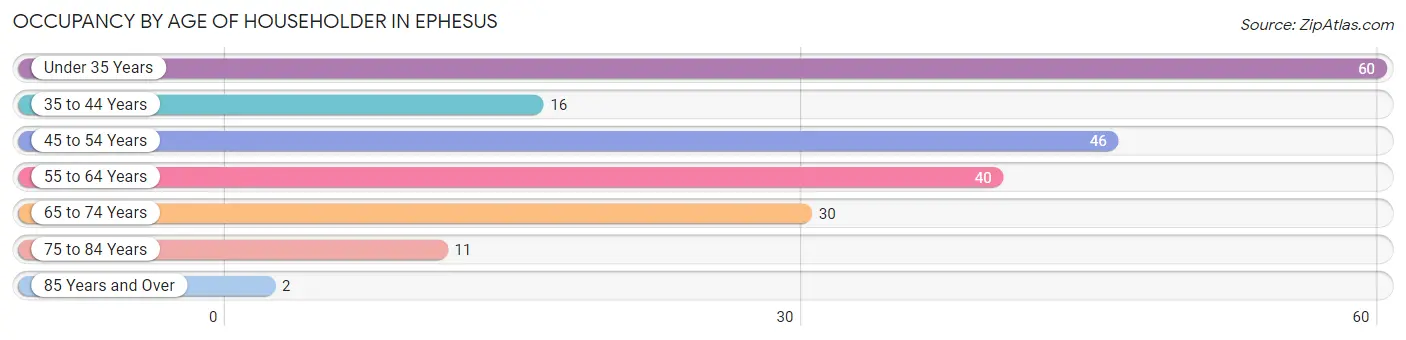
| Age Bracket | # Households | % Households |
| Under 35 Years | 60 | 29.3% |
| 35 to 44 Years | 16 | 7.8% |
| 45 to 54 Years | 46 | 22.4% |
| 55 to 64 Years | 40 | 19.5% |
| 65 to 74 Years | 30 | 14.6% |
| 75 to 84 Years | 11 | 5.4% |
| 85 Years and Over | 2 | 1.0% |
| Total | 205 | 100.0% |
Housing Finances in Ephesus
Median Income by Occupancy in Ephesus
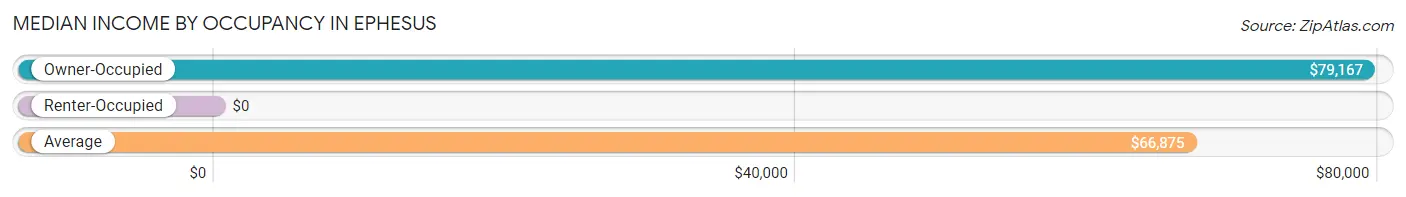
| Occupancy Type | # Households | Median Income |
| Owner-Occupied | 156 (76.1%) | $79,167 |
| Renter-Occupied | 49 (23.9%) | $0 |
| Average | 205 (100.0%) | $66,875 |
Occupancy by Householder Income Bracket in Ephesus
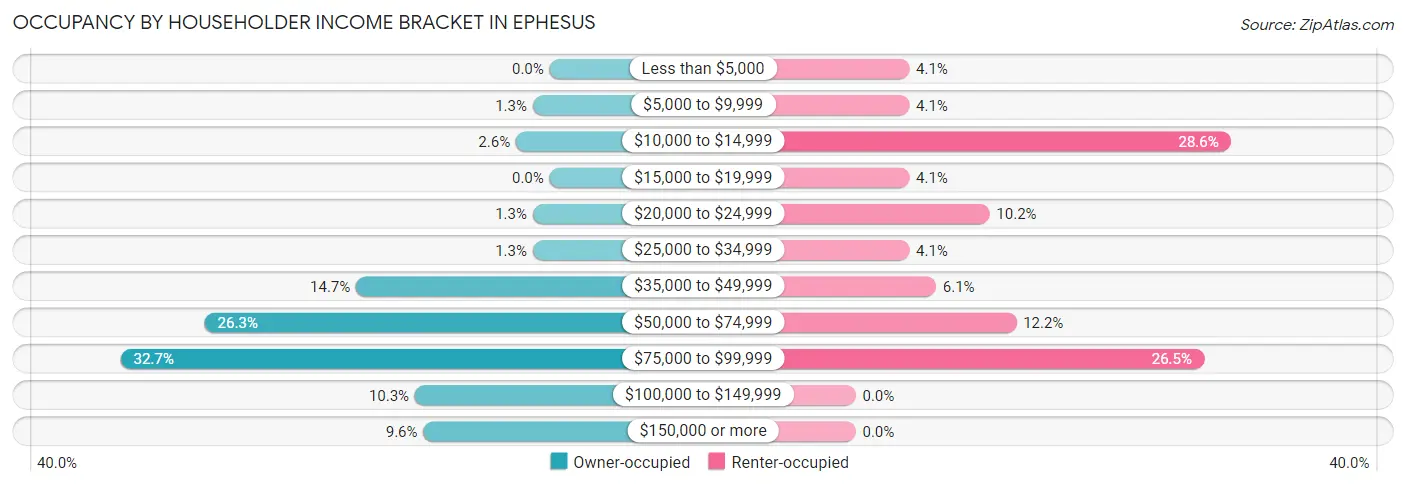
| Income Bracket | Owner-occupied | Renter-occupied |
| Less than $5,000 | 0 (0.0%) | 2 (4.1%) |
| $5,000 to $9,999 | 2 (1.3%) | 2 (4.1%) |
| $10,000 to $14,999 | 4 (2.6%) | 14 (28.6%) |
| $15,000 to $19,999 | 0 (0.0%) | 2 (4.1%) |
| $20,000 to $24,999 | 2 (1.3%) | 5 (10.2%) |
| $25,000 to $34,999 | 2 (1.3%) | 2 (4.1%) |
| $35,000 to $49,999 | 23 (14.7%) | 3 (6.1%) |
| $50,000 to $74,999 | 41 (26.3%) | 6 (12.2%) |
| $75,000 to $99,999 | 51 (32.7%) | 13 (26.5%) |
| $100,000 to $149,999 | 16 (10.3%) | 0 (0.0%) |
| $150,000 or more | 15 (9.6%) | 0 (0.0%) |
| Total | 156 (100.0%) | 49 (100.0%) |
Monthly Housing Cost Tiers in Ephesus
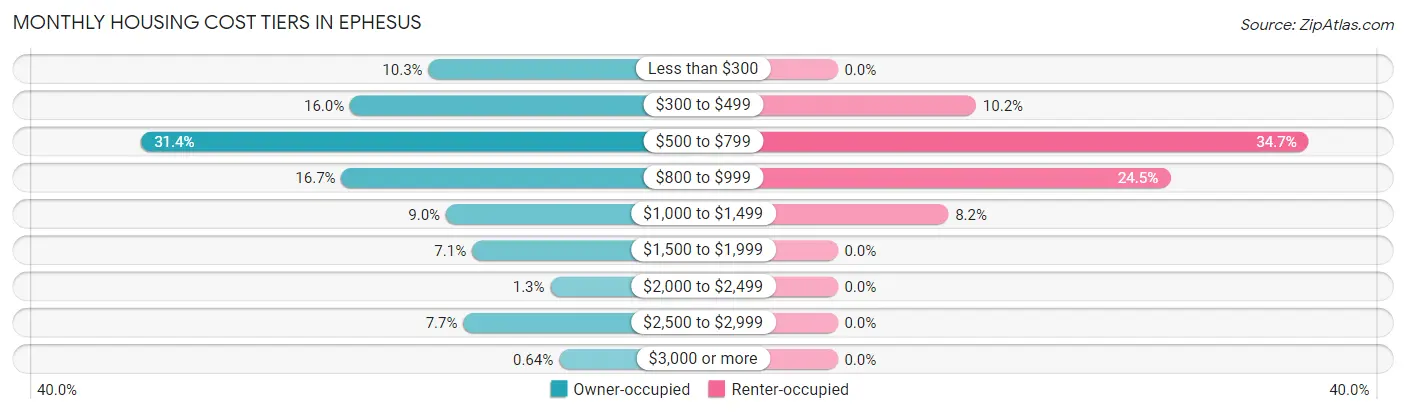
| Monthly Cost | Owner-occupied | Renter-occupied |
| Less than $300 | 16 (10.3%) | 0 (0.0%) |
| $300 to $499 | 25 (16.0%) | 5 (10.2%) |
| $500 to $799 | 49 (31.4%) | 17 (34.7%) |
| $800 to $999 | 26 (16.7%) | 12 (24.5%) |
| $1,000 to $1,499 | 14 (9.0%) | 4 (8.2%) |
| $1,500 to $1,999 | 11 (7.0%) | 0 (0.0%) |
| $2,000 to $2,499 | 2 (1.3%) | 0 (0.0%) |
| $2,500 to $2,999 | 12 (7.7%) | 0 (0.0%) |
| $3,000 or more | 1 (0.6%) | 0 (0.0%) |
| Total | 156 (100.0%) | 49 (100.0%) |
Physical Housing Characteristics in Ephesus
Housing Structures in Ephesus
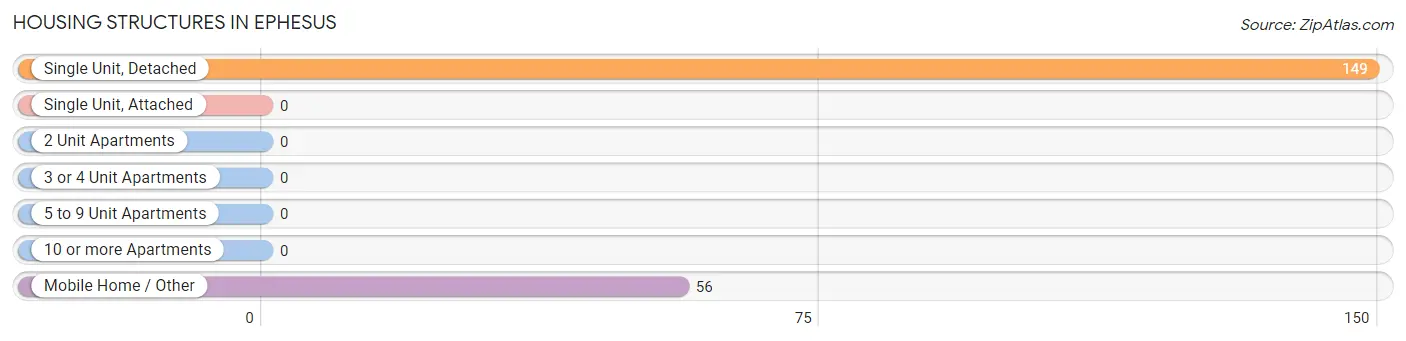
| Structure Type | # Housing Units | % Housing Units |
| Single Unit, Detached | 149 | 72.7% |
| Single Unit, Attached | 0 | 0.0% |
| 2 Unit Apartments | 0 | 0.0% |
| 3 or 4 Unit Apartments | 0 | 0.0% |
| 5 to 9 Unit Apartments | 0 | 0.0% |
| 10 or more Apartments | 0 | 0.0% |
| Mobile Home / Other | 56 | 27.3% |
| Total | 205 | 100.0% |
Housing Structures by Occupancy in Ephesus
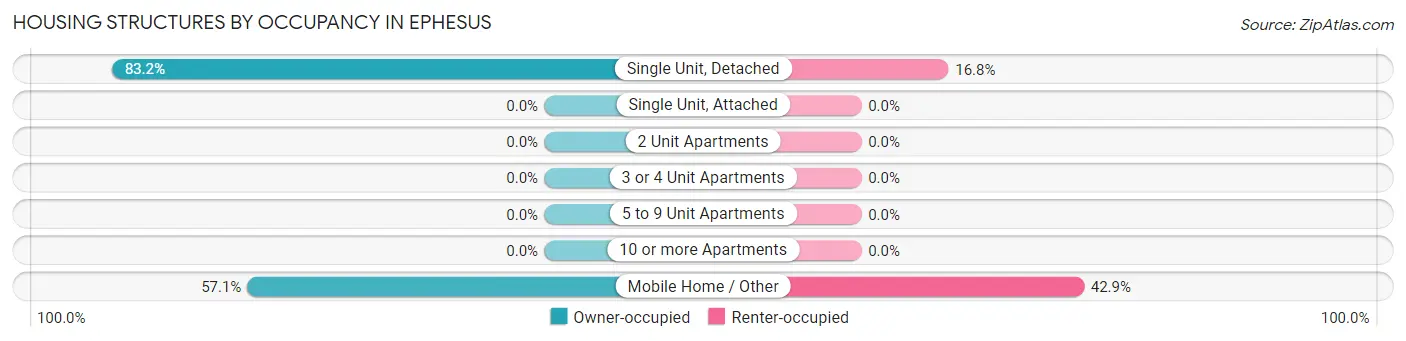
| Structure Type | Owner-occupied | Renter-occupied |
| Single Unit, Detached | 124 (83.2%) | 25 (16.8%) |
| Single Unit, Attached | 0 (0.0%) | 0 (0.0%) |
| 2 Unit Apartments | 0 (0.0%) | 0 (0.0%) |
| 3 or 4 Unit Apartments | 0 (0.0%) | 0 (0.0%) |
| 5 to 9 Unit Apartments | 0 (0.0%) | 0 (0.0%) |
| 10 or more Apartments | 0 (0.0%) | 0 (0.0%) |
| Mobile Home / Other | 32 (57.1%) | 24 (42.9%) |
| Total | 156 (76.1%) | 49 (23.9%) |
Housing Structures by Number of Rooms in Ephesus
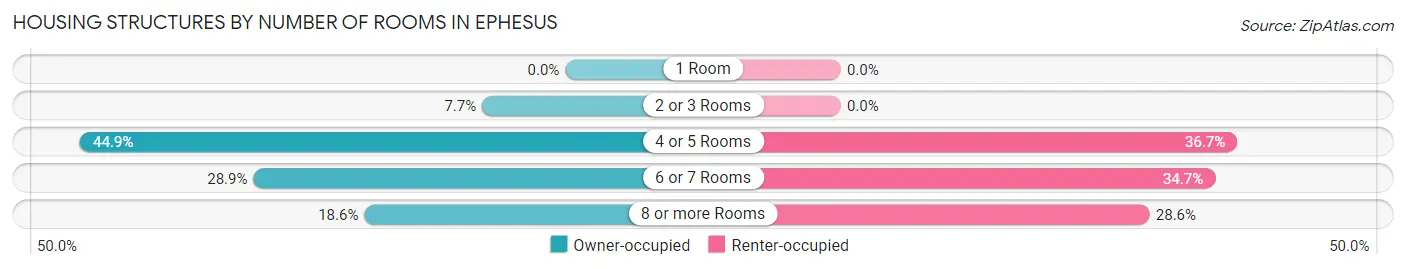
| Number of Rooms | Owner-occupied | Renter-occupied |
| 1 Room | 0 (0.0%) | 0 (0.0%) |
| 2 or 3 Rooms | 12 (7.7%) | 0 (0.0%) |
| 4 or 5 Rooms | 70 (44.9%) | 18 (36.7%) |
| 6 or 7 Rooms | 45 (28.8%) | 17 (34.7%) |
| 8 or more Rooms | 29 (18.6%) | 14 (28.6%) |
| Total | 156 (100.0%) | 49 (100.0%) |
Housing Structure by Heating Type in Ephesus
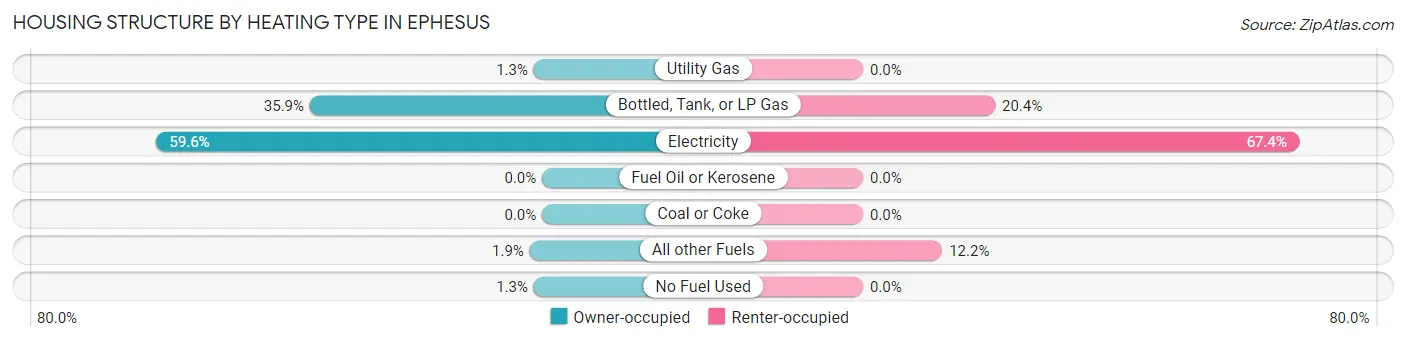
| Heating Type | Owner-occupied | Renter-occupied |
| Utility Gas | 2 (1.3%) | 0 (0.0%) |
| Bottled, Tank, or LP Gas | 56 (35.9%) | 10 (20.4%) |
| Electricity | 93 (59.6%) | 33 (67.3%) |
| Fuel Oil or Kerosene | 0 (0.0%) | 0 (0.0%) |
| Coal or Coke | 0 (0.0%) | 0 (0.0%) |
| All other Fuels | 3 (1.9%) | 6 (12.2%) |
| No Fuel Used | 2 (1.3%) | 0 (0.0%) |
| Total | 156 (100.0%) | 49 (100.0%) |
Household Vehicle Usage in Ephesus
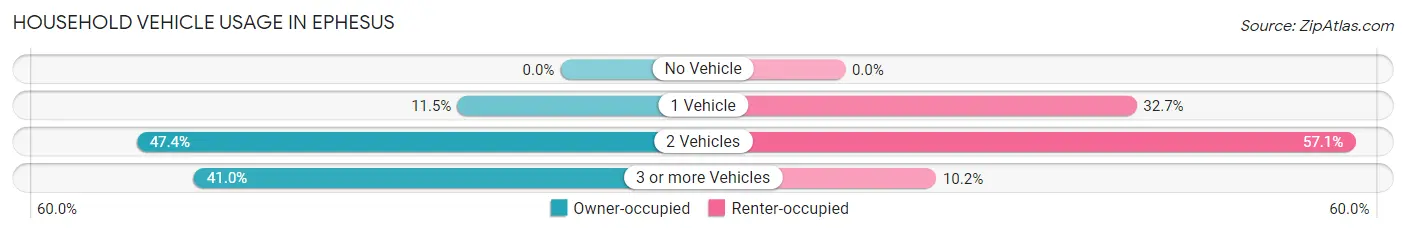
| Vehicles per Household | Owner-occupied | Renter-occupied |
| No Vehicle | 0 (0.0%) | 0 (0.0%) |
| 1 Vehicle | 18 (11.5%) | 16 (32.7%) |
| 2 Vehicles | 74 (47.4%) | 28 (57.1%) |
| 3 or more Vehicles | 64 (41.0%) | 5 (10.2%) |
| Total | 156 (100.0%) | 49 (100.0%) |
Real Estate & Mortgages in Ephesus
Real Estate and Mortgage Overview in Ephesus
| Characteristic | Without Mortgage | With Mortgage |
| Housing Units | 66 | 90 |
| Median Property Value | $142,300 | $160,700 |
| Median Household Income | $65,250 | $9 |
| Monthly Housing Costs | $443 | $0 |
| Real Estate Taxes | $520 | $7 |
Property Value by Mortgage Status in Ephesus
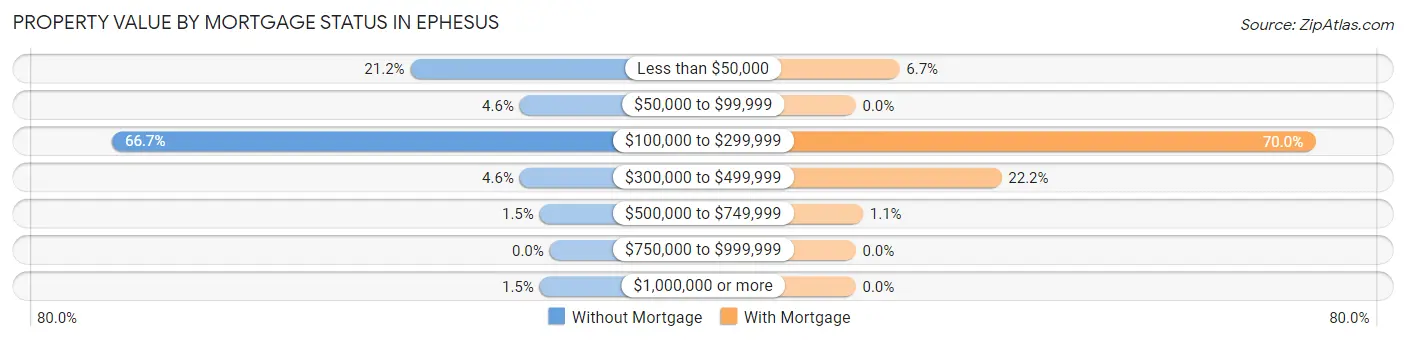
| Property Value | Without Mortgage | With Mortgage |
| Less than $50,000 | 14 (21.2%) | 6 (6.7%) |
| $50,000 to $99,999 | 3 (4.5%) | 0 (0.0%) |
| $100,000 to $299,999 | 44 (66.7%) | 63 (70.0%) |
| $300,000 to $499,999 | 3 (4.5%) | 20 (22.2%) |
| $500,000 to $749,999 | 1 (1.5%) | 1 (1.1%) |
| $750,000 to $999,999 | 0 (0.0%) | 0 (0.0%) |
| $1,000,000 or more | 1 (1.5%) | 0 (0.0%) |
| Total | 66 (100.0%) | 90 (100.0%) |
Household Income by Mortgage Status in Ephesus
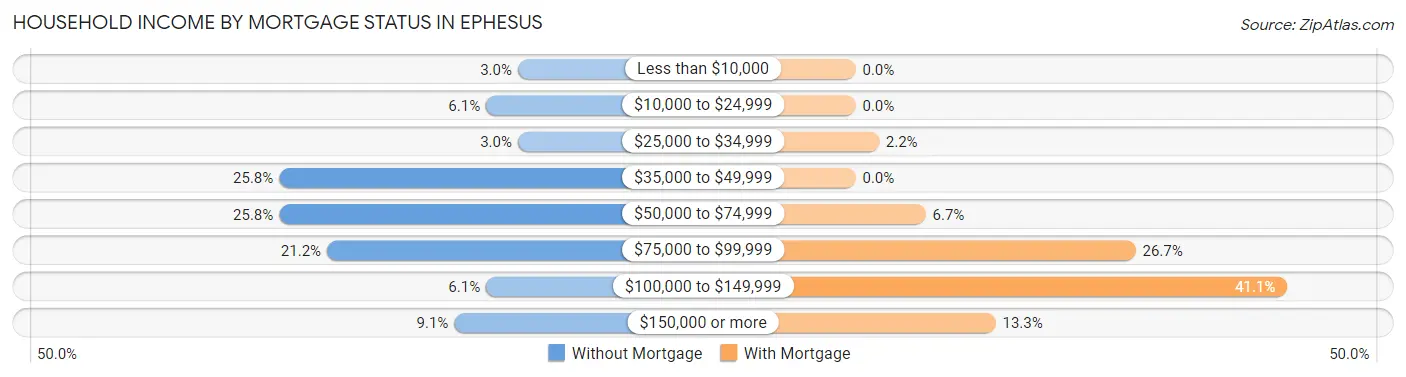
| Household Income | Without Mortgage | With Mortgage |
| Less than $10,000 | 2 (3.0%) | 0 (0.0%) |
| $10,000 to $24,999 | 4 (6.1%) | 0 (0.0%) |
| $25,000 to $34,999 | 2 (3.0%) | 2 (2.2%) |
| $35,000 to $49,999 | 17 (25.8%) | 0 (0.0%) |
| $50,000 to $74,999 | 17 (25.8%) | 6 (6.7%) |
| $75,000 to $99,999 | 14 (21.2%) | 24 (26.7%) |
| $100,000 to $149,999 | 4 (6.1%) | 37 (41.1%) |
| $150,000 or more | 6 (9.1%) | 12 (13.3%) |
| Total | 66 (100.0%) | 90 (100.0%) |
Property Value to Household Income Ratio in Ephesus
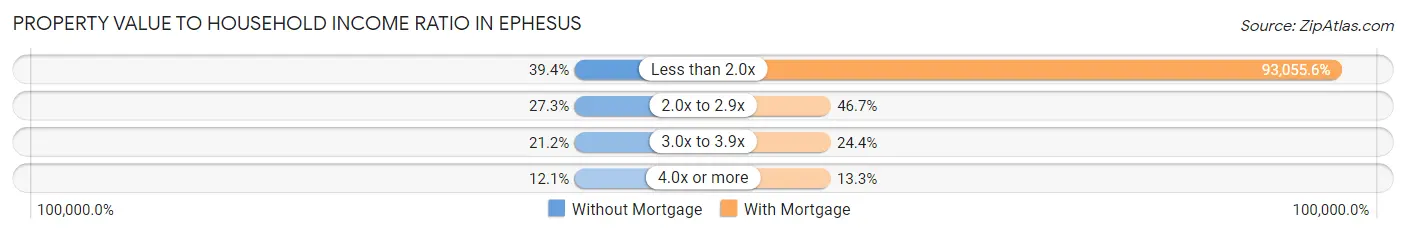
| Value-to-Income Ratio | Without Mortgage | With Mortgage |
| Less than 2.0x | 26 (39.4%) | 83,750 (93,055.6%) |
| 2.0x to 2.9x | 18 (27.3%) | 42 (46.7%) |
| 3.0x to 3.9x | 14 (21.2%) | 22 (24.4%) |
| 4.0x or more | 8 (12.1%) | 12 (13.3%) |
| Total | 66 (100.0%) | 90 (100.0%) |
Real Estate Taxes by Mortgage Status in Ephesus
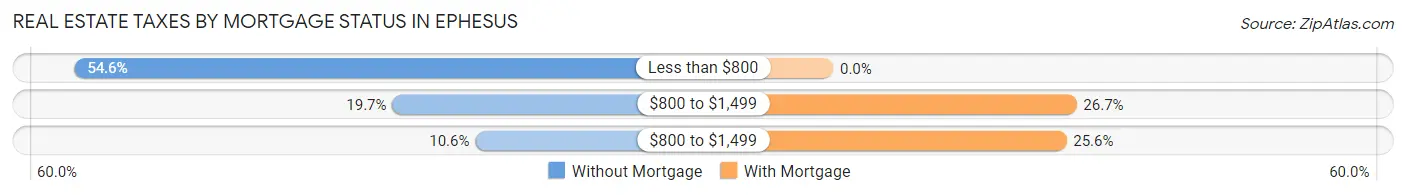
| Property Taxes | Without Mortgage | With Mortgage |
| Less than $800 | 36 (54.5%) | 0 (0.0%) |
| $800 to $1,499 | 13 (19.7%) | 24 (26.7%) |
| $800 to $1,499 | 7 (10.6%) | 23 (25.6%) |
| Total | 66 (100.0%) | 90 (100.0%) |
Health & Disability in Ephesus
Health Insurance Coverage by Age in Ephesus
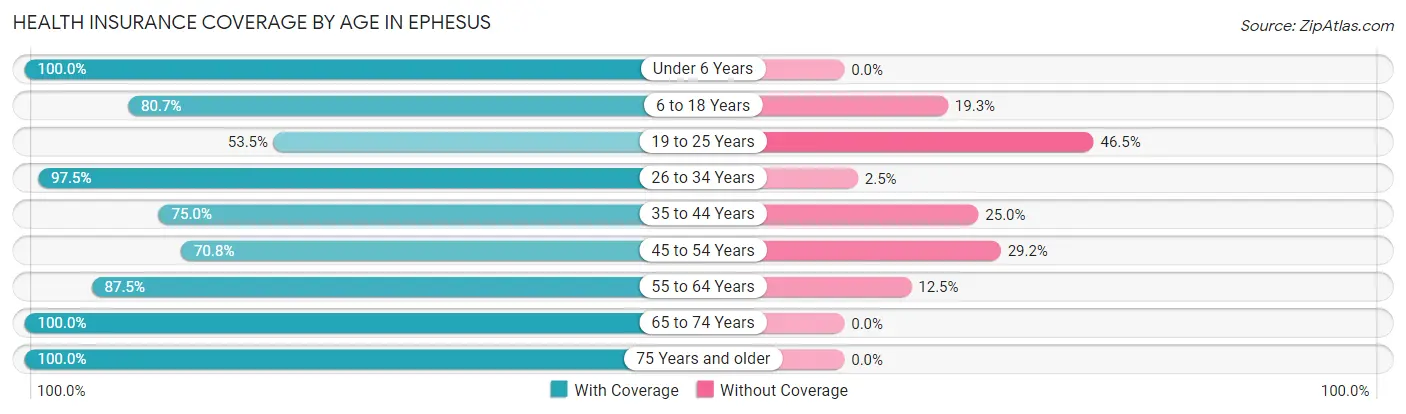
| Age Bracket | With Coverage | Without Coverage |
| Under 6 Years | 75 (100.0%) | 0 (0.0%) |
| 6 to 18 Years | 71 (80.7%) | 17 (19.3%) |
| 19 to 25 Years | 38 (53.5%) | 33 (46.5%) |
| 26 to 34 Years | 77 (97.5%) | 2 (2.5%) |
| 35 to 44 Years | 27 (75.0%) | 9 (25.0%) |
| 45 to 54 Years | 51 (70.8%) | 21 (29.2%) |
| 55 to 64 Years | 56 (87.5%) | 8 (12.5%) |
| 65 to 74 Years | 42 (100.0%) | 0 (0.0%) |
| 75 Years and older | 23 (100.0%) | 0 (0.0%) |
| Total | 460 (83.6%) | 90 (16.4%) |
Health Insurance Coverage by Citizenship Status in Ephesus
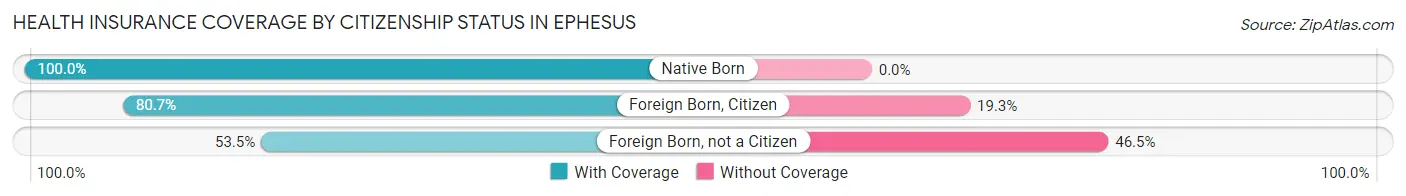
| Citizenship Status | With Coverage | Without Coverage |
| Native Born | 75 (100.0%) | 0 (0.0%) |
| Foreign Born, Citizen | 71 (80.7%) | 17 (19.3%) |
| Foreign Born, not a Citizen | 38 (53.5%) | 33 (46.5%) |
Health Insurance Coverage by Household Income in Ephesus
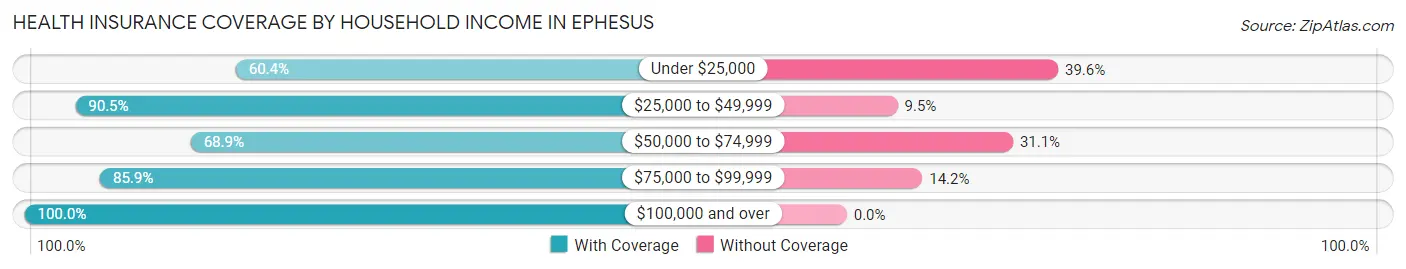
| Household Income | With Coverage | Without Coverage |
| Under $25,000 | 29 (60.4%) | 19 (39.6%) |
| $25,000 to $49,999 | 76 (90.5%) | 8 (9.5%) |
| $50,000 to $74,999 | 73 (68.9%) | 33 (31.1%) |
| $75,000 to $99,999 | 182 (85.9%) | 30 (14.1%) |
| $100,000 and over | 100 (100.0%) | 0 (0.0%) |
Public vs Private Health Insurance Coverage by Age in Ephesus
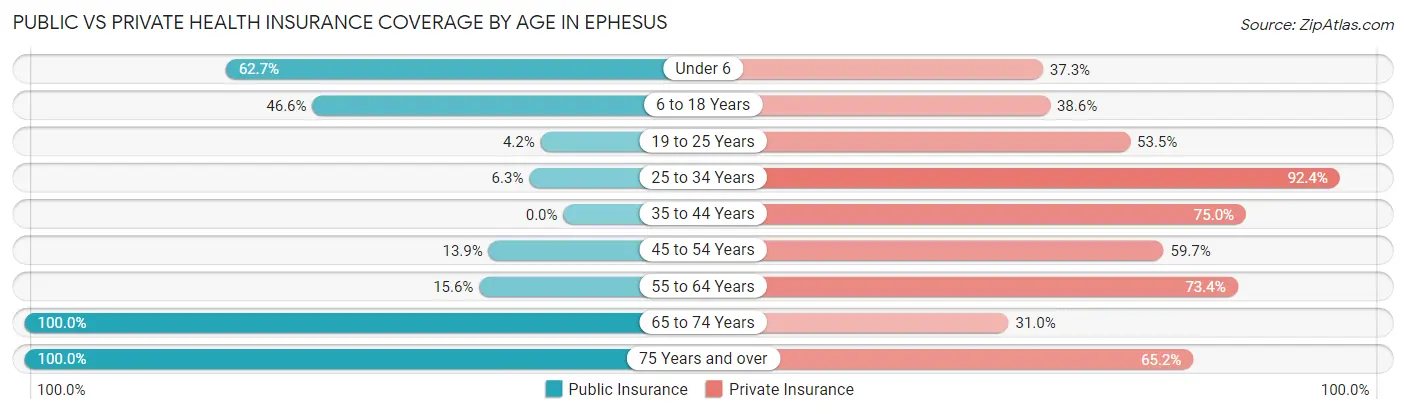
| Age Bracket | Public Insurance | Private Insurance |
| Under 6 | 47 (62.7%) | 28 (37.3%) |
| 6 to 18 Years | 41 (46.6%) | 34 (38.6%) |
| 19 to 25 Years | 3 (4.2%) | 38 (53.5%) |
| 25 to 34 Years | 5 (6.3%) | 73 (92.4%) |
| 35 to 44 Years | 0 (0.0%) | 27 (75.0%) |
| 45 to 54 Years | 10 (13.9%) | 43 (59.7%) |
| 55 to 64 Years | 10 (15.6%) | 47 (73.4%) |
| 65 to 74 Years | 42 (100.0%) | 13 (30.9%) |
| 75 Years and over | 23 (100.0%) | 15 (65.2%) |
| Total | 181 (32.9%) | 318 (57.8%) |
Disability Status by Sex by Age in Ephesus
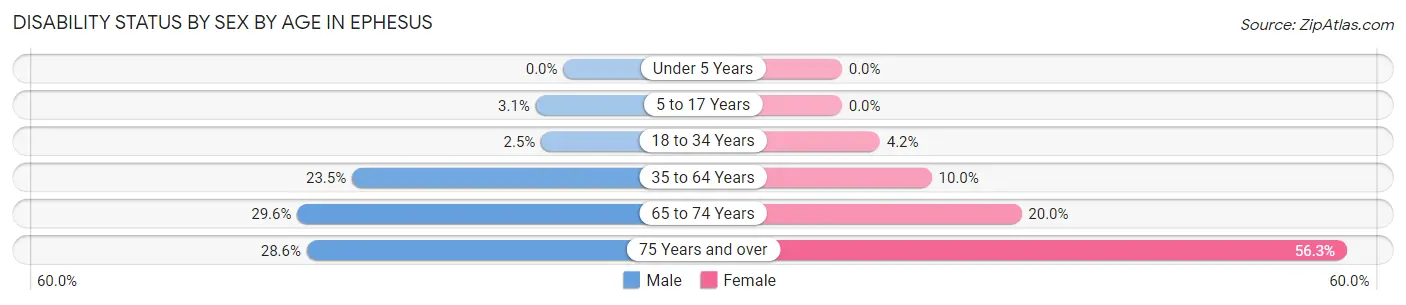
| Age Bracket | Male | Female |
| Under 5 Years | 0 (0.0%) | 0 (0.0%) |
| 5 to 17 Years | 2 (3.1%) | 0 (0.0%) |
| 18 to 34 Years | 2 (2.5%) | 3 (4.2%) |
| 35 to 64 Years | 24 (23.5%) | 7 (10.0%) |
| 65 to 74 Years | 8 (29.6%) | 3 (20.0%) |
| 75 Years and over | 2 (28.6%) | 9 (56.2%) |
Disability Class by Sex by Age in Ephesus
Disability Class: Hearing Difficulty
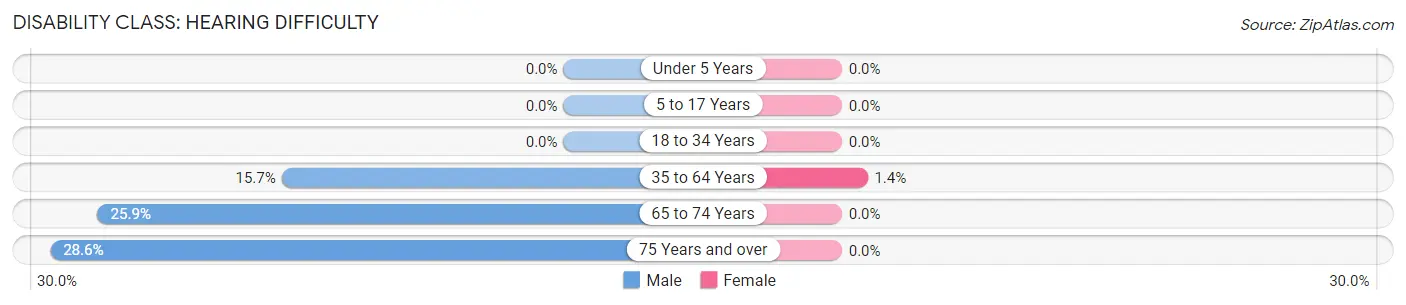
| Age Bracket | Male | Female |
| Under 5 Years | 0 (0.0%) | 0 (0.0%) |
| 5 to 17 Years | 0 (0.0%) | 0 (0.0%) |
| 18 to 34 Years | 0 (0.0%) | 0 (0.0%) |
| 35 to 64 Years | 16 (15.7%) | 1 (1.4%) |
| 65 to 74 Years | 7 (25.9%) | 0 (0.0%) |
| 75 Years and over | 2 (28.6%) | 0 (0.0%) |
Disability Class: Vision Difficulty
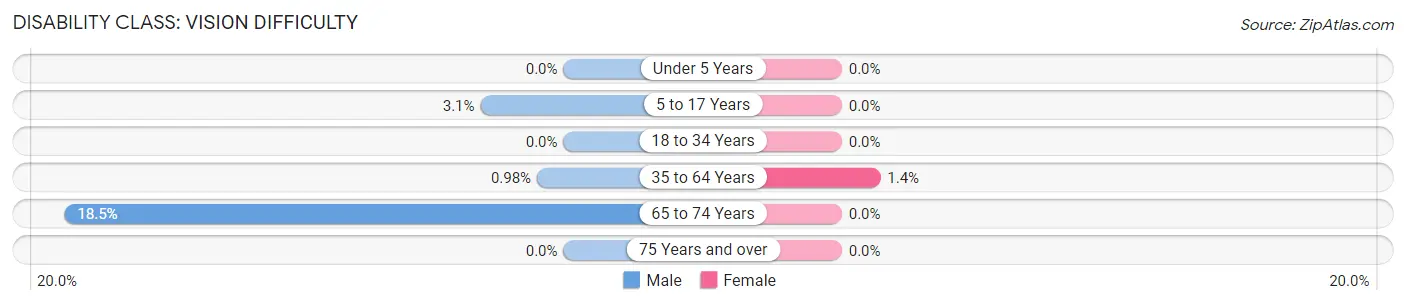
| Age Bracket | Male | Female |
| Under 5 Years | 0 (0.0%) | 0 (0.0%) |
| 5 to 17 Years | 2 (3.1%) | 0 (0.0%) |
| 18 to 34 Years | 0 (0.0%) | 0 (0.0%) |
| 35 to 64 Years | 1 (1.0%) | 1 (1.4%) |
| 65 to 74 Years | 5 (18.5%) | 0 (0.0%) |
| 75 Years and over | 0 (0.0%) | 0 (0.0%) |
Disability Class: Cognitive Difficulty
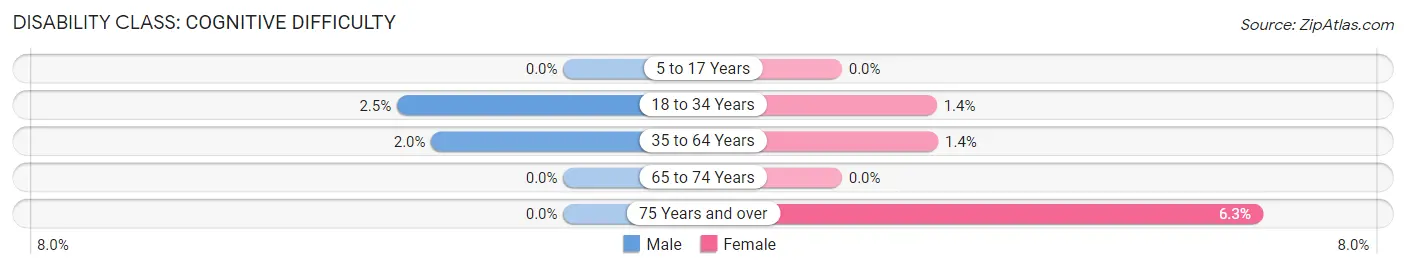
| Age Bracket | Male | Female |
| 5 to 17 Years | 0 (0.0%) | 0 (0.0%) |
| 18 to 34 Years | 2 (2.5%) | 1 (1.4%) |
| 35 to 64 Years | 2 (2.0%) | 1 (1.4%) |
| 65 to 74 Years | 0 (0.0%) | 0 (0.0%) |
| 75 Years and over | 0 (0.0%) | 1 (6.2%) |
Disability Class: Ambulatory Difficulty
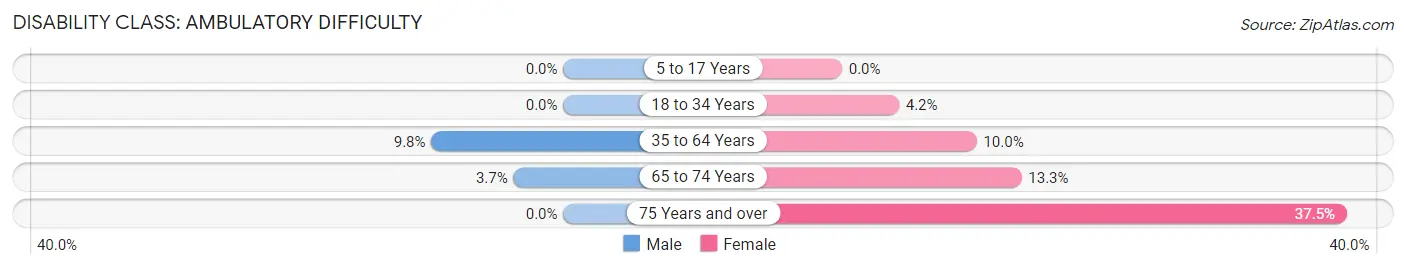
| Age Bracket | Male | Female |
| 5 to 17 Years | 0 (0.0%) | 0 (0.0%) |
| 18 to 34 Years | 0 (0.0%) | 3 (4.2%) |
| 35 to 64 Years | 10 (9.8%) | 7 (10.0%) |
| 65 to 74 Years | 1 (3.7%) | 2 (13.3%) |
| 75 Years and over | 0 (0.0%) | 6 (37.5%) |
Disability Class: Self-Care Difficulty
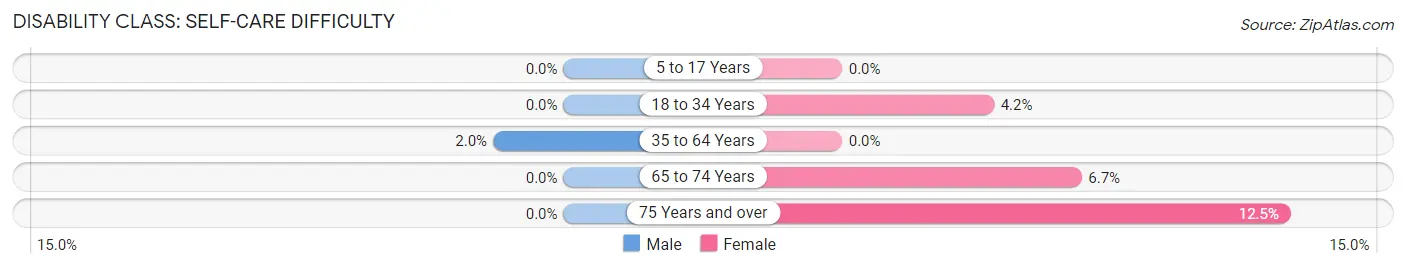
| Age Bracket | Male | Female |
| 5 to 17 Years | 0 (0.0%) | 0 (0.0%) |
| 18 to 34 Years | 0 (0.0%) | 3 (4.2%) |
| 35 to 64 Years | 2 (2.0%) | 0 (0.0%) |
| 65 to 74 Years | 0 (0.0%) | 1 (6.7%) |
| 75 Years and over | 0 (0.0%) | 2 (12.5%) |
Technology Access in Ephesus
Computing Device Access in Ephesus
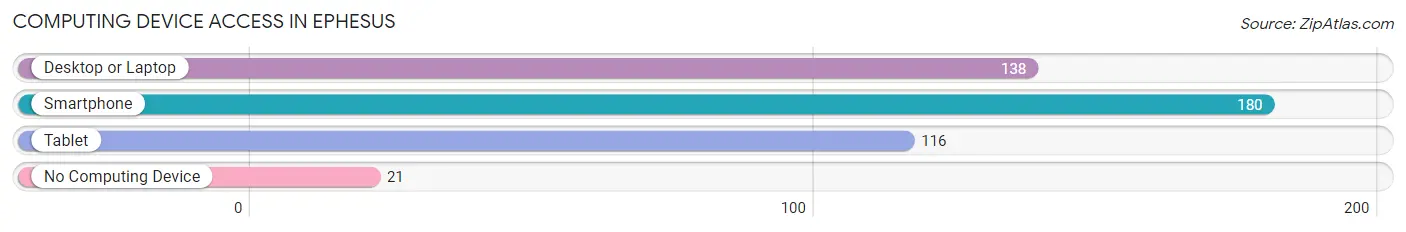
| Device Type | # Households | % Households |
| Desktop or Laptop | 138 | 67.3% |
| Smartphone | 180 | 87.8% |
| Tablet | 116 | 56.6% |
| No Computing Device | 21 | 10.2% |
| Total | 205 | 100.0% |
Internet Access in Ephesus
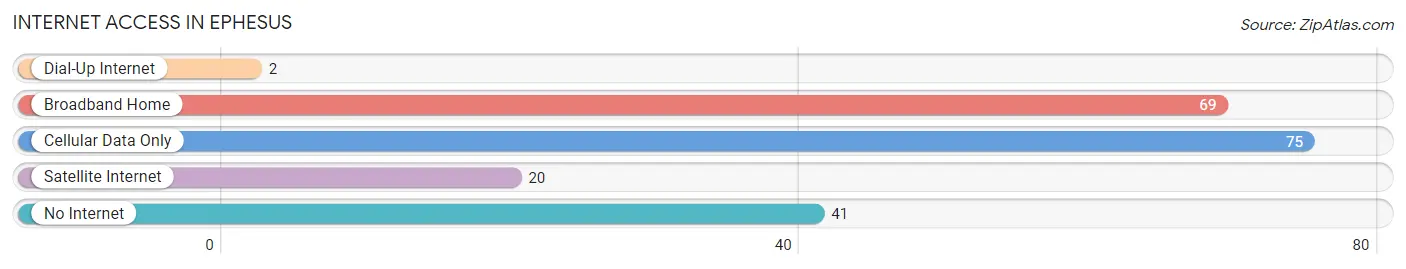
| Internet Type | # Households | % Households |
| Dial-Up Internet | 2 | 1.0% |
| Broadband Home | 69 | 33.7% |
| Cellular Data Only | 75 | 36.6% |
| Satellite Internet | 20 | 9.8% |
| No Internet | 41 | 20.0% |
| Total | 205 | 100.0% |
Ephesus Summary
Ephesus, Georgia is a small town located in the northwest corner of the state, in Heard County. It is situated on the banks of the Chattahoochee River, and is part of the Atlanta metropolitan area. The town was founded in 1837 and has a population of just over 1,000 people.
History
Ephesus was founded in 1837 by a group of settlers from South Carolina. The town was named after the ancient city of Ephesus in Turkey, which was a major trading center in the ancient world. The settlers were attracted to the area due to its proximity to the Chattahoochee River, which provided a convenient transportation route for goods and people.
The town quickly grew and prospered, and by the late 19th century, it was a thriving agricultural center. Cotton was the main crop grown in the area, and the town was home to several cotton gins and warehouses. The town also had a number of stores, churches, and other businesses.
In the early 20th century, the town began to decline as the cotton industry moved away from the area. The Great Depression also had a major impact on the town, and many of the businesses closed. The town was able to survive, however, and by the 1950s, it had become a popular tourist destination.
Geography
Ephesus is located in the northwest corner of Georgia, in Heard County. It is situated on the banks of the Chattahoochee River, and is part of the Atlanta metropolitan area. The town is located about 30 miles south of Atlanta, and is accessible via Interstate 85.
The town is located in a rural area, and is surrounded by rolling hills and forests. The town is also home to several small lakes, which provide recreational opportunities for visitors.
Economy
Ephesus is a small town, and the economy is largely based on tourism. The town is home to several small businesses, including restaurants, antique stores, and gift shops. The town also has a number of bed and breakfasts, which attract visitors from all over the country.
The town is also home to a number of farms, which produce a variety of crops, including cotton, corn, and soybeans. The town is also home to a number of manufacturing plants, which produce a variety of products, including furniture, clothing, and electronics.
Demographics
As of the 2010 census, the population of Ephesus was 1,072. The town is predominantly white, with a small African American population. The median household income is $37,000, and the median home value is $125,000. The town has a low unemployment rate, and the poverty rate is below the national average.
Ephesus is a small town with a rich history and a bright future. The town is home to a number of businesses, and is a popular tourist destination. The town is also home to a number of farms, which provide a variety of products to the local economy. The town is a great place to live, work, and visit.
Common Questions
What is Per Capita Income in Ephesus?
Per Capita income in Ephesus is $31,141.
What is the Median Family Income in Ephesus?
Median Family Income in Ephesus is $73,750.
What is the Median Household income in Ephesus?
Median Household Income in Ephesus is $66,875.
What is Income or Wage Gap in Ephesus?
Income or Wage Gap in Ephesus is 59.1%.
Women in Ephesus earn 40.9 cents for every dollar earned by a man.
What is Inequality or Gini Index in Ephesus?
Inequality or Gini Index in Ephesus is 0.41.
What is the Total Population of Ephesus?
Total Population of Ephesus is 553.
What is the Total Male Population of Ephesus?
Total Male Population of Ephesus is 311.
What is the Total Female Population of Ephesus?
Total Female Population of Ephesus is 242.
What is the Ratio of Males per 100 Females in Ephesus?
There are 128.51 Males per 100 Females in Ephesus.
What is the Ratio of Females per 100 Males in Ephesus?
There are 77.81 Females per 100 Males in Ephesus.
What is the Median Population Age in Ephesus?
Median Population Age in Ephesus is 29.9 Years.
What is the Average Family Size in Ephesus
Average Family Size in Ephesus is 3.2 People.
What is the Average Household Size in Ephesus
Average Household Size in Ephesus is 2.7 People.
How Large is the Labor Force in Ephesus?
There are 279 People in the Labor Forcein in Ephesus.
What is the Percentage of People in the Labor Force in Ephesus?
69.4% of People are in the Labor Force in Ephesus.
What is the Unemployment Rate in Ephesus?
Unemployment Rate in Ephesus is 4.3%.