Zip Codes with the Highest Percentage of Population Employed in Security & Protection in Bainbridge, GA
RELATED REPORTS & OPTIONS
Security & Protection
Bainbridge
Compare Zip Codes
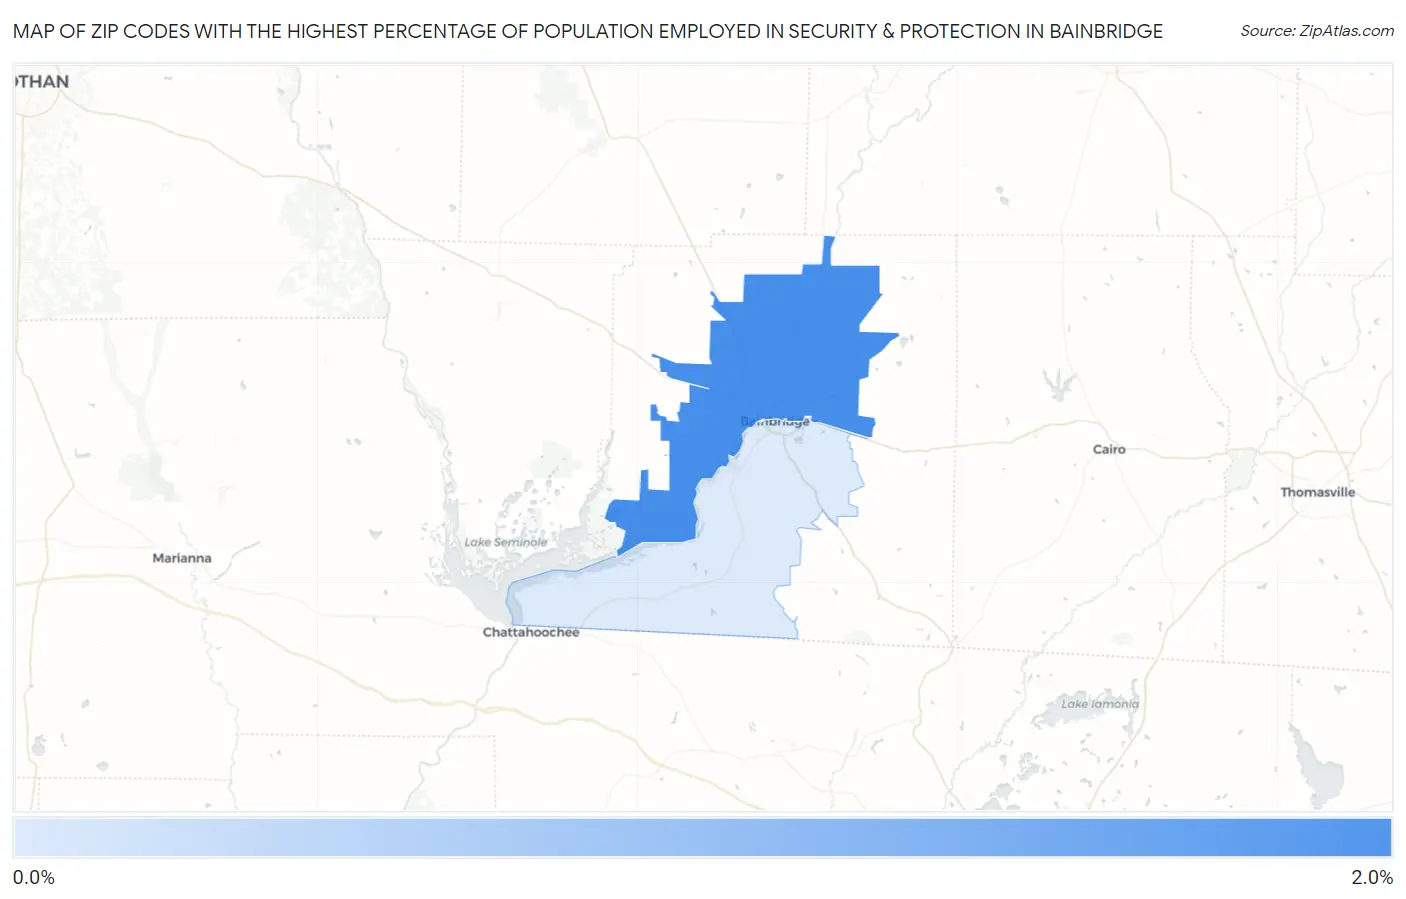
Map of Zip Codes with the Highest Percentage of Population Employed in Security & Protection in Bainbridge
0.90%
1.6%
Zip Codes with the Highest Percentage of Population Employed in Security & Protection in Bainbridge, GA
| Zip Code | % Employed | vs State | vs National | |
| 1. | 39817 | 1.6% | 2.2%(-0.549)#426 | 2.1%(-0.526)#15,237 |
| 2. | 39819 | 0.90% | 2.2%(-1.27)#540 | 2.1%(-1.25)#20,780 |
1
Common Questions
What are the Top Zip Codes with the Highest Percentage of Population Employed in Security & Protection in Bainbridge, GA?
Top Zip Codes with the Highest Percentage of Population Employed in Security & Protection in Bainbridge, GA are:
What zip code has the Highest Percentage of Population Employed in Security & Protection in Bainbridge, GA?
39817 has the Highest Percentage of Population Employed in Security & Protection in Bainbridge, GA with 1.6%.
What is the Percentage of Population Employed in Security & Protection in Bainbridge, GA?
Percentage of Population Employed in Security & Protection in Bainbridge is 0.36%.
What is the Percentage of Population Employed in Security & Protection in Georgia?
Percentage of Population Employed in Security & Protection in Georgia is 2.2%.
What is the Percentage of Population Employed in Security & Protection in the United States?
Percentage of Population Employed in Security & Protection in the United States is 2.1%.