Zip Codes with the Highest Percentage of Population Employed in Security & Protection in Woodstock, GA
RELATED REPORTS & OPTIONS
Security & Protection
Woodstock
Compare Zip Codes
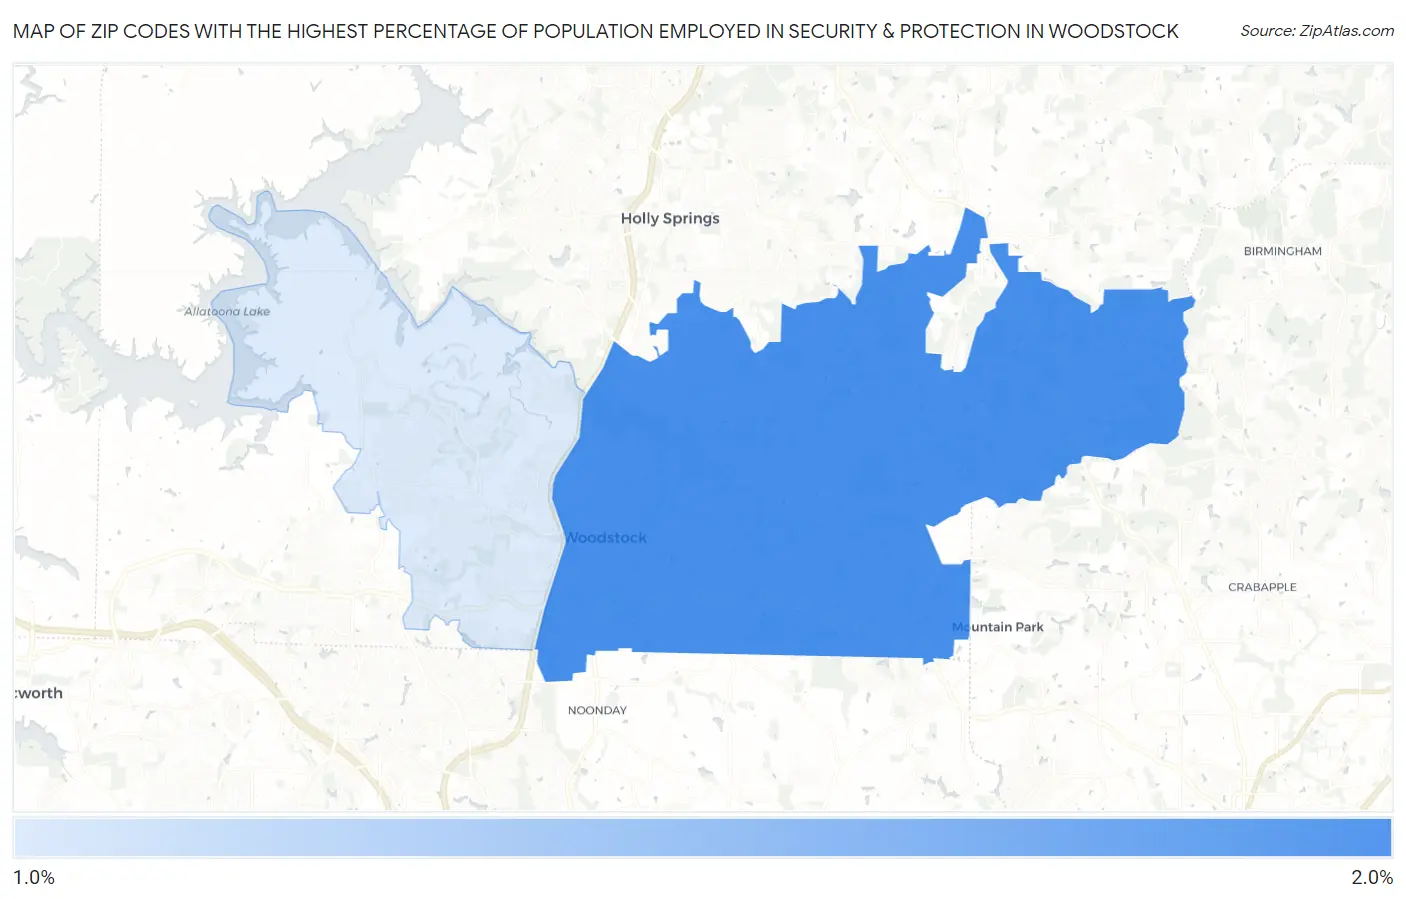
Map of Zip Codes with the Highest Percentage of Population Employed in Security & Protection in Woodstock
1.5%
1.6%
Zip Codes with the Highest Percentage of Population Employed in Security & Protection in Woodstock, GA
| Zip Code | % Employed | vs State | vs National | |
| 1. | 30188 | 1.6% | 2.2%(-0.607)#438 | 2.1%(-0.583)#15,682 |
| 2. | 30189 | 1.5% | 2.2%(-0.714)#453 | 2.1%(-0.691)#16,513 |
1
Common Questions
What are the Top Zip Codes with the Highest Percentage of Population Employed in Security & Protection in Woodstock, GA?
Top Zip Codes with the Highest Percentage of Population Employed in Security & Protection in Woodstock, GA are:
What zip code has the Highest Percentage of Population Employed in Security & Protection in Woodstock, GA?
30188 has the Highest Percentage of Population Employed in Security & Protection in Woodstock, GA with 1.6%.
What is the Percentage of Population Employed in Security & Protection in Woodstock, GA?
Percentage of Population Employed in Security & Protection in Woodstock is 2.0%.
What is the Percentage of Population Employed in Security & Protection in Georgia?
Percentage of Population Employed in Security & Protection in Georgia is 2.2%.
What is the Percentage of Population Employed in Security & Protection in the United States?
Percentage of Population Employed in Security & Protection in the United States is 2.1%.