Zip Codes with the Highest Percentage of Population Employed in Security & Protection in Norcross, GA
RELATED REPORTS & OPTIONS
Security & Protection
Norcross
Compare Zip Codes
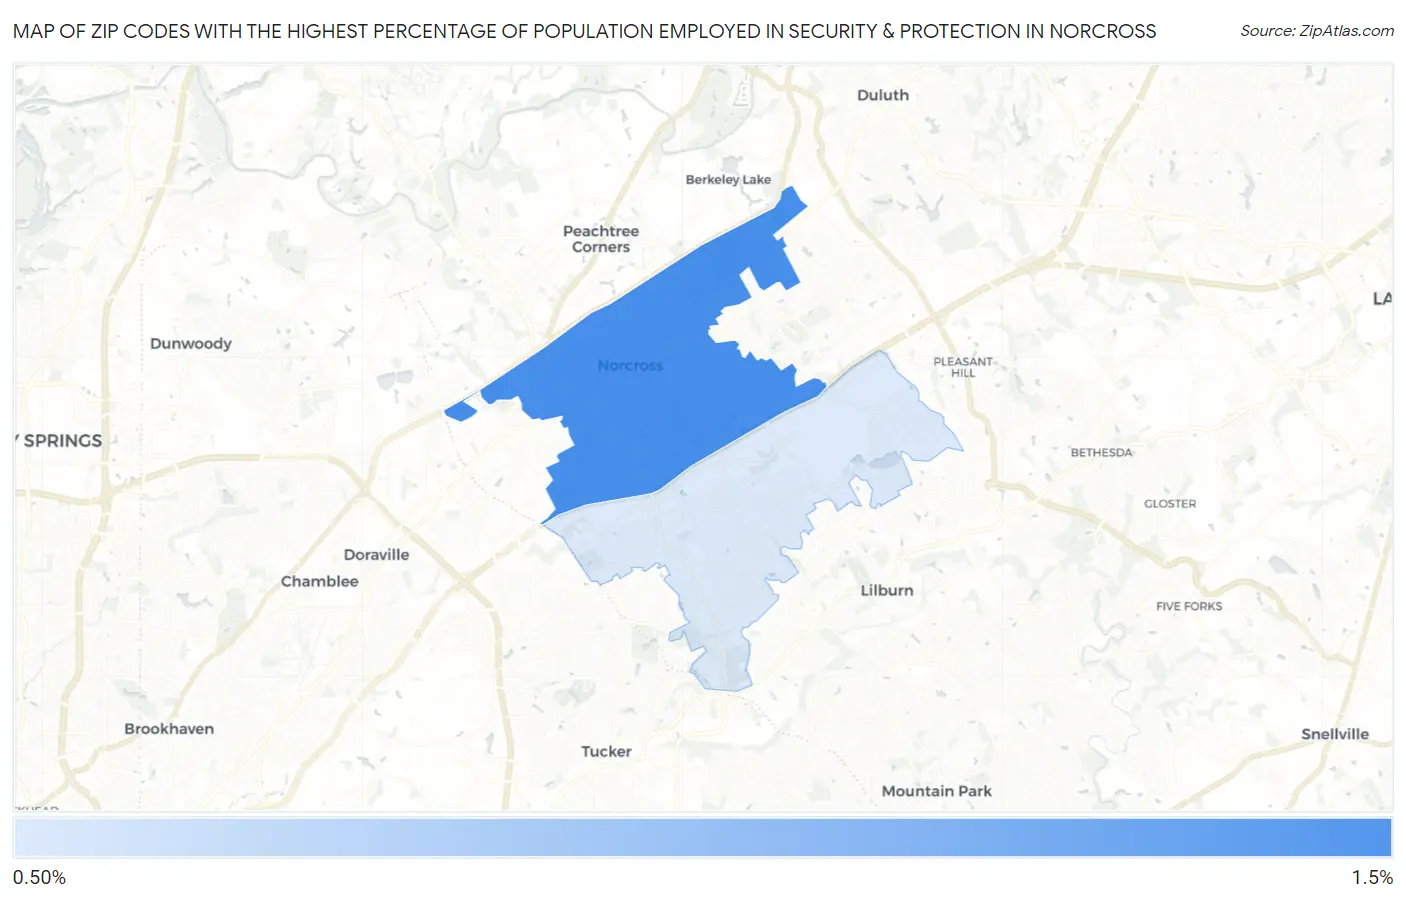
Map of Zip Codes with the Highest Percentage of Population Employed in Security & Protection in Norcross
0.98%
1.4%
Zip Codes with the Highest Percentage of Population Employed in Security & Protection in Norcross, GA
| Zip Code | % Employed | vs State | vs National | |
| 1. | 30071 | 1.4% | 2.2%(-0.734)#458 | 2.1%(-0.711)#16,679 |
| 2. | 30093 | 0.98% | 2.2%(-1.20)#531 | 2.1%(-1.17)#20,236 |
1
Common Questions
What are the Top Zip Codes with the Highest Percentage of Population Employed in Security & Protection in Norcross, GA?
Top Zip Codes with the Highest Percentage of Population Employed in Security & Protection in Norcross, GA are:
What zip code has the Highest Percentage of Population Employed in Security & Protection in Norcross, GA?
30071 has the Highest Percentage of Population Employed in Security & Protection in Norcross, GA with 1.4%.
What is the Percentage of Population Employed in Security & Protection in Norcross, GA?
Percentage of Population Employed in Security & Protection in Norcross is 2.0%.
What is the Percentage of Population Employed in Security & Protection in Georgia?
Percentage of Population Employed in Security & Protection in Georgia is 2.2%.
What is the Percentage of Population Employed in Security & Protection in the United States?
Percentage of Population Employed in Security & Protection in the United States is 2.1%.