Virden, NM Map & Demographics
Virden Map
Virden Overview
$40,647
PER CAPITA INCOME
$150,119
AVG FAMILY INCOME
$118,750
AVG HOUSEHOLD INCOME
97.6%
WAGE / INCOME GAP [ % ]
2.4¢/ $1
WAGE / INCOME GAP [ $ ]
0.44
INEQUALITY / GINI INDEX
192
TOTAL POPULATION
61
MALE POPULATION
131
FEMALE POPULATION
46.56
MALES / 100 FEMALES
214.75
FEMALES / 100 MALES
49.5
MEDIAN AGE
2.1
AVG FAMILY SIZE
2.0
AVG HOUSEHOLD SIZE
93
LABOR FORCE [ PEOPLE ]
60.8%
PERCENT IN LABOR FORCE
12.9%
UNEMPLOYMENT RATE
Virden Area Codes
Income in Virden
Income Overview in Virden
Per Capita Income in Virden is $40,647, while median incomes of families and households are $150,119 and $118,750 respectively.
| Characteristic | Number | Measure |
| Per Capita Income | 192 | $40,647 |
| Median Family Income | 90 | $150,119 |
| Mean Family Income | 90 | $149,202 |
| Median Household Income | 96 | $118,750 |
| Mean Household Income | 96 | $141,874 |
| Income Deficit | 90 | $0 |
| Wage / Income Gap (%) | 192 | 97.55% |
| Wage / Income Gap ($) | 192 | 2.45¢ per $1 |
| Gini / Inequality Index | 192 | 0.44 |
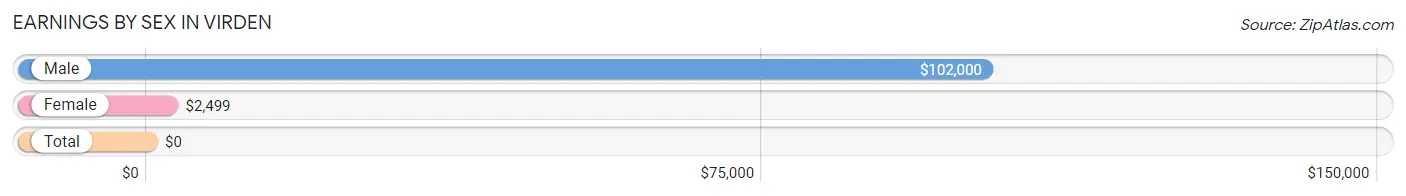
Earnings by Sex in Virden
| Sex | Number | Average Earnings |
| Male | 18 (18.6%) | $102,000 |
| Female | 79 (81.4%) | $2,499 |
| Total | 97 (100.0%) | $0 |
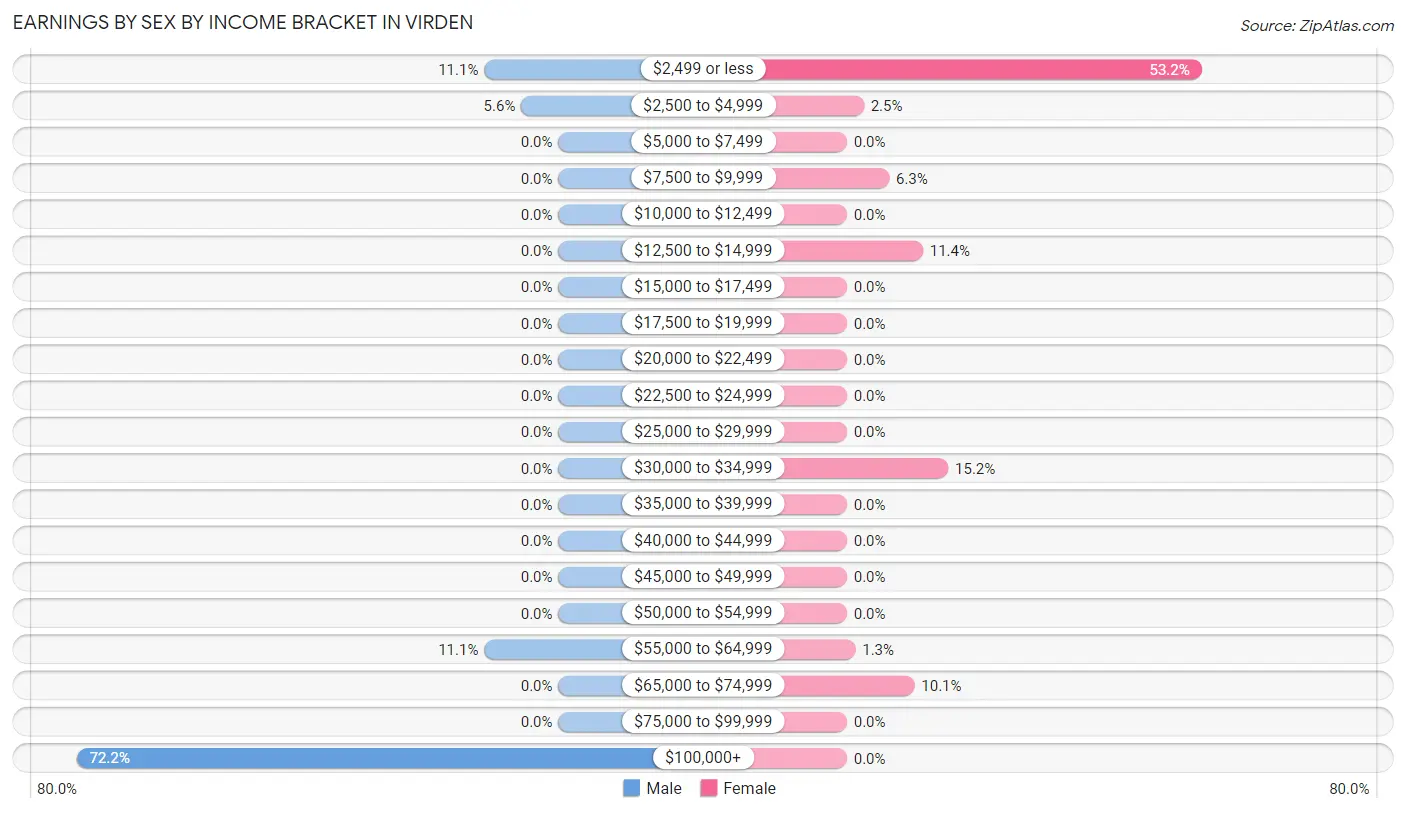
Earnings by Sex by Income Bracket in Virden
The most common earnings brackets in Virden are $100,000+ for men (13 | 72.2%) and $2,499 or less for women (42 | 53.2%).
| Income | Male | Female |
| $2,499 or less | 2 (11.1%) | 42 (53.2%) |
| $2,500 to $4,999 | 1 (5.6%) | 2 (2.5%) |
| $5,000 to $7,499 | 0 (0.0%) | 0 (0.0%) |
| $7,500 to $9,999 | 0 (0.0%) | 5 (6.3%) |
| $10,000 to $12,499 | 0 (0.0%) | 0 (0.0%) |
| $12,500 to $14,999 | 0 (0.0%) | 9 (11.4%) |
| $15,000 to $17,499 | 0 (0.0%) | 0 (0.0%) |
| $17,500 to $19,999 | 0 (0.0%) | 0 (0.0%) |
| $20,000 to $22,499 | 0 (0.0%) | 0 (0.0%) |
| $22,500 to $24,999 | 0 (0.0%) | 0 (0.0%) |
| $25,000 to $29,999 | 0 (0.0%) | 0 (0.0%) |
| $30,000 to $34,999 | 0 (0.0%) | 12 (15.2%) |
| $35,000 to $39,999 | 0 (0.0%) | 0 (0.0%) |
| $40,000 to $44,999 | 0 (0.0%) | 0 (0.0%) |
| $45,000 to $49,999 | 0 (0.0%) | 0 (0.0%) |
| $50,000 to $54,999 | 0 (0.0%) | 0 (0.0%) |
| $55,000 to $64,999 | 2 (11.1%) | 1 (1.3%) |
| $65,000 to $74,999 | 0 (0.0%) | 8 (10.1%) |
| $75,000 to $99,999 | 0 (0.0%) | 0 (0.0%) |
| $100,000+ | 13 (72.2%) | 0 (0.0%) |
| Total | 18 (100.0%) | 79 (100.0%) |
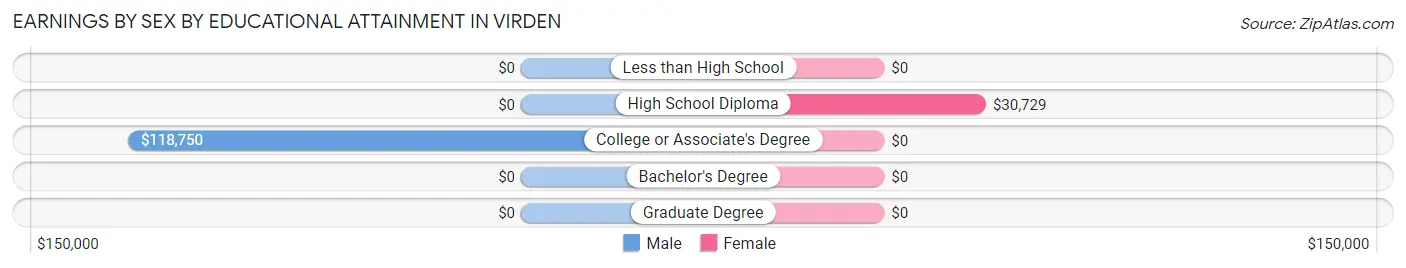
Earnings by Sex by Educational Attainment in Virden
Average earnings in Virden are $106,250 for men and $2,499 for women, a difference of 97.7%. Men with an educational attainment of college or associate's degree enjoy the highest average annual earnings of $118,750, while those with college or associate's degree education earn the least with $118,750. Women with an educational attainment of high school diploma earn the most with the average annual earnings of $30,729, while those with high school diploma education have the smallest earnings of $30,729.
| Educational Attainment | Male Income | Female Income |
| Less than High School | - | - |
| High School Diploma | - | - |
| College or Associate's Degree | $118,750 | $0 |
| Bachelor's Degree | - | - |
| Graduate Degree | - | - |
| Total | $106,250 | $2,499 |
Family Income in Virden
Family Income Brackets in Virden
According to the Virden family income data, there are 44 families falling into the $150,000 to $199,999 income range, which is the most common income bracket and makes up 48.9% of all families.
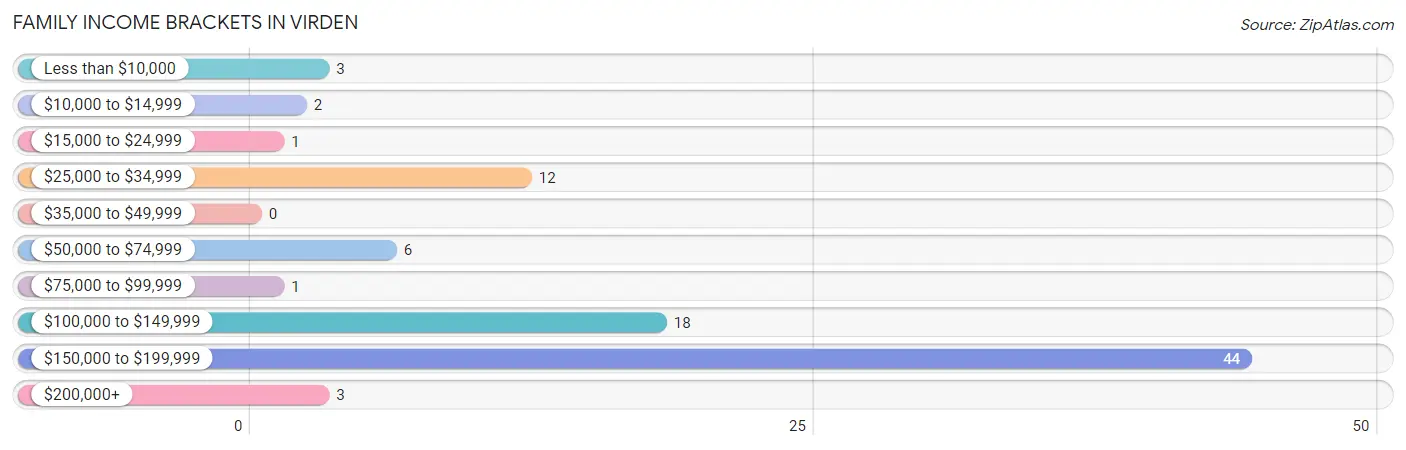
| Income Bracket | # Families | % Families |
| Less than $10,000 | 3 | 3.3% |
| $10,000 to $14,999 | 2 | 2.2% |
| $15,000 to $24,999 | 1 | 1.1% |
| $25,000 to $34,999 | 12 | 13.3% |
| $35,000 to $49,999 | 0 | 0.0% |
| $50,000 to $74,999 | 6 | 6.7% |
| $75,000 to $99,999 | 1 | 1.1% |
| $100,000 to $149,999 | 18 | 20.0% |
| $150,000 to $199,999 | 44 | 48.9% |
| $200,000+ | 3 | 3.3% |
Family Income by Famaliy Size in Virden
2-person families (62 | 68.9%) account for the highest median family income in Virden with $150,952 per family, while 2-person families (62 | 68.9%) have the highest median income of $75,476 per family member.
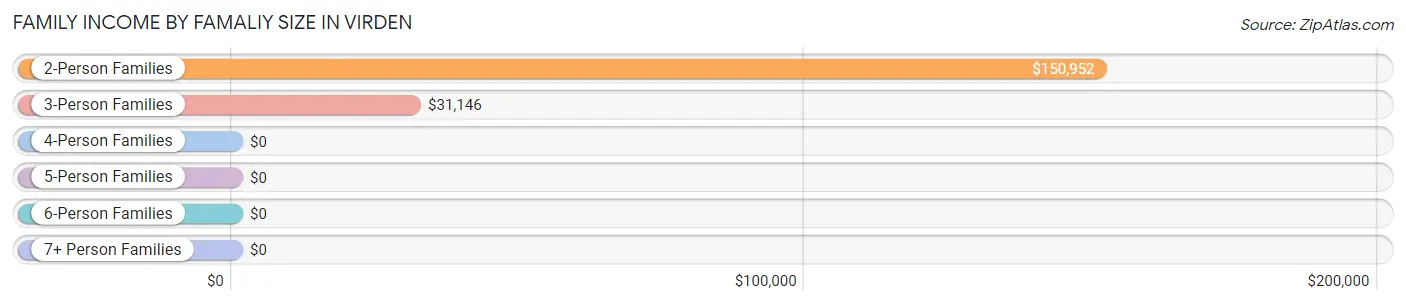
| Income Bracket | # Families | Median Income |
| 2-Person Families | 62 (68.9%) | $150,952 |
| 3-Person Families | 17 (18.9%) | $31,146 |
| 4-Person Families | 0 (0.0%) | $0 |
| 5-Person Families | 9 (10.0%) | $0 |
| 6-Person Families | 2 (2.2%) | $0 |
| 7+ Person Families | 0 (0.0%) | $0 |
| Total | 90 (100.0%) | $150,119 |
Family Income by Number of Earners in Virden
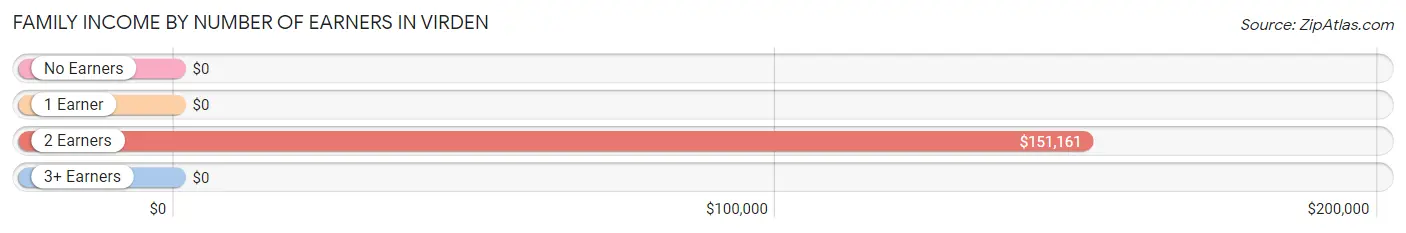
| Number of Earners | # Families | Median Income |
| No Earners | 12 (13.3%) | $0 |
| 1 Earner | 25 (27.8%) | $0 |
| 2 Earners | 45 (50.0%) | $151,161 |
| 3+ Earners | 8 (8.9%) | $0 |
| Total | 90 (100.0%) | $150,119 |
Household Income in Virden
Household Income Brackets in Virden
With 44 households falling in the category, the $150,000 to $199,999 income range is the most frequent in Virden, accounting for 45.8% of all households. In contrast, only 1 households (1.0%) fall into the $35,000 to $49,999 income bracket, making it the least populous group.
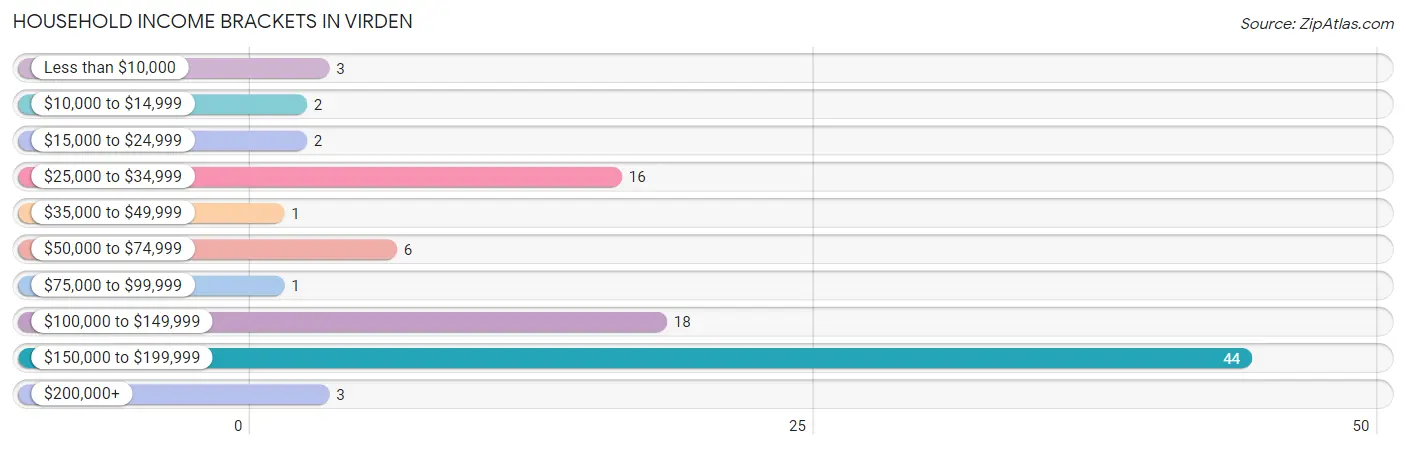
| Income Bracket | # Households | % Households |
| Less than $10,000 | 3 | 3.1% |
| $10,000 to $14,999 | 2 | 2.1% |
| $15,000 to $24,999 | 2 | 2.1% |
| $25,000 to $34,999 | 16 | 16.7% |
| $35,000 to $49,999 | 1 | 1.0% |
| $50,000 to $74,999 | 6 | 6.3% |
| $75,000 to $99,999 | 1 | 1.0% |
| $100,000 to $149,999 | 18 | 18.8% |
| $150,000 to $199,999 | 44 | 45.8% |
| $200,000+ | 3 | 3.1% |
Household Income by Householder Age in Virden
The median household income in Virden is $118,750, with the highest median household income of $150,565 found in the 45 to 64 years age bracket for the primary householder. A total of 65 households (67.7%) fall into this category.
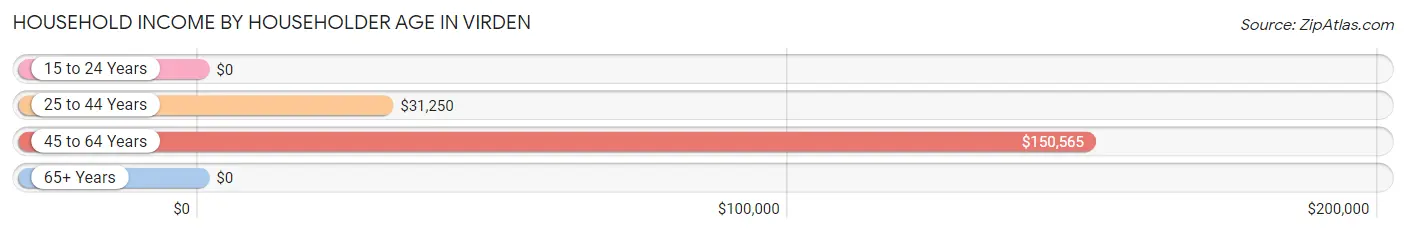
| Income Bracket | # Households | Median Income |
| 15 to 24 Years | 0 (0.0%) | $0 |
| 25 to 44 Years | 16 (16.7%) | $31,250 |
| 45 to 64 Years | 65 (67.7%) | $150,565 |
| 65+ Years | 15 (15.6%) | $0 |
| Total | 96 (100.0%) | $118,750 |
Poverty in Virden
Income Below Poverty by Sex and Age in Virden
With 3.3% poverty level for males and 13.0% for females among the residents of Virden, 55 to 64 year old males and 18 to 24 year old females are the most vulnerable to poverty, with 2 males (15.4%) and 4 females (100.0%) in their respective age groups living below the poverty level.
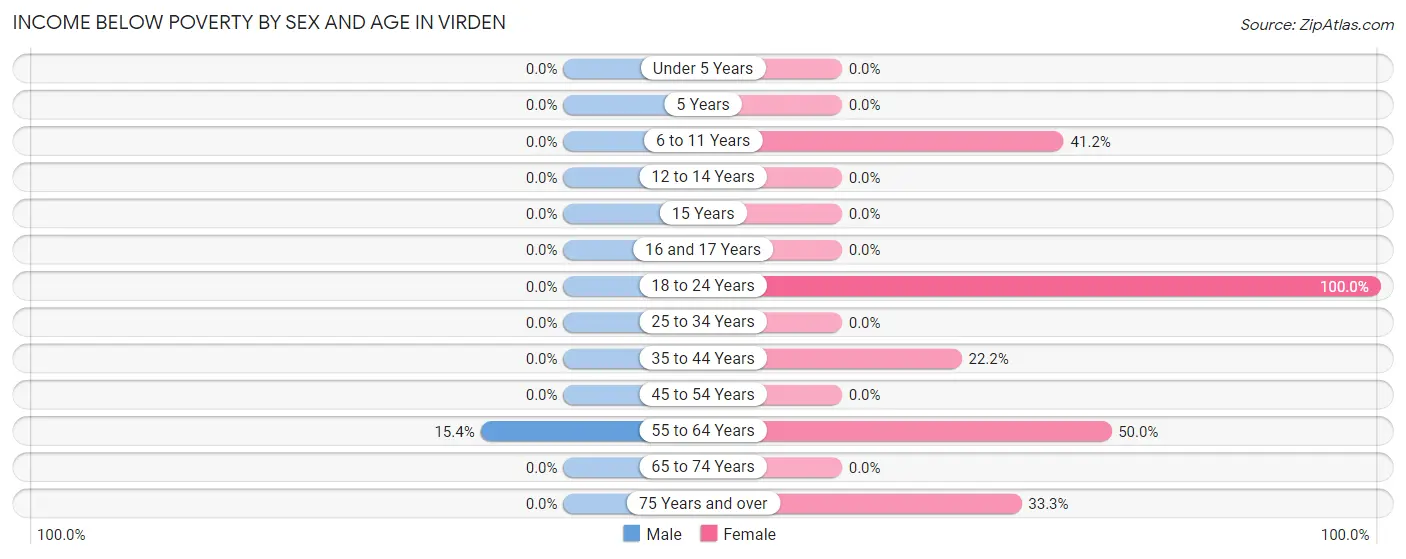
| Age Bracket | Male | Female |
| Under 5 Years | 0 (0.0%) | 0 (0.0%) |
| 5 Years | 0 (0.0%) | 0 (0.0%) |
| 6 to 11 Years | 0 (0.0%) | 7 (41.2%) |
| 12 to 14 Years | 0 (0.0%) | 0 (0.0%) |
| 15 Years | 0 (0.0%) | 0 (0.0%) |
| 16 and 17 Years | 0 (0.0%) | 0 (0.0%) |
| 18 to 24 Years | 0 (0.0%) | 4 (100.0%) |
| 25 to 34 Years | 0 (0.0%) | 0 (0.0%) |
| 35 to 44 Years | 0 (0.0%) | 2 (22.2%) |
| 45 to 54 Years | 0 (0.0%) | 0 (0.0%) |
| 55 to 64 Years | 2 (15.4%) | 2 (50.0%) |
| 65 to 74 Years | 0 (0.0%) | 0 (0.0%) |
| 75 Years and over | 0 (0.0%) | 2 (33.3%) |
| Total | 2 (3.3%) | 17 (13.0%) |
Income Above Poverty by Sex and Age in Virden
According to the poverty statistics in Virden, males aged under 5 years and females aged 12 to 14 years are the age groups that are most secure financially, with 100.0% of males and 100.0% of females in these age groups living above the poverty line.
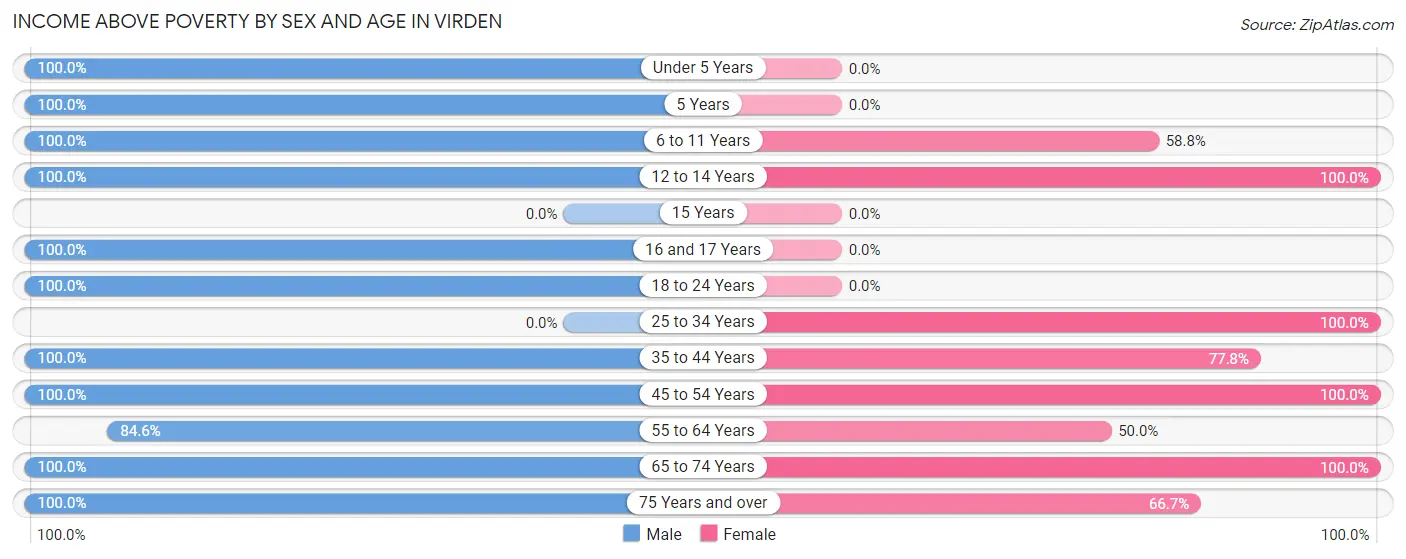
| Age Bracket | Male | Female |
| Under 5 Years | 1 (100.0%) | 0 (0.0%) |
| 5 Years | 1 (100.0%) | 0 (0.0%) |
| 6 to 11 Years | 3 (100.0%) | 10 (58.8%) |
| 12 to 14 Years | 7 (100.0%) | 10 (100.0%) |
| 15 Years | 0 (0.0%) | 0 (0.0%) |
| 16 and 17 Years | 9 (100.0%) | 0 (0.0%) |
| 18 to 24 Years | 4 (100.0%) | 0 (0.0%) |
| 25 to 34 Years | 0 (0.0%) | 12 (100.0%) |
| 35 to 44 Years | 6 (100.0%) | 7 (77.8%) |
| 45 to 54 Years | 5 (100.0%) | 58 (100.0%) |
| 55 to 64 Years | 11 (84.6%) | 2 (50.0%) |
| 65 to 74 Years | 9 (100.0%) | 11 (100.0%) |
| 75 Years and over | 3 (100.0%) | 4 (66.7%) |
| Total | 59 (96.7%) | 114 (87.0%) |
Income Below Poverty Among Married-Couple Families in Virden
The poverty statistics for married-couple families in Virden show that 2.7% or 2 of the total 75 families live below the poverty line. Families with no children have the highest poverty rate of 3.1%, comprising of 2 families. On the other hand, families with 1 or 2 children have the lowest poverty rate of 0.0%, which includes 0 families.
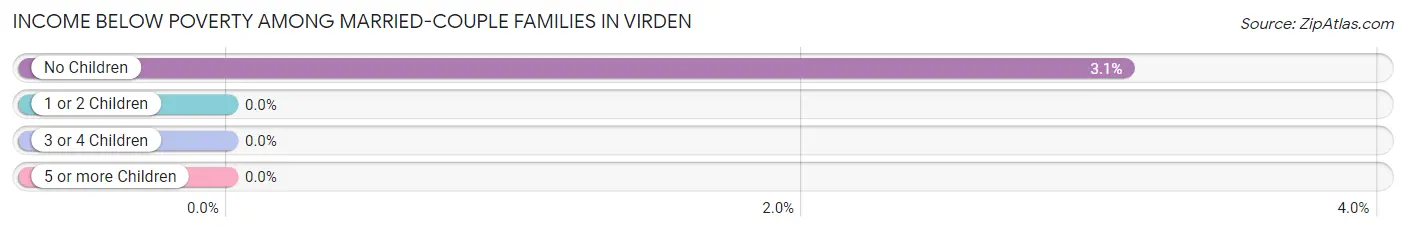
| Children | Above Poverty | Below Poverty |
| No Children | 62 (96.9%) | 2 (3.1%) |
| 1 or 2 Children | 1 (100.0%) | 0 (0.0%) |
| 3 or 4 Children | 10 (100.0%) | 0 (0.0%) |
| 5 or more Children | 0 (0.0%) | 0 (0.0%) |
| Total | 73 (97.3%) | 2 (2.7%) |
Income Below Poverty Among Single-Parent Households in Virden
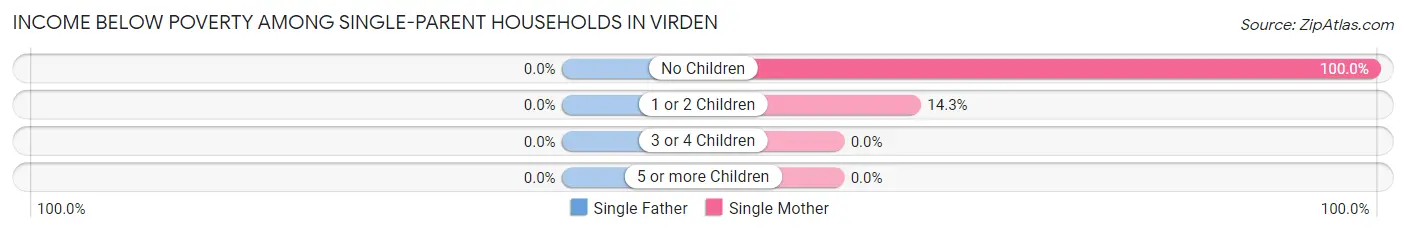
| Children | Single Father | Single Mother |
| No Children | 0 (0.0%) | 1 (100.0%) |
| 1 or 2 Children | 0 (0.0%) | 2 (14.3%) |
| 3 or 4 Children | 0 (0.0%) | 0 (0.0%) |
| 5 or more Children | 0 (0.0%) | 0 (0.0%) |
| Total | 0 (0.0%) | 3 (20.0%) |
Income Below Poverty Among Married-Couple vs Single-Parent Households in Virden
The poverty data for Virden shows that 2 of the married-couple family households (2.7%) and 3 of the single-parent households (20.0%) are living below the poverty level. Within the married-couple family households, those with no children have the highest poverty rate, with 2 households (3.1%) falling below the poverty line. Among the single-parent households, those with no children have the highest poverty rate, with 1 household (100.0%) living below poverty.
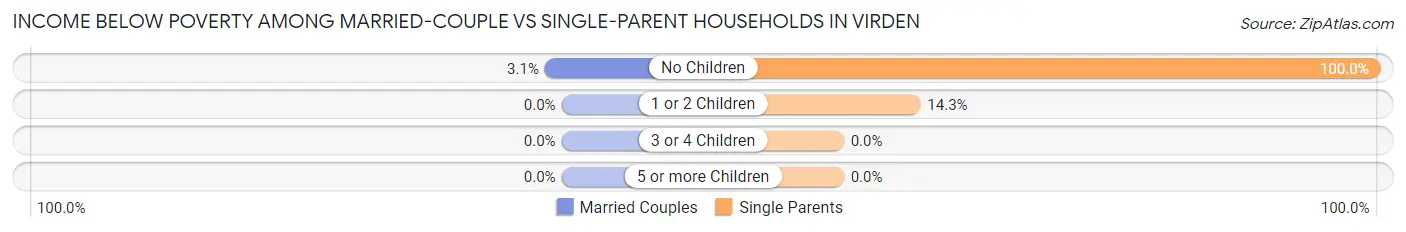
| Children | Married-Couple Families | Single-Parent Households |
| No Children | 2 (3.1%) | 1 (100.0%) |
| 1 or 2 Children | 0 (0.0%) | 2 (14.3%) |
| 3 or 4 Children | 0 (0.0%) | 0 (0.0%) |
| 5 or more Children | 0 (0.0%) | 0 (0.0%) |
| Total | 2 (2.7%) | 3 (20.0%) |
Race in Virden
The most populous races in Virden are White / Caucasian (182 | 94.8%), Black / African American (7 | 3.6%), and Hispanic or Latino (3 | 1.6%).
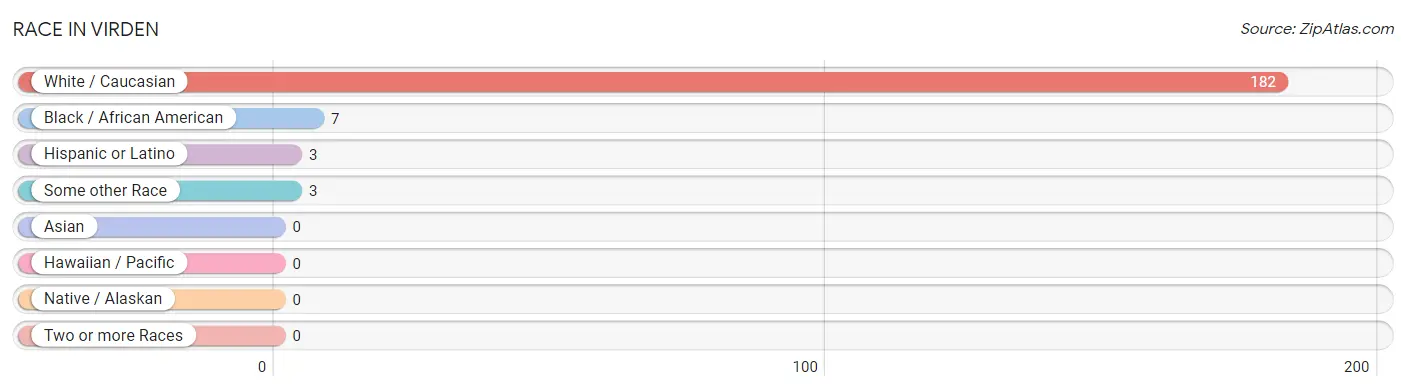
| Race | # Population | % Population |
| Asian | 0 | 0.0% |
| Black / African American | 7 | 3.6% |
| Hawaiian / Pacific | 0 | 0.0% |
| Hispanic or Latino | 3 | 1.6% |
| Native / Alaskan | 0 | 0.0% |
| White / Caucasian | 182 | 94.8% |
| Two or more Races | 0 | 0.0% |
| Some other Race | 3 | 1.6% |
| Total | 192 | 100.0% |
Ancestry in Virden
The most populous ancestries reported in Virden are Scottish (50 | 26.0%), English (37 | 19.3%), Danish (30 | 15.6%), German (19 | 9.9%), and European (18 | 9.4%), together accounting for 80.2% of all Virden residents.
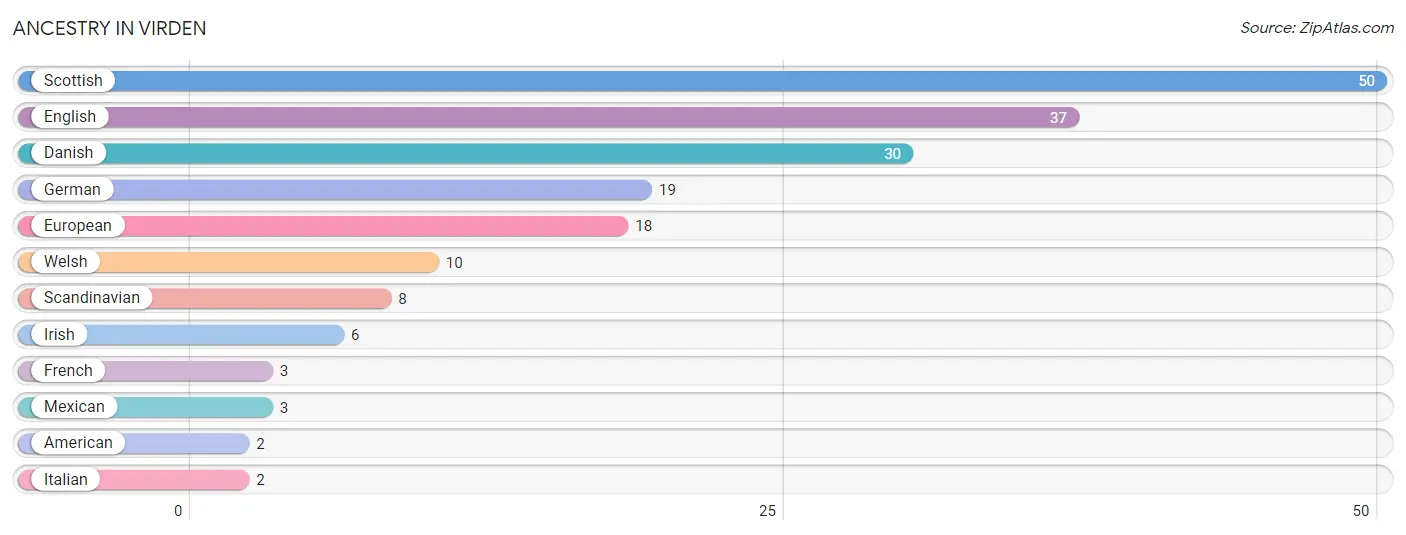
| Ancestry | # Population | % Population |
| American | 2 | 1.0% |
| Danish | 30 | 15.6% |
| English | 37 | 19.3% |
| European | 18 | 9.4% |
| French | 3 | 1.6% |
| German | 19 | 9.9% |
| Irish | 6 | 3.1% |
| Italian | 2 | 1.0% |
| Mexican | 3 | 1.6% |
| Scandinavian | 8 | 4.2% |
| Scottish | 50 | 26.0% |
| Welsh | 10 | 5.2% | View All 12 Rows |
Immigrants in Virden

| Immigration Origin | # Population | % Population | View All 0 Rows |
Sex and Age in Virden
Sex and Age in Virden
The most populous age groups in Virden are 15 to 19 Years (13 | 21.3%) for men and 50 to 54 Years (42 | 32.1%) for women.
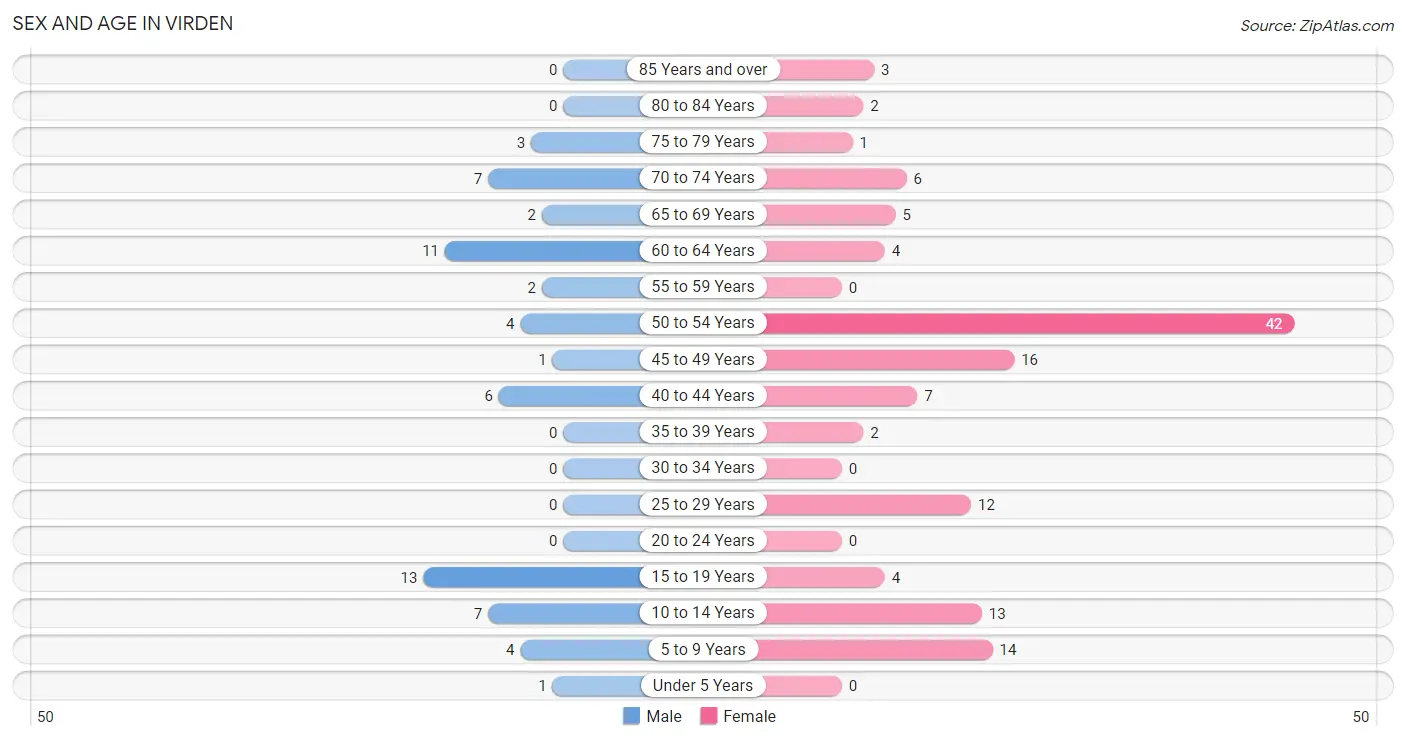
| Age Bracket | Male | Female |
| Under 5 Years | 1 (1.6%) | 0 (0.0%) |
| 5 to 9 Years | 4 (6.6%) | 14 (10.7%) |
| 10 to 14 Years | 7 (11.5%) | 13 (9.9%) |
| 15 to 19 Years | 13 (21.3%) | 4 (3.0%) |
| 20 to 24 Years | 0 (0.0%) | 0 (0.0%) |
| 25 to 29 Years | 0 (0.0%) | 12 (9.2%) |
| 30 to 34 Years | 0 (0.0%) | 0 (0.0%) |
| 35 to 39 Years | 0 (0.0%) | 2 (1.5%) |
| 40 to 44 Years | 6 (9.8%) | 7 (5.3%) |
| 45 to 49 Years | 1 (1.6%) | 16 (12.2%) |
| 50 to 54 Years | 4 (6.6%) | 42 (32.1%) |
| 55 to 59 Years | 2 (3.3%) | 0 (0.0%) |
| 60 to 64 Years | 11 (18.0%) | 4 (3.0%) |
| 65 to 69 Years | 2 (3.3%) | 5 (3.8%) |
| 70 to 74 Years | 7 (11.5%) | 6 (4.6%) |
| 75 to 79 Years | 3 (4.9%) | 1 (0.8%) |
| 80 to 84 Years | 0 (0.0%) | 2 (1.5%) |
| 85 Years and over | 0 (0.0%) | 3 (2.3%) |
| Total | 61 (100.0%) | 131 (100.0%) |
Families and Households in Virden
Median Family Size in Virden
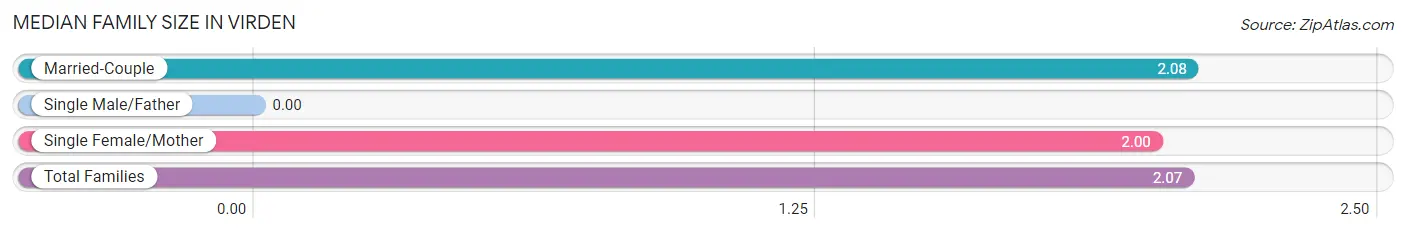
| Family Type | # Families | Family Size |
| Married-Couple | 75 (83.3%) | 2.08 |
| Single Male/Father | 0 (0.0%) | - |
| Single Female/Mother | 15 (16.7%) | 2.00 |
| Total Families | 90 (100.0%) | 2.07 |
Median Household Size in Virden
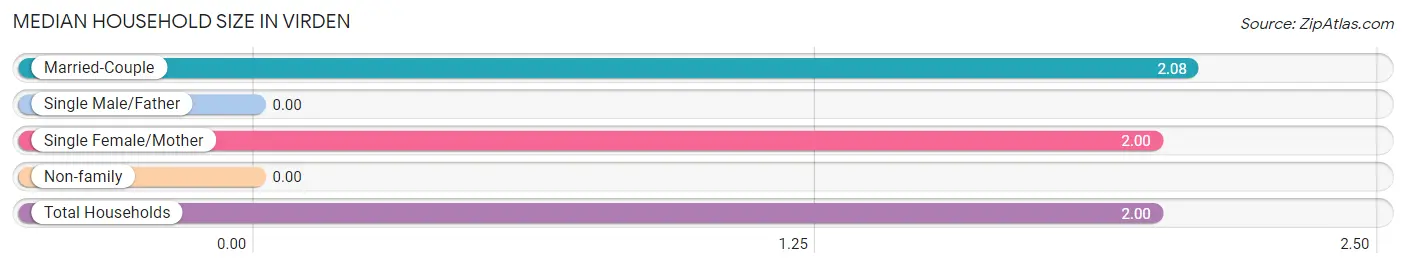
| Household Type | # Households | Household Size |
| Married-Couple | 75 (78.1%) | 2.08 |
| Single Male/Father | 0 (0.0%) | - |
| Single Female/Mother | 15 (15.6%) | 2.00 |
| Non-family | 6 (6.2%) | - |
| Total Households | 96 (100.0%) | 2.00 |
Household Size by Marriage Status in Virden
Out of a total of 96 households in Virden, 90 (93.8%) are family households, while 6 (6.2%) are nonfamily households. The most numerous type of family households are 2-person households, comprising 62, and the most common type of nonfamily households are 1-person households, comprising 6.
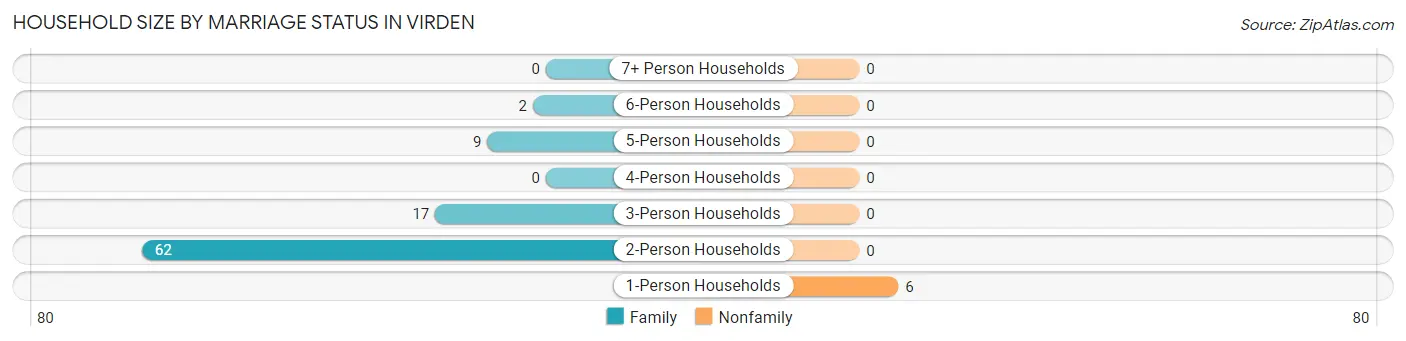
| Household Size | Family Households | Nonfamily Households |
| 1-Person Households | - | 6 (6.2%) |
| 2-Person Households | 62 (64.6%) | 0 (0.0%) |
| 3-Person Households | 17 (17.7%) | 0 (0.0%) |
| 4-Person Households | 0 (0.0%) | 0 (0.0%) |
| 5-Person Households | 9 (9.4%) | 0 (0.0%) |
| 6-Person Households | 2 (2.1%) | 0 (0.0%) |
| 7+ Person Households | 0 (0.0%) | 0 (0.0%) |
| Total | 90 (93.8%) | 6 (6.2%) |
Female Fertility in Virden
Fertility by Age in Virden
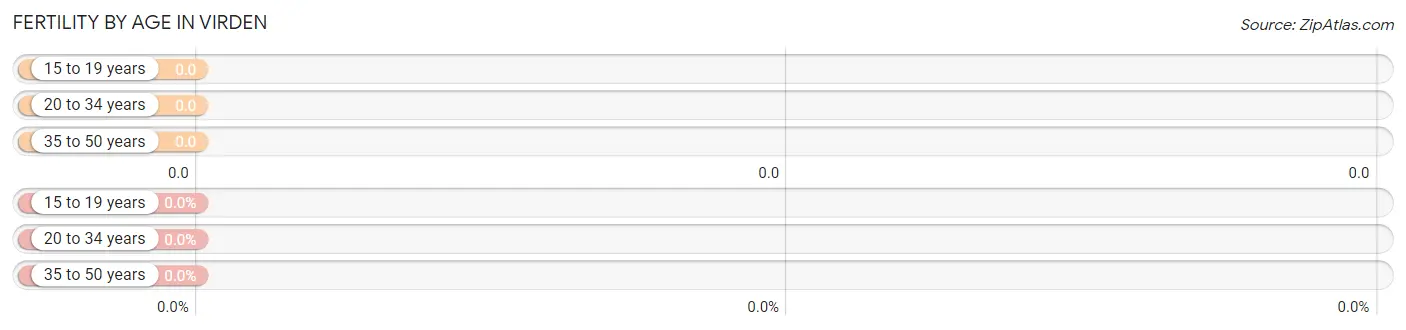
| Age Bracket | Women with Births | Births / 1,000 Women |
| 15 to 19 years | 0 (0.0%) | 0.0 |
| 20 to 34 years | 0 (0.0%) | 0.0 |
| 35 to 50 years | 0 (0.0%) | 0.0 |
| Total | 0 (0.0%) | 0.0 |
Fertility by Age by Marriage Status in Virden
| Age Bracket | Married | Unmarried |
| 15 to 19 years | 0 (0.0%) | 0 (0.0%) |
| 20 to 34 years | 0 (0.0%) | 0 (0.0%) |
| 35 to 50 years | 0 (0.0%) | 0 (0.0%) |
| Total | 0 (0.0%) | 0 (0.0%) |
Fertility by Education in Virden
| Educational Attainment | Women with Births | Births / 1,000 Women |
| Less than High School | 0 (0.0%) | 0.0 |
| High School Diploma | 0 (0.0%) | 0.0 |
| College or Associate's Degree | 0 (0.0%) | 0.0 |
| Bachelor's Degree | 0 (0.0%) | 0.0 |
| Graduate Degree | 0 (0.0%) | 0.0 |
| Total | 0 (0.0%) | 0.0 |
Fertility by Education by Marriage Status in Virden
| Educational Attainment | Married | Unmarried |
| Less than High School | 0 (0.0%) | 0 (0.0%) |
| High School Diploma | 0 (0.0%) | 0 (0.0%) |
| College or Associate's Degree | 0 (0.0%) | 0 (0.0%) |
| Bachelor's Degree | 0 (0.0%) | 0 (0.0%) |
| Graduate Degree | 0 (0.0%) | 0 (0.0%) |
| Total | 0 (0.0%) | 0 (0.0%) |
Employment Characteristics in Virden
Employment by Class of Employer in Virden
Among the 81 employed individuals in Virden, state government employees (48 | 59.3%), private company employees (24 | 29.6%), and local government employees (9 | 11.1%) make up the most common classes of employment.
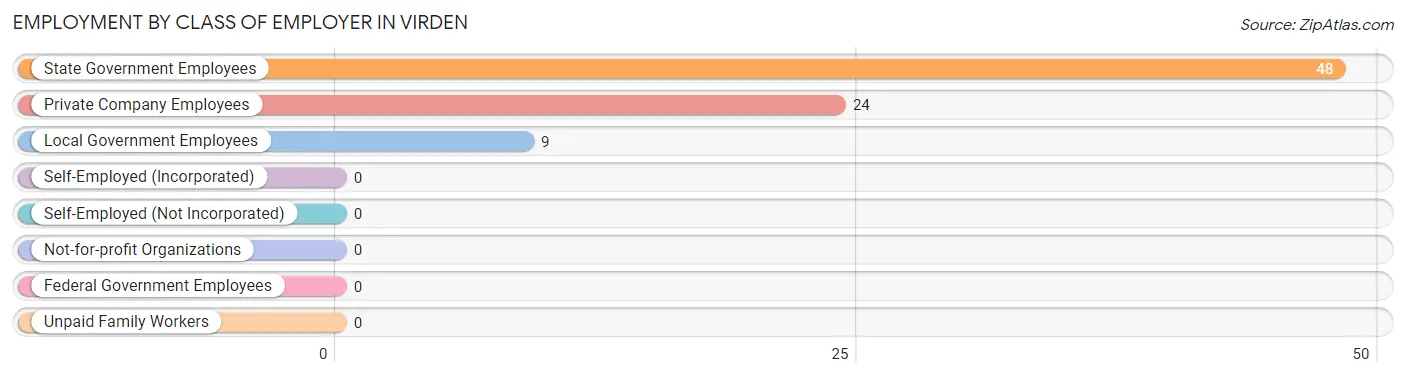
| Employer Class | # Employees | % Employees |
| Private Company Employees | 24 | 29.6% |
| Self-Employed (Incorporated) | 0 | 0.0% |
| Self-Employed (Not Incorporated) | 0 | 0.0% |
| Not-for-profit Organizations | 0 | 0.0% |
| Local Government Employees | 9 | 11.1% |
| State Government Employees | 48 | 59.3% |
| Federal Government Employees | 0 | 0.0% |
| Unpaid Family Workers | 0 | 0.0% |
| Total | 81 | 100.0% |
Employment Status by Age in Virden
According to the labor force statistics for Virden, out of the total population over 16 years of age (153), 60.8% or 93 individuals are in the labor force, with 12.9% or 12 of them unemployed. The age group with the highest labor force participation rate is 25 to 29 years, with 100.0% or 12 individuals in the labor force. Within the labor force, the 25 to 29 years age range has the highest percentage of unemployed individuals, with 100.0% or 12 of them being unemployed.
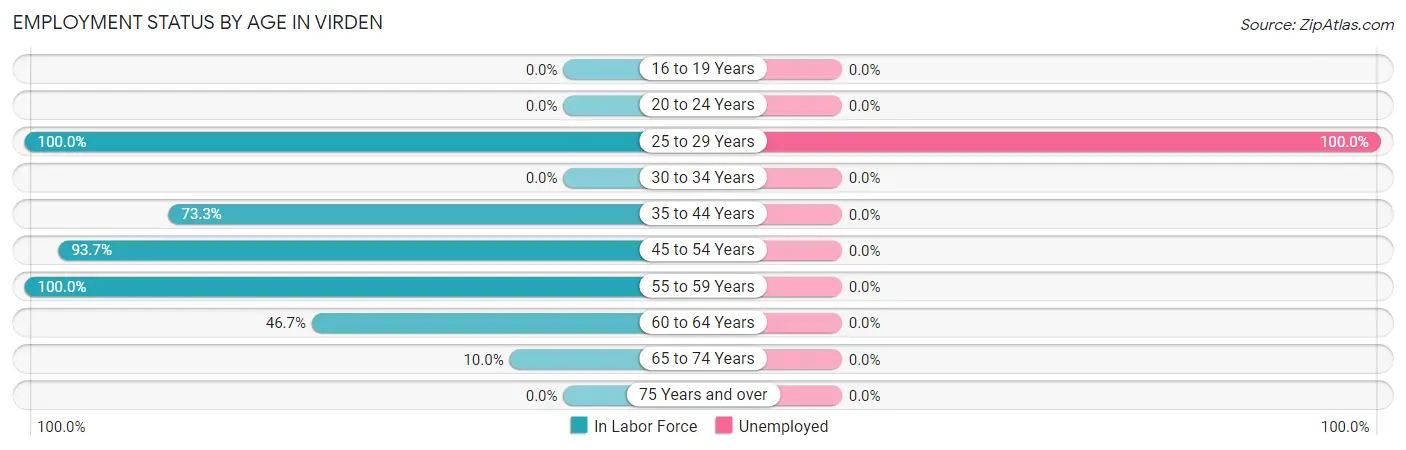
| Age Bracket | In Labor Force | Unemployed |
| 16 to 19 Years | 0 (0.0%) | 0 (0.0%) |
| 20 to 24 Years | 0 (0.0%) | 0 (0.0%) |
| 25 to 29 Years | 12 (100.0%) | 12 (100.0%) |
| 30 to 34 Years | 0 (0.0%) | 0 (0.0%) |
| 35 to 44 Years | 11 (73.3%) | 0 (0.0%) |
| 45 to 54 Years | 59 (93.7%) | 0 (0.0%) |
| 55 to 59 Years | 2 (100.0%) | 0 (0.0%) |
| 60 to 64 Years | 7 (46.7%) | 0 (0.0%) |
| 65 to 74 Years | 2 (10.0%) | 0 (0.0%) |
| 75 Years and over | 0 (0.0%) | 0 (0.0%) |
| Total | 93 (60.8%) | 12 (12.9%) |
Employment Status by Educational Attainment in Virden
According to labor force statistics for Virden, 85.0% of individuals (91) out of the total population between 25 and 64 years of age (107) are in the labor force, with 13.2% or 12 of them being unemployed. The group with the highest labor force participation rate are those with the educational attainment of bachelor's degree or higher, with 95.7% or 45 individuals in the labor force. Within the labor force, individuals with high school diploma education have the highest percentage of unemployment, with 63.2% or 12 of them being unemployed.
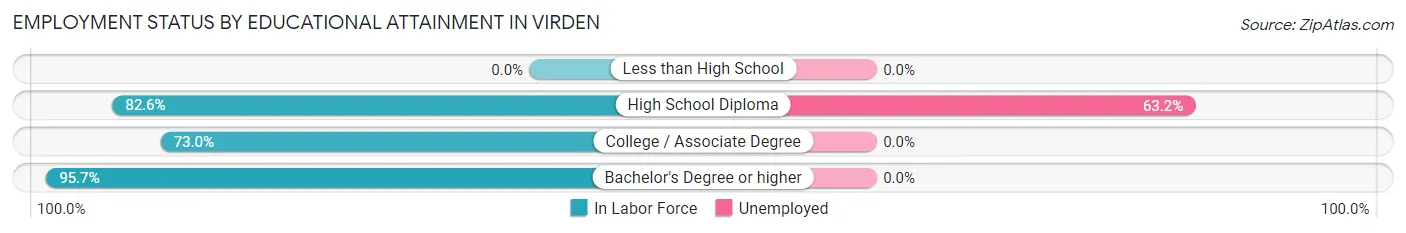
| Educational Attainment | In Labor Force | Unemployed |
| Less than High School | 0 (0.0%) | 0 (0.0%) |
| High School Diploma | 19 (82.6%) | 15 (63.2%) |
| College / Associate Degree | 27 (73.0%) | 0 (0.0%) |
| Bachelor's Degree or higher | 45 (95.7%) | 0 (0.0%) |
| Total | 91 (85.0%) | 14 (13.2%) |
Employment Occupations by Sex in Virden
Management, Business, Science and Arts Occupations
The most common Management, Business, Science and Arts occupations in Virden are Community & Social Service (50 | 61.7%), Education Instruction & Library (50 | 61.7%), Management (6 | 7.4%), and Business & Financial (2 | 2.5%).
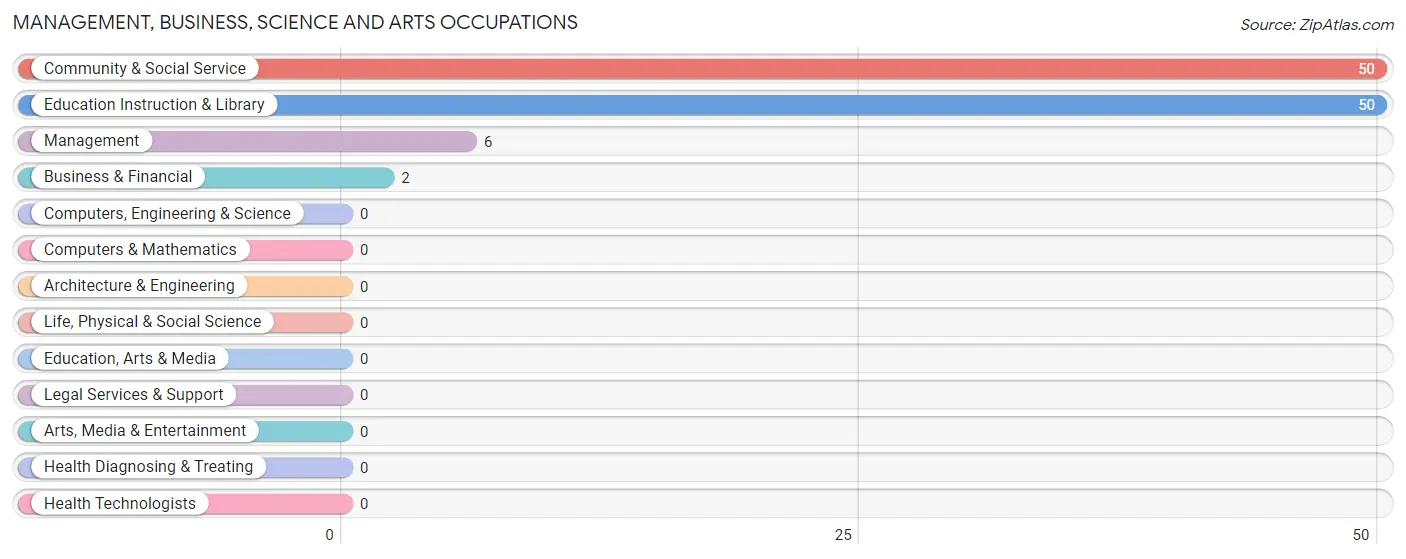
Management, Business, Science and Arts Occupations by Sex
Within the Management, Business, Science and Arts occupations in Virden, the most male-oriented occupations are Management (100.0%), and Business & Financial (100.0%), while the most female-oriented occupations are Community & Social Service (100.0%), and Education Instruction & Library (100.0%).
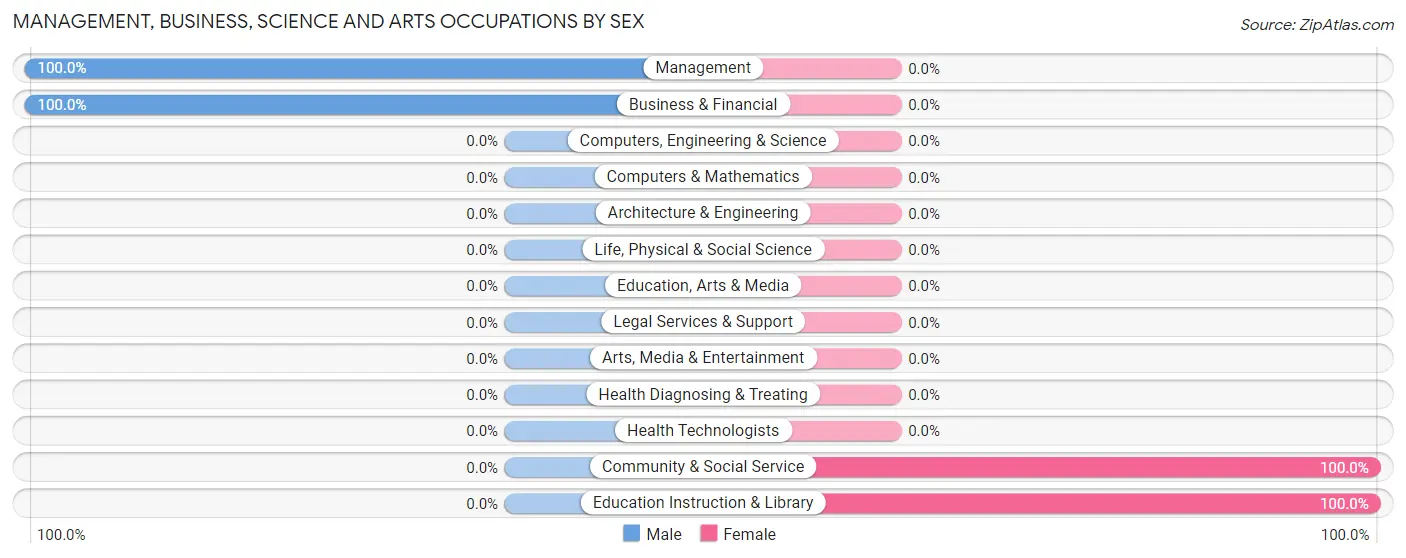
| Occupation | Male | Female |
| Management | 6 (100.0%) | 0 (0.0%) |
| Business & Financial | 2 (100.0%) | 0 (0.0%) |
| Computers, Engineering & Science | 0 (0.0%) | 0 (0.0%) |
| Computers & Mathematics | 0 (0.0%) | 0 (0.0%) |
| Architecture & Engineering | 0 (0.0%) | 0 (0.0%) |
| Life, Physical & Social Science | 0 (0.0%) | 0 (0.0%) |
| Community & Social Service | 0 (0.0%) | 50 (100.0%) |
| Education, Arts & Media | 0 (0.0%) | 0 (0.0%) |
| Legal Services & Support | 0 (0.0%) | 0 (0.0%) |
| Education Instruction & Library | 0 (0.0%) | 50 (100.0%) |
| Arts, Media & Entertainment | 0 (0.0%) | 0 (0.0%) |
| Health Diagnosing & Treating | 0 (0.0%) | 0 (0.0%) |
| Health Technologists | 0 (0.0%) | 0 (0.0%) |
| Total (Category) | 8 (13.8%) | 50 (86.2%) |
| Total (Overall) | 16 (19.8%) | 65 (80.2%) |
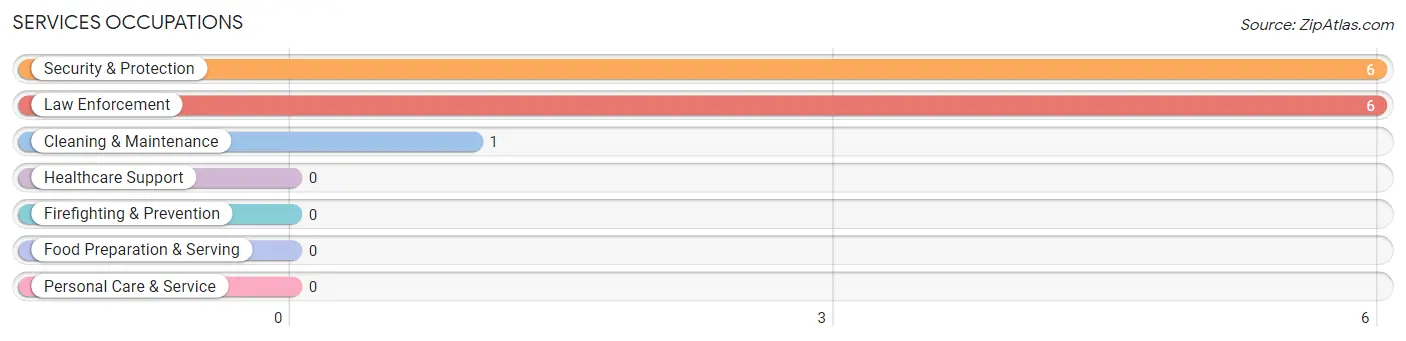
Services Occupations
The most common Services occupations in Virden are Security & Protection (6 | 7.4%), Law Enforcement (6 | 7.4%), and Cleaning & Maintenance (1 | 1.2%).
Services Occupations by Sex
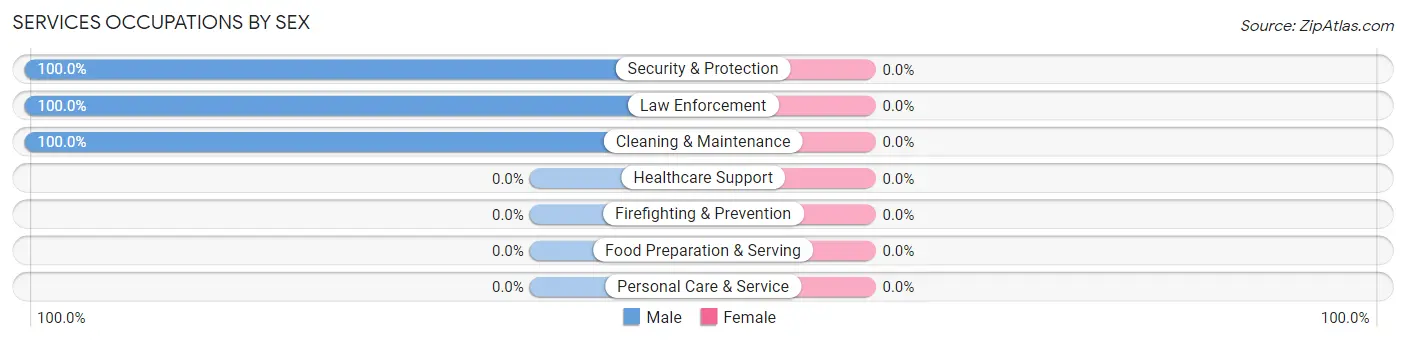
| Occupation | Male | Female |
| Healthcare Support | 0 (0.0%) | 0 (0.0%) |
| Security & Protection | 6 (100.0%) | 0 (0.0%) |
| Firefighting & Prevention | 0 (0.0%) | 0 (0.0%) |
| Law Enforcement | 6 (100.0%) | 0 (0.0%) |
| Food Preparation & Serving | 0 (0.0%) | 0 (0.0%) |
| Cleaning & Maintenance | 1 (100.0%) | 0 (0.0%) |
| Personal Care & Service | 0 (0.0%) | 0 (0.0%) |
| Total (Category) | 7 (100.0%) | 0 (0.0%) |
| Total (Overall) | 16 (19.8%) | 65 (80.2%) |
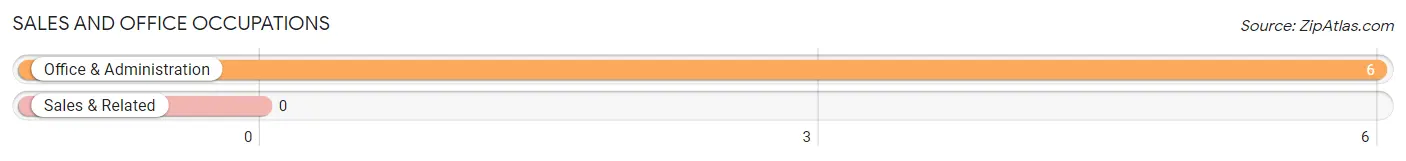
Sales and Office Occupations
The most common Sales and Office occupations in Virden are , and Office & Administration (6 | 7.4%).
Sales and Office Occupations by Sex
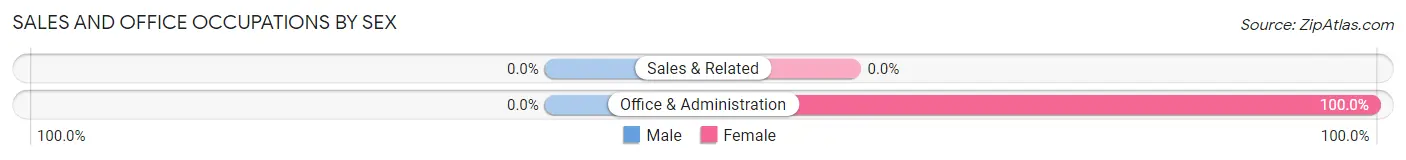
| Occupation | Male | Female |
| Sales & Related | 0 (0.0%) | 0 (0.0%) |
| Office & Administration | 0 (0.0%) | 6 (100.0%) |
| Total (Category) | 0 (0.0%) | 6 (100.0%) |
| Total (Overall) | 16 (19.8%) | 65 (80.2%) |
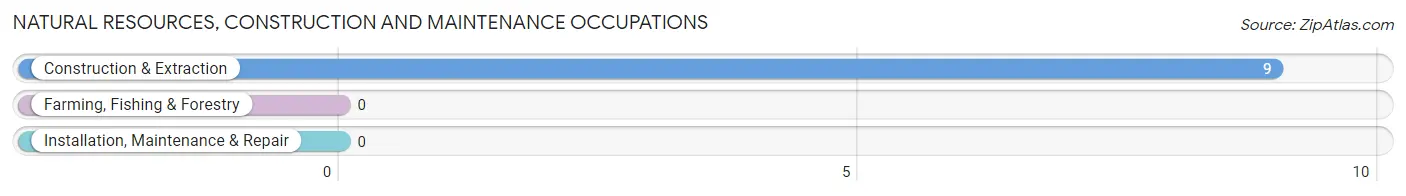
Natural Resources, Construction and Maintenance Occupations
The most common Natural Resources, Construction and Maintenance occupations in Virden are , and Construction & Extraction (9 | 11.1%).
Natural Resources, Construction and Maintenance Occupations by Sex
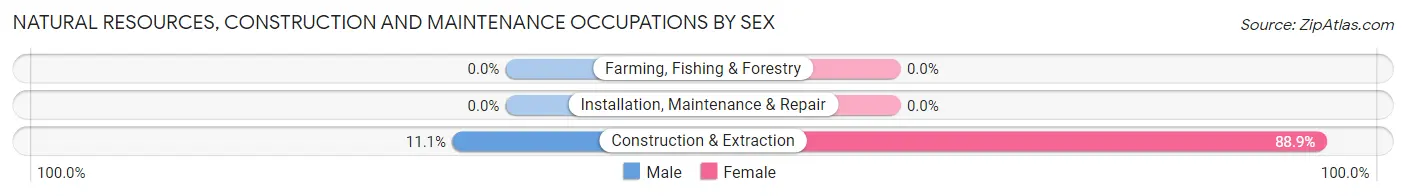
| Occupation | Male | Female |
| Farming, Fishing & Forestry | 0 (0.0%) | 0 (0.0%) |
| Construction & Extraction | 1 (11.1%) | 8 (88.9%) |
| Installation, Maintenance & Repair | 0 (0.0%) | 0 (0.0%) |
| Total (Category) | 1 (11.1%) | 8 (88.9%) |
| Total (Overall) | 16 (19.8%) | 65 (80.2%) |
Production, Transportation and Moving Occupations
The most common Production, Transportation and Moving occupations in Virden are , and Material Moving (1 | 1.2%).
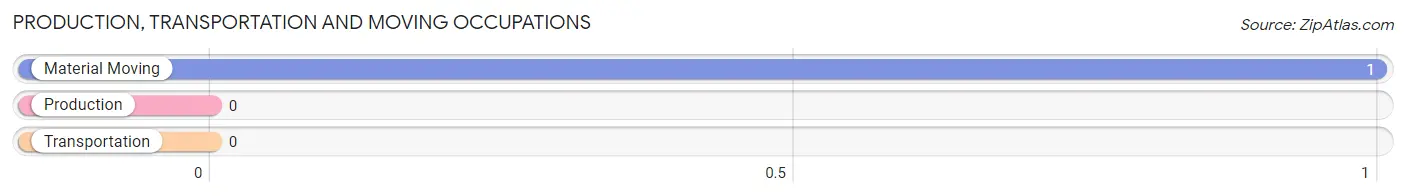
Production, Transportation and Moving Occupations by Sex
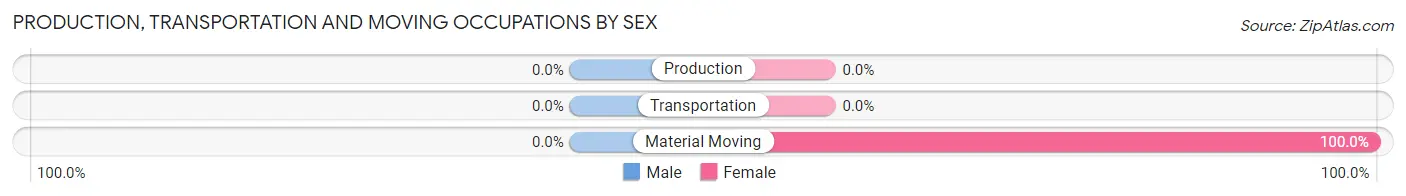
| Occupation | Male | Female |
| Production | 0 (0.0%) | 0 (0.0%) |
| Transportation | 0 (0.0%) | 0 (0.0%) |
| Material Moving | 0 (0.0%) | 1 (100.0%) |
| Total (Category) | 0 (0.0%) | 1 (100.0%) |
| Total (Overall) | 16 (19.8%) | 65 (80.2%) |
Employment Industries by Sex in Virden
Employment Industries in Virden
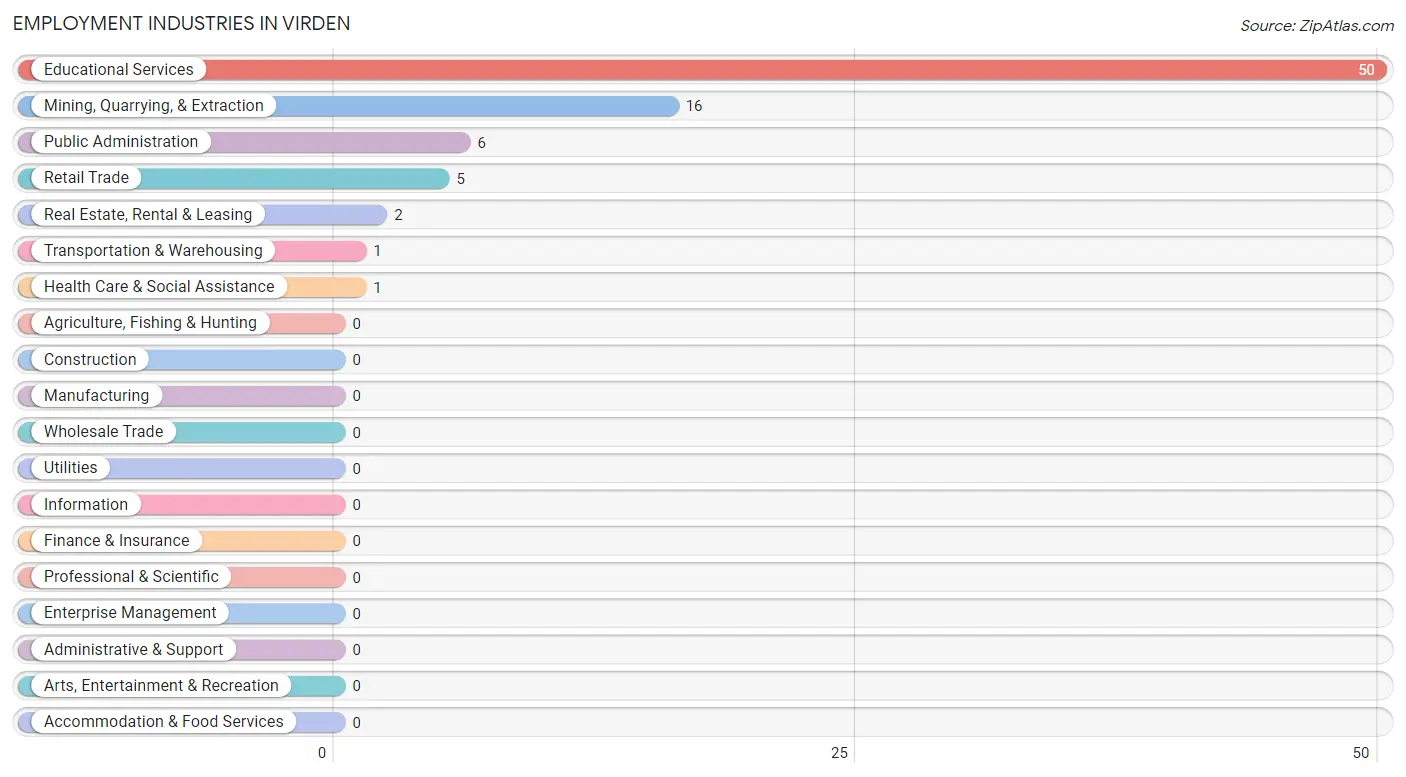
The major employment industries in Virden include Educational Services (50 | 61.7%), Mining, Quarrying, & Extraction (16 | 19.8%), Public Administration (6 | 7.4%), Retail Trade (5 | 6.2%), and Real Estate, Rental & Leasing (2 | 2.5%).
Employment Industries by Sex in Virden
The Virden industries that see more men than women are Real Estate, Rental & Leasing (100.0%), Health Care & Social Assistance (100.0%), and Public Administration (100.0%), whereas the industries that tend to have a higher number of women are Retail Trade (100.0%), Transportation & Warehousing (100.0%), and Educational Services (100.0%).
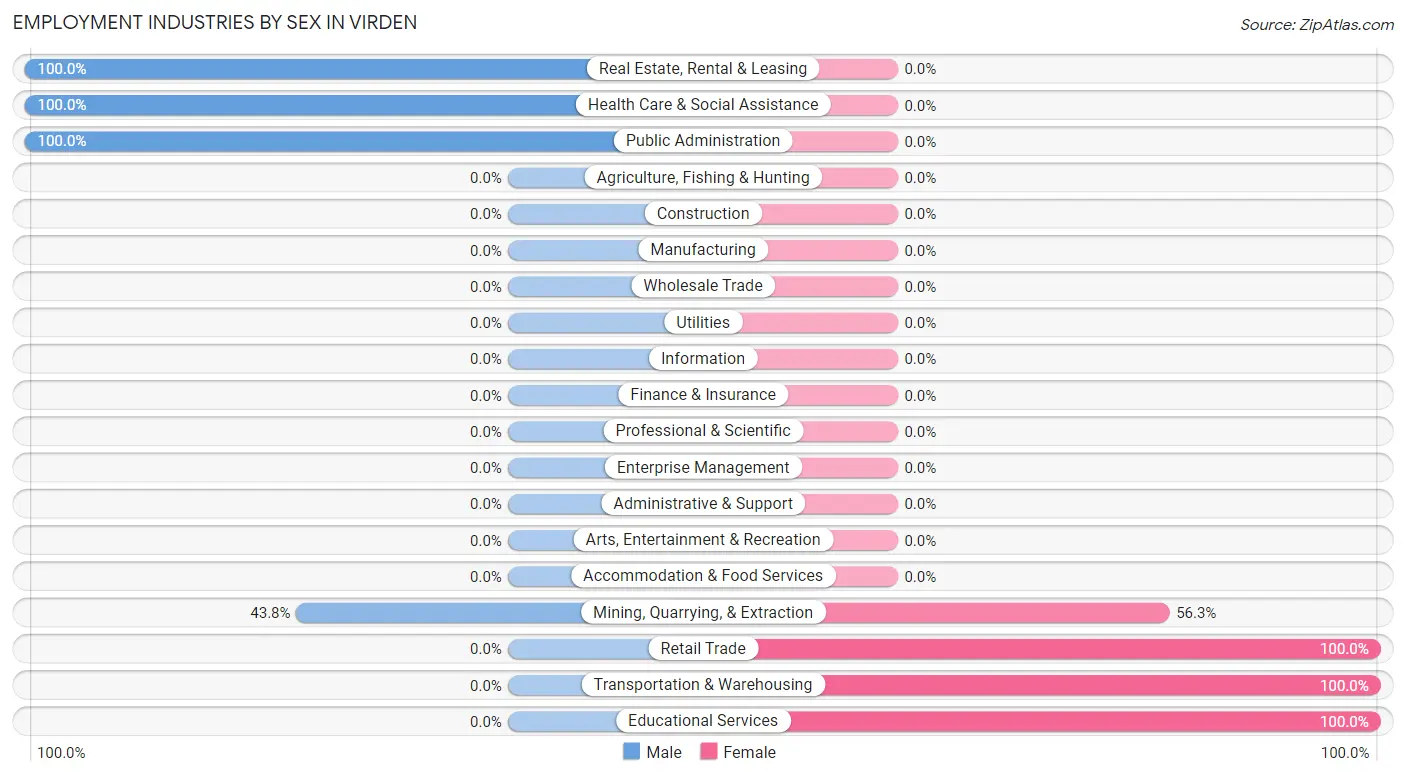
| Industry | Male | Female |
| Agriculture, Fishing & Hunting | 0 (0.0%) | 0 (0.0%) |
| Mining, Quarrying, & Extraction | 7 (43.8%) | 9 (56.2%) |
| Construction | 0 (0.0%) | 0 (0.0%) |
| Manufacturing | 0 (0.0%) | 0 (0.0%) |
| Wholesale Trade | 0 (0.0%) | 0 (0.0%) |
| Retail Trade | 0 (0.0%) | 5 (100.0%) |
| Transportation & Warehousing | 0 (0.0%) | 1 (100.0%) |
| Utilities | 0 (0.0%) | 0 (0.0%) |
| Information | 0 (0.0%) | 0 (0.0%) |
| Finance & Insurance | 0 (0.0%) | 0 (0.0%) |
| Real Estate, Rental & Leasing | 2 (100.0%) | 0 (0.0%) |
| Professional & Scientific | 0 (0.0%) | 0 (0.0%) |
| Enterprise Management | 0 (0.0%) | 0 (0.0%) |
| Administrative & Support | 0 (0.0%) | 0 (0.0%) |
| Educational Services | 0 (0.0%) | 50 (100.0%) |
| Health Care & Social Assistance | 1 (100.0%) | 0 (0.0%) |
| Arts, Entertainment & Recreation | 0 (0.0%) | 0 (0.0%) |
| Accommodation & Food Services | 0 (0.0%) | 0 (0.0%) |
| Public Administration | 6 (100.0%) | 0 (0.0%) |
| Total | 16 (19.8%) | 65 (80.2%) |
Education in Virden
School Enrollment in Virden
The most common levels of schooling among the 56 students in Virden are elementary school (20 | 35.7%), high school (16 | 28.6%), and middle school (14 | 25.0%).
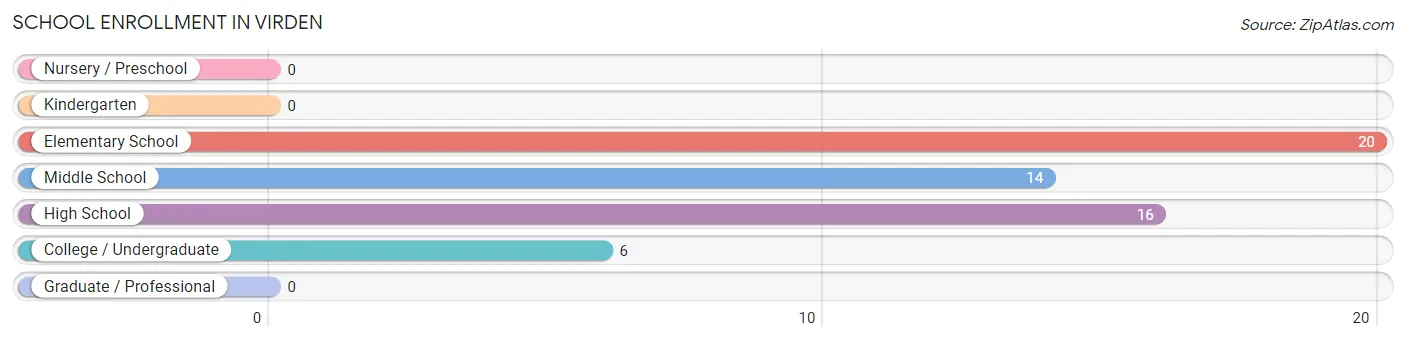
| School Level | # Students | % Students |
| Nursery / Preschool | 0 | 0.0% |
| Kindergarten | 0 | 0.0% |
| Elementary School | 20 | 35.7% |
| Middle School | 14 | 25.0% |
| High School | 16 | 28.6% |
| College / Undergraduate | 6 | 10.7% |
| Graduate / Professional | 0 | 0.0% |
| Total | 56 | 100.0% |
School Enrollment by Age by Funding Source in Virden
Out of a total of 56 students who are enrolled in schools in Virden, 8 (14.3%) attend a private institution, while the remaining 48 (85.7%) are enrolled in public schools. The age group of 18 to 19 year olds has the highest likelihood of being enrolled in private schools, with 4 (50.0% in the age bracket) enrolled. Conversely, the age group of 5 to 9 year old has the lowest likelihood of being enrolled in a private school, with 17 (100.0% in the age bracket) attending a public institution.
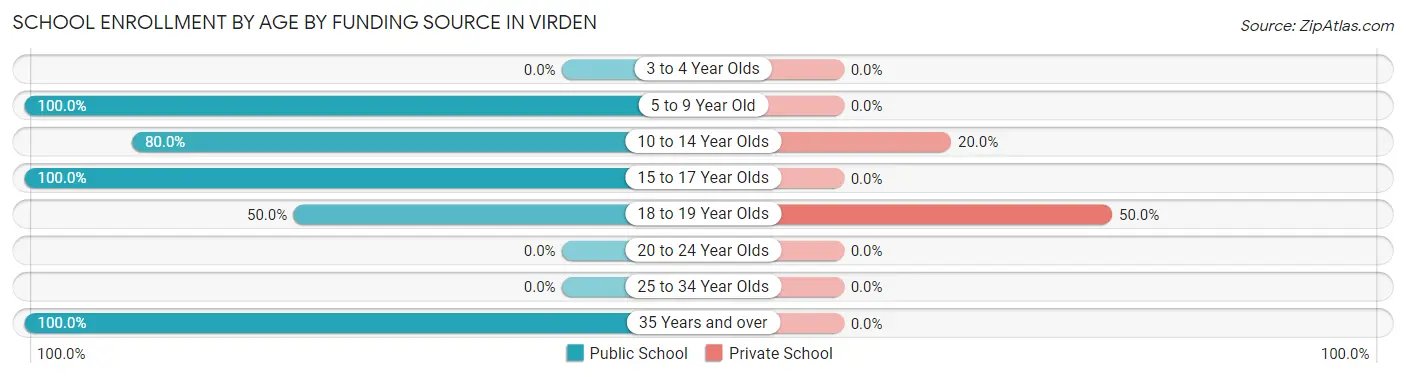
| Age Bracket | Public School | Private School |
| 3 to 4 Year Olds | 0 (0.0%) | 0 (0.0%) |
| 5 to 9 Year Old | 17 (100.0%) | 0 (0.0%) |
| 10 to 14 Year Olds | 16 (80.0%) | 4 (20.0%) |
| 15 to 17 Year Olds | 9 (100.0%) | 0 (0.0%) |
| 18 to 19 Year Olds | 4 (50.0%) | 4 (50.0%) |
| 20 to 24 Year Olds | 0 (0.0%) | 0 (0.0%) |
| 25 to 34 Year Olds | 0 (0.0%) | 0 (0.0%) |
| 35 Years and over | 2 (100.0%) | 0 (0.0%) |
| Total | 48 (85.7%) | 8 (14.3%) |
Educational Attainment by Field of Study in Virden
Liberal arts & history (42 | 70.0%), physical & health sciences (8 | 13.3%), bio, nature & agricultural (5 | 8.3%), business (2 | 3.3%), and arts & humanities (2 | 3.3%) are the most common fields of study among 60 individuals in Virden who have obtained a bachelor's degree or higher.
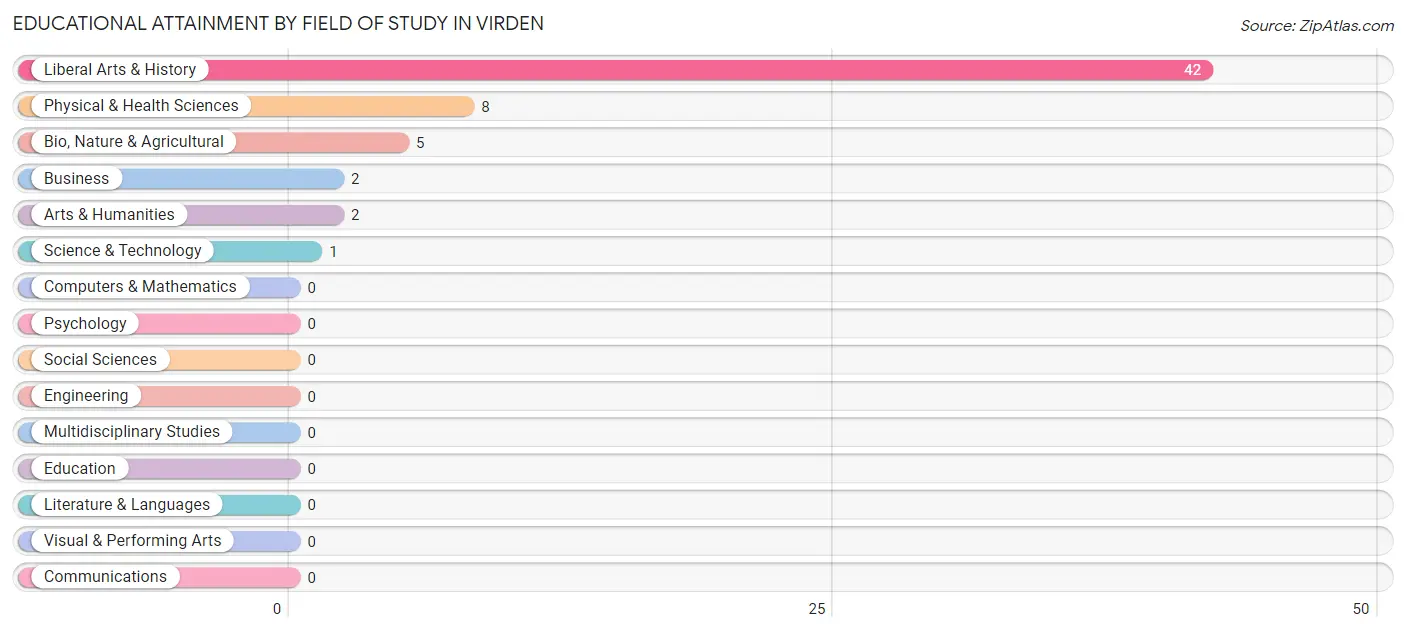
| Field of Study | # Graduates | % Graduates |
| Computers & Mathematics | 0 | 0.0% |
| Bio, Nature & Agricultural | 5 | 8.3% |
| Physical & Health Sciences | 8 | 13.3% |
| Psychology | 0 | 0.0% |
| Social Sciences | 0 | 0.0% |
| Engineering | 0 | 0.0% |
| Multidisciplinary Studies | 0 | 0.0% |
| Science & Technology | 1 | 1.7% |
| Business | 2 | 3.3% |
| Education | 0 | 0.0% |
| Literature & Languages | 0 | 0.0% |
| Liberal Arts & History | 42 | 70.0% |
| Visual & Performing Arts | 0 | 0.0% |
| Communications | 0 | 0.0% |
| Arts & Humanities | 2 | 3.3% |
| Total | 60 | 100.0% |
Transportation & Commute in Virden
Vehicle Availability by Sex in Virden
The most prevalent vehicle ownership categories in Virden are males with 2 vehicles (8, accounting for 50.0%) and females with 2 vehicles (51, making up 12.3%).
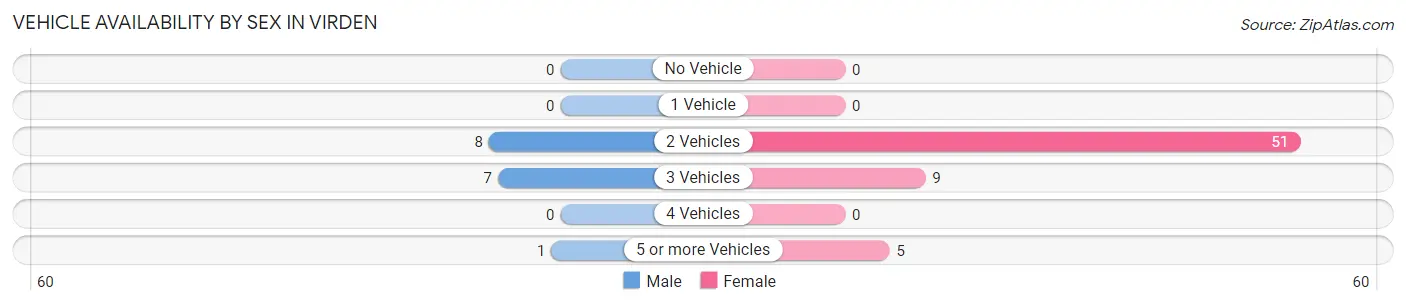
| Vehicles Available | Male | Female |
| No Vehicle | 0 (0.0%) | 0 (0.0%) |
| 1 Vehicle | 0 (0.0%) | 0 (0.0%) |
| 2 Vehicles | 8 (50.0%) | 51 (78.5%) |
| 3 Vehicles | 7 (43.8%) | 9 (13.9%) |
| 4 Vehicles | 0 (0.0%) | 0 (0.0%) |
| 5 or more Vehicles | 1 (6.2%) | 5 (7.7%) |
| Total | 16 (100.0%) | 65 (100.0%) |
Commute Time in Virden
The most frequently occuring commute durations in Virden are 15 to 19 minutes (44 commuters, 54.3%), 30 to 34 minutes (10 commuters, 12.3%), and 40 to 44 minutes (8 commuters, 9.9%).
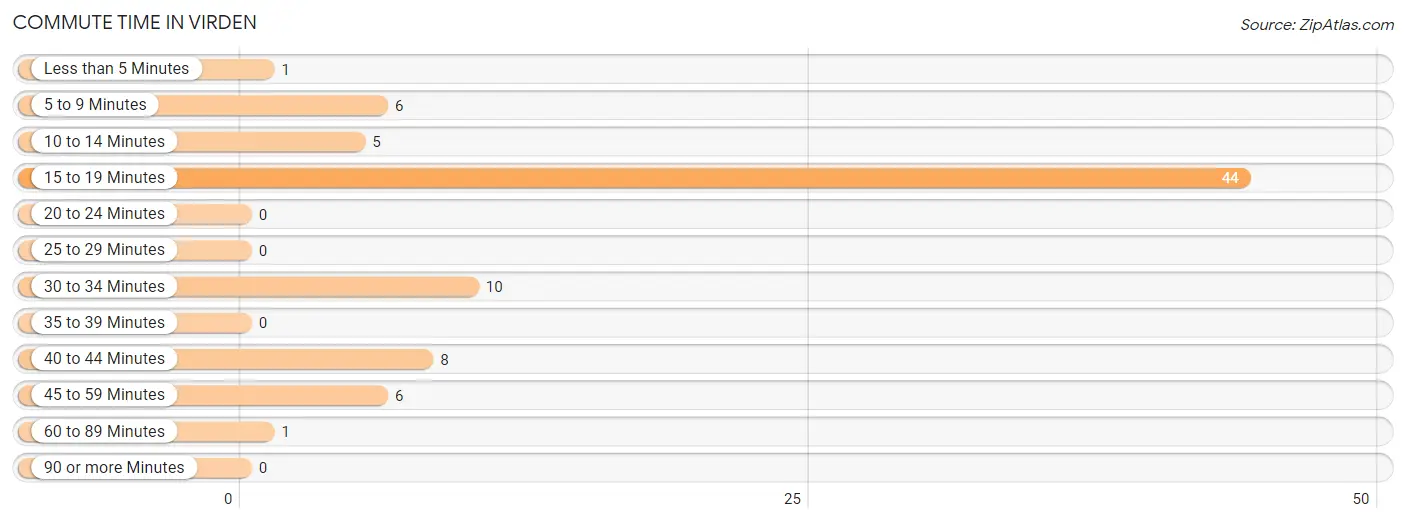
| Commute Time | # Commuters | % Commuters |
| Less than 5 Minutes | 1 | 1.2% |
| 5 to 9 Minutes | 6 | 7.4% |
| 10 to 14 Minutes | 5 | 6.2% |
| 15 to 19 Minutes | 44 | 54.3% |
| 20 to 24 Minutes | 0 | 0.0% |
| 25 to 29 Minutes | 0 | 0.0% |
| 30 to 34 Minutes | 10 | 12.3% |
| 35 to 39 Minutes | 0 | 0.0% |
| 40 to 44 Minutes | 8 | 9.9% |
| 45 to 59 Minutes | 6 | 7.4% |
| 60 to 89 Minutes | 1 | 1.2% |
| 90 or more Minutes | 0 | 0.0% |
Commute Time by Sex in Virden
The most common commute times in Virden are 5 to 9 minutes (6 commuters, 37.5%) for males and 15 to 19 minutes (44 commuters, 67.7%) for females.
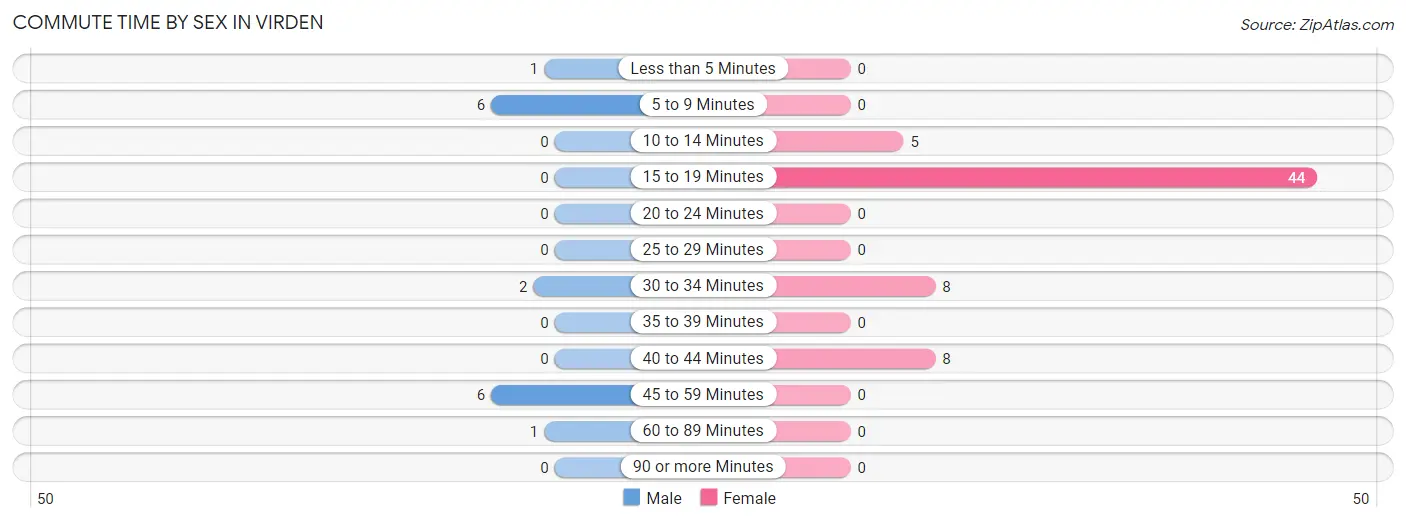
| Commute Time | Male | Female |
| Less than 5 Minutes | 1 (6.2%) | 0 (0.0%) |
| 5 to 9 Minutes | 6 (37.5%) | 0 (0.0%) |
| 10 to 14 Minutes | 0 (0.0%) | 5 (7.7%) |
| 15 to 19 Minutes | 0 (0.0%) | 44 (67.7%) |
| 20 to 24 Minutes | 0 (0.0%) | 0 (0.0%) |
| 25 to 29 Minutes | 0 (0.0%) | 0 (0.0%) |
| 30 to 34 Minutes | 2 (12.5%) | 8 (12.3%) |
| 35 to 39 Minutes | 0 (0.0%) | 0 (0.0%) |
| 40 to 44 Minutes | 0 (0.0%) | 8 (12.3%) |
| 45 to 59 Minutes | 6 (37.5%) | 0 (0.0%) |
| 60 to 89 Minutes | 1 (6.2%) | 0 (0.0%) |
| 90 or more Minutes | 0 (0.0%) | 0 (0.0%) |
Time of Departure to Work by Sex in Virden
The most frequent times of departure to work in Virden are 7:00 AM to 7:29 AM (7, 43.8%) for males and 7:00 AM to 7:29 AM (47, 72.3%) for females.
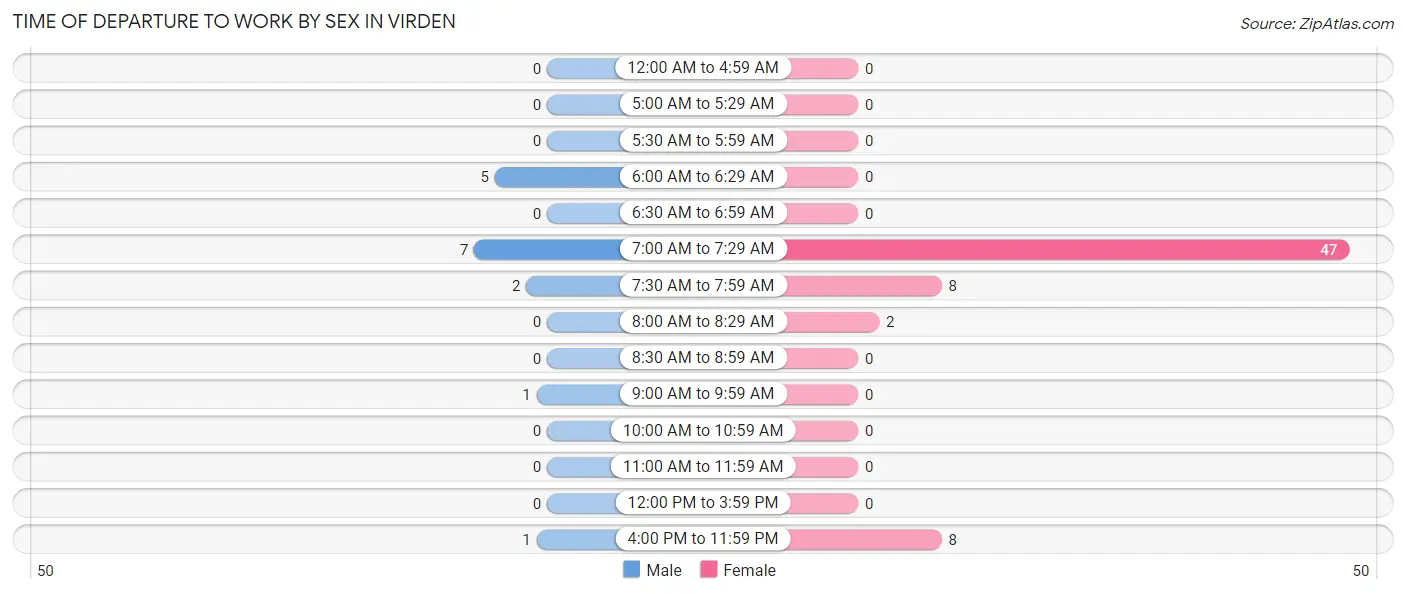
| Time of Departure | Male | Female |
| 12:00 AM to 4:59 AM | 0 (0.0%) | 0 (0.0%) |
| 5:00 AM to 5:29 AM | 0 (0.0%) | 0 (0.0%) |
| 5:30 AM to 5:59 AM | 0 (0.0%) | 0 (0.0%) |
| 6:00 AM to 6:29 AM | 5 (31.2%) | 0 (0.0%) |
| 6:30 AM to 6:59 AM | 0 (0.0%) | 0 (0.0%) |
| 7:00 AM to 7:29 AM | 7 (43.8%) | 47 (72.3%) |
| 7:30 AM to 7:59 AM | 2 (12.5%) | 8 (12.3%) |
| 8:00 AM to 8:29 AM | 0 (0.0%) | 2 (3.1%) |
| 8:30 AM to 8:59 AM | 0 (0.0%) | 0 (0.0%) |
| 9:00 AM to 9:59 AM | 1 (6.2%) | 0 (0.0%) |
| 10:00 AM to 10:59 AM | 0 (0.0%) | 0 (0.0%) |
| 11:00 AM to 11:59 AM | 0 (0.0%) | 0 (0.0%) |
| 12:00 PM to 3:59 PM | 0 (0.0%) | 0 (0.0%) |
| 4:00 PM to 11:59 PM | 1 (6.2%) | 8 (12.3%) |
| Total | 16 (100.0%) | 65 (100.0%) |
Housing Occupancy in Virden
Occupancy by Ownership in Virden
Of the total 96 dwellings in Virden, owner-occupied units account for 85 (88.5%), while renter-occupied units make up 11 (11.5%).
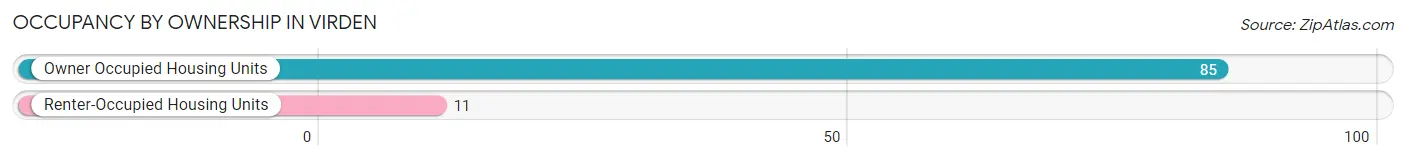
| Occupancy | # Housing Units | % Housing Units |
| Owner Occupied Housing Units | 85 | 88.5% |
| Renter-Occupied Housing Units | 11 | 11.5% |
| Total Occupied Housing Units | 96 | 100.0% |
Occupancy by Household Size in Virden
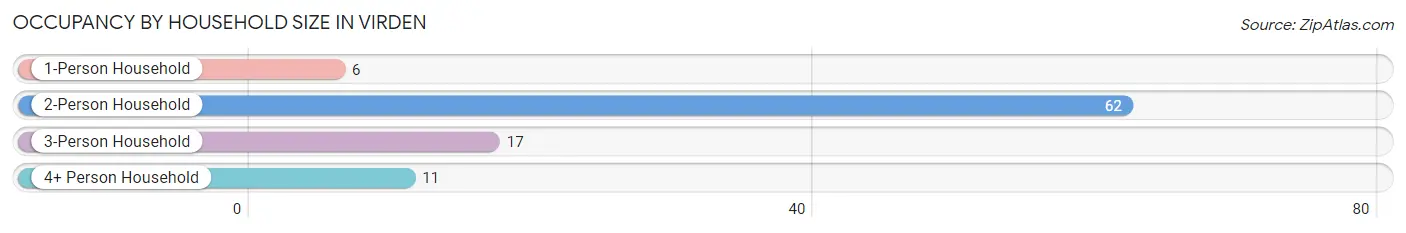
| Household Size | # Housing Units | % Housing Units |
| 1-Person Household | 6 | 6.2% |
| 2-Person Household | 62 | 64.6% |
| 3-Person Household | 17 | 17.7% |
| 4+ Person Household | 11 | 11.5% |
| Total Housing Units | 96 | 100.0% |
Occupancy by Ownership by Household Size in Virden
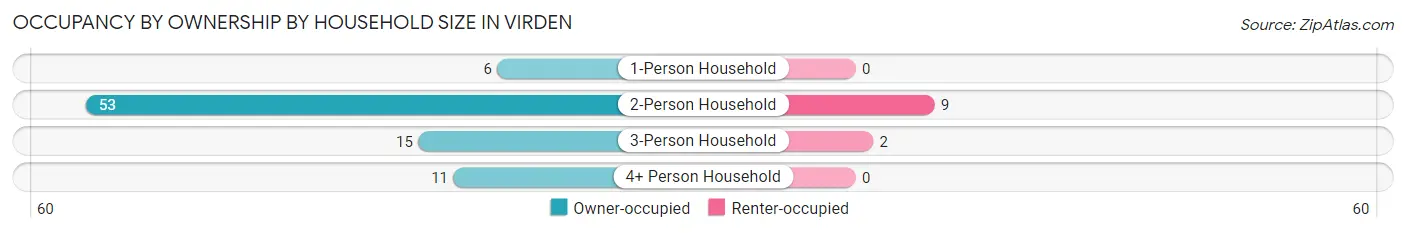
| Household Size | Owner-occupied | Renter-occupied |
| 1-Person Household | 6 (100.0%) | 0 (0.0%) |
| 2-Person Household | 53 (85.5%) | 9 (14.5%) |
| 3-Person Household | 15 (88.2%) | 2 (11.8%) |
| 4+ Person Household | 11 (100.0%) | 0 (0.0%) |
| Total Housing Units | 85 (88.5%) | 11 (11.5%) |
Occupancy by Educational Attainment in Virden
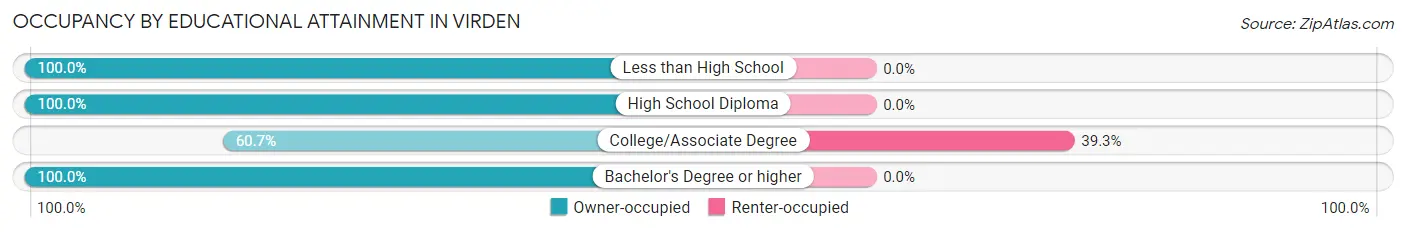
| Household Size | Owner-occupied | Renter-occupied |
| Less than High School | 1 (100.0%) | 0 (0.0%) |
| High School Diploma | 17 (100.0%) | 0 (0.0%) |
| College/Associate Degree | 17 (60.7%) | 11 (39.3%) |
| Bachelor's Degree or higher | 50 (100.0%) | 0 (0.0%) |
Occupancy by Age of Householder in Virden
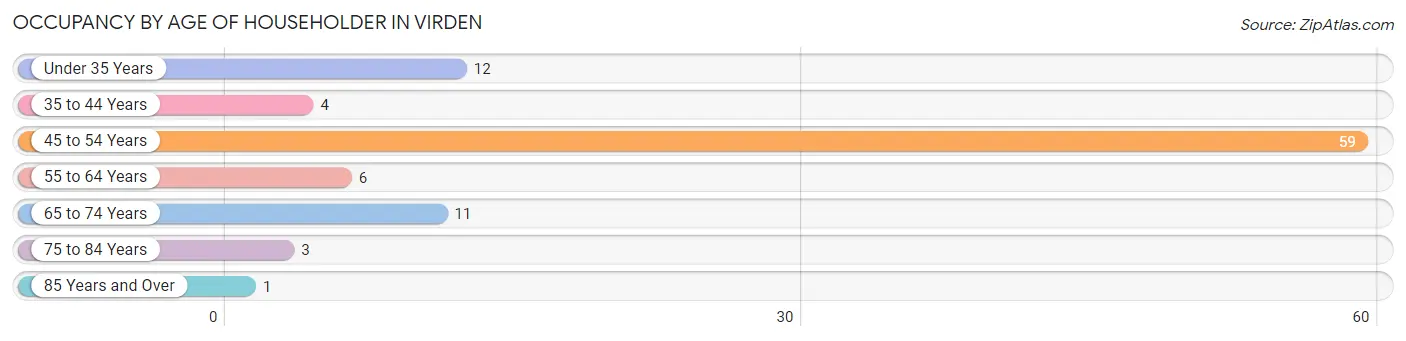
| Age Bracket | # Households | % Households |
| Under 35 Years | 12 | 12.5% |
| 35 to 44 Years | 4 | 4.2% |
| 45 to 54 Years | 59 | 61.5% |
| 55 to 64 Years | 6 | 6.2% |
| 65 to 74 Years | 11 | 11.5% |
| 75 to 84 Years | 3 | 3.1% |
| 85 Years and Over | 1 | 1.0% |
| Total | 96 | 100.0% |
Housing Finances in Virden
Median Income by Occupancy in Virden
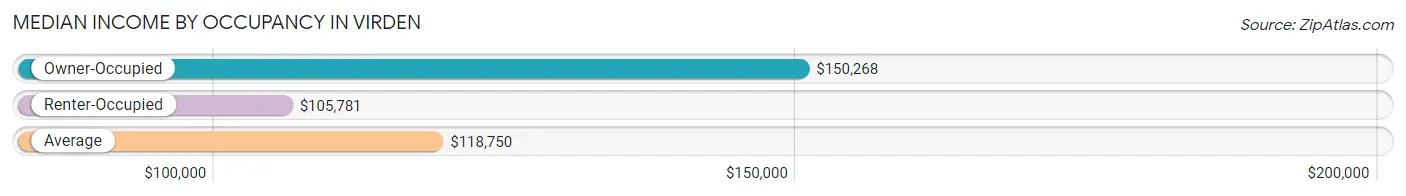
| Occupancy Type | # Households | Median Income |
| Owner-Occupied | 85 (88.5%) | $150,268 |
| Renter-Occupied | 11 (11.5%) | $105,781 |
| Average | 96 (100.0%) | $118,750 |
Occupancy by Householder Income Bracket in Virden
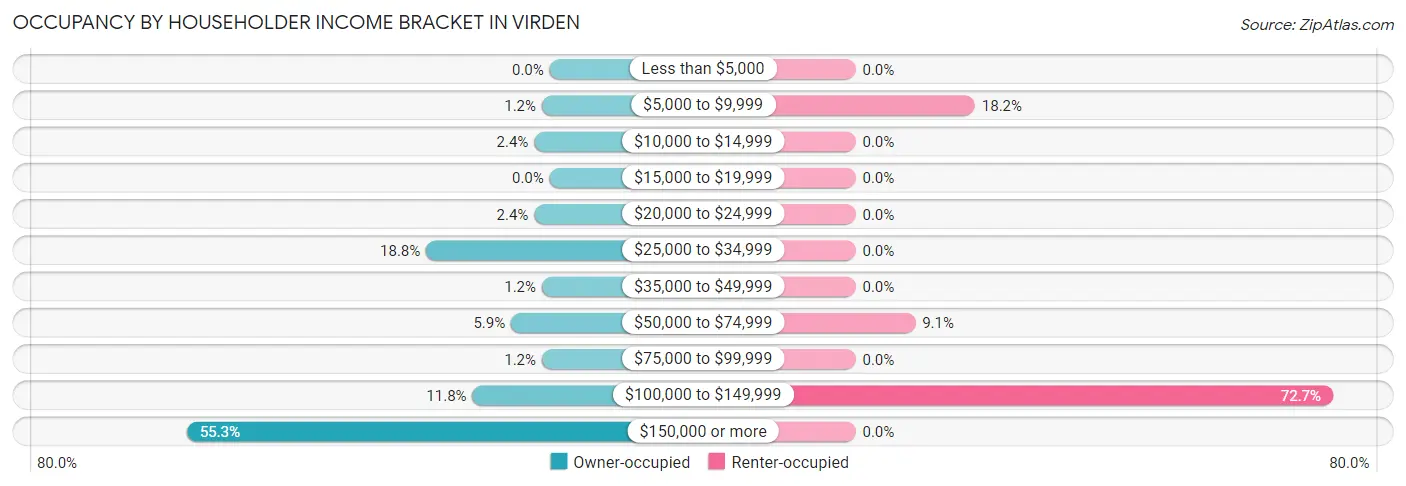
| Income Bracket | Owner-occupied | Renter-occupied |
| Less than $5,000 | 0 (0.0%) | 0 (0.0%) |
| $5,000 to $9,999 | 1 (1.2%) | 2 (18.2%) |
| $10,000 to $14,999 | 2 (2.4%) | 0 (0.0%) |
| $15,000 to $19,999 | 0 (0.0%) | 0 (0.0%) |
| $20,000 to $24,999 | 2 (2.4%) | 0 (0.0%) |
| $25,000 to $34,999 | 16 (18.8%) | 0 (0.0%) |
| $35,000 to $49,999 | 1 (1.2%) | 0 (0.0%) |
| $50,000 to $74,999 | 5 (5.9%) | 1 (9.1%) |
| $75,000 to $99,999 | 1 (1.2%) | 0 (0.0%) |
| $100,000 to $149,999 | 10 (11.8%) | 8 (72.7%) |
| $150,000 or more | 47 (55.3%) | 0 (0.0%) |
| Total | 85 (100.0%) | 11 (100.0%) |
Monthly Housing Cost Tiers in Virden
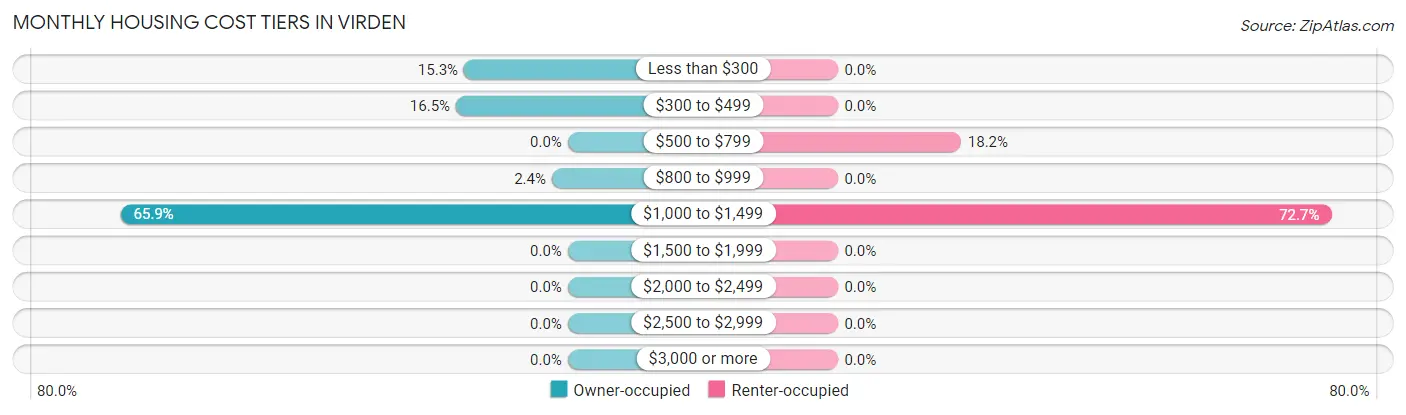
| Monthly Cost | Owner-occupied | Renter-occupied |
| Less than $300 | 13 (15.3%) | 0 (0.0%) |
| $300 to $499 | 14 (16.5%) | 0 (0.0%) |
| $500 to $799 | 0 (0.0%) | 2 (18.2%) |
| $800 to $999 | 2 (2.4%) | 0 (0.0%) |
| $1,000 to $1,499 | 56 (65.9%) | 8 (72.7%) |
| $1,500 to $1,999 | 0 (0.0%) | 0 (0.0%) |
| $2,000 to $2,499 | 0 (0.0%) | 0 (0.0%) |
| $2,500 to $2,999 | 0 (0.0%) | 0 (0.0%) |
| $3,000 or more | 0 (0.0%) | 0 (0.0%) |
| Total | 85 (100.0%) | 11 (100.0%) |
Physical Housing Characteristics in Virden
Housing Structures in Virden
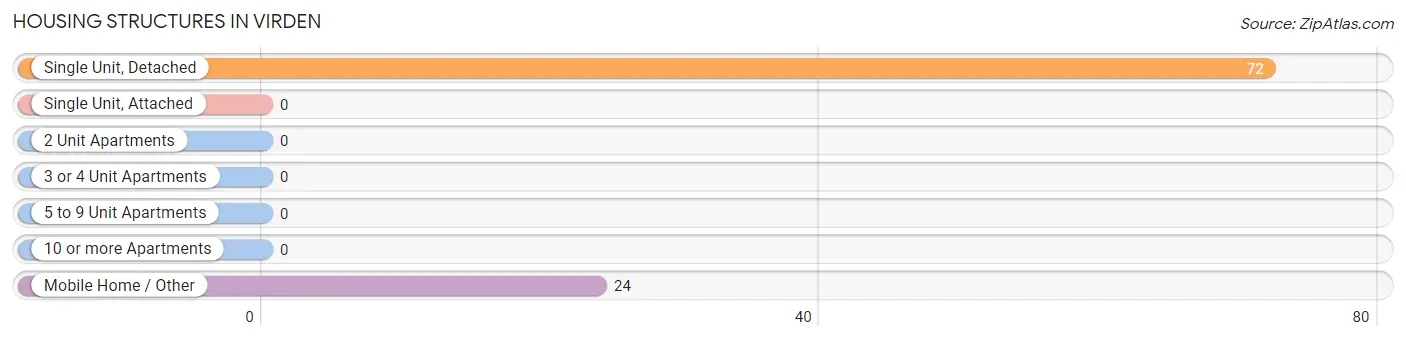
| Structure Type | # Housing Units | % Housing Units |
| Single Unit, Detached | 72 | 75.0% |
| Single Unit, Attached | 0 | 0.0% |
| 2 Unit Apartments | 0 | 0.0% |
| 3 or 4 Unit Apartments | 0 | 0.0% |
| 5 to 9 Unit Apartments | 0 | 0.0% |
| 10 or more Apartments | 0 | 0.0% |
| Mobile Home / Other | 24 | 25.0% |
| Total | 96 | 100.0% |
Housing Structures by Occupancy in Virden
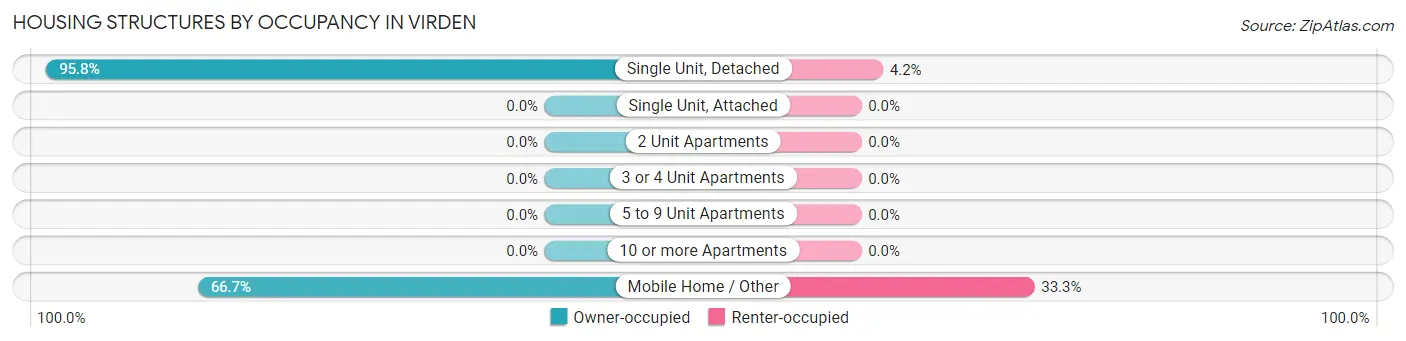
| Structure Type | Owner-occupied | Renter-occupied |
| Single Unit, Detached | 69 (95.8%) | 3 (4.2%) |
| Single Unit, Attached | 0 (0.0%) | 0 (0.0%) |
| 2 Unit Apartments | 0 (0.0%) | 0 (0.0%) |
| 3 or 4 Unit Apartments | 0 (0.0%) | 0 (0.0%) |
| 5 to 9 Unit Apartments | 0 (0.0%) | 0 (0.0%) |
| 10 or more Apartments | 0 (0.0%) | 0 (0.0%) |
| Mobile Home / Other | 16 (66.7%) | 8 (33.3%) |
| Total | 85 (88.5%) | 11 (11.5%) |
Housing Structures by Number of Rooms in Virden
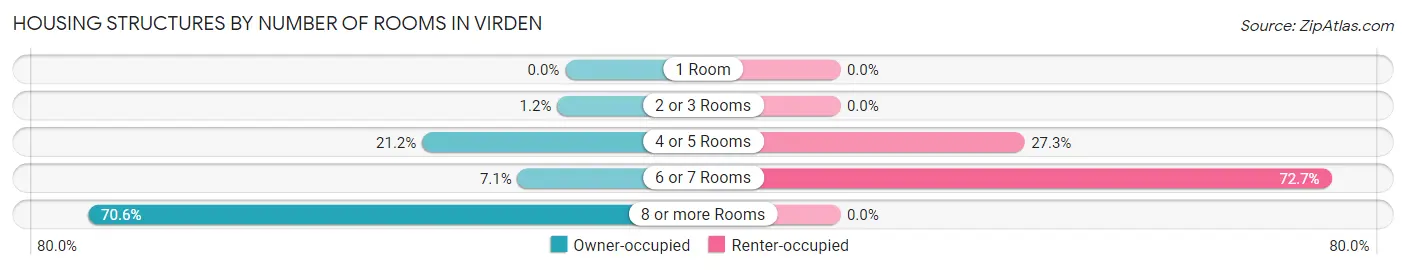
| Number of Rooms | Owner-occupied | Renter-occupied |
| 1 Room | 0 (0.0%) | 0 (0.0%) |
| 2 or 3 Rooms | 1 (1.2%) | 0 (0.0%) |
| 4 or 5 Rooms | 18 (21.2%) | 3 (27.3%) |
| 6 or 7 Rooms | 6 (7.1%) | 8 (72.7%) |
| 8 or more Rooms | 60 (70.6%) | 0 (0.0%) |
| Total | 85 (100.0%) | 11 (100.0%) |
Housing Structure by Heating Type in Virden
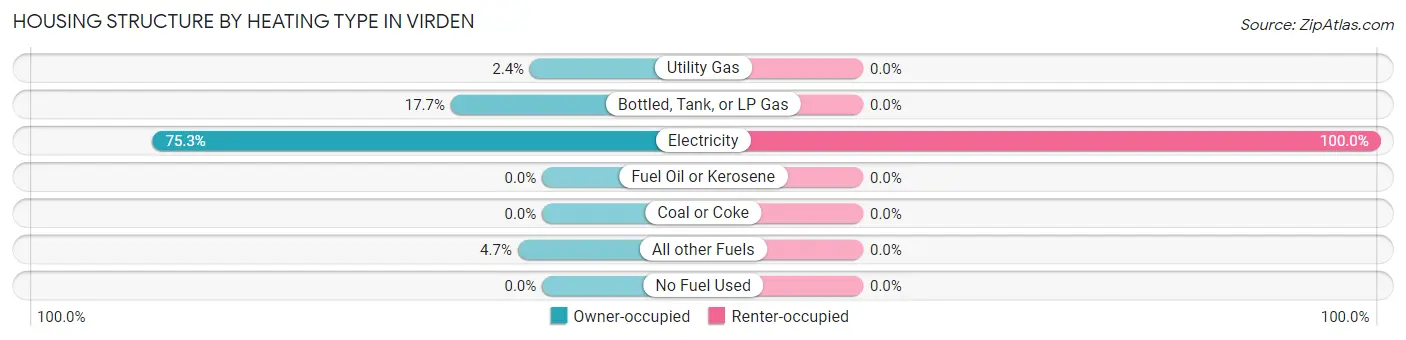
| Heating Type | Owner-occupied | Renter-occupied |
| Utility Gas | 2 (2.4%) | 0 (0.0%) |
| Bottled, Tank, or LP Gas | 15 (17.6%) | 0 (0.0%) |
| Electricity | 64 (75.3%) | 11 (100.0%) |
| Fuel Oil or Kerosene | 0 (0.0%) | 0 (0.0%) |
| Coal or Coke | 0 (0.0%) | 0 (0.0%) |
| All other Fuels | 4 (4.7%) | 0 (0.0%) |
| No Fuel Used | 0 (0.0%) | 0 (0.0%) |
| Total | 85 (100.0%) | 11 (100.0%) |
Household Vehicle Usage in Virden
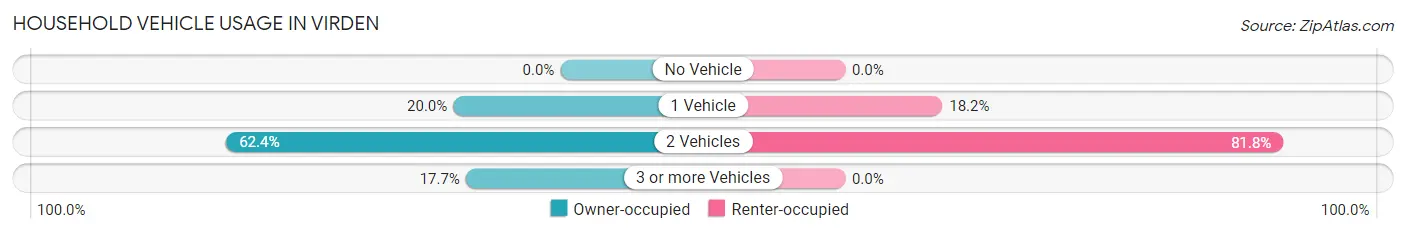
| Vehicles per Household | Owner-occupied | Renter-occupied |
| No Vehicle | 0 (0.0%) | 0 (0.0%) |
| 1 Vehicle | 17 (20.0%) | 2 (18.2%) |
| 2 Vehicles | 53 (62.4%) | 9 (81.8%) |
| 3 or more Vehicles | 15 (17.6%) | 0 (0.0%) |
| Total | 85 (100.0%) | 11 (100.0%) |
Real Estate & Mortgages in Virden
Real Estate and Mortgage Overview in Virden
| Characteristic | Without Mortgage | With Mortgage |
| Housing Units | 29 | 56 |
| Median Property Value | $68,800 | $183,300 |
| Median Household Income | - | - |
| Monthly Housing Costs | $309 | $0 |
| Real Estate Taxes | $550 | $0 |
Property Value by Mortgage Status in Virden
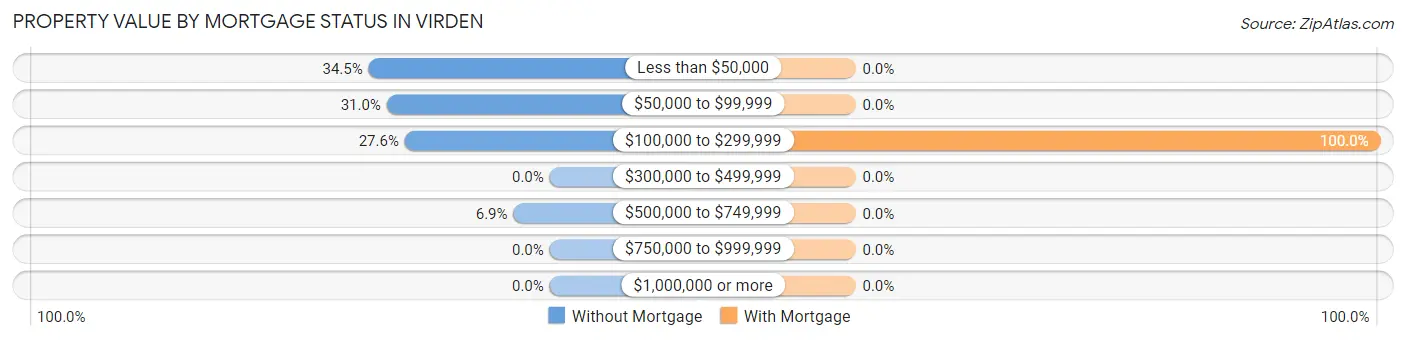
| Property Value | Without Mortgage | With Mortgage |
| Less than $50,000 | 10 (34.5%) | 0 (0.0%) |
| $50,000 to $99,999 | 9 (31.0%) | 0 (0.0%) |
| $100,000 to $299,999 | 8 (27.6%) | 56 (100.0%) |
| $300,000 to $499,999 | 0 (0.0%) | 0 (0.0%) |
| $500,000 to $749,999 | 2 (6.9%) | 0 (0.0%) |
| $750,000 to $999,999 | 0 (0.0%) | 0 (0.0%) |
| $1,000,000 or more | 0 (0.0%) | 0 (0.0%) |
| Total | 29 (100.0%) | 56 (100.0%) |
Household Income by Mortgage Status in Virden
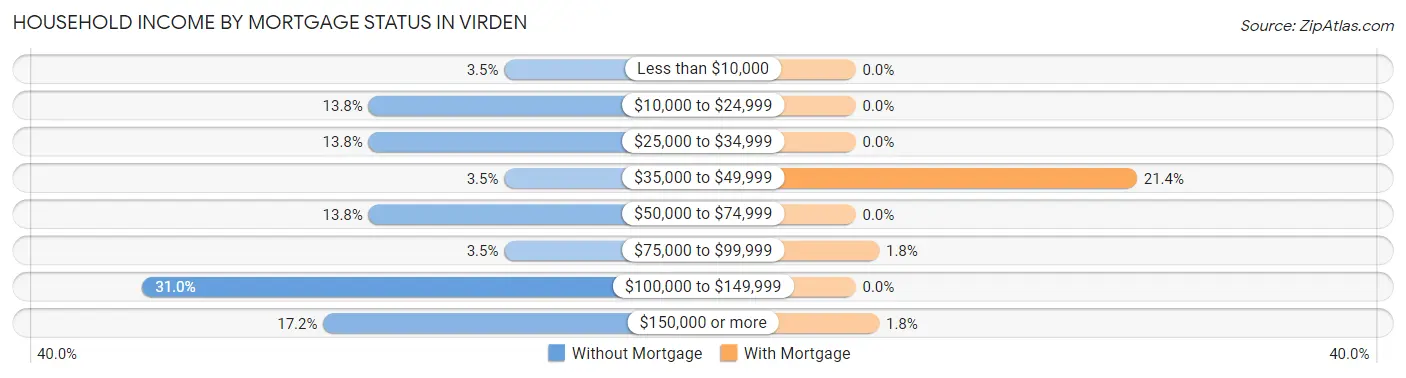
| Household Income | Without Mortgage | With Mortgage |
| Less than $10,000 | 1 (3.5%) | 0 (0.0%) |
| $10,000 to $24,999 | 4 (13.8%) | 0 (0.0%) |
| $25,000 to $34,999 | 4 (13.8%) | 0 (0.0%) |
| $35,000 to $49,999 | 1 (3.5%) | 12 (21.4%) |
| $50,000 to $74,999 | 4 (13.8%) | 0 (0.0%) |
| $75,000 to $99,999 | 1 (3.5%) | 1 (1.8%) |
| $100,000 to $149,999 | 9 (31.0%) | 0 (0.0%) |
| $150,000 or more | 5 (17.2%) | 1 (1.8%) |
| Total | 29 (100.0%) | 56 (100.0%) |
Property Value to Household Income Ratio in Virden
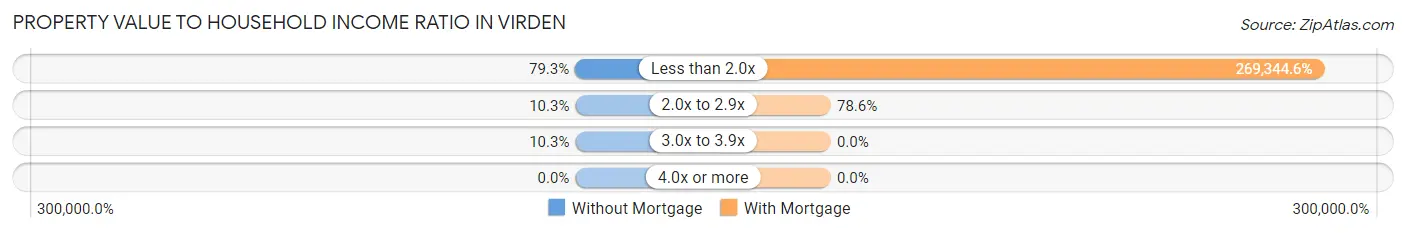
| Value-to-Income Ratio | Without Mortgage | With Mortgage |
| Less than 2.0x | 23 (79.3%) | 150,833 (269,344.6%) |
| 2.0x to 2.9x | 3 (10.3%) | 44 (78.6%) |
| 3.0x to 3.9x | 3 (10.3%) | 0 (0.0%) |
| 4.0x or more | 0 (0.0%) | 0 (0.0%) |
| Total | 29 (100.0%) | 56 (100.0%) |
Real Estate Taxes by Mortgage Status in Virden
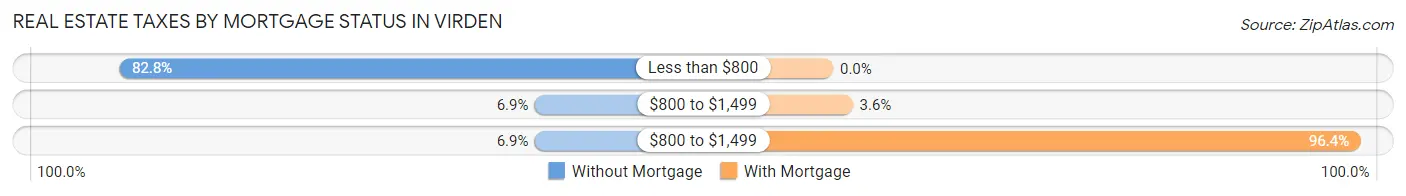
| Property Taxes | Without Mortgage | With Mortgage |
| Less than $800 | 24 (82.8%) | 0 (0.0%) |
| $800 to $1,499 | 2 (6.9%) | 2 (3.6%) |
| $800 to $1,499 | 2 (6.9%) | 54 (96.4%) |
| Total | 29 (100.0%) | 56 (100.0%) |
Health & Disability in Virden
Health Insurance Coverage by Age in Virden
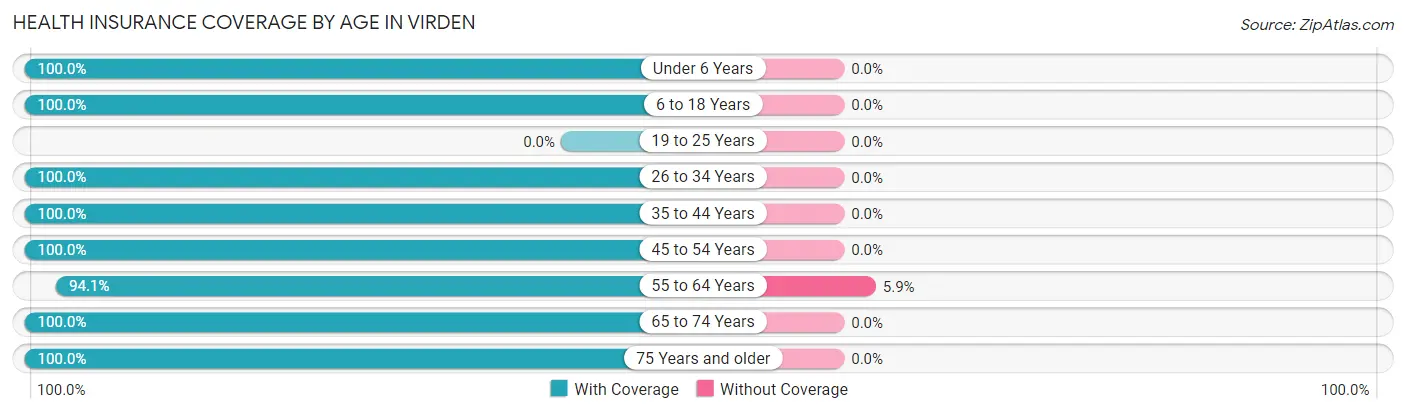
| Age Bracket | With Coverage | Without Coverage |
| Under 6 Years | 2 (100.0%) | 0 (0.0%) |
| 6 to 18 Years | 54 (100.0%) | 0 (0.0%) |
| 19 to 25 Years | 0 (0.0%) | 0 (0.0%) |
| 26 to 34 Years | 12 (100.0%) | 0 (0.0%) |
| 35 to 44 Years | 15 (100.0%) | 0 (0.0%) |
| 45 to 54 Years | 63 (100.0%) | 0 (0.0%) |
| 55 to 64 Years | 16 (94.1%) | 1 (5.9%) |
| 65 to 74 Years | 20 (100.0%) | 0 (0.0%) |
| 75 Years and older | 9 (100.0%) | 0 (0.0%) |
| Total | 191 (99.5%) | 1 (0.5%) |
Health Insurance Coverage by Citizenship Status in Virden
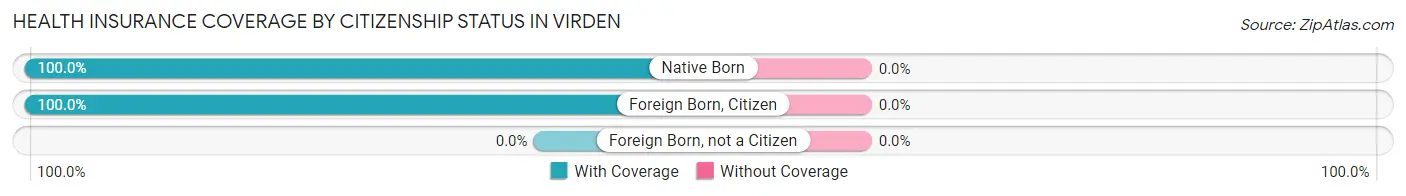
| Citizenship Status | With Coverage | Without Coverage |
| Native Born | 2 (100.0%) | 0 (0.0%) |
| Foreign Born, Citizen | 54 (100.0%) | 0 (0.0%) |
| Foreign Born, not a Citizen | 0 (0.0%) | 0 (0.0%) |
Health Insurance Coverage by Household Income in Virden
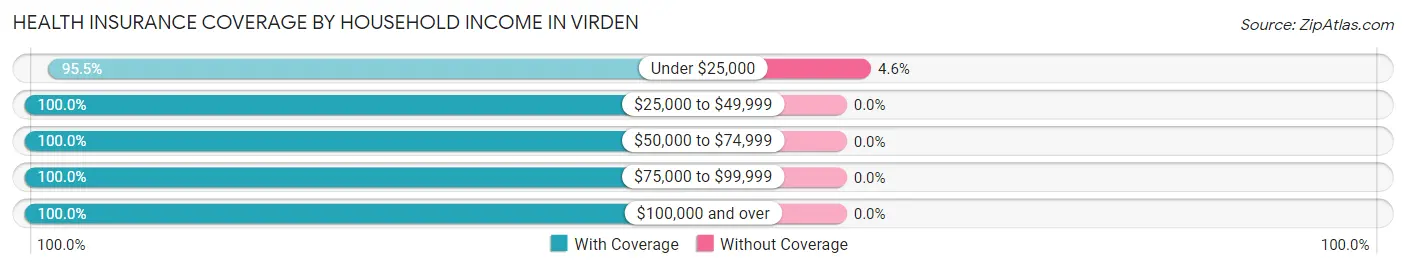
| Household Income | With Coverage | Without Coverage |
| Under $25,000 | 21 (95.5%) | 1 (4.5%) |
| $25,000 to $49,999 | 19 (100.0%) | 0 (0.0%) |
| $50,000 to $74,999 | 39 (100.0%) | 0 (0.0%) |
| $75,000 to $99,999 | 2 (100.0%) | 0 (0.0%) |
| $100,000 and over | 110 (100.0%) | 0 (0.0%) |
Public vs Private Health Insurance Coverage by Age in Virden
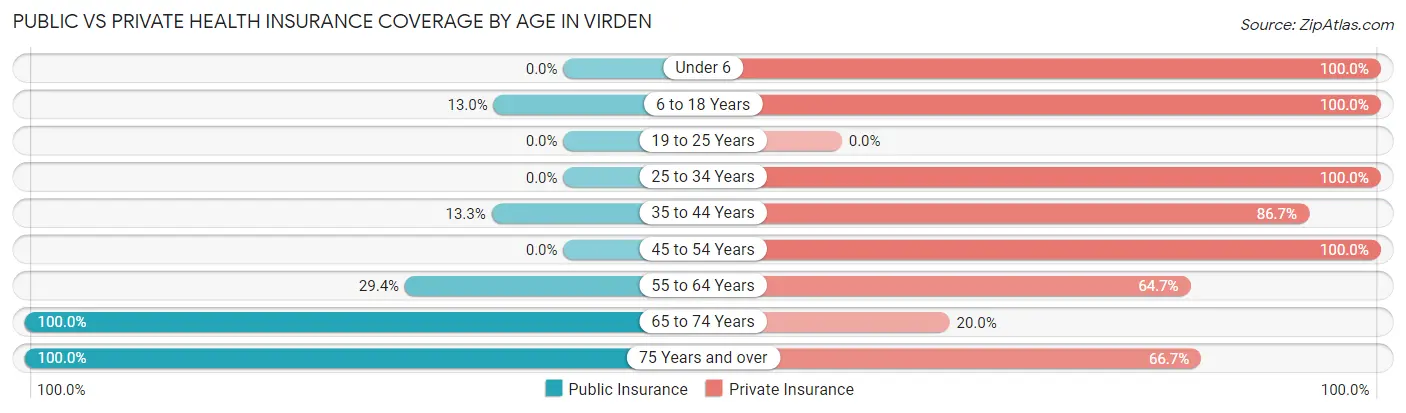
| Age Bracket | Public Insurance | Private Insurance |
| Under 6 | 0 (0.0%) | 2 (100.0%) |
| 6 to 18 Years | 7 (13.0%) | 54 (100.0%) |
| 19 to 25 Years | 0 (0.0%) | 0 (0.0%) |
| 25 to 34 Years | 0 (0.0%) | 12 (100.0%) |
| 35 to 44 Years | 2 (13.3%) | 13 (86.7%) |
| 45 to 54 Years | 0 (0.0%) | 63 (100.0%) |
| 55 to 64 Years | 5 (29.4%) | 11 (64.7%) |
| 65 to 74 Years | 20 (100.0%) | 4 (20.0%) |
| 75 Years and over | 9 (100.0%) | 6 (66.7%) |
| Total | 43 (22.4%) | 165 (85.9%) |
Disability Status by Sex by Age in Virden
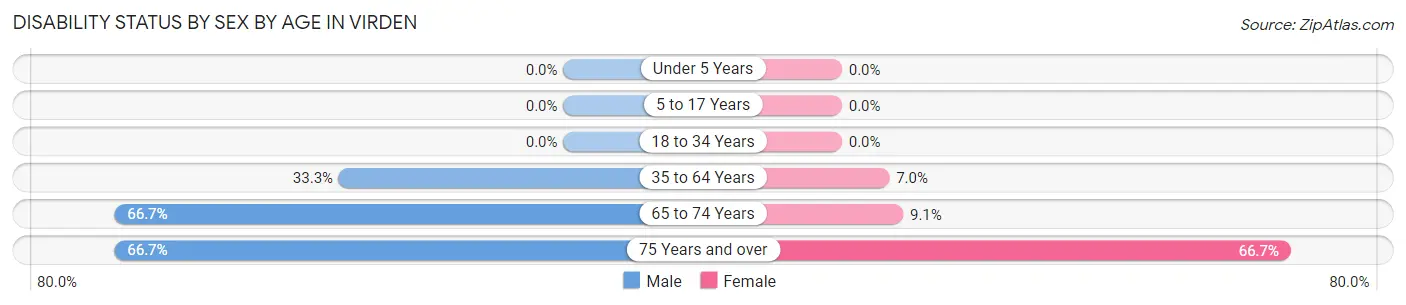
| Age Bracket | Male | Female |
| Under 5 Years | 0 (0.0%) | 0 (0.0%) |
| 5 to 17 Years | 0 (0.0%) | 0 (0.0%) |
| 18 to 34 Years | 0 (0.0%) | 0 (0.0%) |
| 35 to 64 Years | 8 (33.3%) | 5 (7.0%) |
| 65 to 74 Years | 6 (66.7%) | 1 (9.1%) |
| 75 Years and over | 2 (66.7%) | 4 (66.7%) |
Disability Class by Sex by Age in Virden
Disability Class: Hearing Difficulty
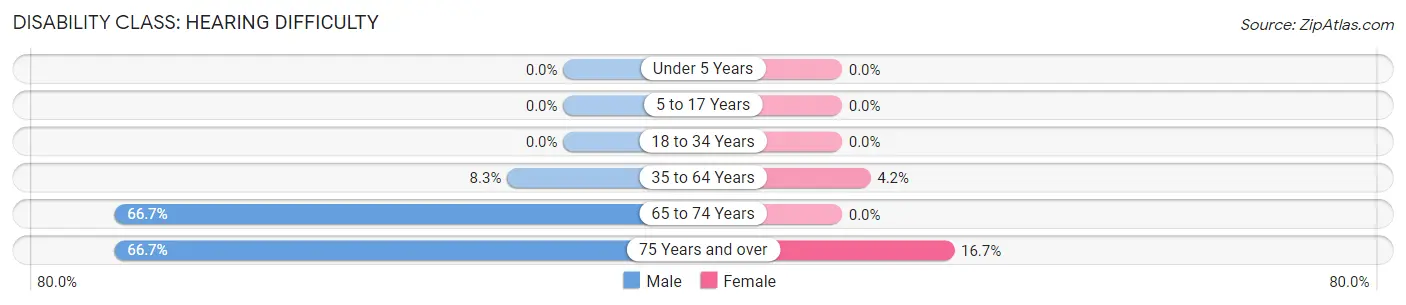
| Age Bracket | Male | Female |
| Under 5 Years | 0 (0.0%) | 0 (0.0%) |
| 5 to 17 Years | 0 (0.0%) | 0 (0.0%) |
| 18 to 34 Years | 0 (0.0%) | 0 (0.0%) |
| 35 to 64 Years | 2 (8.3%) | 3 (4.2%) |
| 65 to 74 Years | 6 (66.7%) | 0 (0.0%) |
| 75 Years and over | 2 (66.7%) | 1 (16.7%) |
Disability Class: Vision Difficulty
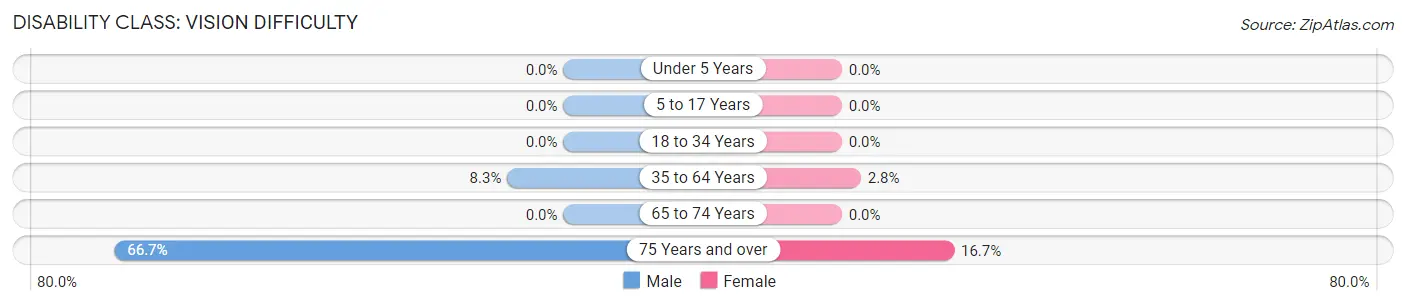
| Age Bracket | Male | Female |
| Under 5 Years | 0 (0.0%) | 0 (0.0%) |
| 5 to 17 Years | 0 (0.0%) | 0 (0.0%) |
| 18 to 34 Years | 0 (0.0%) | 0 (0.0%) |
| 35 to 64 Years | 2 (8.3%) | 2 (2.8%) |
| 65 to 74 Years | 0 (0.0%) | 0 (0.0%) |
| 75 Years and over | 2 (66.7%) | 1 (16.7%) |
Disability Class: Cognitive Difficulty
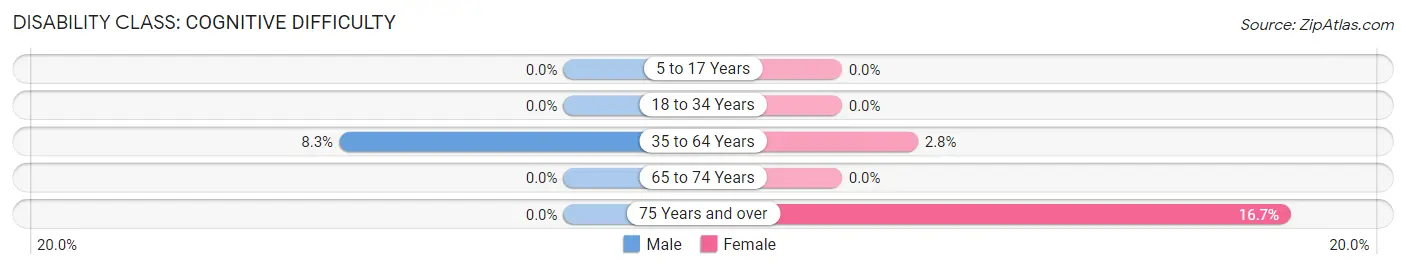
| Age Bracket | Male | Female |
| 5 to 17 Years | 0 (0.0%) | 0 (0.0%) |
| 18 to 34 Years | 0 (0.0%) | 0 (0.0%) |
| 35 to 64 Years | 2 (8.3%) | 2 (2.8%) |
| 65 to 74 Years | 0 (0.0%) | 0 (0.0%) |
| 75 Years and over | 0 (0.0%) | 1 (16.7%) |
Disability Class: Ambulatory Difficulty
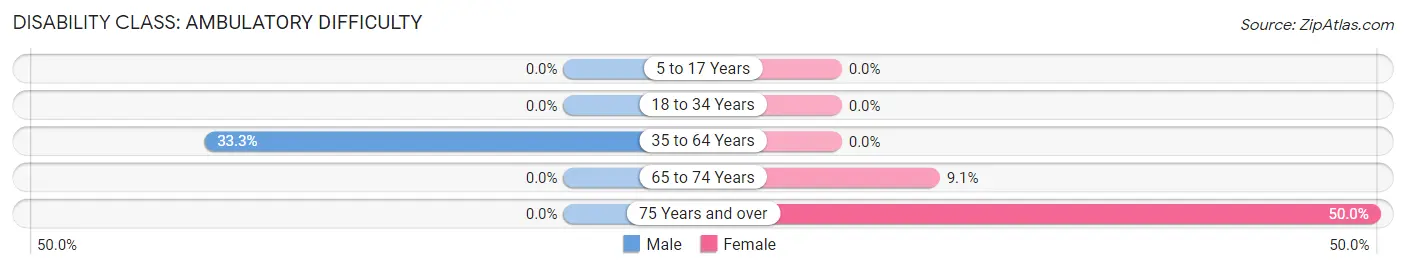
| Age Bracket | Male | Female |
| 5 to 17 Years | 0 (0.0%) | 0 (0.0%) |
| 18 to 34 Years | 0 (0.0%) | 0 (0.0%) |
| 35 to 64 Years | 8 (33.3%) | 0 (0.0%) |
| 65 to 74 Years | 0 (0.0%) | 1 (9.1%) |
| 75 Years and over | 0 (0.0%) | 3 (50.0%) |
Disability Class: Self-Care Difficulty
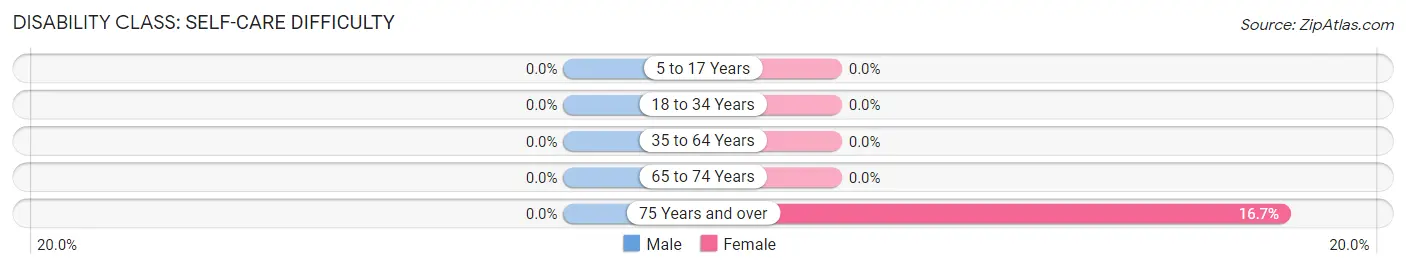
| Age Bracket | Male | Female |
| 5 to 17 Years | 0 (0.0%) | 0 (0.0%) |
| 18 to 34 Years | 0 (0.0%) | 0 (0.0%) |
| 35 to 64 Years | 0 (0.0%) | 0 (0.0%) |
| 65 to 74 Years | 0 (0.0%) | 0 (0.0%) |
| 75 Years and over | 0 (0.0%) | 1 (16.7%) |
Technology Access in Virden
Computing Device Access in Virden
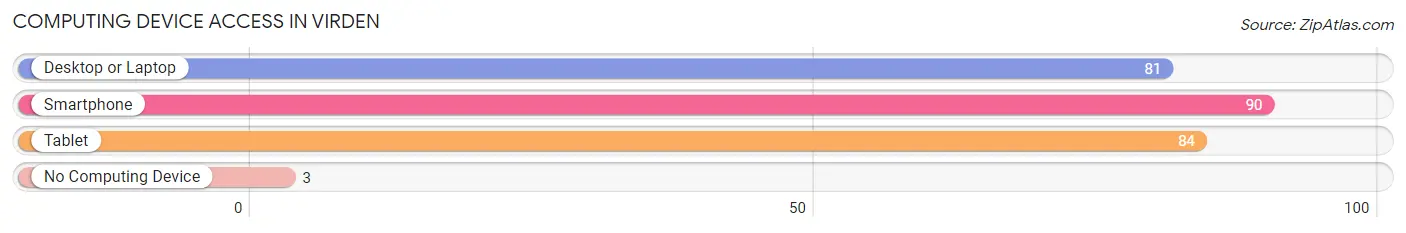
| Device Type | # Households | % Households |
| Desktop or Laptop | 81 | 84.4% |
| Smartphone | 90 | 93.8% |
| Tablet | 84 | 87.5% |
| No Computing Device | 3 | 3.1% |
| Total | 96 | 100.0% |
Internet Access in Virden
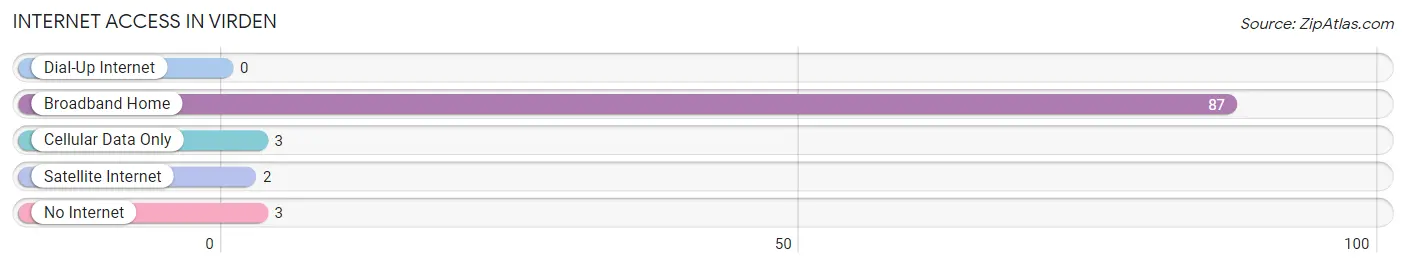
| Internet Type | # Households | % Households |
| Dial-Up Internet | 0 | 0.0% |
| Broadband Home | 87 | 90.6% |
| Cellular Data Only | 3 | 3.1% |
| Satellite Internet | 2 | 2.1% |
| No Internet | 3 | 3.1% |
| Total | 96 | 100.0% |
Virden Summary
Virden is a small town located in the southeastern corner of New Mexico, in Hidalgo County. It is situated at the intersection of U.S. Route 70 and State Route 9, about 25 miles east of the Arizona border. The town was founded in 1881 and named after the nearby Virden Creek.
History
Virden was founded in 1881 by a group of settlers from Texas. The town was named after the nearby Virden Creek, which was named after a local rancher, William Virden. The town quickly grew and by the early 1900s, it had become a bustling center of commerce and industry. The town was home to several businesses, including a hotel, a general store, a blacksmith shop, a livery stable, and a saloon.
In the early 1900s, the town was also home to a large number of Mexican immigrants, who worked in the local mines and on the nearby ranches. The town was also home to a large number of Native Americans, who lived in the area for centuries before the arrival of the settlers.
In the 1920s, the town experienced a period of growth and prosperity. The population increased from about 500 in 1920 to over 1,000 in 1930. During this time, the town was home to several businesses, including a bank, a movie theater, a hotel, and a number of stores.
In the 1950s, the town began to decline as the local economy shifted away from mining and ranching. By the 1970s, the population had dropped to about 500. In the 1980s, the town experienced a resurgence as the local economy shifted to tourism and recreation.
Geography
Virden is located in the southeastern corner of New Mexico, in Hidalgo County. It is situated at the intersection of U.S. Route 70 and State Route 9, about 25 miles east of the Arizona border. The town is located in the Chihuahuan Desert, at an elevation of 4,000 feet. The climate is semi-arid, with hot summers and mild winters.
The town is surrounded by several mountain ranges, including the Animas Mountains to the north, the Peloncillo Mountains to the east, and the Chiricahua Mountains to the south. The nearby San Simon River flows through the town, providing a source of water for the local population.
Economy
The economy of Virden is largely based on tourism and recreation. The town is home to several tourist attractions, including the nearby Gila National Forest and the Chiricahua National Monument. The town is also home to several outdoor recreation areas, including the Virden Wildlife Refuge and the Virden State Park.
The town is also home to several businesses, including restaurants, hotels, and retail stores. The local economy is also supported by the nearby mining and ranching industries.
Demographics
As of the 2010 census, the population of Virden was 1,093. The racial makeup of the town was 94.3% White, 0.7% African American, 0.7% Native American, 0.3% Asian, 0.1% Pacific Islander, 2.2% from other races, and 1.9% from two or more races. Hispanic or Latino of any race were 8.2% of the population.
The median household income in Virden was $30,938, and the median family income was $35,625. The per capita income was $15,945. About 16.2% of the population was below the poverty line.
Common Questions
What is Per Capita Income in Virden?
Per Capita income in Virden is $40,647.
What is the Median Family Income in Virden?
Median Family Income in Virden is $150,119.
What is the Median Household income in Virden?
Median Household Income in Virden is $118,750.
What is Income or Wage Gap in Virden?
Income or Wage Gap in Virden is 97.6%.
Women in Virden earn 2.4 cents for every dollar earned by a man.
What is Inequality or Gini Index in Virden?
Inequality or Gini Index in Virden is 0.44.
What is the Total Population of Virden?
Total Population of Virden is 192.
What is the Total Male Population of Virden?
Total Male Population of Virden is 61.
What is the Total Female Population of Virden?
Total Female Population of Virden is 131.
What is the Ratio of Males per 100 Females in Virden?
There are 46.56 Males per 100 Females in Virden.
What is the Ratio of Females per 100 Males in Virden?
There are 214.75 Females per 100 Males in Virden.
What is the Median Population Age in Virden?
Median Population Age in Virden is 49.5 Years.
What is the Average Family Size in Virden
Average Family Size in Virden is 2.1 People.
What is the Average Household Size in Virden
Average Household Size in Virden is 2.0 People.
How Large is the Labor Force in Virden?
There are 93 People in the Labor Forcein in Virden.
What is the Percentage of People in the Labor Force in Virden?
60.8% of People are in the Labor Force in Virden.
What is the Unemployment Rate in Virden?
Unemployment Rate in Virden is 12.9%.