Sanders, AZ Map & Demographics
Sanders Map
Sanders Overview
$15,429
PER CAPITA INCOME
$28,844
AVG FAMILY INCOME
$29,543
AVG HOUSEHOLD INCOME
34.2%
WAGE / INCOME GAP [ % ]
65.8¢/ $1
WAGE / INCOME GAP [ $ ]
0.33
INEQUALITY / GINI INDEX
696
TOTAL POPULATION
324
MALE POPULATION
372
FEMALE POPULATION
87.10
MALES / 100 FEMALES
114.81
FEMALES / 100 MALES
27.4
MEDIAN AGE
3.2
AVG FAMILY SIZE
2.7
AVG HOUSEHOLD SIZE
239
LABOR FORCE [ PEOPLE ]
54.8%
PERCENT IN LABOR FORCE
1.3%
UNEMPLOYMENT RATE
Sanders Zip Codes
Sanders Area Codes
Income in Sanders
Income Overview in Sanders
Per Capita Income in Sanders is $15,429, while median incomes of families and households are $28,844 and $29,543 respectively.
| Characteristic | Number | Measure |
| Per Capita Income | 696 | $15,429 |
| Median Family Income | 192 | $28,844 |
| Mean Family Income | 192 | $33,000 |
| Median Household Income | 256 | $29,543 |
| Mean Household Income | 256 | $38,039 |
| Income Deficit | 192 | $0 |
| Wage / Income Gap (%) | 696 | 34.23% |
| Wage / Income Gap ($) | 696 | 65.77¢ per $1 |
| Gini / Inequality Index | 696 | 0.33 |
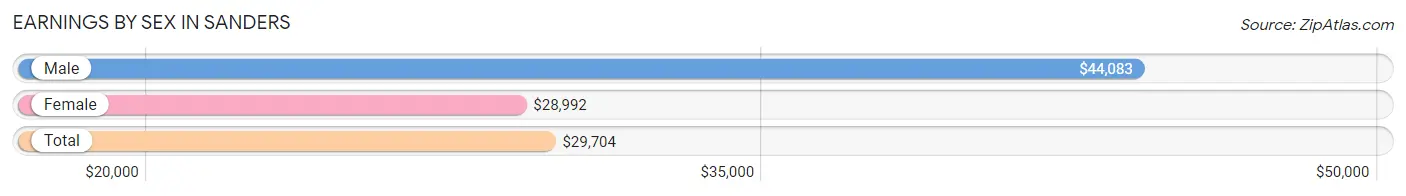
Earnings by Sex in Sanders
Average Earnings in Sanders are $29,704, $44,083 for men and $28,992 for women, a difference of 34.2%.
| Sex | Number | Average Earnings |
| Male | 93 (39.4%) | $44,083 |
| Female | 143 (60.6%) | $28,992 |
| Total | 236 (100.0%) | $29,704 |
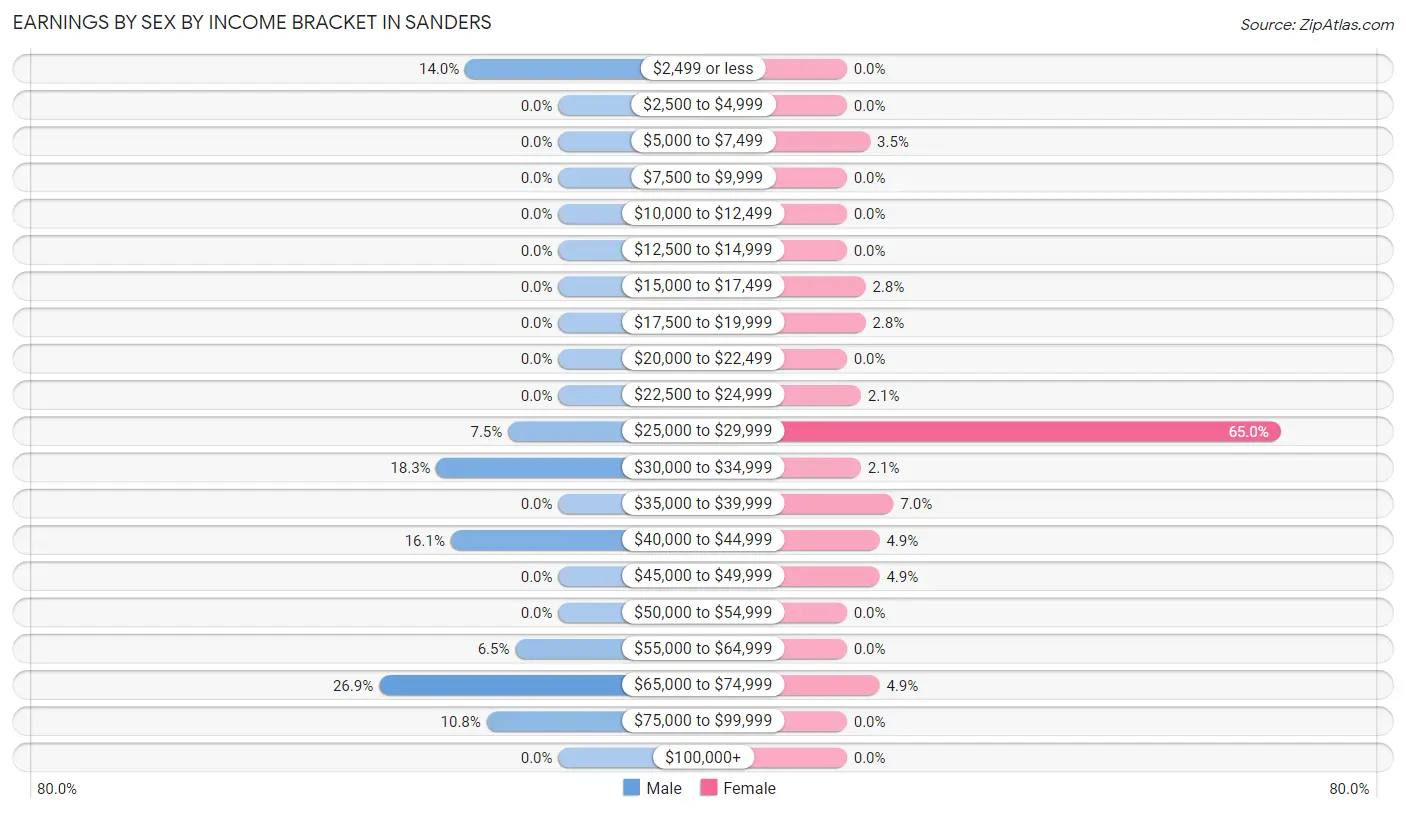
Earnings by Sex by Income Bracket in Sanders
The most common earnings brackets in Sanders are $65,000 to $74,999 for men (25 | 26.9%) and $25,000 to $29,999 for women (93 | 65.0%).
| Income | Male | Female |
| $2,499 or less | 13 (14.0%) | 0 (0.0%) |
| $2,500 to $4,999 | 0 (0.0%) | 0 (0.0%) |
| $5,000 to $7,499 | 0 (0.0%) | 5 (3.5%) |
| $7,500 to $9,999 | 0 (0.0%) | 0 (0.0%) |
| $10,000 to $12,499 | 0 (0.0%) | 0 (0.0%) |
| $12,500 to $14,999 | 0 (0.0%) | 0 (0.0%) |
| $15,000 to $17,499 | 0 (0.0%) | 4 (2.8%) |
| $17,500 to $19,999 | 0 (0.0%) | 4 (2.8%) |
| $20,000 to $22,499 | 0 (0.0%) | 0 (0.0%) |
| $22,500 to $24,999 | 0 (0.0%) | 3 (2.1%) |
| $25,000 to $29,999 | 7 (7.5%) | 93 (65.0%) |
| $30,000 to $34,999 | 17 (18.3%) | 3 (2.1%) |
| $35,000 to $39,999 | 0 (0.0%) | 10 (7.0%) |
| $40,000 to $44,999 | 15 (16.1%) | 7 (4.9%) |
| $45,000 to $49,999 | 0 (0.0%) | 7 (4.9%) |
| $50,000 to $54,999 | 0 (0.0%) | 0 (0.0%) |
| $55,000 to $64,999 | 6 (6.5%) | 0 (0.0%) |
| $65,000 to $74,999 | 25 (26.9%) | 7 (4.9%) |
| $75,000 to $99,999 | 10 (10.7%) | 0 (0.0%) |
| $100,000+ | 0 (0.0%) | 0 (0.0%) |
| Total | 93 (100.0%) | 143 (100.0%) |
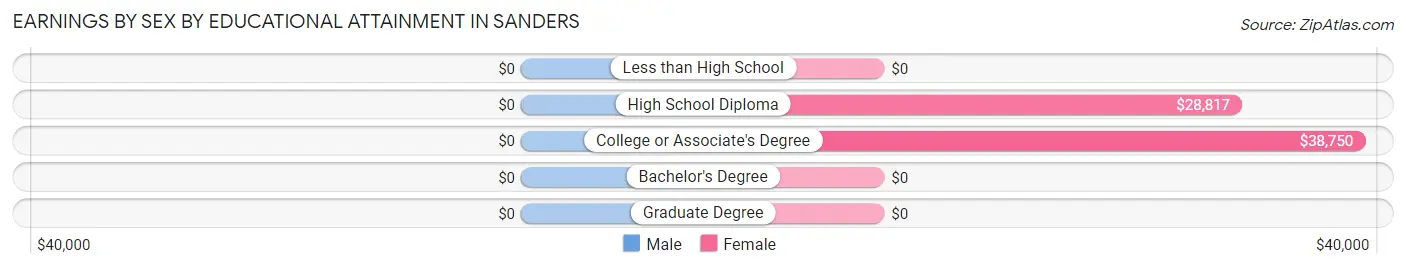
Earnings by Sex by Educational Attainment in Sanders
| Educational Attainment | Male Income | Female Income |
| Less than High School | - | - |
| High School Diploma | - | - |
| College or Associate's Degree | - | - |
| Bachelor's Degree | - | - |
| Graduate Degree | - | - |
| Total | $44,667 | $28,992 |
Family Income in Sanders
Family Income Brackets in Sanders
According to the Sanders family income data, there are 110 families falling into the $25,000 to $34,999 income range, which is the most common income bracket and makes up 57.3% of all families.
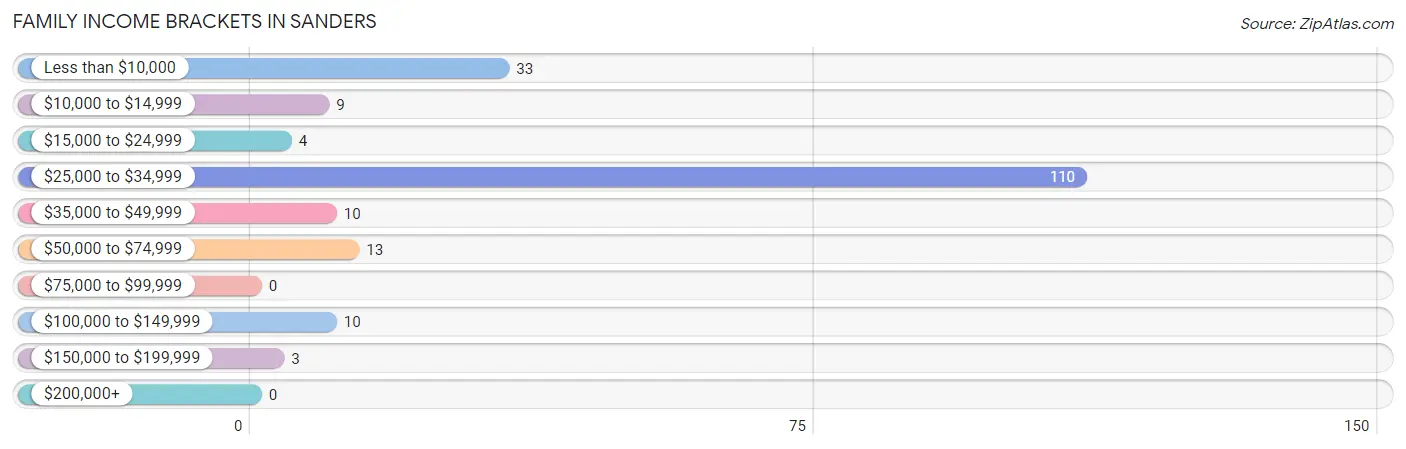
| Income Bracket | # Families | % Families |
| Less than $10,000 | 33 | 17.2% |
| $10,000 to $14,999 | 9 | 4.7% |
| $15,000 to $24,999 | 4 | 2.1% |
| $25,000 to $34,999 | 110 | 57.3% |
| $35,000 to $49,999 | 10 | 5.2% |
| $50,000 to $74,999 | 13 | 6.8% |
| $75,000 to $99,999 | 0 | 0.0% |
| $100,000 to $149,999 | 10 | 5.2% |
| $150,000 to $199,999 | 3 | 1.6% |
| $200,000+ | 0 | 0.0% |
Family Income by Famaliy Size in Sanders
5-person families (24 | 12.5%) account for the highest median family income in Sanders with $30,735 per family, while 2-person families (125 | 65.1%) have the highest median income of $14,214 per family member.
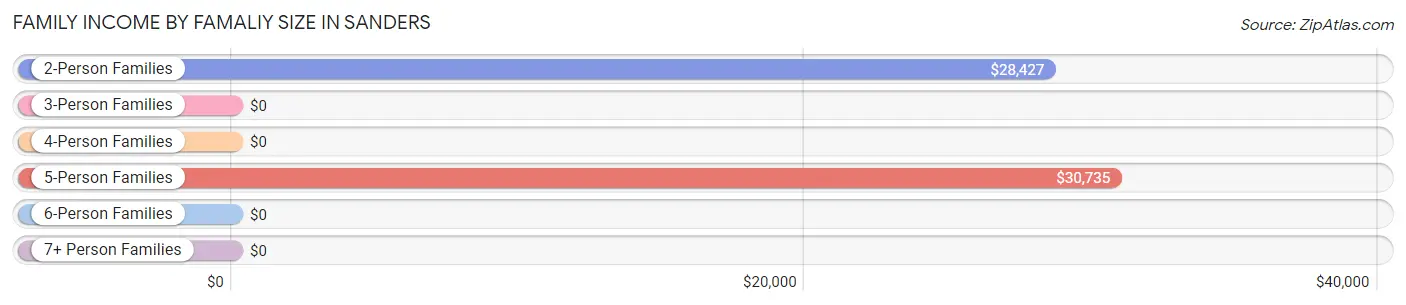
| Income Bracket | # Families | Median Income |
| 2-Person Families | 125 (65.1%) | $28,427 |
| 3-Person Families | 13 (6.8%) | $0 |
| 4-Person Families | 20 (10.4%) | $0 |
| 5-Person Families | 24 (12.5%) | $30,735 |
| 6-Person Families | 10 (5.2%) | $0 |
| 7+ Person Families | 0 (0.0%) | $0 |
| Total | 192 (100.0%) | $28,844 |
Family Income by Number of Earners in Sanders
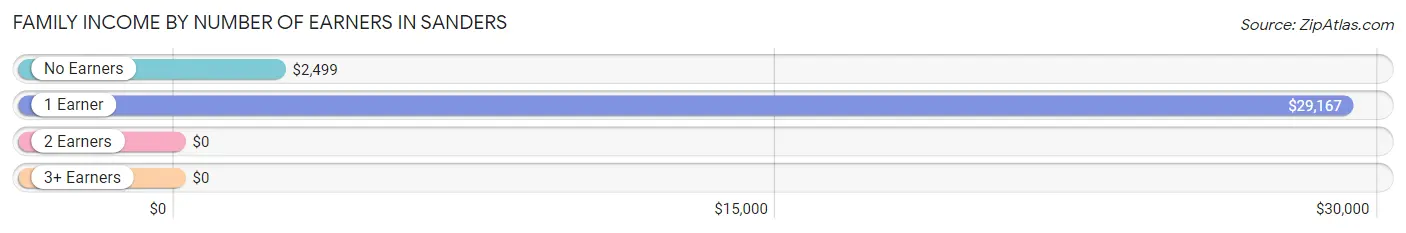
| Number of Earners | # Families | Median Income |
| No Earners | 37 (19.3%) | $2,499 |
| 1 Earner | 142 (74.0%) | $29,167 |
| 2 Earners | 13 (6.8%) | $0 |
| 3+ Earners | 0 (0.0%) | $0 |
| Total | 192 (100.0%) | $28,844 |
Household Income in Sanders
Household Income Brackets in Sanders
With 113 households falling in the category, the $25,000 to $34,999 income range is the most frequent in Sanders, accounting for 44.1% of all households.
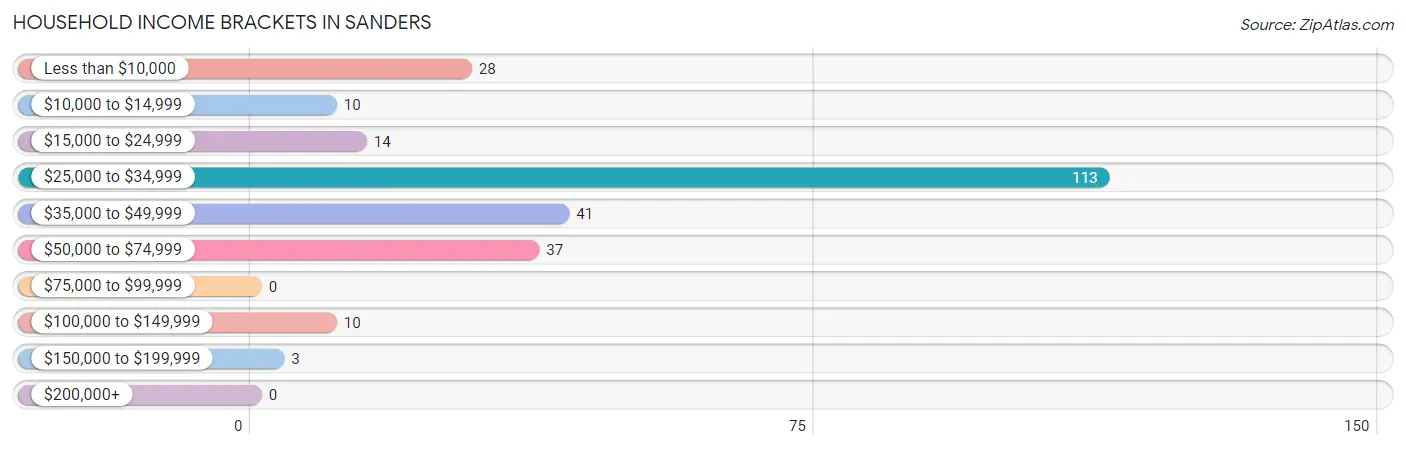
| Income Bracket | # Households | % Households |
| Less than $10,000 | 28 | 10.9% |
| $10,000 to $14,999 | 10 | 3.9% |
| $15,000 to $24,999 | 14 | 5.5% |
| $25,000 to $34,999 | 113 | 44.1% |
| $35,000 to $49,999 | 41 | 16.0% |
| $50,000 to $74,999 | 37 | 14.5% |
| $75,000 to $99,999 | 0 | 0.0% |
| $100,000 to $149,999 | 10 | 3.9% |
| $150,000 to $199,999 | 3 | 1.2% |
| $200,000+ | 0 | 0.0% |
Household Income by Householder Age in Sanders
The median household income in Sanders is $29,543, with the highest median household income of $39,327 found in the 65+ years age bracket for the primary householder. A total of 69 households (27.0%) fall into this category. Meanwhile, the 15 to 24 years age bracket for the primary householder has the lowest median household income of $0, with 17 households (6.6%) in this group.
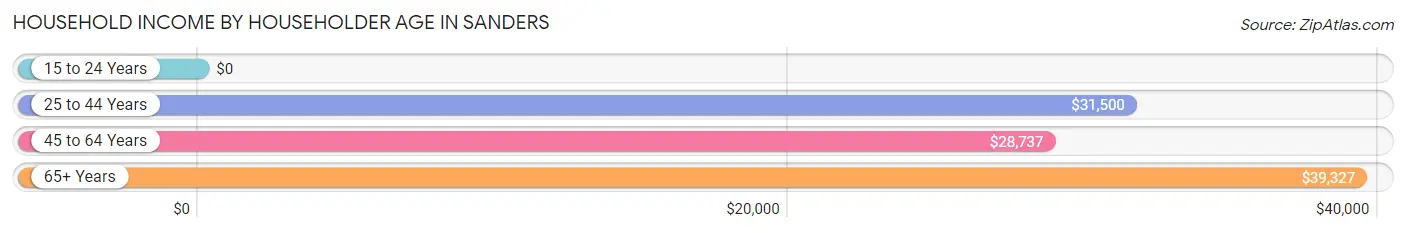
| Income Bracket | # Households | Median Income |
| 15 to 24 Years | 17 (6.6%) | $0 |
| 25 to 44 Years | 64 (25.0%) | $31,500 |
| 45 to 64 Years | 106 (41.4%) | $28,737 |
| 65+ Years | 69 (27.0%) | $39,327 |
| Total | 256 (100.0%) | $29,543 |
Poverty in Sanders
Income Below Poverty by Sex and Age in Sanders
With 52.8% poverty level for males and 33.1% for females among the residents of Sanders, under 5 year old males and under 5 year old females are the most vulnerable to poverty, with 61 males (88.4%) and 9 females (100.0%) in their respective age groups living below the poverty level.
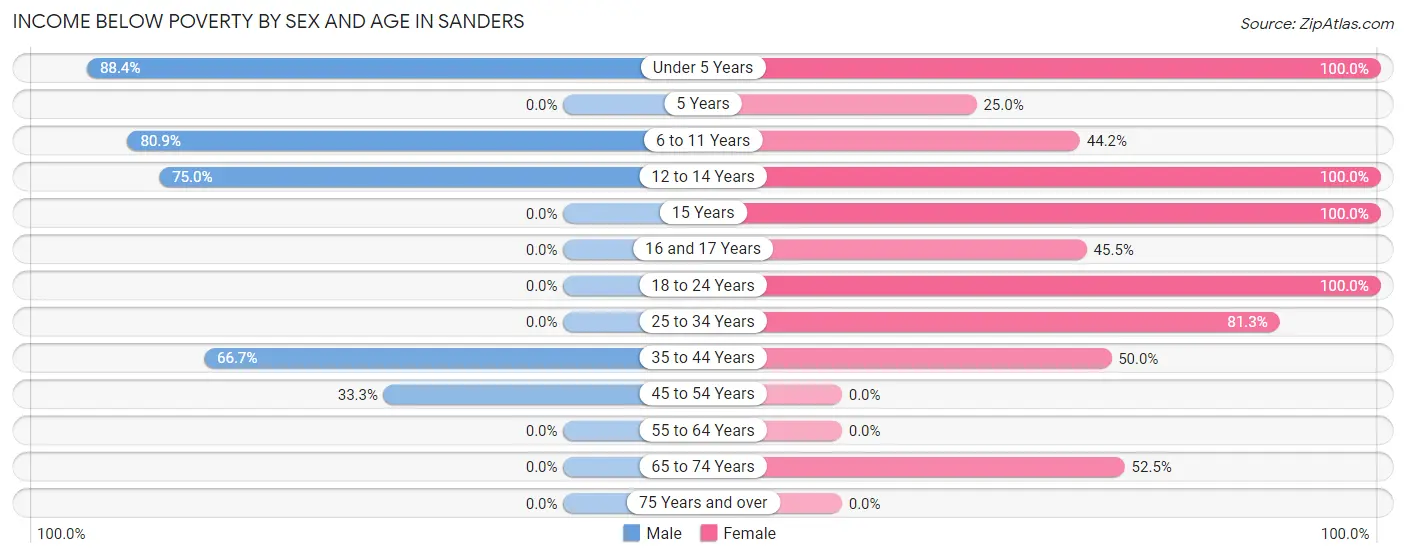
| Age Bracket | Male | Female |
| Under 5 Years | 61 (88.4%) | 9 (100.0%) |
| 5 Years | 0 (0.0%) | 5 (25.0%) |
| 6 to 11 Years | 72 (80.9%) | 19 (44.2%) |
| 12 to 14 Years | 15 (75.0%) | 5 (100.0%) |
| 15 Years | 0 (0.0%) | 5 (100.0%) |
| 16 and 17 Years | 0 (0.0%) | 5 (45.5%) |
| 18 to 24 Years | 0 (0.0%) | 17 (100.0%) |
| 25 to 34 Years | 0 (0.0%) | 13 (81.2%) |
| 35 to 44 Years | 20 (66.7%) | 24 (50.0%) |
| 45 to 54 Years | 3 (33.3%) | 0 (0.0%) |
| 55 to 64 Years | 0 (0.0%) | 0 (0.0%) |
| 65 to 74 Years | 0 (0.0%) | 21 (52.5%) |
| 75 Years and over | 0 (0.0%) | 0 (0.0%) |
| Total | 171 (52.8%) | 123 (33.1%) |
Income Above Poverty by Sex and Age in Sanders
According to the poverty statistics in Sanders, males aged 16 and 17 years and females aged 45 to 54 years are the age groups that are most secure financially, with 100.0% of males and 100.0% of females in these age groups living above the poverty line.
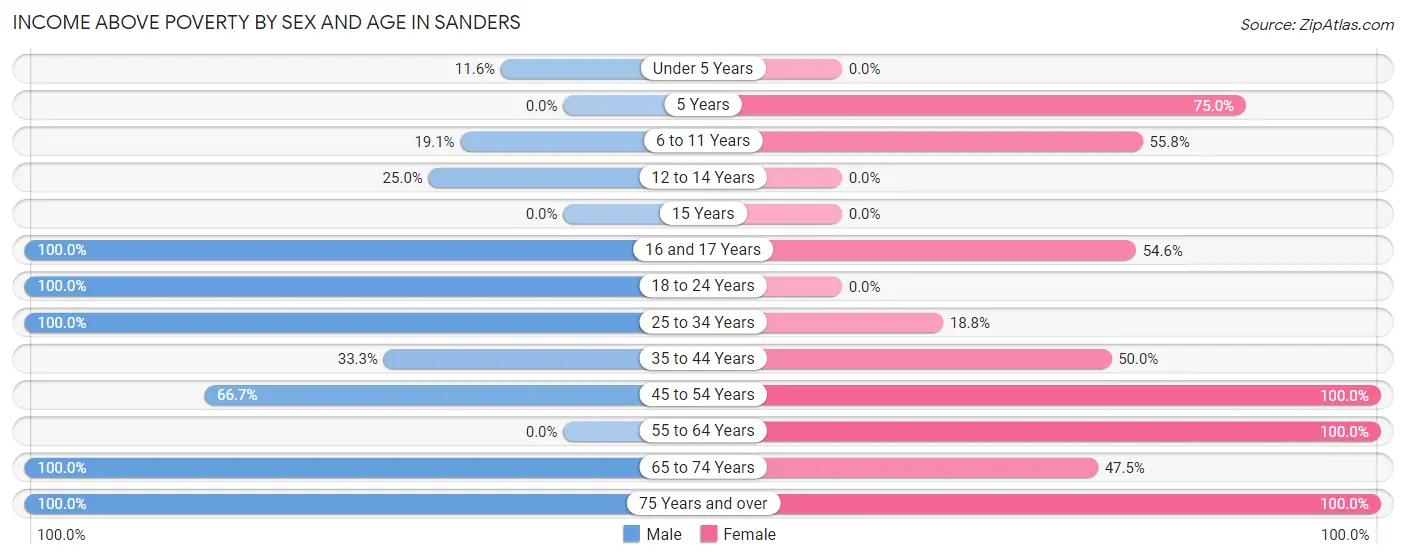
| Age Bracket | Male | Female |
| Under 5 Years | 8 (11.6%) | 0 (0.0%) |
| 5 Years | 0 (0.0%) | 15 (75.0%) |
| 6 to 11 Years | 17 (19.1%) | 24 (55.8%) |
| 12 to 14 Years | 5 (25.0%) | 0 (0.0%) |
| 15 Years | 0 (0.0%) | 0 (0.0%) |
| 16 and 17 Years | 45 (100.0%) | 6 (54.5%) |
| 18 to 24 Years | 7 (100.0%) | 0 (0.0%) |
| 25 to 34 Years | 25 (100.0%) | 3 (18.8%) |
| 35 to 44 Years | 10 (33.3%) | 24 (50.0%) |
| 45 to 54 Years | 6 (66.7%) | 127 (100.0%) |
| 55 to 64 Years | 0 (0.0%) | 17 (100.0%) |
| 65 to 74 Years | 28 (100.0%) | 19 (47.5%) |
| 75 Years and over | 2 (100.0%) | 14 (100.0%) |
| Total | 153 (47.2%) | 249 (66.9%) |
Income Below Poverty Among Married-Couple Families in Sanders
The poverty statistics for married-couple families in Sanders show that 39.5% or 17 of the total 43 families live below the poverty line. Families with 3 or 4 children have the highest poverty rate of 100.0%, comprising of 17 families. On the other hand, families with no children have the lowest poverty rate of 0.0%, which includes 0 families.
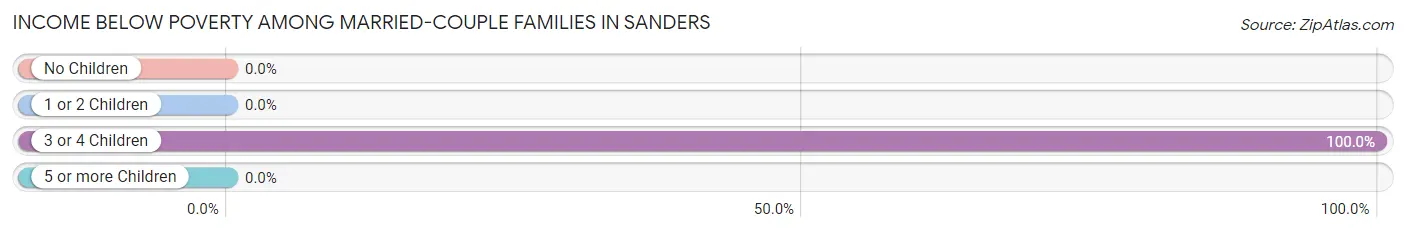
| Children | Above Poverty | Below Poverty |
| No Children | 13 (100.0%) | 0 (0.0%) |
| 1 or 2 Children | 13 (100.0%) | 0 (0.0%) |
| 3 or 4 Children | 0 (0.0%) | 17 (100.0%) |
| 5 or more Children | 0 (0.0%) | 0 (0.0%) |
| Total | 26 (60.5%) | 17 (39.5%) |
Income Below Poverty Among Single-Parent Households in Sanders
According to the poverty data in Sanders, 100.0% or 3 single-father households and 29.4% or 43 single-mother households are living below the poverty line. Among single-father households, those with 3 or 4 children have the highest poverty rate, with 3 households (100.0%) experiencing poverty. Likewise, among single-mother households, those with 5 or more children have the highest poverty rate, with 4 households (100.0%) falling below the poverty line.
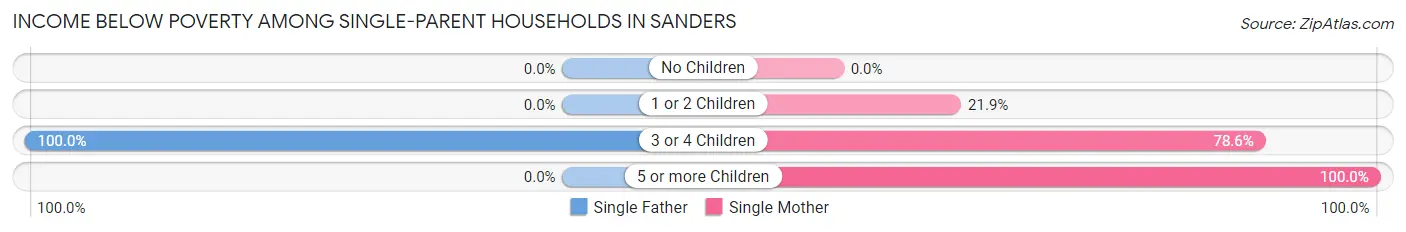
| Children | Single Father | Single Mother |
| No Children | 0 (0.0%) | 0 (0.0%) |
| 1 or 2 Children | 0 (0.0%) | 28 (21.9%) |
| 3 or 4 Children | 3 (100.0%) | 11 (78.6%) |
| 5 or more Children | 0 (0.0%) | 4 (100.0%) |
| Total | 3 (100.0%) | 43 (29.4%) |
Income Below Poverty Among Married-Couple vs Single-Parent Households in Sanders
The poverty data for Sanders shows that 17 of the married-couple family households (39.5%) and 46 of the single-parent households (30.9%) are living below the poverty level. Within the married-couple family households, those with 3 or 4 children have the highest poverty rate, with 17 households (100.0%) falling below the poverty line. Among the single-parent households, those with 5 or more children have the highest poverty rate, with 4 household (100.0%) living below poverty.
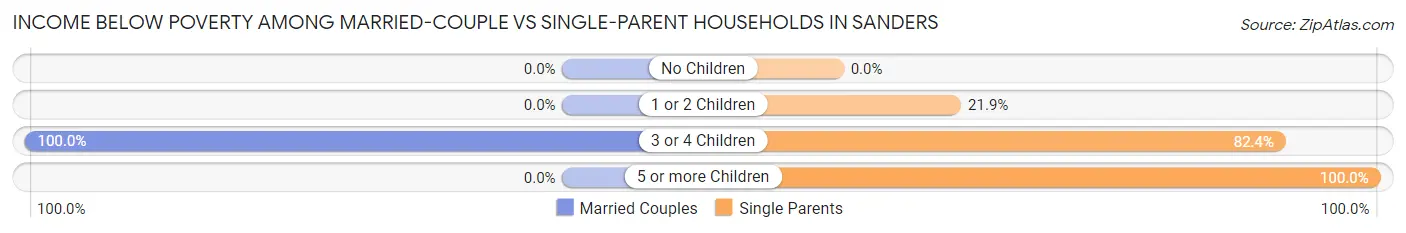
| Children | Married-Couple Families | Single-Parent Households |
| No Children | 0 (0.0%) | 0 (0.0%) |
| 1 or 2 Children | 0 (0.0%) | 28 (21.9%) |
| 3 or 4 Children | 17 (100.0%) | 14 (82.4%) |
| 5 or more Children | 0 (0.0%) | 4 (100.0%) |
| Total | 17 (39.5%) | 46 (30.9%) |
Race in Sanders
The most populous races in Sanders are Native / Alaskan (689 | 99.0%), and White / Caucasian (7 | 1.0%).
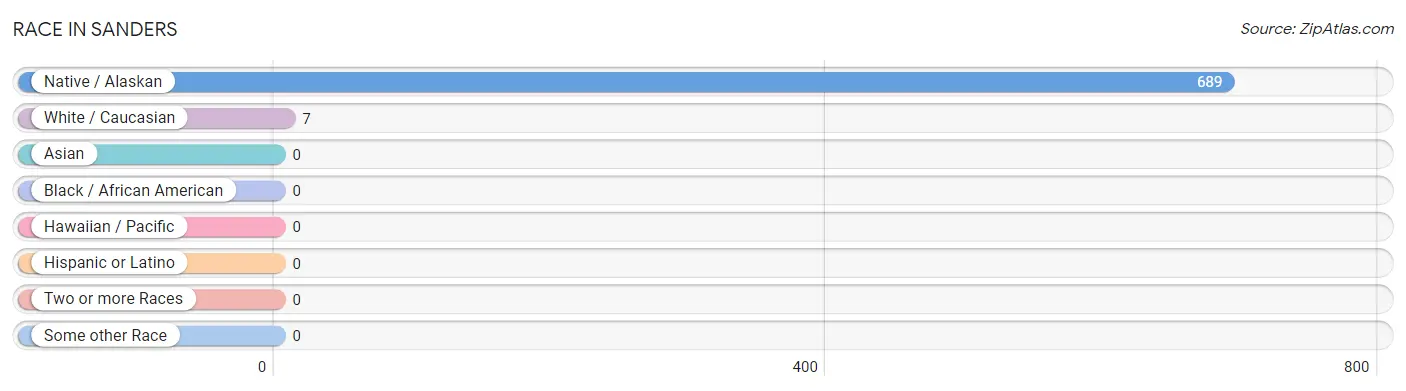
| Race | # Population | % Population |
| Asian | 0 | 0.0% |
| Black / African American | 0 | 0.0% |
| Hawaiian / Pacific | 0 | 0.0% |
| Hispanic or Latino | 0 | 0.0% |
| Native / Alaskan | 689 | 99.0% |
| White / Caucasian | 7 | 1.0% |
| Two or more Races | 0 | 0.0% |
| Some other Race | 0 | 0.0% |
| Total | 696 | 100.0% |
Ancestry in Sanders
The most populous ancestries reported in Sanders are Navajo (674 | 96.8%), and English (7 | 1.0%), together accounting for 97.9% of all Sanders residents.
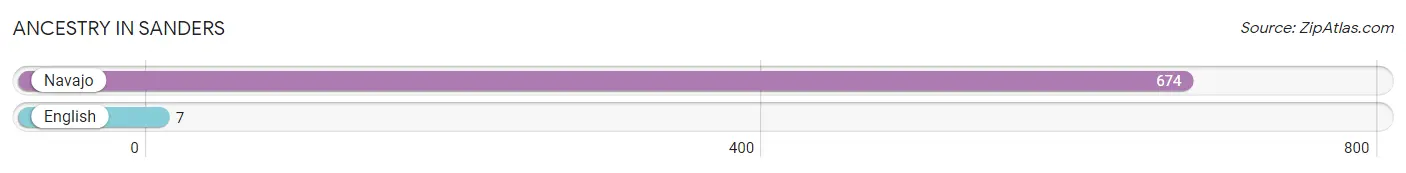
| Ancestry | # Population | % Population |
| English | 7 | 1.0% |
| Navajo | 674 | 96.8% | View All 2 Rows |
Immigrants in Sanders

| Immigration Origin | # Population | % Population | View All 0 Rows |
Sex and Age in Sanders
Sex and Age in Sanders
The most populous age groups in Sanders are Under 5 Years (69 | 21.3%) for men and 45 to 49 Years (93 | 25.0%) for women.
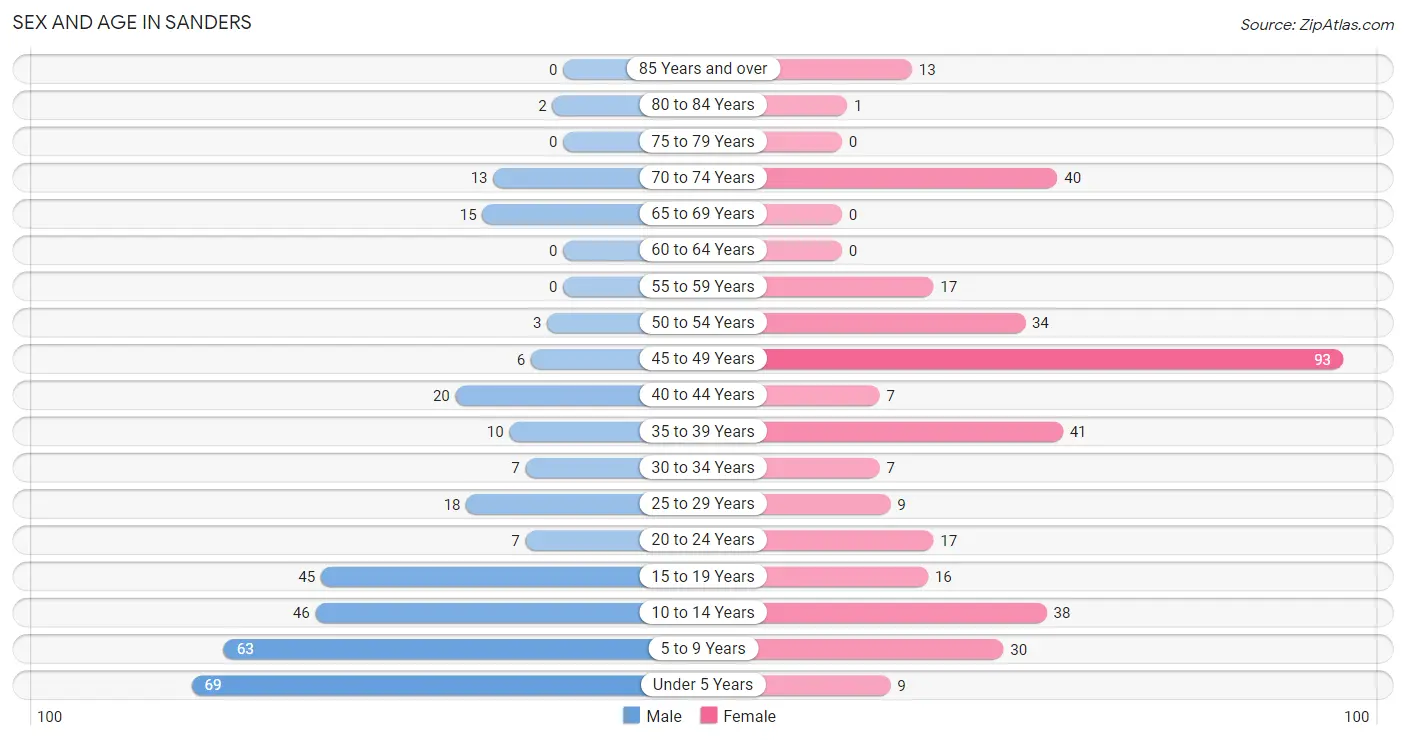
| Age Bracket | Male | Female |
| Under 5 Years | 69 (21.3%) | 9 (2.4%) |
| 5 to 9 Years | 63 (19.4%) | 30 (8.1%) |
| 10 to 14 Years | 46 (14.2%) | 38 (10.2%) |
| 15 to 19 Years | 45 (13.9%) | 16 (4.3%) |
| 20 to 24 Years | 7 (2.2%) | 17 (4.6%) |
| 25 to 29 Years | 18 (5.6%) | 9 (2.4%) |
| 30 to 34 Years | 7 (2.2%) | 7 (1.9%) |
| 35 to 39 Years | 10 (3.1%) | 41 (11.0%) |
| 40 to 44 Years | 20 (6.2%) | 7 (1.9%) |
| 45 to 49 Years | 6 (1.8%) | 93 (25.0%) |
| 50 to 54 Years | 3 (0.9%) | 34 (9.1%) |
| 55 to 59 Years | 0 (0.0%) | 17 (4.6%) |
| 60 to 64 Years | 0 (0.0%) | 0 (0.0%) |
| 65 to 69 Years | 15 (4.6%) | 0 (0.0%) |
| 70 to 74 Years | 13 (4.0%) | 40 (10.7%) |
| 75 to 79 Years | 0 (0.0%) | 0 (0.0%) |
| 80 to 84 Years | 2 (0.6%) | 1 (0.3%) |
| 85 Years and over | 0 (0.0%) | 13 (3.5%) |
| Total | 324 (100.0%) | 372 (100.0%) |
Families and Households in Sanders
Median Family Size in Sanders
The median family size in Sanders is 3.17 persons per family, with single male/father families (3 | 1.6%) accounting for the largest median family size of 6 persons per family. On the other hand, single female/mother families (146 | 76.0%) represent the smallest median family size with 2.45 persons per family.
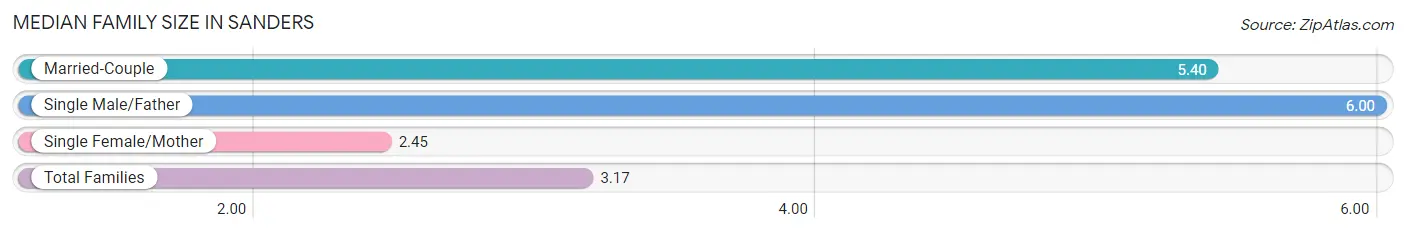
| Family Type | # Families | Family Size |
| Married-Couple | 43 (22.4%) | 5.40 |
| Single Male/Father | 3 (1.6%) | 6.00 |
| Single Female/Mother | 146 (76.0%) | 2.45 |
| Total Families | 192 (100.0%) | 3.17 |
Median Household Size in Sanders
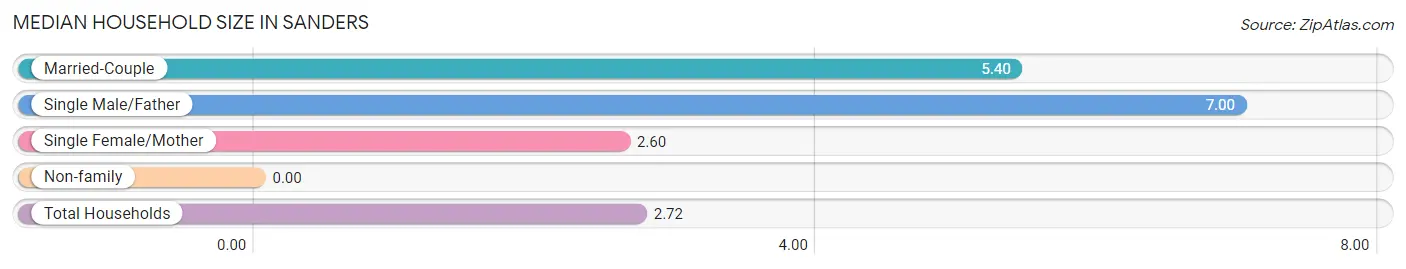
| Household Type | # Households | Household Size |
| Married-Couple | 43 (16.8%) | 5.40 |
| Single Male/Father | 3 (1.2%) | 7.00 |
| Single Female/Mother | 146 (57.0%) | 2.60 |
| Non-family | 64 (25.0%) | - |
| Total Households | 256 (100.0%) | 2.72 |
Household Size by Marriage Status in Sanders
Out of a total of 256 households in Sanders, 192 (75.0%) are family households, while 64 (25.0%) are nonfamily households. The most numerous type of family households are 2-person households, comprising 108, and the most common type of nonfamily households are 1-person households, comprising 64.
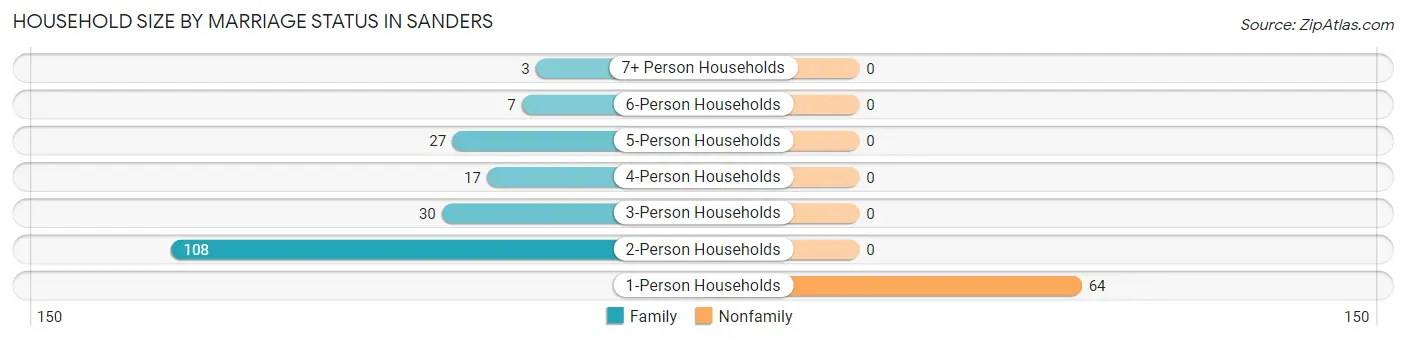
| Household Size | Family Households | Nonfamily Households |
| 1-Person Households | - | 64 (25.0%) |
| 2-Person Households | 108 (42.2%) | 0 (0.0%) |
| 3-Person Households | 30 (11.7%) | 0 (0.0%) |
| 4-Person Households | 17 (6.6%) | 0 (0.0%) |
| 5-Person Households | 27 (10.5%) | 0 (0.0%) |
| 6-Person Households | 7 (2.7%) | 0 (0.0%) |
| 7+ Person Households | 3 (1.2%) | 0 (0.0%) |
| Total | 192 (75.0%) | 64 (25.0%) |
Female Fertility in Sanders
Fertility by Age in Sanders
Average fertility rate in Sanders is 21.0 births per 1,000 women. Women in the age bracket of 20 to 34 years have the highest fertility rate with 121.0 births per 1,000 women. Women in the age bracket of 20 to 34 years acount for 100.0% of all women with births.
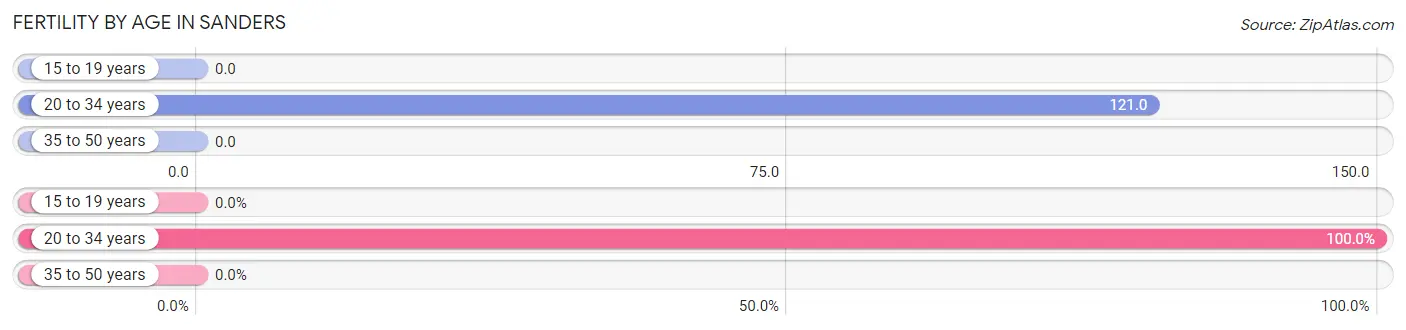
| Age Bracket | Women with Births | Births / 1,000 Women |
| 15 to 19 years | 0 (0.0%) | 0.0 |
| 20 to 34 years | 4 (100.0%) | 121.0 |
| 35 to 50 years | 0 (0.0%) | 0.0 |
| Total | 4 (100.0%) | 21.0 |
Fertility by Age by Marriage Status in Sanders
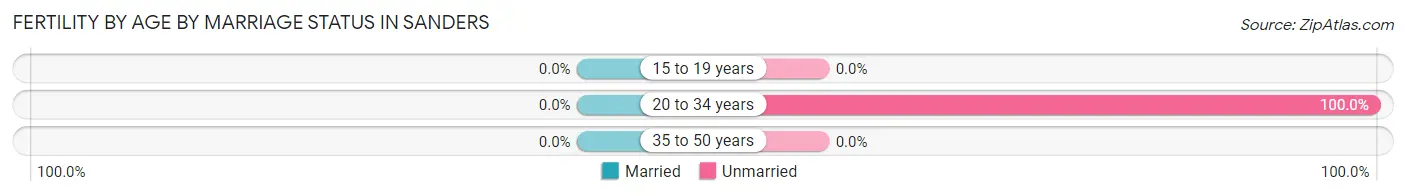
| Age Bracket | Married | Unmarried |
| 15 to 19 years | 0 (0.0%) | 0 (0.0%) |
| 20 to 34 years | 0 (0.0%) | 4 (100.0%) |
| 35 to 50 years | 0 (0.0%) | 0 (0.0%) |
| Total | 0 (0.0%) | 4 (100.0%) |
Fertility by Education in Sanders
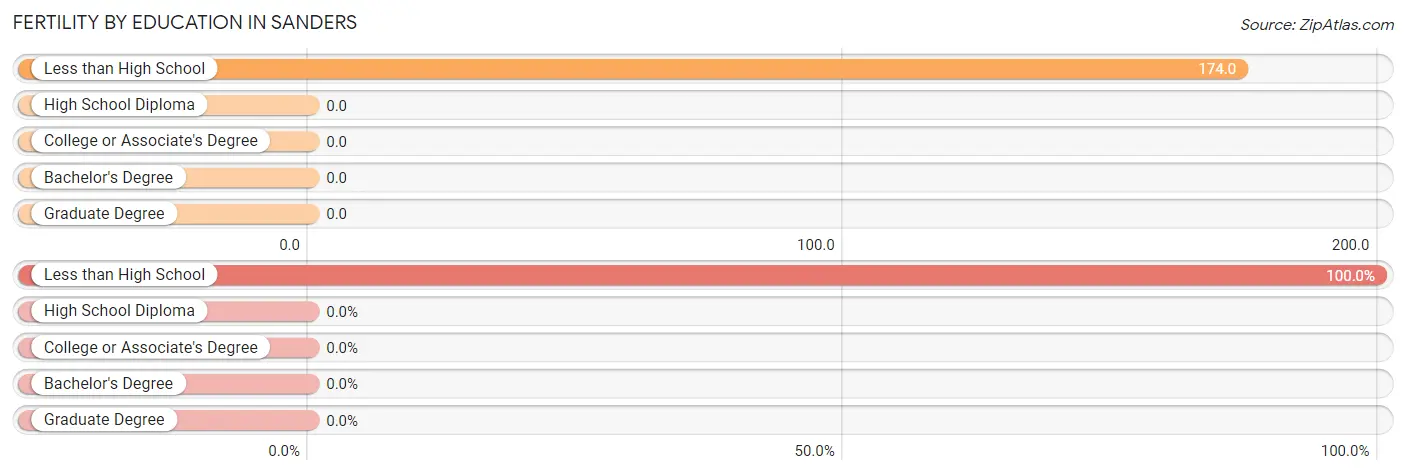
| Educational Attainment | Women with Births | Births / 1,000 Women |
| Less than High School | 4 (100.0%) | 174.0 |
| High School Diploma | 0 (0.0%) | 0.0 |
| College or Associate's Degree | 0 (0.0%) | 0.0 |
| Bachelor's Degree | 0 (0.0%) | 0.0 |
| Graduate Degree | 0 (0.0%) | 0.0 |
| Total | 4 (100.0%) | 21.0 |
Fertility by Education by Marriage Status in Sanders
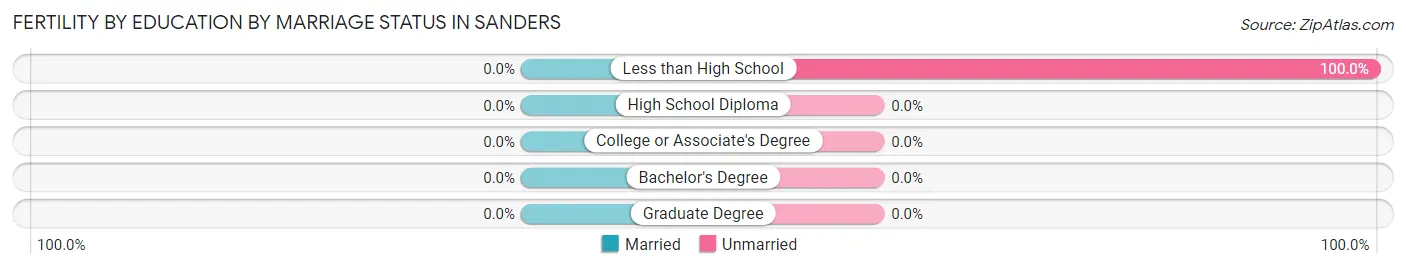
| Educational Attainment | Married | Unmarried |
| Less than High School | 0 (0.0%) | 4 (100.0%) |
| High School Diploma | 0 (0.0%) | 0 (0.0%) |
| College or Associate's Degree | 0 (0.0%) | 0 (0.0%) |
| Bachelor's Degree | 0 (0.0%) | 0 (0.0%) |
| Graduate Degree | 0 (0.0%) | 0 (0.0%) |
| Total | 0 (0.0%) | 4 (100.0%) |
Employment Characteristics in Sanders
Employment by Class of Employer in Sanders
Among the 236 employed individuals in Sanders, state government employees (138 | 58.5%), private company employees (73 | 30.9%), and federal government employees (15 | 6.4%) make up the most common classes of employment.
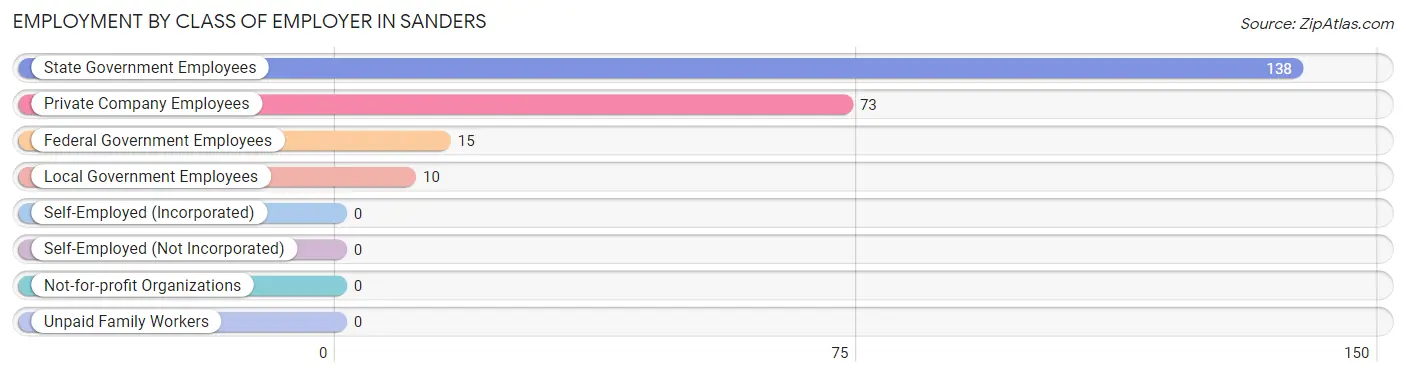
| Employer Class | # Employees | % Employees |
| Private Company Employees | 73 | 30.9% |
| Self-Employed (Incorporated) | 0 | 0.0% |
| Self-Employed (Not Incorporated) | 0 | 0.0% |
| Not-for-profit Organizations | 0 | 0.0% |
| Local Government Employees | 10 | 4.2% |
| State Government Employees | 138 | 58.5% |
| Federal Government Employees | 15 | 6.4% |
| Unpaid Family Workers | 0 | 0.0% |
| Total | 236 | 100.0% |
Employment Status by Age in Sanders
According to the labor force statistics for Sanders, out of the total population over 16 years of age (436), 54.8% or 239 individuals are in the labor force, with 1.3% or 3 of them unemployed. The age group with the highest labor force participation rate is 25 to 29 years, with 85.2% or 23 individuals in the labor force. Within the labor force, the 35 to 44 years age range has the highest percentage of unemployed individuals, with 5.6% or 3 of them being unemployed.
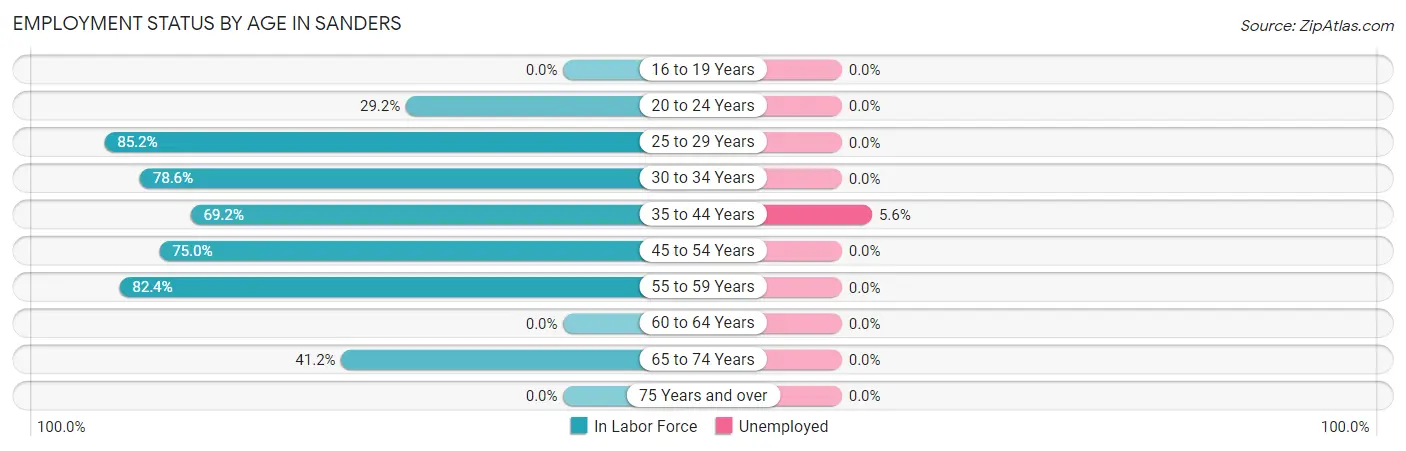
| Age Bracket | In Labor Force | Unemployed |
| 16 to 19 Years | 0 (0.0%) | 0 (0.0%) |
| 20 to 24 Years | 7 (29.2%) | 0 (0.0%) |
| 25 to 29 Years | 23 (85.2%) | 0 (0.0%) |
| 30 to 34 Years | 11 (78.6%) | 0 (0.0%) |
| 35 to 44 Years | 54 (69.2%) | 3 (5.6%) |
| 45 to 54 Years | 102 (75.0%) | 0 (0.0%) |
| 55 to 59 Years | 14 (82.4%) | 0 (0.0%) |
| 60 to 64 Years | 0 (0.0%) | 0 (0.0%) |
| 65 to 74 Years | 28 (41.2%) | 0 (0.0%) |
| 75 Years and over | 0 (0.0%) | 0 (0.0%) |
| Total | 239 (54.8%) | 3 (1.3%) |
Employment Status by Educational Attainment in Sanders
According to labor force statistics for Sanders, 75.0% of individuals (204) out of the total population between 25 and 64 years of age (272) are in the labor force, with 1.5% or 3 of them being unemployed. The group with the highest labor force participation rate are those with the educational attainment of college / associate degree, with 85.4% or 41 individuals in the labor force. Within the labor force, individuals with less than high school education have the highest percentage of unemployment, with 12.5% or 3 of them being unemployed.
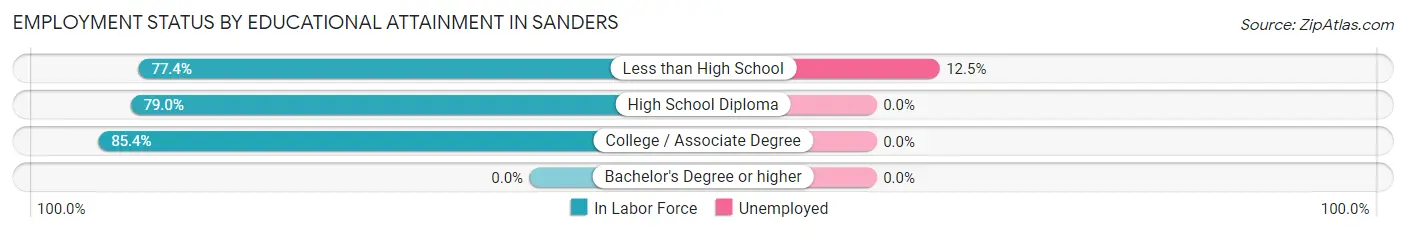
| Educational Attainment | In Labor Force | Unemployed |
| Less than High School | 24 (77.4%) | 4 (12.5%) |
| High School Diploma | 139 (79.0%) | 0 (0.0%) |
| College / Associate Degree | 41 (85.4%) | 0 (0.0%) |
| Bachelor's Degree or higher | 0 (0.0%) | 0 (0.0%) |
| Total | 204 (75.0%) | 4 (1.5%) |
Employment Occupations by Sex in Sanders
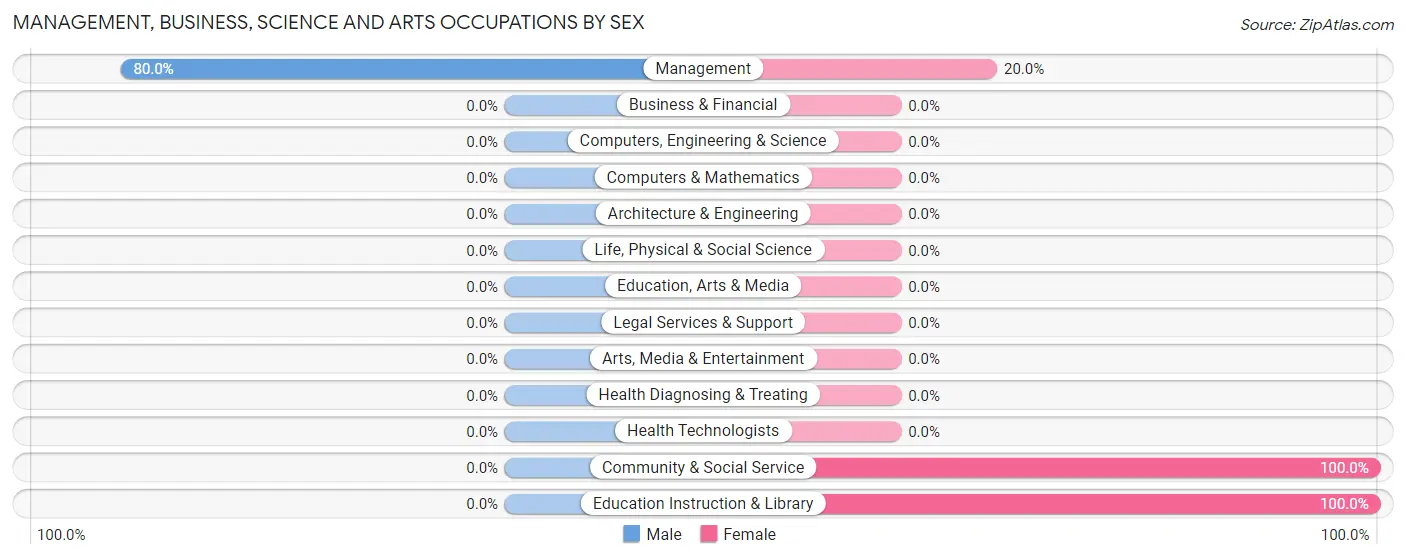
Management, Business, Science and Arts Occupations
The most common Management, Business, Science and Arts occupations in Sanders are Community & Social Service (93 | 39.4%), Education Instruction & Library (93 | 39.4%), and Management (35 | 14.8%).
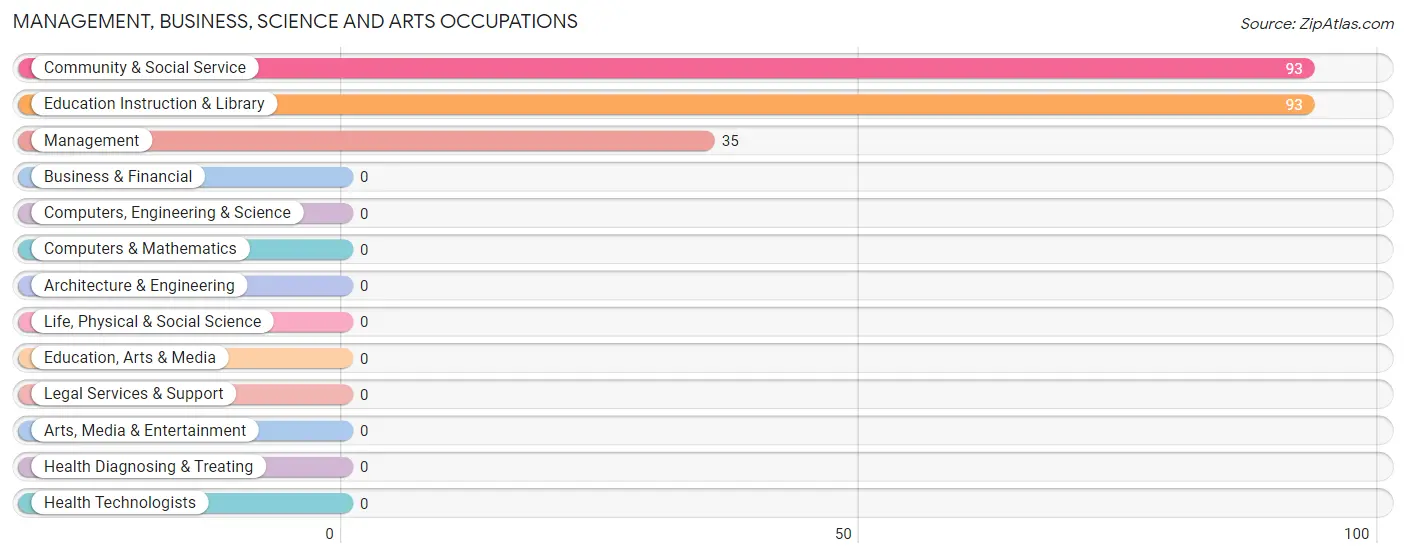
Management, Business, Science and Arts Occupations by Sex
| Occupation | Male | Female |
| Management | 28 (80.0%) | 7 (20.0%) |
| Business & Financial | 0 (0.0%) | 0 (0.0%) |
| Computers, Engineering & Science | 0 (0.0%) | 0 (0.0%) |
| Computers & Mathematics | 0 (0.0%) | 0 (0.0%) |
| Architecture & Engineering | 0 (0.0%) | 0 (0.0%) |
| Life, Physical & Social Science | 0 (0.0%) | 0 (0.0%) |
| Community & Social Service | 0 (0.0%) | 93 (100.0%) |
| Education, Arts & Media | 0 (0.0%) | 0 (0.0%) |
| Legal Services & Support | 0 (0.0%) | 0 (0.0%) |
| Education Instruction & Library | 0 (0.0%) | 93 (100.0%) |
| Arts, Media & Entertainment | 0 (0.0%) | 0 (0.0%) |
| Health Diagnosing & Treating | 0 (0.0%) | 0 (0.0%) |
| Health Technologists | 0 (0.0%) | 0 (0.0%) |
| Total (Category) | 28 (21.9%) | 100 (78.1%) |
| Total (Overall) | 93 (39.4%) | 143 (60.6%) |
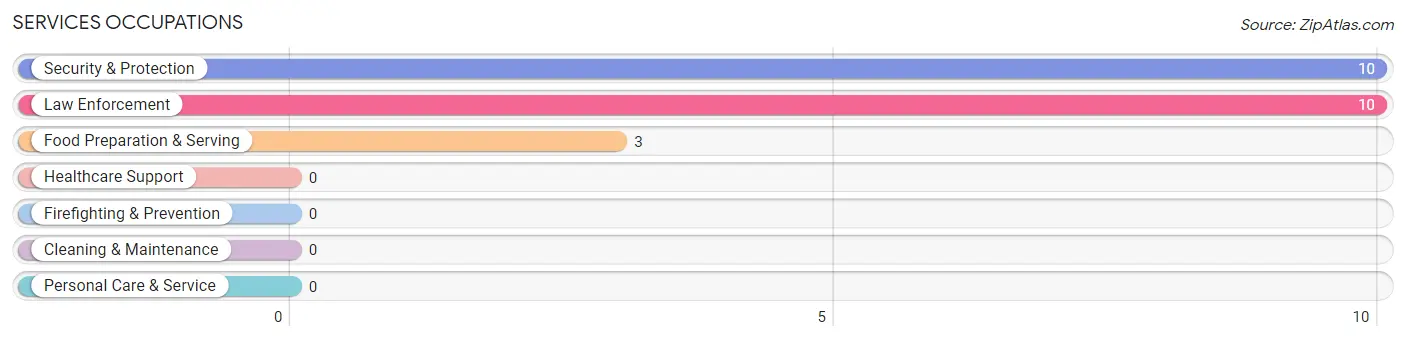
Services Occupations
The most common Services occupations in Sanders are Security & Protection (10 | 4.2%), Law Enforcement (10 | 4.2%), and Food Preparation & Serving (3 | 1.3%).
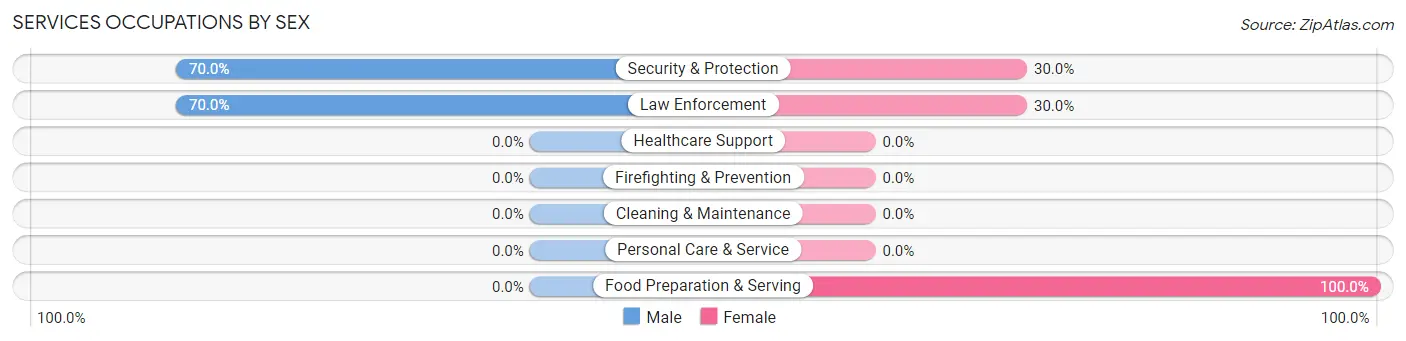
Services Occupations by Sex
Within the Services occupations in Sanders, the most male-oriented occupations are Security & Protection (70.0%), and Law Enforcement (70.0%), while the most female-oriented occupations are Food Preparation & Serving (100.0%), Security & Protection (30.0%), and Law Enforcement (30.0%).
| Occupation | Male | Female |
| Healthcare Support | 0 (0.0%) | 0 (0.0%) |
| Security & Protection | 7 (70.0%) | 3 (30.0%) |
| Firefighting & Prevention | 0 (0.0%) | 0 (0.0%) |
| Law Enforcement | 7 (70.0%) | 3 (30.0%) |
| Food Preparation & Serving | 0 (0.0%) | 3 (100.0%) |
| Cleaning & Maintenance | 0 (0.0%) | 0 (0.0%) |
| Personal Care & Service | 0 (0.0%) | 0 (0.0%) |
| Total (Category) | 7 (53.8%) | 6 (46.2%) |
| Total (Overall) | 93 (39.4%) | 143 (60.6%) |
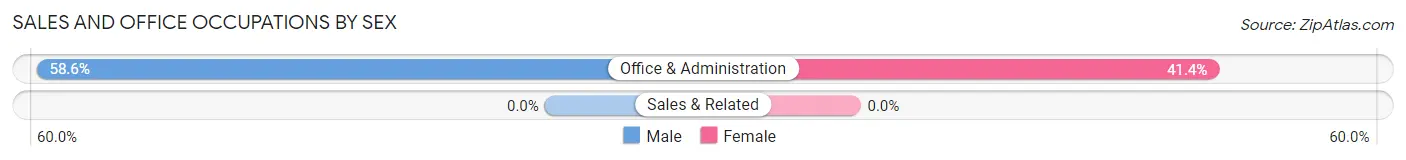
Sales and Office Occupations
The most common Sales and Office occupations in Sanders are , and Office & Administration (29 | 12.3%).
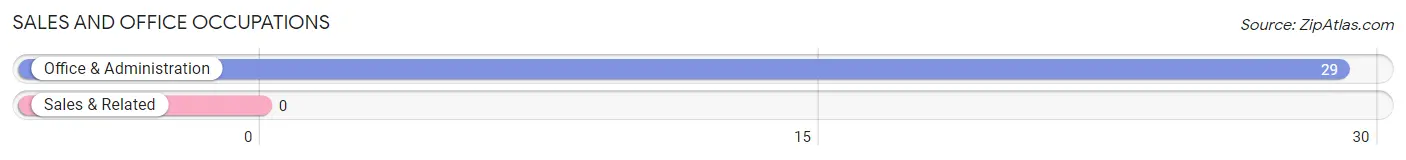
Sales and Office Occupations by Sex
| Occupation | Male | Female |
| Sales & Related | 0 (0.0%) | 0 (0.0%) |
| Office & Administration | 17 (58.6%) | 12 (41.4%) |
| Total (Category) | 17 (58.6%) | 12 (41.4%) |
| Total (Overall) | 93 (39.4%) | 143 (60.6%) |
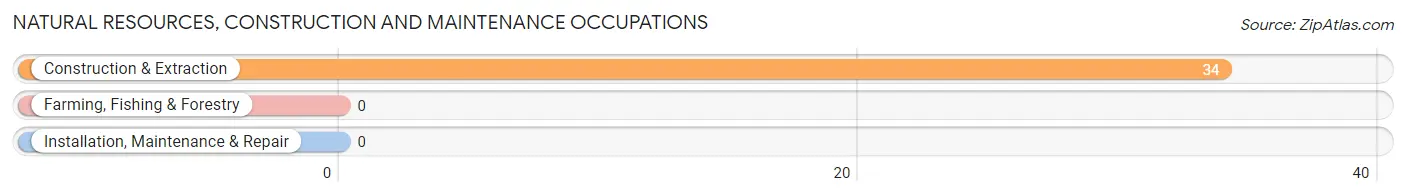
Natural Resources, Construction and Maintenance Occupations
The most common Natural Resources, Construction and Maintenance occupations in Sanders are , and Construction & Extraction (34 | 14.4%).
Natural Resources, Construction and Maintenance Occupations by Sex
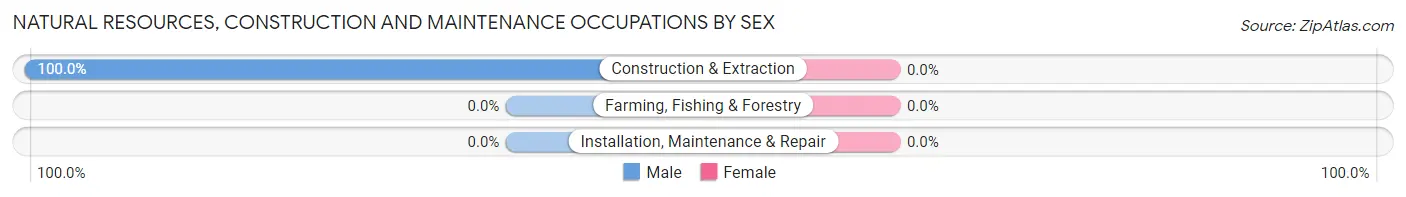
| Occupation | Male | Female |
| Farming, Fishing & Forestry | 0 (0.0%) | 0 (0.0%) |
| Construction & Extraction | 34 (100.0%) | 0 (0.0%) |
| Installation, Maintenance & Repair | 0 (0.0%) | 0 (0.0%) |
| Total (Category) | 34 (100.0%) | 0 (0.0%) |
| Total (Overall) | 93 (39.4%) | 143 (60.6%) |
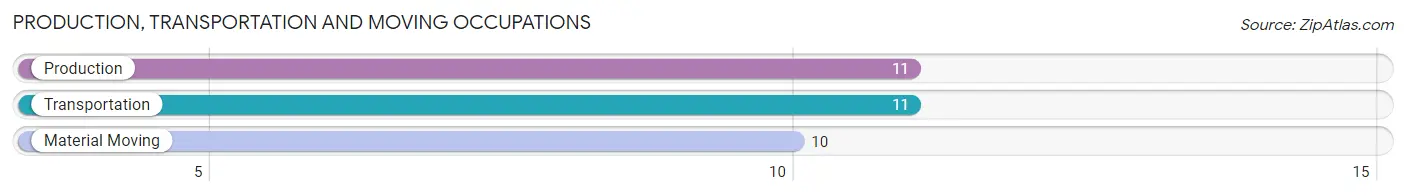
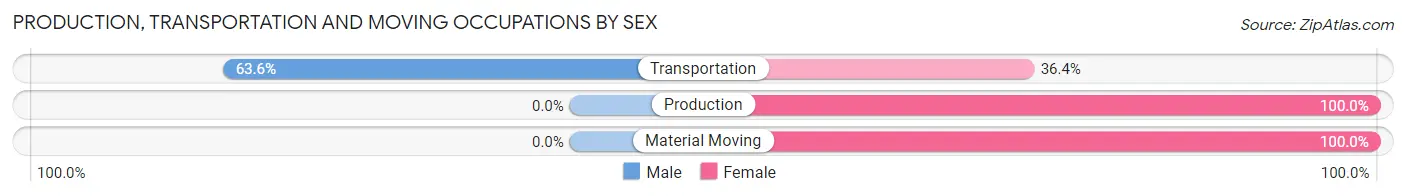
Production, Transportation and Moving Occupations
The most common Production, Transportation and Moving occupations in Sanders are Production (11 | 4.7%), Transportation (11 | 4.7%), and Material Moving (10 | 4.2%).
Production, Transportation and Moving Occupations by Sex
| Occupation | Male | Female |
| Production | 0 (0.0%) | 11 (100.0%) |
| Transportation | 7 (63.6%) | 4 (36.4%) |
| Material Moving | 0 (0.0%) | 10 (100.0%) |
| Total (Category) | 7 (21.9%) | 25 (78.1%) |
| Total (Overall) | 93 (39.4%) | 143 (60.6%) |
Employment Industries by Sex in Sanders
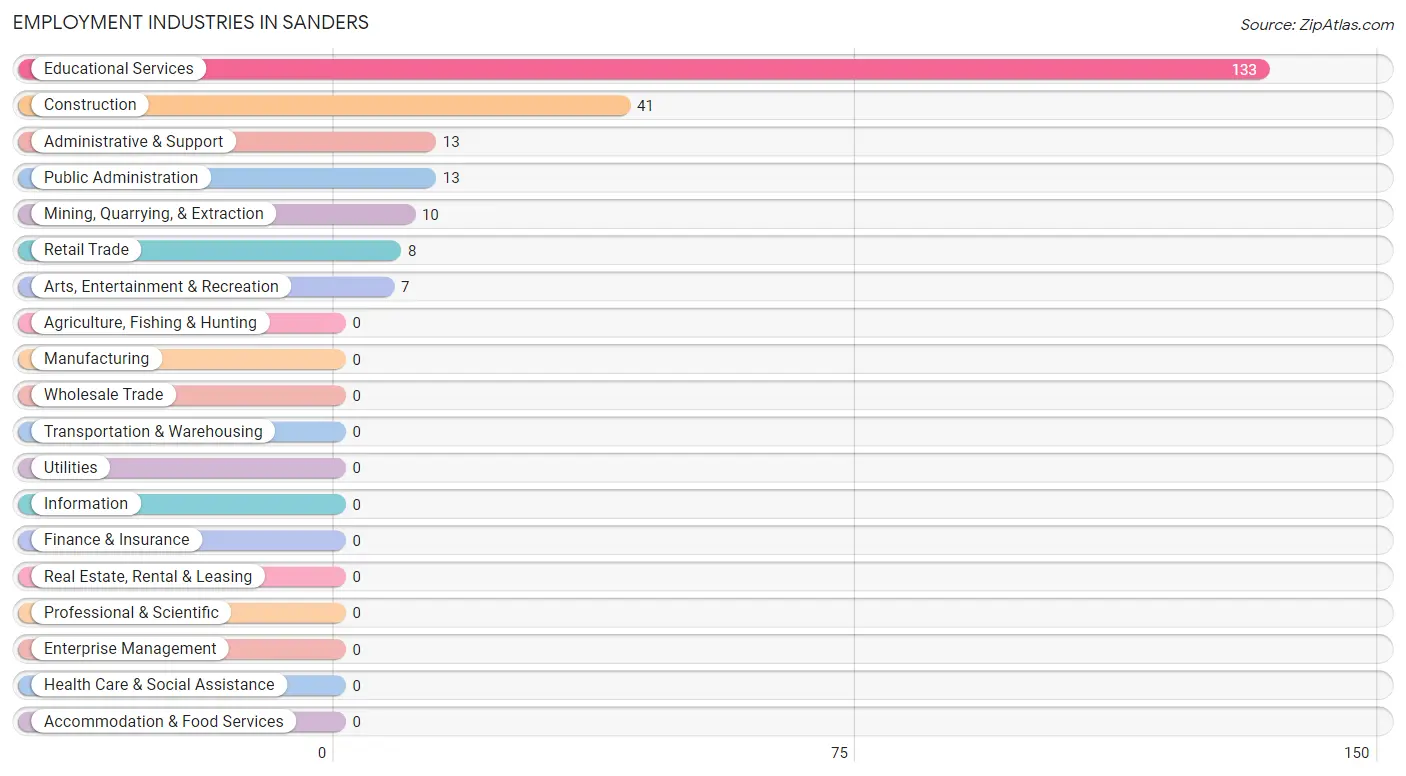
Employment Industries in Sanders
The major employment industries in Sanders include Educational Services (133 | 56.4%), Construction (41 | 17.4%), Administrative & Support (13 | 5.5%), Public Administration (13 | 5.5%), and Mining, Quarrying, & Extraction (10 | 4.2%).
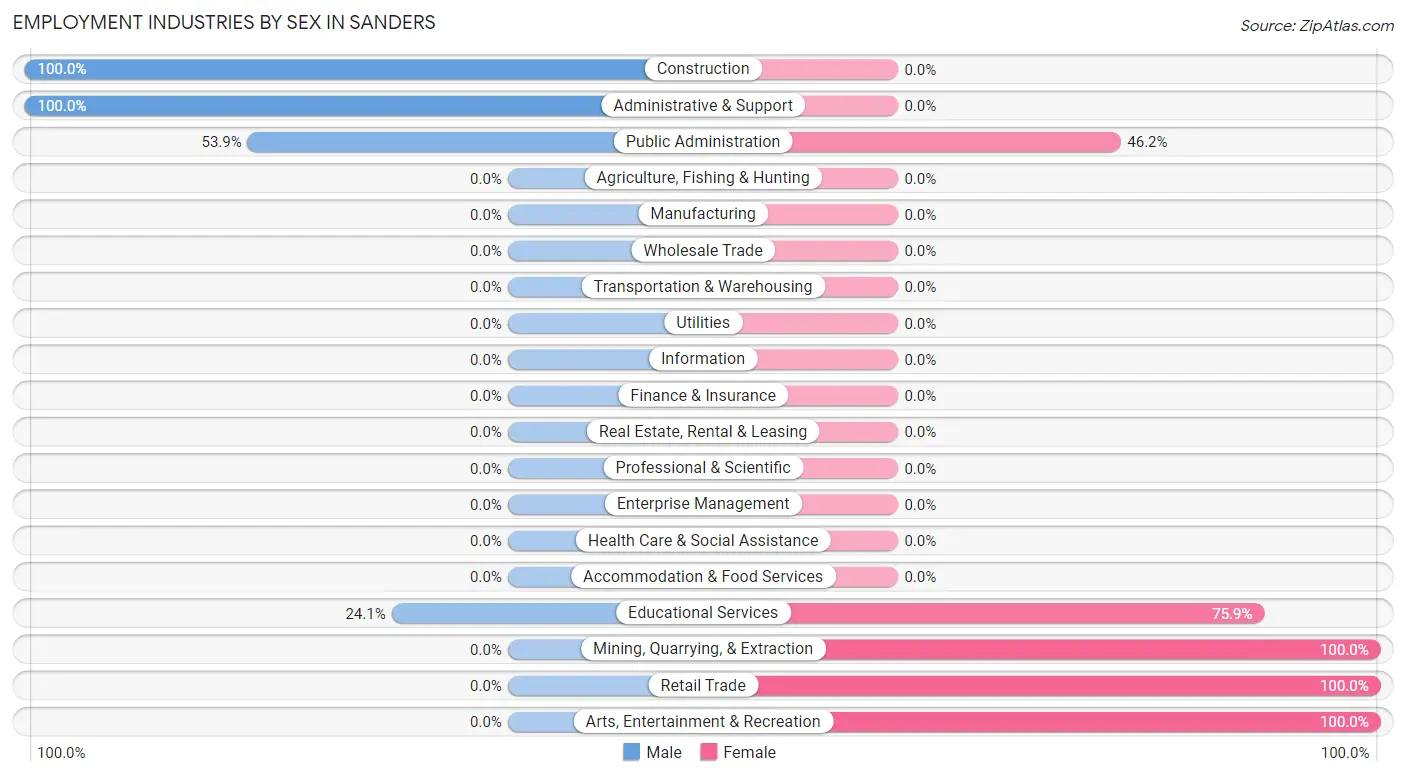
Employment Industries by Sex in Sanders
The Sanders industries that see more men than women are Construction (100.0%), Administrative & Support (100.0%), and Public Administration (53.8%), whereas the industries that tend to have a higher number of women are Mining, Quarrying, & Extraction (100.0%), Retail Trade (100.0%), and Arts, Entertainment & Recreation (100.0%).
| Industry | Male | Female |
| Agriculture, Fishing & Hunting | 0 (0.0%) | 0 (0.0%) |
| Mining, Quarrying, & Extraction | 0 (0.0%) | 10 (100.0%) |
| Construction | 41 (100.0%) | 0 (0.0%) |
| Manufacturing | 0 (0.0%) | 0 (0.0%) |
| Wholesale Trade | 0 (0.0%) | 0 (0.0%) |
| Retail Trade | 0 (0.0%) | 8 (100.0%) |
| Transportation & Warehousing | 0 (0.0%) | 0 (0.0%) |
| Utilities | 0 (0.0%) | 0 (0.0%) |
| Information | 0 (0.0%) | 0 (0.0%) |
| Finance & Insurance | 0 (0.0%) | 0 (0.0%) |
| Real Estate, Rental & Leasing | 0 (0.0%) | 0 (0.0%) |
| Professional & Scientific | 0 (0.0%) | 0 (0.0%) |
| Enterprise Management | 0 (0.0%) | 0 (0.0%) |
| Administrative & Support | 13 (100.0%) | 0 (0.0%) |
| Educational Services | 32 (24.1%) | 101 (75.9%) |
| Health Care & Social Assistance | 0 (0.0%) | 0 (0.0%) |
| Arts, Entertainment & Recreation | 0 (0.0%) | 7 (100.0%) |
| Accommodation & Food Services | 0 (0.0%) | 0 (0.0%) |
| Public Administration | 7 (53.8%) | 6 (46.2%) |
| Total | 93 (39.4%) | 143 (60.6%) |
Education in Sanders
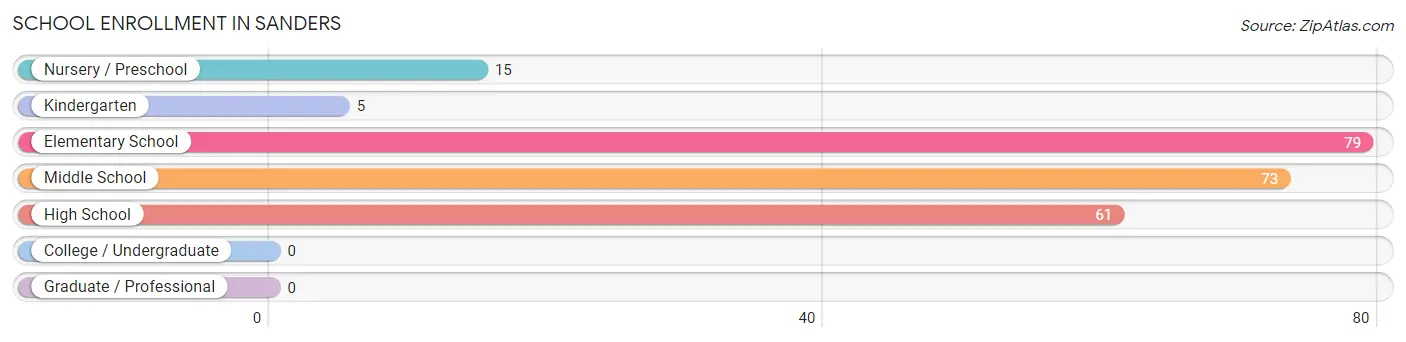
School Enrollment in Sanders
The most common levels of schooling among the 233 students in Sanders are elementary school (79 | 33.9%), middle school (73 | 31.3%), and high school (61 | 26.2%).
| School Level | # Students | % Students |
| Nursery / Preschool | 15 | 6.4% |
| Kindergarten | 5 | 2.1% |
| Elementary School | 79 | 33.9% |
| Middle School | 73 | 31.3% |
| High School | 61 | 26.2% |
| College / Undergraduate | 0 | 0.0% |
| Graduate / Professional | 0 | 0.0% |
| Total | 233 | 100.0% |
School Enrollment by Age by Funding Source in Sanders
Out of a total of 233 students who are enrolled in schools in Sanders, 15 (6.4%) attend a private institution, while the remaining 218 (93.6%) are enrolled in public schools. The age group of 5 to 9 year old has the highest likelihood of being enrolled in private schools, with 15 (16.1% in the age bracket) enrolled. Conversely, the age group of 10 to 14 year olds has the lowest likelihood of being enrolled in a private school, with 79 (100.0% in the age bracket) attending a public institution.
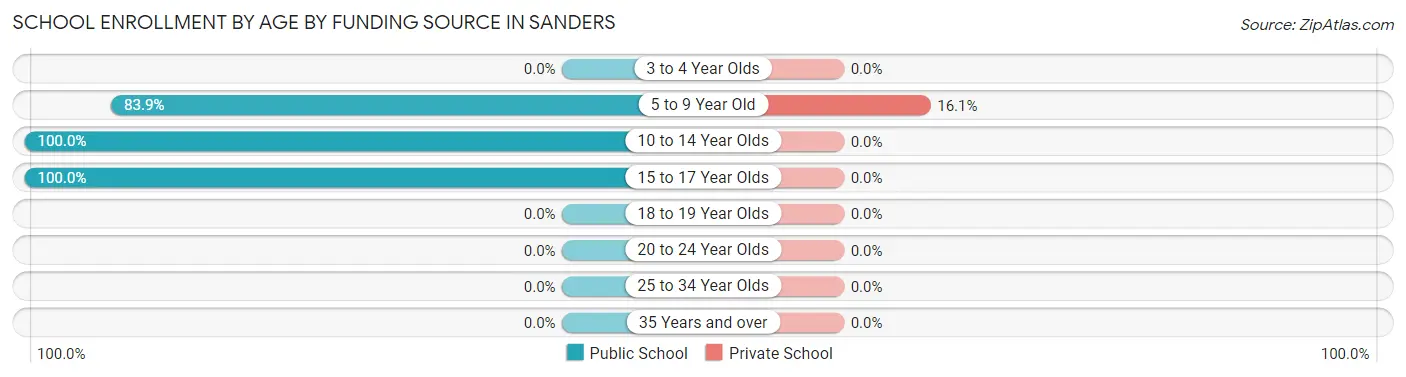
| Age Bracket | Public School | Private School |
| 3 to 4 Year Olds | 0 (0.0%) | 0 (0.0%) |
| 5 to 9 Year Old | 78 (83.9%) | 15 (16.1%) |
| 10 to 14 Year Olds | 79 (100.0%) | 0 (0.0%) |
| 15 to 17 Year Olds | 61 (100.0%) | 0 (0.0%) |
| 18 to 19 Year Olds | 0 (0.0%) | 0 (0.0%) |
| 20 to 24 Year Olds | 0 (0.0%) | 0 (0.0%) |
| 25 to 34 Year Olds | 0 (0.0%) | 0 (0.0%) |
| 35 Years and over | 0 (0.0%) | 0 (0.0%) |
| Total | 218 (93.6%) | 15 (6.4%) |
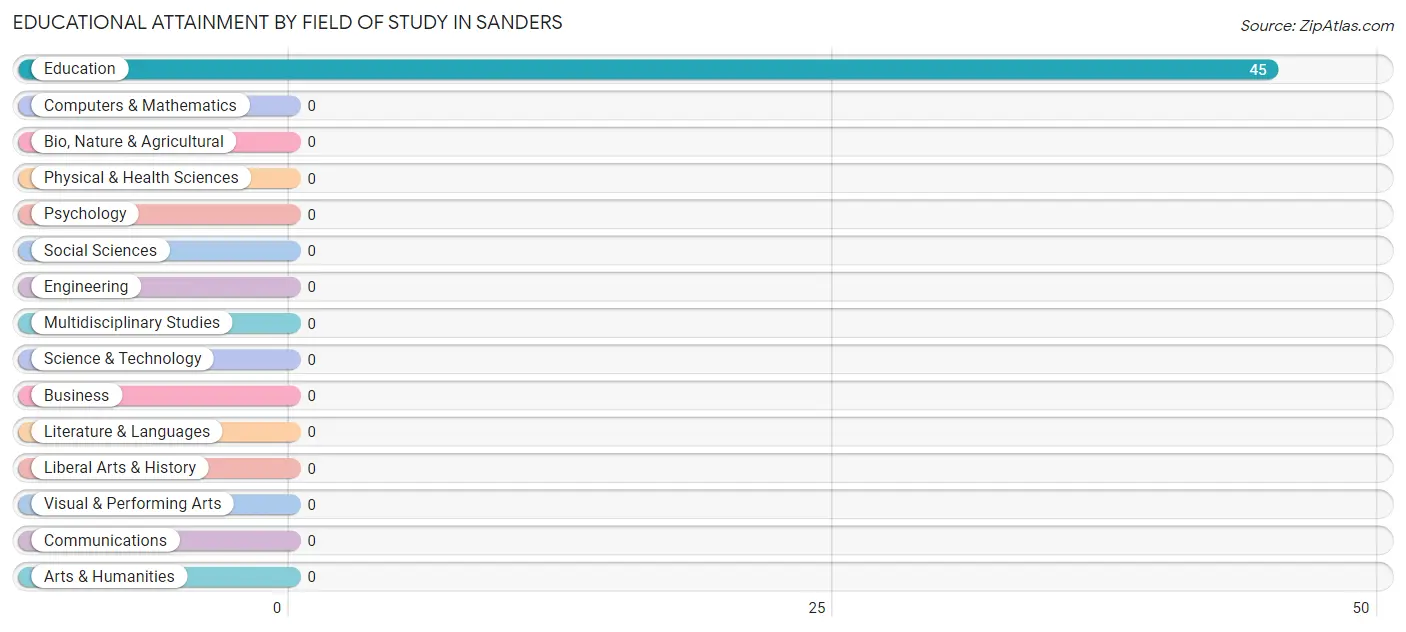
Educational Attainment by Field of Study in Sanders
, and education (45 | 100.0%) are the most common fields of study among 45 individuals in Sanders who have obtained a bachelor's degree or higher.
| Field of Study | # Graduates | % Graduates |
| Computers & Mathematics | 0 | 0.0% |
| Bio, Nature & Agricultural | 0 | 0.0% |
| Physical & Health Sciences | 0 | 0.0% |
| Psychology | 0 | 0.0% |
| Social Sciences | 0 | 0.0% |
| Engineering | 0 | 0.0% |
| Multidisciplinary Studies | 0 | 0.0% |
| Science & Technology | 0 | 0.0% |
| Business | 0 | 0.0% |
| Education | 45 | 100.0% |
| Literature & Languages | 0 | 0.0% |
| Liberal Arts & History | 0 | 0.0% |
| Visual & Performing Arts | 0 | 0.0% |
| Communications | 0 | 0.0% |
| Arts & Humanities | 0 | 0.0% |
| Total | 45 | 100.0% |
Transportation & Commute in Sanders
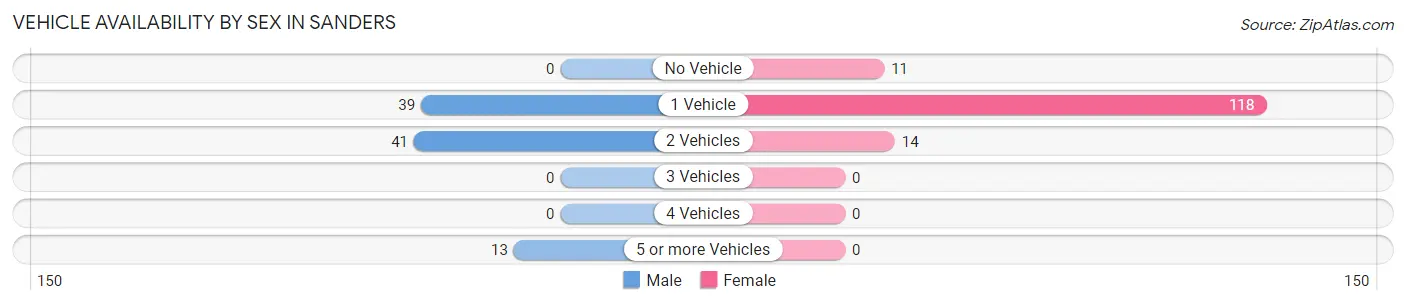
Vehicle Availability by Sex in Sanders
The most prevalent vehicle ownership categories in Sanders are males with 2 vehicles (41, accounting for 44.1%) and females with 2 vehicles (14, making up 28.7%).
| Vehicles Available | Male | Female |
| No Vehicle | 0 (0.0%) | 11 (7.7%) |
| 1 Vehicle | 39 (41.9%) | 118 (82.5%) |
| 2 Vehicles | 41 (44.1%) | 14 (9.8%) |
| 3 Vehicles | 0 (0.0%) | 0 (0.0%) |
| 4 Vehicles | 0 (0.0%) | 0 (0.0%) |
| 5 or more Vehicles | 13 (14.0%) | 0 (0.0%) |
| Total | 93 (100.0%) | 143 (100.0%) |
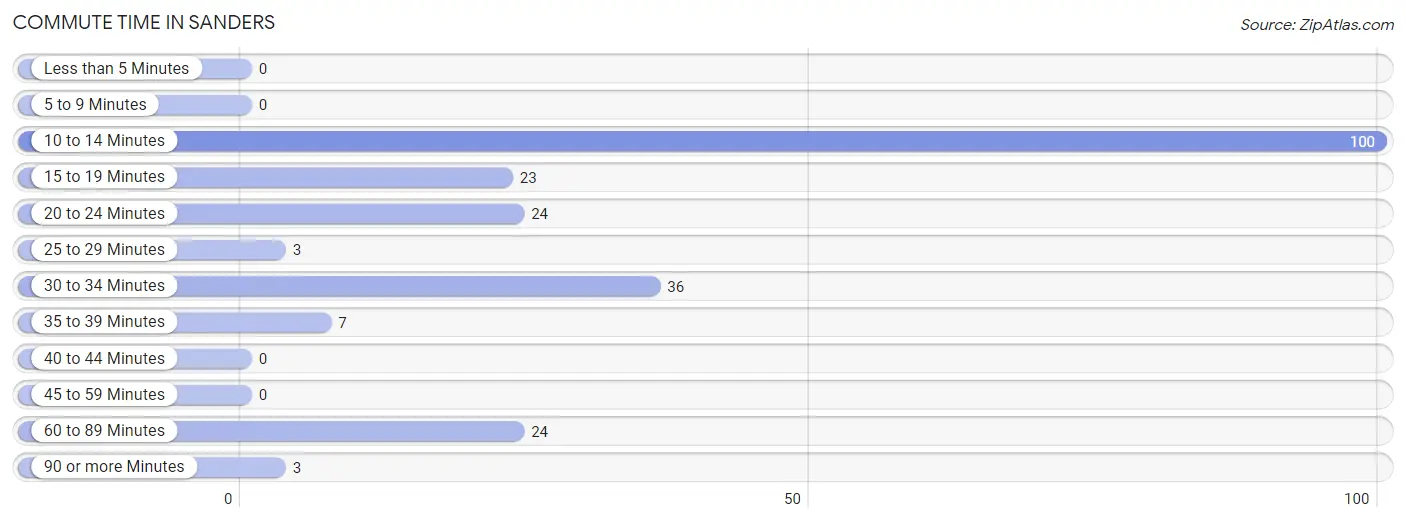
Commute Time in Sanders
The most frequently occuring commute durations in Sanders are 10 to 14 minutes (100 commuters, 45.5%), 30 to 34 minutes (36 commuters, 16.4%), and 20 to 24 minutes (24 commuters, 10.9%).
| Commute Time | # Commuters | % Commuters |
| Less than 5 Minutes | 0 | 0.0% |
| 5 to 9 Minutes | 0 | 0.0% |
| 10 to 14 Minutes | 100 | 45.5% |
| 15 to 19 Minutes | 23 | 10.4% |
| 20 to 24 Minutes | 24 | 10.9% |
| 25 to 29 Minutes | 3 | 1.4% |
| 30 to 34 Minutes | 36 | 16.4% |
| 35 to 39 Minutes | 7 | 3.2% |
| 40 to 44 Minutes | 0 | 0.0% |
| 45 to 59 Minutes | 0 | 0.0% |
| 60 to 89 Minutes | 24 | 10.9% |
| 90 or more Minutes | 3 | 1.4% |
Commute Time by Sex in Sanders
The most common commute times in Sanders are 30 to 34 minutes (31 commuters, 38.8%) for males and 10 to 14 minutes (100 commuters, 71.4%) for females.
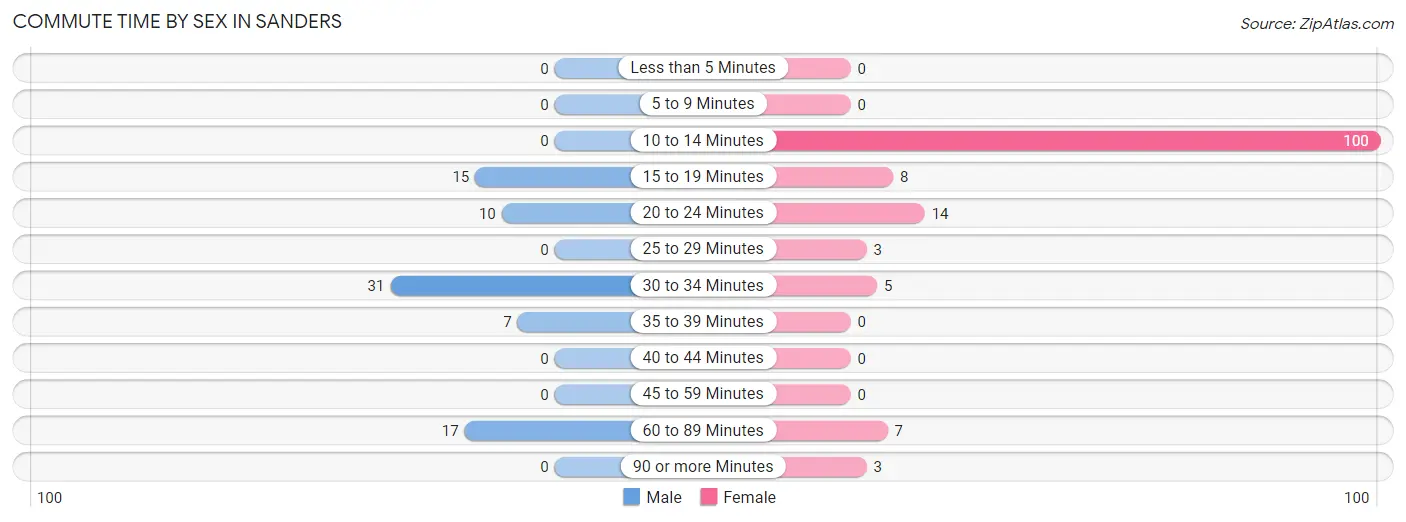
| Commute Time | Male | Female |
| Less than 5 Minutes | 0 (0.0%) | 0 (0.0%) |
| 5 to 9 Minutes | 0 (0.0%) | 0 (0.0%) |
| 10 to 14 Minutes | 0 (0.0%) | 100 (71.4%) |
| 15 to 19 Minutes | 15 (18.8%) | 8 (5.7%) |
| 20 to 24 Minutes | 10 (12.5%) | 14 (10.0%) |
| 25 to 29 Minutes | 0 (0.0%) | 3 (2.1%) |
| 30 to 34 Minutes | 31 (38.8%) | 5 (3.6%) |
| 35 to 39 Minutes | 7 (8.7%) | 0 (0.0%) |
| 40 to 44 Minutes | 0 (0.0%) | 0 (0.0%) |
| 45 to 59 Minutes | 0 (0.0%) | 0 (0.0%) |
| 60 to 89 Minutes | 17 (21.2%) | 7 (5.0%) |
| 90 or more Minutes | 0 (0.0%) | 3 (2.1%) |
Time of Departure to Work by Sex in Sanders
The most frequent times of departure to work in Sanders are 6:00 AM to 6:29 AM (27, 33.8%) for males and 7:00 AM to 7:29 AM (93, 66.4%) for females.
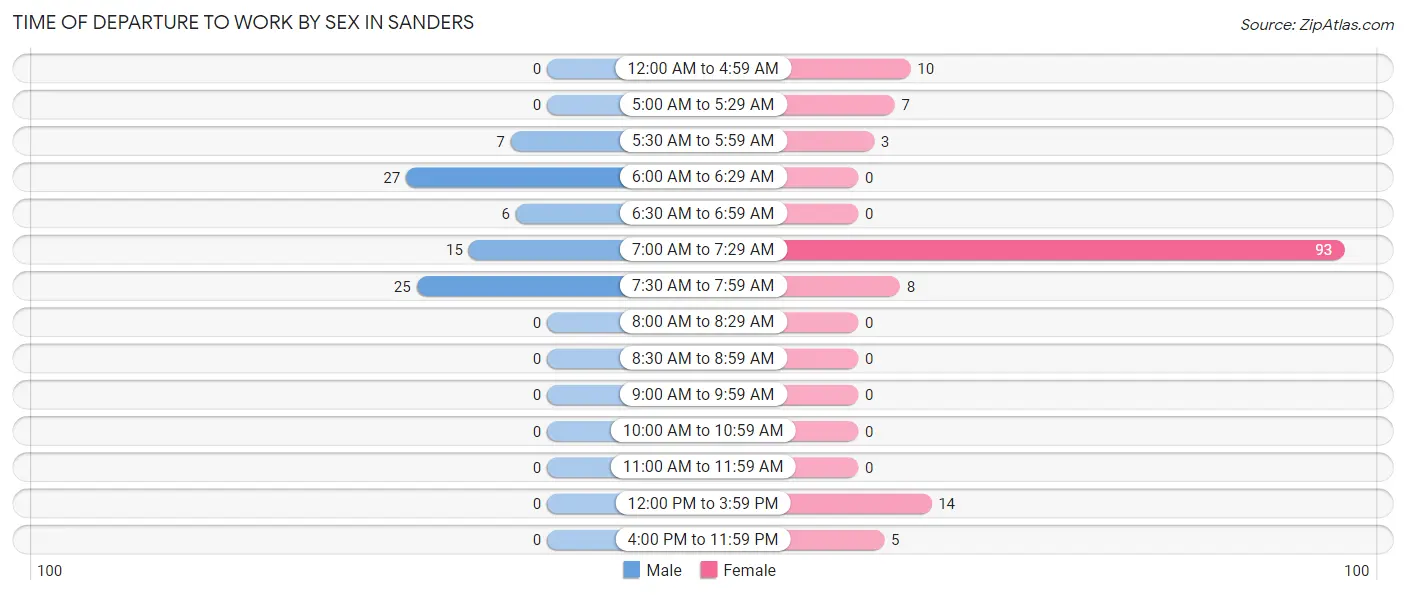
| Time of Departure | Male | Female |
| 12:00 AM to 4:59 AM | 0 (0.0%) | 10 (7.1%) |
| 5:00 AM to 5:29 AM | 0 (0.0%) | 7 (5.0%) |
| 5:30 AM to 5:59 AM | 7 (8.7%) | 3 (2.1%) |
| 6:00 AM to 6:29 AM | 27 (33.8%) | 0 (0.0%) |
| 6:30 AM to 6:59 AM | 6 (7.5%) | 0 (0.0%) |
| 7:00 AM to 7:29 AM | 15 (18.8%) | 93 (66.4%) |
| 7:30 AM to 7:59 AM | 25 (31.2%) | 8 (5.7%) |
| 8:00 AM to 8:29 AM | 0 (0.0%) | 0 (0.0%) |
| 8:30 AM to 8:59 AM | 0 (0.0%) | 0 (0.0%) |
| 9:00 AM to 9:59 AM | 0 (0.0%) | 0 (0.0%) |
| 10:00 AM to 10:59 AM | 0 (0.0%) | 0 (0.0%) |
| 11:00 AM to 11:59 AM | 0 (0.0%) | 0 (0.0%) |
| 12:00 PM to 3:59 PM | 0 (0.0%) | 14 (10.0%) |
| 4:00 PM to 11:59 PM | 0 (0.0%) | 5 (3.6%) |
| Total | 80 (100.0%) | 140 (100.0%) |
Housing Occupancy in Sanders
Occupancy by Ownership in Sanders
Of the total 256 dwellings in Sanders, owner-occupied units account for 76 (29.7%), while renter-occupied units make up 180 (70.3%).
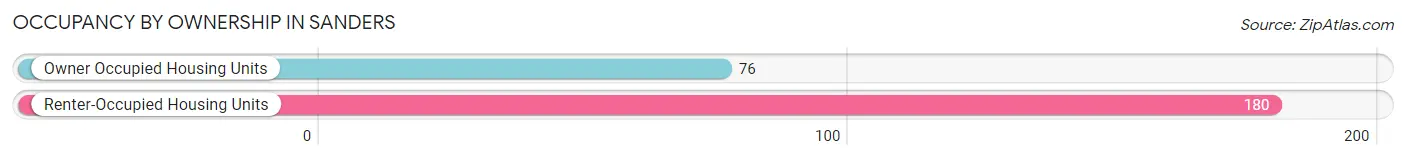
| Occupancy | # Housing Units | % Housing Units |
| Owner Occupied Housing Units | 76 | 29.7% |
| Renter-Occupied Housing Units | 180 | 70.3% |
| Total Occupied Housing Units | 256 | 100.0% |
Occupancy by Household Size in Sanders
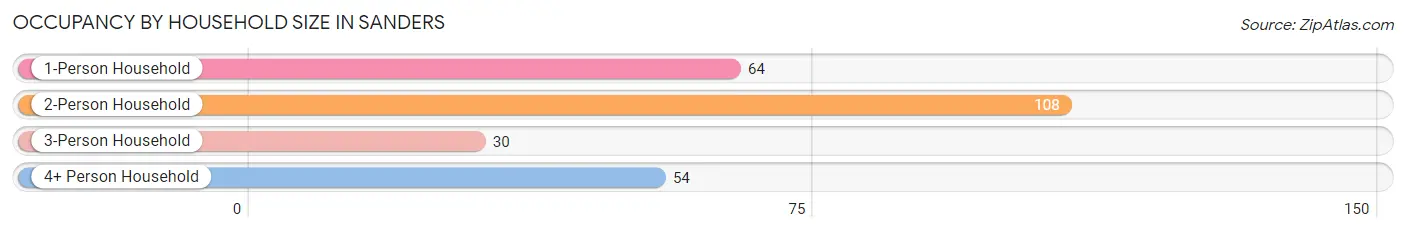
| Household Size | # Housing Units | % Housing Units |
| 1-Person Household | 64 | 25.0% |
| 2-Person Household | 108 | 42.2% |
| 3-Person Household | 30 | 11.7% |
| 4+ Person Household | 54 | 21.1% |
| Total Housing Units | 256 | 100.0% |
Occupancy by Ownership by Household Size in Sanders
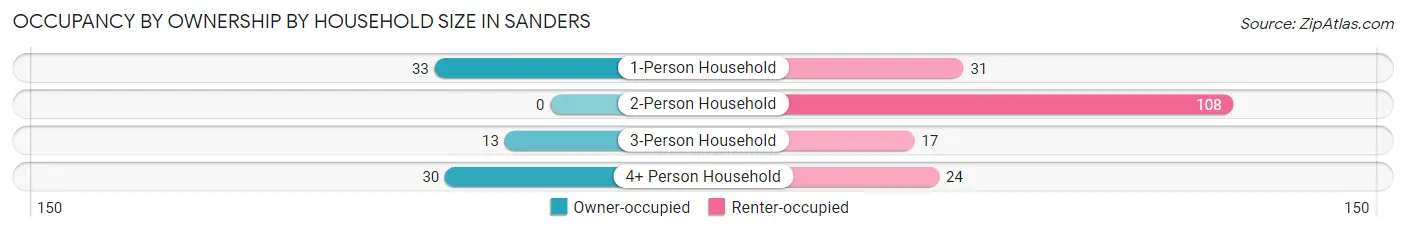
| Household Size | Owner-occupied | Renter-occupied |
| 1-Person Household | 33 (51.6%) | 31 (48.4%) |
| 2-Person Household | 0 (0.0%) | 108 (100.0%) |
| 3-Person Household | 13 (43.3%) | 17 (56.7%) |
| 4+ Person Household | 30 (55.6%) | 24 (44.4%) |
| Total Housing Units | 76 (29.7%) | 180 (70.3%) |
Occupancy by Educational Attainment in Sanders
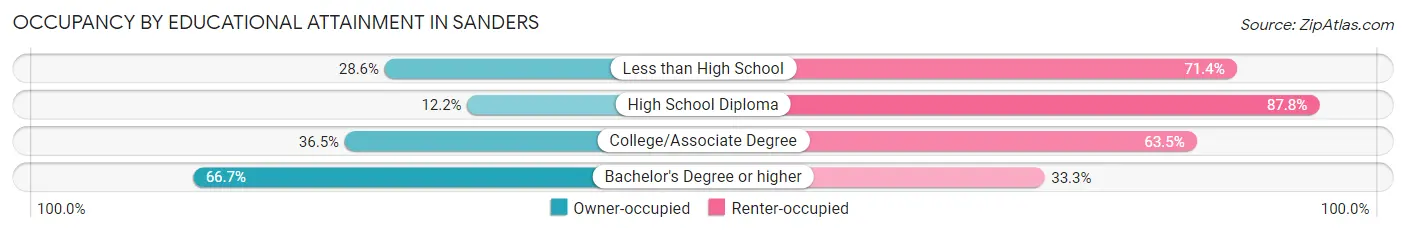
| Household Size | Owner-occupied | Renter-occupied |
| Less than High School | 4 (28.6%) | 10 (71.4%) |
| High School Diploma | 15 (12.2%) | 108 (87.8%) |
| College/Associate Degree | 27 (36.5%) | 47 (63.5%) |
| Bachelor's Degree or higher | 30 (66.7%) | 15 (33.3%) |
Occupancy by Age of Householder in Sanders
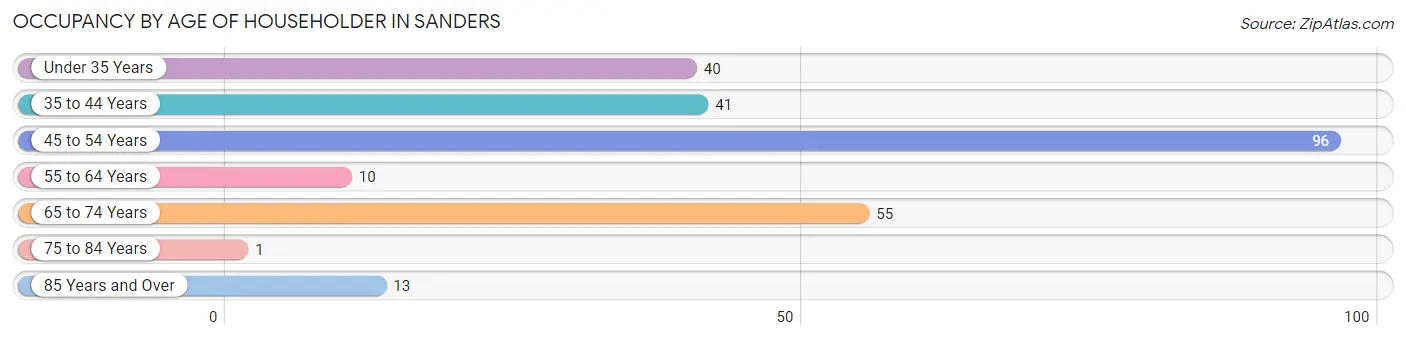
| Age Bracket | # Households | % Households |
| Under 35 Years | 40 | 15.6% |
| 35 to 44 Years | 41 | 16.0% |
| 45 to 54 Years | 96 | 37.5% |
| 55 to 64 Years | 10 | 3.9% |
| 65 to 74 Years | 55 | 21.5% |
| 75 to 84 Years | 1 | 0.4% |
| 85 Years and Over | 13 | 5.1% |
| Total | 256 | 100.0% |
Housing Finances in Sanders
Median Income by Occupancy in Sanders
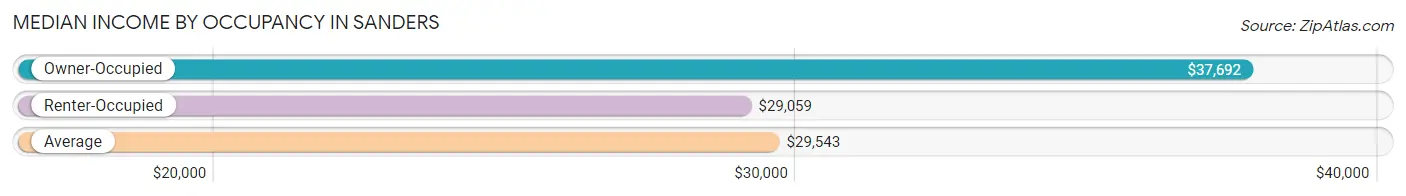
| Occupancy Type | # Households | Median Income |
| Owner-Occupied | 76 (29.7%) | $37,692 |
| Renter-Occupied | 180 (70.3%) | $29,059 |
| Average | 256 (100.0%) | $29,543 |
Occupancy by Householder Income Bracket in Sanders
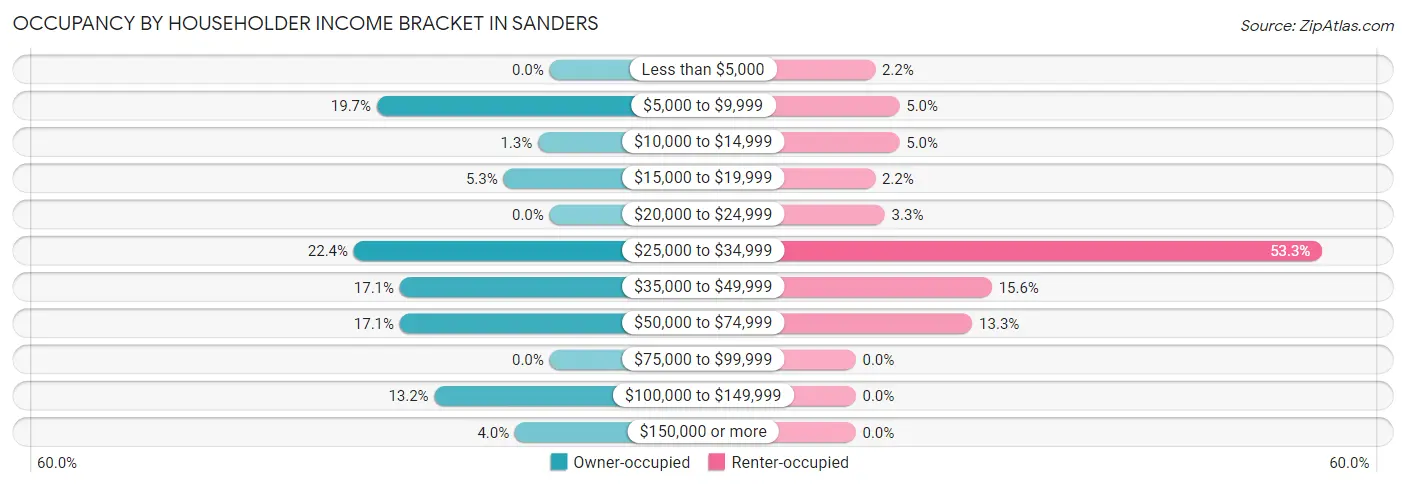
| Income Bracket | Owner-occupied | Renter-occupied |
| Less than $5,000 | 0 (0.0%) | 4 (2.2%) |
| $5,000 to $9,999 | 15 (19.7%) | 9 (5.0%) |
| $10,000 to $14,999 | 1 (1.3%) | 9 (5.0%) |
| $15,000 to $19,999 | 4 (5.3%) | 4 (2.2%) |
| $20,000 to $24,999 | 0 (0.0%) | 6 (3.3%) |
| $25,000 to $34,999 | 17 (22.4%) | 96 (53.3%) |
| $35,000 to $49,999 | 13 (17.1%) | 28 (15.6%) |
| $50,000 to $74,999 | 13 (17.1%) | 24 (13.3%) |
| $75,000 to $99,999 | 0 (0.0%) | 0 (0.0%) |
| $100,000 to $149,999 | 10 (13.2%) | 0 (0.0%) |
| $150,000 or more | 3 (4.0%) | 0 (0.0%) |
| Total | 76 (100.0%) | 180 (100.0%) |
Monthly Housing Cost Tiers in Sanders
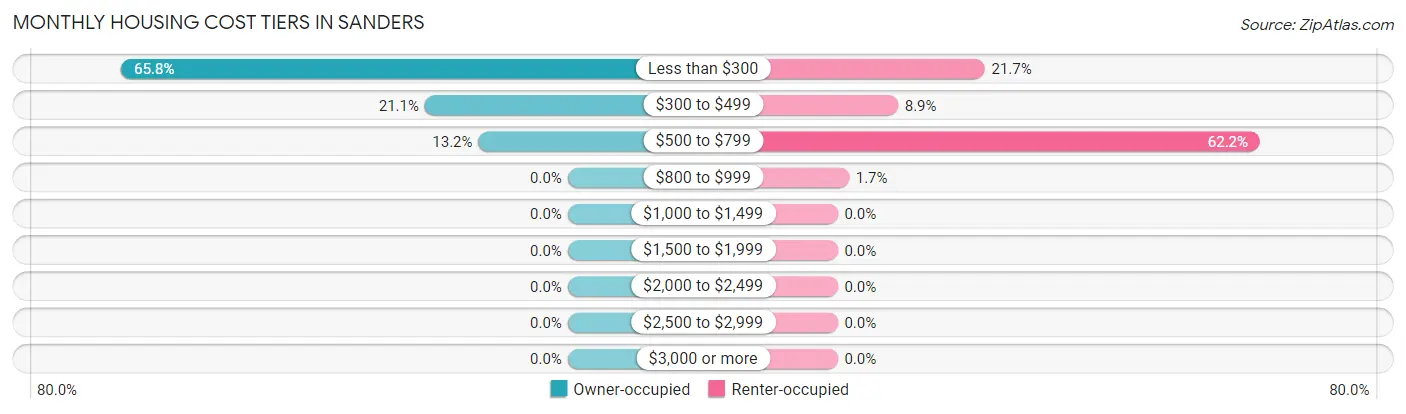
| Monthly Cost | Owner-occupied | Renter-occupied |
| Less than $300 | 50 (65.8%) | 39 (21.7%) |
| $300 to $499 | 16 (21.0%) | 16 (8.9%) |
| $500 to $799 | 10 (13.2%) | 112 (62.2%) |
| $800 to $999 | 0 (0.0%) | 3 (1.7%) |
| $1,000 to $1,499 | 0 (0.0%) | 0 (0.0%) |
| $1,500 to $1,999 | 0 (0.0%) | 0 (0.0%) |
| $2,000 to $2,499 | 0 (0.0%) | 0 (0.0%) |
| $2,500 to $2,999 | 0 (0.0%) | 0 (0.0%) |
| $3,000 or more | 0 (0.0%) | 0 (0.0%) |
| Total | 76 (100.0%) | 180 (100.0%) |
Physical Housing Characteristics in Sanders
Housing Structures in Sanders
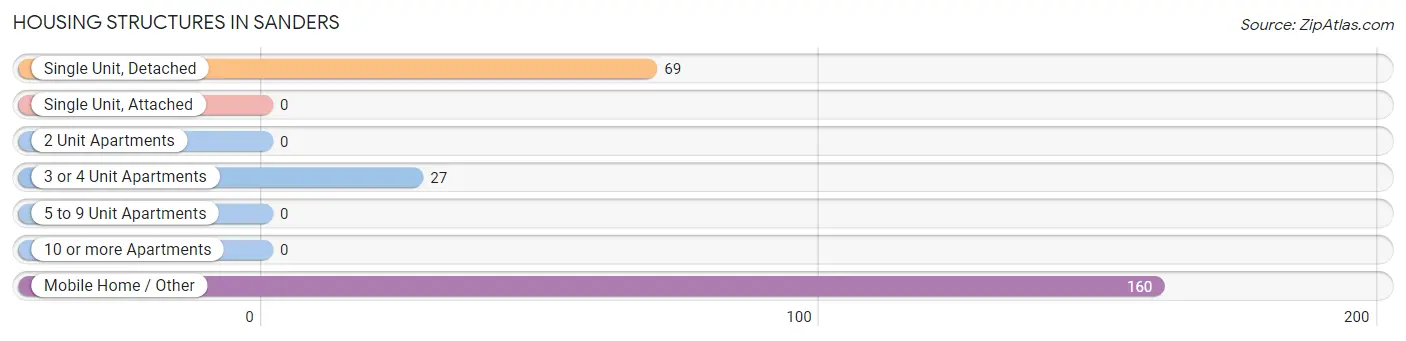
| Structure Type | # Housing Units | % Housing Units |
| Single Unit, Detached | 69 | 27.0% |
| Single Unit, Attached | 0 | 0.0% |
| 2 Unit Apartments | 0 | 0.0% |
| 3 or 4 Unit Apartments | 27 | 10.5% |
| 5 to 9 Unit Apartments | 0 | 0.0% |
| 10 or more Apartments | 0 | 0.0% |
| Mobile Home / Other | 160 | 62.5% |
| Total | 256 | 100.0% |
Housing Structures by Occupancy in Sanders
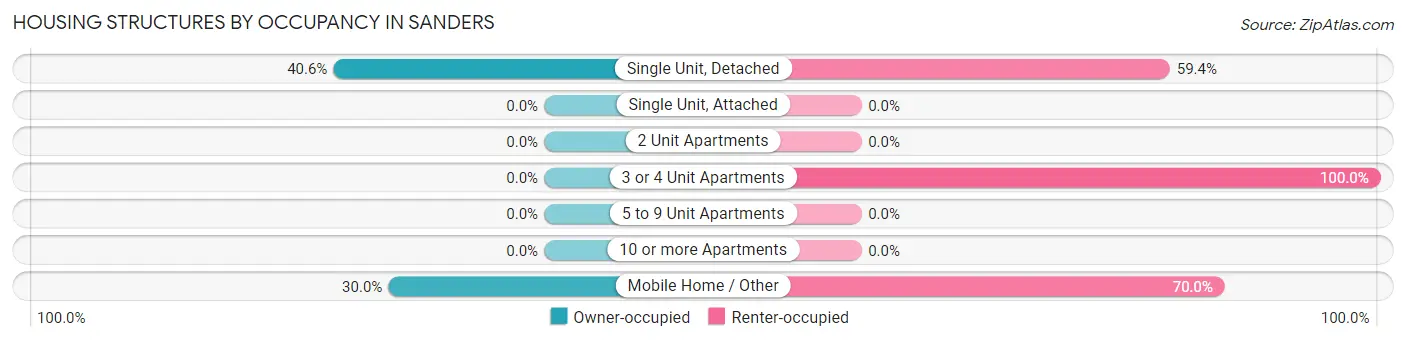
| Structure Type | Owner-occupied | Renter-occupied |
| Single Unit, Detached | 28 (40.6%) | 41 (59.4%) |
| Single Unit, Attached | 0 (0.0%) | 0 (0.0%) |
| 2 Unit Apartments | 0 (0.0%) | 0 (0.0%) |
| 3 or 4 Unit Apartments | 0 (0.0%) | 27 (100.0%) |
| 5 to 9 Unit Apartments | 0 (0.0%) | 0 (0.0%) |
| 10 or more Apartments | 0 (0.0%) | 0 (0.0%) |
| Mobile Home / Other | 48 (30.0%) | 112 (70.0%) |
| Total | 76 (29.7%) | 180 (70.3%) |
Housing Structures by Number of Rooms in Sanders
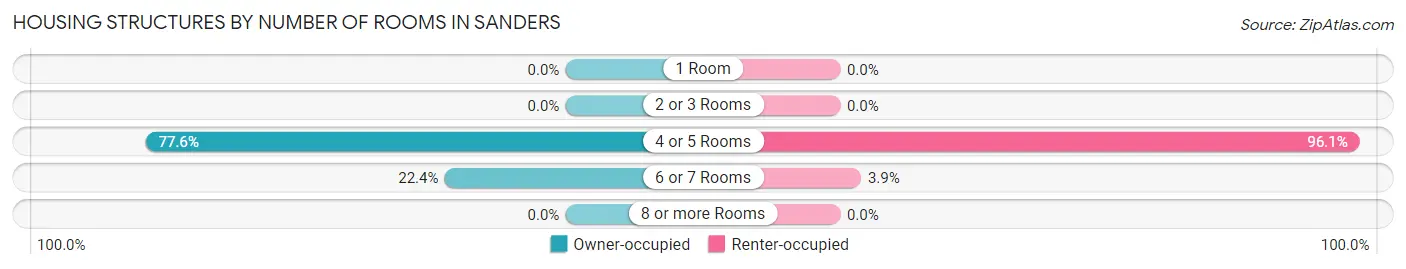
| Number of Rooms | Owner-occupied | Renter-occupied |
| 1 Room | 0 (0.0%) | 0 (0.0%) |
| 2 or 3 Rooms | 0 (0.0%) | 0 (0.0%) |
| 4 or 5 Rooms | 59 (77.6%) | 173 (96.1%) |
| 6 or 7 Rooms | 17 (22.4%) | 7 (3.9%) |
| 8 or more Rooms | 0 (0.0%) | 0 (0.0%) |
| Total | 76 (100.0%) | 180 (100.0%) |
Housing Structure by Heating Type in Sanders
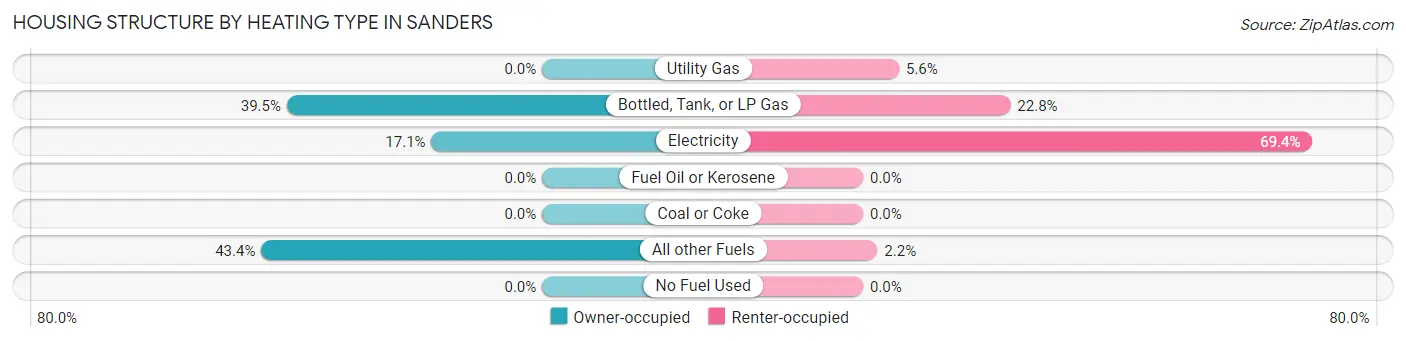
| Heating Type | Owner-occupied | Renter-occupied |
| Utility Gas | 0 (0.0%) | 10 (5.6%) |
| Bottled, Tank, or LP Gas | 30 (39.5%) | 41 (22.8%) |
| Electricity | 13 (17.1%) | 125 (69.4%) |
| Fuel Oil or Kerosene | 0 (0.0%) | 0 (0.0%) |
| Coal or Coke | 0 (0.0%) | 0 (0.0%) |
| All other Fuels | 33 (43.4%) | 4 (2.2%) |
| No Fuel Used | 0 (0.0%) | 0 (0.0%) |
| Total | 76 (100.0%) | 180 (100.0%) |
Household Vehicle Usage in Sanders
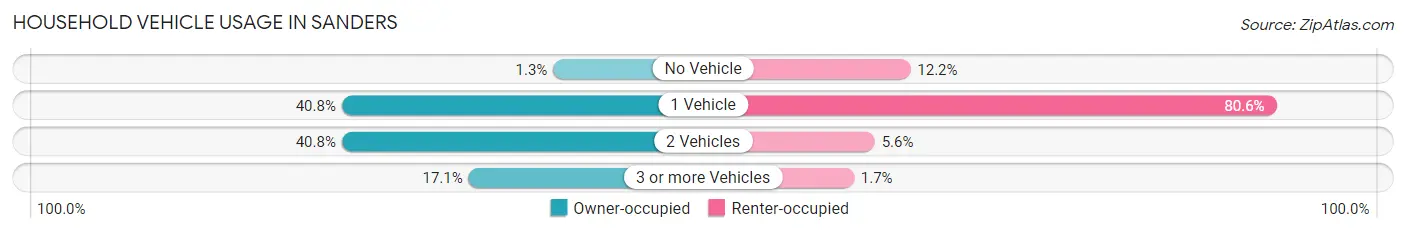
| Vehicles per Household | Owner-occupied | Renter-occupied |
| No Vehicle | 1 (1.3%) | 22 (12.2%) |
| 1 Vehicle | 31 (40.8%) | 145 (80.6%) |
| 2 Vehicles | 31 (40.8%) | 10 (5.6%) |
| 3 or more Vehicles | 13 (17.1%) | 3 (1.7%) |
| Total | 76 (100.0%) | 180 (100.0%) |
Real Estate & Mortgages in Sanders
Real Estate and Mortgage Overview in Sanders
| Characteristic | Without Mortgage | With Mortgage |
| Housing Units | 76 | 0 |
| Median Property Value | - | - |
| Median Household Income | $37,692 | $0 |
| Monthly Housing Costs | $249 | $0 |
| Real Estate Taxes | - | - |
Property Value by Mortgage Status in Sanders
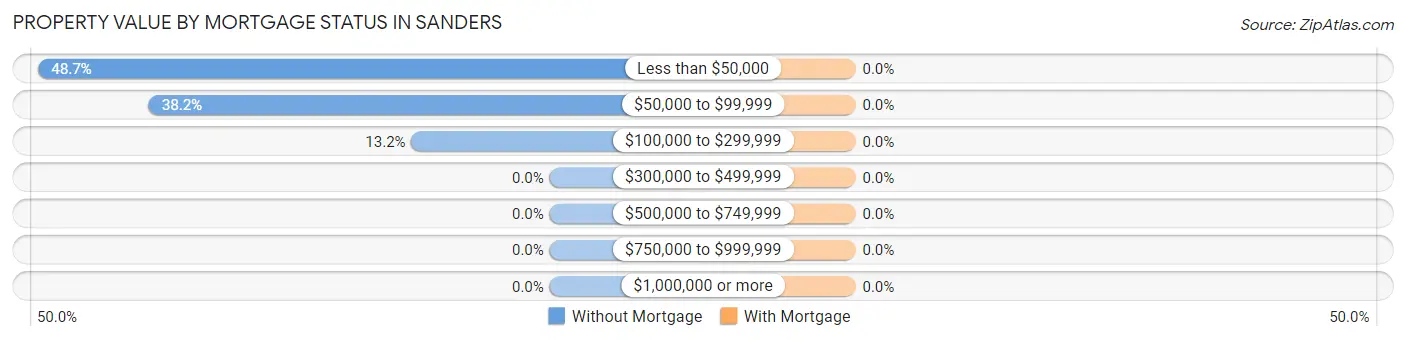
| Property Value | Without Mortgage | With Mortgage |
| Less than $50,000 | 37 (48.7%) | 0 (0.0%) |
| $50,000 to $99,999 | 29 (38.2%) | 0 (0.0%) |
| $100,000 to $299,999 | 10 (13.2%) | 0 (0.0%) |
| $300,000 to $499,999 | 0 (0.0%) | 0 (0.0%) |
| $500,000 to $749,999 | 0 (0.0%) | 0 (0.0%) |
| $750,000 to $999,999 | 0 (0.0%) | 0 (0.0%) |
| $1,000,000 or more | 0 (0.0%) | 0 (0.0%) |
| Total | 76 (100.0%) | 0 (0.0%) |
Household Income by Mortgage Status in Sanders
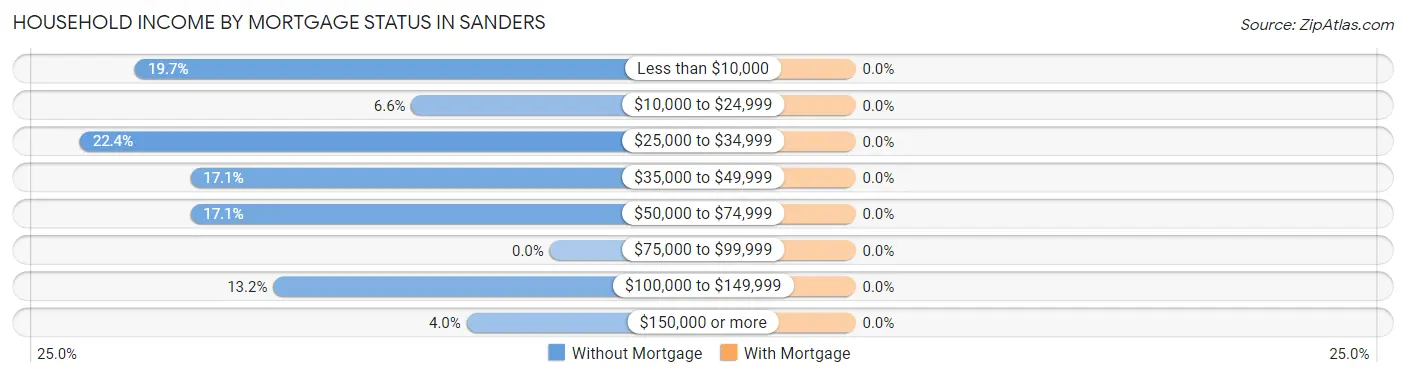
| Household Income | Without Mortgage | With Mortgage |
| Less than $10,000 | 15 (19.7%) | 0 (0.0%) |
| $10,000 to $24,999 | 5 (6.6%) | 0 (0.0%) |
| $25,000 to $34,999 | 17 (22.4%) | 0 (0.0%) |
| $35,000 to $49,999 | 13 (17.1%) | 0 (0.0%) |
| $50,000 to $74,999 | 13 (17.1%) | 0 (0.0%) |
| $75,000 to $99,999 | 0 (0.0%) | 0 (0.0%) |
| $100,000 to $149,999 | 10 (13.2%) | 0 (0.0%) |
| $150,000 or more | 3 (4.0%) | 0 (0.0%) |
| Total | 76 (100.0%) | 0 (0.0%) |
Property Value to Household Income Ratio in Sanders
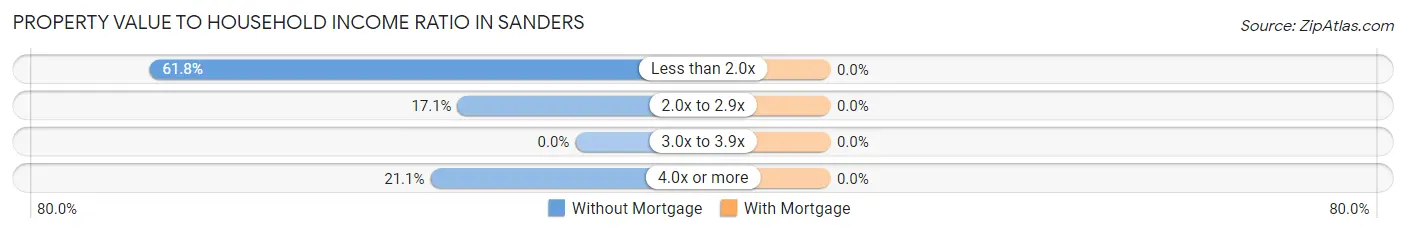
| Value-to-Income Ratio | Without Mortgage | With Mortgage |
| Less than 2.0x | 47 (61.8%) | 0 (0.0%) |
| 2.0x to 2.9x | 13 (17.1%) | 0 (0.0%) |
| 3.0x to 3.9x | 0 (0.0%) | 0 (0.0%) |
| 4.0x or more | 16 (21.0%) | 0 (0.0%) |
| Total | 76 (100.0%) | 0 (0.0%) |
Real Estate Taxes by Mortgage Status in Sanders
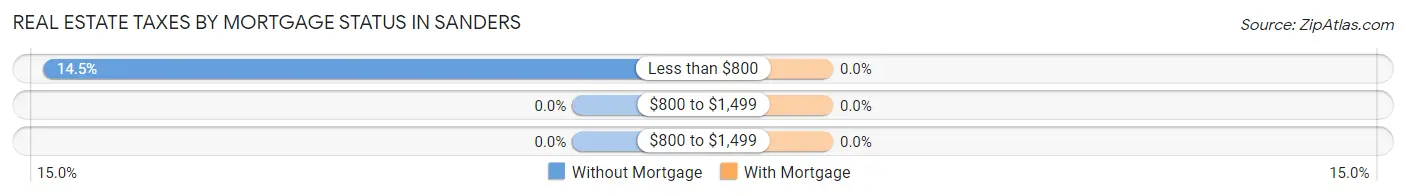
| Property Taxes | Without Mortgage | With Mortgage |
| Less than $800 | 11 (14.5%) | 0 (0.0%) |
| $800 to $1,499 | 0 (0.0%) | 0 (0.0%) |
| $800 to $1,499 | 0 (0.0%) | 0 (0.0%) |
| Total | 76 (100.0%) | 0 (0.0%) |
Health & Disability in Sanders
Health Insurance Coverage by Age in Sanders
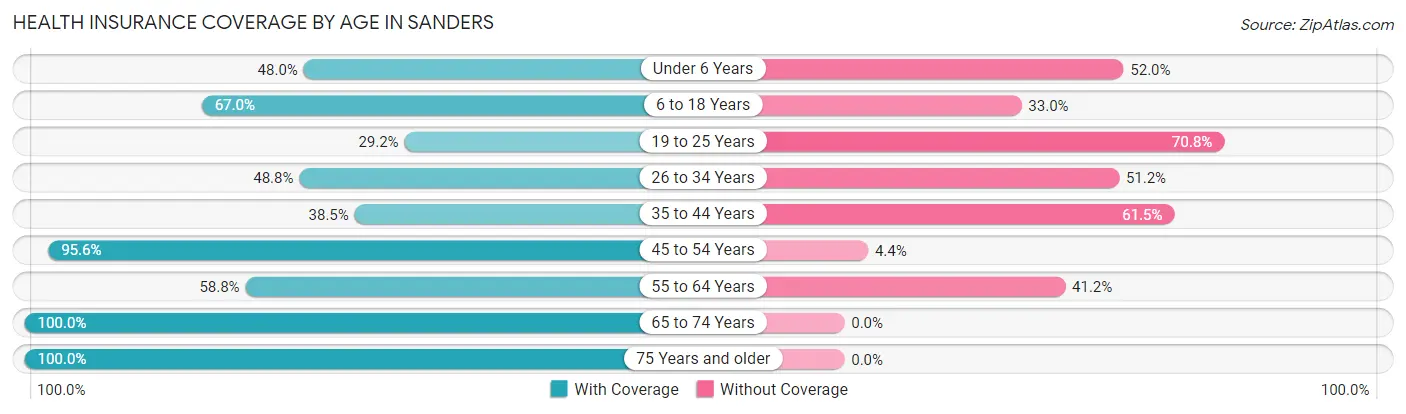
| Age Bracket | With Coverage | Without Coverage |
| Under 6 Years | 47 (48.0%) | 51 (52.0%) |
| 6 to 18 Years | 146 (67.0%) | 72 (33.0%) |
| 19 to 25 Years | 7 (29.2%) | 17 (70.8%) |
| 26 to 34 Years | 20 (48.8%) | 21 (51.2%) |
| 35 to 44 Years | 30 (38.5%) | 48 (61.5%) |
| 45 to 54 Years | 130 (95.6%) | 6 (4.4%) |
| 55 to 64 Years | 10 (58.8%) | 7 (41.2%) |
| 65 to 74 Years | 68 (100.0%) | 0 (0.0%) |
| 75 Years and older | 16 (100.0%) | 0 (0.0%) |
| Total | 474 (68.1%) | 222 (31.9%) |
Health Insurance Coverage by Citizenship Status in Sanders
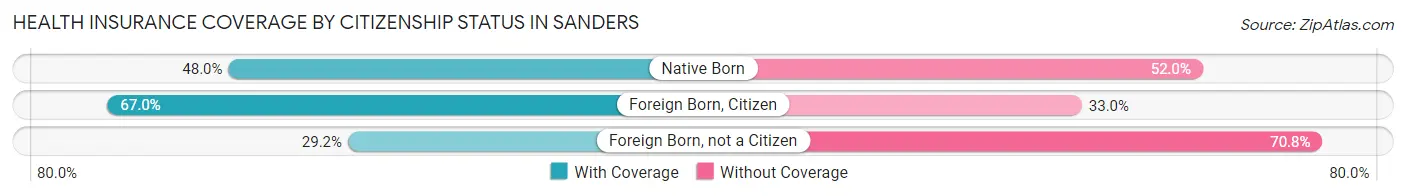
| Citizenship Status | With Coverage | Without Coverage |
| Native Born | 47 (48.0%) | 51 (52.0%) |
| Foreign Born, Citizen | 146 (67.0%) | 72 (33.0%) |
| Foreign Born, not a Citizen | 7 (29.2%) | 17 (70.8%) |
Health Insurance Coverage by Household Income in Sanders
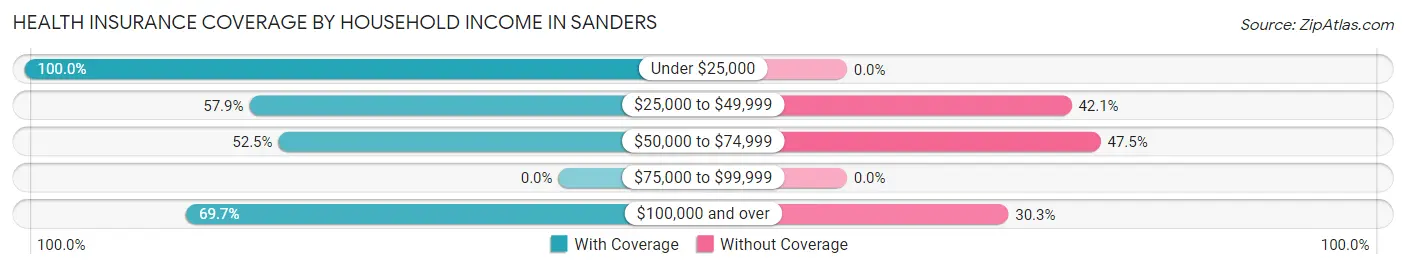
| Household Income | With Coverage | Without Coverage |
| Under $25,000 | 163 (100.0%) | 0 (0.0%) |
| $25,000 to $49,999 | 194 (57.9%) | 141 (42.1%) |
| $50,000 to $74,999 | 64 (52.5%) | 58 (47.5%) |
| $75,000 to $99,999 | 0 (0.0%) | 0 (0.0%) |
| $100,000 and over | 53 (69.7%) | 23 (30.3%) |
Public vs Private Health Insurance Coverage by Age in Sanders
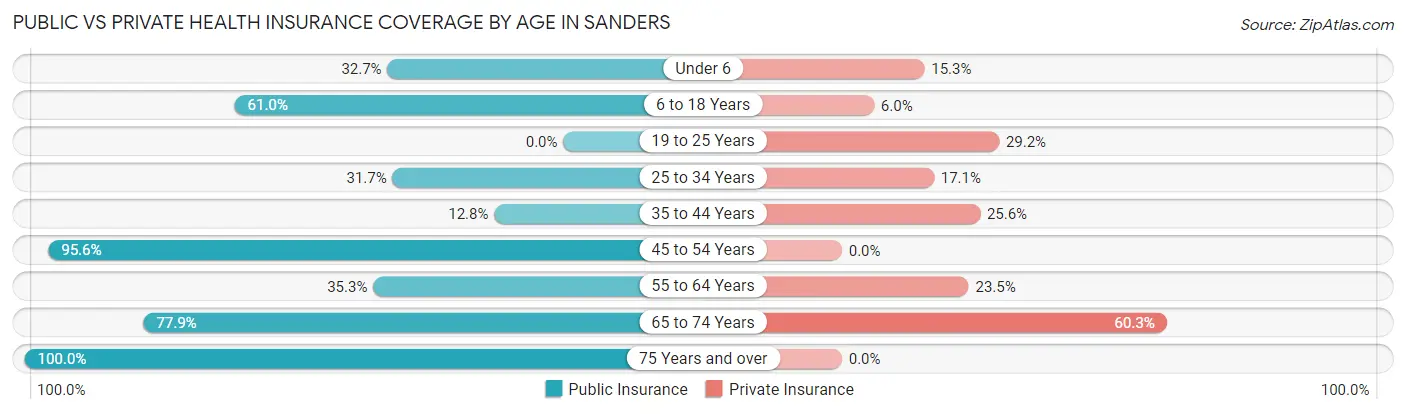
| Age Bracket | Public Insurance | Private Insurance |
| Under 6 | 32 (32.7%) | 15 (15.3%) |
| 6 to 18 Years | 133 (61.0%) | 13 (6.0%) |
| 19 to 25 Years | 0 (0.0%) | 7 (29.2%) |
| 25 to 34 Years | 13 (31.7%) | 7 (17.1%) |
| 35 to 44 Years | 10 (12.8%) | 20 (25.6%) |
| 45 to 54 Years | 130 (95.6%) | 0 (0.0%) |
| 55 to 64 Years | 6 (35.3%) | 4 (23.5%) |
| 65 to 74 Years | 53 (77.9%) | 41 (60.3%) |
| 75 Years and over | 16 (100.0%) | 0 (0.0%) |
| Total | 393 (56.5%) | 107 (15.4%) |
Disability Status by Sex by Age in Sanders
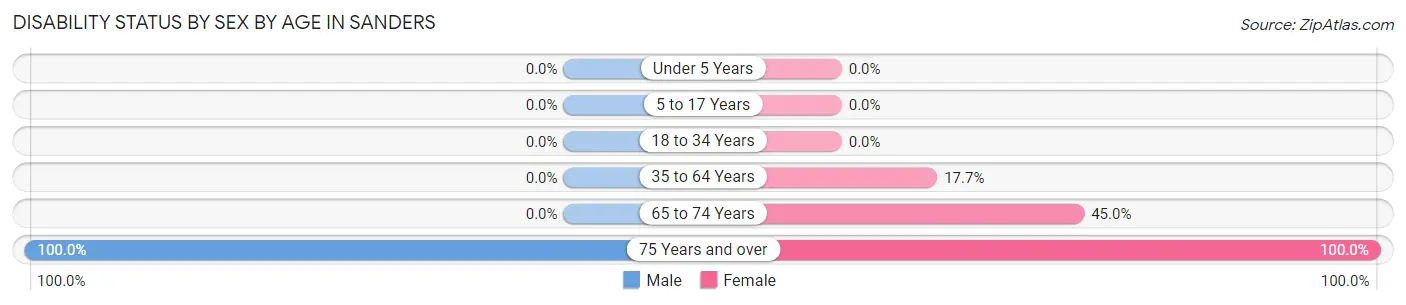
| Age Bracket | Male | Female |
| Under 5 Years | 0 (0.0%) | 0 (0.0%) |
| 5 to 17 Years | 0 (0.0%) | 0 (0.0%) |
| 18 to 34 Years | 0 (0.0%) | 0 (0.0%) |
| 35 to 64 Years | 0 (0.0%) | 34 (17.7%) |
| 65 to 74 Years | 0 (0.0%) | 18 (45.0%) |
| 75 Years and over | 2 (100.0%) | 14 (100.0%) |
Disability Class by Sex by Age in Sanders
Disability Class: Hearing Difficulty
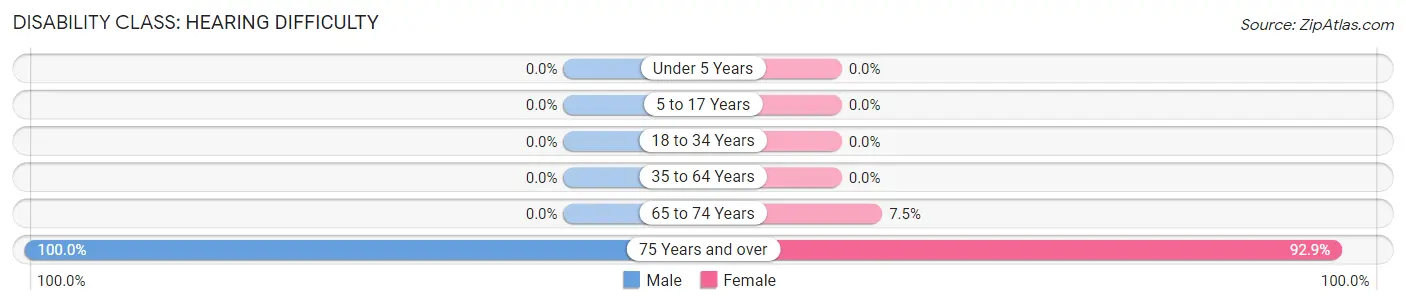
| Age Bracket | Male | Female |
| Under 5 Years | 0 (0.0%) | 0 (0.0%) |
| 5 to 17 Years | 0 (0.0%) | 0 (0.0%) |
| 18 to 34 Years | 0 (0.0%) | 0 (0.0%) |
| 35 to 64 Years | 0 (0.0%) | 0 (0.0%) |
| 65 to 74 Years | 0 (0.0%) | 3 (7.5%) |
| 75 Years and over | 2 (100.0%) | 13 (92.9%) |
Disability Class: Vision Difficulty
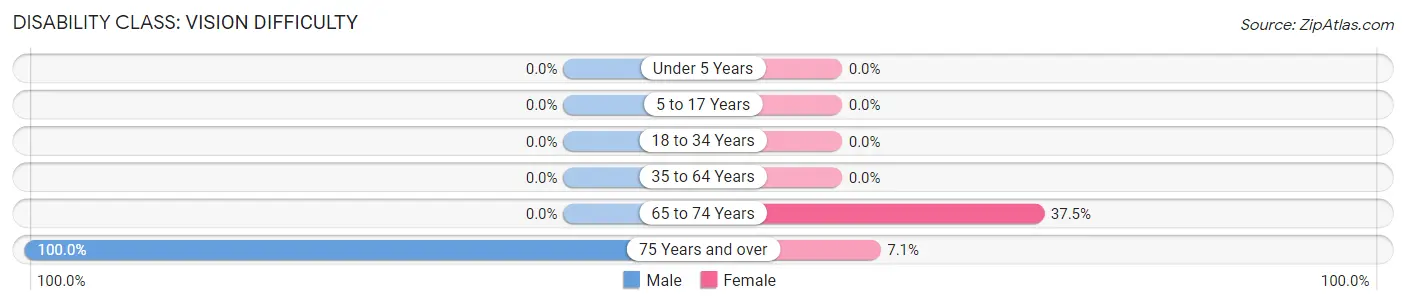
| Age Bracket | Male | Female |
| Under 5 Years | 0 (0.0%) | 0 (0.0%) |
| 5 to 17 Years | 0 (0.0%) | 0 (0.0%) |
| 18 to 34 Years | 0 (0.0%) | 0 (0.0%) |
| 35 to 64 Years | 0 (0.0%) | 0 (0.0%) |
| 65 to 74 Years | 0 (0.0%) | 15 (37.5%) |
| 75 Years and over | 2 (100.0%) | 1 (7.1%) |
Disability Class: Cognitive Difficulty
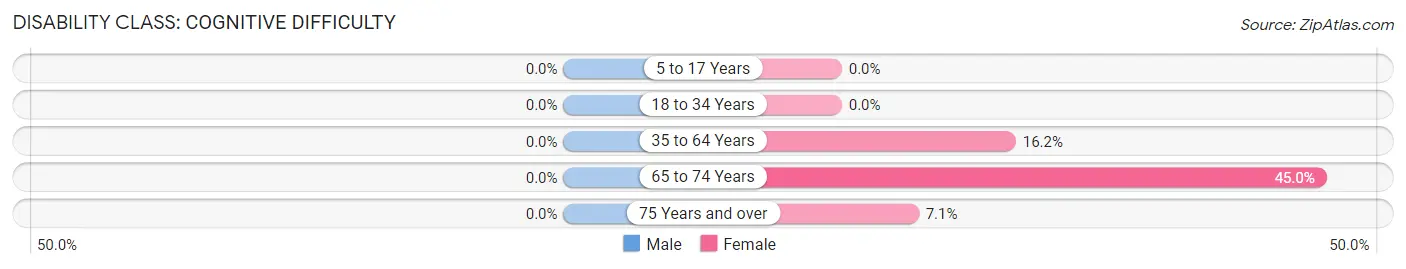
| Age Bracket | Male | Female |
| 5 to 17 Years | 0 (0.0%) | 0 (0.0%) |
| 18 to 34 Years | 0 (0.0%) | 0 (0.0%) |
| 35 to 64 Years | 0 (0.0%) | 31 (16.2%) |
| 65 to 74 Years | 0 (0.0%) | 18 (45.0%) |
| 75 Years and over | 0 (0.0%) | 1 (7.1%) |
Disability Class: Ambulatory Difficulty
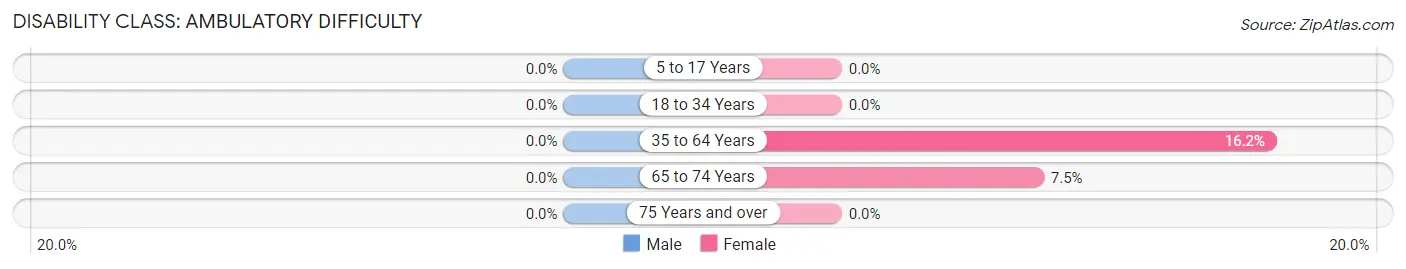
| Age Bracket | Male | Female |
| 5 to 17 Years | 0 (0.0%) | 0 (0.0%) |
| 18 to 34 Years | 0 (0.0%) | 0 (0.0%) |
| 35 to 64 Years | 0 (0.0%) | 31 (16.2%) |
| 65 to 74 Years | 0 (0.0%) | 3 (7.5%) |
| 75 Years and over | 0 (0.0%) | 0 (0.0%) |
Disability Class: Self-Care Difficulty
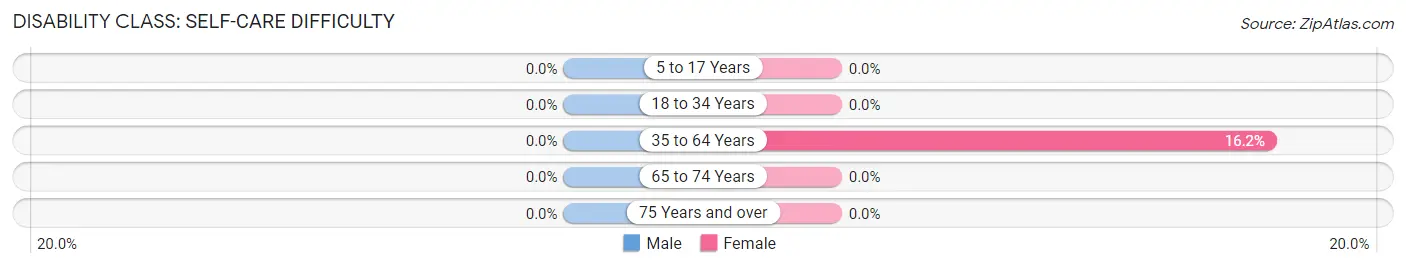
| Age Bracket | Male | Female |
| 5 to 17 Years | 0 (0.0%) | 0 (0.0%) |
| 18 to 34 Years | 0 (0.0%) | 0 (0.0%) |
| 35 to 64 Years | 0 (0.0%) | 31 (16.2%) |
| 65 to 74 Years | 0 (0.0%) | 0 (0.0%) |
| 75 Years and over | 0 (0.0%) | 0 (0.0%) |
Technology Access in Sanders
Computing Device Access in Sanders
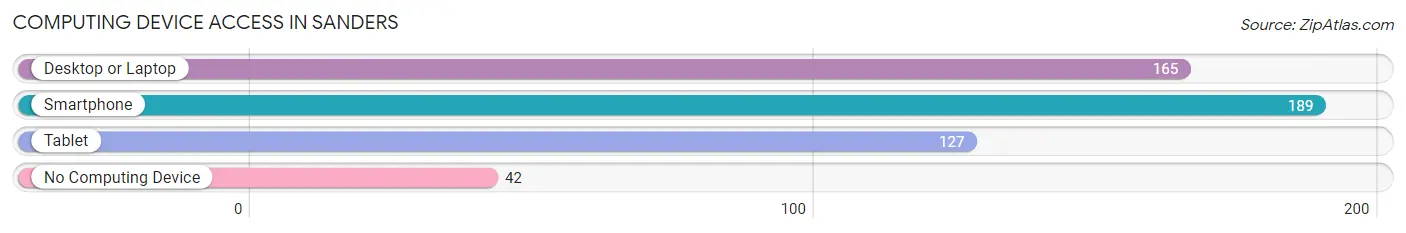
| Device Type | # Households | % Households |
| Desktop or Laptop | 165 | 64.4% |
| Smartphone | 189 | 73.8% |
| Tablet | 127 | 49.6% |
| No Computing Device | 42 | 16.4% |
| Total | 256 | 100.0% |
Internet Access in Sanders
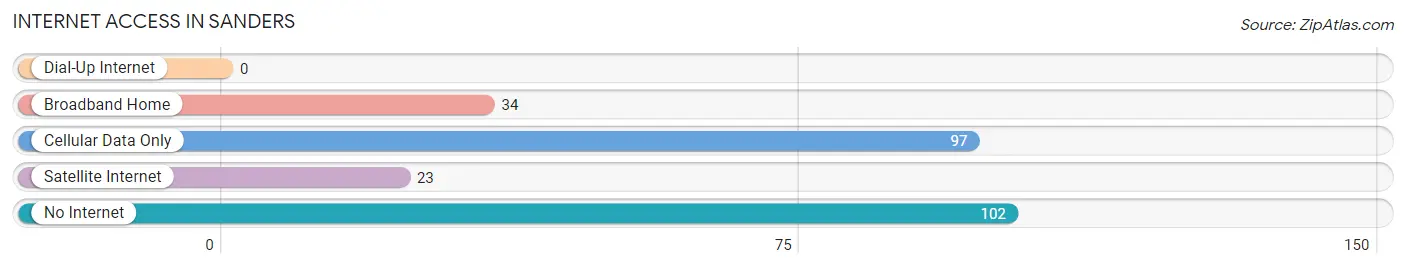
| Internet Type | # Households | % Households |
| Dial-Up Internet | 0 | 0.0% |
| Broadband Home | 34 | 13.3% |
| Cellular Data Only | 97 | 37.9% |
| Satellite Internet | 23 | 9.0% |
| No Internet | 102 | 39.8% |
| Total | 256 | 100.0% |
Sanders Summary
Sanders, Arizona is a small town located in Apache County, Arizona. It is situated in the northeastern corner of the state, near the New Mexico border. The town was founded in 1881 and is named after the Sanders family, who were among the first settlers in the area. The population of Sanders was 1,072 as of the 2010 census.
History
The area around Sanders was first inhabited by the Navajo people, who had lived in the region for centuries. The first European settlers arrived in the area in the late 1800s, and the town of Sanders was established in 1881. The town was named after the Sanders family, who were among the first settlers in the area.
The town grew slowly over the years, and by the early 1900s, it had become a small but thriving community. The town was home to a number of businesses, including a general store, a hotel, a blacksmith shop, and a saloon.
Geography
Sanders is located in the northeastern corner of Arizona, near the New Mexico border. The town is situated in the Chuska Mountains, at an elevation of 5,845 feet. The town is surrounded by the Navajo Nation Reservation, which covers a large portion of the area.
The climate in Sanders is semi-arid, with hot summers and cold winters. The average annual temperature is 57°F, and the average annual precipitation is 11.5 inches.
Economy
The economy of Sanders is largely based on agriculture and tourism. The town is home to a number of farms, which produce a variety of crops, including corn, alfalfa, and hay. The town is also home to a number of tourist attractions, including the Chuska Mountains, the Navajo Nation Reservation, and the nearby Petrified Forest National Park.
Demographics
As of the 2010 census, the population of Sanders was 1,072. The racial makeup of the town was 94.3% Native American, 4.2% White, 0.3% Asian, and 0.2% from other races. The median household income was $25,000, and the median family income was $30,000.
Conclusion
Sanders, Arizona is a small town located in Apache County, Arizona. It was founded in 1881 and is named after the Sanders family, who were among the first settlers in the area. The town has a population of 1,072 and is largely based on agriculture and tourism. The town is surrounded by the Navajo Nation Reservation, and is home to a number of tourist attractions, including the Chuska Mountains, the Navajo Nation Reservation, and the nearby Petrified Forest National Park.
Common Questions
What is Per Capita Income in Sanders?
Per Capita income in Sanders is $15,429.
What is the Median Family Income in Sanders?
Median Family Income in Sanders is $28,844.
What is the Median Household income in Sanders?
Median Household Income in Sanders is $29,543.
What is Income or Wage Gap in Sanders?
Income or Wage Gap in Sanders is 34.2%.
Women in Sanders earn 65.8 cents for every dollar earned by a man.
What is Inequality or Gini Index in Sanders?
Inequality or Gini Index in Sanders is 0.33.
What is the Total Population of Sanders?
Total Population of Sanders is 696.
What is the Total Male Population of Sanders?
Total Male Population of Sanders is 324.
What is the Total Female Population of Sanders?
Total Female Population of Sanders is 372.
What is the Ratio of Males per 100 Females in Sanders?
There are 87.10 Males per 100 Females in Sanders.
What is the Ratio of Females per 100 Males in Sanders?
There are 114.81 Females per 100 Males in Sanders.
What is the Median Population Age in Sanders?
Median Population Age in Sanders is 27.4 Years.
What is the Average Family Size in Sanders
Average Family Size in Sanders is 3.2 People.
What is the Average Household Size in Sanders
Average Household Size in Sanders is 2.7 People.
How Large is the Labor Force in Sanders?
There are 239 People in the Labor Forcein in Sanders.
What is the Percentage of People in the Labor Force in Sanders?
54.8% of People are in the Labor Force in Sanders.
What is the Unemployment Rate in Sanders?
Unemployment Rate in Sanders is 1.3%.