Courtland, CA Map & Demographics
Courtland Map
Courtland Overview
$31,198
PER CAPITA INCOME
$68,980
AVG FAMILY INCOME
$68,742
AVG HOUSEHOLD INCOME
18.2%
WAGE / INCOME GAP [ % ]
81.8¢/ $1
WAGE / INCOME GAP [ $ ]
0.28
INEQUALITY / GINI INDEX
654
TOTAL POPULATION
305
MALE POPULATION
349
FEMALE POPULATION
87.39
MALES / 100 FEMALES
114.43
FEMALES / 100 MALES
54.2
MEDIAN AGE
3.4
AVG FAMILY SIZE
2.9
AVG HOUSEHOLD SIZE
296
LABOR FORCE [ PEOPLE ]
57.0%
PERCENT IN LABOR FORCE
Courtland Zip Codes
Courtland Area Codes
Income in Courtland
Income Overview in Courtland
Per Capita Income in Courtland is $31,198, while median incomes of families and households are $68,980 and $68,742 respectively.
| Characteristic | Number | Measure |
| Per Capita Income | 654 | $31,198 |
| Median Family Income | 180 | $68,980 |
| Mean Family Income | 180 | $82,027 |
| Median Household Income | 229 | $68,742 |
| Mean Household Income | 229 | $71,438 |
| Income Deficit | 180 | $0 |
| Wage / Income Gap (%) | 654 | 18.16% |
| Wage / Income Gap ($) | 654 | 81.84¢ per $1 |
| Gini / Inequality Index | 654 | 0.28 |
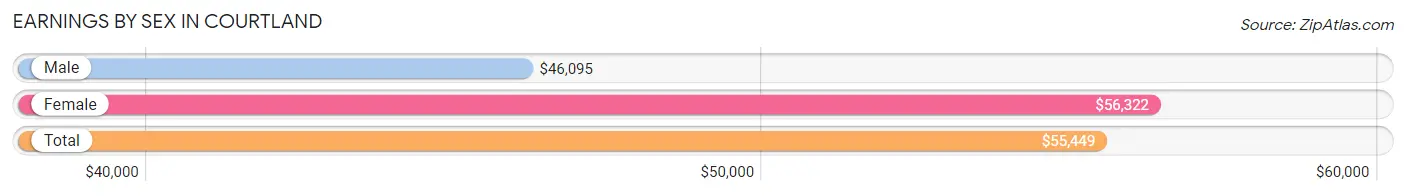
Earnings by Sex in Courtland
Average Earnings in Courtland are $55,449, $46,095 for men and $56,322 for women, a difference of 18.2%.
| Sex | Number | Average Earnings |
| Male | 109 (36.8%) | $46,095 |
| Female | 187 (63.2%) | $56,322 |
| Total | 296 (100.0%) | $55,449 |
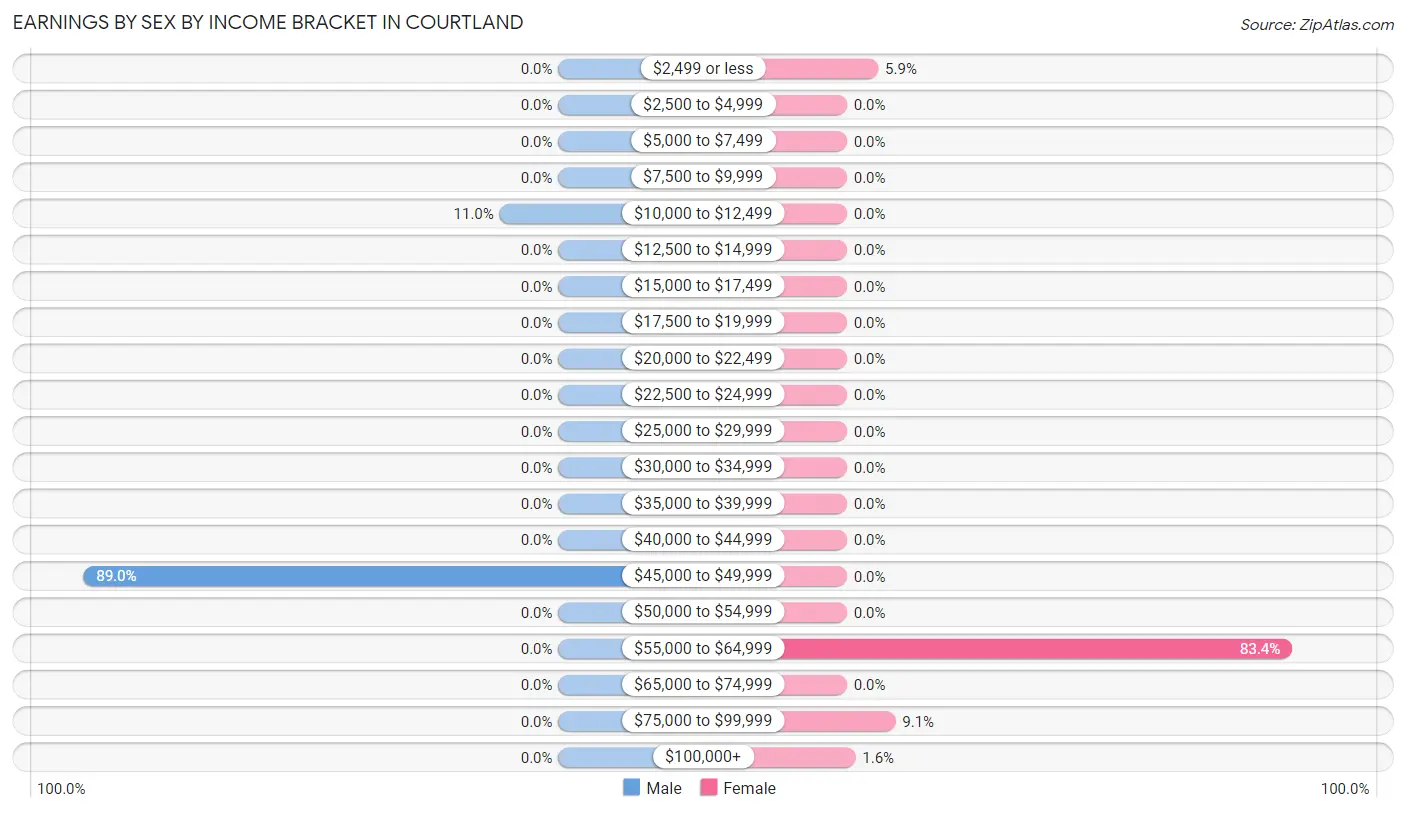
Earnings by Sex by Income Bracket in Courtland
The most common earnings brackets in Courtland are $45,000 to $49,999 for men (97 | 89.0%) and $55,000 to $64,999 for women (156 | 83.4%).
| Income | Male | Female |
| $2,499 or less | 0 (0.0%) | 11 (5.9%) |
| $2,500 to $4,999 | 0 (0.0%) | 0 (0.0%) |
| $5,000 to $7,499 | 0 (0.0%) | 0 (0.0%) |
| $7,500 to $9,999 | 0 (0.0%) | 0 (0.0%) |
| $10,000 to $12,499 | 12 (11.0%) | 0 (0.0%) |
| $12,500 to $14,999 | 0 (0.0%) | 0 (0.0%) |
| $15,000 to $17,499 | 0 (0.0%) | 0 (0.0%) |
| $17,500 to $19,999 | 0 (0.0%) | 0 (0.0%) |
| $20,000 to $22,499 | 0 (0.0%) | 0 (0.0%) |
| $22,500 to $24,999 | 0 (0.0%) | 0 (0.0%) |
| $25,000 to $29,999 | 0 (0.0%) | 0 (0.0%) |
| $30,000 to $34,999 | 0 (0.0%) | 0 (0.0%) |
| $35,000 to $39,999 | 0 (0.0%) | 0 (0.0%) |
| $40,000 to $44,999 | 0 (0.0%) | 0 (0.0%) |
| $45,000 to $49,999 | 97 (89.0%) | 0 (0.0%) |
| $50,000 to $54,999 | 0 (0.0%) | 0 (0.0%) |
| $55,000 to $64,999 | 0 (0.0%) | 156 (83.4%) |
| $65,000 to $74,999 | 0 (0.0%) | 0 (0.0%) |
| $75,000 to $99,999 | 0 (0.0%) | 17 (9.1%) |
| $100,000+ | 0 (0.0%) | 3 (1.6%) |
| Total | 109 (100.0%) | 187 (100.0%) |
Earnings by Sex by Educational Attainment in Courtland
| Educational Attainment | Male Income | Female Income |
| Less than High School | - | - |
| High School Diploma | - | - |
| College or Associate's Degree | - | - |
| Bachelor's Degree | - | - |
| Graduate Degree | - | - |
| Total | $46,095 | $56,322 |
Family Income in Courtland
Family Income Brackets in Courtland
According to the Courtland family income data, there are 152 families falling into the $50,000 to $74,999 income range, which is the most common income bracket and makes up 84.4% of all families.
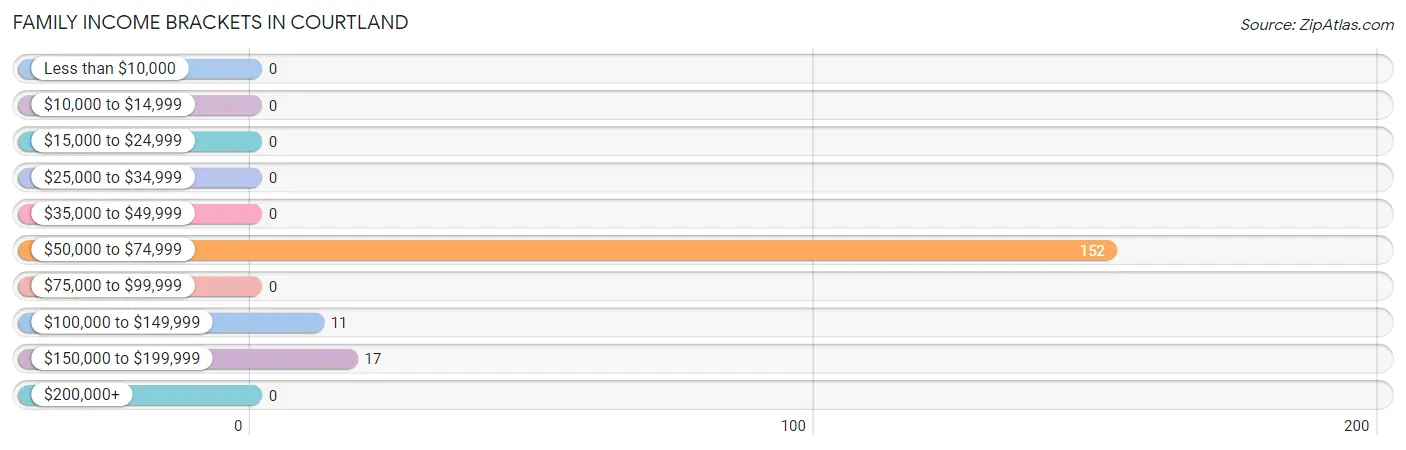
| Income Bracket | # Families | % Families |
| Less than $10,000 | 0 | 0.0% |
| $10,000 to $14,999 | 0 | 0.0% |
| $15,000 to $24,999 | 0 | 0.0% |
| $25,000 to $34,999 | 0 | 0.0% |
| $35,000 to $49,999 | 0 | 0.0% |
| $50,000 to $74,999 | 152 | 84.4% |
| $75,000 to $99,999 | 0 | 0.0% |
| $100,000 to $149,999 | 11 | 6.1% |
| $150,000 to $199,999 | 17 | 9.4% |
| $200,000+ | 0 | 0.0% |
Family Income by Famaliy Size in Courtland
| Income Bracket | # Families | Median Income |
| 2-Person Families | 100 (55.6%) | $0 |
| 3-Person Families | 8 (4.4%) | $0 |
| 4-Person Families | 72 (40.0%) | $0 |
| 5-Person Families | 0 (0.0%) | $0 |
| 6-Person Families | 0 (0.0%) | $0 |
| 7+ Person Families | 0 (0.0%) | $0 |
| Total | 180 (100.0%) | $68,980 |
Family Income by Number of Earners in Courtland
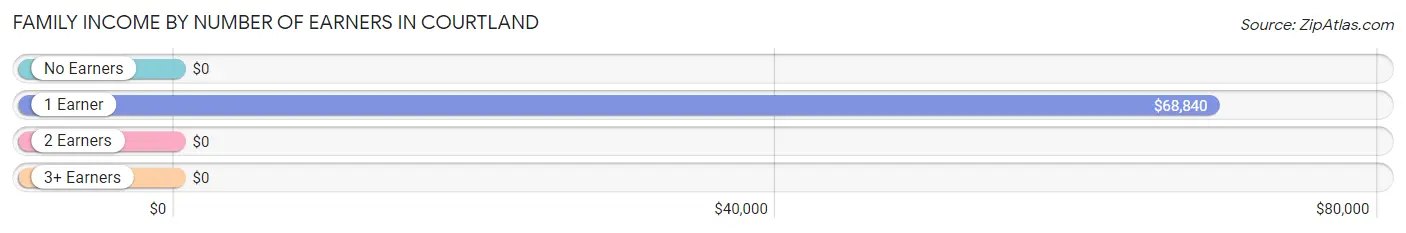
| Number of Earners | # Families | Median Income |
| No Earners | 0 (0.0%) | $0 |
| 1 Earner | 163 (90.6%) | $68,840 |
| 2 Earners | 0 (0.0%) | $0 |
| 3+ Earners | 17 (9.4%) | $0 |
| Total | 180 (100.0%) | $68,980 |
Household Income in Courtland
Household Income Brackets in Courtland
With 152 households falling in the category, the $50,000 to $74,999 income range is the most frequent in Courtland, accounting for 66.4% of all households.
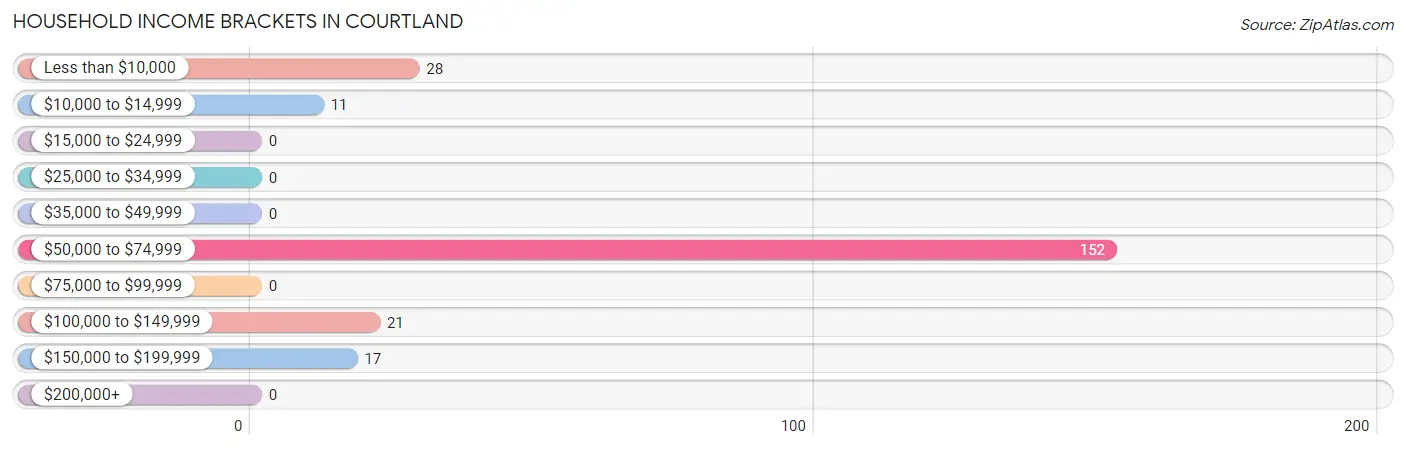
| Income Bracket | # Households | % Households |
| Less than $10,000 | 28 | 12.2% |
| $10,000 to $14,999 | 11 | 4.8% |
| $15,000 to $24,999 | 0 | 0.0% |
| $25,000 to $34,999 | 0 | 0.0% |
| $35,000 to $49,999 | 0 | 0.0% |
| $50,000 to $74,999 | 152 | 66.4% |
| $75,000 to $99,999 | 0 | 0.0% |
| $100,000 to $149,999 | 21 | 9.2% |
| $150,000 to $199,999 | 17 | 7.4% |
| $200,000+ | 0 | 0.0% |
Household Income by Householder Age in Courtland
| Income Bracket | # Households | Median Income |
| 15 to 24 Years | 0 (0.0%) | $0 |
| 25 to 44 Years | 58 (25.3%) | $0 |
| 45 to 64 Years | 64 (28.0%) | $0 |
| 65+ Years | 107 (46.7%) | $0 |
| Total | 229 (100.0%) | $68,742 |
Poverty in Courtland
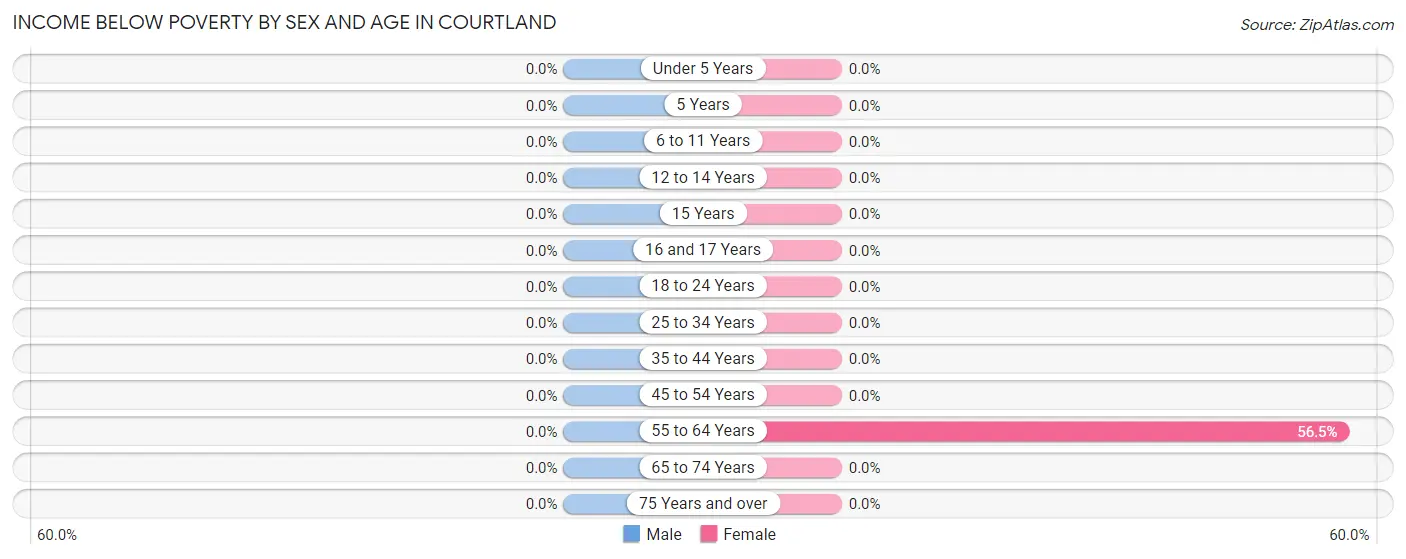
Income Below Poverty by Sex and Age in Courtland
| Age Bracket | Male | Female |
| Under 5 Years | 0 (0.0%) | 0 (0.0%) |
| 5 Years | 0 (0.0%) | 0 (0.0%) |
| 6 to 11 Years | 0 (0.0%) | 0 (0.0%) |
| 12 to 14 Years | 0 (0.0%) | 0 (0.0%) |
| 15 Years | 0 (0.0%) | 0 (0.0%) |
| 16 and 17 Years | 0 (0.0%) | 0 (0.0%) |
| 18 to 24 Years | 0 (0.0%) | 0 (0.0%) |
| 25 to 34 Years | 0 (0.0%) | 0 (0.0%) |
| 35 to 44 Years | 0 (0.0%) | 0 (0.0%) |
| 45 to 54 Years | 0 (0.0%) | 0 (0.0%) |
| 55 to 64 Years | 0 (0.0%) | 39 (56.5%) |
| 65 to 74 Years | 0 (0.0%) | 0 (0.0%) |
| 75 Years and over | 0 (0.0%) | 0 (0.0%) |
| Total | 0 (0.0%) | 39 (11.2%) |
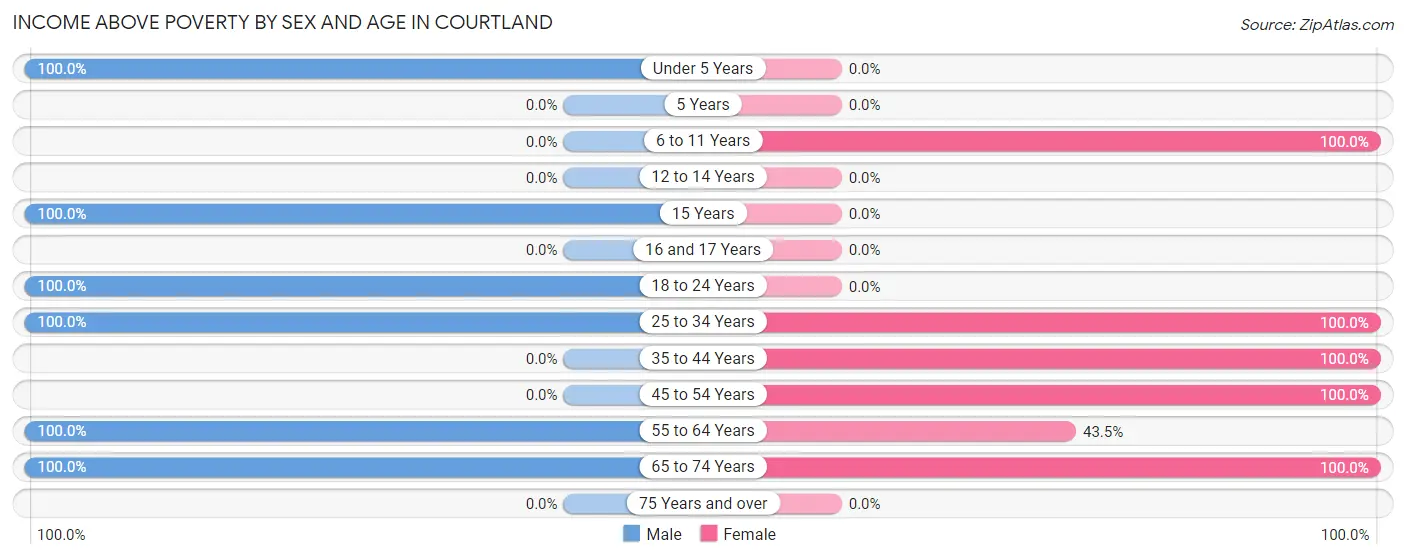
Income Above Poverty by Sex and Age in Courtland
According to the poverty statistics in Courtland, males aged under 5 years and females aged 6 to 11 years are the age groups that are most secure financially, with 100.0% of males and 100.0% of females in these age groups living above the poverty line.
| Age Bracket | Male | Female |
| Under 5 Years | 67 (100.0%) | 0 (0.0%) |
| 5 Years | 0 (0.0%) | 0 (0.0%) |
| 6 to 11 Years | 0 (0.0%) | 56 (100.0%) |
| 12 to 14 Years | 0 (0.0%) | 0 (0.0%) |
| 15 Years | 12 (100.0%) | 0 (0.0%) |
| 16 and 17 Years | 0 (0.0%) | 0 (0.0%) |
| 18 to 24 Years | 20 (100.0%) | 0 (0.0%) |
| 25 to 34 Years | 78 (100.0%) | 55 (100.0%) |
| 35 to 44 Years | 0 (0.0%) | 3 (100.0%) |
| 45 to 54 Years | 0 (0.0%) | 156 (100.0%) |
| 55 to 64 Years | 12 (100.0%) | 30 (43.5%) |
| 65 to 74 Years | 116 (100.0%) | 10 (100.0%) |
| 75 Years and over | 0 (0.0%) | 0 (0.0%) |
| Total | 305 (100.0%) | 310 (88.8%) |
Income Below Poverty Among Married-Couple Families in Courtland
| Children | Above Poverty | Below Poverty |
| No Children | 114 (100.0%) | 0 (0.0%) |
| 1 or 2 Children | 63 (100.0%) | 0 (0.0%) |
| 3 or 4 Children | 0 (0.0%) | 0 (0.0%) |
| 5 or more Children | 0 (0.0%) | 0 (0.0%) |
| Total | 177 (100.0%) | 0 (0.0%) |
Income Below Poverty Among Single-Parent Households in Courtland
| Children | Single Father | Single Mother |
| No Children | 0 (0.0%) | 0 (0.0%) |
| 1 or 2 Children | 0 (0.0%) | 0 (0.0%) |
| 3 or 4 Children | 0 (0.0%) | 0 (0.0%) |
| 5 or more Children | 0 (0.0%) | 0 (0.0%) |
| Total | 0 (0.0%) | 0 (0.0%) |
Income Below Poverty Among Married-Couple vs Single-Parent Households in Courtland
| Children | Married-Couple Families | Single-Parent Households |
| No Children | 0 (0.0%) | 0 (0.0%) |
| 1 or 2 Children | 0 (0.0%) | 0 (0.0%) |
| 3 or 4 Children | 0 (0.0%) | 0 (0.0%) |
| 5 or more Children | 0 (0.0%) | 0 (0.0%) |
| Total | 0 (0.0%) | 0 (0.0%) |
Race in Courtland
The most populous races in Courtland are White / Caucasian (349 | 53.4%), Hispanic or Latino (292 | 44.7%), and Two or more Races (216 | 33.0%).
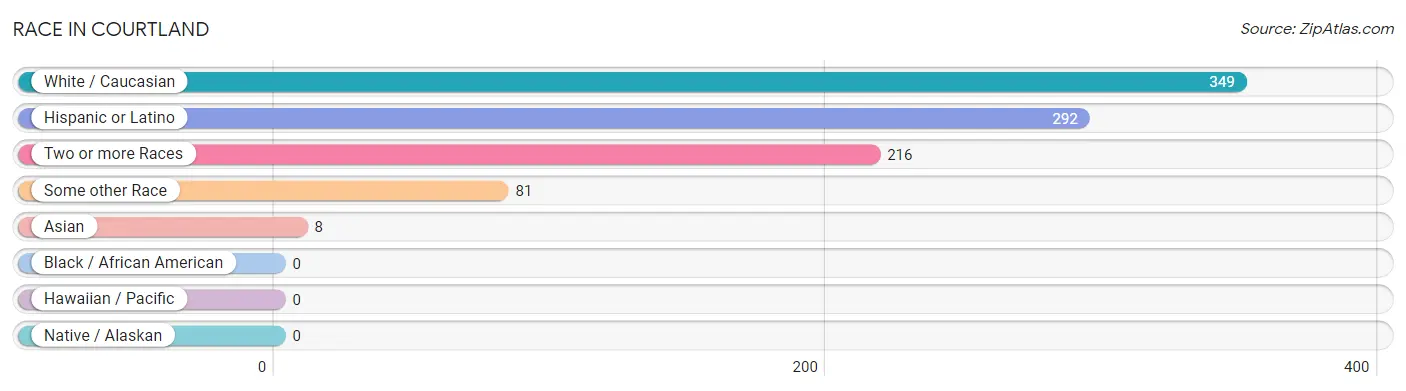
| Race | # Population | % Population |
| Asian | 8 | 1.2% |
| Black / African American | 0 | 0.0% |
| Hawaiian / Pacific | 0 | 0.0% |
| Hispanic or Latino | 292 | 44.7% |
| Native / Alaskan | 0 | 0.0% |
| White / Caucasian | 349 | 53.4% |
| Two or more Races | 216 | 33.0% |
| Some other Race | 81 | 12.4% |
| Total | 654 | 100.0% |
Ancestry in Courtland
The most populous ancestries reported in Courtland are Mexican (237 | 36.2%), Portuguese (179 | 27.4%), Scottish (123 | 18.8%), Polish (97 | 14.8%), and German (56 | 8.6%), together accounting for 105.8% of all Courtland residents.
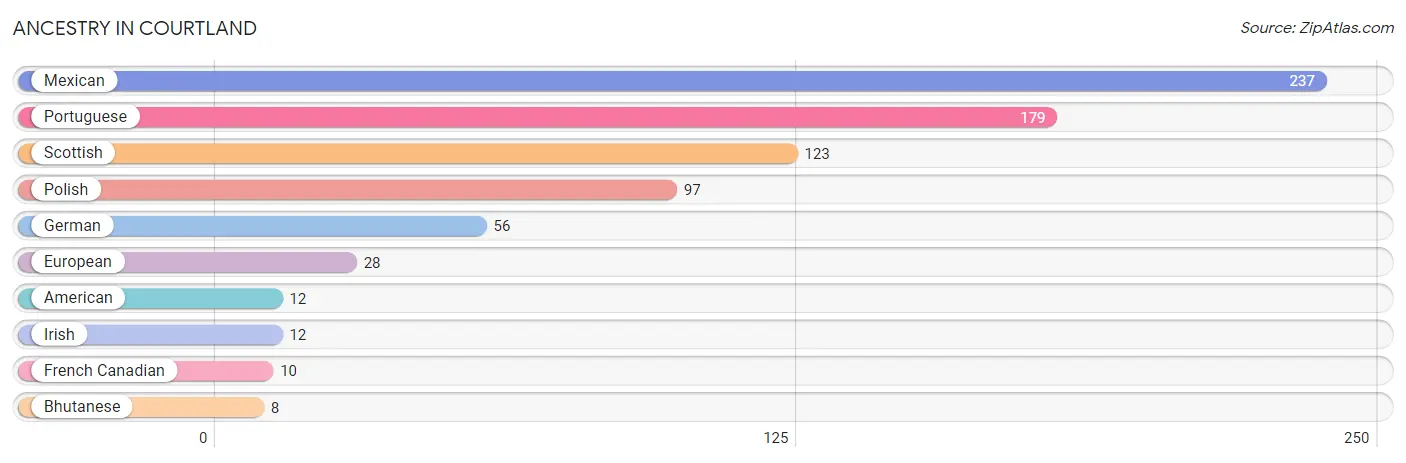
| Ancestry | # Population | % Population |
| American | 12 | 1.8% |
| Bhutanese | 8 | 1.2% |
| European | 28 | 4.3% |
| French Canadian | 10 | 1.5% |
| German | 56 | 8.6% |
| Irish | 12 | 1.8% |
| Mexican | 237 | 36.2% |
| Polish | 97 | 14.8% |
| Portuguese | 179 | 27.4% |
| Scottish | 123 | 18.8% | View All 10 Rows |
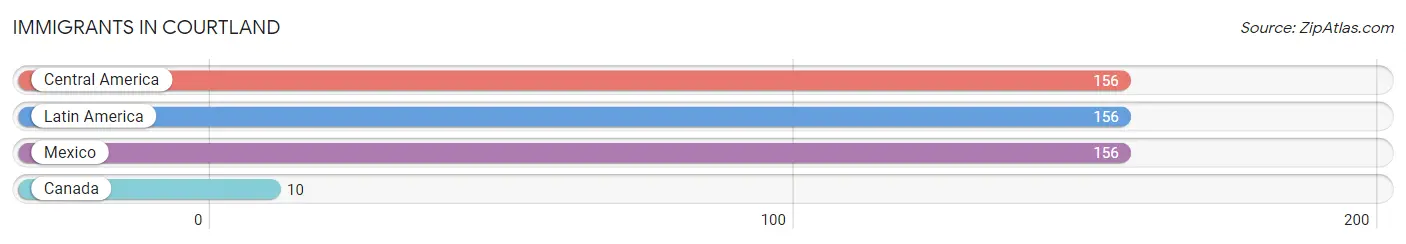
Immigrants in Courtland
The most numerous immigrant groups reported in Courtland came from Central America (156 | 23.8%), Latin America (156 | 23.8%), Mexico (156 | 23.8%), and Canada (10 | 1.5%), together accounting for 73.1% of all Courtland residents.
| Immigration Origin | # Population | % Population |
| Canada | 10 | 1.5% |
| Central America | 156 | 23.8% |
| Latin America | 156 | 23.8% |
| Mexico | 156 | 23.8% | View All 4 Rows |
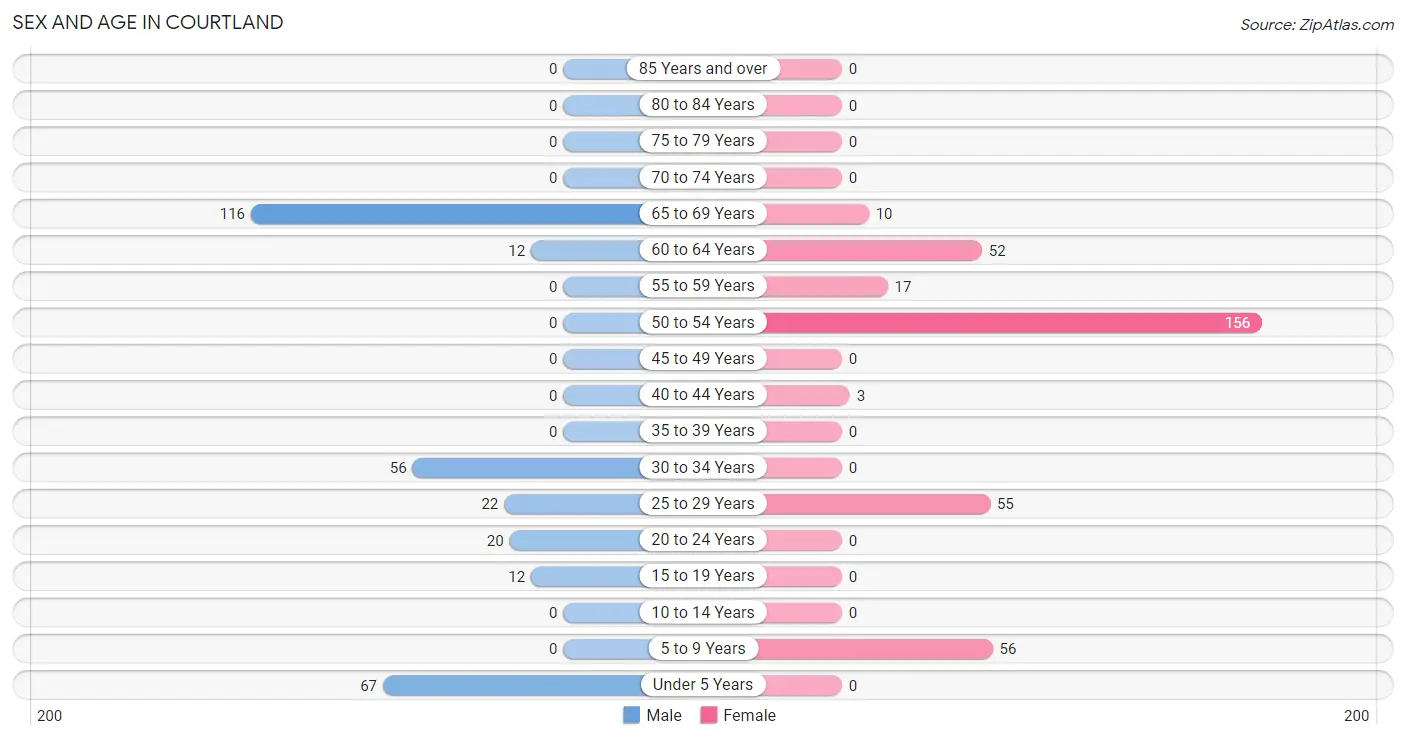
Sex and Age in Courtland
Sex and Age in Courtland
The most populous age groups in Courtland are 65 to 69 Years (116 | 38.0%) for men and 50 to 54 Years (156 | 44.7%) for women.
| Age Bracket | Male | Female |
| Under 5 Years | 67 (22.0%) | 0 (0.0%) |
| 5 to 9 Years | 0 (0.0%) | 56 (16.1%) |
| 10 to 14 Years | 0 (0.0%) | 0 (0.0%) |
| 15 to 19 Years | 12 (3.9%) | 0 (0.0%) |
| 20 to 24 Years | 20 (6.6%) | 0 (0.0%) |
| 25 to 29 Years | 22 (7.2%) | 55 (15.8%) |
| 30 to 34 Years | 56 (18.4%) | 0 (0.0%) |
| 35 to 39 Years | 0 (0.0%) | 0 (0.0%) |
| 40 to 44 Years | 0 (0.0%) | 3 (0.9%) |
| 45 to 49 Years | 0 (0.0%) | 0 (0.0%) |
| 50 to 54 Years | 0 (0.0%) | 156 (44.7%) |
| 55 to 59 Years | 0 (0.0%) | 17 (4.9%) |
| 60 to 64 Years | 12 (3.9%) | 52 (14.9%) |
| 65 to 69 Years | 116 (38.0%) | 10 (2.9%) |
| 70 to 74 Years | 0 (0.0%) | 0 (0.0%) |
| 75 to 79 Years | 0 (0.0%) | 0 (0.0%) |
| 80 to 84 Years | 0 (0.0%) | 0 (0.0%) |
| 85 Years and over | 0 (0.0%) | 0 (0.0%) |
| Total | 305 (100.0%) | 349 (100.0%) |
Families and Households in Courtland
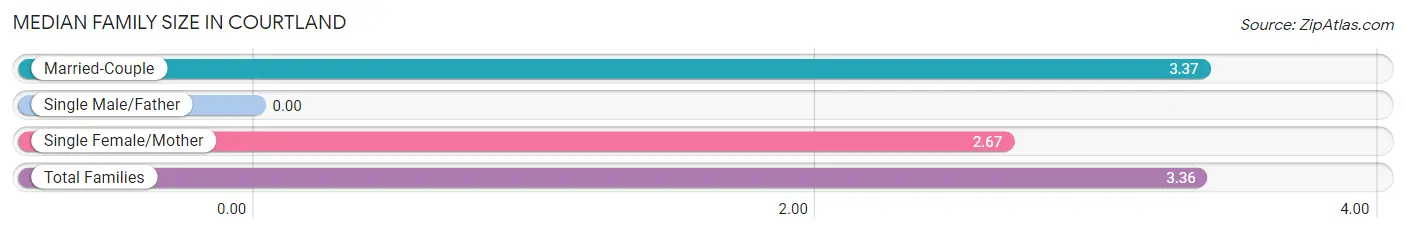
Median Family Size in Courtland
| Family Type | # Families | Family Size |
| Married-Couple | 177 (98.3%) | 3.37 |
| Single Male/Father | 0 (0.0%) | - |
| Single Female/Mother | 3 (1.7%) | 2.67 |
| Total Families | 180 (100.0%) | 3.36 |
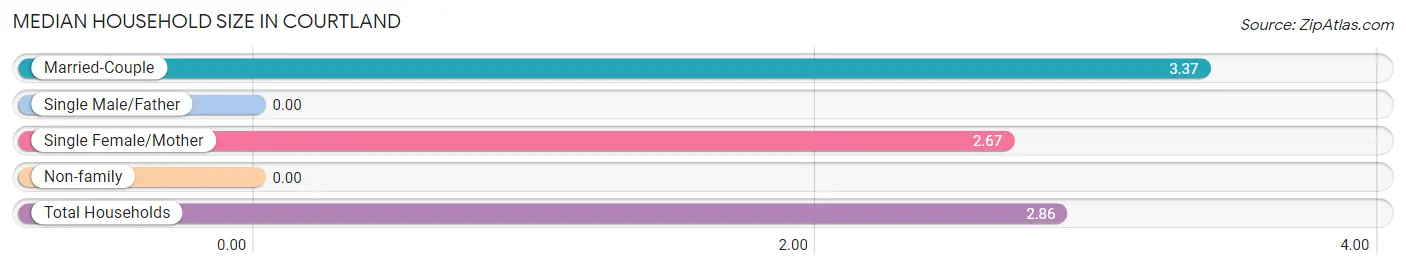
Median Household Size in Courtland
| Household Type | # Households | Household Size |
| Married-Couple | 177 (77.3%) | 3.37 |
| Single Male/Father | 0 (0.0%) | - |
| Single Female/Mother | 3 (1.3%) | 2.67 |
| Non-family | 49 (21.4%) | - |
| Total Households | 229 (100.0%) | 2.86 |
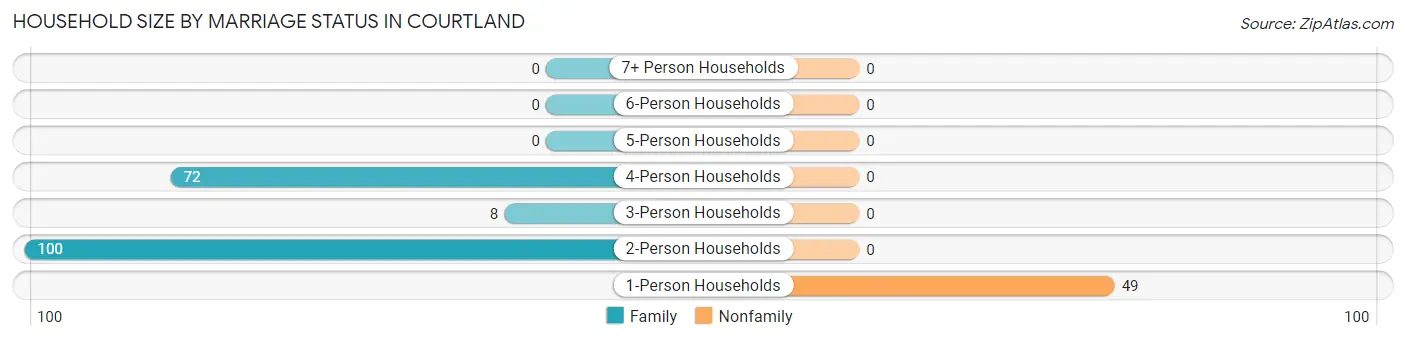
Household Size by Marriage Status in Courtland
Out of a total of 229 households in Courtland, 180 (78.6%) are family households, while 49 (21.4%) are nonfamily households. The most numerous type of family households are 2-person households, comprising 100, and the most common type of nonfamily households are 1-person households, comprising 49.
| Household Size | Family Households | Nonfamily Households |
| 1-Person Households | - | 49 (21.4%) |
| 2-Person Households | 100 (43.7%) | 0 (0.0%) |
| 3-Person Households | 8 (3.5%) | 0 (0.0%) |
| 4-Person Households | 72 (31.4%) | 0 (0.0%) |
| 5-Person Households | 0 (0.0%) | 0 (0.0%) |
| 6-Person Households | 0 (0.0%) | 0 (0.0%) |
| 7+ Person Households | 0 (0.0%) | 0 (0.0%) |
| Total | 180 (78.6%) | 49 (21.4%) |
Female Fertility in Courtland
Fertility by Age in Courtland
| Age Bracket | Women with Births | Births / 1,000 Women |
| 15 to 19 years | 0 (0.0%) | 0.0 |
| 20 to 34 years | 0 (0.0%) | 0.0 |
| 35 to 50 years | 0 (0.0%) | 0.0 |
| Total | 0 (0.0%) | 0.0 |
Fertility by Age by Marriage Status in Courtland
| Age Bracket | Married | Unmarried |
| 15 to 19 years | 0 (0.0%) | 0 (0.0%) |
| 20 to 34 years | 0 (0.0%) | 0 (0.0%) |
| 35 to 50 years | 0 (0.0%) | 0 (0.0%) |
| Total | 0 (0.0%) | 0 (0.0%) |
Fertility by Education in Courtland
| Educational Attainment | Women with Births | Births / 1,000 Women |
| Less than High School | 0 (0.0%) | 0.0 |
| High School Diploma | 0 (0.0%) | 0.0 |
| College or Associate's Degree | 0 (0.0%) | 0.0 |
| Bachelor's Degree | 0 (0.0%) | 0.0 |
| Graduate Degree | 0 (0.0%) | 0.0 |
| Total | 0 (0.0%) | 0.0 |
Fertility by Education by Marriage Status in Courtland
| Educational Attainment | Married | Unmarried |
| Less than High School | 0 (0.0%) | 0 (0.0%) |
| High School Diploma | 0 (0.0%) | 0 (0.0%) |
| College or Associate's Degree | 0 (0.0%) | 0 (0.0%) |
| Bachelor's Degree | 0 (0.0%) | 0 (0.0%) |
| Graduate Degree | 0 (0.0%) | 0 (0.0%) |
| Total | 0 (0.0%) | 0 (0.0%) |
Employment Characteristics in Courtland
Employment by Class of Employer in Courtland
Among the 296 employed individuals in Courtland, state government employees (229 | 77.4%), private company employees (52 | 17.6%), and self-employed (not incorporated) (12 | 4.1%) make up the most common classes of employment.
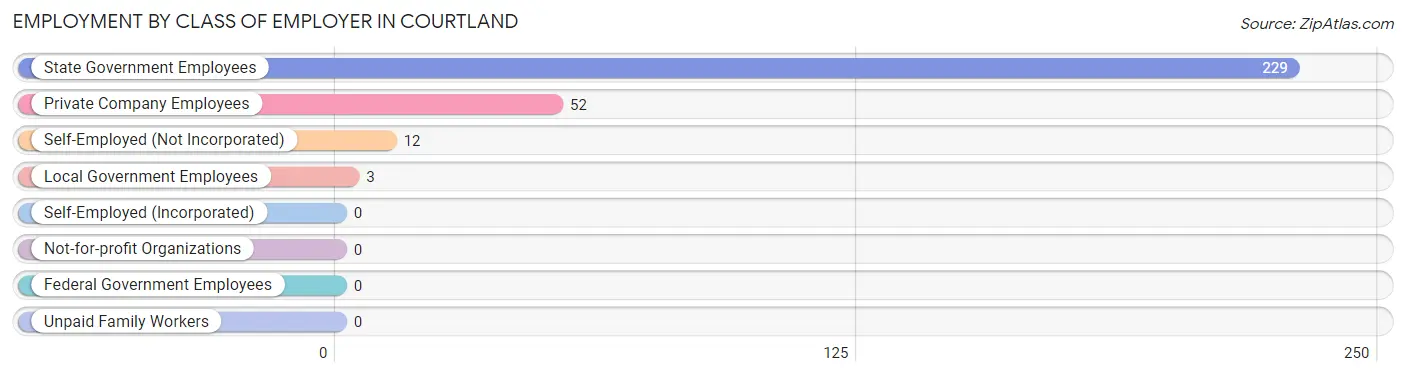
| Employer Class | # Employees | % Employees |
| Private Company Employees | 52 | 17.6% |
| Self-Employed (Incorporated) | 0 | 0.0% |
| Self-Employed (Not Incorporated) | 12 | 4.1% |
| Not-for-profit Organizations | 0 | 0.0% |
| Local Government Employees | 3 | 1.0% |
| State Government Employees | 229 | 77.4% |
| Federal Government Employees | 0 | 0.0% |
| Unpaid Family Workers | 0 | 0.0% |
| Total | 296 | 100.0% |
Employment Status by Age in Courtland
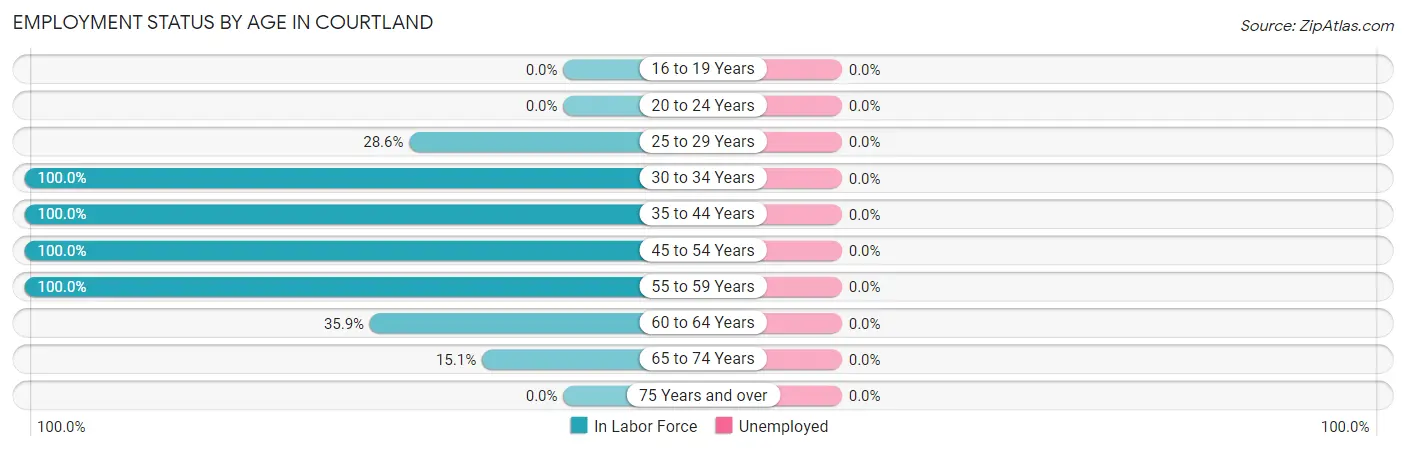
| Age Bracket | In Labor Force | Unemployed |
| 16 to 19 Years | 0 (0.0%) | 0 (0.0%) |
| 20 to 24 Years | 0 (0.0%) | 0 (0.0%) |
| 25 to 29 Years | 22 (28.6%) | 0 (0.0%) |
| 30 to 34 Years | 56 (100.0%) | 0 (0.0%) |
| 35 to 44 Years | 3 (100.0%) | 0 (0.0%) |
| 45 to 54 Years | 156 (100.0%) | 0 (0.0%) |
| 55 to 59 Years | 17 (100.0%) | 0 (0.0%) |
| 60 to 64 Years | 23 (35.9%) | 0 (0.0%) |
| 65 to 74 Years | 19 (15.1%) | 0 (0.0%) |
| 75 Years and over | 0 (0.0%) | 0 (0.0%) |
| Total | 296 (57.0%) | 0 (0.0%) |
Employment Status by Educational Attainment in Courtland
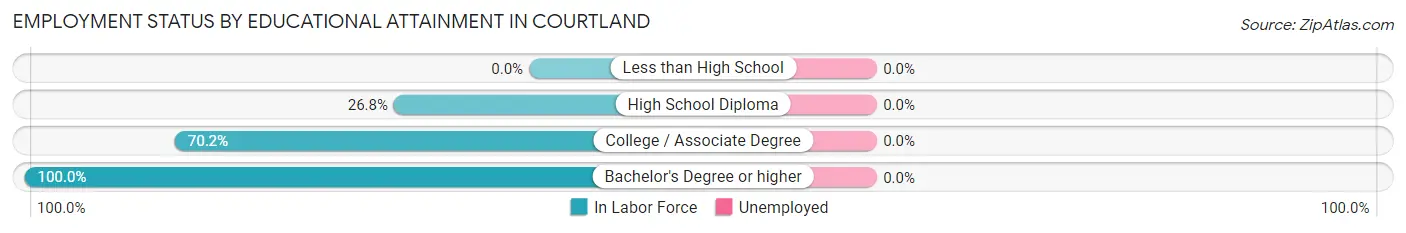
| Educational Attainment | In Labor Force | Unemployed |
| Less than High School | 0 (0.0%) | 0 (0.0%) |
| High School Diploma | 22 (26.8%) | 0 (0.0%) |
| College / Associate Degree | 85 (70.2%) | 0 (0.0%) |
| Bachelor's Degree or higher | 170 (100.0%) | 0 (0.0%) |
| Total | 277 (74.3%) | 0 (0.0%) |
Employment Occupations by Sex in Courtland
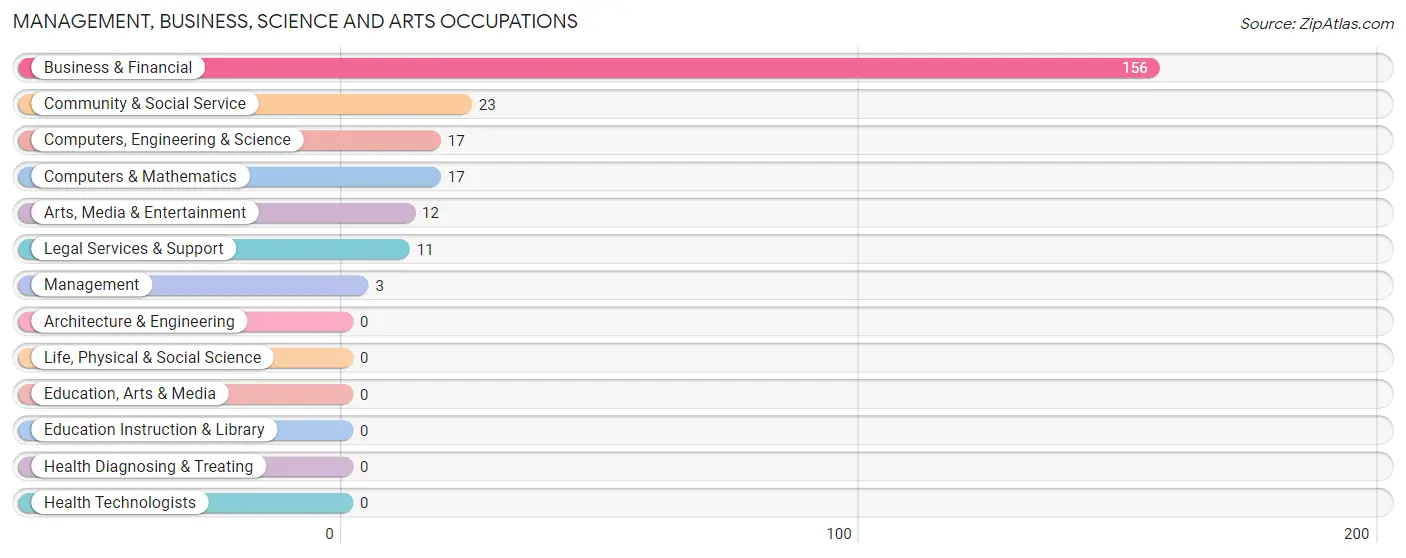
Management, Business, Science and Arts Occupations
The most common Management, Business, Science and Arts occupations in Courtland are Business & Financial (156 | 52.7%), Community & Social Service (23 | 7.8%), Computers, Engineering & Science (17 | 5.7%), Computers & Mathematics (17 | 5.7%), and Arts, Media & Entertainment (12 | 4.1%).
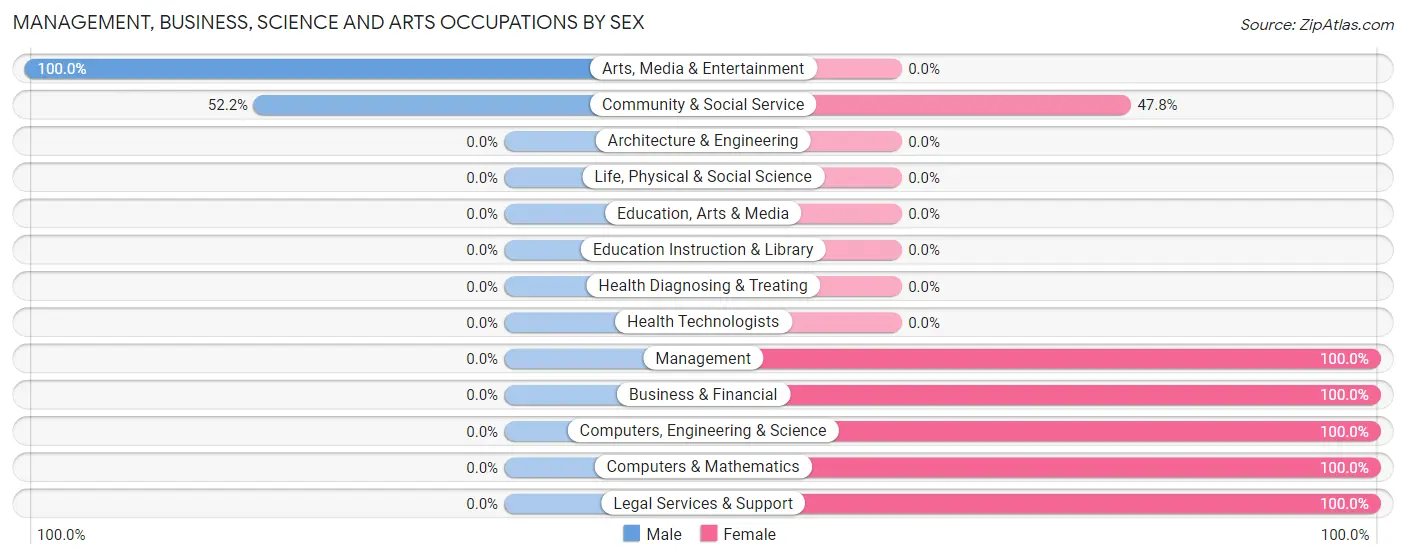
Management, Business, Science and Arts Occupations by Sex
Within the Management, Business, Science and Arts occupations in Courtland, the most male-oriented occupations are Arts, Media & Entertainment (100.0%), and Community & Social Service (52.2%), while the most female-oriented occupations are Management (100.0%), Business & Financial (100.0%), and Computers, Engineering & Science (100.0%).
| Occupation | Male | Female |
| Management | 0 (0.0%) | 3 (100.0%) |
| Business & Financial | 0 (0.0%) | 156 (100.0%) |
| Computers, Engineering & Science | 0 (0.0%) | 17 (100.0%) |
| Computers & Mathematics | 0 (0.0%) | 17 (100.0%) |
| Architecture & Engineering | 0 (0.0%) | 0 (0.0%) |
| Life, Physical & Social Science | 0 (0.0%) | 0 (0.0%) |
| Community & Social Service | 12 (52.2%) | 11 (47.8%) |
| Education, Arts & Media | 0 (0.0%) | 0 (0.0%) |
| Legal Services & Support | 0 (0.0%) | 11 (100.0%) |
| Education Instruction & Library | 0 (0.0%) | 0 (0.0%) |
| Arts, Media & Entertainment | 12 (100.0%) | 0 (0.0%) |
| Health Diagnosing & Treating | 0 (0.0%) | 0 (0.0%) |
| Health Technologists | 0 (0.0%) | 0 (0.0%) |
| Total (Category) | 12 (6.0%) | 187 (94.0%) |
| Total (Overall) | 109 (36.8%) | 187 (63.2%) |
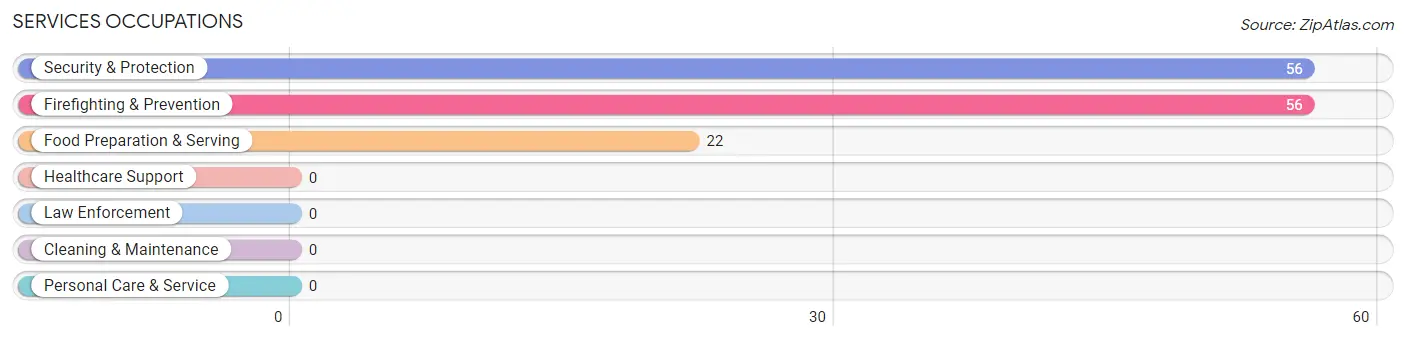
Services Occupations
The most common Services occupations in Courtland are Security & Protection (56 | 18.9%), Firefighting & Prevention (56 | 18.9%), and Food Preparation & Serving (22 | 7.4%).
Services Occupations by Sex
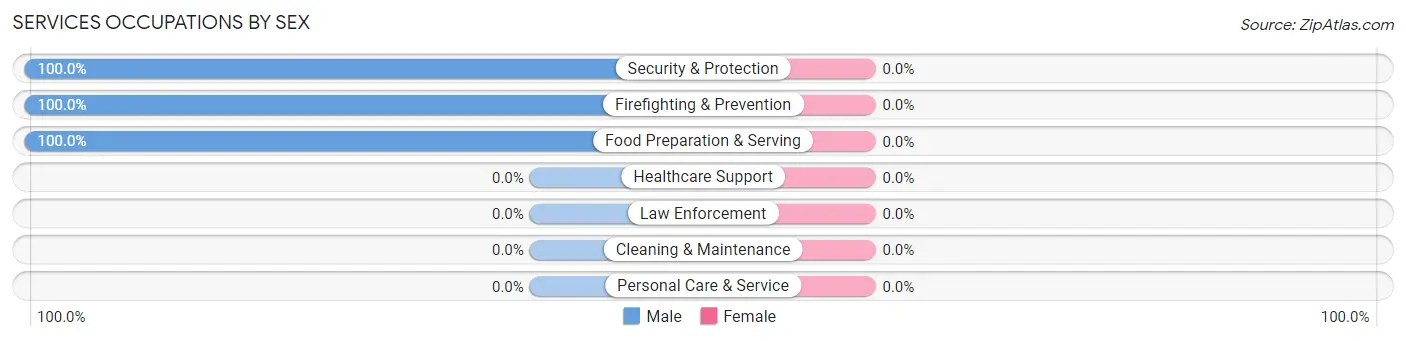
| Occupation | Male | Female |
| Healthcare Support | 0 (0.0%) | 0 (0.0%) |
| Security & Protection | 56 (100.0%) | 0 (0.0%) |
| Firefighting & Prevention | 56 (100.0%) | 0 (0.0%) |
| Law Enforcement | 0 (0.0%) | 0 (0.0%) |
| Food Preparation & Serving | 22 (100.0%) | 0 (0.0%) |
| Cleaning & Maintenance | 0 (0.0%) | 0 (0.0%) |
| Personal Care & Service | 0 (0.0%) | 0 (0.0%) |
| Total (Category) | 78 (100.0%) | 0 (0.0%) |
| Total (Overall) | 109 (36.8%) | 187 (63.2%) |
Sales and Office Occupations
The most common Sales and Office occupations in Courtland are , and Office & Administration (19 | 6.4%).
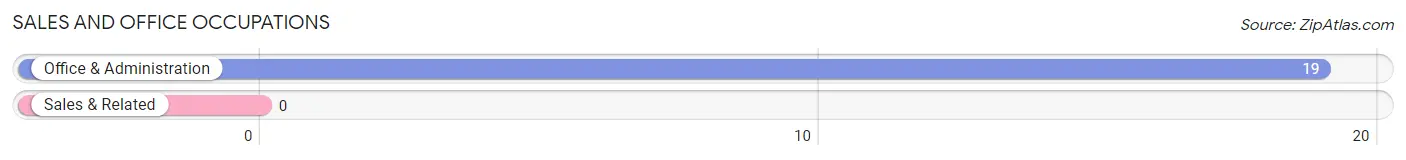
Sales and Office Occupations by Sex
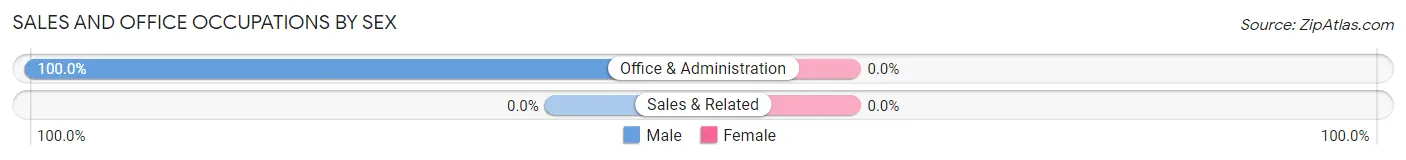
| Occupation | Male | Female |
| Sales & Related | 0 (0.0%) | 0 (0.0%) |
| Office & Administration | 19 (100.0%) | 0 (0.0%) |
| Total (Category) | 19 (100.0%) | 0 (0.0%) |
| Total (Overall) | 109 (36.8%) | 187 (63.2%) |
Natural Resources, Construction and Maintenance Occupations
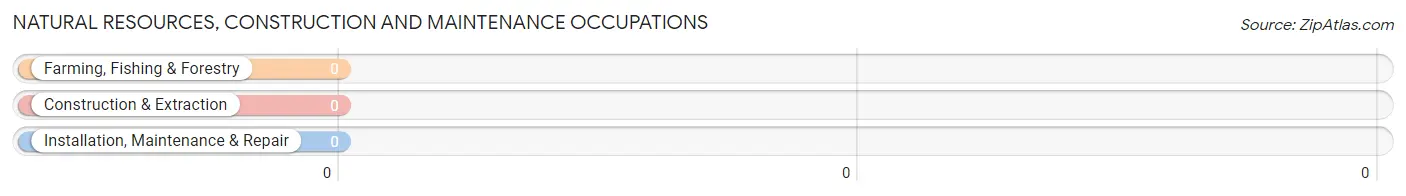
Natural Resources, Construction and Maintenance Occupations by Sex
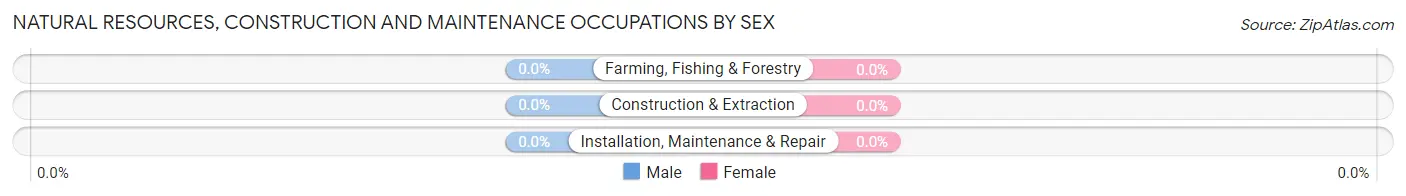
| Occupation | Male | Female |
| Farming, Fishing & Forestry | 0 (0.0%) | 0 (0.0%) |
| Construction & Extraction | 0 (0.0%) | 0 (0.0%) |
| Installation, Maintenance & Repair | 0 (0.0%) | 0 (0.0%) |
| Total (Category) | 0 (0.0%) | 0 (0.0%) |
| Total (Overall) | 109 (36.8%) | 187 (63.2%) |
Production, Transportation and Moving Occupations
Production, Transportation and Moving Occupations by Sex
| Occupation | Male | Female |
| Production | 0 (0.0%) | 0 (0.0%) |
| Transportation | 0 (0.0%) | 0 (0.0%) |
| Material Moving | 0 (0.0%) | 0 (0.0%) |
| Total (Category) | 0 (0.0%) | 0 (0.0%) |
| Total (Overall) | 109 (36.8%) | 187 (63.2%) |
Employment Industries by Sex in Courtland
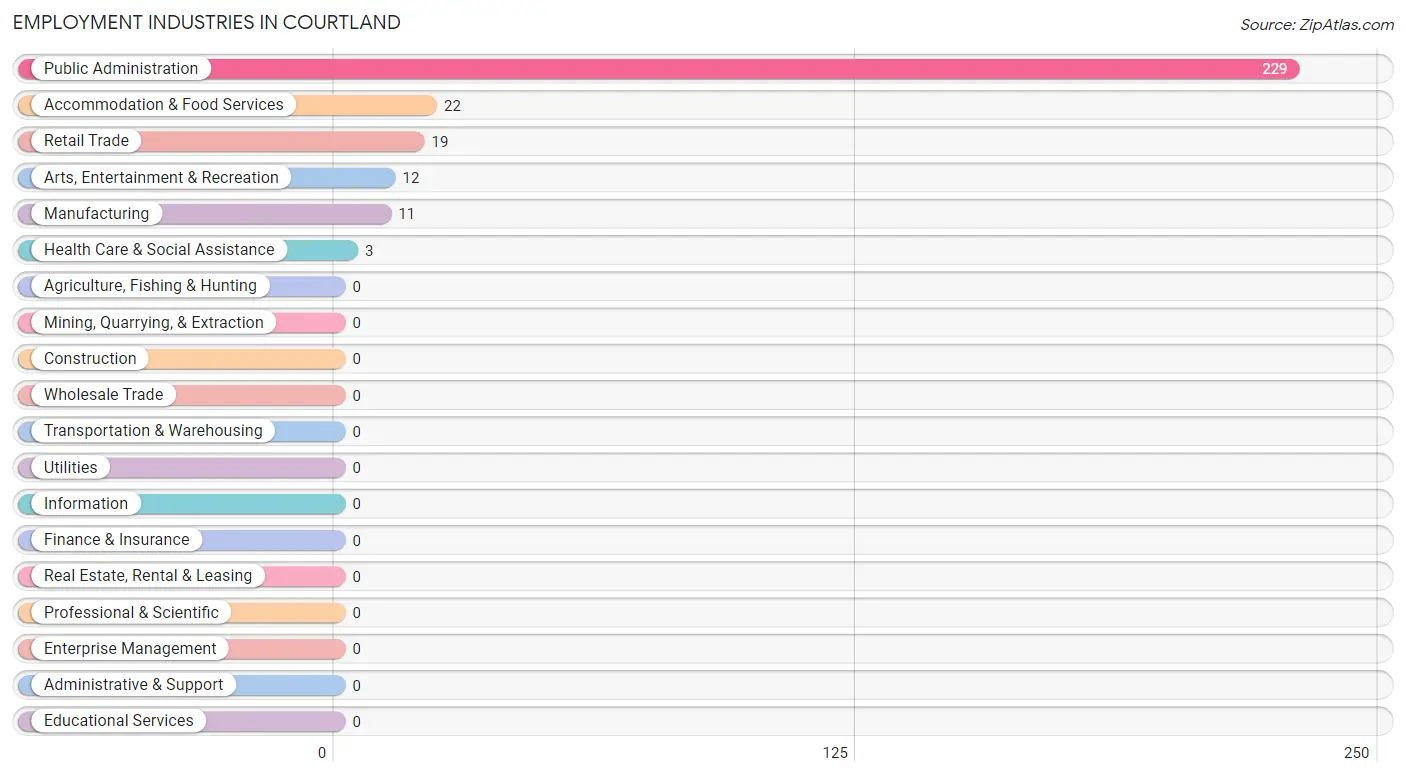
Employment Industries in Courtland
The major employment industries in Courtland include Public Administration (229 | 77.4%), Accommodation & Food Services (22 | 7.4%), Retail Trade (19 | 6.4%), Arts, Entertainment & Recreation (12 | 4.1%), and Manufacturing (11 | 3.7%).
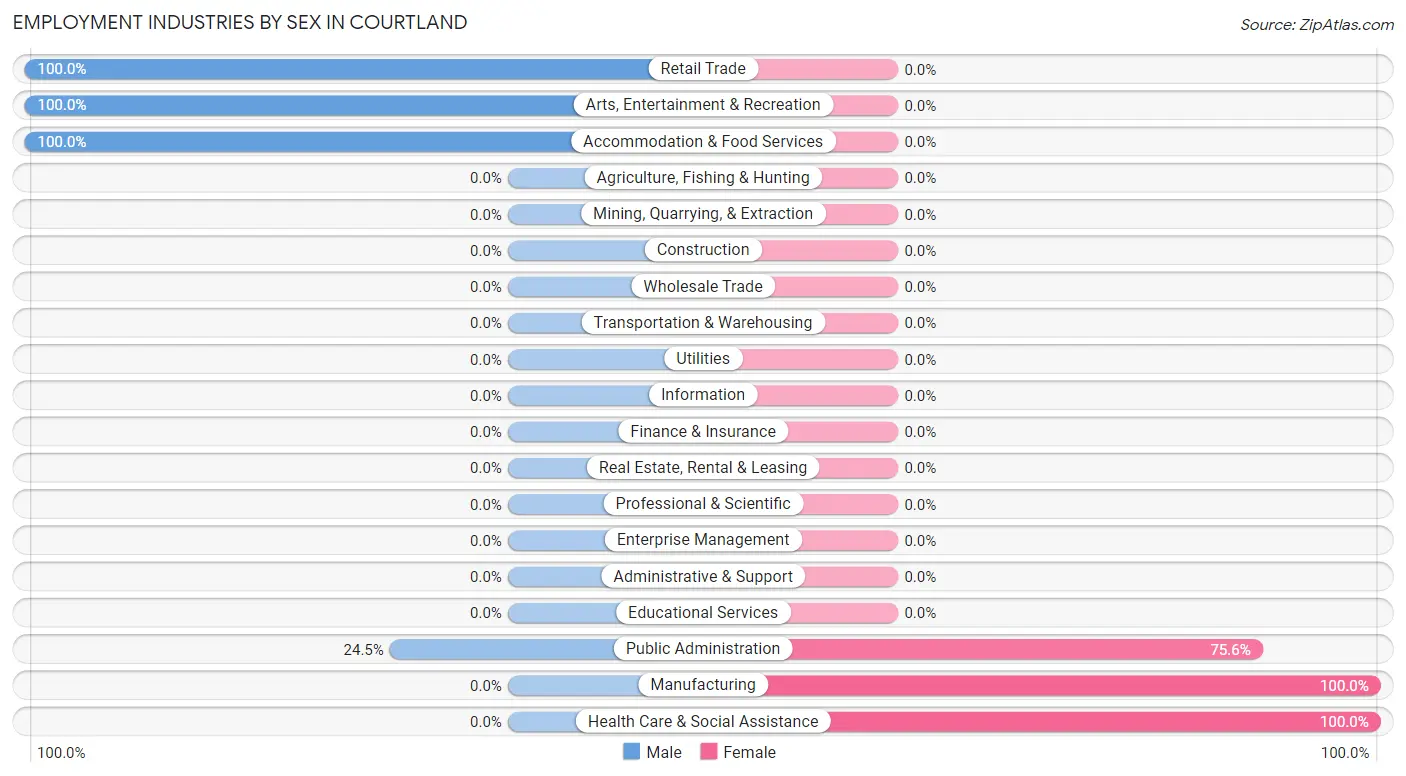
Employment Industries by Sex in Courtland
The Courtland industries that see more men than women are Retail Trade (100.0%), Arts, Entertainment & Recreation (100.0%), and Accommodation & Food Services (100.0%), whereas the industries that tend to have a higher number of women are Manufacturing (100.0%), Health Care & Social Assistance (100.0%), and Public Administration (75.5%).
| Industry | Male | Female |
| Agriculture, Fishing & Hunting | 0 (0.0%) | 0 (0.0%) |
| Mining, Quarrying, & Extraction | 0 (0.0%) | 0 (0.0%) |
| Construction | 0 (0.0%) | 0 (0.0%) |
| Manufacturing | 0 (0.0%) | 11 (100.0%) |
| Wholesale Trade | 0 (0.0%) | 0 (0.0%) |
| Retail Trade | 19 (100.0%) | 0 (0.0%) |
| Transportation & Warehousing | 0 (0.0%) | 0 (0.0%) |
| Utilities | 0 (0.0%) | 0 (0.0%) |
| Information | 0 (0.0%) | 0 (0.0%) |
| Finance & Insurance | 0 (0.0%) | 0 (0.0%) |
| Real Estate, Rental & Leasing | 0 (0.0%) | 0 (0.0%) |
| Professional & Scientific | 0 (0.0%) | 0 (0.0%) |
| Enterprise Management | 0 (0.0%) | 0 (0.0%) |
| Administrative & Support | 0 (0.0%) | 0 (0.0%) |
| Educational Services | 0 (0.0%) | 0 (0.0%) |
| Health Care & Social Assistance | 0 (0.0%) | 3 (100.0%) |
| Arts, Entertainment & Recreation | 12 (100.0%) | 0 (0.0%) |
| Accommodation & Food Services | 22 (100.0%) | 0 (0.0%) |
| Public Administration | 56 (24.4%) | 173 (75.5%) |
| Total | 109 (36.8%) | 187 (63.2%) |
Education in Courtland
School Enrollment in Courtland
The most common levels of schooling among the 144 students in Courtland are college / undergraduate (76 | 52.8%), kindergarten (56 | 38.9%), and high school (12 | 8.3%).
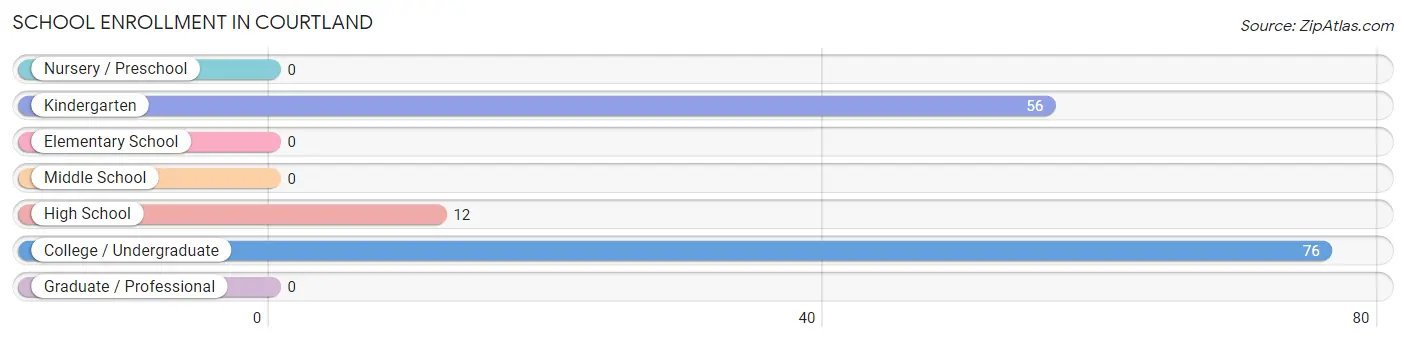
| School Level | # Students | % Students |
| Nursery / Preschool | 0 | 0.0% |
| Kindergarten | 56 | 38.9% |
| Elementary School | 0 | 0.0% |
| Middle School | 0 | 0.0% |
| High School | 12 | 8.3% |
| College / Undergraduate | 76 | 52.8% |
| Graduate / Professional | 0 | 0.0% |
| Total | 144 | 100.0% |
School Enrollment by Age by Funding Source in Courtland
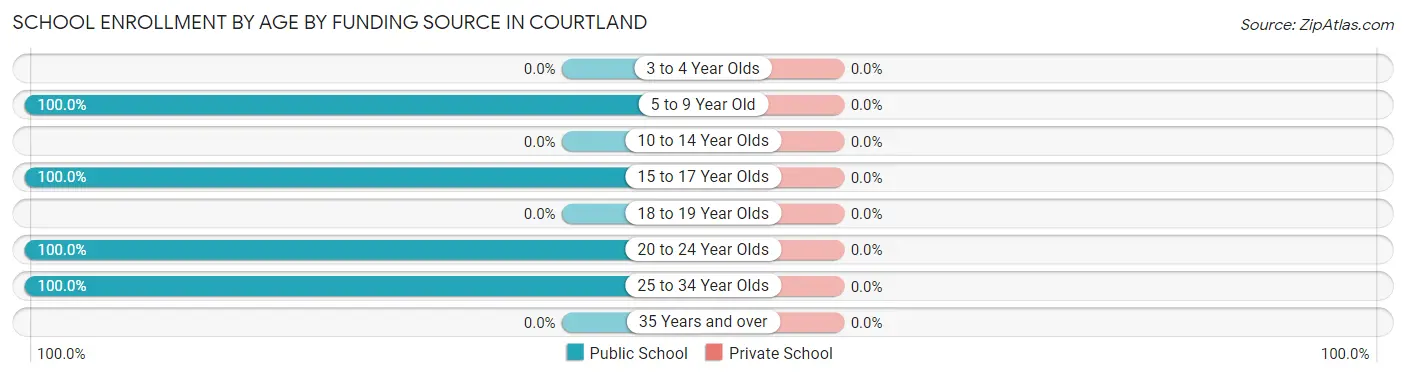
| Age Bracket | Public School | Private School |
| 3 to 4 Year Olds | 0 (0.0%) | 0 (0.0%) |
| 5 to 9 Year Old | 56 (100.0%) | 0 (0.0%) |
| 10 to 14 Year Olds | 0 (0.0%) | 0 (0.0%) |
| 15 to 17 Year Olds | 12 (100.0%) | 0 (0.0%) |
| 18 to 19 Year Olds | 0 (0.0%) | 0 (0.0%) |
| 20 to 24 Year Olds | 20 (100.0%) | 0 (0.0%) |
| 25 to 34 Year Olds | 56 (100.0%) | 0 (0.0%) |
| 35 Years and over | 0 (0.0%) | 0 (0.0%) |
| Total | 144 (100.0%) | 0 (0.0%) |
Educational Attainment by Field of Study in Courtland
Business (156 | 82.1%), social sciences (11 | 5.8%), psychology (10 | 5.3%), liberal arts & history (10 | 5.3%), and arts & humanities (3 | 1.6%) are the most common fields of study among 190 individuals in Courtland who have obtained a bachelor's degree or higher.
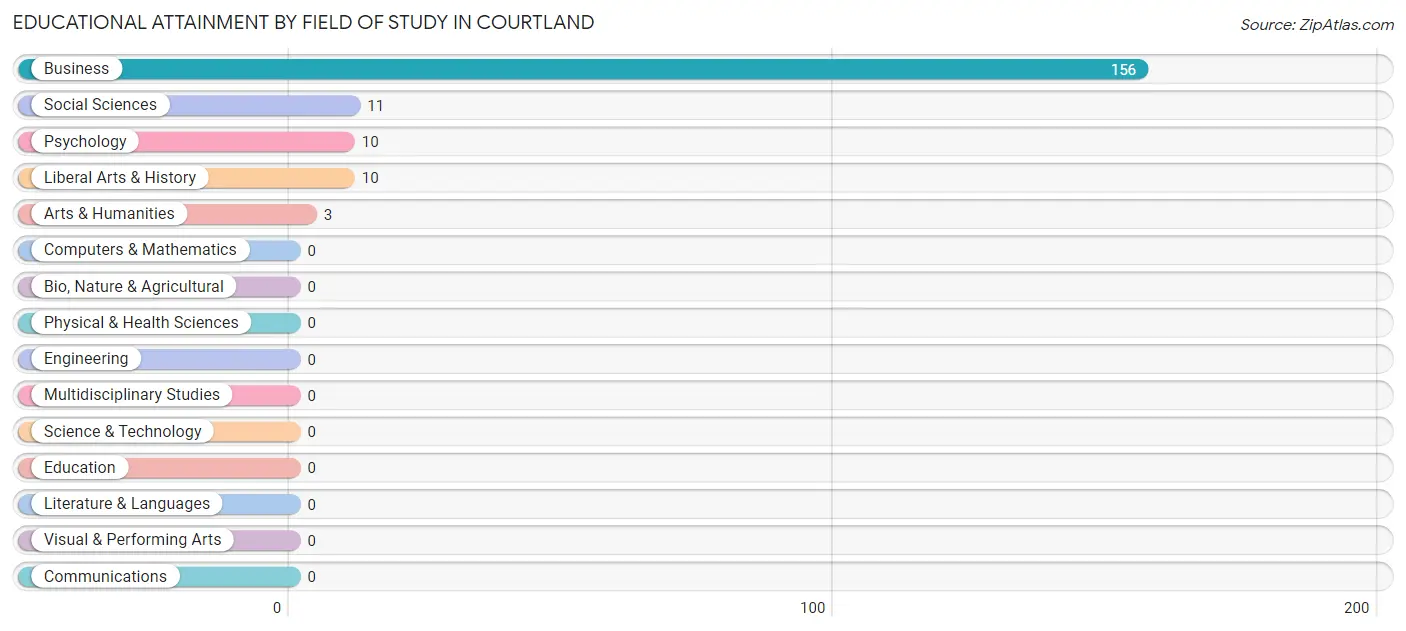
| Field of Study | # Graduates | % Graduates |
| Computers & Mathematics | 0 | 0.0% |
| Bio, Nature & Agricultural | 0 | 0.0% |
| Physical & Health Sciences | 0 | 0.0% |
| Psychology | 10 | 5.3% |
| Social Sciences | 11 | 5.8% |
| Engineering | 0 | 0.0% |
| Multidisciplinary Studies | 0 | 0.0% |
| Science & Technology | 0 | 0.0% |
| Business | 156 | 82.1% |
| Education | 0 | 0.0% |
| Literature & Languages | 0 | 0.0% |
| Liberal Arts & History | 10 | 5.3% |
| Visual & Performing Arts | 0 | 0.0% |
| Communications | 0 | 0.0% |
| Arts & Humanities | 3 | 1.6% |
| Total | 190 | 100.0% |
Transportation & Commute in Courtland
Vehicle Availability by Sex in Courtland
The most prevalent vehicle ownership categories in Courtland are males with 2 vehicles (109, accounting for 100.0%) and females with 2 vehicles (17, making up 58.3%).
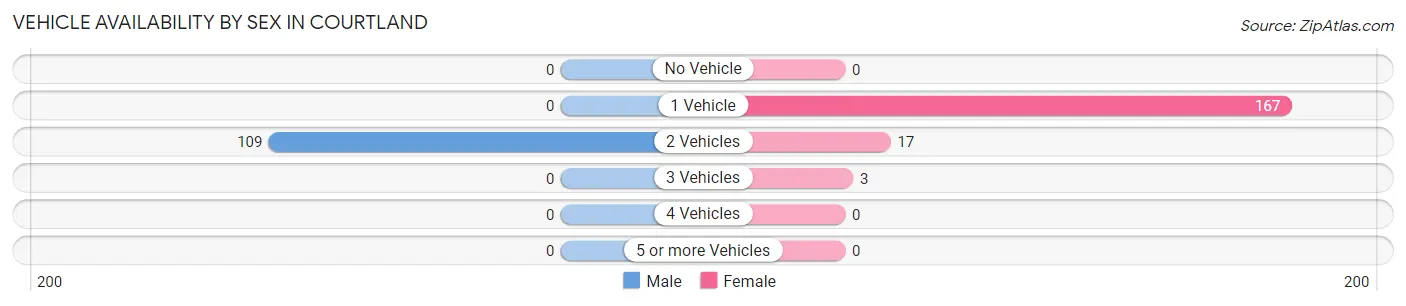
| Vehicles Available | Male | Female |
| No Vehicle | 0 (0.0%) | 0 (0.0%) |
| 1 Vehicle | 0 (0.0%) | 167 (89.3%) |
| 2 Vehicles | 109 (100.0%) | 17 (9.1%) |
| 3 Vehicles | 0 (0.0%) | 3 (1.6%) |
| 4 Vehicles | 0 (0.0%) | 0 (0.0%) |
| 5 or more Vehicles | 0 (0.0%) | 0 (0.0%) |
| Total | 109 (100.0%) | 187 (100.0%) |
Commute Time in Courtland
The most frequently occuring commute durations in Courtland are 35 to 39 minutes (156 commuters, 54.9%), 90 or more minutes (56 commuters, 19.7%), and 30 to 34 minutes (41 commuters, 14.4%).
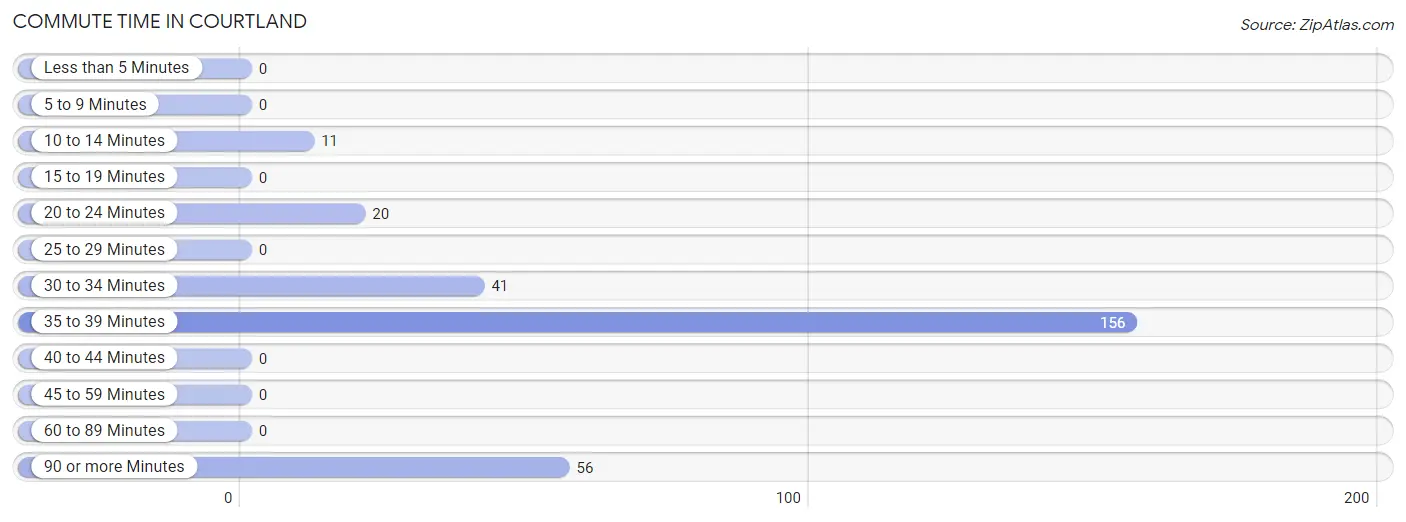
| Commute Time | # Commuters | % Commuters |
| Less than 5 Minutes | 0 | 0.0% |
| 5 to 9 Minutes | 0 | 0.0% |
| 10 to 14 Minutes | 11 | 3.9% |
| 15 to 19 Minutes | 0 | 0.0% |
| 20 to 24 Minutes | 20 | 7.0% |
| 25 to 29 Minutes | 0 | 0.0% |
| 30 to 34 Minutes | 41 | 14.4% |
| 35 to 39 Minutes | 156 | 54.9% |
| 40 to 44 Minutes | 0 | 0.0% |
| 45 to 59 Minutes | 0 | 0.0% |
| 60 to 89 Minutes | 0 | 0.0% |
| 90 or more Minutes | 56 | 19.7% |
Commute Time by Sex in Courtland
The most common commute times in Courtland are 90 or more minutes (56 commuters, 57.7%) for males and 35 to 39 minutes (156 commuters, 83.4%) for females.
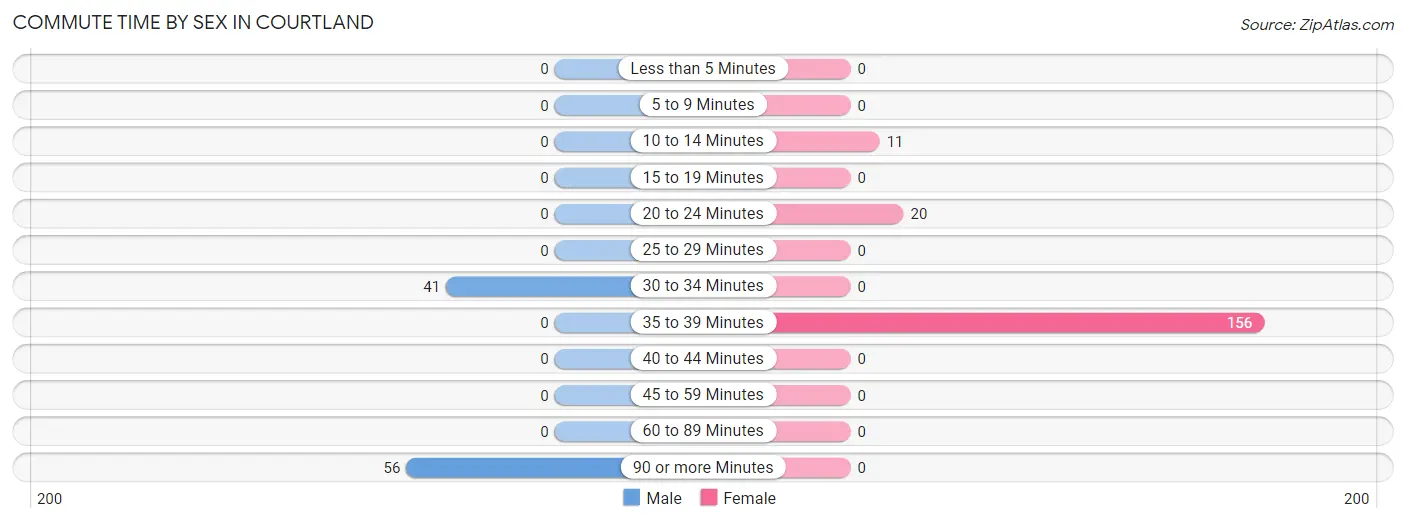
| Commute Time | Male | Female |
| Less than 5 Minutes | 0 (0.0%) | 0 (0.0%) |
| 5 to 9 Minutes | 0 (0.0%) | 0 (0.0%) |
| 10 to 14 Minutes | 0 (0.0%) | 11 (5.9%) |
| 15 to 19 Minutes | 0 (0.0%) | 0 (0.0%) |
| 20 to 24 Minutes | 0 (0.0%) | 20 (10.7%) |
| 25 to 29 Minutes | 0 (0.0%) | 0 (0.0%) |
| 30 to 34 Minutes | 41 (42.3%) | 0 (0.0%) |
| 35 to 39 Minutes | 0 (0.0%) | 156 (83.4%) |
| 40 to 44 Minutes | 0 (0.0%) | 0 (0.0%) |
| 45 to 59 Minutes | 0 (0.0%) | 0 (0.0%) |
| 60 to 89 Minutes | 0 (0.0%) | 0 (0.0%) |
| 90 or more Minutes | 56 (57.7%) | 0 (0.0%) |
Time of Departure to Work by Sex in Courtland
The most frequent times of departure to work in Courtland are 12:00 AM to 4:59 AM (56, 57.7%) for males and 5:30 AM to 5:59 AM (156, 83.4%) for females.
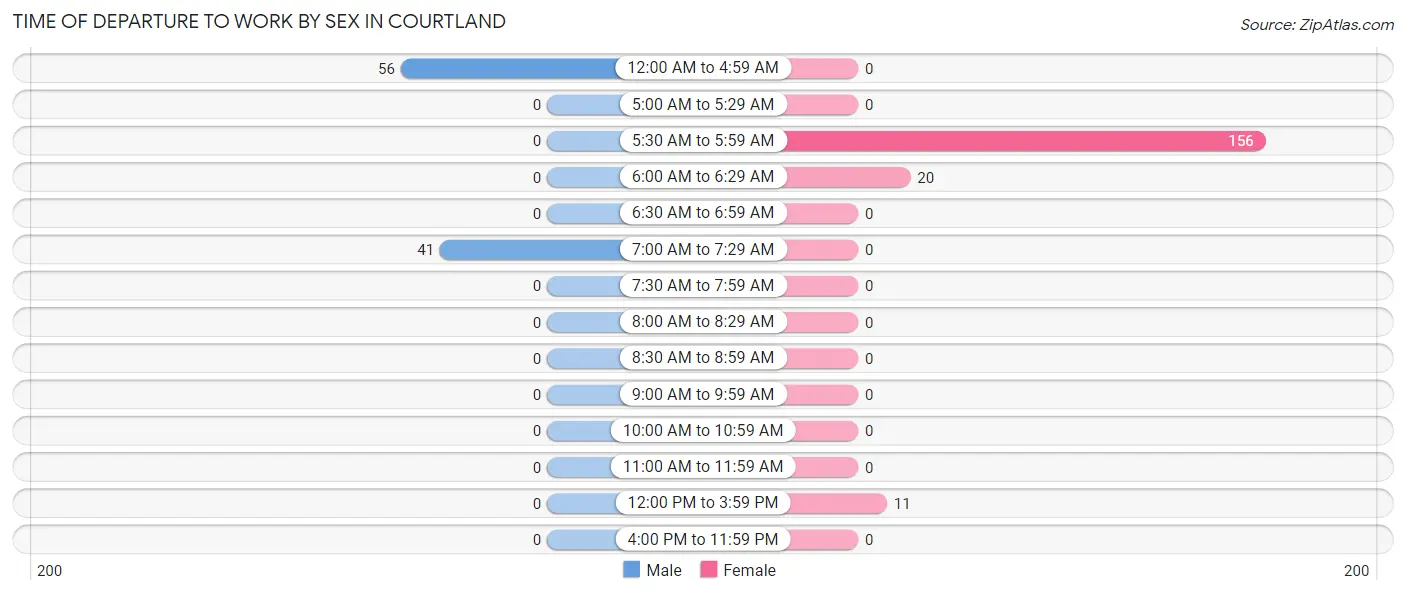
| Time of Departure | Male | Female |
| 12:00 AM to 4:59 AM | 56 (57.7%) | 0 (0.0%) |
| 5:00 AM to 5:29 AM | 0 (0.0%) | 0 (0.0%) |
| 5:30 AM to 5:59 AM | 0 (0.0%) | 156 (83.4%) |
| 6:00 AM to 6:29 AM | 0 (0.0%) | 20 (10.7%) |
| 6:30 AM to 6:59 AM | 0 (0.0%) | 0 (0.0%) |
| 7:00 AM to 7:29 AM | 41 (42.3%) | 0 (0.0%) |
| 7:30 AM to 7:59 AM | 0 (0.0%) | 0 (0.0%) |
| 8:00 AM to 8:29 AM | 0 (0.0%) | 0 (0.0%) |
| 8:30 AM to 8:59 AM | 0 (0.0%) | 0 (0.0%) |
| 9:00 AM to 9:59 AM | 0 (0.0%) | 0 (0.0%) |
| 10:00 AM to 10:59 AM | 0 (0.0%) | 0 (0.0%) |
| 11:00 AM to 11:59 AM | 0 (0.0%) | 0 (0.0%) |
| 12:00 PM to 3:59 PM | 0 (0.0%) | 11 (5.9%) |
| 4:00 PM to 11:59 PM | 0 (0.0%) | 0 (0.0%) |
| Total | 97 (100.0%) | 187 (100.0%) |
Housing Occupancy in Courtland
Occupancy by Ownership in Courtland
Of the total 229 dwellings in Courtland, owner-occupied units account for 136 (59.4%), while renter-occupied units make up 93 (40.6%).
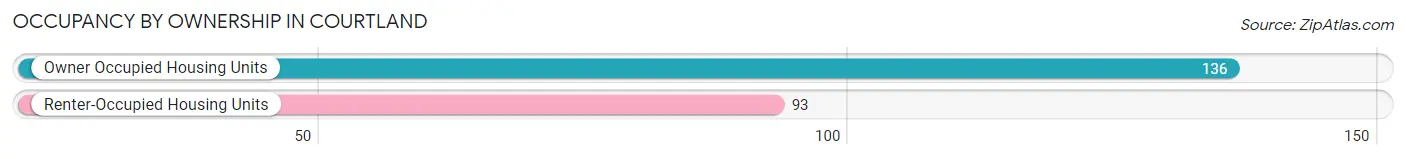
| Occupancy | # Housing Units | % Housing Units |
| Owner Occupied Housing Units | 136 | 59.4% |
| Renter-Occupied Housing Units | 93 | 40.6% |
| Total Occupied Housing Units | 229 | 100.0% |
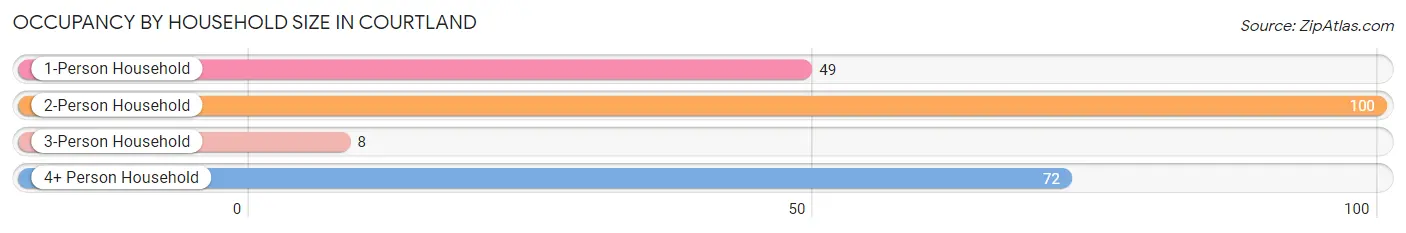
Occupancy by Household Size in Courtland
| Household Size | # Housing Units | % Housing Units |
| 1-Person Household | 49 | 21.4% |
| 2-Person Household | 100 | 43.7% |
| 3-Person Household | 8 | 3.5% |
| 4+ Person Household | 72 | 31.4% |
| Total Housing Units | 229 | 100.0% |
Occupancy by Ownership by Household Size in Courtland
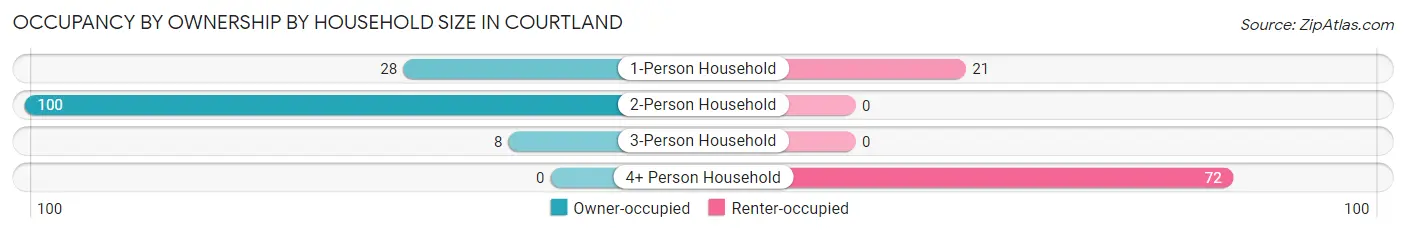
| Household Size | Owner-occupied | Renter-occupied |
| 1-Person Household | 28 (57.1%) | 21 (42.9%) |
| 2-Person Household | 100 (100.0%) | 0 (0.0%) |
| 3-Person Household | 8 (100.0%) | 0 (0.0%) |
| 4+ Person Household | 0 (0.0%) | 72 (100.0%) |
| Total Housing Units | 136 (59.4%) | 93 (40.6%) |
Occupancy by Educational Attainment in Courtland
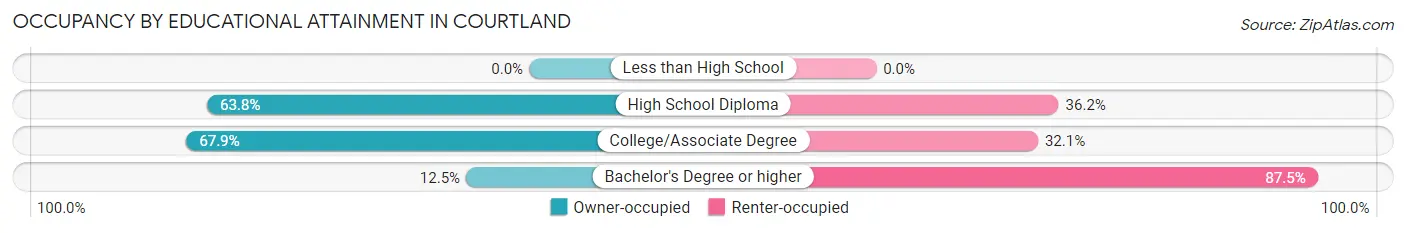
| Household Size | Owner-occupied | Renter-occupied |
| Less than High School | 0 (0.0%) | 0 (0.0%) |
| High School Diploma | 97 (63.8%) | 55 (36.2%) |
| College/Associate Degree | 36 (67.9%) | 17 (32.1%) |
| Bachelor's Degree or higher | 3 (12.5%) | 21 (87.5%) |
Occupancy by Age of Householder in Courtland
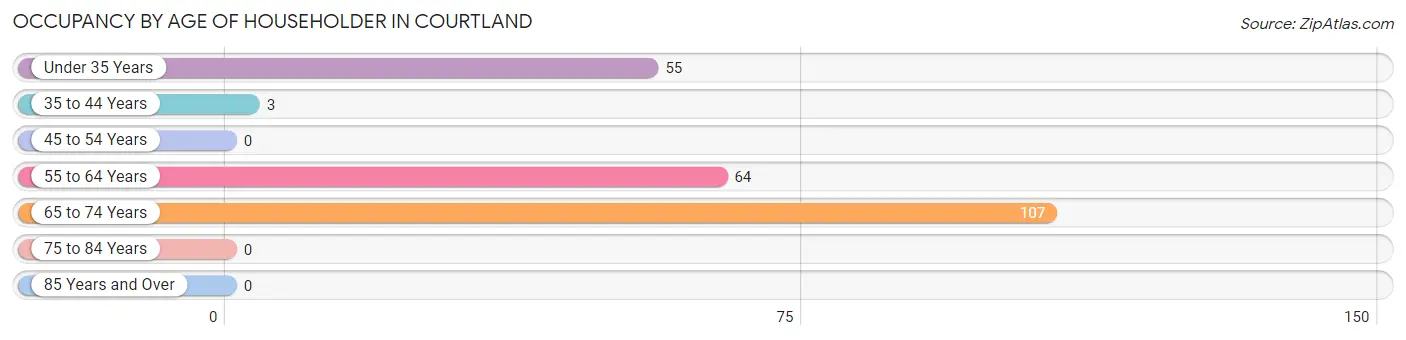
| Age Bracket | # Households | % Households |
| Under 35 Years | 55 | 24.0% |
| 35 to 44 Years | 3 | 1.3% |
| 45 to 54 Years | 0 | 0.0% |
| 55 to 64 Years | 64 | 28.0% |
| 65 to 74 Years | 107 | 46.7% |
| 75 to 84 Years | 0 | 0.0% |
| 85 Years and Over | 0 | 0.0% |
| Total | 229 | 100.0% |
Housing Finances in Courtland
Median Income by Occupancy in Courtland
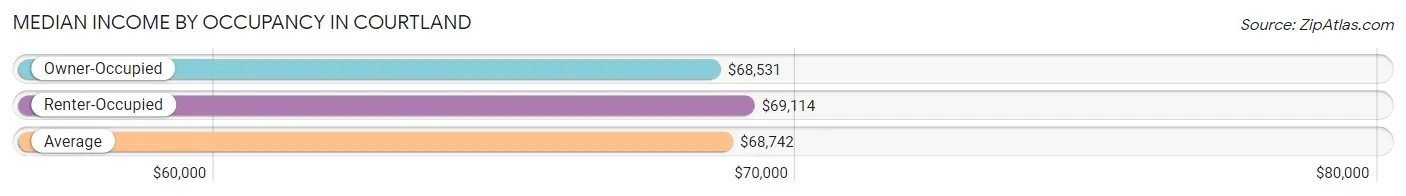
| Occupancy Type | # Households | Median Income |
| Owner-Occupied | 136 (59.4%) | $68,531 |
| Renter-Occupied | 93 (40.6%) | $69,114 |
| Average | 229 (100.0%) | $68,742 |
Occupancy by Householder Income Bracket in Courtland
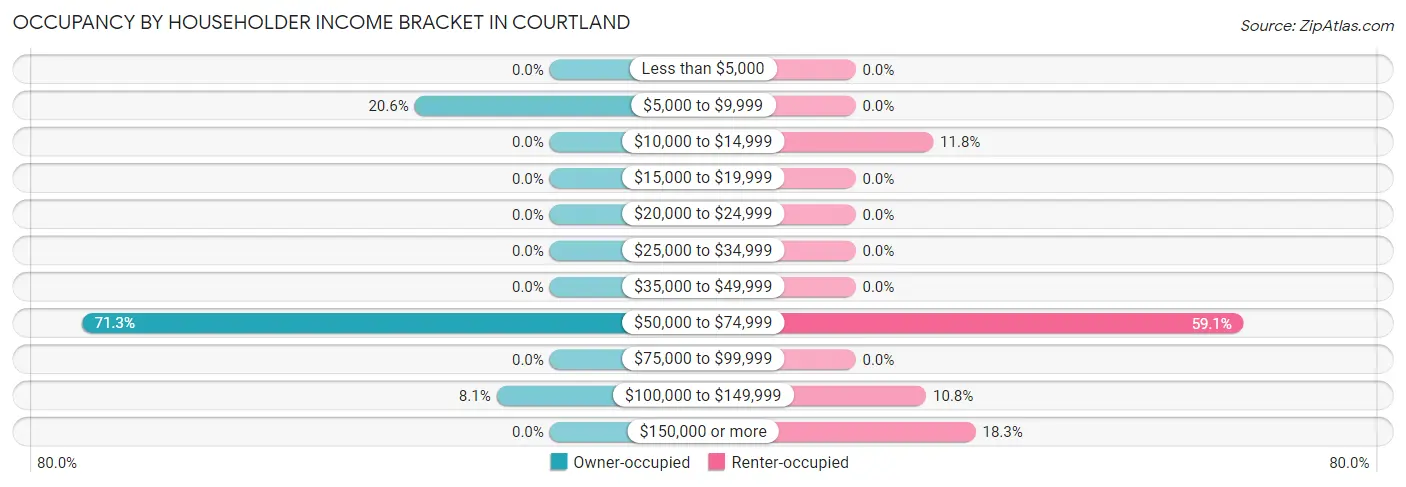
| Income Bracket | Owner-occupied | Renter-occupied |
| Less than $5,000 | 0 (0.0%) | 0 (0.0%) |
| $5,000 to $9,999 | 28 (20.6%) | 0 (0.0%) |
| $10,000 to $14,999 | 0 (0.0%) | 11 (11.8%) |
| $15,000 to $19,999 | 0 (0.0%) | 0 (0.0%) |
| $20,000 to $24,999 | 0 (0.0%) | 0 (0.0%) |
| $25,000 to $34,999 | 0 (0.0%) | 0 (0.0%) |
| $35,000 to $49,999 | 0 (0.0%) | 0 (0.0%) |
| $50,000 to $74,999 | 97 (71.3%) | 55 (59.1%) |
| $75,000 to $99,999 | 0 (0.0%) | 0 (0.0%) |
| $100,000 to $149,999 | 11 (8.1%) | 10 (10.7%) |
| $150,000 or more | 0 (0.0%) | 17 (18.3%) |
| Total | 136 (100.0%) | 93 (100.0%) |
Monthly Housing Cost Tiers in Courtland
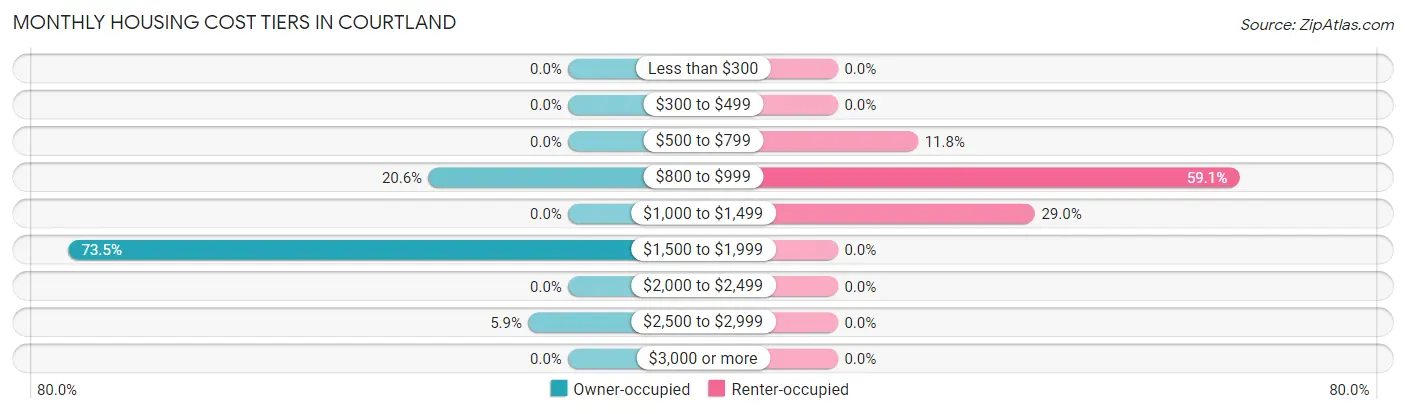
| Monthly Cost | Owner-occupied | Renter-occupied |
| Less than $300 | 0 (0.0%) | 0 (0.0%) |
| $300 to $499 | 0 (0.0%) | 0 (0.0%) |
| $500 to $799 | 0 (0.0%) | 11 (11.8%) |
| $800 to $999 | 28 (20.6%) | 55 (59.1%) |
| $1,000 to $1,499 | 0 (0.0%) | 27 (29.0%) |
| $1,500 to $1,999 | 100 (73.5%) | 0 (0.0%) |
| $2,000 to $2,499 | 0 (0.0%) | 0 (0.0%) |
| $2,500 to $2,999 | 8 (5.9%) | 0 (0.0%) |
| $3,000 or more | 0 (0.0%) | 0 (0.0%) |
| Total | 136 (100.0%) | 93 (100.0%) |
Physical Housing Characteristics in Courtland
Housing Structures in Courtland
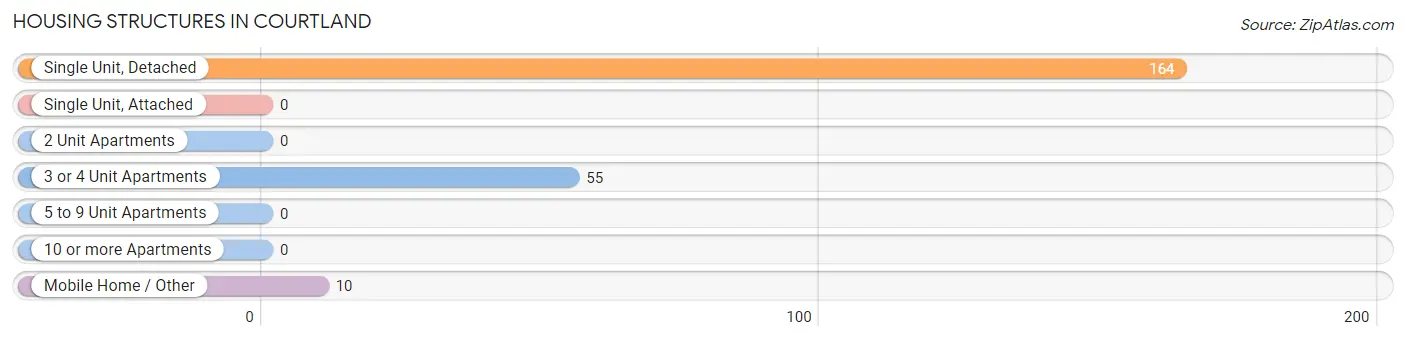
| Structure Type | # Housing Units | % Housing Units |
| Single Unit, Detached | 164 | 71.6% |
| Single Unit, Attached | 0 | 0.0% |
| 2 Unit Apartments | 0 | 0.0% |
| 3 or 4 Unit Apartments | 55 | 24.0% |
| 5 to 9 Unit Apartments | 0 | 0.0% |
| 10 or more Apartments | 0 | 0.0% |
| Mobile Home / Other | 10 | 4.4% |
| Total | 229 | 100.0% |
Housing Structures by Occupancy in Courtland
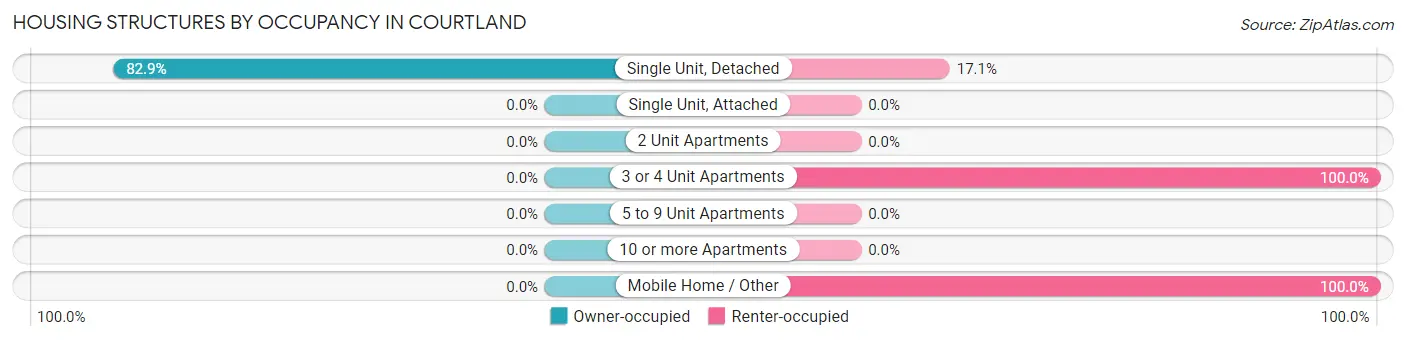
| Structure Type | Owner-occupied | Renter-occupied |
| Single Unit, Detached | 136 (82.9%) | 28 (17.1%) |
| Single Unit, Attached | 0 (0.0%) | 0 (0.0%) |
| 2 Unit Apartments | 0 (0.0%) | 0 (0.0%) |
| 3 or 4 Unit Apartments | 0 (0.0%) | 55 (100.0%) |
| 5 to 9 Unit Apartments | 0 (0.0%) | 0 (0.0%) |
| 10 or more Apartments | 0 (0.0%) | 0 (0.0%) |
| Mobile Home / Other | 0 (0.0%) | 10 (100.0%) |
| Total | 136 (59.4%) | 93 (40.6%) |
Housing Structures by Number of Rooms in Courtland
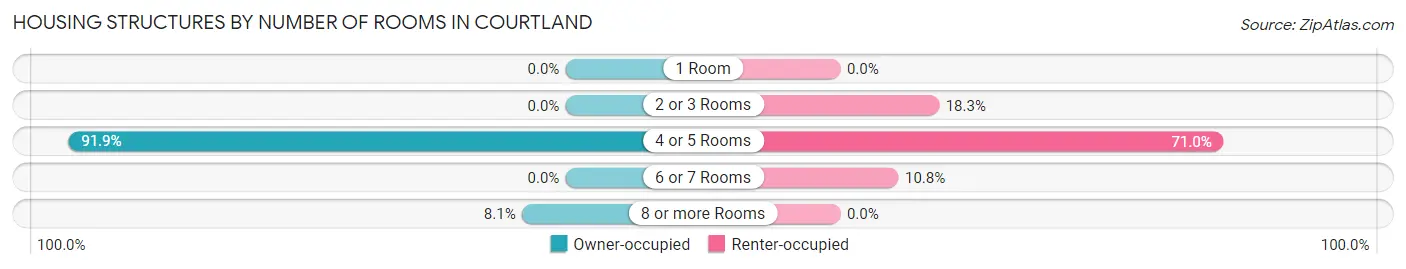
| Number of Rooms | Owner-occupied | Renter-occupied |
| 1 Room | 0 (0.0%) | 0 (0.0%) |
| 2 or 3 Rooms | 0 (0.0%) | 17 (18.3%) |
| 4 or 5 Rooms | 125 (91.9%) | 66 (71.0%) |
| 6 or 7 Rooms | 0 (0.0%) | 10 (10.7%) |
| 8 or more Rooms | 11 (8.1%) | 0 (0.0%) |
| Total | 136 (100.0%) | 93 (100.0%) |
Housing Structure by Heating Type in Courtland
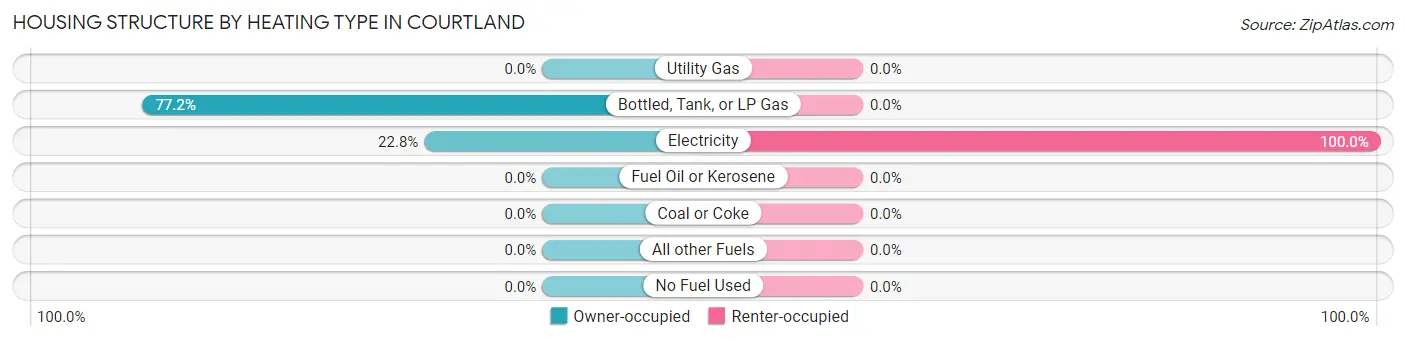
| Heating Type | Owner-occupied | Renter-occupied |
| Utility Gas | 0 (0.0%) | 0 (0.0%) |
| Bottled, Tank, or LP Gas | 105 (77.2%) | 0 (0.0%) |
| Electricity | 31 (22.8%) | 93 (100.0%) |
| Fuel Oil or Kerosene | 0 (0.0%) | 0 (0.0%) |
| Coal or Coke | 0 (0.0%) | 0 (0.0%) |
| All other Fuels | 0 (0.0%) | 0 (0.0%) |
| No Fuel Used | 0 (0.0%) | 0 (0.0%) |
| Total | 136 (100.0%) | 93 (100.0%) |
Household Vehicle Usage in Courtland
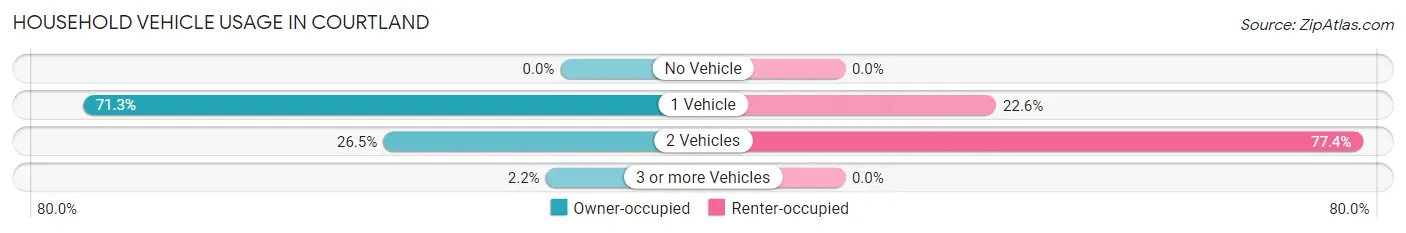
| Vehicles per Household | Owner-occupied | Renter-occupied |
| No Vehicle | 0 (0.0%) | 0 (0.0%) |
| 1 Vehicle | 97 (71.3%) | 21 (22.6%) |
| 2 Vehicles | 36 (26.5%) | 72 (77.4%) |
| 3 or more Vehicles | 3 (2.2%) | 0 (0.0%) |
| Total | 136 (100.0%) | 93 (100.0%) |
Real Estate & Mortgages in Courtland
Real Estate and Mortgage Overview in Courtland
| Characteristic | Without Mortgage | With Mortgage |
| Housing Units | 28 | 108 |
| Median Property Value | - | - |
| Median Household Income | - | - |
| Monthly Housing Costs | - | - |
| Real Estate Taxes | - | - |
Property Value by Mortgage Status in Courtland
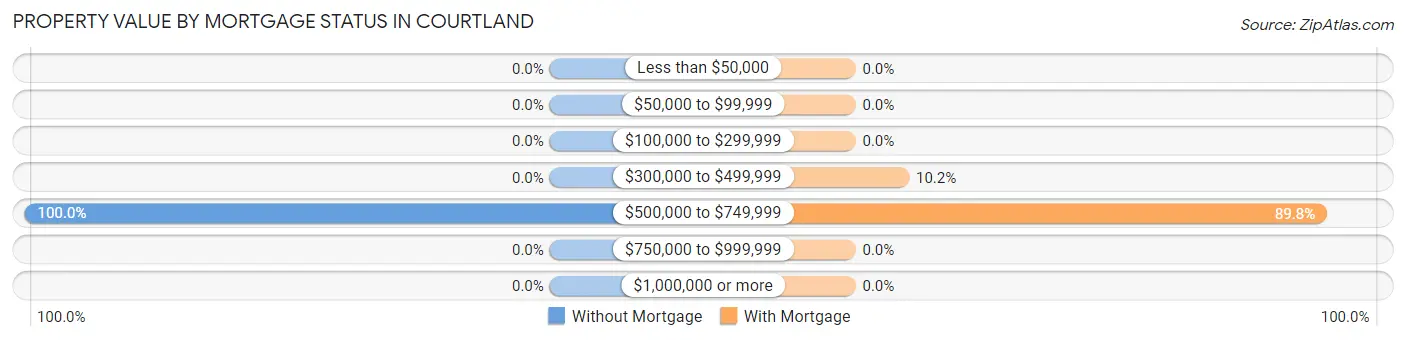
| Property Value | Without Mortgage | With Mortgage |
| Less than $50,000 | 0 (0.0%) | 0 (0.0%) |
| $50,000 to $99,999 | 0 (0.0%) | 0 (0.0%) |
| $100,000 to $299,999 | 0 (0.0%) | 0 (0.0%) |
| $300,000 to $499,999 | 0 (0.0%) | 11 (10.2%) |
| $500,000 to $749,999 | 28 (100.0%) | 97 (89.8%) |
| $750,000 to $999,999 | 0 (0.0%) | 0 (0.0%) |
| $1,000,000 or more | 0 (0.0%) | 0 (0.0%) |
| Total | 28 (100.0%) | 108 (100.0%) |
Household Income by Mortgage Status in Courtland
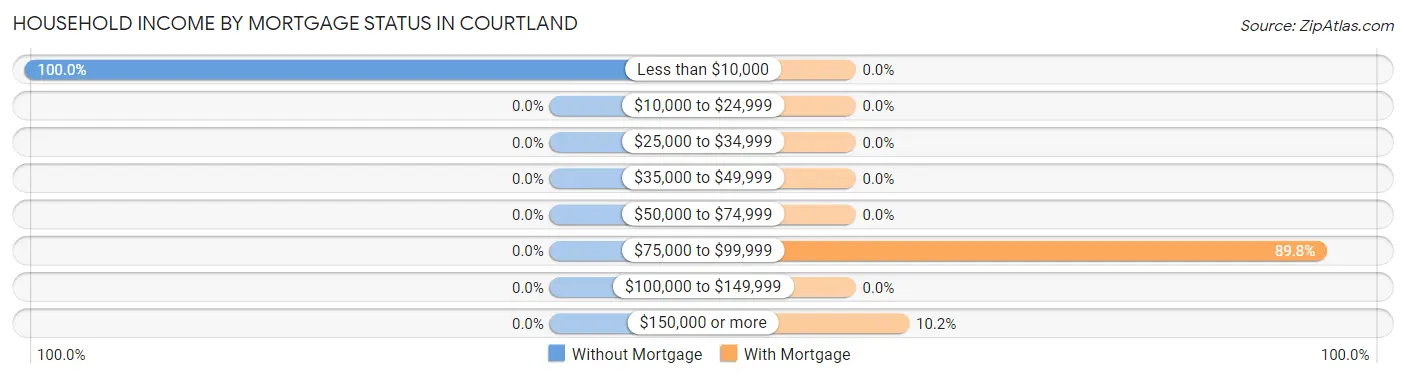
| Household Income | Without Mortgage | With Mortgage |
| Less than $10,000 | 28 (100.0%) | 0 (0.0%) |
| $10,000 to $24,999 | 0 (0.0%) | 0 (0.0%) |
| $25,000 to $34,999 | 0 (0.0%) | 0 (0.0%) |
| $35,000 to $49,999 | 0 (0.0%) | 0 (0.0%) |
| $50,000 to $74,999 | 0 (0.0%) | 0 (0.0%) |
| $75,000 to $99,999 | 0 (0.0%) | 97 (89.8%) |
| $100,000 to $149,999 | 0 (0.0%) | 0 (0.0%) |
| $150,000 or more | 0 (0.0%) | 11 (10.2%) |
| Total | 28 (100.0%) | 108 (100.0%) |
Property Value to Household Income Ratio in Courtland
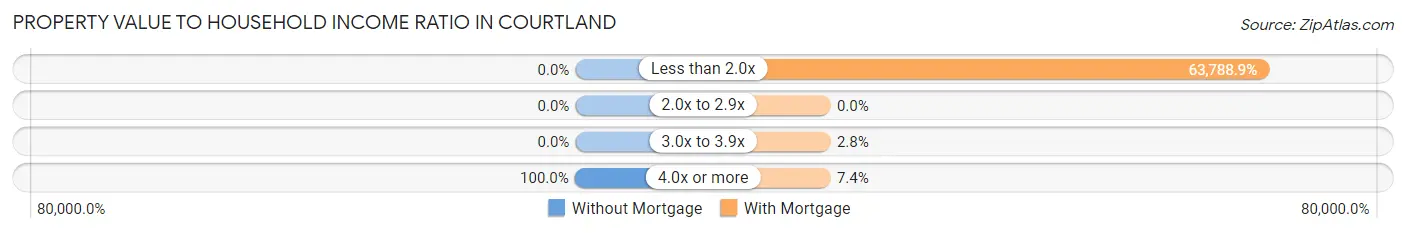
| Value-to-Income Ratio | Without Mortgage | With Mortgage |
| Less than 2.0x | 0 (0.0%) | 68,892 (63,788.9%) |
| 2.0x to 2.9x | 0 (0.0%) | 0 (0.0%) |
| 3.0x to 3.9x | 0 (0.0%) | 3 (2.8%) |
| 4.0x or more | 28 (100.0%) | 8 (7.4%) |
| Total | 28 (100.0%) | 108 (100.0%) |
Real Estate Taxes by Mortgage Status in Courtland
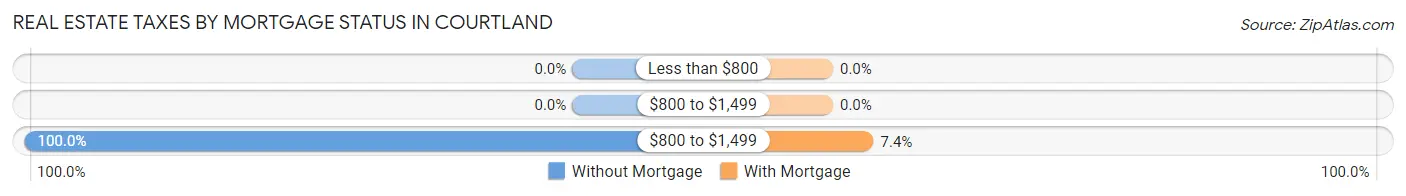
| Property Taxes | Without Mortgage | With Mortgage |
| Less than $800 | 0 (0.0%) | 0 (0.0%) |
| $800 to $1,499 | 0 (0.0%) | 0 (0.0%) |
| $800 to $1,499 | 28 (100.0%) | 8 (7.4%) |
| Total | 28 (100.0%) | 108 (100.0%) |
Health & Disability in Courtland
Health Insurance Coverage by Age in Courtland
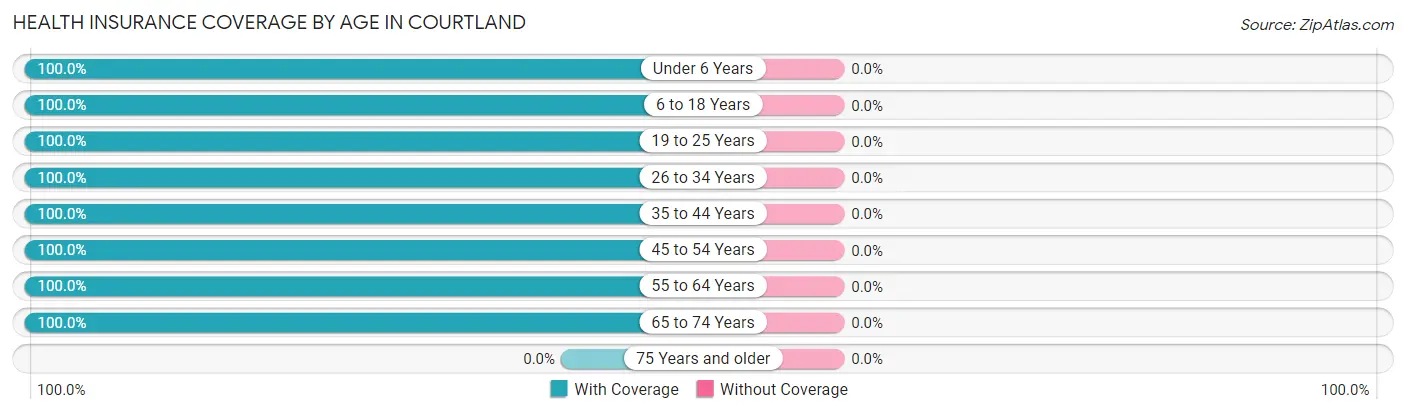
| Age Bracket | With Coverage | Without Coverage |
| Under 6 Years | 67 (100.0%) | 0 (0.0%) |
| 6 to 18 Years | 68 (100.0%) | 0 (0.0%) |
| 19 to 25 Years | 20 (100.0%) | 0 (0.0%) |
| 26 to 34 Years | 133 (100.0%) | 0 (0.0%) |
| 35 to 44 Years | 3 (100.0%) | 0 (0.0%) |
| 45 to 54 Years | 156 (100.0%) | 0 (0.0%) |
| 55 to 64 Years | 81 (100.0%) | 0 (0.0%) |
| 65 to 74 Years | 126 (100.0%) | 0 (0.0%) |
| 75 Years and older | 0 (0.0%) | 0 (0.0%) |
| Total | 654 (100.0%) | 0 (0.0%) |
Health Insurance Coverage by Citizenship Status in Courtland
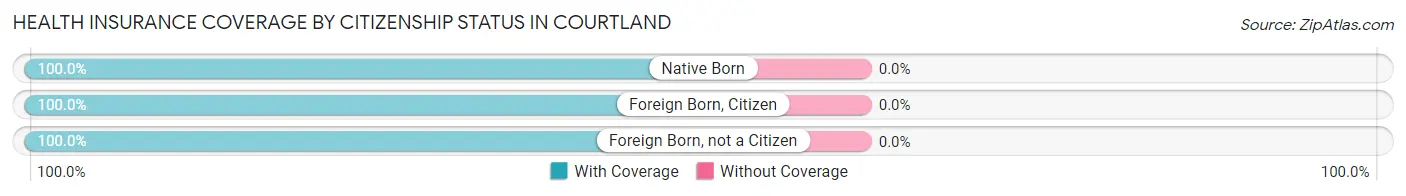
| Citizenship Status | With Coverage | Without Coverage |
| Native Born | 67 (100.0%) | 0 (0.0%) |
| Foreign Born, Citizen | 68 (100.0%) | 0 (0.0%) |
| Foreign Born, not a Citizen | 20 (100.0%) | 0 (0.0%) |
Health Insurance Coverage by Household Income in Courtland
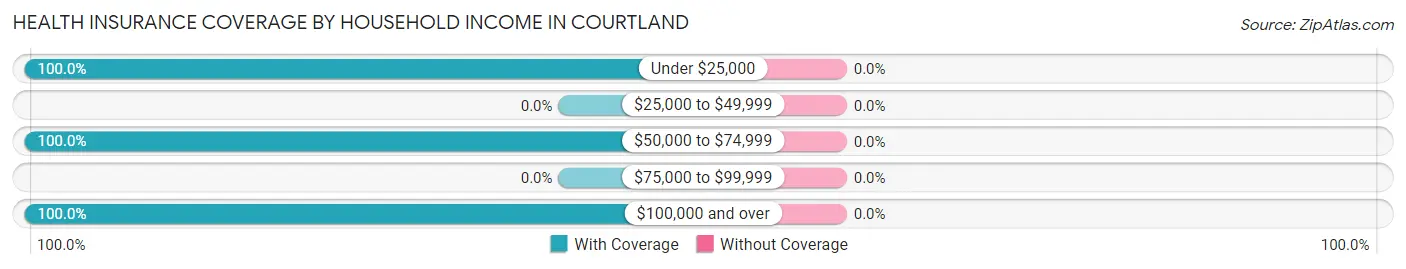
| Household Income | With Coverage | Without Coverage |
| Under $25,000 | 39 (100.0%) | 0 (0.0%) |
| $25,000 to $49,999 | 0 (0.0%) | 0 (0.0%) |
| $50,000 to $74,999 | 487 (100.0%) | 0 (0.0%) |
| $75,000 to $99,999 | 0 (0.0%) | 0 (0.0%) |
| $100,000 and over | 128 (100.0%) | 0 (0.0%) |
Public vs Private Health Insurance Coverage by Age in Courtland
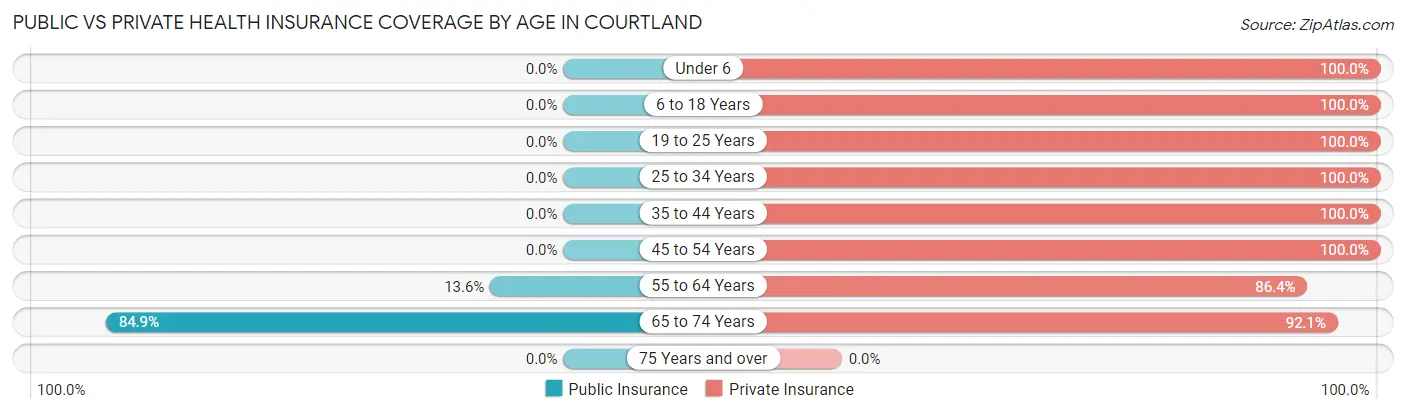
| Age Bracket | Public Insurance | Private Insurance |
| Under 6 | 0 (0.0%) | 67 (100.0%) |
| 6 to 18 Years | 0 (0.0%) | 68 (100.0%) |
| 19 to 25 Years | 0 (0.0%) | 20 (100.0%) |
| 25 to 34 Years | 0 (0.0%) | 133 (100.0%) |
| 35 to 44 Years | 0 (0.0%) | 3 (100.0%) |
| 45 to 54 Years | 0 (0.0%) | 156 (100.0%) |
| 55 to 64 Years | 11 (13.6%) | 70 (86.4%) |
| 65 to 74 Years | 107 (84.9%) | 116 (92.1%) |
| 75 Years and over | 0 (0.0%) | 0 (0.0%) |
| Total | 118 (18.0%) | 633 (96.8%) |
Disability Status by Sex by Age in Courtland
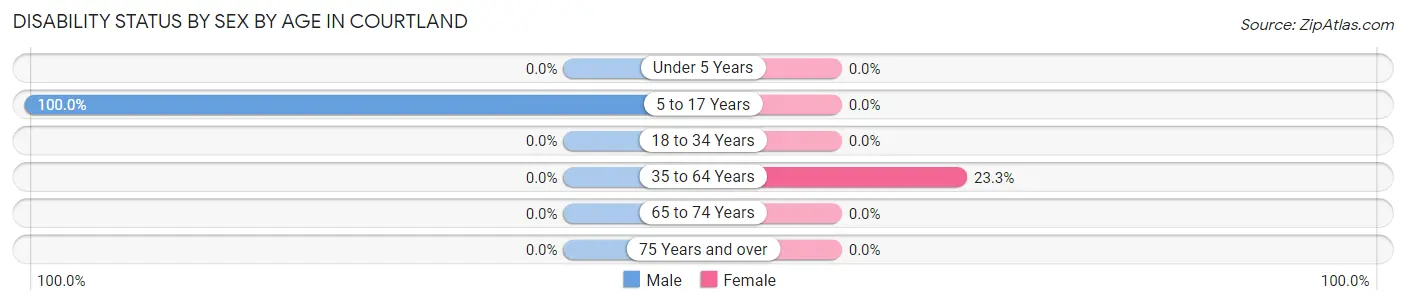
| Age Bracket | Male | Female |
| Under 5 Years | 0 (0.0%) | 0 (0.0%) |
| 5 to 17 Years | 12 (100.0%) | 0 (0.0%) |
| 18 to 34 Years | 0 (0.0%) | 0 (0.0%) |
| 35 to 64 Years | 0 (0.0%) | 53 (23.3%) |
| 65 to 74 Years | 0 (0.0%) | 0 (0.0%) |
| 75 Years and over | 0 (0.0%) | 0 (0.0%) |
Disability Class by Sex by Age in Courtland
Disability Class: Hearing Difficulty
| Age Bracket | Male | Female |
| Under 5 Years | 0 (0.0%) | 0 (0.0%) |
| 5 to 17 Years | 0 (0.0%) | 0 (0.0%) |
| 18 to 34 Years | 0 (0.0%) | 0 (0.0%) |
| 35 to 64 Years | 0 (0.0%) | 0 (0.0%) |
| 65 to 74 Years | 0 (0.0%) | 0 (0.0%) |
| 75 Years and over | 0 (0.0%) | 0 (0.0%) |
Disability Class: Vision Difficulty
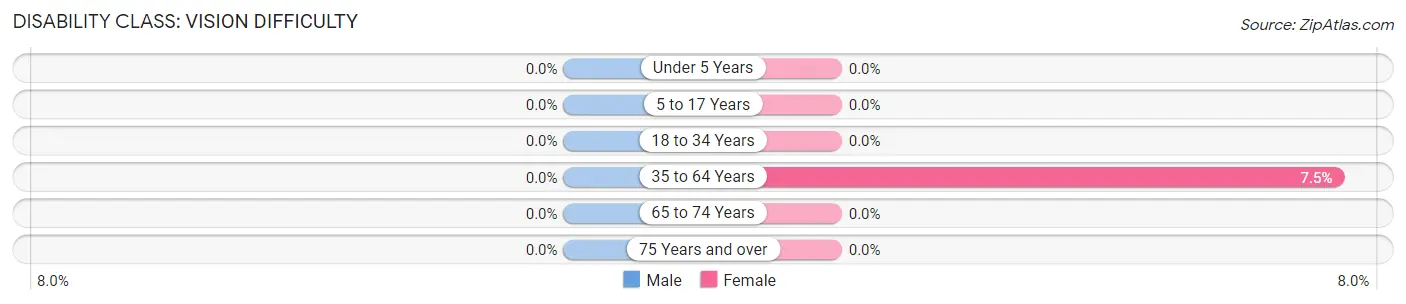
| Age Bracket | Male | Female |
| Under 5 Years | 0 (0.0%) | 0 (0.0%) |
| 5 to 17 Years | 0 (0.0%) | 0 (0.0%) |
| 18 to 34 Years | 0 (0.0%) | 0 (0.0%) |
| 35 to 64 Years | 0 (0.0%) | 17 (7.5%) |
| 65 to 74 Years | 0 (0.0%) | 0 (0.0%) |
| 75 Years and over | 0 (0.0%) | 0 (0.0%) |
Disability Class: Cognitive Difficulty
| Age Bracket | Male | Female |
| 5 to 17 Years | 0 (0.0%) | 0 (0.0%) |
| 18 to 34 Years | 0 (0.0%) | 0 (0.0%) |
| 35 to 64 Years | 0 (0.0%) | 0 (0.0%) |
| 65 to 74 Years | 0 (0.0%) | 0 (0.0%) |
| 75 Years and over | 0 (0.0%) | 0 (0.0%) |
Disability Class: Ambulatory Difficulty
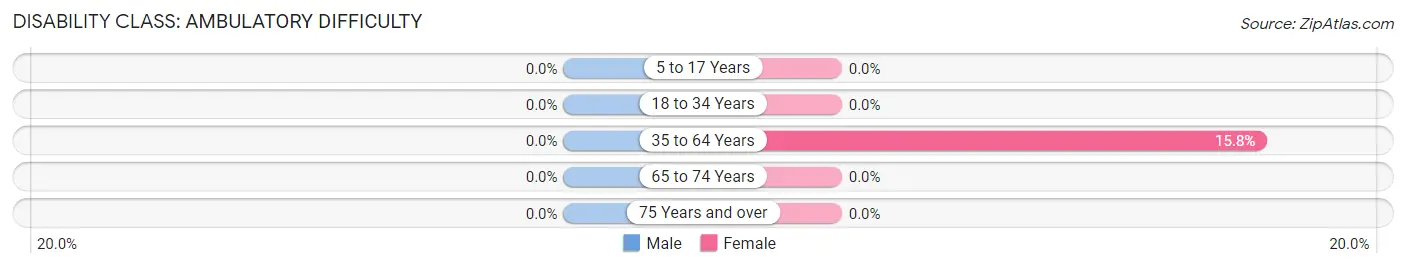
| Age Bracket | Male | Female |
| 5 to 17 Years | 0 (0.0%) | 0 (0.0%) |
| 18 to 34 Years | 0 (0.0%) | 0 (0.0%) |
| 35 to 64 Years | 0 (0.0%) | 36 (15.8%) |
| 65 to 74 Years | 0 (0.0%) | 0 (0.0%) |
| 75 Years and over | 0 (0.0%) | 0 (0.0%) |
Disability Class: Self-Care Difficulty
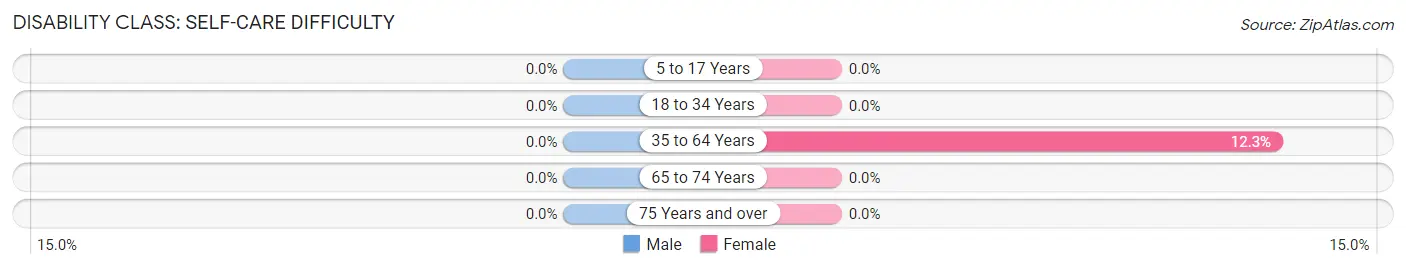
| Age Bracket | Male | Female |
| 5 to 17 Years | 0 (0.0%) | 0 (0.0%) |
| 18 to 34 Years | 0 (0.0%) | 0 (0.0%) |
| 35 to 64 Years | 0 (0.0%) | 28 (12.3%) |
| 65 to 74 Years | 0 (0.0%) | 0 (0.0%) |
| 75 Years and over | 0 (0.0%) | 0 (0.0%) |
Technology Access in Courtland
Computing Device Access in Courtland
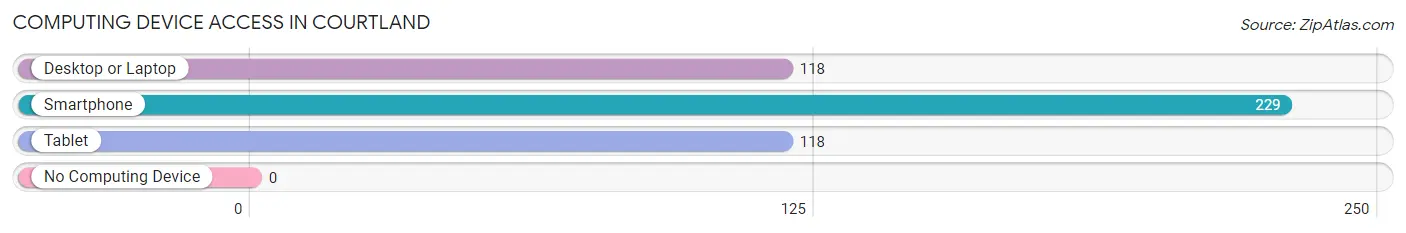
| Device Type | # Households | % Households |
| Desktop or Laptop | 118 | 51.5% |
| Smartphone | 229 | 100.0% |
| Tablet | 118 | 51.5% |
| No Computing Device | 0 | 0.0% |
| Total | 229 | 100.0% |
Internet Access in Courtland
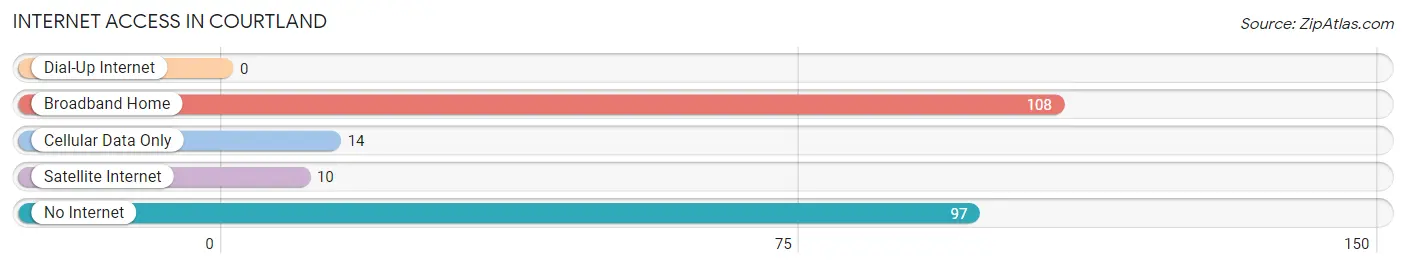
| Internet Type | # Households | % Households |
| Dial-Up Internet | 0 | 0.0% |
| Broadband Home | 108 | 47.2% |
| Cellular Data Only | 14 | 6.1% |
| Satellite Internet | 10 | 4.4% |
| No Internet | 97 | 42.4% |
| Total | 229 | 100.0% |
Courtland Summary
History
The small town of Courtland, California is located in the Sacramento-San Joaquin River Delta region of California. It is situated in the northern part of the county of Sacramento, and is part of the greater Sacramento metropolitan area. The town was founded in 1854 by a group of settlers from the nearby town of Walnut Grove. The settlers were looking for a place to settle and farm, and they chose the area around Courtland because of its fertile soil and abundant water supply.
The town was named after the Courtland family, who were among the first settlers in the area. The Courtland family owned a large amount of land in the area, and they were instrumental in the development of the town. The Courtland family also donated land for the construction of a school, which was the first school in the area.
The town of Courtland grew slowly over the years, and by the early 1900s it had become a thriving agricultural community. The town was known for its production of fruits and vegetables, and it was also home to a number of small businesses.
Geography
Courtland is located in the Sacramento-San Joaquin River Delta region of California. It is situated in the northern part of the county of Sacramento, and is part of the greater Sacramento metropolitan area. The town is located on the banks of the Sacramento River, and is surrounded by a number of small towns and villages.
The town of Courtland is located at an elevation of approximately 20 feet above sea level. The climate in the area is generally mild, with temperatures ranging from the mid-50s in the winter to the mid-90s in the summer. The area receives an average of about 20 inches of rain per year.
Economy
The economy of Courtland is largely based on agriculture. The town is known for its production of fruits and vegetables, and it is also home to a number of small businesses. The town is also home to a number of wineries, which produce a variety of wines.
The town is also home to a number of small manufacturing businesses, which produce a variety of products. These businesses include a number of furniture manufacturers, as well as a number of metalworking and machine shops.
Demographics
As of the 2010 census, the population of Courtland was 1,845. The racial makeup of the town was 79.3% White, 0.7% African American, 0.3% Native American, 0.7% Asian, 0.1% Pacific Islander, 16.2% from other races, and 2.9% from two or more races. Hispanic or Latino of any race were 28.2% of the population.
The median household income in Courtland was $45,938, and the median family income was $50,938. The per capita income for the town was $20,938. About 11.2% of families and 14.2% of the population were below the poverty line, including 18.2% of those under age 18 and 8.2% of those age 65 or over.
Common Questions
What is Per Capita Income in Courtland?
Per Capita income in Courtland is $31,198.
What is the Median Family Income in Courtland?
Median Family Income in Courtland is $68,980.
What is the Median Household income in Courtland?
Median Household Income in Courtland is $68,742.
What is Income or Wage Gap in Courtland?
Income or Wage Gap in Courtland is 18.2%.
Women in Courtland earn 81.8 cents for every dollar earned by a man.
What is Inequality or Gini Index in Courtland?
Inequality or Gini Index in Courtland is 0.28.
What is the Total Population of Courtland?
Total Population of Courtland is 654.
What is the Total Male Population of Courtland?
Total Male Population of Courtland is 305.
What is the Total Female Population of Courtland?
Total Female Population of Courtland is 349.
What is the Ratio of Males per 100 Females in Courtland?
There are 87.39 Males per 100 Females in Courtland.
What is the Ratio of Females per 100 Males in Courtland?
There are 114.43 Females per 100 Males in Courtland.
What is the Median Population Age in Courtland?
Median Population Age in Courtland is 54.2 Years.
What is the Average Family Size in Courtland
Average Family Size in Courtland is 3.4 People.
What is the Average Household Size in Courtland
Average Household Size in Courtland is 2.9 People.
How Large is the Labor Force in Courtland?
There are 296 People in the Labor Forcein in Courtland.
What is the Percentage of People in the Labor Force in Courtland?
57.0% of People are in the Labor Force in Courtland.