Danville, WA Map & Demographics
Danville Map
Danville Overview
$20,851
PER CAPITA INCOME
0.41
INEQUALITY / GINI INDEX
82
TOTAL POPULATION
15
MALE POPULATION
67
FEMALE POPULATION
22.39
MALES / 100 FEMALES
446.67
FEMALES / 100 MALES
20.8
MEDIAN AGE
3.7
AVG FAMILY SIZE
2.3
AVG HOUSEHOLD SIZE
23
LABOR FORCE [ PEOPLE ]
31.9%
PERCENT IN LABOR FORCE
Danville Zip Codes
Danville Area Codes
Income in Danville
Income Overview in Danville
| Characteristic | Number | Measure |
| Per Capita Income | 82 | $20,851 |
| Median Family Income | 17 | $0 |
| Mean Family Income | 17 | $0 |
| Median Household Income | 36 | $0 |
| Mean Household Income | 36 | $47,833 |
| Income Deficit | 17 | $0 |
| Wage / Income Gap (%) | 82 | 0.00% |
| Wage / Income Gap ($) | 82 | 100.00¢ per $1 |
| Gini / Inequality Index | 82 | 0.41 |
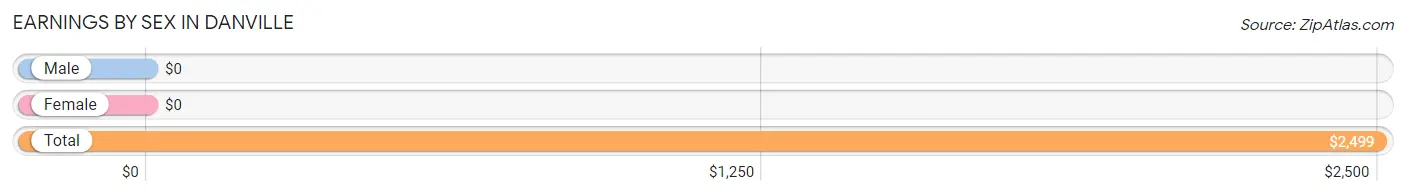
Earnings by Sex in Danville
| Sex | Number | Average Earnings |
| Male | 10 (43.5%) | $0 |
| Female | 13 (56.5%) | $0 |
| Total | 23 (100.0%) | $2,499 |
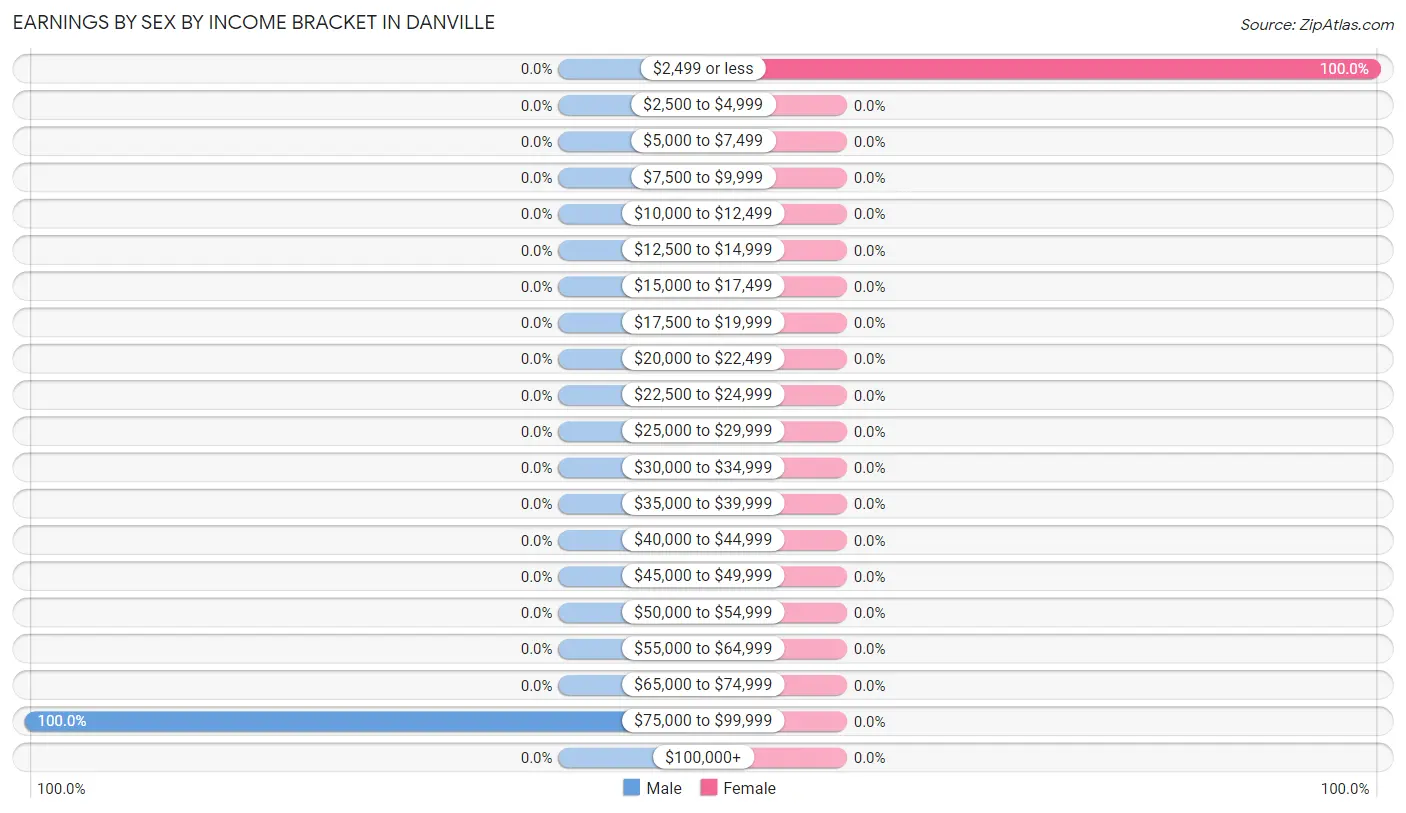
Earnings by Sex by Income Bracket in Danville
The most common earnings brackets in Danville are $75,000 to $99,999 for men (10 | 100.0%) and $2,499 or less for women (13 | 100.0%).
| Income | Male | Female |
| $2,499 or less | 0 (0.0%) | 13 (100.0%) |
| $2,500 to $4,999 | 0 (0.0%) | 0 (0.0%) |
| $5,000 to $7,499 | 0 (0.0%) | 0 (0.0%) |
| $7,500 to $9,999 | 0 (0.0%) | 0 (0.0%) |
| $10,000 to $12,499 | 0 (0.0%) | 0 (0.0%) |
| $12,500 to $14,999 | 0 (0.0%) | 0 (0.0%) |
| $15,000 to $17,499 | 0 (0.0%) | 0 (0.0%) |
| $17,500 to $19,999 | 0 (0.0%) | 0 (0.0%) |
| $20,000 to $22,499 | 0 (0.0%) | 0 (0.0%) |
| $22,500 to $24,999 | 0 (0.0%) | 0 (0.0%) |
| $25,000 to $29,999 | 0 (0.0%) | 0 (0.0%) |
| $30,000 to $34,999 | 0 (0.0%) | 0 (0.0%) |
| $35,000 to $39,999 | 0 (0.0%) | 0 (0.0%) |
| $40,000 to $44,999 | 0 (0.0%) | 0 (0.0%) |
| $45,000 to $49,999 | 0 (0.0%) | 0 (0.0%) |
| $50,000 to $54,999 | 0 (0.0%) | 0 (0.0%) |
| $55,000 to $64,999 | 0 (0.0%) | 0 (0.0%) |
| $65,000 to $74,999 | 0 (0.0%) | 0 (0.0%) |
| $75,000 to $99,999 | 10 (100.0%) | 0 (0.0%) |
| $100,000+ | 0 (0.0%) | 0 (0.0%) |
| Total | 10 (100.0%) | 13 (100.0%) |
Earnings by Sex by Educational Attainment in Danville
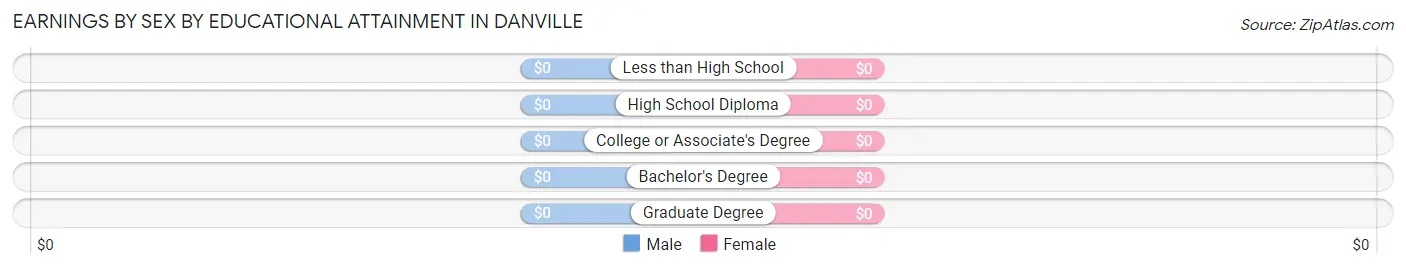
| Educational Attainment | Male Income | Female Income |
| Less than High School | - | - |
| High School Diploma | - | - |
| College or Associate's Degree | - | - |
| Bachelor's Degree | - | - |
| Graduate Degree | - | - |
| Total | - | - |
Family Income in Danville
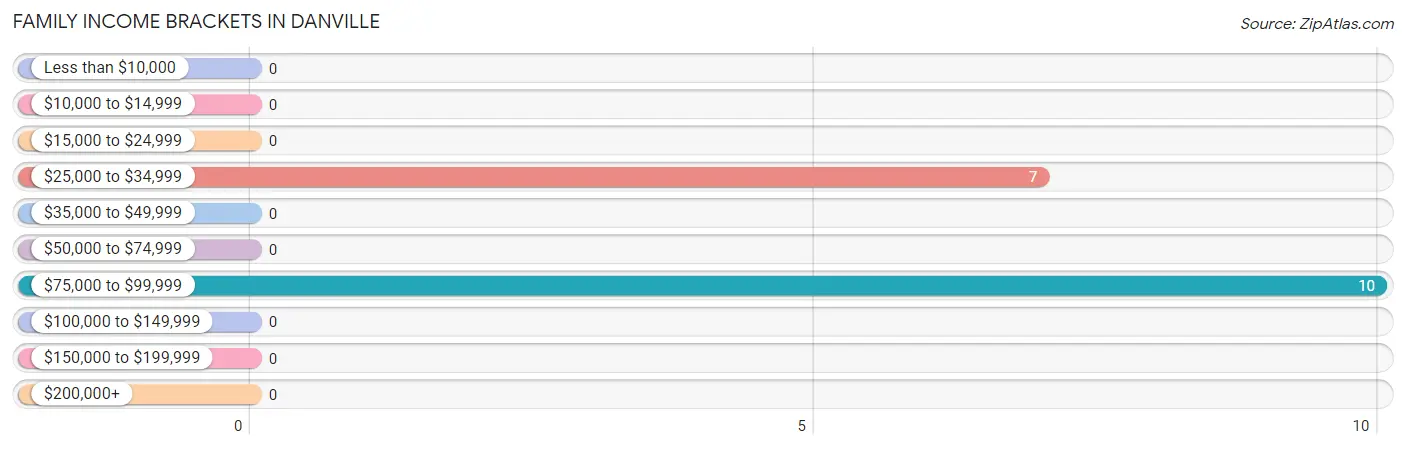
Family Income Brackets in Danville
According to the Danville family income data, there are 10 families falling into the $75,000 to $99,999 income range, which is the most common income bracket and makes up 58.8% of all families.
| Income Bracket | # Families | % Families |
| Less than $10,000 | 0 | 0.0% |
| $10,000 to $14,999 | 0 | 0.0% |
| $15,000 to $24,999 | 0 | 0.0% |
| $25,000 to $34,999 | 7 | 41.2% |
| $35,000 to $49,999 | 0 | 0.0% |
| $50,000 to $74,999 | 0 | 0.0% |
| $75,000 to $99,999 | 10 | 58.8% |
| $100,000 to $149,999 | 0 | 0.0% |
| $150,000 to $199,999 | 0 | 0.0% |
| $200,000+ | 0 | 0.0% |
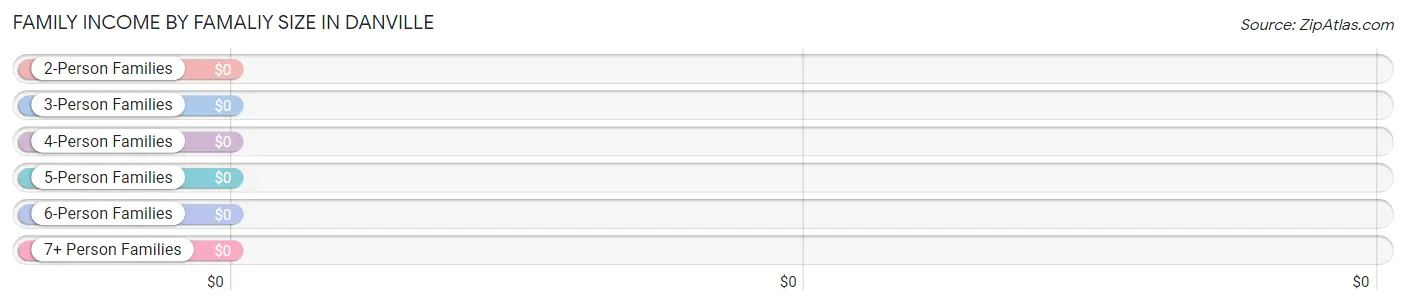
Family Income by Famaliy Size in Danville
| Income Bracket | # Families | Median Income |
| 2-Person Families | 0 (0.0%) | $0 |
| 3-Person Families | 17 (100.0%) | $0 |
| 4-Person Families | 0 (0.0%) | $0 |
| 5-Person Families | 0 (0.0%) | $0 |
| 6-Person Families | 0 (0.0%) | $0 |
| 7+ Person Families | 0 (0.0%) | $0 |
| Total | 17 (100.0%) | $0 |
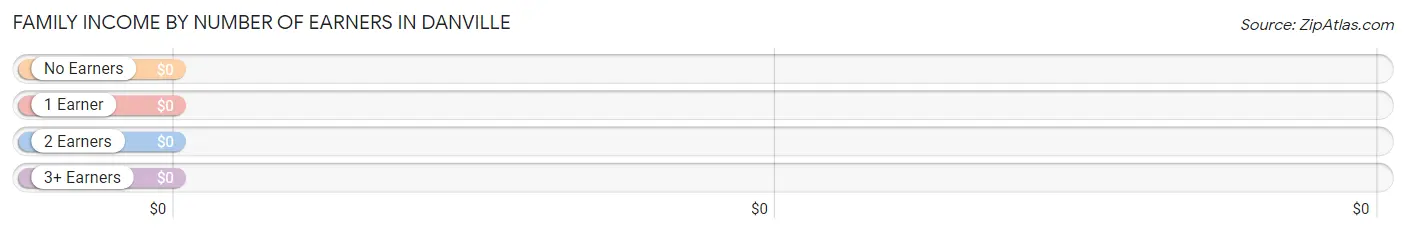
Family Income by Number of Earners in Danville
| Number of Earners | # Families | Median Income |
| No Earners | 7 (41.2%) | $0 |
| 1 Earner | 0 (0.0%) | $0 |
| 2 Earners | 0 (0.0%) | $0 |
| 3+ Earners | 10 (58.8%) | $0 |
| Total | 17 (100.0%) | $0 |
Household Income in Danville
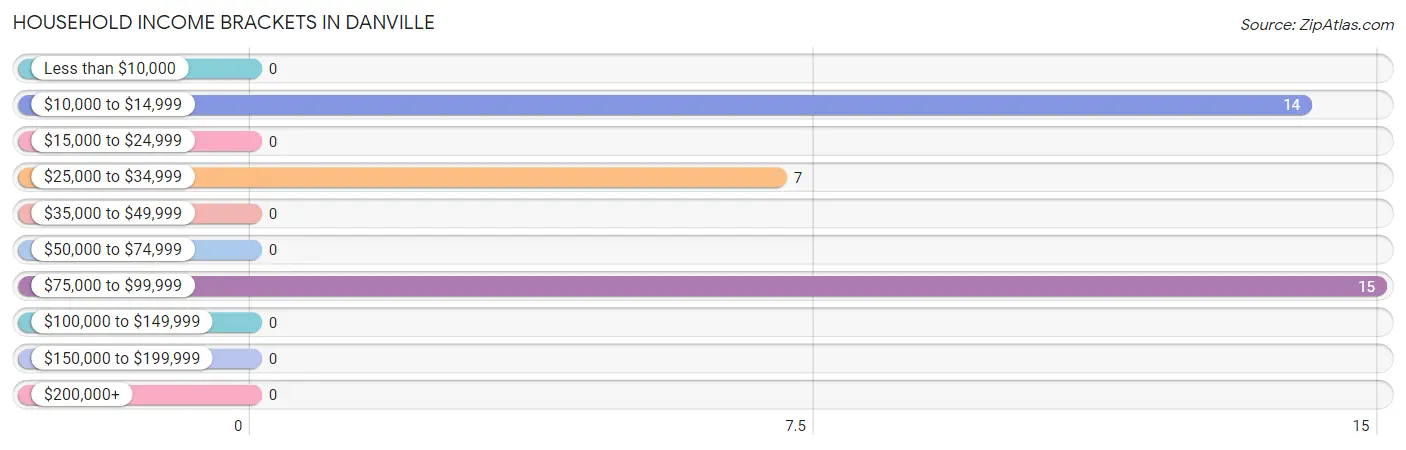
Household Income Brackets in Danville
With 15 households falling in the category, the $75,000 to $99,999 income range is the most frequent in Danville, accounting for 41.7% of all households.
| Income Bracket | # Households | % Households |
| Less than $10,000 | 0 | 0.0% |
| $10,000 to $14,999 | 14 | 38.9% |
| $15,000 to $24,999 | 0 | 0.0% |
| $25,000 to $34,999 | 7 | 19.4% |
| $35,000 to $49,999 | 0 | 0.0% |
| $50,000 to $74,999 | 0 | 0.0% |
| $75,000 to $99,999 | 15 | 41.7% |
| $100,000 to $149,999 | 0 | 0.0% |
| $150,000 to $199,999 | 0 | 0.0% |
| $200,000+ | 0 | 0.0% |
Household Income by Householder Age in Danville
| Income Bracket | # Households | Median Income |
| 15 to 24 Years | 0 (0.0%) | $0 |
| 25 to 44 Years | 7 (19.4%) | $0 |
| 45 to 64 Years | 10 (27.8%) | $0 |
| 65+ Years | 19 (52.8%) | $0 |
| Total | 36 (100.0%) | $0 |
Poverty in Danville
Income Below Poverty by Sex and Age in Danville
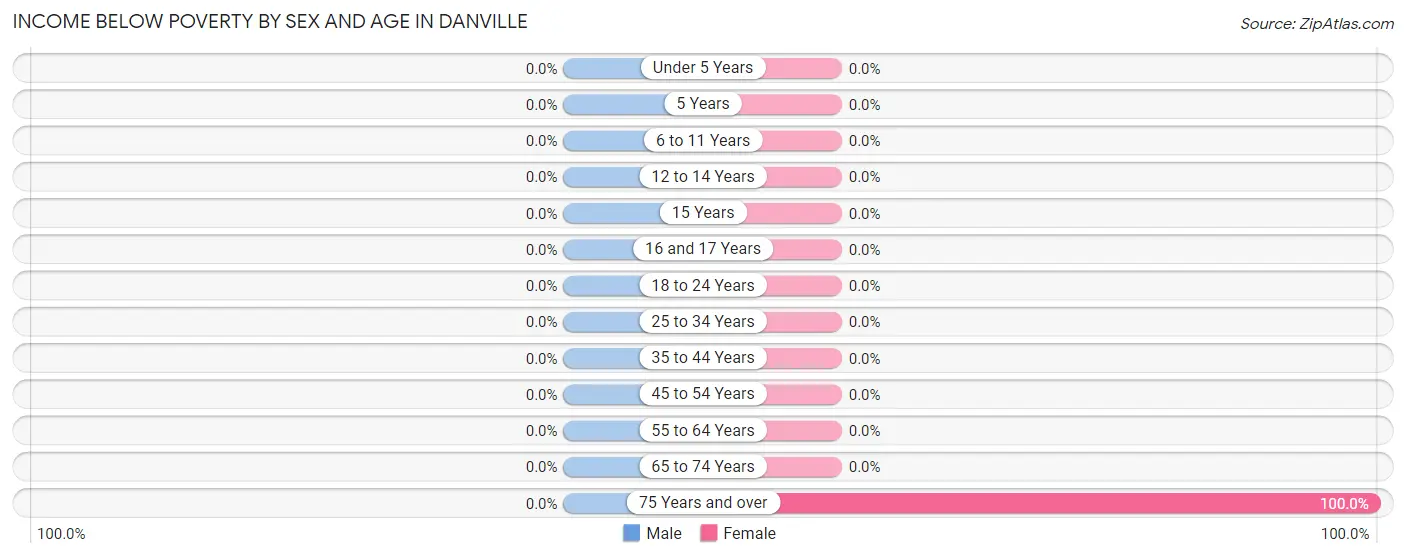
| Age Bracket | Male | Female |
| Under 5 Years | 0 (0.0%) | 0 (0.0%) |
| 5 Years | 0 (0.0%) | 0 (0.0%) |
| 6 to 11 Years | 0 (0.0%) | 0 (0.0%) |
| 12 to 14 Years | 0 (0.0%) | 0 (0.0%) |
| 15 Years | 0 (0.0%) | 0 (0.0%) |
| 16 and 17 Years | 0 (0.0%) | 0 (0.0%) |
| 18 to 24 Years | 0 (0.0%) | 0 (0.0%) |
| 25 to 34 Years | 0 (0.0%) | 0 (0.0%) |
| 35 to 44 Years | 0 (0.0%) | 0 (0.0%) |
| 45 to 54 Years | 0 (0.0%) | 0 (0.0%) |
| 55 to 64 Years | 0 (0.0%) | 0 (0.0%) |
| 65 to 74 Years | 0 (0.0%) | 0 (0.0%) |
| 75 Years and over | 0 (0.0%) | 14 (100.0%) |
| Total | 0 (0.0%) | 14 (20.9%) |
Income Above Poverty by Sex and Age in Danville
According to the poverty statistics in Danville, males aged 45 to 54 years and females aged under 5 years are the age groups that are most secure financially, with 100.0% of males and 100.0% of females in these age groups living above the poverty line.
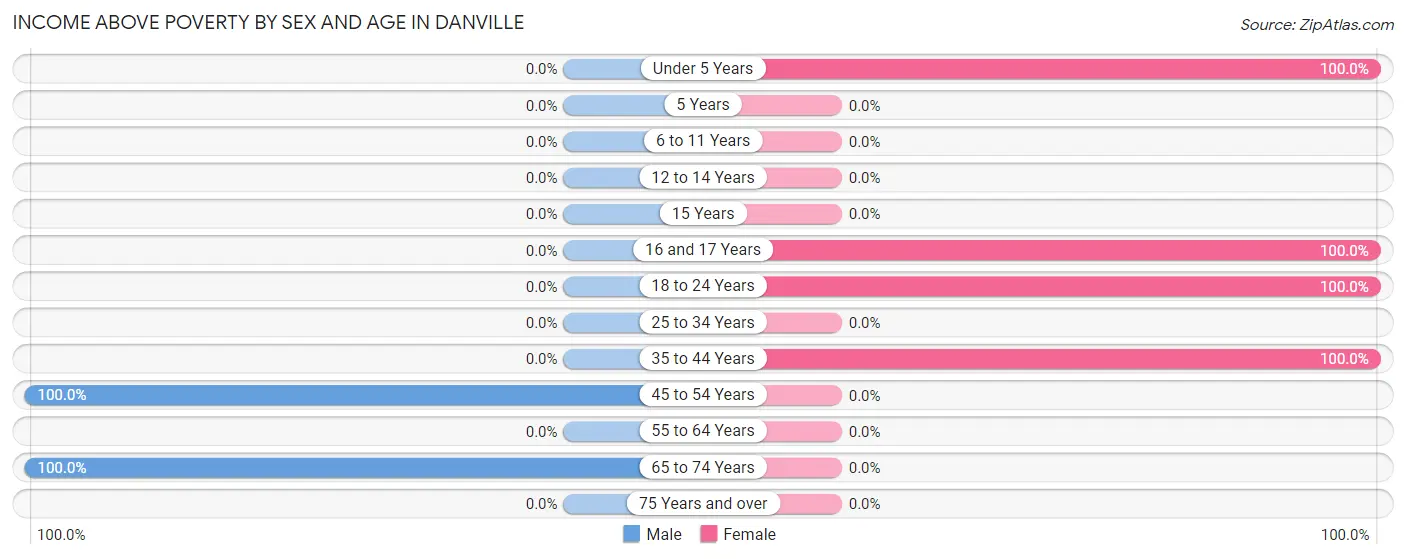
| Age Bracket | Male | Female |
| Under 5 Years | 0 (0.0%) | 10 (100.0%) |
| 5 Years | 0 (0.0%) | 0 (0.0%) |
| 6 to 11 Years | 0 (0.0%) | 0 (0.0%) |
| 12 to 14 Years | 0 (0.0%) | 0 (0.0%) |
| 15 Years | 0 (0.0%) | 0 (0.0%) |
| 16 and 17 Years | 0 (0.0%) | 13 (100.0%) |
| 18 to 24 Years | 0 (0.0%) | 23 (100.0%) |
| 25 to 34 Years | 0 (0.0%) | 0 (0.0%) |
| 35 to 44 Years | 0 (0.0%) | 7 (100.0%) |
| 45 to 54 Years | 10 (100.0%) | 0 (0.0%) |
| 55 to 64 Years | 0 (0.0%) | 0 (0.0%) |
| 65 to 74 Years | 5 (100.0%) | 0 (0.0%) |
| 75 Years and over | 0 (0.0%) | 0 (0.0%) |
| Total | 15 (100.0%) | 53 (79.1%) |
Income Below Poverty Among Married-Couple Families in Danville
| Children | Above Poverty | Below Poverty |
| No Children | 0 (0.0%) | 0 (0.0%) |
| 1 or 2 Children | 0 (0.0%) | 0 (0.0%) |
| 3 or 4 Children | 0 (0.0%) | 0 (0.0%) |
| 5 or more Children | 0 (0.0%) | 0 (0.0%) |
| Total | 0 (0.0%) | 0 (0.0%) |
Income Below Poverty Among Single-Parent Households in Danville
| Children | Single Father | Single Mother |
| No Children | 0 (0.0%) | 0 (0.0%) |
| 1 or 2 Children | 0 (0.0%) | 0 (0.0%) |
| 3 or 4 Children | 0 (0.0%) | 0 (0.0%) |
| 5 or more Children | 0 (0.0%) | 0 (0.0%) |
| Total | 0 (0.0%) | 0 (0.0%) |
Income Below Poverty Among Married-Couple vs Single-Parent Households in Danville
| Children | Married-Couple Families | Single-Parent Households |
| No Children | 0 (0.0%) | 0 (0.0%) |
| 1 or 2 Children | 0 (0.0%) | 0 (0.0%) |
| 3 or 4 Children | 0 (0.0%) | 0 (0.0%) |
| 5 or more Children | 0 (0.0%) | 0 (0.0%) |
| Total | 0 (0.0%) | 0 (0.0%) |
Race in Danville
The most populous races in Danville are White / Caucasian (49 | 59.8%), and Two or more Races (33 | 40.2%).
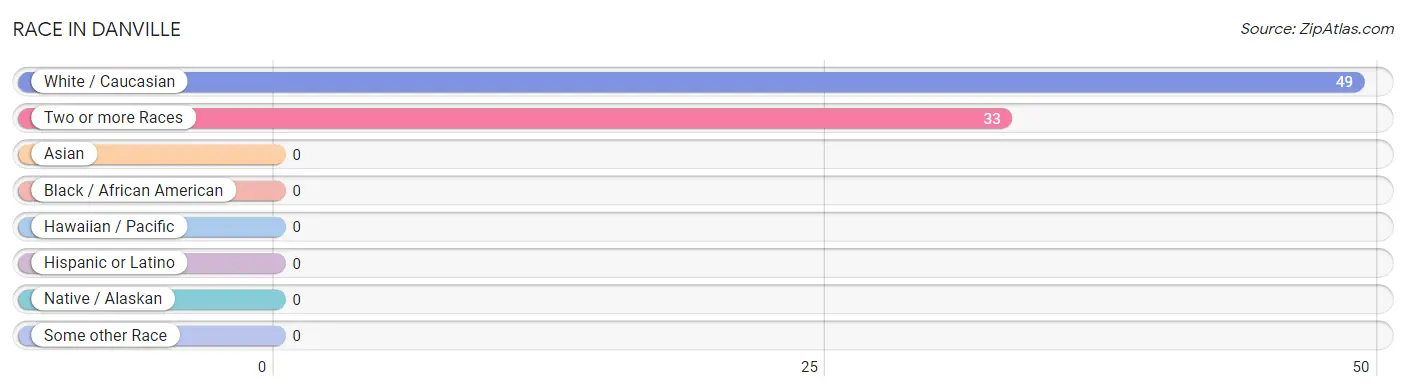
| Race | # Population | % Population |
| Asian | 0 | 0.0% |
| Black / African American | 0 | 0.0% |
| Hawaiian / Pacific | 0 | 0.0% |
| Hispanic or Latino | 0 | 0.0% |
| Native / Alaskan | 0 | 0.0% |
| White / Caucasian | 49 | 59.8% |
| Two or more Races | 33 | 40.2% |
| Some other Race | 0 | 0.0% |
| Total | 82 | 100.0% |
Ancestry in Danville
The most populous ancestries reported in Danville are Swedish (23 | 28.1%), and Scotch-Irish (5 | 6.1%), together accounting for 34.2% of all Danville residents.
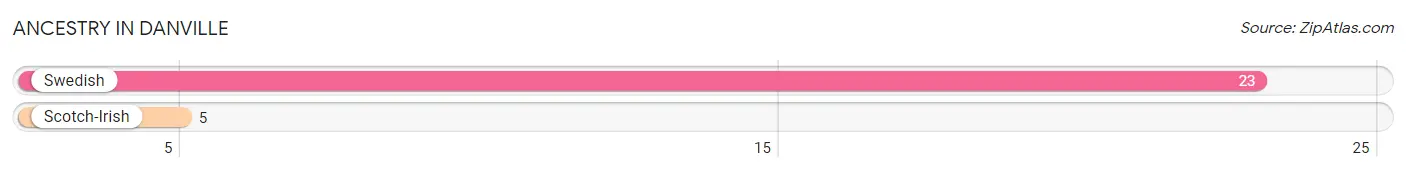
| Ancestry | # Population | % Population |
| Scotch-Irish | 5 | 6.1% |
| Swedish | 23 | 28.1% | View All 2 Rows |
Immigrants in Danville

| Immigration Origin | # Population | % Population | View All 0 Rows |
Sex and Age in Danville
Sex and Age in Danville
The most populous age groups in Danville are 45 to 49 Years (10 | 66.7%) for men and 20 to 24 Years (23 | 34.3%) for women.
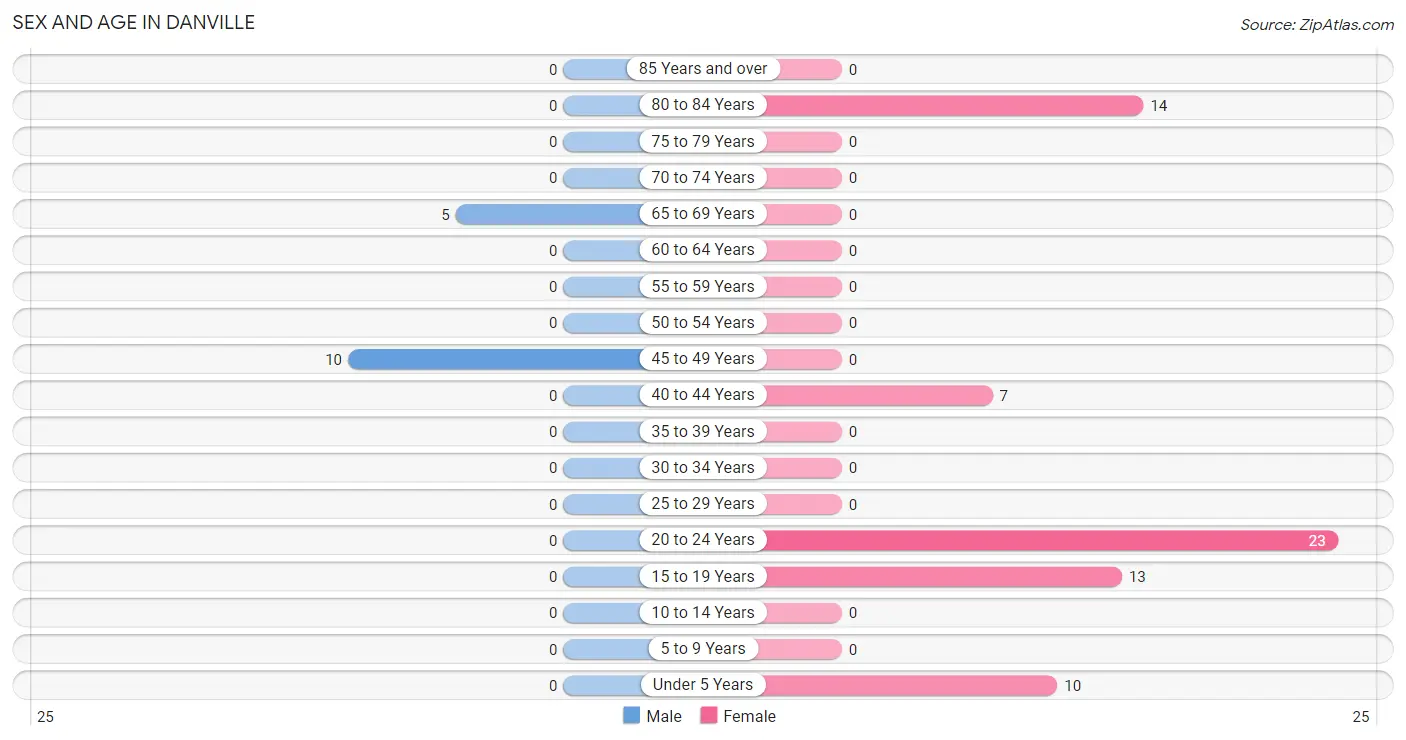
| Age Bracket | Male | Female |
| Under 5 Years | 0 (0.0%) | 10 (14.9%) |
| 5 to 9 Years | 0 (0.0%) | 0 (0.0%) |
| 10 to 14 Years | 0 (0.0%) | 0 (0.0%) |
| 15 to 19 Years | 0 (0.0%) | 13 (19.4%) |
| 20 to 24 Years | 0 (0.0%) | 23 (34.3%) |
| 25 to 29 Years | 0 (0.0%) | 0 (0.0%) |
| 30 to 34 Years | 0 (0.0%) | 0 (0.0%) |
| 35 to 39 Years | 0 (0.0%) | 0 (0.0%) |
| 40 to 44 Years | 0 (0.0%) | 7 (10.4%) |
| 45 to 49 Years | 10 (66.7%) | 0 (0.0%) |
| 50 to 54 Years | 0 (0.0%) | 0 (0.0%) |
| 55 to 59 Years | 0 (0.0%) | 0 (0.0%) |
| 60 to 64 Years | 0 (0.0%) | 0 (0.0%) |
| 65 to 69 Years | 5 (33.3%) | 0 (0.0%) |
| 70 to 74 Years | 0 (0.0%) | 0 (0.0%) |
| 75 to 79 Years | 0 (0.0%) | 0 (0.0%) |
| 80 to 84 Years | 0 (0.0%) | 14 (20.9%) |
| 85 Years and over | 0 (0.0%) | 0 (0.0%) |
| Total | 15 (100.0%) | 67 (100.0%) |
Families and Households in Danville
Median Family Size in Danville
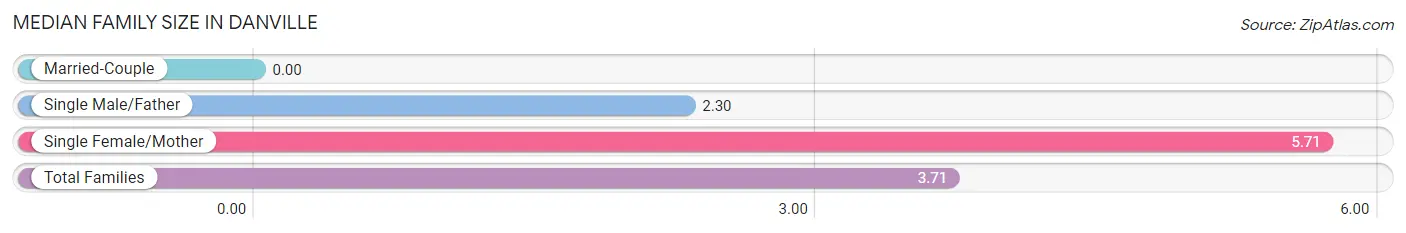
| Family Type | # Families | Family Size |
| Married-Couple | 0 (0.0%) | - |
| Single Male/Father | 10 (58.8%) | 2.30 |
| Single Female/Mother | 7 (41.2%) | 5.71 |
| Total Families | 17 (100.0%) | 3.71 |
Median Household Size in Danville
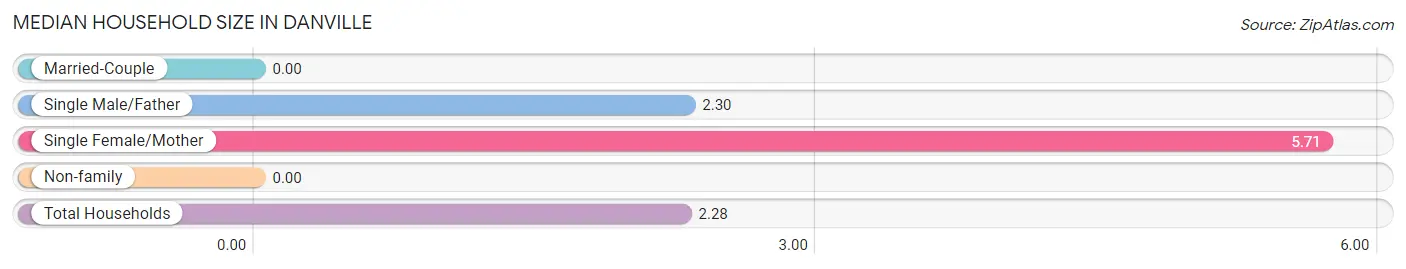
| Household Type | # Households | Household Size |
| Married-Couple | 0 (0.0%) | - |
| Single Male/Father | 10 (27.8%) | 2.30 |
| Single Female/Mother | 7 (19.4%) | 5.71 |
| Non-family | 19 (52.8%) | - |
| Total Households | 36 (100.0%) | 2.28 |
Household Size by Marriage Status in Danville
Out of a total of 36 households in Danville, 17 (47.2%) are family households, while 19 (52.8%) are nonfamily households. The most numerous type of family households are 3-person households, comprising 17, and the most common type of nonfamily households are 1-person households, comprising 19.
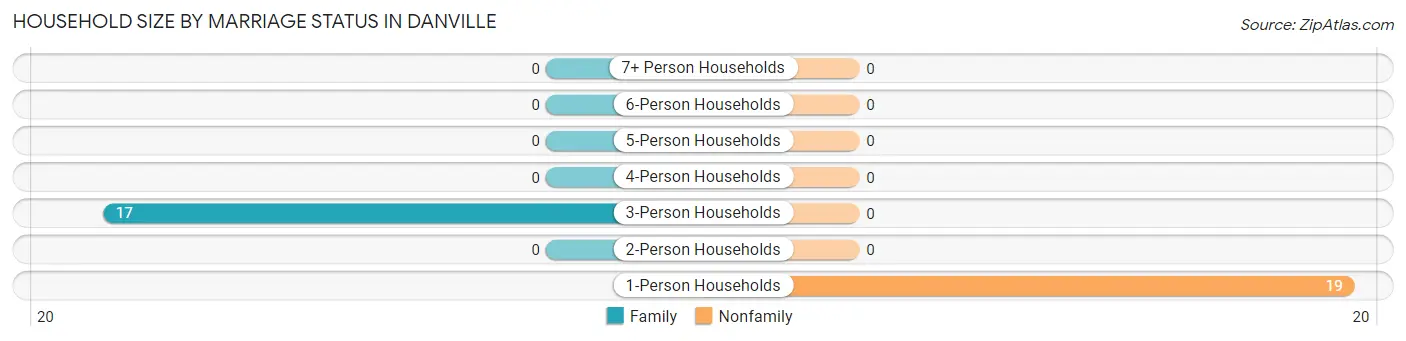
| Household Size | Family Households | Nonfamily Households |
| 1-Person Households | - | 19 (52.8%) |
| 2-Person Households | 0 (0.0%) | 0 (0.0%) |
| 3-Person Households | 17 (47.2%) | 0 (0.0%) |
| 4-Person Households | 0 (0.0%) | 0 (0.0%) |
| 5-Person Households | 0 (0.0%) | 0 (0.0%) |
| 6-Person Households | 0 (0.0%) | 0 (0.0%) |
| 7+ Person Households | 0 (0.0%) | 0 (0.0%) |
| Total | 17 (47.2%) | 19 (52.8%) |
Female Fertility in Danville
Fertility by Age in Danville
Average fertility rate in Danville is 163.0 births per 1,000 women. Women in the age bracket of 35 to 50 years have the highest fertility rate with 1,000.0 births per 1,000 women. Women in the age bracket of 35 to 50 years acount for 100.0% of all women with births.
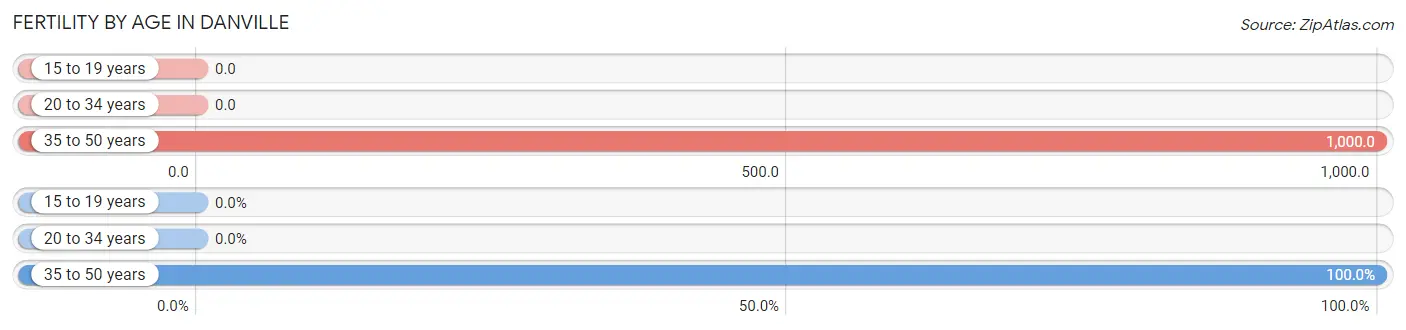
| Age Bracket | Women with Births | Births / 1,000 Women |
| 15 to 19 years | 0 (0.0%) | 0.0 |
| 20 to 34 years | 0 (0.0%) | 0.0 |
| 35 to 50 years | 7 (100.0%) | 1,000.0 |
| Total | 7 (100.0%) | 163.0 |
Fertility by Age by Marriage Status in Danville
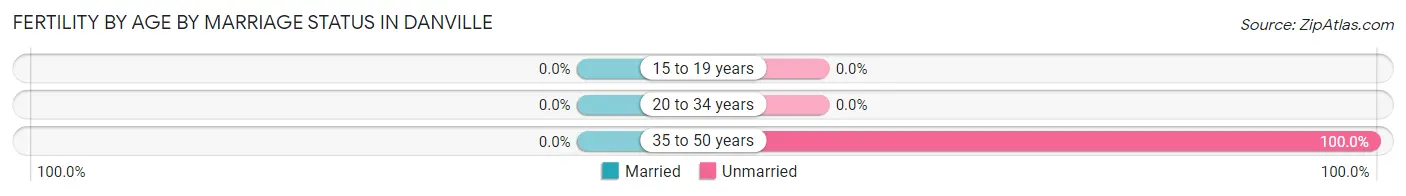
| Age Bracket | Married | Unmarried |
| 15 to 19 years | 0 (0.0%) | 0 (0.0%) |
| 20 to 34 years | 0 (0.0%) | 0 (0.0%) |
| 35 to 50 years | 0 (0.0%) | 7 (100.0%) |
| Total | 0 (0.0%) | 7 (100.0%) |
Fertility by Education in Danville
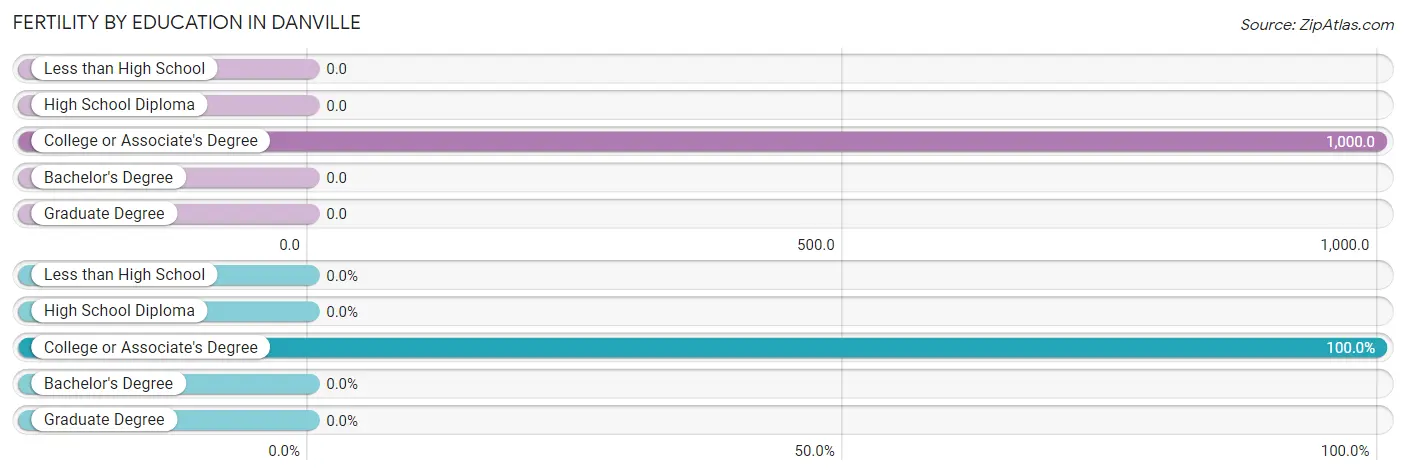
| Educational Attainment | Women with Births | Births / 1,000 Women |
| Less than High School | 0 (0.0%) | 0.0 |
| High School Diploma | 0 (0.0%) | 0.0 |
| College or Associate's Degree | 7 (100.0%) | 1,000.0 |
| Bachelor's Degree | 0 (0.0%) | 0.0 |
| Graduate Degree | 0 (0.0%) | 0.0 |
| Total | 7 (100.0%) | 163.0 |
Fertility by Education by Marriage Status in Danville
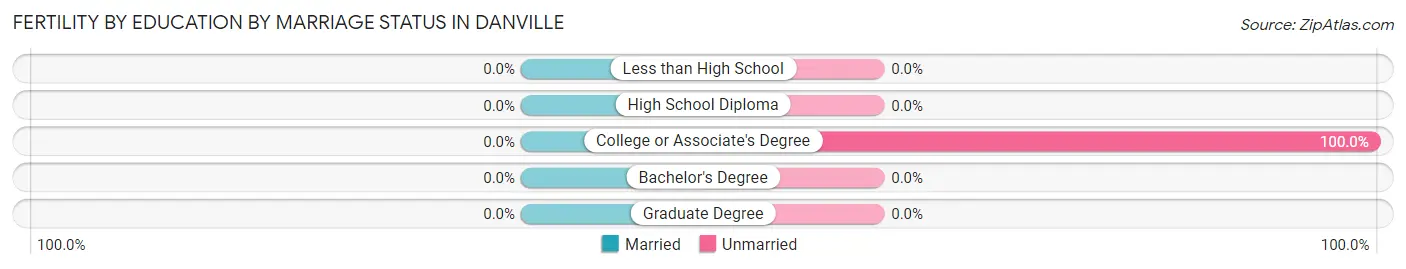
| Educational Attainment | Married | Unmarried |
| Less than High School | 0 (0.0%) | 0 (0.0%) |
| High School Diploma | 0 (0.0%) | 0 (0.0%) |
| College or Associate's Degree | 0 (0.0%) | 7 (100.0%) |
| Bachelor's Degree | 0 (0.0%) | 0 (0.0%) |
| Graduate Degree | 0 (0.0%) | 0 (0.0%) |
| Total | 0 (0.0%) | 7 (100.0%) |
Employment Characteristics in Danville
Employment by Class of Employer in Danville
Among the 23 employed individuals in Danville, state government employees (13 | 56.5%), and private company employees (10 | 43.5%) make up the most common classes of employment.
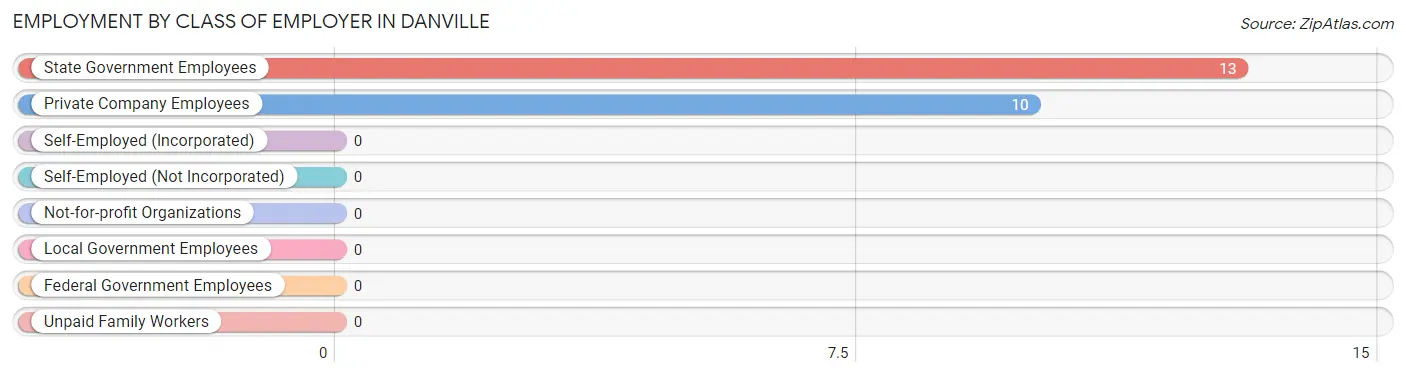
| Employer Class | # Employees | % Employees |
| Private Company Employees | 10 | 43.5% |
| Self-Employed (Incorporated) | 0 | 0.0% |
| Self-Employed (Not Incorporated) | 0 | 0.0% |
| Not-for-profit Organizations | 0 | 0.0% |
| Local Government Employees | 0 | 0.0% |
| State Government Employees | 13 | 56.5% |
| Federal Government Employees | 0 | 0.0% |
| Unpaid Family Workers | 0 | 0.0% |
| Total | 23 | 100.0% |
Employment Status by Age in Danville
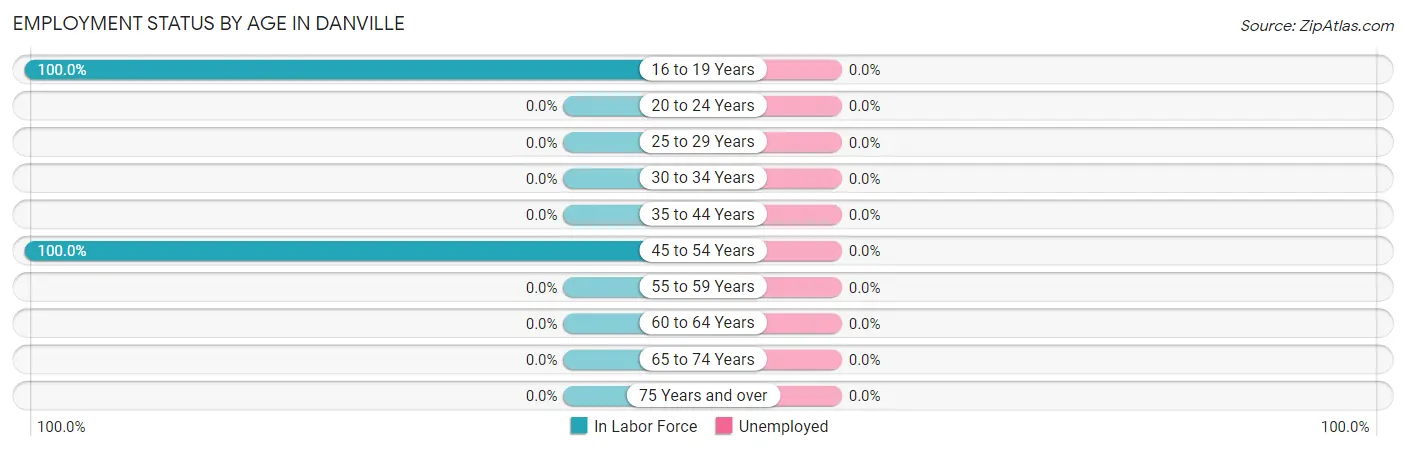
| Age Bracket | In Labor Force | Unemployed |
| 16 to 19 Years | 13 (100.0%) | 0 (0.0%) |
| 20 to 24 Years | 0 (0.0%) | 0 (0.0%) |
| 25 to 29 Years | 0 (0.0%) | 0 (0.0%) |
| 30 to 34 Years | 0 (0.0%) | 0 (0.0%) |
| 35 to 44 Years | 0 (0.0%) | 0 (0.0%) |
| 45 to 54 Years | 10 (100.0%) | 0 (0.0%) |
| 55 to 59 Years | 0 (0.0%) | 0 (0.0%) |
| 60 to 64 Years | 0 (0.0%) | 0 (0.0%) |
| 65 to 74 Years | 0 (0.0%) | 0 (0.0%) |
| 75 Years and over | 0 (0.0%) | 0 (0.0%) |
| Total | 23 (31.9%) | 0 (0.0%) |
Employment Status by Educational Attainment in Danville
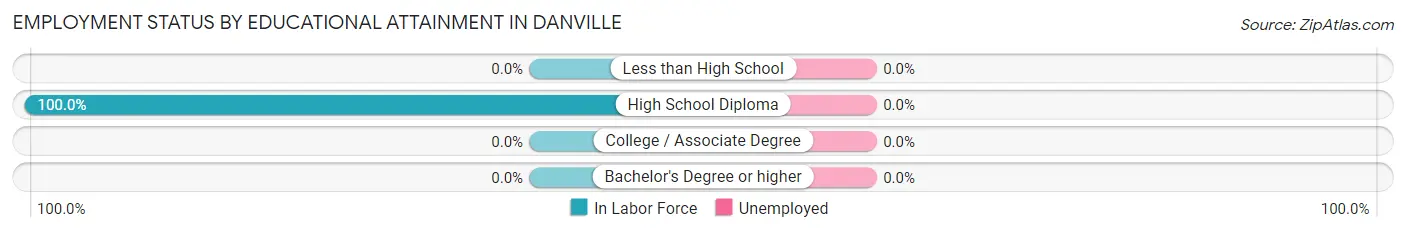
| Educational Attainment | In Labor Force | Unemployed |
| Less than High School | 0 (0.0%) | 0 (0.0%) |
| High School Diploma | 10 (100.0%) | 0 (0.0%) |
| College / Associate Degree | 0 (0.0%) | 0 (0.0%) |
| Bachelor's Degree or higher | 0 (0.0%) | 0 (0.0%) |
| Total | 10 (58.8%) | 0 (0.0%) |
Employment Occupations by Sex in Danville
Management, Business, Science and Arts Occupations
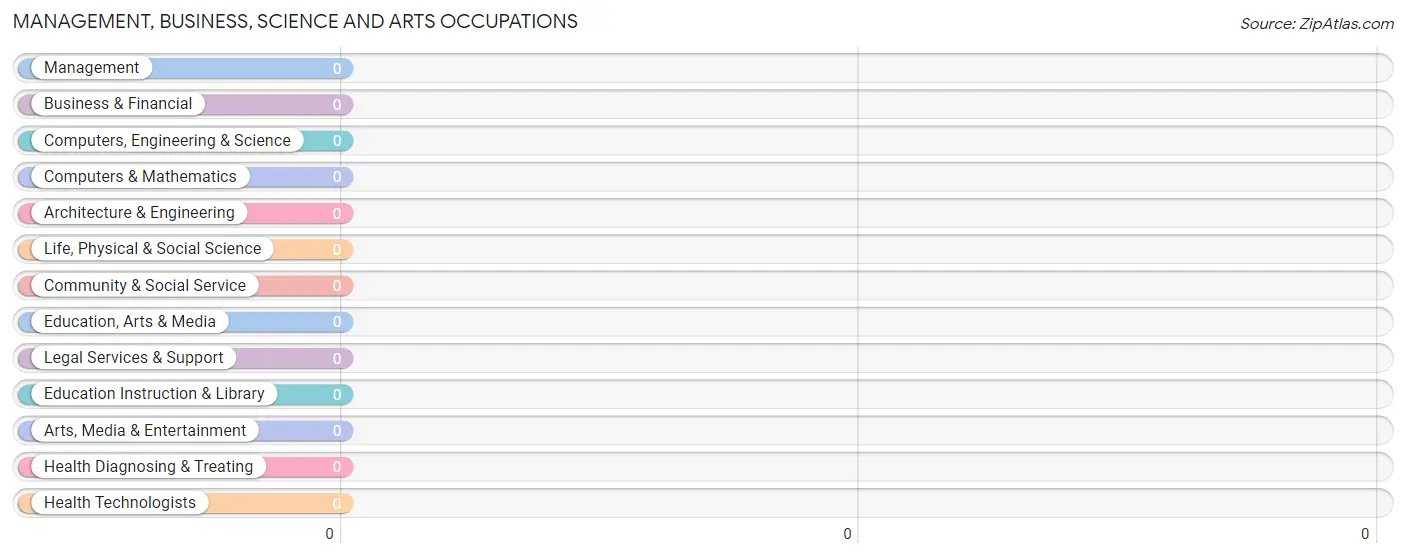
Management, Business, Science and Arts Occupations by Sex
| Occupation | Male | Female |
| Management | 0 (0.0%) | 0 (0.0%) |
| Business & Financial | 0 (0.0%) | 0 (0.0%) |
| Computers, Engineering & Science | 0 (0.0%) | 0 (0.0%) |
| Computers & Mathematics | 0 (0.0%) | 0 (0.0%) |
| Architecture & Engineering | 0 (0.0%) | 0 (0.0%) |
| Life, Physical & Social Science | 0 (0.0%) | 0 (0.0%) |
| Community & Social Service | 0 (0.0%) | 0 (0.0%) |
| Education, Arts & Media | 0 (0.0%) | 0 (0.0%) |
| Legal Services & Support | 0 (0.0%) | 0 (0.0%) |
| Education Instruction & Library | 0 (0.0%) | 0 (0.0%) |
| Arts, Media & Entertainment | 0 (0.0%) | 0 (0.0%) |
| Health Diagnosing & Treating | 0 (0.0%) | 0 (0.0%) |
| Health Technologists | 0 (0.0%) | 0 (0.0%) |
| Total (Category) | 0 (0.0%) | 0 (0.0%) |
| Total (Overall) | 10 (43.5%) | 13 (56.5%) |
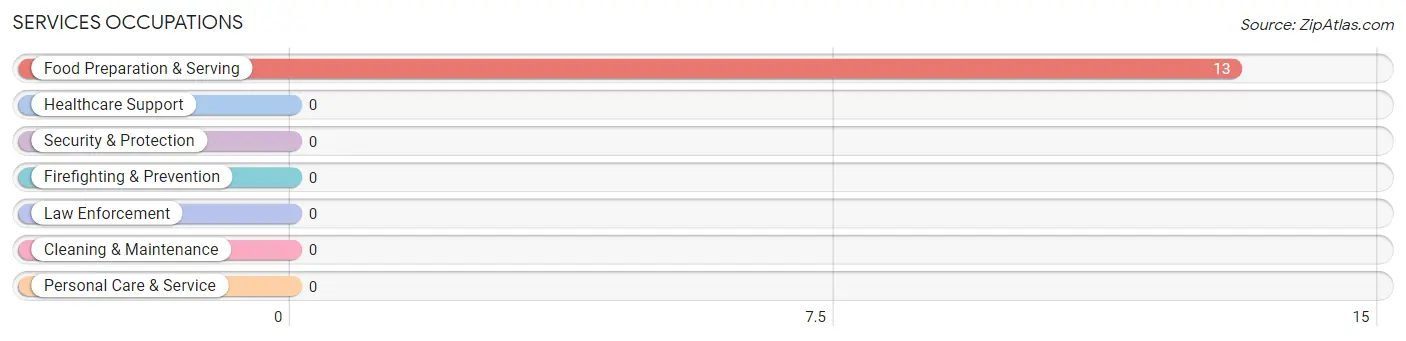
Services Occupations
The most common Services occupations in Danville are , and Food Preparation & Serving (13 | 56.5%).
Services Occupations by Sex
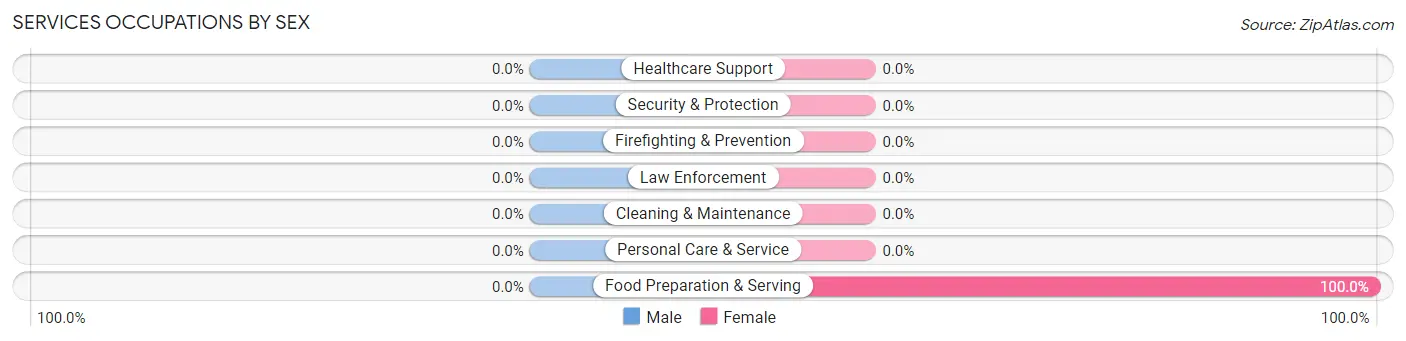
| Occupation | Male | Female |
| Healthcare Support | 0 (0.0%) | 0 (0.0%) |
| Security & Protection | 0 (0.0%) | 0 (0.0%) |
| Firefighting & Prevention | 0 (0.0%) | 0 (0.0%) |
| Law Enforcement | 0 (0.0%) | 0 (0.0%) |
| Food Preparation & Serving | 0 (0.0%) | 13 (100.0%) |
| Cleaning & Maintenance | 0 (0.0%) | 0 (0.0%) |
| Personal Care & Service | 0 (0.0%) | 0 (0.0%) |
| Total (Category) | 0 (0.0%) | 13 (100.0%) |
| Total (Overall) | 10 (43.5%) | 13 (56.5%) |
Sales and Office Occupations
Sales and Office Occupations by Sex
| Occupation | Male | Female |
| Sales & Related | 0 (0.0%) | 0 (0.0%) |
| Office & Administration | 0 (0.0%) | 0 (0.0%) |
| Total (Category) | 0 (0.0%) | 0 (0.0%) |
| Total (Overall) | 10 (43.5%) | 13 (56.5%) |
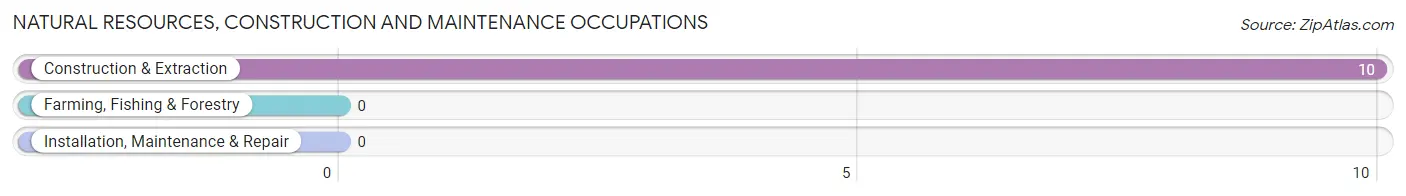
Natural Resources, Construction and Maintenance Occupations
The most common Natural Resources, Construction and Maintenance occupations in Danville are , and Construction & Extraction (10 | 43.5%).
Natural Resources, Construction and Maintenance Occupations by Sex
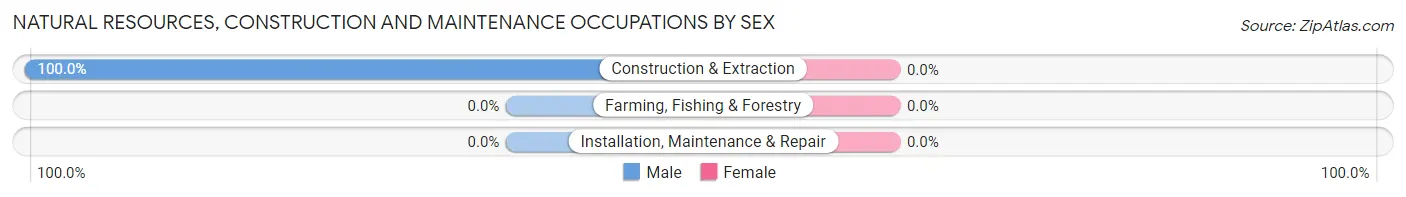
| Occupation | Male | Female |
| Farming, Fishing & Forestry | 0 (0.0%) | 0 (0.0%) |
| Construction & Extraction | 10 (100.0%) | 0 (0.0%) |
| Installation, Maintenance & Repair | 0 (0.0%) | 0 (0.0%) |
| Total (Category) | 10 (100.0%) | 0 (0.0%) |
| Total (Overall) | 10 (43.5%) | 13 (56.5%) |
Production, Transportation and Moving Occupations
Production, Transportation and Moving Occupations by Sex
| Occupation | Male | Female |
| Production | 0 (0.0%) | 0 (0.0%) |
| Transportation | 0 (0.0%) | 0 (0.0%) |
| Material Moving | 0 (0.0%) | 0 (0.0%) |
| Total (Category) | 0 (0.0%) | 0 (0.0%) |
| Total (Overall) | 10 (43.5%) | 13 (56.5%) |
Employment Industries by Sex in Danville
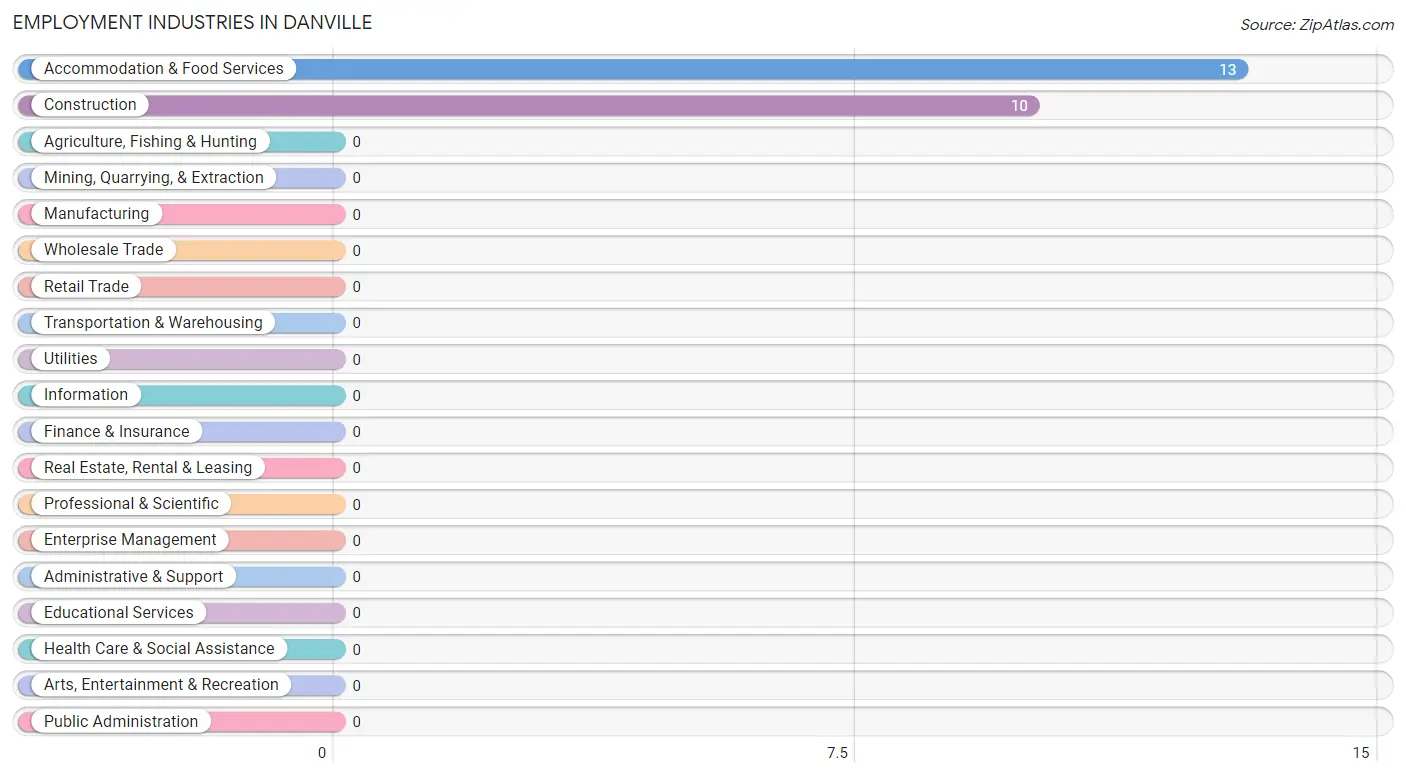
Employment Industries in Danville
The major employment industries in Danville include Accommodation & Food Services (13 | 56.5%), and Construction (10 | 43.5%).
Employment Industries by Sex in Danville
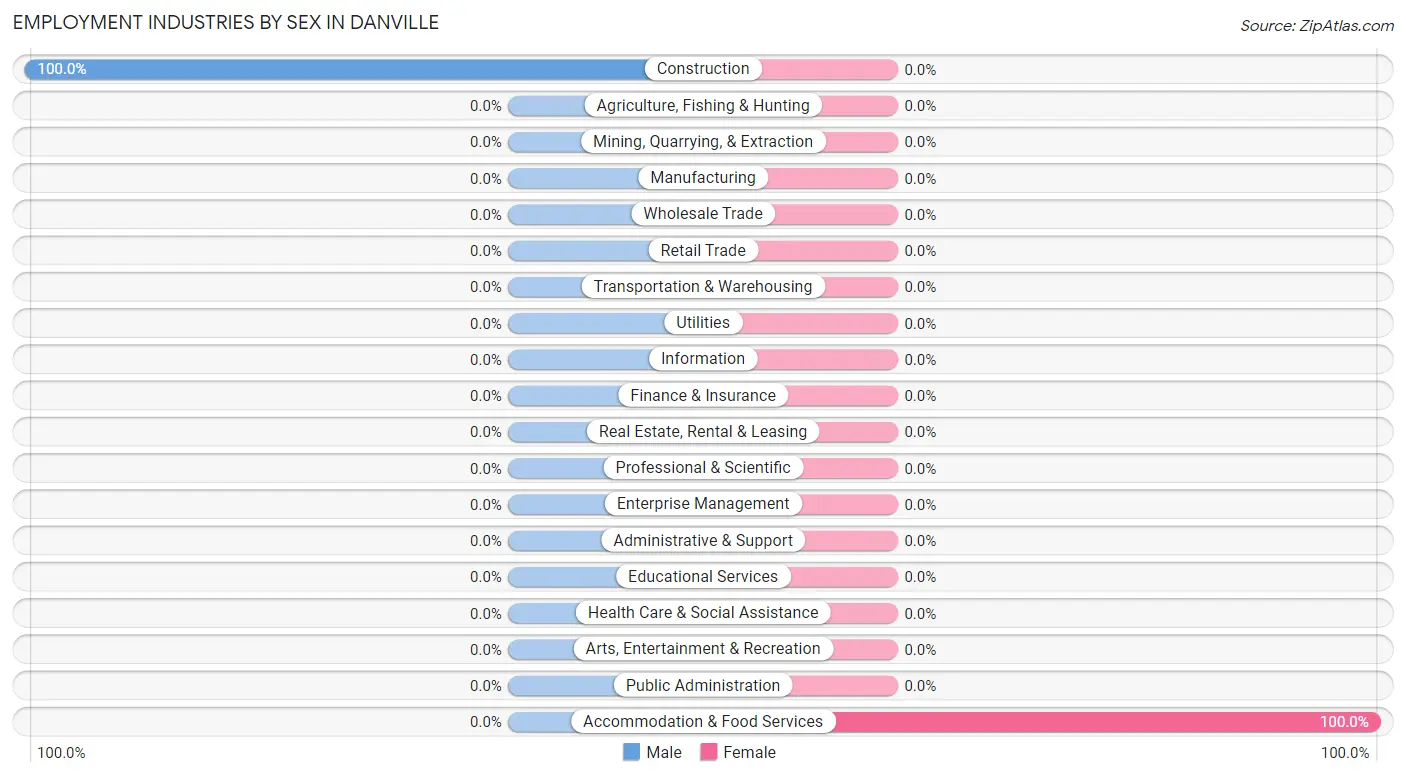
| Industry | Male | Female |
| Agriculture, Fishing & Hunting | 0 (0.0%) | 0 (0.0%) |
| Mining, Quarrying, & Extraction | 0 (0.0%) | 0 (0.0%) |
| Construction | 10 (100.0%) | 0 (0.0%) |
| Manufacturing | 0 (0.0%) | 0 (0.0%) |
| Wholesale Trade | 0 (0.0%) | 0 (0.0%) |
| Retail Trade | 0 (0.0%) | 0 (0.0%) |
| Transportation & Warehousing | 0 (0.0%) | 0 (0.0%) |
| Utilities | 0 (0.0%) | 0 (0.0%) |
| Information | 0 (0.0%) | 0 (0.0%) |
| Finance & Insurance | 0 (0.0%) | 0 (0.0%) |
| Real Estate, Rental & Leasing | 0 (0.0%) | 0 (0.0%) |
| Professional & Scientific | 0 (0.0%) | 0 (0.0%) |
| Enterprise Management | 0 (0.0%) | 0 (0.0%) |
| Administrative & Support | 0 (0.0%) | 0 (0.0%) |
| Educational Services | 0 (0.0%) | 0 (0.0%) |
| Health Care & Social Assistance | 0 (0.0%) | 0 (0.0%) |
| Arts, Entertainment & Recreation | 0 (0.0%) | 0 (0.0%) |
| Accommodation & Food Services | 0 (0.0%) | 13 (100.0%) |
| Public Administration | 0 (0.0%) | 0 (0.0%) |
| Total | 10 (43.5%) | 13 (56.5%) |
Education in Danville
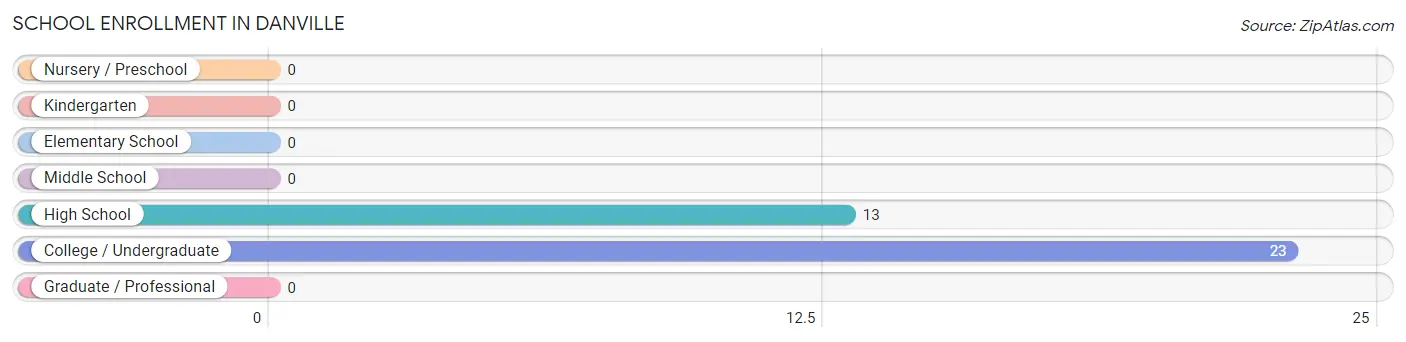
School Enrollment in Danville
The most common levels of schooling among the 36 students in Danville are college / undergraduate (23 | 63.9%), and high school (13 | 36.1%).
| School Level | # Students | % Students |
| Nursery / Preschool | 0 | 0.0% |
| Kindergarten | 0 | 0.0% |
| Elementary School | 0 | 0.0% |
| Middle School | 0 | 0.0% |
| High School | 13 | 36.1% |
| College / Undergraduate | 23 | 63.9% |
| Graduate / Professional | 0 | 0.0% |
| Total | 36 | 100.0% |
School Enrollment by Age by Funding Source in Danville
Out of a total of 36 students who are enrolled in schools in Danville, 6 (16.7%) attend a private institution, while the remaining 30 (83.3%) are enrolled in public schools. The age group of 15 to 17 year olds has the highest likelihood of being enrolled in private schools, with 6 (46.2% in the age bracket) enrolled. Conversely, the age group of 20 to 24 year olds has the lowest likelihood of being enrolled in a private school, with 23 (100.0% in the age bracket) attending a public institution.
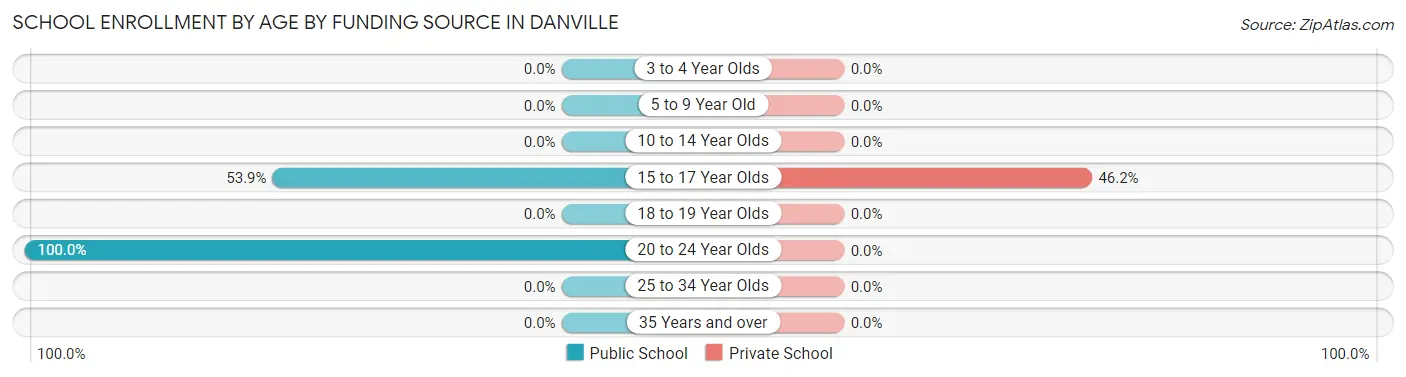
| Age Bracket | Public School | Private School |
| 3 to 4 Year Olds | 0 (0.0%) | 0 (0.0%) |
| 5 to 9 Year Old | 0 (0.0%) | 0 (0.0%) |
| 10 to 14 Year Olds | 0 (0.0%) | 0 (0.0%) |
| 15 to 17 Year Olds | 7 (53.8%) | 6 (46.2%) |
| 18 to 19 Year Olds | 0 (0.0%) | 0 (0.0%) |
| 20 to 24 Year Olds | 23 (100.0%) | 0 (0.0%) |
| 25 to 34 Year Olds | 0 (0.0%) | 0 (0.0%) |
| 35 Years and over | 0 (0.0%) | 0 (0.0%) |
| Total | 30 (83.3%) | 6 (16.7%) |
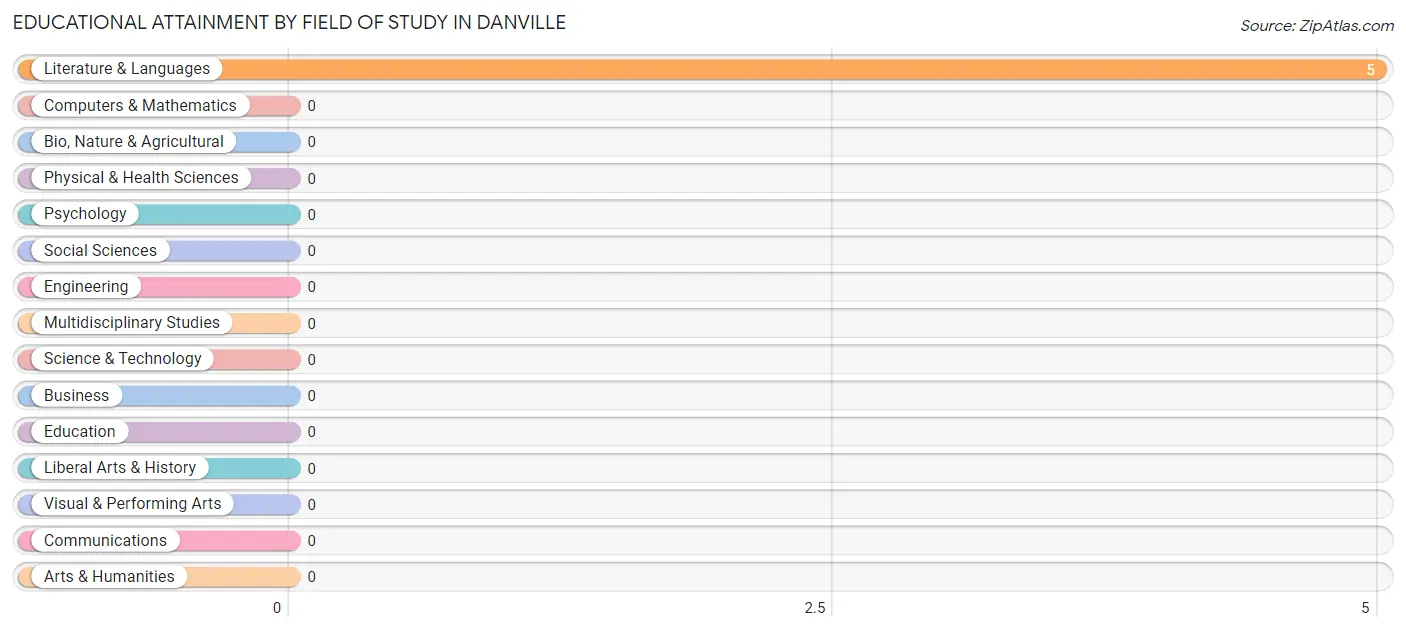
Educational Attainment by Field of Study in Danville
, and literature & languages (5 | 100.0%) are the most common fields of study among 5 individuals in Danville who have obtained a bachelor's degree or higher.
| Field of Study | # Graduates | % Graduates |
| Computers & Mathematics | 0 | 0.0% |
| Bio, Nature & Agricultural | 0 | 0.0% |
| Physical & Health Sciences | 0 | 0.0% |
| Psychology | 0 | 0.0% |
| Social Sciences | 0 | 0.0% |
| Engineering | 0 | 0.0% |
| Multidisciplinary Studies | 0 | 0.0% |
| Science & Technology | 0 | 0.0% |
| Business | 0 | 0.0% |
| Education | 0 | 0.0% |
| Literature & Languages | 5 | 100.0% |
| Liberal Arts & History | 0 | 0.0% |
| Visual & Performing Arts | 0 | 0.0% |
| Communications | 0 | 0.0% |
| Arts & Humanities | 0 | 0.0% |
| Total | 5 | 100.0% |
Transportation & Commute in Danville
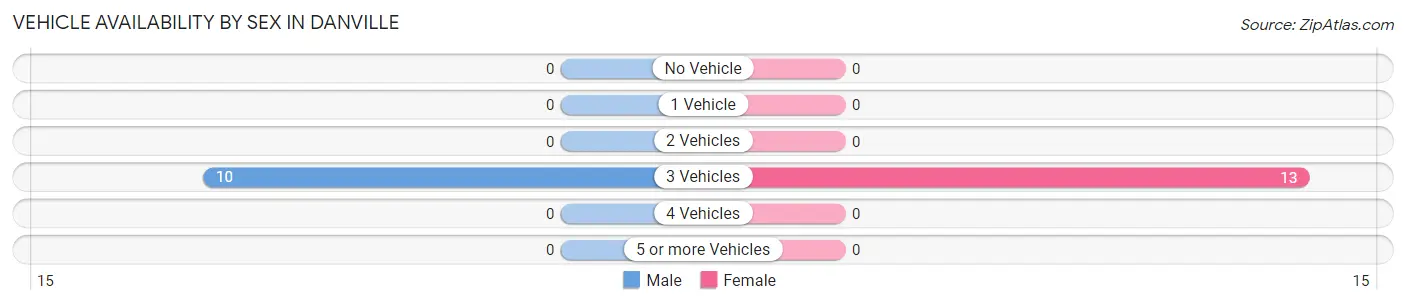
Vehicle Availability by Sex in Danville
The most prevalent vehicle ownership categories in Danville are males with 3 vehicles (10, accounting for 100.0%) and females with 3 vehicles (13, making up 76.9%).
| Vehicles Available | Male | Female |
| No Vehicle | 0 (0.0%) | 0 (0.0%) |
| 1 Vehicle | 0 (0.0%) | 0 (0.0%) |
| 2 Vehicles | 0 (0.0%) | 0 (0.0%) |
| 3 Vehicles | 10 (100.0%) | 13 (100.0%) |
| 4 Vehicles | 0 (0.0%) | 0 (0.0%) |
| 5 or more Vehicles | 0 (0.0%) | 0 (0.0%) |
| Total | 10 (100.0%) | 13 (100.0%) |
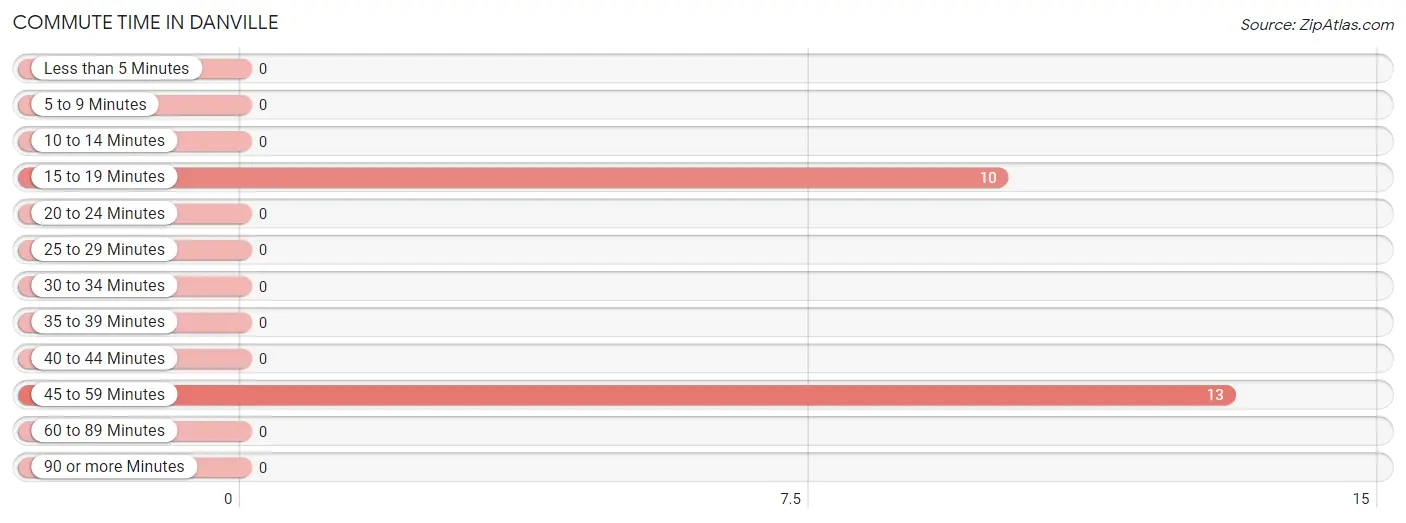
Commute Time in Danville
The most frequently occuring commute durations in Danville are 45 to 59 minutes (13 commuters, 56.5%), 15 to 19 minutes (10 commuters, 43.5%), and less than 5 minutes (0 commuters, 0.0%).
| Commute Time | # Commuters | % Commuters |
| Less than 5 Minutes | 0 | 0.0% |
| 5 to 9 Minutes | 0 | 0.0% |
| 10 to 14 Minutes | 0 | 0.0% |
| 15 to 19 Minutes | 10 | 43.5% |
| 20 to 24 Minutes | 0 | 0.0% |
| 25 to 29 Minutes | 0 | 0.0% |
| 30 to 34 Minutes | 0 | 0.0% |
| 35 to 39 Minutes | 0 | 0.0% |
| 40 to 44 Minutes | 0 | 0.0% |
| 45 to 59 Minutes | 13 | 56.5% |
| 60 to 89 Minutes | 0 | 0.0% |
| 90 or more Minutes | 0 | 0.0% |
Commute Time by Sex in Danville
The most common commute times in Danville are 15 to 19 minutes (10 commuters, 100.0%) for males and 45 to 59 minutes (13 commuters, 100.0%) for females.
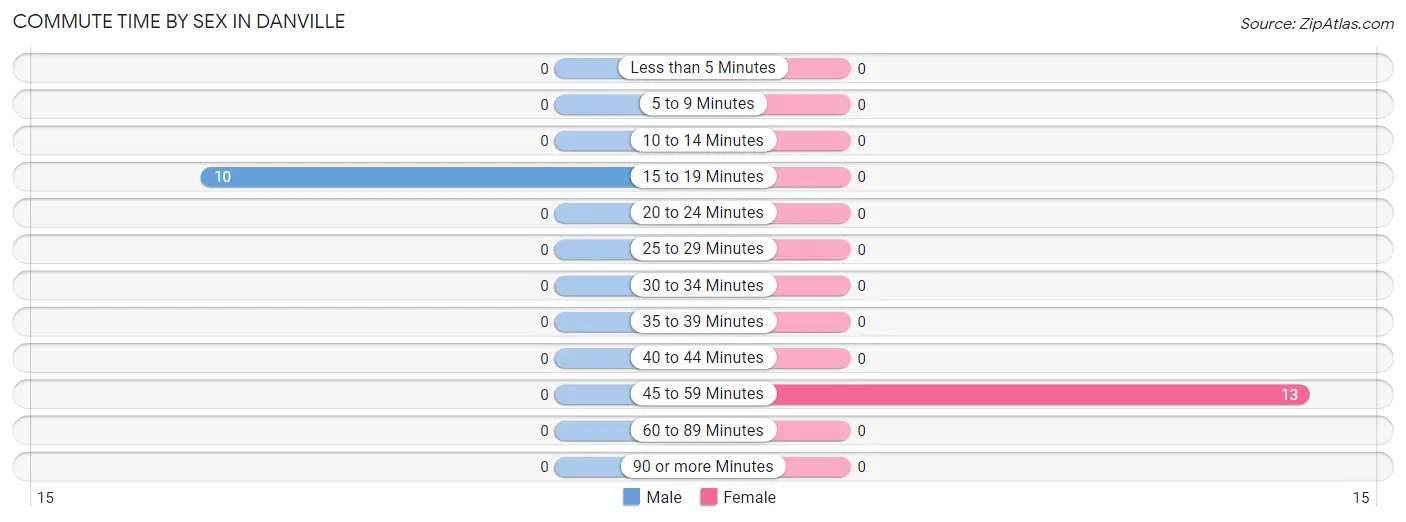
| Commute Time | Male | Female |
| Less than 5 Minutes | 0 (0.0%) | 0 (0.0%) |
| 5 to 9 Minutes | 0 (0.0%) | 0 (0.0%) |
| 10 to 14 Minutes | 0 (0.0%) | 0 (0.0%) |
| 15 to 19 Minutes | 10 (100.0%) | 0 (0.0%) |
| 20 to 24 Minutes | 0 (0.0%) | 0 (0.0%) |
| 25 to 29 Minutes | 0 (0.0%) | 0 (0.0%) |
| 30 to 34 Minutes | 0 (0.0%) | 0 (0.0%) |
| 35 to 39 Minutes | 0 (0.0%) | 0 (0.0%) |
| 40 to 44 Minutes | 0 (0.0%) | 0 (0.0%) |
| 45 to 59 Minutes | 0 (0.0%) | 13 (100.0%) |
| 60 to 89 Minutes | 0 (0.0%) | 0 (0.0%) |
| 90 or more Minutes | 0 (0.0%) | 0 (0.0%) |
Time of Departure to Work by Sex in Danville
The most frequent times of departure to work in Danville are 6:00 AM to 6:29 AM (10, 100.0%) for males and 8:00 AM to 8:29 AM (7, 53.8%) for females.
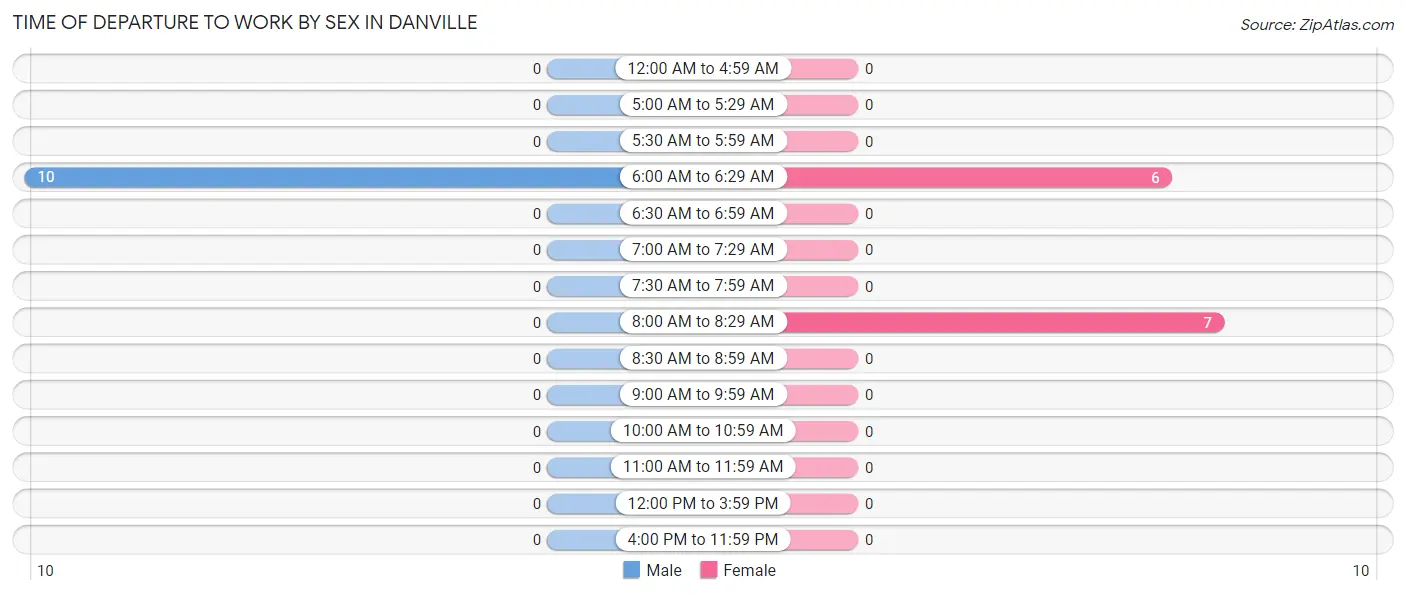
| Time of Departure | Male | Female |
| 12:00 AM to 4:59 AM | 0 (0.0%) | 0 (0.0%) |
| 5:00 AM to 5:29 AM | 0 (0.0%) | 0 (0.0%) |
| 5:30 AM to 5:59 AM | 0 (0.0%) | 0 (0.0%) |
| 6:00 AM to 6:29 AM | 10 (100.0%) | 6 (46.2%) |
| 6:30 AM to 6:59 AM | 0 (0.0%) | 0 (0.0%) |
| 7:00 AM to 7:29 AM | 0 (0.0%) | 0 (0.0%) |
| 7:30 AM to 7:59 AM | 0 (0.0%) | 0 (0.0%) |
| 8:00 AM to 8:29 AM | 0 (0.0%) | 7 (53.8%) |
| 8:30 AM to 8:59 AM | 0 (0.0%) | 0 (0.0%) |
| 9:00 AM to 9:59 AM | 0 (0.0%) | 0 (0.0%) |
| 10:00 AM to 10:59 AM | 0 (0.0%) | 0 (0.0%) |
| 11:00 AM to 11:59 AM | 0 (0.0%) | 0 (0.0%) |
| 12:00 PM to 3:59 PM | 0 (0.0%) | 0 (0.0%) |
| 4:00 PM to 11:59 PM | 0 (0.0%) | 0 (0.0%) |
| Total | 10 (100.0%) | 13 (100.0%) |
Housing Occupancy in Danville
Occupancy by Ownership in Danville
Of the total 36 dwellings in Danville, owner-occupied units account for 15 (41.7%), while renter-occupied units make up 21 (58.3%).
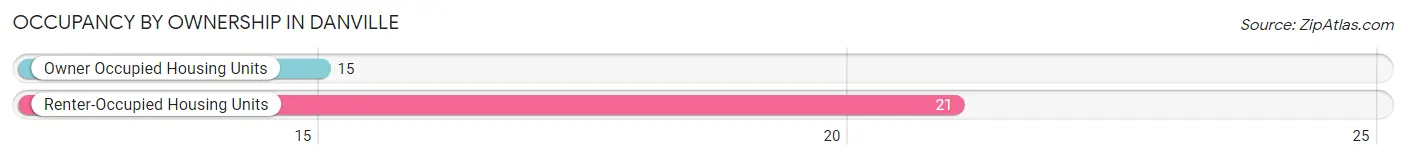
| Occupancy | # Housing Units | % Housing Units |
| Owner Occupied Housing Units | 15 | 41.7% |
| Renter-Occupied Housing Units | 21 | 58.3% |
| Total Occupied Housing Units | 36 | 100.0% |
Occupancy by Household Size in Danville
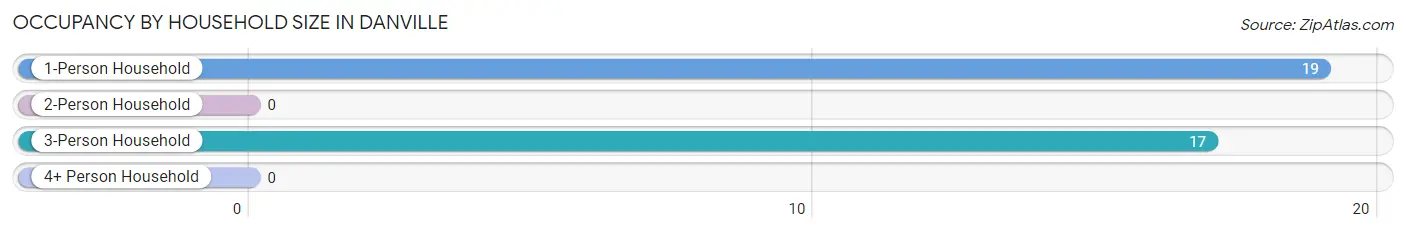
| Household Size | # Housing Units | % Housing Units |
| 1-Person Household | 19 | 52.8% |
| 2-Person Household | 0 | 0.0% |
| 3-Person Household | 17 | 47.2% |
| 4+ Person Household | 0 | 0.0% |
| Total Housing Units | 36 | 100.0% |
Occupancy by Ownership by Household Size in Danville
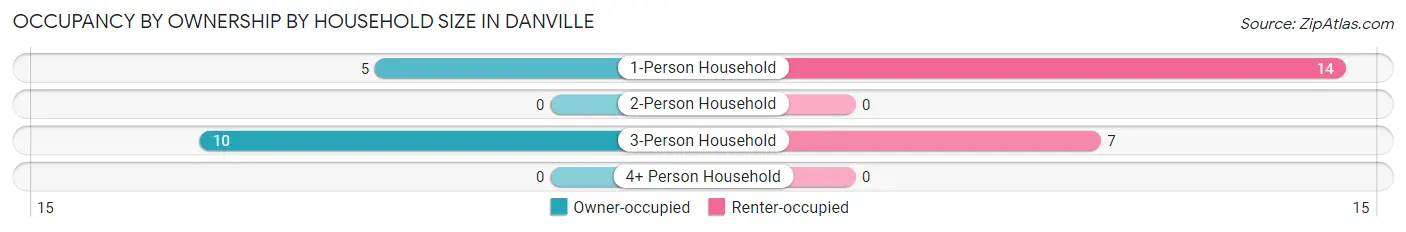
| Household Size | Owner-occupied | Renter-occupied |
| 1-Person Household | 5 (26.3%) | 14 (73.7%) |
| 2-Person Household | 0 (0.0%) | 0 (0.0%) |
| 3-Person Household | 10 (58.8%) | 7 (41.2%) |
| 4+ Person Household | 0 (0.0%) | 0 (0.0%) |
| Total Housing Units | 15 (41.7%) | 21 (58.3%) |
Occupancy by Educational Attainment in Danville
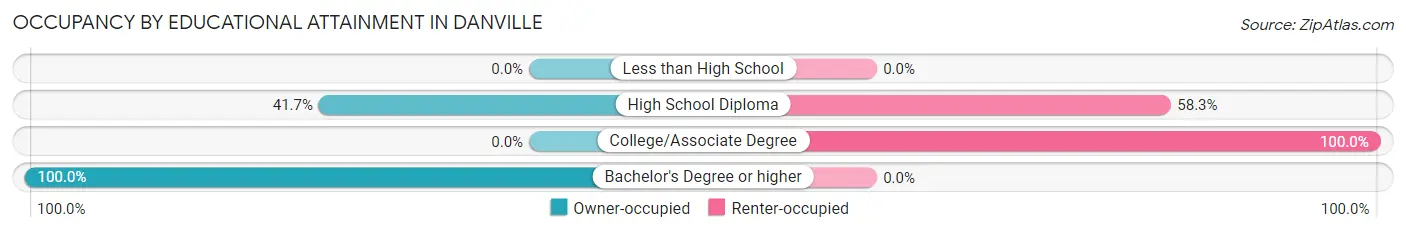
| Household Size | Owner-occupied | Renter-occupied |
| Less than High School | 0 (0.0%) | 0 (0.0%) |
| High School Diploma | 10 (41.7%) | 14 (58.3%) |
| College/Associate Degree | 0 (0.0%) | 7 (100.0%) |
| Bachelor's Degree or higher | 5 (100.0%) | 0 (0.0%) |
Occupancy by Age of Householder in Danville
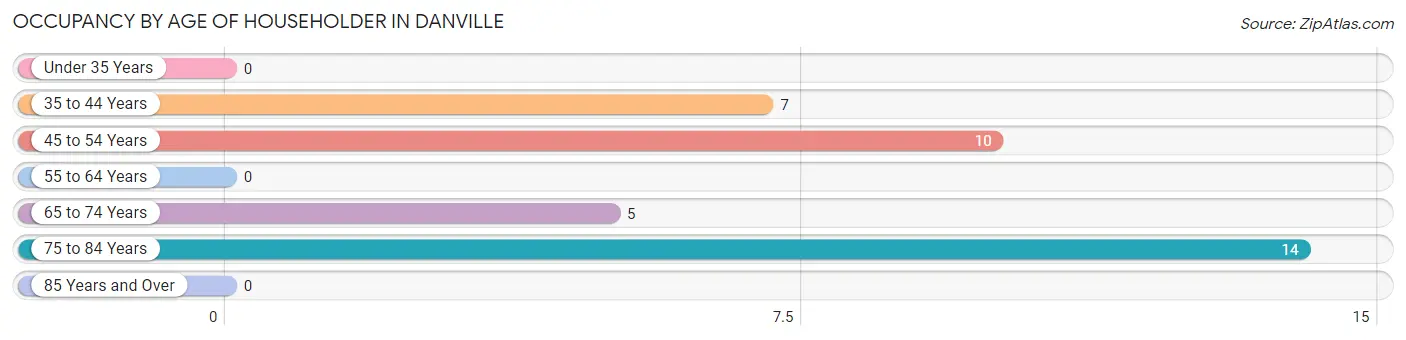
| Age Bracket | # Households | % Households |
| Under 35 Years | 0 | 0.0% |
| 35 to 44 Years | 7 | 19.4% |
| 45 to 54 Years | 10 | 27.8% |
| 55 to 64 Years | 0 | 0.0% |
| 65 to 74 Years | 5 | 13.9% |
| 75 to 84 Years | 14 | 38.9% |
| 85 Years and Over | 0 | 0.0% |
| Total | 36 | 100.0% |
Housing Finances in Danville
Median Income by Occupancy in Danville
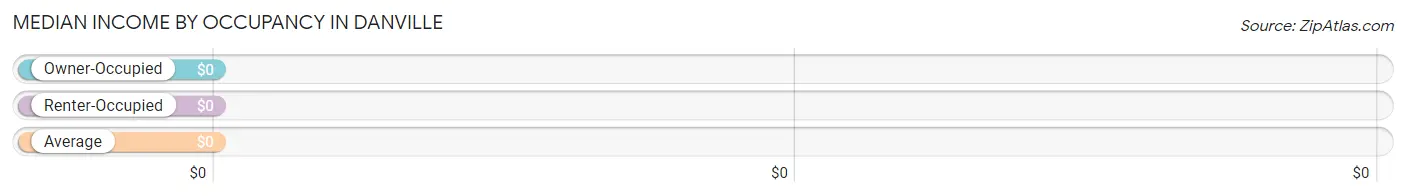
| Occupancy Type | # Households | Median Income |
| Owner-Occupied | 15 (41.7%) | $0 |
| Renter-Occupied | 21 (58.3%) | $0 |
| Average | 36 (100.0%) | $0 |
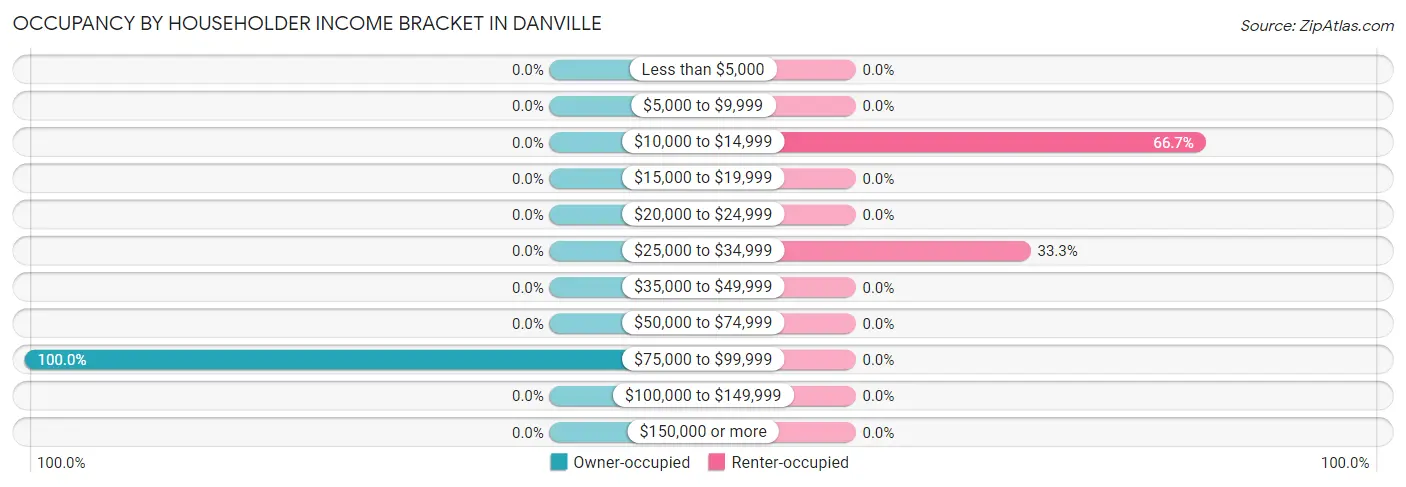
Occupancy by Householder Income Bracket in Danville
| Income Bracket | Owner-occupied | Renter-occupied |
| Less than $5,000 | 0 (0.0%) | 0 (0.0%) |
| $5,000 to $9,999 | 0 (0.0%) | 0 (0.0%) |
| $10,000 to $14,999 | 0 (0.0%) | 14 (66.7%) |
| $15,000 to $19,999 | 0 (0.0%) | 0 (0.0%) |
| $20,000 to $24,999 | 0 (0.0%) | 0 (0.0%) |
| $25,000 to $34,999 | 0 (0.0%) | 7 (33.3%) |
| $35,000 to $49,999 | 0 (0.0%) | 0 (0.0%) |
| $50,000 to $74,999 | 0 (0.0%) | 0 (0.0%) |
| $75,000 to $99,999 | 15 (100.0%) | 0 (0.0%) |
| $100,000 to $149,999 | 0 (0.0%) | 0 (0.0%) |
| $150,000 or more | 0 (0.0%) | 0 (0.0%) |
| Total | 15 (100.0%) | 21 (100.0%) |
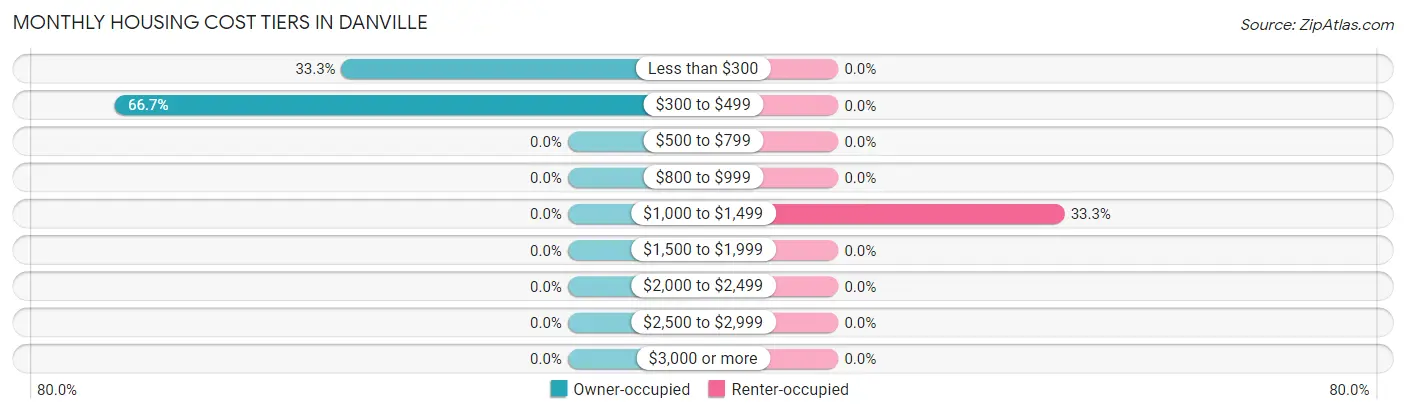
Monthly Housing Cost Tiers in Danville
| Monthly Cost | Owner-occupied | Renter-occupied |
| Less than $300 | 5 (33.3%) | 0 (0.0%) |
| $300 to $499 | 10 (66.7%) | 0 (0.0%) |
| $500 to $799 | 0 (0.0%) | 0 (0.0%) |
| $800 to $999 | 0 (0.0%) | 0 (0.0%) |
| $1,000 to $1,499 | 0 (0.0%) | 7 (33.3%) |
| $1,500 to $1,999 | 0 (0.0%) | 0 (0.0%) |
| $2,000 to $2,499 | 0 (0.0%) | 0 (0.0%) |
| $2,500 to $2,999 | 0 (0.0%) | 0 (0.0%) |
| $3,000 or more | 0 (0.0%) | 0 (0.0%) |
| Total | 15 (100.0%) | 21 (100.0%) |
Physical Housing Characteristics in Danville
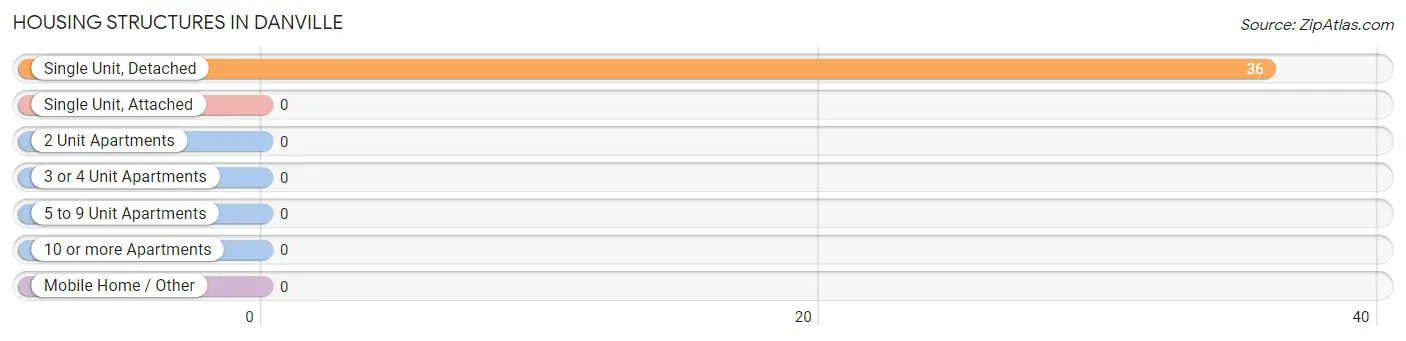
Housing Structures in Danville
| Structure Type | # Housing Units | % Housing Units |
| Single Unit, Detached | 36 | 100.0% |
| Single Unit, Attached | 0 | 0.0% |
| 2 Unit Apartments | 0 | 0.0% |
| 3 or 4 Unit Apartments | 0 | 0.0% |
| 5 to 9 Unit Apartments | 0 | 0.0% |
| 10 or more Apartments | 0 | 0.0% |
| Mobile Home / Other | 0 | 0.0% |
| Total | 36 | 100.0% |
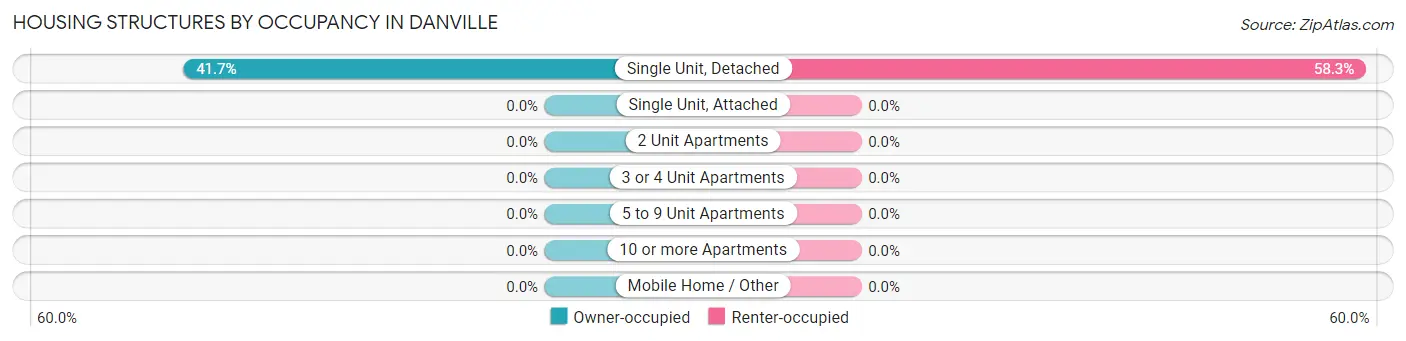
Housing Structures by Occupancy in Danville
| Structure Type | Owner-occupied | Renter-occupied |
| Single Unit, Detached | 15 (41.7%) | 21 (58.3%) |
| Single Unit, Attached | 0 (0.0%) | 0 (0.0%) |
| 2 Unit Apartments | 0 (0.0%) | 0 (0.0%) |
| 3 or 4 Unit Apartments | 0 (0.0%) | 0 (0.0%) |
| 5 to 9 Unit Apartments | 0 (0.0%) | 0 (0.0%) |
| 10 or more Apartments | 0 (0.0%) | 0 (0.0%) |
| Mobile Home / Other | 0 (0.0%) | 0 (0.0%) |
| Total | 15 (41.7%) | 21 (58.3%) |
Housing Structures by Number of Rooms in Danville
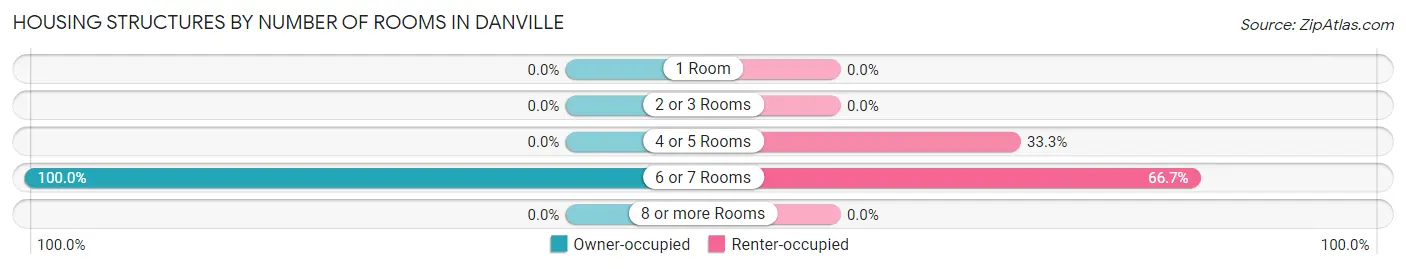
| Number of Rooms | Owner-occupied | Renter-occupied |
| 1 Room | 0 (0.0%) | 0 (0.0%) |
| 2 or 3 Rooms | 0 (0.0%) | 0 (0.0%) |
| 4 or 5 Rooms | 0 (0.0%) | 7 (33.3%) |
| 6 or 7 Rooms | 15 (100.0%) | 14 (66.7%) |
| 8 or more Rooms | 0 (0.0%) | 0 (0.0%) |
| Total | 15 (100.0%) | 21 (100.0%) |
Housing Structure by Heating Type in Danville
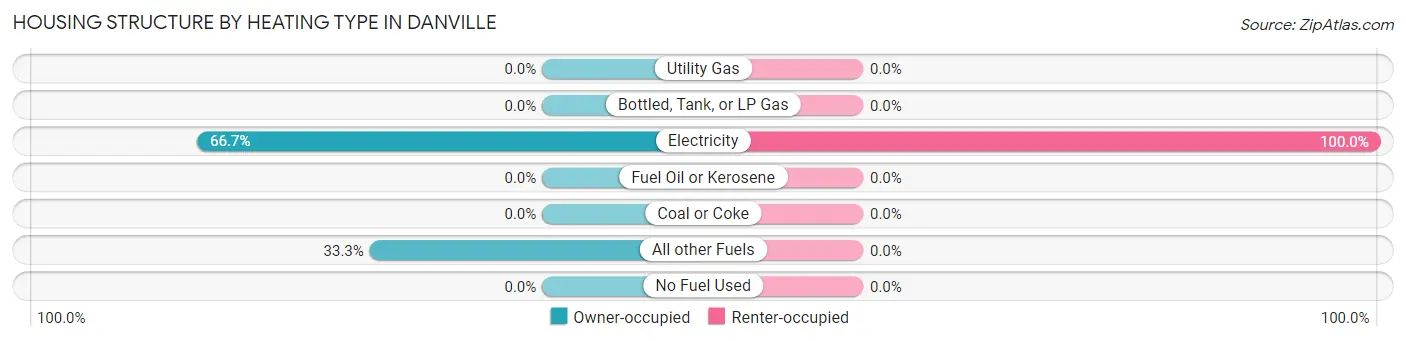
| Heating Type | Owner-occupied | Renter-occupied |
| Utility Gas | 0 (0.0%) | 0 (0.0%) |
| Bottled, Tank, or LP Gas | 0 (0.0%) | 0 (0.0%) |
| Electricity | 10 (66.7%) | 21 (100.0%) |
| Fuel Oil or Kerosene | 0 (0.0%) | 0 (0.0%) |
| Coal or Coke | 0 (0.0%) | 0 (0.0%) |
| All other Fuels | 5 (33.3%) | 0 (0.0%) |
| No Fuel Used | 0 (0.0%) | 0 (0.0%) |
| Total | 15 (100.0%) | 21 (100.0%) |
Household Vehicle Usage in Danville
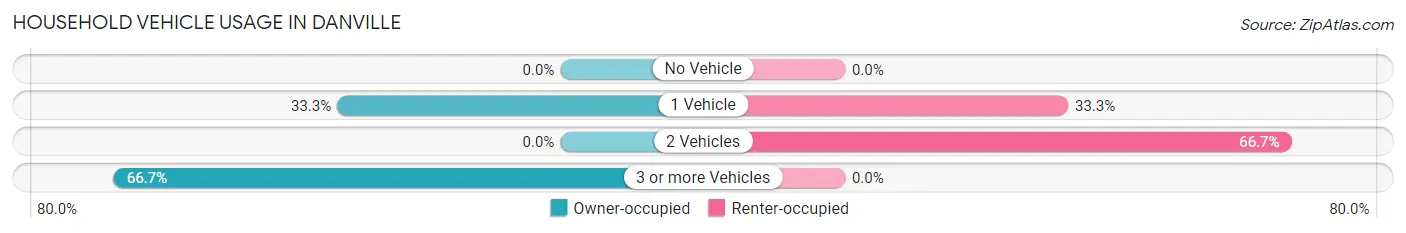
| Vehicles per Household | Owner-occupied | Renter-occupied |
| No Vehicle | 0 (0.0%) | 0 (0.0%) |
| 1 Vehicle | 5 (33.3%) | 7 (33.3%) |
| 2 Vehicles | 0 (0.0%) | 14 (66.7%) |
| 3 or more Vehicles | 10 (66.7%) | 0 (0.0%) |
| Total | 15 (100.0%) | 21 (100.0%) |
Real Estate & Mortgages in Danville
Real Estate and Mortgage Overview in Danville
| Characteristic | Without Mortgage | With Mortgage |
| Housing Units | 15 | 0 |
| Median Property Value | - | - |
| Median Household Income | - | - |
| Monthly Housing Costs | - | - |
| Real Estate Taxes | - | - |
Property Value by Mortgage Status in Danville
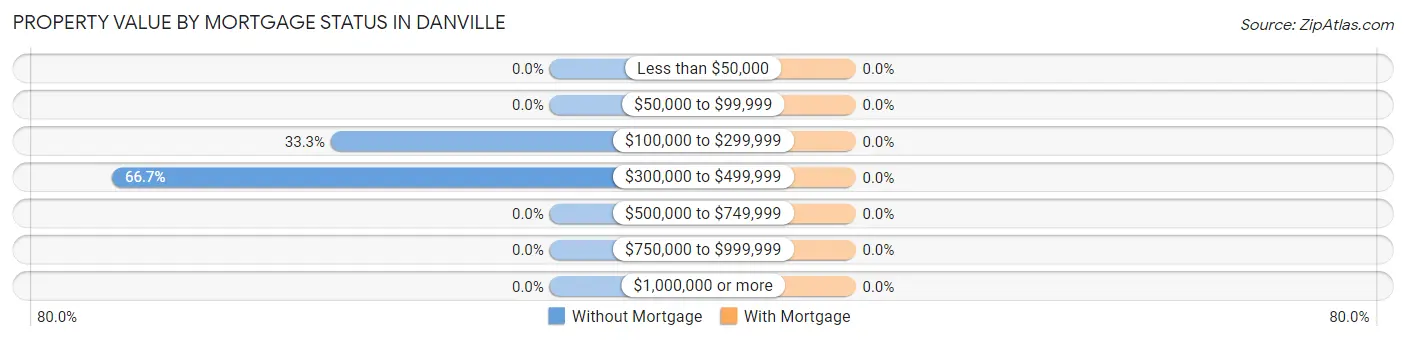
| Property Value | Without Mortgage | With Mortgage |
| Less than $50,000 | 0 (0.0%) | 0 (0.0%) |
| $50,000 to $99,999 | 0 (0.0%) | 0 (0.0%) |
| $100,000 to $299,999 | 5 (33.3%) | 0 (0.0%) |
| $300,000 to $499,999 | 10 (66.7%) | 0 (0.0%) |
| $500,000 to $749,999 | 0 (0.0%) | 0 (0.0%) |
| $750,000 to $999,999 | 0 (0.0%) | 0 (0.0%) |
| $1,000,000 or more | 0 (0.0%) | 0 (0.0%) |
| Total | 15 (100.0%) | 0 (0.0%) |
Household Income by Mortgage Status in Danville
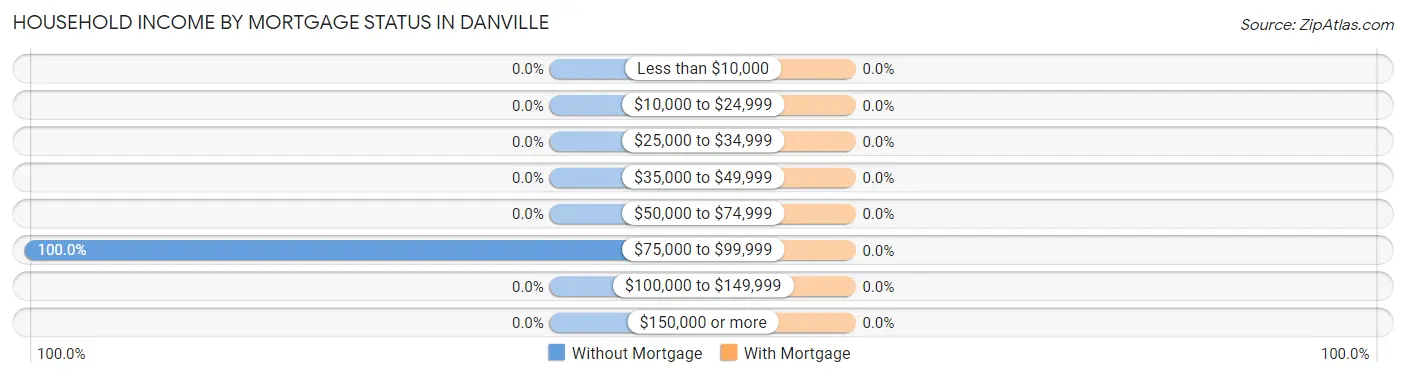
| Household Income | Without Mortgage | With Mortgage |
| Less than $10,000 | 0 (0.0%) | 0 (0.0%) |
| $10,000 to $24,999 | 0 (0.0%) | 0 (0.0%) |
| $25,000 to $34,999 | 0 (0.0%) | 0 (0.0%) |
| $35,000 to $49,999 | 0 (0.0%) | 0 (0.0%) |
| $50,000 to $74,999 | 0 (0.0%) | 0 (0.0%) |
| $75,000 to $99,999 | 15 (100.0%) | 0 (0.0%) |
| $100,000 to $149,999 | 0 (0.0%) | 0 (0.0%) |
| $150,000 or more | 0 (0.0%) | 0 (0.0%) |
| Total | 15 (100.0%) | 0 (0.0%) |
Property Value to Household Income Ratio in Danville
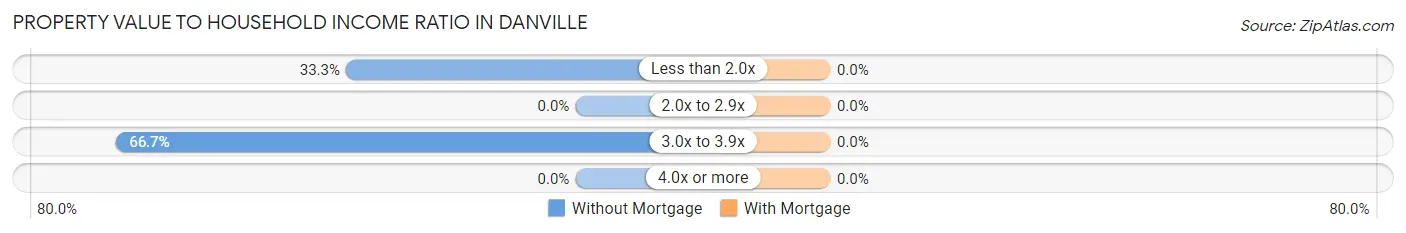
| Value-to-Income Ratio | Without Mortgage | With Mortgage |
| Less than 2.0x | 5 (33.3%) | 0 (0.0%) |
| 2.0x to 2.9x | 0 (0.0%) | 0 (0.0%) |
| 3.0x to 3.9x | 10 (66.7%) | 0 (0.0%) |
| 4.0x or more | 0 (0.0%) | 0 (0.0%) |
| Total | 15 (100.0%) | 0 (0.0%) |
Real Estate Taxes by Mortgage Status in Danville
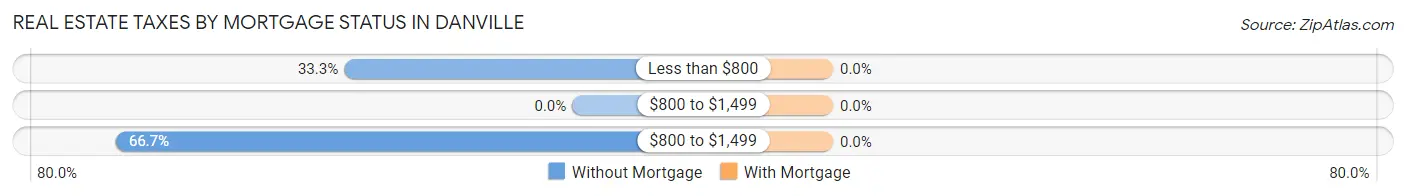
| Property Taxes | Without Mortgage | With Mortgage |
| Less than $800 | 5 (33.3%) | 0 (0.0%) |
| $800 to $1,499 | 0 (0.0%) | 0 (0.0%) |
| $800 to $1,499 | 10 (66.7%) | 0 (0.0%) |
| Total | 15 (100.0%) | 0 (0.0%) |
Health & Disability in Danville
Health Insurance Coverage by Age in Danville
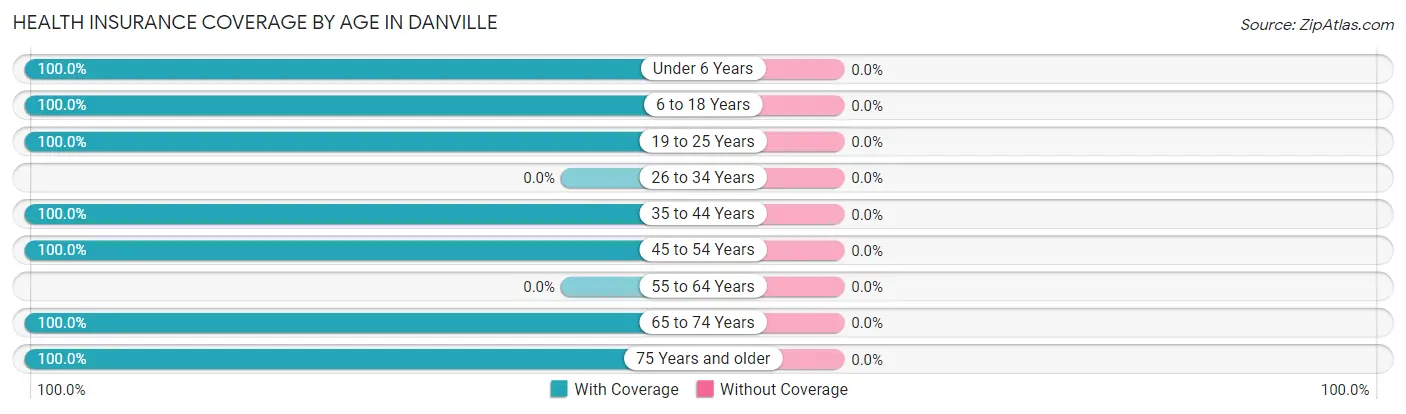
| Age Bracket | With Coverage | Without Coverage |
| Under 6 Years | 10 (100.0%) | 0 (0.0%) |
| 6 to 18 Years | 13 (100.0%) | 0 (0.0%) |
| 19 to 25 Years | 23 (100.0%) | 0 (0.0%) |
| 26 to 34 Years | 0 (0.0%) | 0 (0.0%) |
| 35 to 44 Years | 7 (100.0%) | 0 (0.0%) |
| 45 to 54 Years | 10 (100.0%) | 0 (0.0%) |
| 55 to 64 Years | 0 (0.0%) | 0 (0.0%) |
| 65 to 74 Years | 5 (100.0%) | 0 (0.0%) |
| 75 Years and older | 14 (100.0%) | 0 (0.0%) |
| Total | 82 (100.0%) | 0 (0.0%) |
Health Insurance Coverage by Citizenship Status in Danville
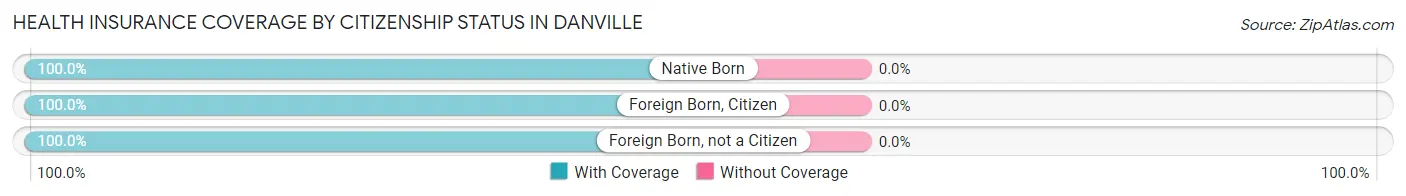
| Citizenship Status | With Coverage | Without Coverage |
| Native Born | 10 (100.0%) | 0 (0.0%) |
| Foreign Born, Citizen | 13 (100.0%) | 0 (0.0%) |
| Foreign Born, not a Citizen | 23 (100.0%) | 0 (0.0%) |
Health Insurance Coverage by Household Income in Danville
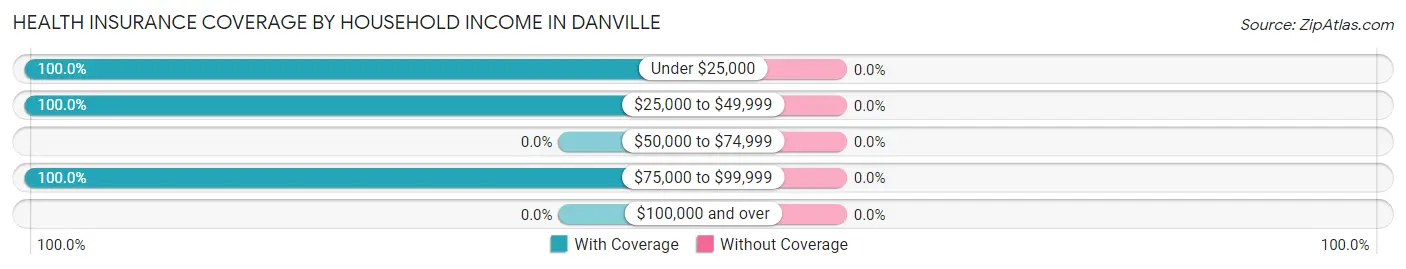
| Household Income | With Coverage | Without Coverage |
| Under $25,000 | 14 (100.0%) | 0 (0.0%) |
| $25,000 to $49,999 | 40 (100.0%) | 0 (0.0%) |
| $50,000 to $74,999 | 0 (0.0%) | 0 (0.0%) |
| $75,000 to $99,999 | 28 (100.0%) | 0 (0.0%) |
| $100,000 and over | 0 (0.0%) | 0 (0.0%) |
Public vs Private Health Insurance Coverage by Age in Danville
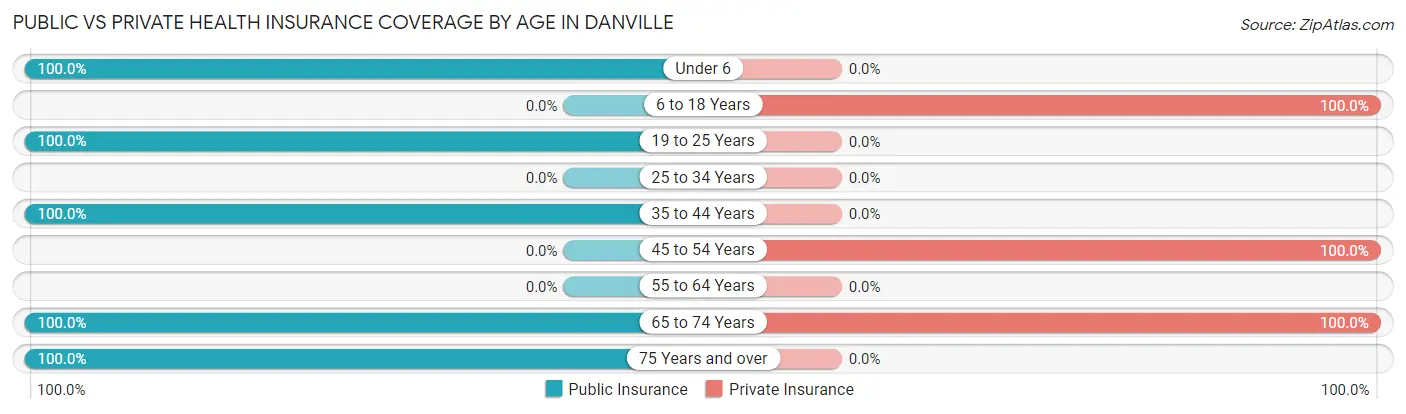
| Age Bracket | Public Insurance | Private Insurance |
| Under 6 | 10 (100.0%) | 0 (0.0%) |
| 6 to 18 Years | 0 (0.0%) | 13 (100.0%) |
| 19 to 25 Years | 23 (100.0%) | 0 (0.0%) |
| 25 to 34 Years | 0 (0.0%) | 0 (0.0%) |
| 35 to 44 Years | 7 (100.0%) | 0 (0.0%) |
| 45 to 54 Years | 0 (0.0%) | 10 (100.0%) |
| 55 to 64 Years | 0 (0.0%) | 0 (0.0%) |
| 65 to 74 Years | 5 (100.0%) | 5 (100.0%) |
| 75 Years and over | 14 (100.0%) | 0 (0.0%) |
| Total | 59 (72.0%) | 28 (34.2%) |
Disability Status by Sex by Age in Danville
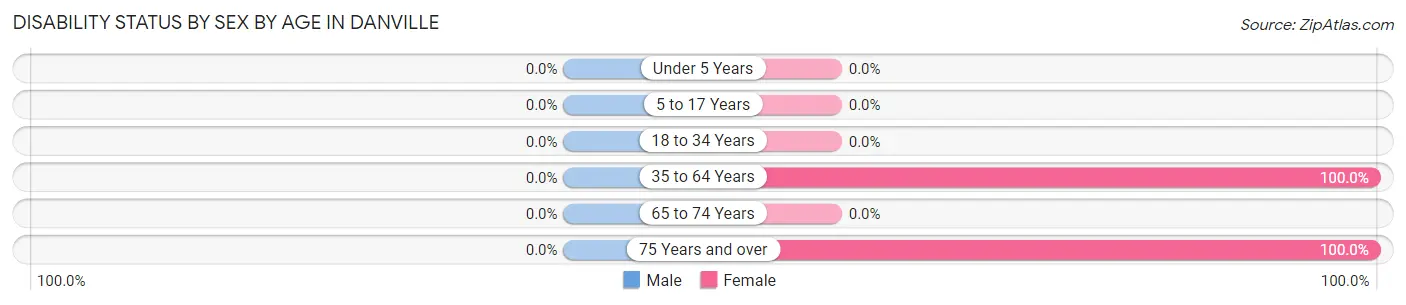
| Age Bracket | Male | Female |
| Under 5 Years | 0 (0.0%) | 0 (0.0%) |
| 5 to 17 Years | 0 (0.0%) | 0 (0.0%) |
| 18 to 34 Years | 0 (0.0%) | 0 (0.0%) |
| 35 to 64 Years | 0 (0.0%) | 7 (100.0%) |
| 65 to 74 Years | 0 (0.0%) | 0 (0.0%) |
| 75 Years and over | 0 (0.0%) | 14 (100.0%) |
Disability Class by Sex by Age in Danville
Disability Class: Hearing Difficulty
| Age Bracket | Male | Female |
| Under 5 Years | 0 (0.0%) | 0 (0.0%) |
| 5 to 17 Years | 0 (0.0%) | 0 (0.0%) |
| 18 to 34 Years | 0 (0.0%) | 0 (0.0%) |
| 35 to 64 Years | 0 (0.0%) | 0 (0.0%) |
| 65 to 74 Years | 0 (0.0%) | 0 (0.0%) |
| 75 Years and over | 0 (0.0%) | 0 (0.0%) |
Disability Class: Vision Difficulty
| Age Bracket | Male | Female |
| Under 5 Years | 0 (0.0%) | 0 (0.0%) |
| 5 to 17 Years | 0 (0.0%) | 0 (0.0%) |
| 18 to 34 Years | 0 (0.0%) | 0 (0.0%) |
| 35 to 64 Years | 0 (0.0%) | 0 (0.0%) |
| 65 to 74 Years | 0 (0.0%) | 0 (0.0%) |
| 75 Years and over | 0 (0.0%) | 0 (0.0%) |
Disability Class: Cognitive Difficulty
| Age Bracket | Male | Female |
| 5 to 17 Years | 0 (0.0%) | 0 (0.0%) |
| 18 to 34 Years | 0 (0.0%) | 0 (0.0%) |
| 35 to 64 Years | 0 (0.0%) | 0 (0.0%) |
| 65 to 74 Years | 0 (0.0%) | 0 (0.0%) |
| 75 Years and over | 0 (0.0%) | 0 (0.0%) |
Disability Class: Ambulatory Difficulty
| Age Bracket | Male | Female |
| 5 to 17 Years | 0 (0.0%) | 0 (0.0%) |
| 18 to 34 Years | 0 (0.0%) | 0 (0.0%) |
| 35 to 64 Years | 0 (0.0%) | 7 (100.0%) |
| 65 to 74 Years | 0 (0.0%) | 0 (0.0%) |
| 75 Years and over | 0 (0.0%) | 14 (100.0%) |
Disability Class: Self-Care Difficulty
| Age Bracket | Male | Female |
| 5 to 17 Years | 0 (0.0%) | 0 (0.0%) |
| 18 to 34 Years | 0 (0.0%) | 0 (0.0%) |
| 35 to 64 Years | 0 (0.0%) | 0 (0.0%) |
| 65 to 74 Years | 0 (0.0%) | 0 (0.0%) |
| 75 Years and over | 0 (0.0%) | 0 (0.0%) |
Technology Access in Danville
Computing Device Access in Danville
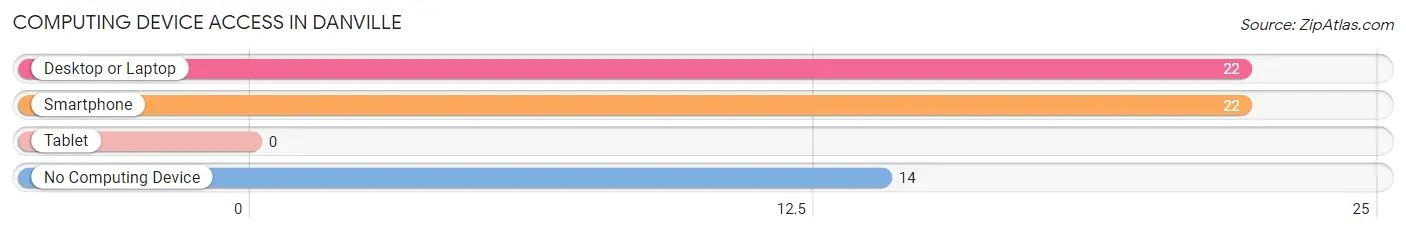
| Device Type | # Households | % Households |
| Desktop or Laptop | 22 | 61.1% |
| Smartphone | 22 | 61.1% |
| Tablet | 0 | 0.0% |
| No Computing Device | 14 | 38.9% |
| Total | 36 | 100.0% |
Internet Access in Danville
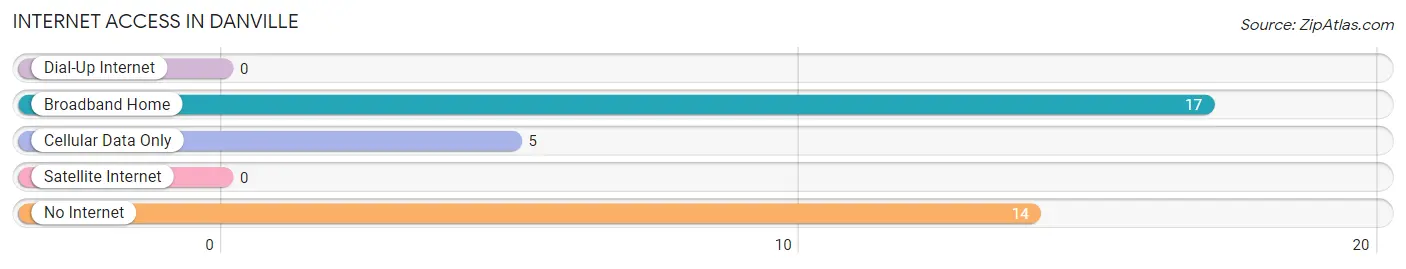
| Internet Type | # Households | % Households |
| Dial-Up Internet | 0 | 0.0% |
| Broadband Home | 17 | 47.2% |
| Cellular Data Only | 5 | 13.9% |
| Satellite Internet | 0 | 0.0% |
| No Internet | 14 | 38.9% |
| Total | 36 | 100.0% |
Danville Summary
Danville, Washington is a small town located in the northeastern corner of the state, near the Canadian border. It is situated in the Okanogan County, and is part of the Okanogan-Wenatchee National Forest. The town has a population of just over 500 people, and is a rural community with a strong agricultural base.
History
The area that is now Danville was first settled in the late 1800s by homesteaders. The town was officially founded in 1891, and was named after the nearby Dan River. The town was originally a logging and mining town, and the first post office was established in 1892.
In the early 1900s, the town began to grow and develop, and by the 1920s, it had become a thriving agricultural community. The town was home to several farms, and the local economy was largely based on the production of wheat, barley, and other grains.
In the 1950s, the town began to decline, as the local economy shifted away from agriculture and towards tourism. The town was largely forgotten until the 1980s, when it was rediscovered by tourists and outdoor enthusiasts.
Geography
Danville is located in the northeastern corner of Washington, near the Canadian border. It is situated in the Okanogan County, and is part of the Okanogan-Wenatchee National Forest. The town is located in a valley, surrounded by mountains and forests. The nearest major city is Spokane, which is about 100 miles away.
The climate in Danville is generally mild, with warm summers and cold winters. The average annual temperature is around 50 degrees Fahrenheit. The town receives an average of 20 inches of precipitation per year, with most of it falling in the winter months.
Economy
The economy of Danville is largely based on tourism and outdoor recreation. The town is home to several small businesses, including restaurants, shops, and lodging. The town is also home to several farms, which produce wheat, barley, and other grains.
The town is also home to several wineries, which produce a variety of wines. The town is also home to several outdoor recreation businesses, which offer activities such as fishing, hunting, and camping.
Demographics
As of the 2010 census, the population of Danville was 514 people. The racial makeup of the town was 94.3% White, 0.6% African American, 0.4% Native American, 0.2% Asian, 0.2% Pacific Islander, and 4.3% from other races. The median household income was $37,500, and the median age was 44.
Conclusion
Danville, Washington is a small town located in the northeastern corner of the state, near the Canadian border. It is situated in the Okanogan County, and is part of the Okanogan-Wenatchee National Forest. The town has a population of just over 500 people, and is a rural community with a strong agricultural base. The economy of Danville is largely based on tourism and outdoor recreation, and the town is home to several small businesses, farms, and wineries. The town is also home to several outdoor recreation businesses, which offer activities such as fishing, hunting, and camping.
Common Questions
What is Per Capita Income in Danville?
Per Capita income in Danville is $20,851.
What is Inequality or Gini Index in Danville?
Inequality or Gini Index in Danville is 0.41.
What is the Total Population of Danville?
Total Population of Danville is 82.
What is the Total Male Population of Danville?
Total Male Population of Danville is 15.
What is the Total Female Population of Danville?
Total Female Population of Danville is 67.
What is the Ratio of Males per 100 Females in Danville?
There are 22.39 Males per 100 Females in Danville.
What is the Ratio of Females per 100 Males in Danville?
There are 446.67 Females per 100 Males in Danville.
What is the Median Population Age in Danville?
Median Population Age in Danville is 20.8 Years.
What is the Average Family Size in Danville
Average Family Size in Danville is 3.7 People.
What is the Average Household Size in Danville
Average Household Size in Danville is 2.3 People.
How Large is the Labor Force in Danville?
There are 23 People in the Labor Forcein in Danville.
What is the Percentage of People in the Labor Force in Danville?
31.9% of People are in the Labor Force in Danville.