Torreon CDP Torrance County, NM Map & Demographics
Torreon CDP Torrance County Overview
$18,774
PER CAPITA INCOME
$38,060
AVG FAMILY INCOME
$38,060
AVG HOUSEHOLD INCOME
0.09
INEQUALITY / GINI INDEX
232
TOTAL POPULATION
103
MALE POPULATION
129
FEMALE POPULATION
79.84
MALES / 100 FEMALES
125.24
FEMALES / 100 MALES
35.5
MEDIAN AGE
2.2
AVG FAMILY SIZE
2.2
AVG HOUSEHOLD SIZE
102
LABOR FORCE [ PEOPLE ]
50.0%
PERCENT IN LABOR FORCE
Income in Torreon CDP Torrance County
Income Overview in Torreon CDP Torrance County
Per Capita Income in Torreon CDP Torrance County is $18,774, while median incomes of families and households are $38,060 and $38,060 respectively.
| Characteristic | Number | Measure |
| Per Capita Income | 232 | $18,774 |
| Median Family Income | 105 | $38,060 |
| Mean Family Income | 105 | $38,367 |
| Median Household Income | 105 | $38,060 |
| Mean Household Income | 105 | $38,367 |
| Income Deficit | 105 | $0 |
| Wage / Income Gap (%) | 232 | 0.00% |
| Wage / Income Gap ($) | 232 | 100.00¢ per $1 |
| Gini / Inequality Index | 232 | 0.09 |
Earnings by Sex in Torreon CDP Torrance County
| Sex | Number | Average Earnings |
| Male | 73 (71.6%) | $0 |
| Female | 29 (28.4%) | $0 |
| Total | 102 (100.0%) | $0 |
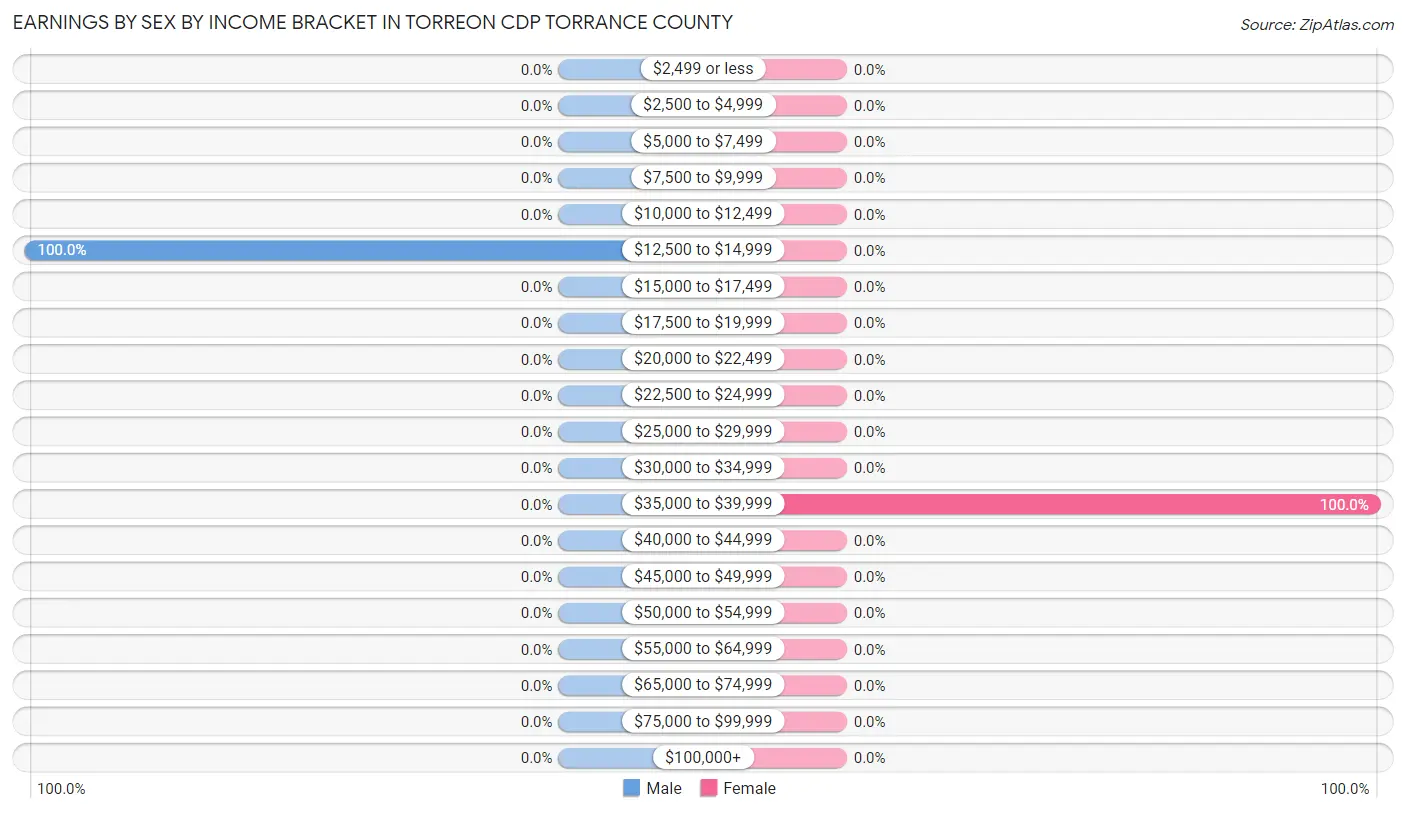
Earnings by Sex by Income Bracket in Torreon CDP Torrance County
The most common earnings brackets in Torreon CDP Torrance County are $12,500 to $14,999 for men (73 | 100.0%) and $35,000 to $39,999 for women (29 | 100.0%).
| Income | Male | Female |
| $2,499 or less | 0 (0.0%) | 0 (0.0%) |
| $2,500 to $4,999 | 0 (0.0%) | 0 (0.0%) |
| $5,000 to $7,499 | 0 (0.0%) | 0 (0.0%) |
| $7,500 to $9,999 | 0 (0.0%) | 0 (0.0%) |
| $10,000 to $12,499 | 0 (0.0%) | 0 (0.0%) |
| $12,500 to $14,999 | 73 (100.0%) | 0 (0.0%) |
| $15,000 to $17,499 | 0 (0.0%) | 0 (0.0%) |
| $17,500 to $19,999 | 0 (0.0%) | 0 (0.0%) |
| $20,000 to $22,499 | 0 (0.0%) | 0 (0.0%) |
| $22,500 to $24,999 | 0 (0.0%) | 0 (0.0%) |
| $25,000 to $29,999 | 0 (0.0%) | 0 (0.0%) |
| $30,000 to $34,999 | 0 (0.0%) | 0 (0.0%) |
| $35,000 to $39,999 | 0 (0.0%) | 29 (100.0%) |
| $40,000 to $44,999 | 0 (0.0%) | 0 (0.0%) |
| $45,000 to $49,999 | 0 (0.0%) | 0 (0.0%) |
| $50,000 to $54,999 | 0 (0.0%) | 0 (0.0%) |
| $55,000 to $64,999 | 0 (0.0%) | 0 (0.0%) |
| $65,000 to $74,999 | 0 (0.0%) | 0 (0.0%) |
| $75,000 to $99,999 | 0 (0.0%) | 0 (0.0%) |
| $100,000+ | 0 (0.0%) | 0 (0.0%) |
| Total | 73 (100.0%) | 29 (100.0%) |
Earnings by Sex by Educational Attainment in Torreon CDP Torrance County
| Educational Attainment | Male Income | Female Income |
| Less than High School | - | - |
| High School Diploma | - | - |
| College or Associate's Degree | - | - |
| Bachelor's Degree | - | - |
| Graduate Degree | - | - |
| Total | - | - |
Family Income in Torreon CDP Torrance County
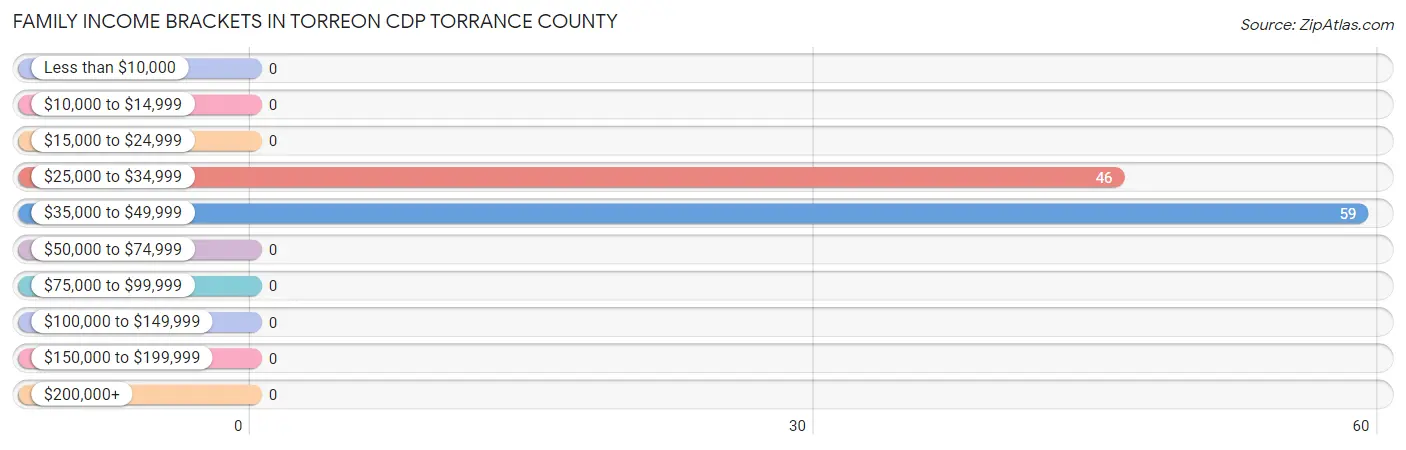
Family Income Brackets in Torreon CDP Torrance County
According to the Torreon CDP Torrance County family income data, there are 59 families falling into the $35,000 to $49,999 income range, which is the most common income bracket and makes up 56.2% of all families.
| Income Bracket | # Families | % Families |
| Less than $10,000 | 0 | 0.0% |
| $10,000 to $14,999 | 0 | 0.0% |
| $15,000 to $24,999 | 0 | 0.0% |
| $25,000 to $34,999 | 46 | 43.8% |
| $35,000 to $49,999 | 59 | 56.2% |
| $50,000 to $74,999 | 0 | 0.0% |
| $75,000 to $99,999 | 0 | 0.0% |
| $100,000 to $149,999 | 0 | 0.0% |
| $150,000 to $199,999 | 0 | 0.0% |
| $200,000+ | 0 | 0.0% |
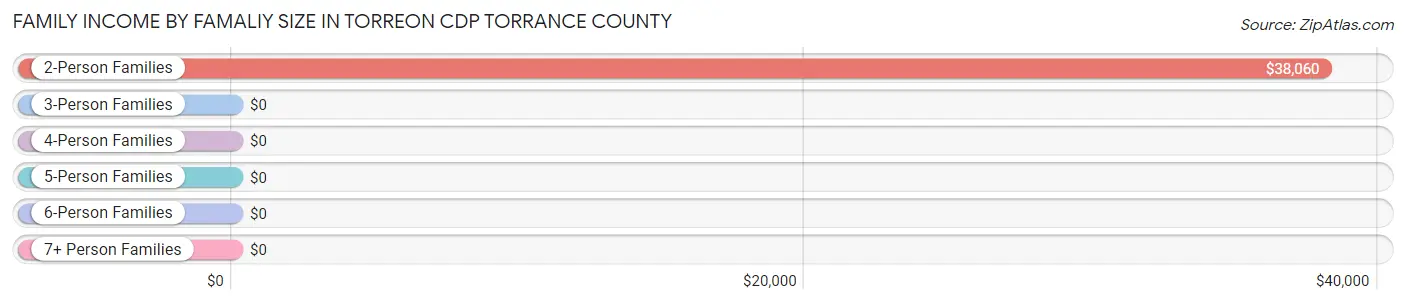
Family Income by Famaliy Size in Torreon CDP Torrance County
2-person families (105 | 100.0%) account for the highest median family income in Torreon CDP Torrance County with $38,060 per family, while 2-person families (105 | 100.0%) have the highest median income of $19,030 per family member.
| Income Bracket | # Families | Median Income |
| 2-Person Families | 105 (100.0%) | $38,060 |
| 3-Person Families | 0 (0.0%) | $0 |
| 4-Person Families | 0 (0.0%) | $0 |
| 5-Person Families | 0 (0.0%) | $0 |
| 6-Person Families | 0 (0.0%) | $0 |
| 7+ Person Families | 0 (0.0%) | $0 |
| Total | 105 (100.0%) | $38,060 |
Family Income by Number of Earners in Torreon CDP Torrance County
| Number of Earners | # Families | Median Income |
| No Earners | 30 (28.6%) | $0 |
| 1 Earner | 75 (71.4%) | $0 |
| 2 Earners | 0 (0.0%) | $0 |
| 3+ Earners | 0 (0.0%) | $0 |
| Total | 105 (100.0%) | $38,060 |
Household Income in Torreon CDP Torrance County
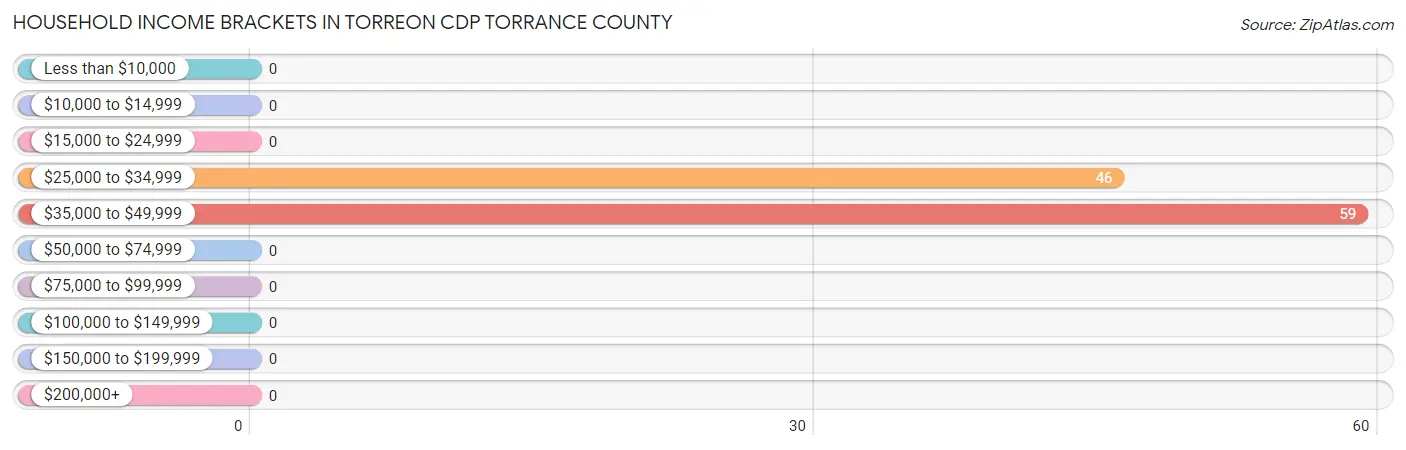
Household Income Brackets in Torreon CDP Torrance County
With 59 households falling in the category, the $35,000 to $49,999 income range is the most frequent in Torreon CDP Torrance County, accounting for 56.2% of all households.
| Income Bracket | # Households | % Households |
| Less than $10,000 | 0 | 0.0% |
| $10,000 to $14,999 | 0 | 0.0% |
| $15,000 to $24,999 | 0 | 0.0% |
| $25,000 to $34,999 | 46 | 43.8% |
| $35,000 to $49,999 | 59 | 56.2% |
| $50,000 to $74,999 | 0 | 0.0% |
| $75,000 to $99,999 | 0 | 0.0% |
| $100,000 to $149,999 | 0 | 0.0% |
| $150,000 to $199,999 | 0 | 0.0% |
| $200,000+ | 0 | 0.0% |
Household Income by Householder Age in Torreon CDP Torrance County
| Income Bracket | # Households | Median Income |
| 15 to 24 Years | 0 (0.0%) | $0 |
| 25 to 44 Years | 29 (27.6%) | $0 |
| 45 to 64 Years | 46 (43.8%) | $0 |
| 65+ Years | 30 (28.6%) | $0 |
| Total | 105 (100.0%) | $38,060 |
Poverty in Torreon CDP Torrance County
Income Below Poverty by Sex and Age in Torreon CDP Torrance County
| Age Bracket | Male | Female |
| Under 5 Years | 0 (0.0%) | 0 (0.0%) |
| 5 Years | 0 (0.0%) | 0 (0.0%) |
| 6 to 11 Years | 0 (0.0%) | 0 (0.0%) |
| 12 to 14 Years | 0 (0.0%) | 0 (0.0%) |
| 15 Years | 0 (0.0%) | 0 (0.0%) |
| 16 and 17 Years | 0 (0.0%) | 0 (0.0%) |
| 18 to 24 Years | 0 (0.0%) | 0 (0.0%) |
| 25 to 34 Years | 0 (0.0%) | 0 (0.0%) |
| 35 to 44 Years | 0 (0.0%) | 0 (0.0%) |
| 45 to 54 Years | 0 (0.0%) | 0 (0.0%) |
| 55 to 64 Years | 0 (0.0%) | 0 (0.0%) |
| 65 to 74 Years | 0 (0.0%) | 0 (0.0%) |
| 75 Years and over | 0 (0.0%) | 0 (0.0%) |
| Total | 0 (0.0%) | 0 (0.0%) |
Income Above Poverty by Sex and Age in Torreon CDP Torrance County
According to the poverty statistics in Torreon CDP Torrance County, males aged 25 to 34 years and females aged under 5 years are the age groups that are most secure financially, with 100.0% of males and 100.0% of females in these age groups living above the poverty line.
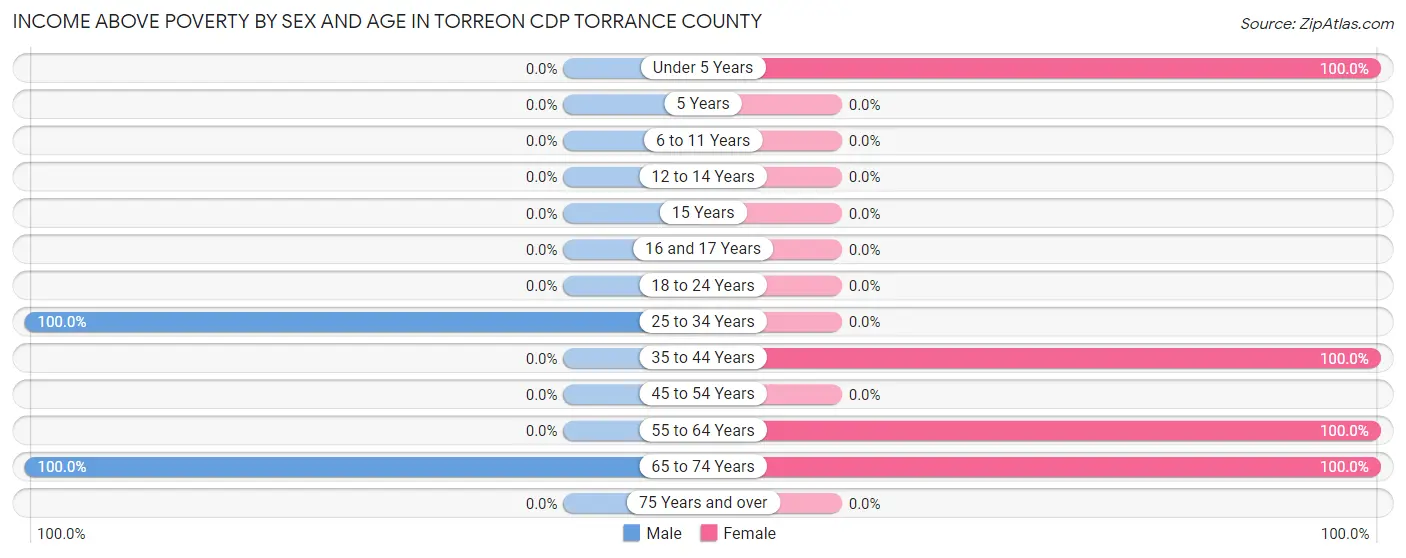
| Age Bracket | Male | Female |
| Under 5 Years | 0 (0.0%) | 28 (100.0%) |
| 5 Years | 0 (0.0%) | 0 (0.0%) |
| 6 to 11 Years | 0 (0.0%) | 0 (0.0%) |
| 12 to 14 Years | 0 (0.0%) | 0 (0.0%) |
| 15 Years | 0 (0.0%) | 0 (0.0%) |
| 16 and 17 Years | 0 (0.0%) | 0 (0.0%) |
| 18 to 24 Years | 0 (0.0%) | 0 (0.0%) |
| 25 to 34 Years | 73 (100.0%) | 0 (0.0%) |
| 35 to 44 Years | 0 (0.0%) | 29 (100.0%) |
| 45 to 54 Years | 0 (0.0%) | 0 (0.0%) |
| 55 to 64 Years | 0 (0.0%) | 46 (100.0%) |
| 65 to 74 Years | 30 (100.0%) | 26 (100.0%) |
| 75 Years and over | 0 (0.0%) | 0 (0.0%) |
| Total | 103 (100.0%) | 129 (100.0%) |
Income Below Poverty Among Married-Couple Families in Torreon CDP Torrance County
| Children | Above Poverty | Below Poverty |
| No Children | 30 (100.0%) | 0 (0.0%) |
| 1 or 2 Children | 0 (0.0%) | 0 (0.0%) |
| 3 or 4 Children | 0 (0.0%) | 0 (0.0%) |
| 5 or more Children | 0 (0.0%) | 0 (0.0%) |
| Total | 30 (100.0%) | 0 (0.0%) |
Income Below Poverty Among Single-Parent Households in Torreon CDP Torrance County
| Children | Single Father | Single Mother |
| No Children | 0 (0.0%) | 0 (0.0%) |
| 1 or 2 Children | 0 (0.0%) | 0 (0.0%) |
| 3 or 4 Children | 0 (0.0%) | 0 (0.0%) |
| 5 or more Children | 0 (0.0%) | 0 (0.0%) |
| Total | 0 (0.0%) | 0 (0.0%) |
Income Below Poverty Among Married-Couple vs Single-Parent Households in Torreon CDP Torrance County
| Children | Married-Couple Families | Single-Parent Households |
| No Children | 0 (0.0%) | 0 (0.0%) |
| 1 or 2 Children | 0 (0.0%) | 0 (0.0%) |
| 3 or 4 Children | 0 (0.0%) | 0 (0.0%) |
| 5 or more Children | 0 (0.0%) | 0 (0.0%) |
| Total | 0 (0.0%) | 0 (0.0%) |
Race in Torreon CDP Torrance County
The most populous races in Torreon CDP Torrance County are White / Caucasian (232 | 100.0%), and Hispanic or Latino (119 | 51.3%).
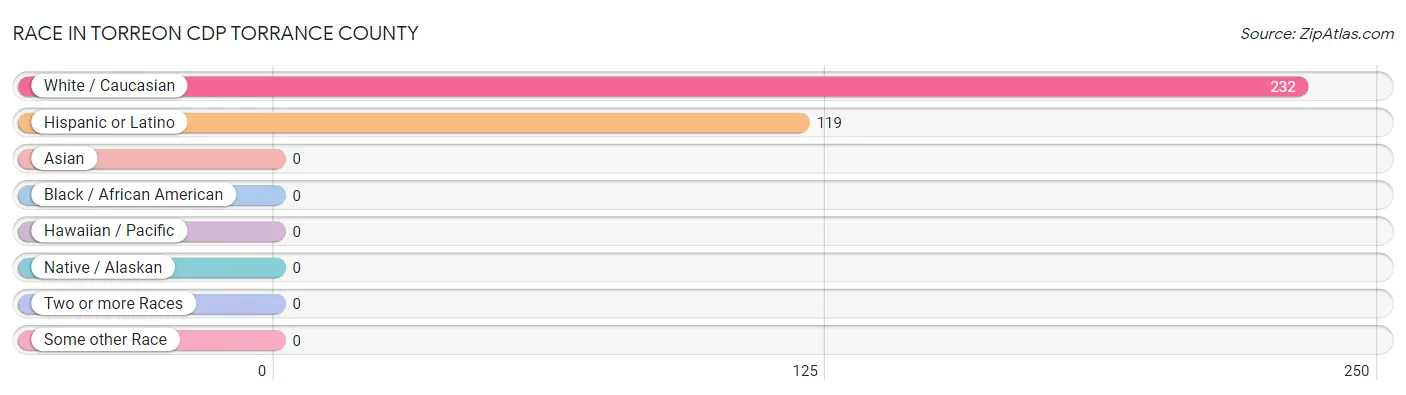
| Race | # Population | % Population |
| Asian | 0 | 0.0% |
| Black / African American | 0 | 0.0% |
| Hawaiian / Pacific | 0 | 0.0% |
| Hispanic or Latino | 119 | 51.3% |
| Native / Alaskan | 0 | 0.0% |
| White / Caucasian | 232 | 100.0% |
| Two or more Races | 0 | 0.0% |
| Some other Race | 0 | 0.0% |
| Total | 232 | 100.0% |
Ancestry in Torreon CDP Torrance County
The most populous ancestries reported in Torreon CDP Torrance County are , and American (26 | 11.2%), together accounting for 11.2% of all Torreon CDP Torrance County residents.

| Ancestry | # Population | % Population |
| American | 26 | 11.2% | View All 1 Rows |
Immigrants in Torreon CDP Torrance County

| Immigration Origin | # Population | % Population | View All 0 Rows |
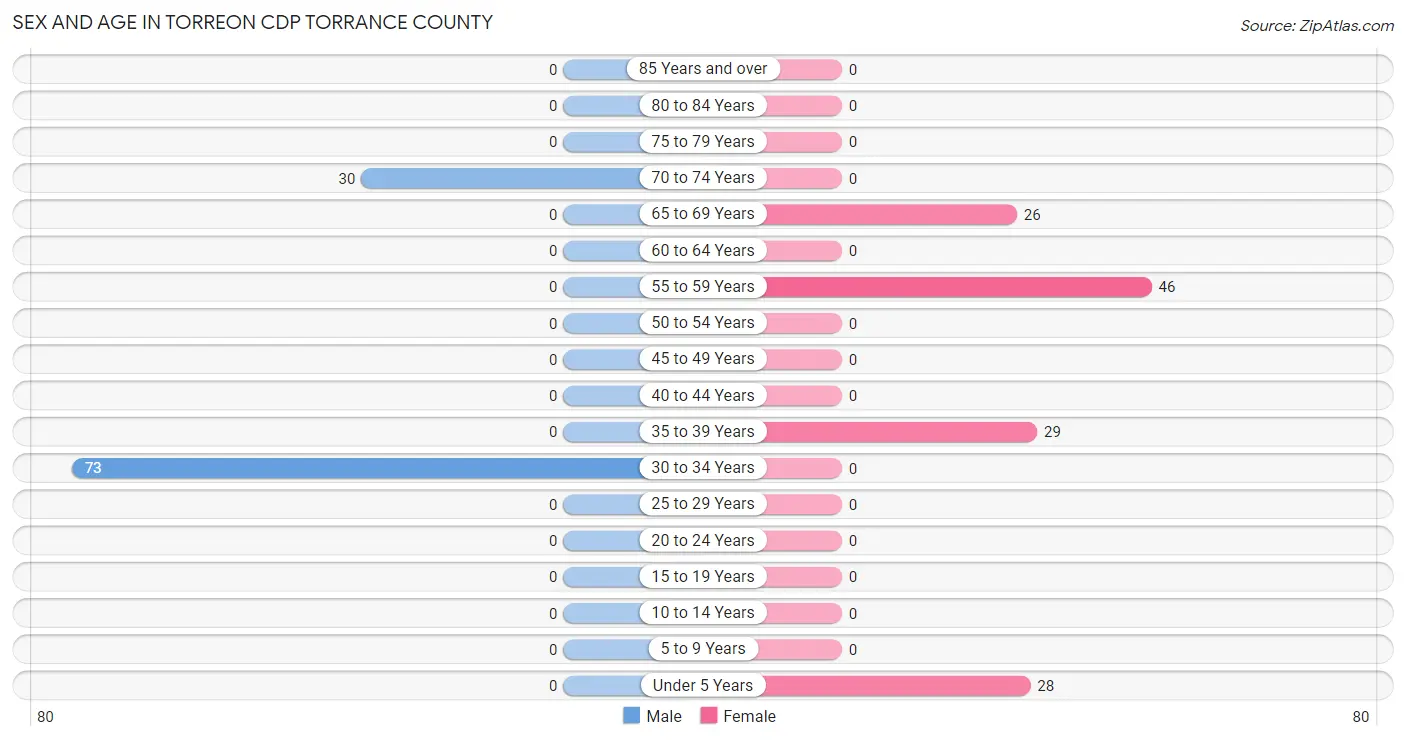
Sex and Age in Torreon CDP Torrance County
Sex and Age in Torreon CDP Torrance County
The most populous age groups in Torreon CDP Torrance County are 30 to 34 Years (73 | 70.9%) for men and 55 to 59 Years (46 | 35.7%) for women.
| Age Bracket | Male | Female |
| Under 5 Years | 0 (0.0%) | 28 (21.7%) |
| 5 to 9 Years | 0 (0.0%) | 0 (0.0%) |
| 10 to 14 Years | 0 (0.0%) | 0 (0.0%) |
| 15 to 19 Years | 0 (0.0%) | 0 (0.0%) |
| 20 to 24 Years | 0 (0.0%) | 0 (0.0%) |
| 25 to 29 Years | 0 (0.0%) | 0 (0.0%) |
| 30 to 34 Years | 73 (70.9%) | 0 (0.0%) |
| 35 to 39 Years | 0 (0.0%) | 29 (22.5%) |
| 40 to 44 Years | 0 (0.0%) | 0 (0.0%) |
| 45 to 49 Years | 0 (0.0%) | 0 (0.0%) |
| 50 to 54 Years | 0 (0.0%) | 0 (0.0%) |
| 55 to 59 Years | 0 (0.0%) | 46 (35.7%) |
| 60 to 64 Years | 0 (0.0%) | 0 (0.0%) |
| 65 to 69 Years | 0 (0.0%) | 26 (20.2%) |
| 70 to 74 Years | 30 (29.1%) | 0 (0.0%) |
| 75 to 79 Years | 0 (0.0%) | 0 (0.0%) |
| 80 to 84 Years | 0 (0.0%) | 0 (0.0%) |
| 85 Years and over | 0 (0.0%) | 0 (0.0%) |
| Total | 103 (100.0%) | 129 (100.0%) |
Families and Households in Torreon CDP Torrance County
Median Family Size in Torreon CDP Torrance County
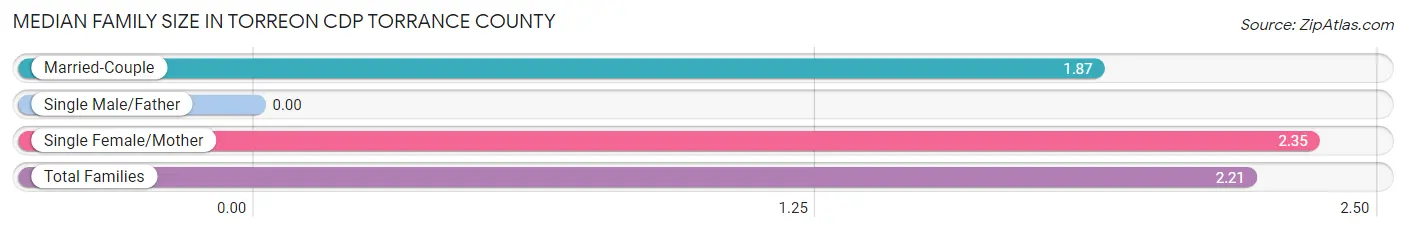
| Family Type | # Families | Family Size |
| Married-Couple | 30 (28.6%) | 1.87 |
| Single Male/Father | 0 (0.0%) | - |
| Single Female/Mother | 75 (71.4%) | 2.35 |
| Total Families | 105 (100.0%) | 2.21 |
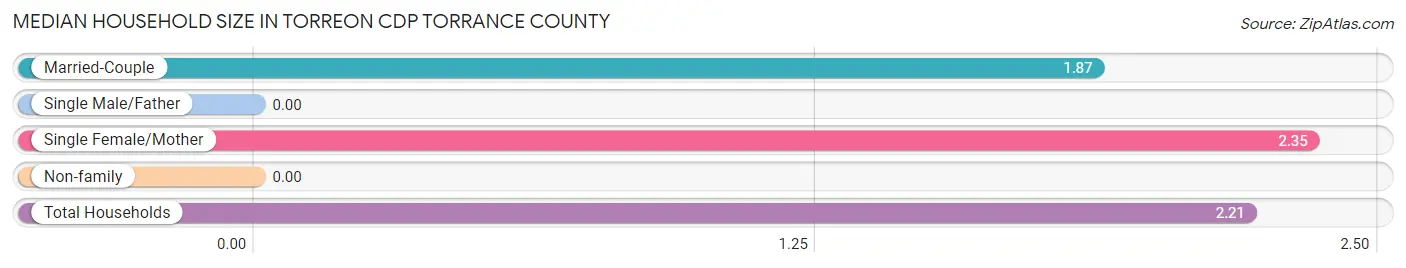
Median Household Size in Torreon CDP Torrance County
| Household Type | # Households | Household Size |
| Married-Couple | 30 (28.6%) | 1.87 |
| Single Male/Father | 0 (0.0%) | - |
| Single Female/Mother | 75 (71.4%) | 2.35 |
| Non-family | 0 (0.0%) | - |
| Total Households | 105 (100.0%) | 2.21 |
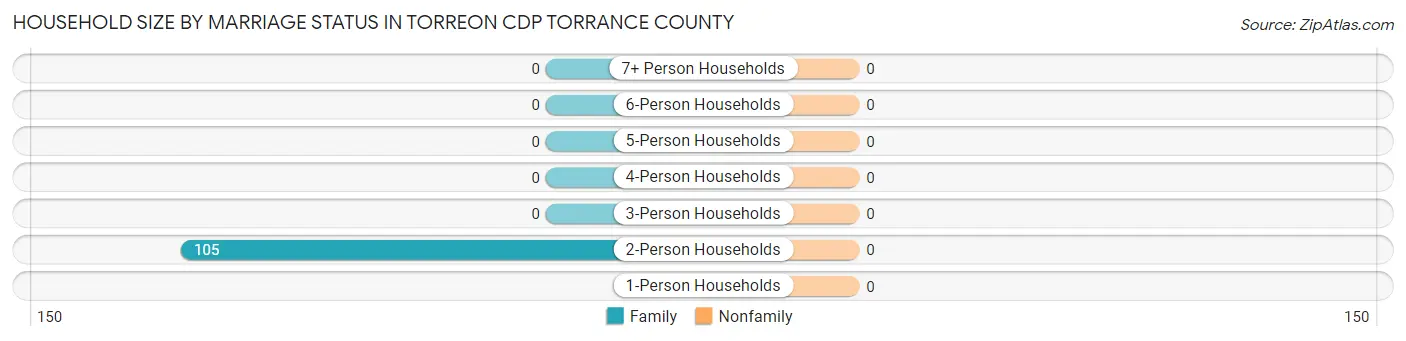
Household Size by Marriage Status in Torreon CDP Torrance County
| Household Size | Family Households | Nonfamily Households |
| 1-Person Households | - | 0 (0.0%) |
| 2-Person Households | 105 (100.0%) | 0 (0.0%) |
| 3-Person Households | 0 (0.0%) | 0 (0.0%) |
| 4-Person Households | 0 (0.0%) | 0 (0.0%) |
| 5-Person Households | 0 (0.0%) | 0 (0.0%) |
| 6-Person Households | 0 (0.0%) | 0 (0.0%) |
| 7+ Person Households | 0 (0.0%) | 0 (0.0%) |
| Total | 105 (100.0%) | 0 (0.0%) |
Female Fertility in Torreon CDP Torrance County
Fertility by Age in Torreon CDP Torrance County
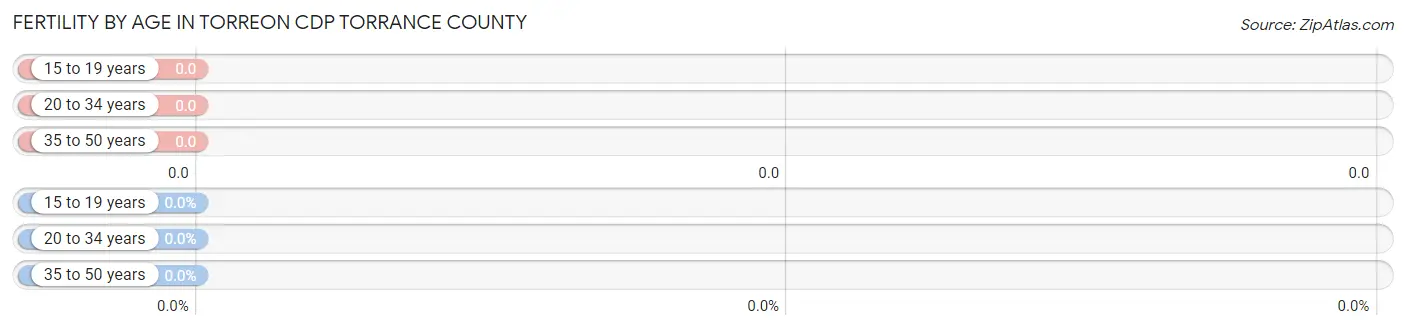
| Age Bracket | Women with Births | Births / 1,000 Women |
| 15 to 19 years | 0 (0.0%) | 0.0 |
| 20 to 34 years | 0 (0.0%) | 0.0 |
| 35 to 50 years | 0 (0.0%) | 0.0 |
| Total | 0 (0.0%) | 0.0 |
Fertility by Age by Marriage Status in Torreon CDP Torrance County
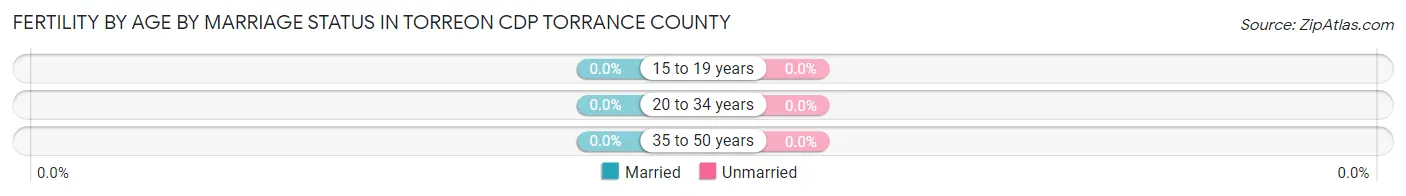
| Age Bracket | Married | Unmarried |
| 15 to 19 years | 0 (0.0%) | 0 (0.0%) |
| 20 to 34 years | 0 (0.0%) | 0 (0.0%) |
| 35 to 50 years | 0 (0.0%) | 0 (0.0%) |
| Total | 0 (0.0%) | 0 (0.0%) |
Fertility by Education in Torreon CDP Torrance County
| Educational Attainment | Women with Births | Births / 1,000 Women |
| Less than High School | 0 (0.0%) | 0.0 |
| High School Diploma | 0 (0.0%) | 0.0 |
| College or Associate's Degree | 0 (0.0%) | 0.0 |
| Bachelor's Degree | 0 (0.0%) | 0.0 |
| Graduate Degree | 0 (0.0%) | 0.0 |
| Total | 0 (0.0%) | 0.0 |
Fertility by Education by Marriage Status in Torreon CDP Torrance County
| Educational Attainment | Married | Unmarried |
| Less than High School | 0 (0.0%) | 0 (0.0%) |
| High School Diploma | 0 (0.0%) | 0 (0.0%) |
| College or Associate's Degree | 0 (0.0%) | 0 (0.0%) |
| Bachelor's Degree | 0 (0.0%) | 0 (0.0%) |
| Graduate Degree | 0 (0.0%) | 0 (0.0%) |
| Total | 0 (0.0%) | 0 (0.0%) |
Employment Characteristics in Torreon CDP Torrance County
Employment by Class of Employer in Torreon CDP Torrance County
Among the 102 employed individuals in Torreon CDP Torrance County, state government employees (73 | 71.6%), and not-for-profit organizations (29 | 28.4%) make up the most common classes of employment.
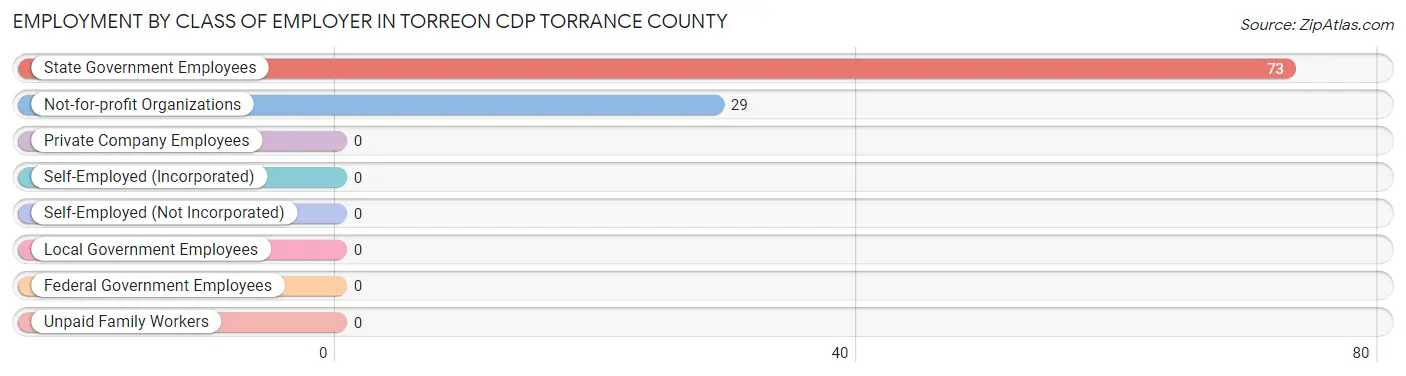
| Employer Class | # Employees | % Employees |
| Private Company Employees | 0 | 0.0% |
| Self-Employed (Incorporated) | 0 | 0.0% |
| Self-Employed (Not Incorporated) | 0 | 0.0% |
| Not-for-profit Organizations | 29 | 28.4% |
| Local Government Employees | 0 | 0.0% |
| State Government Employees | 73 | 71.6% |
| Federal Government Employees | 0 | 0.0% |
| Unpaid Family Workers | 0 | 0.0% |
| Total | 102 | 100.0% |
Employment Status by Age in Torreon CDP Torrance County
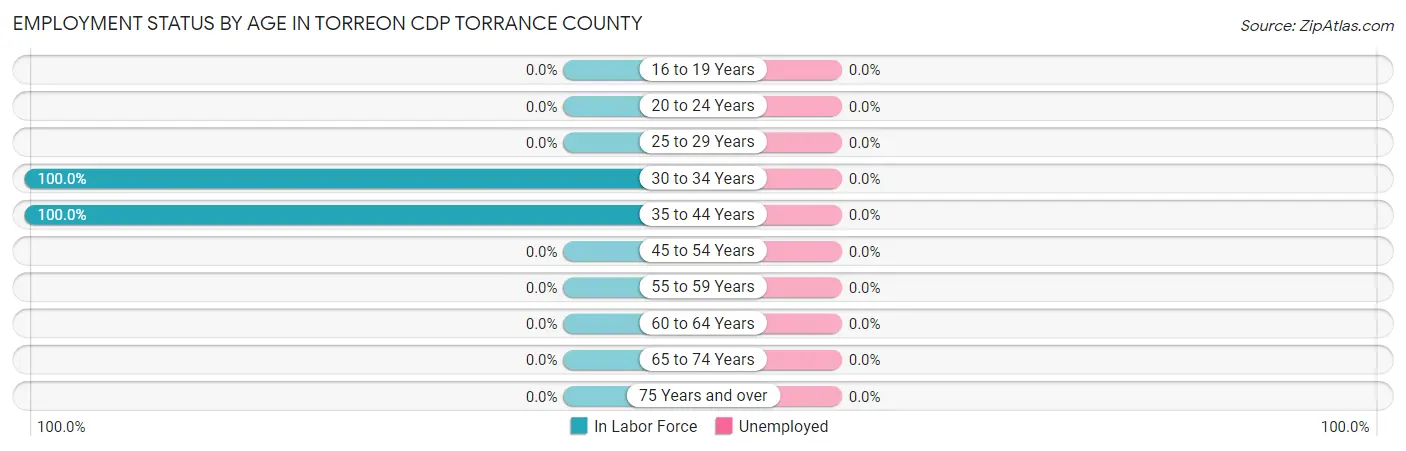
| Age Bracket | In Labor Force | Unemployed |
| 16 to 19 Years | 0 (0.0%) | 0 (0.0%) |
| 20 to 24 Years | 0 (0.0%) | 0 (0.0%) |
| 25 to 29 Years | 0 (0.0%) | 0 (0.0%) |
| 30 to 34 Years | 73 (100.0%) | 0 (0.0%) |
| 35 to 44 Years | 29 (100.0%) | 0 (0.0%) |
| 45 to 54 Years | 0 (0.0%) | 0 (0.0%) |
| 55 to 59 Years | 0 (0.0%) | 0 (0.0%) |
| 60 to 64 Years | 0 (0.0%) | 0 (0.0%) |
| 65 to 74 Years | 0 (0.0%) | 0 (0.0%) |
| 75 Years and over | 0 (0.0%) | 0 (0.0%) |
| Total | 102 (50.0%) | 0 (0.0%) |
Employment Status by Educational Attainment in Torreon CDP Torrance County
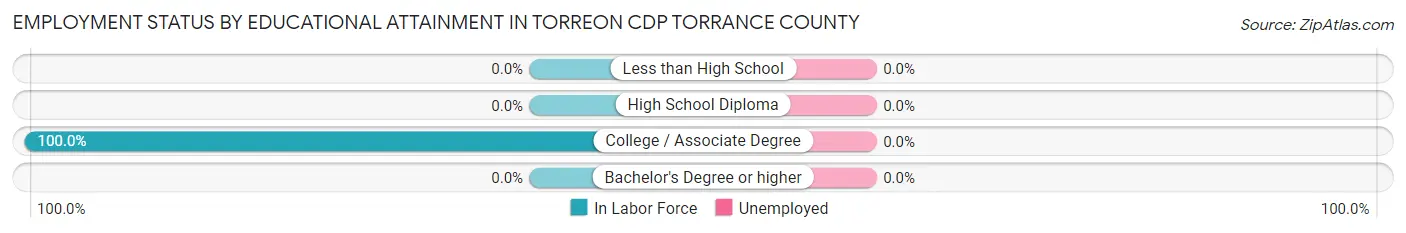
| Educational Attainment | In Labor Force | Unemployed |
| Less than High School | 0 (0.0%) | 0 (0.0%) |
| High School Diploma | 0 (0.0%) | 0 (0.0%) |
| College / Associate Degree | 102 (100.0%) | 0 (0.0%) |
| Bachelor's Degree or higher | 0 (0.0%) | 0 (0.0%) |
| Total | 102 (68.9%) | 0 (0.0%) |
Employment Occupations by Sex in Torreon CDP Torrance County
Management, Business, Science and Arts Occupations
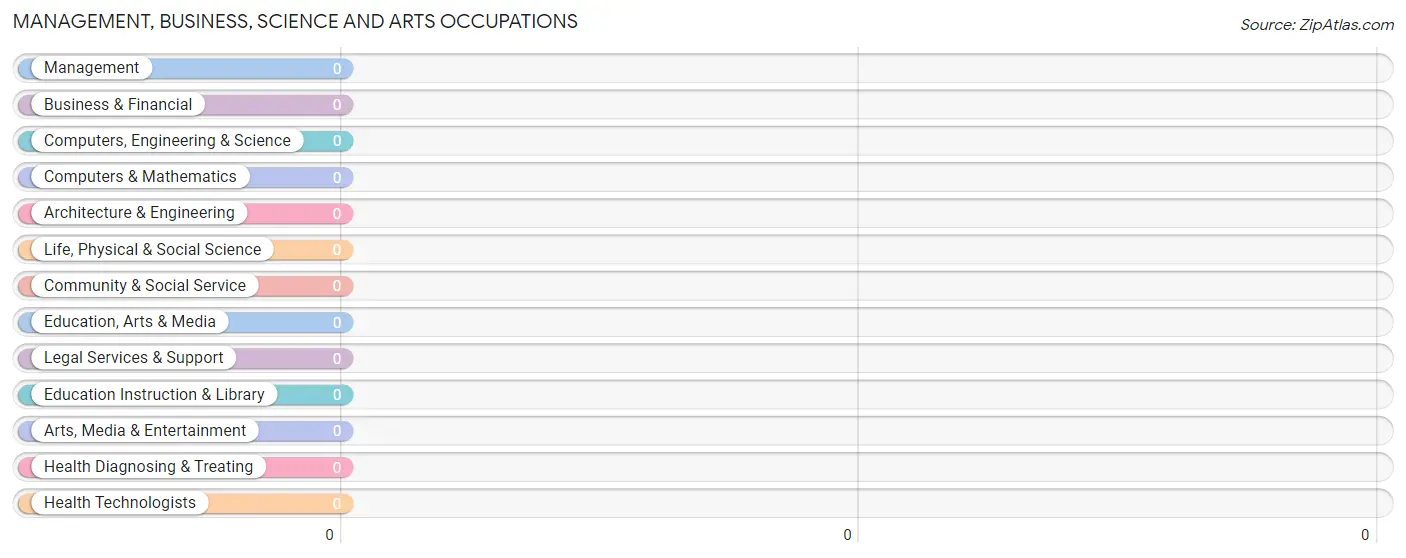
Management, Business, Science and Arts Occupations by Sex
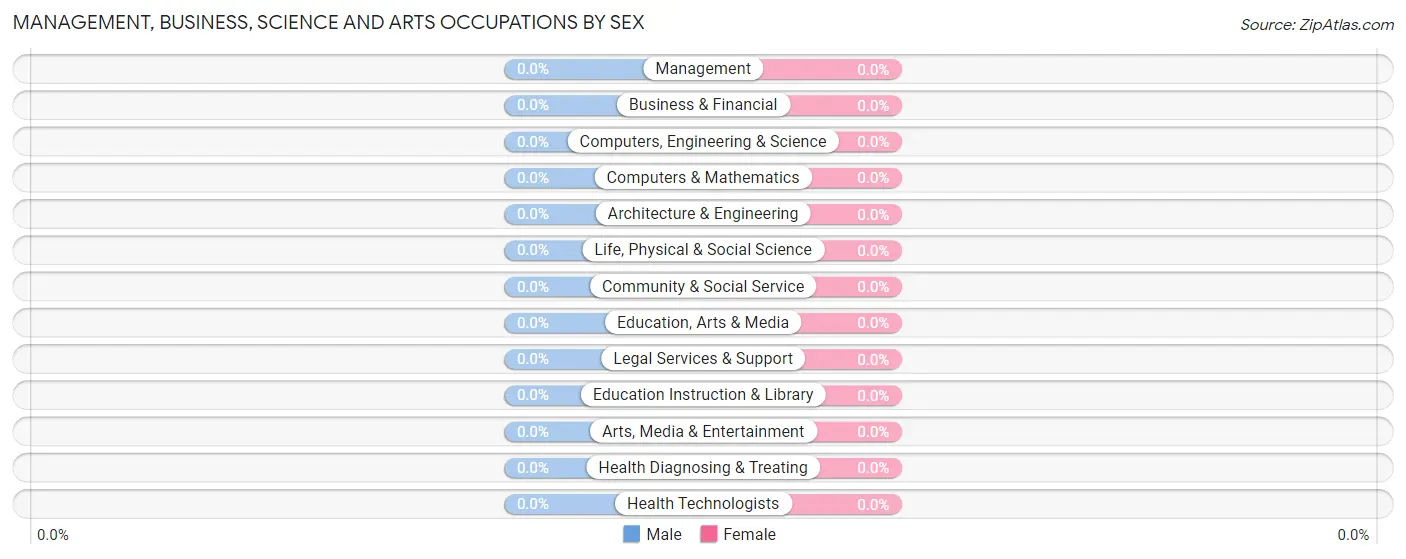
| Occupation | Male | Female |
| Management | 0 (0.0%) | 0 (0.0%) |
| Business & Financial | 0 (0.0%) | 0 (0.0%) |
| Computers, Engineering & Science | 0 (0.0%) | 0 (0.0%) |
| Computers & Mathematics | 0 (0.0%) | 0 (0.0%) |
| Architecture & Engineering | 0 (0.0%) | 0 (0.0%) |
| Life, Physical & Social Science | 0 (0.0%) | 0 (0.0%) |
| Community & Social Service | 0 (0.0%) | 0 (0.0%) |
| Education, Arts & Media | 0 (0.0%) | 0 (0.0%) |
| Legal Services & Support | 0 (0.0%) | 0 (0.0%) |
| Education Instruction & Library | 0 (0.0%) | 0 (0.0%) |
| Arts, Media & Entertainment | 0 (0.0%) | 0 (0.0%) |
| Health Diagnosing & Treating | 0 (0.0%) | 0 (0.0%) |
| Health Technologists | 0 (0.0%) | 0 (0.0%) |
| Total (Category) | 0 (0.0%) | 0 (0.0%) |
| Total (Overall) | 73 (71.6%) | 29 (28.4%) |
Services Occupations
The most common Services occupations in Torreon CDP Torrance County are , and Healthcare Support (29 | 28.4%).
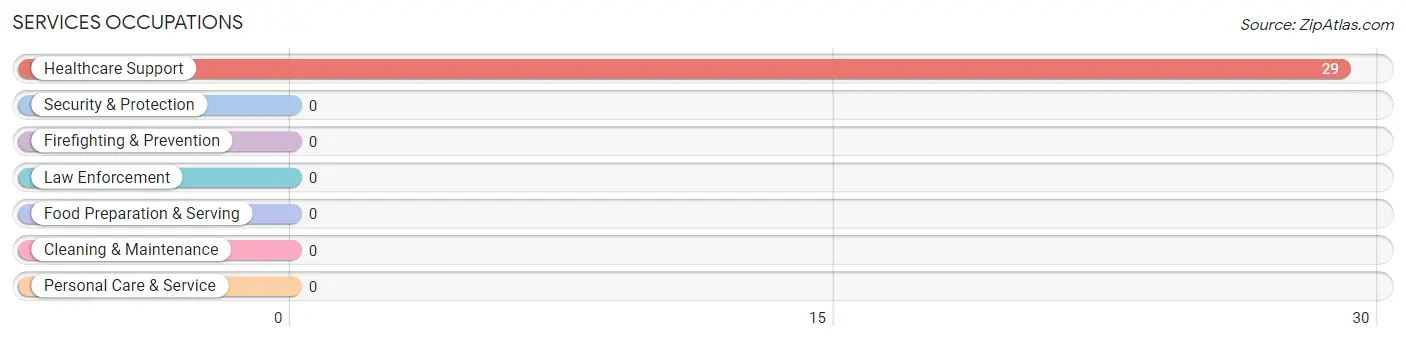
Services Occupations by Sex
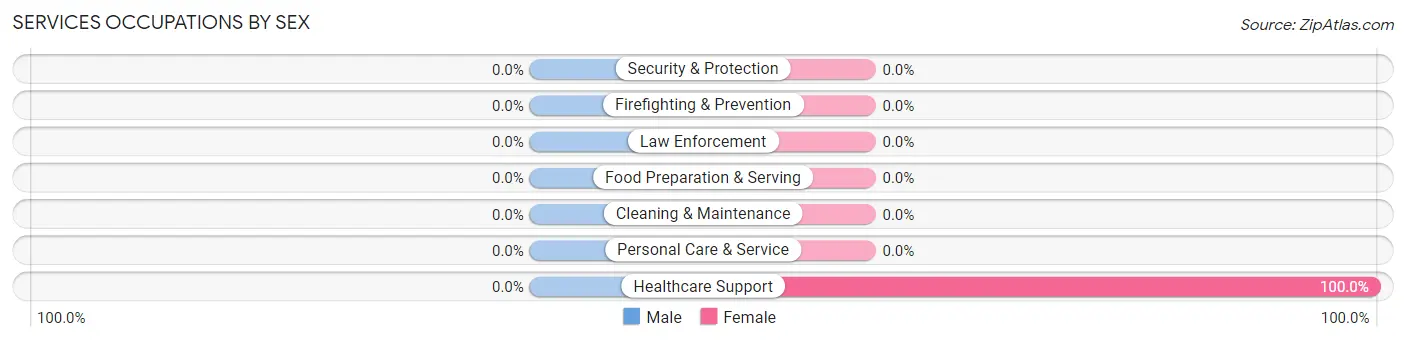
| Occupation | Male | Female |
| Healthcare Support | 0 (0.0%) | 29 (100.0%) |
| Security & Protection | 0 (0.0%) | 0 (0.0%) |
| Firefighting & Prevention | 0 (0.0%) | 0 (0.0%) |
| Law Enforcement | 0 (0.0%) | 0 (0.0%) |
| Food Preparation & Serving | 0 (0.0%) | 0 (0.0%) |
| Cleaning & Maintenance | 0 (0.0%) | 0 (0.0%) |
| Personal Care & Service | 0 (0.0%) | 0 (0.0%) |
| Total (Category) | 0 (0.0%) | 29 (100.0%) |
| Total (Overall) | 73 (71.6%) | 29 (28.4%) |
Sales and Office Occupations
Sales and Office Occupations by Sex
| Occupation | Male | Female |
| Sales & Related | 0 (0.0%) | 0 (0.0%) |
| Office & Administration | 0 (0.0%) | 0 (0.0%) |
| Total (Category) | 0 (0.0%) | 0 (0.0%) |
| Total (Overall) | 73 (71.6%) | 29 (28.4%) |
Natural Resources, Construction and Maintenance Occupations
Natural Resources, Construction and Maintenance Occupations by Sex
| Occupation | Male | Female |
| Farming, Fishing & Forestry | 0 (0.0%) | 0 (0.0%) |
| Construction & Extraction | 0 (0.0%) | 0 (0.0%) |
| Installation, Maintenance & Repair | 0 (0.0%) | 0 (0.0%) |
| Total (Category) | 0 (0.0%) | 0 (0.0%) |
| Total (Overall) | 73 (71.6%) | 29 (28.4%) |
Production, Transportation and Moving Occupations
The most common Production, Transportation and Moving occupations in Torreon CDP Torrance County are , and Transportation (73 | 71.6%).
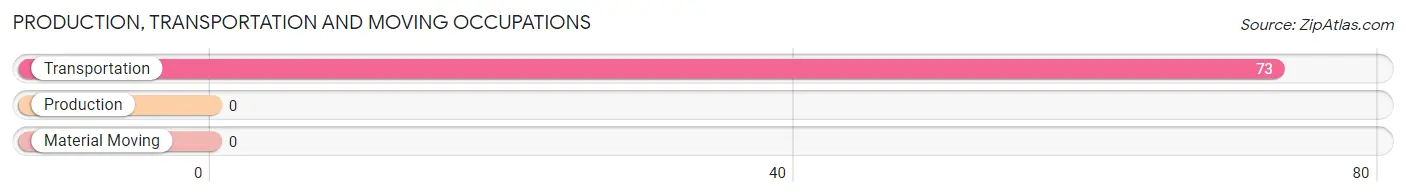
Production, Transportation and Moving Occupations by Sex
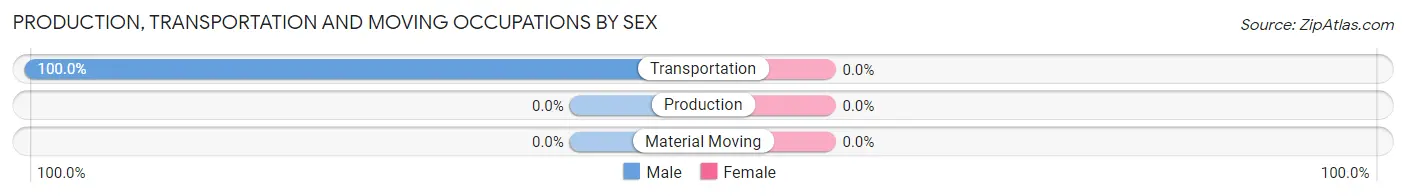
| Occupation | Male | Female |
| Production | 0 (0.0%) | 0 (0.0%) |
| Transportation | 73 (100.0%) | 0 (0.0%) |
| Material Moving | 0 (0.0%) | 0 (0.0%) |
| Total (Category) | 73 (100.0%) | 0 (0.0%) |
| Total (Overall) | 73 (71.6%) | 29 (28.4%) |
Employment Industries by Sex in Torreon CDP Torrance County
Employment Industries in Torreon CDP Torrance County
The major employment industries in Torreon CDP Torrance County include Construction (73 | 71.6%), and Health Care & Social Assistance (29 | 28.4%).
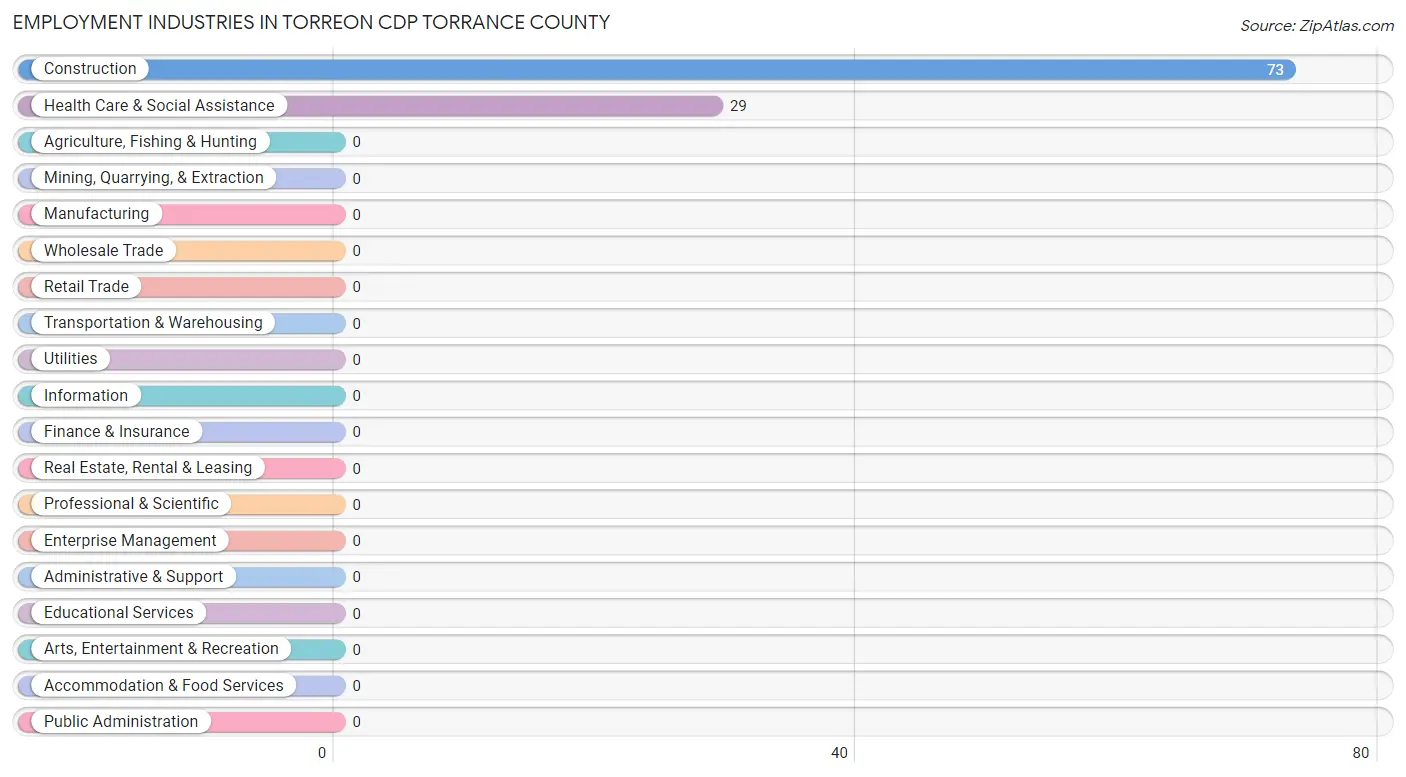
Employment Industries by Sex in Torreon CDP Torrance County
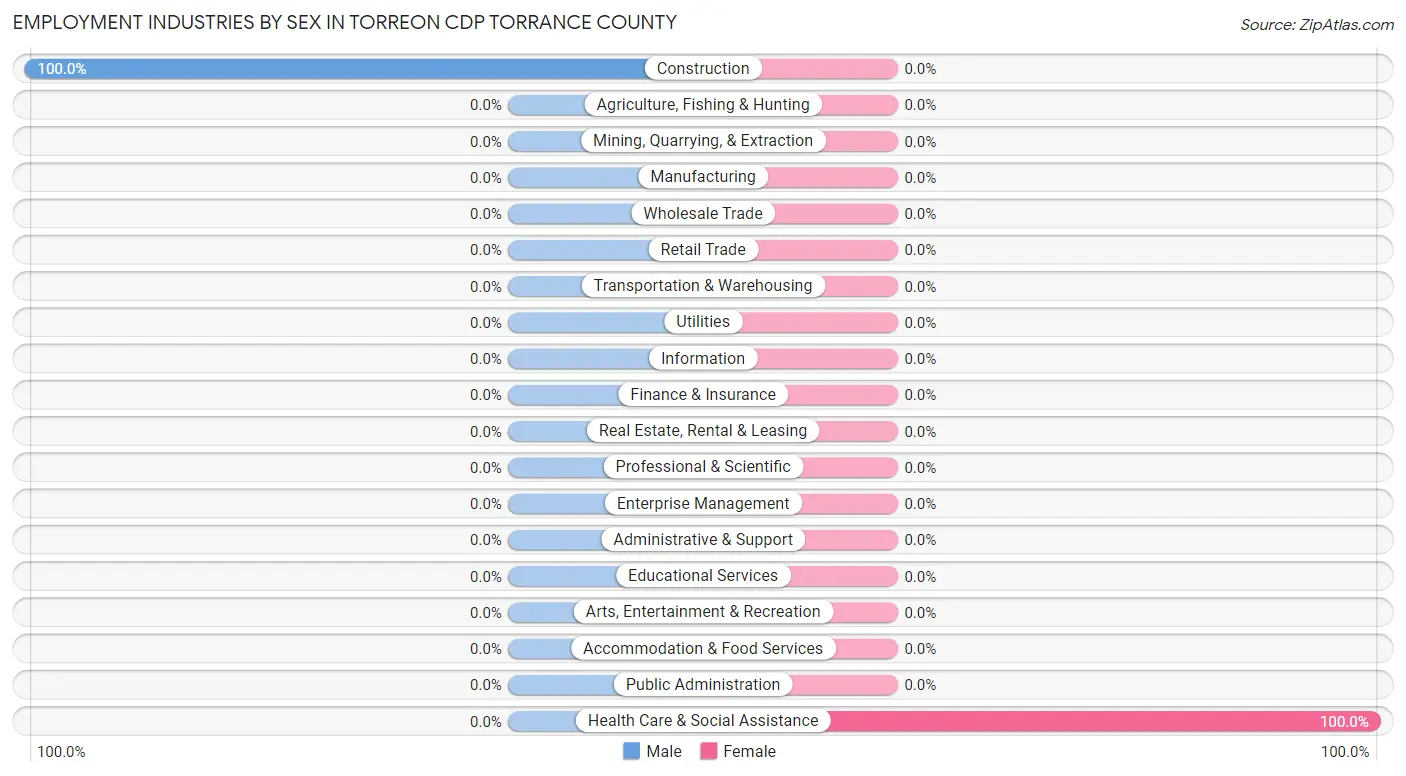
| Industry | Male | Female |
| Agriculture, Fishing & Hunting | 0 (0.0%) | 0 (0.0%) |
| Mining, Quarrying, & Extraction | 0 (0.0%) | 0 (0.0%) |
| Construction | 73 (100.0%) | 0 (0.0%) |
| Manufacturing | 0 (0.0%) | 0 (0.0%) |
| Wholesale Trade | 0 (0.0%) | 0 (0.0%) |
| Retail Trade | 0 (0.0%) | 0 (0.0%) |
| Transportation & Warehousing | 0 (0.0%) | 0 (0.0%) |
| Utilities | 0 (0.0%) | 0 (0.0%) |
| Information | 0 (0.0%) | 0 (0.0%) |
| Finance & Insurance | 0 (0.0%) | 0 (0.0%) |
| Real Estate, Rental & Leasing | 0 (0.0%) | 0 (0.0%) |
| Professional & Scientific | 0 (0.0%) | 0 (0.0%) |
| Enterprise Management | 0 (0.0%) | 0 (0.0%) |
| Administrative & Support | 0 (0.0%) | 0 (0.0%) |
| Educational Services | 0 (0.0%) | 0 (0.0%) |
| Health Care & Social Assistance | 0 (0.0%) | 29 (100.0%) |
| Arts, Entertainment & Recreation | 0 (0.0%) | 0 (0.0%) |
| Accommodation & Food Services | 0 (0.0%) | 0 (0.0%) |
| Public Administration | 0 (0.0%) | 0 (0.0%) |
| Total | 73 (71.6%) | 29 (28.4%) |
Education in Torreon CDP Torrance County
School Enrollment in Torreon CDP Torrance County
| School Level | # Students | % Students |
| Nursery / Preschool | 0 | 0.0% |
| Kindergarten | 0 | 0.0% |
| Elementary School | 0 | 0.0% |
| Middle School | 0 | 0.0% |
| High School | 0 | 0.0% |
| College / Undergraduate | 0 | 0.0% |
| Graduate / Professional | 0 | 0.0% |
| Total | 0 | 0.0% |
School Enrollment by Age by Funding Source in Torreon CDP Torrance County
| Age Bracket | Public School | Private School |
| 3 to 4 Year Olds | 0 (0.0%) | 0 (0.0%) |
| 5 to 9 Year Old | 0 (0.0%) | 0 (0.0%) |
| 10 to 14 Year Olds | 0 (0.0%) | 0 (0.0%) |
| 15 to 17 Year Olds | 0 (0.0%) | 0 (0.0%) |
| 18 to 19 Year Olds | 0 (0.0%) | 0 (0.0%) |
| 20 to 24 Year Olds | 0 (0.0%) | 0 (0.0%) |
| 25 to 34 Year Olds | 0 (0.0%) | 0 (0.0%) |
| 35 Years and over | 0 (0.0%) | 0 (0.0%) |
| Total | 0 (0.0%) | 0 (0.0%) |
Educational Attainment by Field of Study in Torreon CDP Torrance County
| Field of Study | # Graduates | % Graduates |
| Computers & Mathematics | 0 | 0.0% |
| Bio, Nature & Agricultural | 0 | 0.0% |
| Physical & Health Sciences | 0 | 0.0% |
| Psychology | 0 | 0.0% |
| Social Sciences | 0 | 0.0% |
| Engineering | 0 | 0.0% |
| Multidisciplinary Studies | 0 | 0.0% |
| Science & Technology | 0 | 0.0% |
| Business | 0 | 0.0% |
| Education | 0 | 0.0% |
| Literature & Languages | 0 | 0.0% |
| Liberal Arts & History | 0 | 0.0% |
| Visual & Performing Arts | 0 | 0.0% |
| Communications | 0 | 0.0% |
| Arts & Humanities | 0 | 0.0% |
| Total | 0 | 0.0% |
Transportation & Commute in Torreon CDP Torrance County
Vehicle Availability by Sex in Torreon CDP Torrance County
The most prevalent vehicle ownership categories in Torreon CDP Torrance County are males with 4 vehicles (73, accounting for 100.0%) and females with 4 vehicles (0, making up 251.7%).
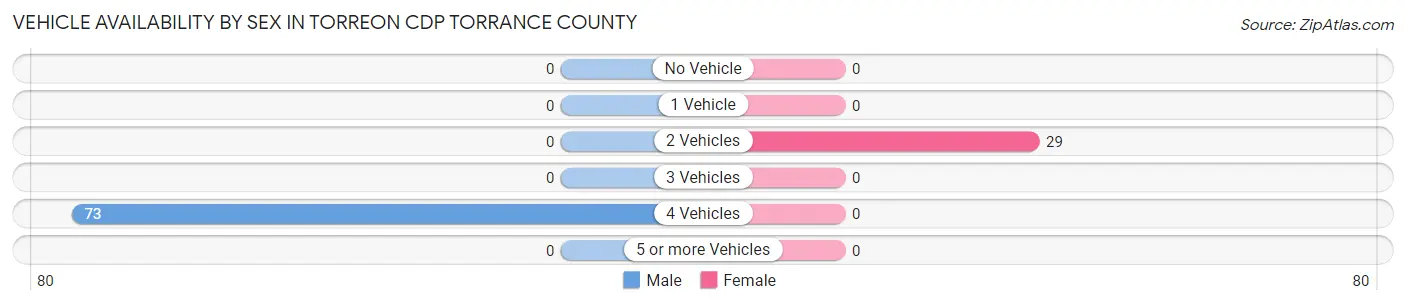
| Vehicles Available | Male | Female |
| No Vehicle | 0 (0.0%) | 0 (0.0%) |
| 1 Vehicle | 0 (0.0%) | 0 (0.0%) |
| 2 Vehicles | 0 (0.0%) | 29 (100.0%) |
| 3 Vehicles | 0 (0.0%) | 0 (0.0%) |
| 4 Vehicles | 73 (100.0%) | 0 (0.0%) |
| 5 or more Vehicles | 0 (0.0%) | 0 (0.0%) |
| Total | 73 (100.0%) | 29 (100.0%) |
Commute Time in Torreon CDP Torrance County
The most frequently occuring commute durations in Torreon CDP Torrance County are 40 to 44 minutes (73 commuters, 71.6%), 25 to 29 minutes (29 commuters, 28.4%), and less than 5 minutes (0 commuters, 0.0%).
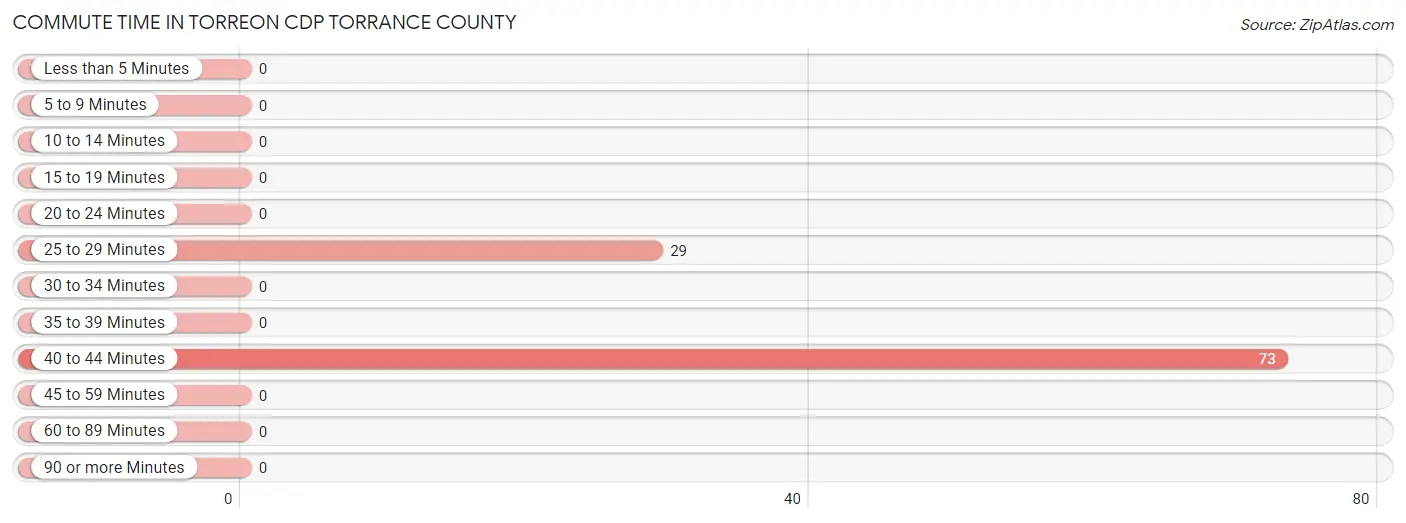
| Commute Time | # Commuters | % Commuters |
| Less than 5 Minutes | 0 | 0.0% |
| 5 to 9 Minutes | 0 | 0.0% |
| 10 to 14 Minutes | 0 | 0.0% |
| 15 to 19 Minutes | 0 | 0.0% |
| 20 to 24 Minutes | 0 | 0.0% |
| 25 to 29 Minutes | 29 | 28.4% |
| 30 to 34 Minutes | 0 | 0.0% |
| 35 to 39 Minutes | 0 | 0.0% |
| 40 to 44 Minutes | 73 | 71.6% |
| 45 to 59 Minutes | 0 | 0.0% |
| 60 to 89 Minutes | 0 | 0.0% |
| 90 or more Minutes | 0 | 0.0% |
Commute Time by Sex in Torreon CDP Torrance County
The most common commute times in Torreon CDP Torrance County are 40 to 44 minutes (73 commuters, 100.0%) for males and 25 to 29 minutes (29 commuters, 100.0%) for females.
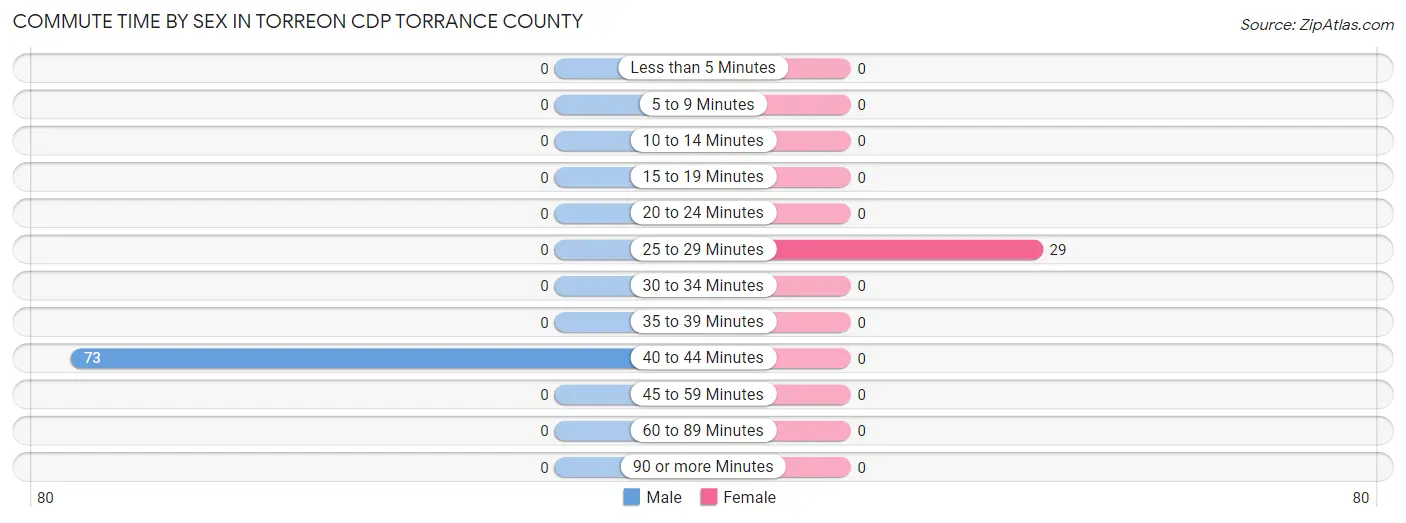
| Commute Time | Male | Female |
| Less than 5 Minutes | 0 (0.0%) | 0 (0.0%) |
| 5 to 9 Minutes | 0 (0.0%) | 0 (0.0%) |
| 10 to 14 Minutes | 0 (0.0%) | 0 (0.0%) |
| 15 to 19 Minutes | 0 (0.0%) | 0 (0.0%) |
| 20 to 24 Minutes | 0 (0.0%) | 0 (0.0%) |
| 25 to 29 Minutes | 0 (0.0%) | 29 (100.0%) |
| 30 to 34 Minutes | 0 (0.0%) | 0 (0.0%) |
| 35 to 39 Minutes | 0 (0.0%) | 0 (0.0%) |
| 40 to 44 Minutes | 73 (100.0%) | 0 (0.0%) |
| 45 to 59 Minutes | 0 (0.0%) | 0 (0.0%) |
| 60 to 89 Minutes | 0 (0.0%) | 0 (0.0%) |
| 90 or more Minutes | 0 (0.0%) | 0 (0.0%) |
Time of Departure to Work by Sex in Torreon CDP Torrance County
The most frequent times of departure to work in Torreon CDP Torrance County are 6:30 AM to 6:59 AM (73, 100.0%) for males and 6:30 AM to 6:59 AM (29, 100.0%) for females.
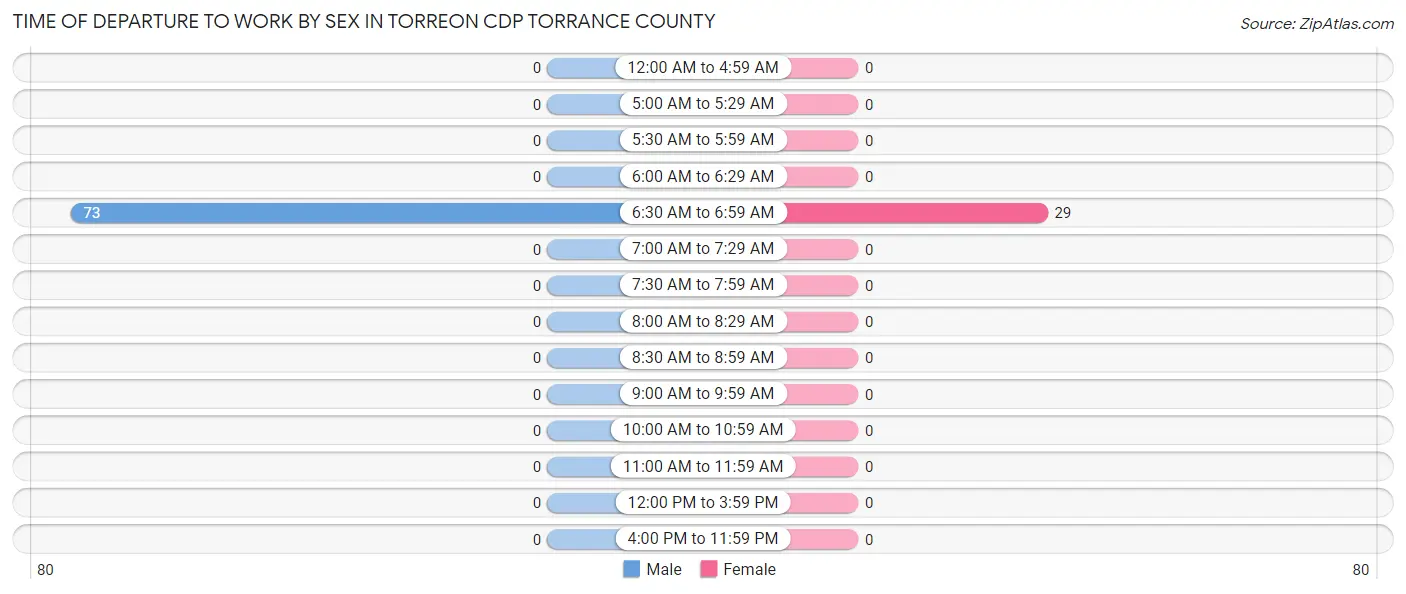
| Time of Departure | Male | Female |
| 12:00 AM to 4:59 AM | 0 (0.0%) | 0 (0.0%) |
| 5:00 AM to 5:29 AM | 0 (0.0%) | 0 (0.0%) |
| 5:30 AM to 5:59 AM | 0 (0.0%) | 0 (0.0%) |
| 6:00 AM to 6:29 AM | 0 (0.0%) | 0 (0.0%) |
| 6:30 AM to 6:59 AM | 73 (100.0%) | 29 (100.0%) |
| 7:00 AM to 7:29 AM | 0 (0.0%) | 0 (0.0%) |
| 7:30 AM to 7:59 AM | 0 (0.0%) | 0 (0.0%) |
| 8:00 AM to 8:29 AM | 0 (0.0%) | 0 (0.0%) |
| 8:30 AM to 8:59 AM | 0 (0.0%) | 0 (0.0%) |
| 9:00 AM to 9:59 AM | 0 (0.0%) | 0 (0.0%) |
| 10:00 AM to 10:59 AM | 0 (0.0%) | 0 (0.0%) |
| 11:00 AM to 11:59 AM | 0 (0.0%) | 0 (0.0%) |
| 12:00 PM to 3:59 PM | 0 (0.0%) | 0 (0.0%) |
| 4:00 PM to 11:59 PM | 0 (0.0%) | 0 (0.0%) |
| Total | 73 (100.0%) | 29 (100.0%) |
Housing Occupancy in Torreon CDP Torrance County
Occupancy by Ownership in Torreon CDP Torrance County
Of the total 105 dwellings in Torreon CDP Torrance County, owner-occupied units account for 105 (100.0%), while renter-occupied units make up 0 (0.0%).
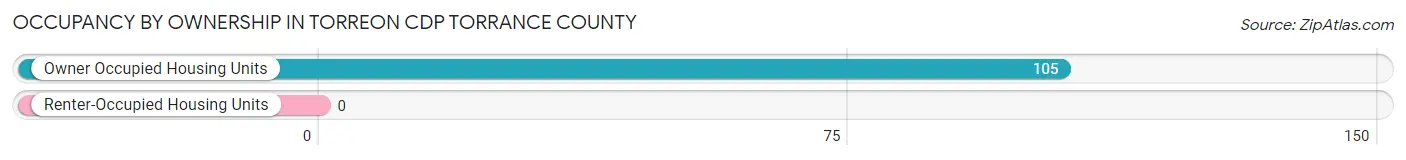
| Occupancy | # Housing Units | % Housing Units |
| Owner Occupied Housing Units | 105 | 100.0% |
| Renter-Occupied Housing Units | 0 | 0.0% |
| Total Occupied Housing Units | 105 | 100.0% |
Occupancy by Household Size in Torreon CDP Torrance County
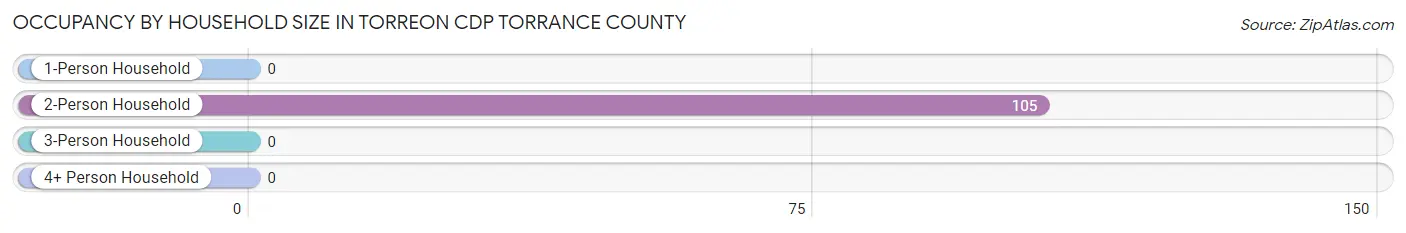
| Household Size | # Housing Units | % Housing Units |
| 1-Person Household | 0 | 0.0% |
| 2-Person Household | 105 | 100.0% |
| 3-Person Household | 0 | 0.0% |
| 4+ Person Household | 0 | 0.0% |
| Total Housing Units | 105 | 100.0% |
Occupancy by Ownership by Household Size in Torreon CDP Torrance County
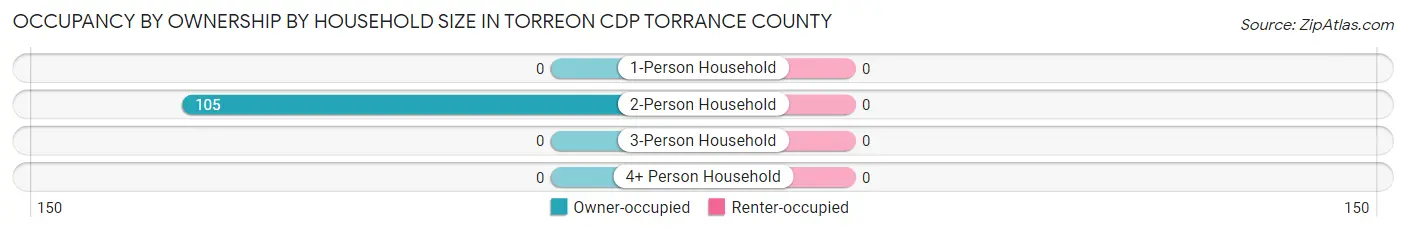
| Household Size | Owner-occupied | Renter-occupied |
| 1-Person Household | 0 (0.0%) | 0 (0.0%) |
| 2-Person Household | 105 (100.0%) | 0 (0.0%) |
| 3-Person Household | 0 (0.0%) | 0 (0.0%) |
| 4+ Person Household | 0 (0.0%) | 0 (0.0%) |
| Total Housing Units | 105 (100.0%) | 0 (0.0%) |
Occupancy by Educational Attainment in Torreon CDP Torrance County
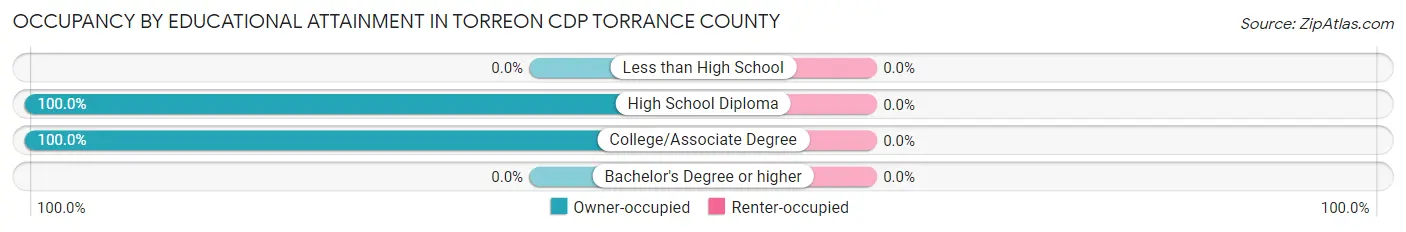
| Household Size | Owner-occupied | Renter-occupied |
| Less than High School | 0 (0.0%) | 0 (0.0%) |
| High School Diploma | 46 (100.0%) | 0 (0.0%) |
| College/Associate Degree | 59 (100.0%) | 0 (0.0%) |
| Bachelor's Degree or higher | 0 (0.0%) | 0 (0.0%) |
Occupancy by Age of Householder in Torreon CDP Torrance County
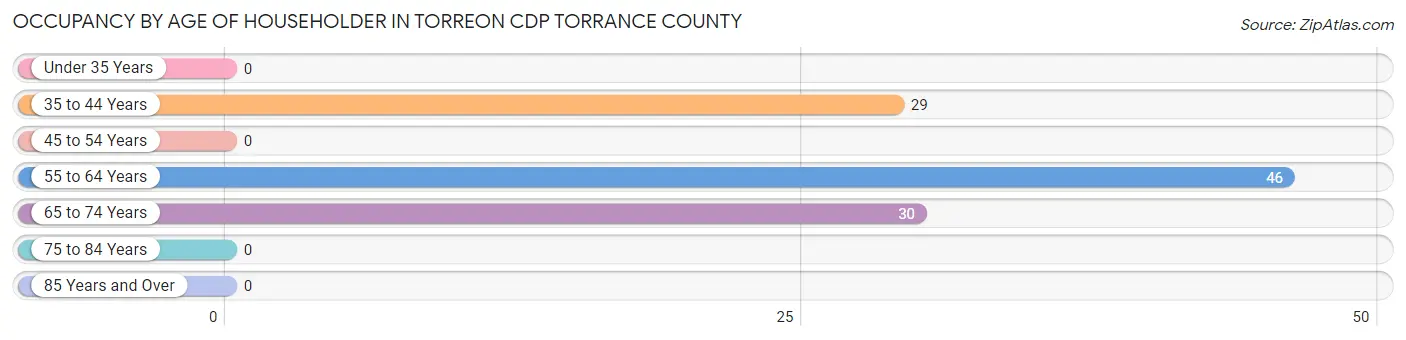
| Age Bracket | # Households | % Households |
| Under 35 Years | 0 | 0.0% |
| 35 to 44 Years | 29 | 27.6% |
| 45 to 54 Years | 0 | 0.0% |
| 55 to 64 Years | 46 | 43.8% |
| 65 to 74 Years | 30 | 28.6% |
| 75 to 84 Years | 0 | 0.0% |
| 85 Years and Over | 0 | 0.0% |
| Total | 105 | 100.0% |
Housing Finances in Torreon CDP Torrance County
Median Income by Occupancy in Torreon CDP Torrance County
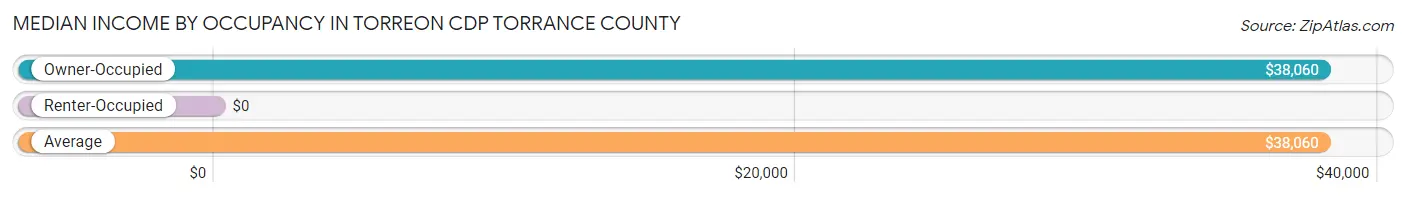
| Occupancy Type | # Households | Median Income |
| Owner-Occupied | 105 (100.0%) | $38,060 |
| Renter-Occupied | 0 (0.0%) | $0 |
| Average | 105 (100.0%) | $38,060 |
Occupancy by Householder Income Bracket in Torreon CDP Torrance County
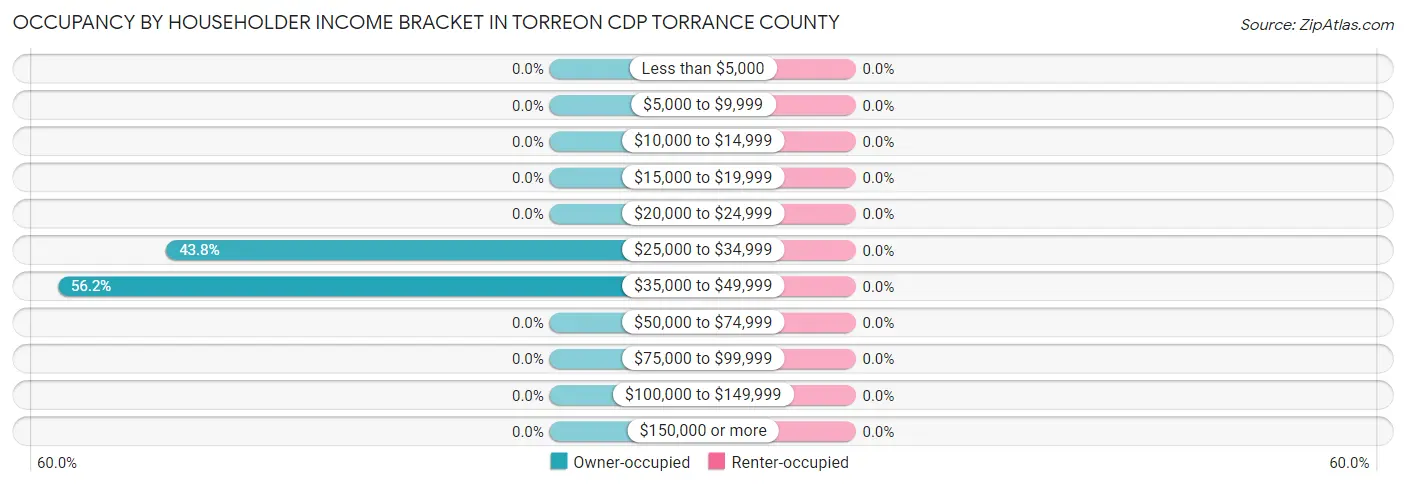
| Income Bracket | Owner-occupied | Renter-occupied |
| Less than $5,000 | 0 (0.0%) | 0 (0.0%) |
| $5,000 to $9,999 | 0 (0.0%) | 0 (0.0%) |
| $10,000 to $14,999 | 0 (0.0%) | 0 (0.0%) |
| $15,000 to $19,999 | 0 (0.0%) | 0 (0.0%) |
| $20,000 to $24,999 | 0 (0.0%) | 0 (0.0%) |
| $25,000 to $34,999 | 46 (43.8%) | 0 (0.0%) |
| $35,000 to $49,999 | 59 (56.2%) | 0 (0.0%) |
| $50,000 to $74,999 | 0 (0.0%) | 0 (0.0%) |
| $75,000 to $99,999 | 0 (0.0%) | 0 (0.0%) |
| $100,000 to $149,999 | 0 (0.0%) | 0 (0.0%) |
| $150,000 or more | 0 (0.0%) | 0 (0.0%) |
| Total | 105 (100.0%) | 0 (0.0%) |
Monthly Housing Cost Tiers in Torreon CDP Torrance County
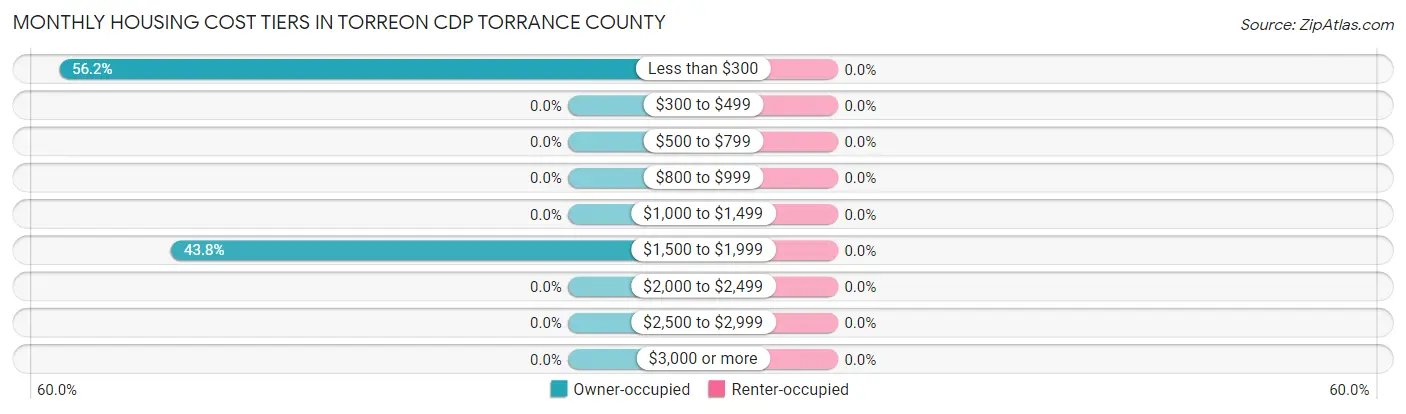
| Monthly Cost | Owner-occupied | Renter-occupied |
| Less than $300 | 59 (56.2%) | 0 (0.0%) |
| $300 to $499 | 0 (0.0%) | 0 (0.0%) |
| $500 to $799 | 0 (0.0%) | 0 (0.0%) |
| $800 to $999 | 0 (0.0%) | 0 (0.0%) |
| $1,000 to $1,499 | 0 (0.0%) | 0 (0.0%) |
| $1,500 to $1,999 | 46 (43.8%) | 0 (0.0%) |
| $2,000 to $2,499 | 0 (0.0%) | 0 (0.0%) |
| $2,500 to $2,999 | 0 (0.0%) | 0 (0.0%) |
| $3,000 or more | 0 (0.0%) | 0 (0.0%) |
| Total | 105 (100.0%) | 0 (0.0%) |
Physical Housing Characteristics in Torreon CDP Torrance County
Housing Structures in Torreon CDP Torrance County
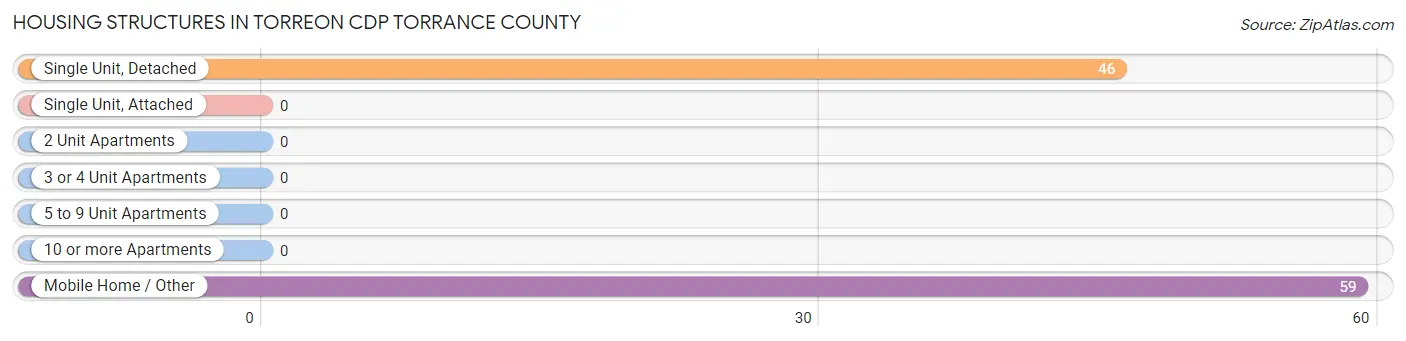
| Structure Type | # Housing Units | % Housing Units |
| Single Unit, Detached | 46 | 43.8% |
| Single Unit, Attached | 0 | 0.0% |
| 2 Unit Apartments | 0 | 0.0% |
| 3 or 4 Unit Apartments | 0 | 0.0% |
| 5 to 9 Unit Apartments | 0 | 0.0% |
| 10 or more Apartments | 0 | 0.0% |
| Mobile Home / Other | 59 | 56.2% |
| Total | 105 | 100.0% |
Housing Structures by Occupancy in Torreon CDP Torrance County
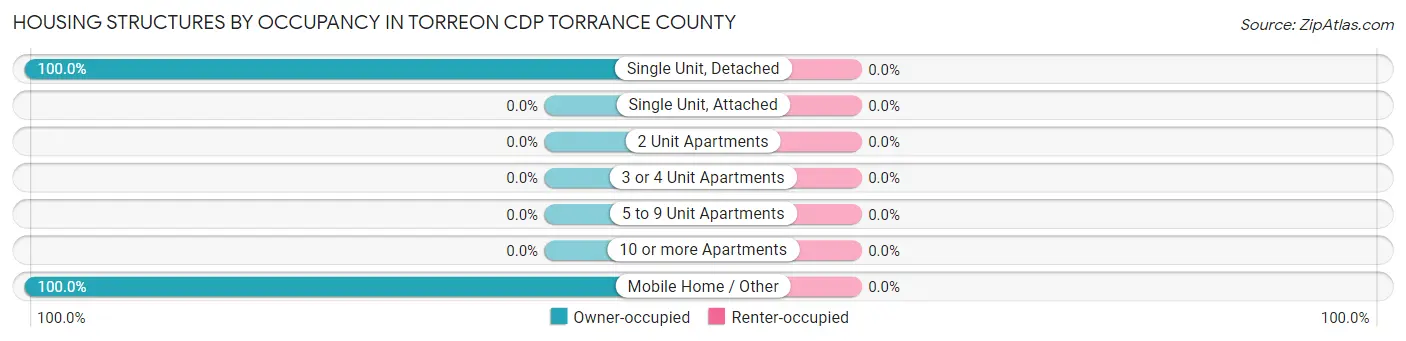
| Structure Type | Owner-occupied | Renter-occupied |
| Single Unit, Detached | 46 (100.0%) | 0 (0.0%) |
| Single Unit, Attached | 0 (0.0%) | 0 (0.0%) |
| 2 Unit Apartments | 0 (0.0%) | 0 (0.0%) |
| 3 or 4 Unit Apartments | 0 (0.0%) | 0 (0.0%) |
| 5 to 9 Unit Apartments | 0 (0.0%) | 0 (0.0%) |
| 10 or more Apartments | 0 (0.0%) | 0 (0.0%) |
| Mobile Home / Other | 59 (100.0%) | 0 (0.0%) |
| Total | 105 (100.0%) | 0 (0.0%) |
Housing Structures by Number of Rooms in Torreon CDP Torrance County
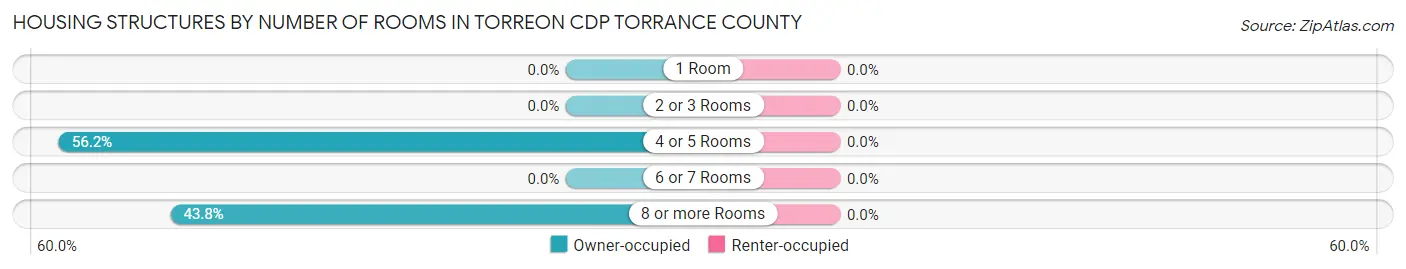
| Number of Rooms | Owner-occupied | Renter-occupied |
| 1 Room | 0 (0.0%) | 0 (0.0%) |
| 2 or 3 Rooms | 0 (0.0%) | 0 (0.0%) |
| 4 or 5 Rooms | 59 (56.2%) | 0 (0.0%) |
| 6 or 7 Rooms | 0 (0.0%) | 0 (0.0%) |
| 8 or more Rooms | 46 (43.8%) | 0 (0.0%) |
| Total | 105 (100.0%) | 0 (0.0%) |
Housing Structure by Heating Type in Torreon CDP Torrance County
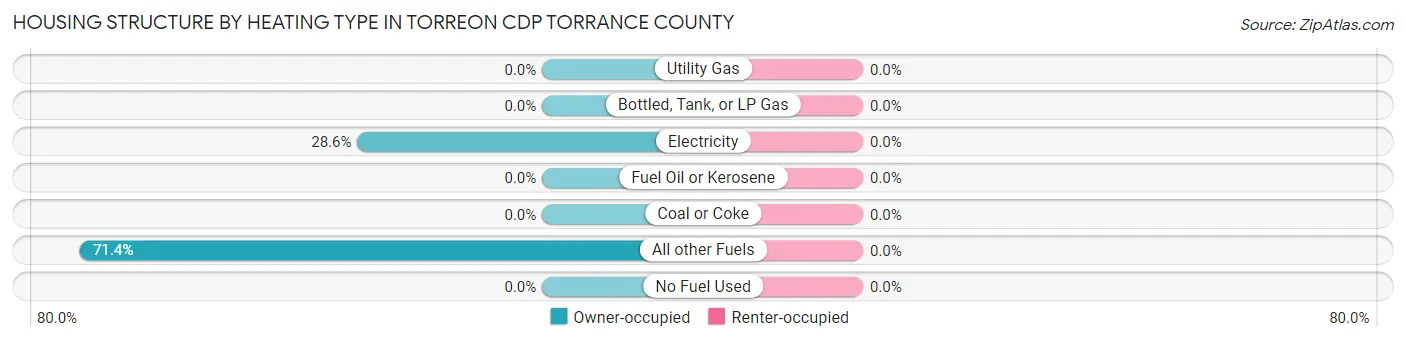
| Heating Type | Owner-occupied | Renter-occupied |
| Utility Gas | 0 (0.0%) | 0 (0.0%) |
| Bottled, Tank, or LP Gas | 0 (0.0%) | 0 (0.0%) |
| Electricity | 30 (28.6%) | 0 (0.0%) |
| Fuel Oil or Kerosene | 0 (0.0%) | 0 (0.0%) |
| Coal or Coke | 0 (0.0%) | 0 (0.0%) |
| All other Fuels | 75 (71.4%) | 0 (0.0%) |
| No Fuel Used | 0 (0.0%) | 0 (0.0%) |
| Total | 105 (100.0%) | 0 (0.0%) |
Household Vehicle Usage in Torreon CDP Torrance County
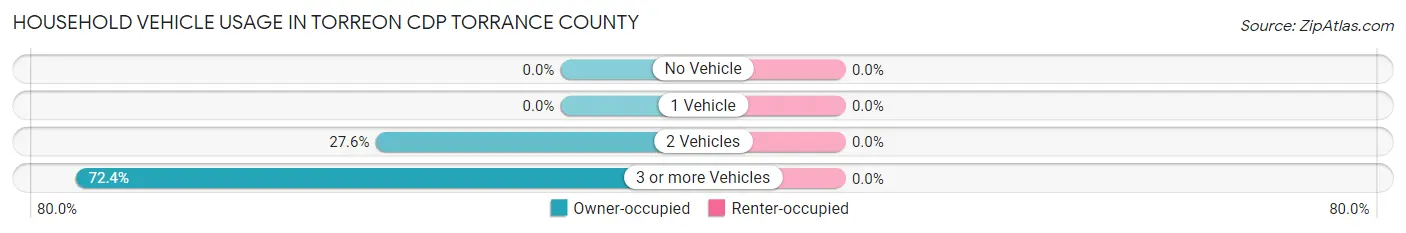
| Vehicles per Household | Owner-occupied | Renter-occupied |
| No Vehicle | 0 (0.0%) | 0 (0.0%) |
| 1 Vehicle | 0 (0.0%) | 0 (0.0%) |
| 2 Vehicles | 29 (27.6%) | 0 (0.0%) |
| 3 or more Vehicles | 76 (72.4%) | 0 (0.0%) |
| Total | 105 (100.0%) | 0 (0.0%) |
Real Estate & Mortgages in Torreon CDP Torrance County
Real Estate and Mortgage Overview in Torreon CDP Torrance County
| Characteristic | Without Mortgage | With Mortgage |
| Housing Units | 59 | 46 |
| Median Property Value | - | - |
| Median Household Income | - | - |
| Monthly Housing Costs | - | - |
| Real Estate Taxes | - | - |
Property Value by Mortgage Status in Torreon CDP Torrance County
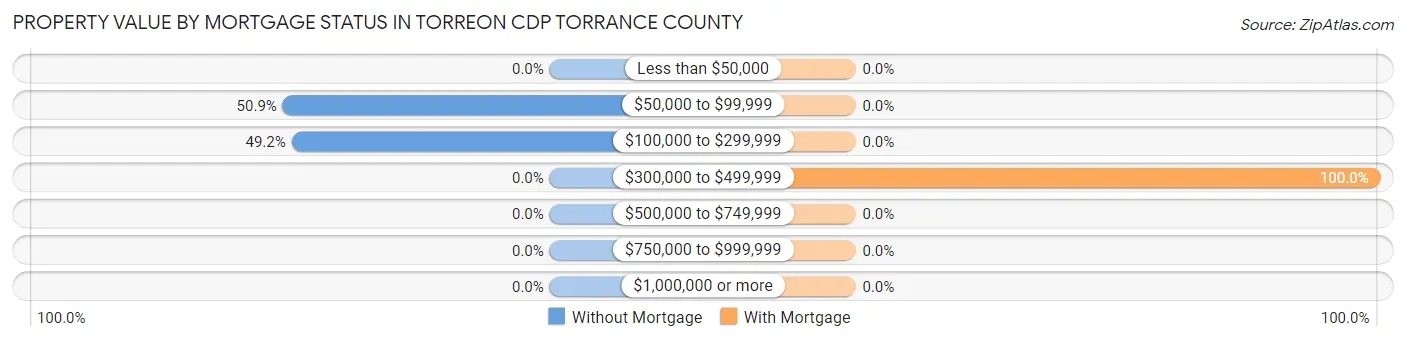
| Property Value | Without Mortgage | With Mortgage |
| Less than $50,000 | 0 (0.0%) | 0 (0.0%) |
| $50,000 to $99,999 | 30 (50.8%) | 0 (0.0%) |
| $100,000 to $299,999 | 29 (49.1%) | 0 (0.0%) |
| $300,000 to $499,999 | 0 (0.0%) | 46 (100.0%) |
| $500,000 to $749,999 | 0 (0.0%) | 0 (0.0%) |
| $750,000 to $999,999 | 0 (0.0%) | 0 (0.0%) |
| $1,000,000 or more | 0 (0.0%) | 0 (0.0%) |
| Total | 59 (100.0%) | 46 (100.0%) |
Household Income by Mortgage Status in Torreon CDP Torrance County
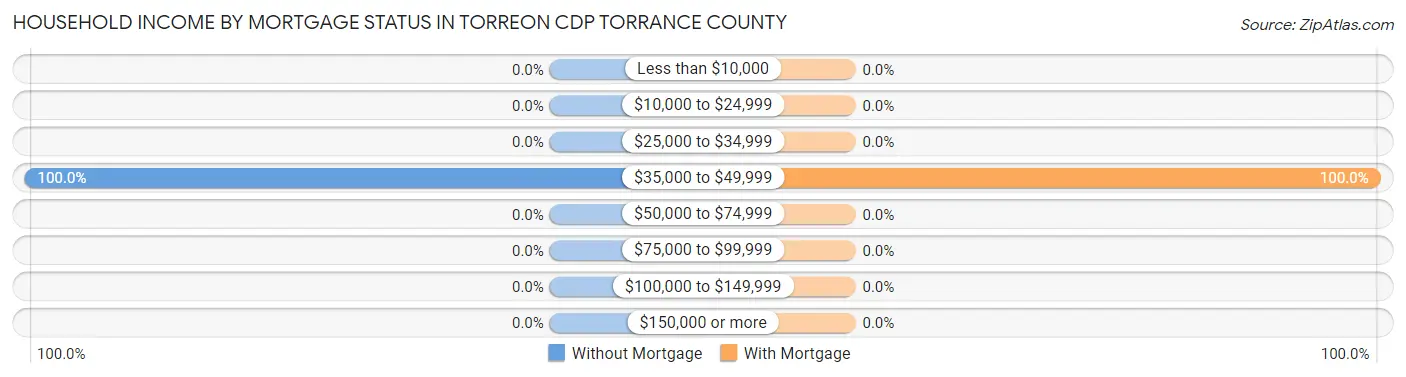
| Household Income | Without Mortgage | With Mortgage |
| Less than $10,000 | 0 (0.0%) | 0 (0.0%) |
| $10,000 to $24,999 | 0 (0.0%) | 0 (0.0%) |
| $25,000 to $34,999 | 0 (0.0%) | 0 (0.0%) |
| $35,000 to $49,999 | 59 (100.0%) | 46 (100.0%) |
| $50,000 to $74,999 | 0 (0.0%) | 0 (0.0%) |
| $75,000 to $99,999 | 0 (0.0%) | 0 (0.0%) |
| $100,000 to $149,999 | 0 (0.0%) | 0 (0.0%) |
| $150,000 or more | 0 (0.0%) | 0 (0.0%) |
| Total | 59 (100.0%) | 46 (100.0%) |
Property Value to Household Income Ratio in Torreon CDP Torrance County
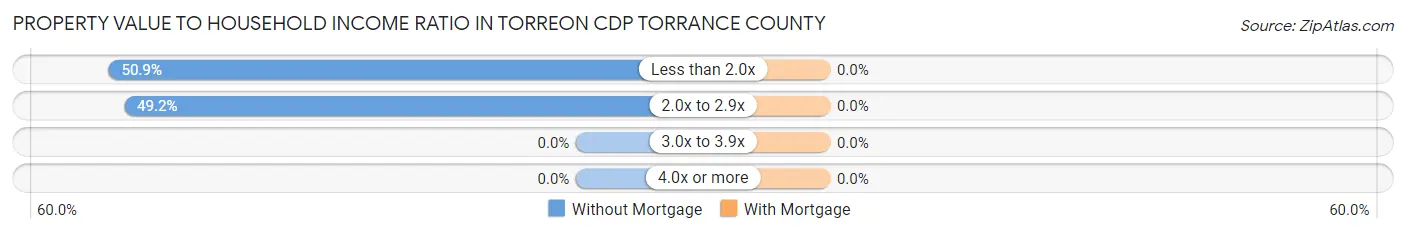
| Value-to-Income Ratio | Without Mortgage | With Mortgage |
| Less than 2.0x | 30 (50.8%) | 0 (0.0%) |
| 2.0x to 2.9x | 29 (49.1%) | 0 (0.0%) |
| 3.0x to 3.9x | 0 (0.0%) | 0 (0.0%) |
| 4.0x or more | 0 (0.0%) | 0 (0.0%) |
| Total | 59 (100.0%) | 46 (100.0%) |
Real Estate Taxes by Mortgage Status in Torreon CDP Torrance County
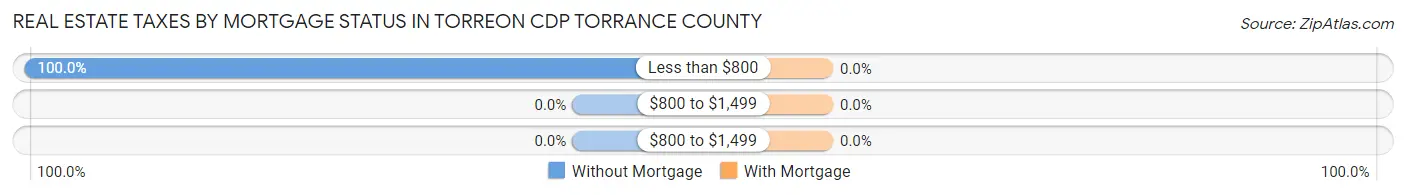
| Property Taxes | Without Mortgage | With Mortgage |
| Less than $800 | 59 (100.0%) | 0 (0.0%) |
| $800 to $1,499 | 0 (0.0%) | 0 (0.0%) |
| $800 to $1,499 | 0 (0.0%) | 0 (0.0%) |
| Total | 59 (100.0%) | 46 (100.0%) |
Health & Disability in Torreon CDP Torrance County
Health Insurance Coverage by Age in Torreon CDP Torrance County
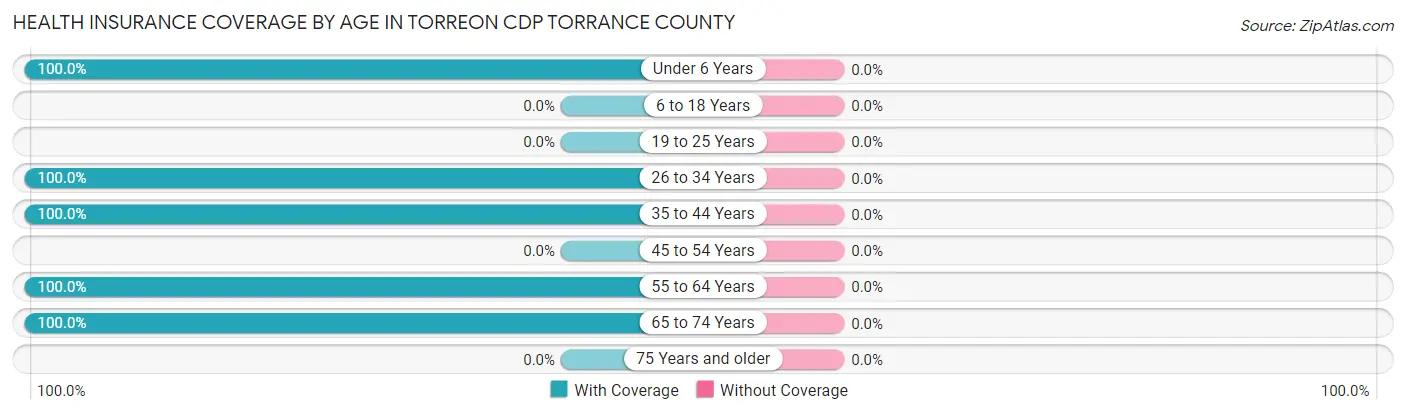
| Age Bracket | With Coverage | Without Coverage |
| Under 6 Years | 28 (100.0%) | 0 (0.0%) |
| 6 to 18 Years | 0 (0.0%) | 0 (0.0%) |
| 19 to 25 Years | 0 (0.0%) | 0 (0.0%) |
| 26 to 34 Years | 73 (100.0%) | 0 (0.0%) |
| 35 to 44 Years | 29 (100.0%) | 0 (0.0%) |
| 45 to 54 Years | 0 (0.0%) | 0 (0.0%) |
| 55 to 64 Years | 46 (100.0%) | 0 (0.0%) |
| 65 to 74 Years | 56 (100.0%) | 0 (0.0%) |
| 75 Years and older | 0 (0.0%) | 0 (0.0%) |
| Total | 232 (100.0%) | 0 (0.0%) |
Health Insurance Coverage by Citizenship Status in Torreon CDP Torrance County
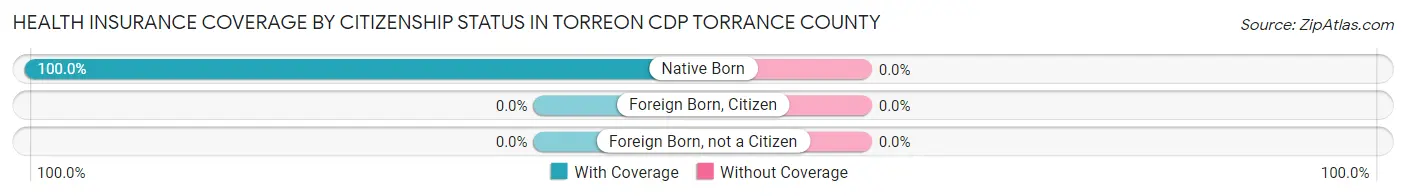
| Citizenship Status | With Coverage | Without Coverage |
| Native Born | 28 (100.0%) | 0 (0.0%) |
| Foreign Born, Citizen | 0 (0.0%) | 0 (0.0%) |
| Foreign Born, not a Citizen | 0 (0.0%) | 0 (0.0%) |
Health Insurance Coverage by Household Income in Torreon CDP Torrance County
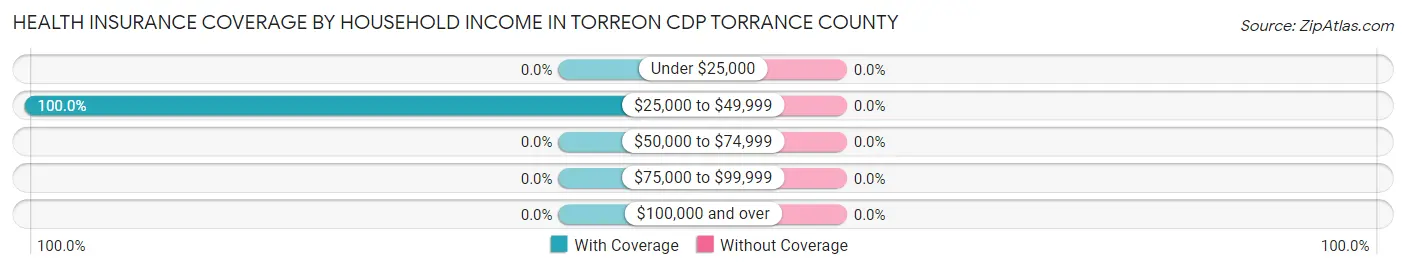
| Household Income | With Coverage | Without Coverage |
| Under $25,000 | 0 (0.0%) | 0 (0.0%) |
| $25,000 to $49,999 | 232 (100.0%) | 0 (0.0%) |
| $50,000 to $74,999 | 0 (0.0%) | 0 (0.0%) |
| $75,000 to $99,999 | 0 (0.0%) | 0 (0.0%) |
| $100,000 and over | 0 (0.0%) | 0 (0.0%) |
Public vs Private Health Insurance Coverage by Age in Torreon CDP Torrance County
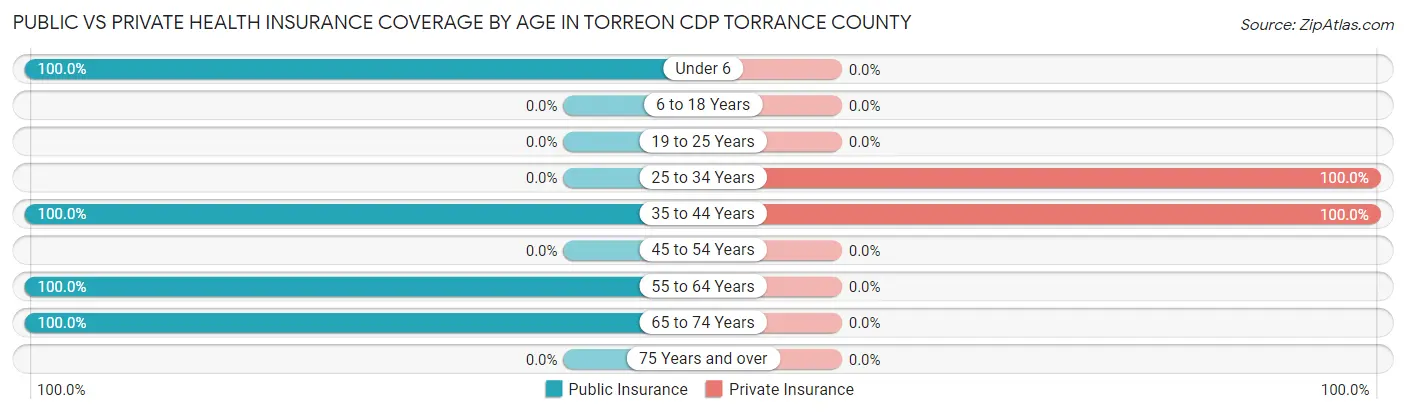
| Age Bracket | Public Insurance | Private Insurance |
| Under 6 | 28 (100.0%) | 0 (0.0%) |
| 6 to 18 Years | 0 (0.0%) | 0 (0.0%) |
| 19 to 25 Years | 0 (0.0%) | 0 (0.0%) |
| 25 to 34 Years | 0 (0.0%) | 73 (100.0%) |
| 35 to 44 Years | 29 (100.0%) | 29 (100.0%) |
| 45 to 54 Years | 0 (0.0%) | 0 (0.0%) |
| 55 to 64 Years | 46 (100.0%) | 0 (0.0%) |
| 65 to 74 Years | 56 (100.0%) | 0 (0.0%) |
| 75 Years and over | 0 (0.0%) | 0 (0.0%) |
| Total | 159 (68.5%) | 102 (44.0%) |
Disability Status by Sex by Age in Torreon CDP Torrance County
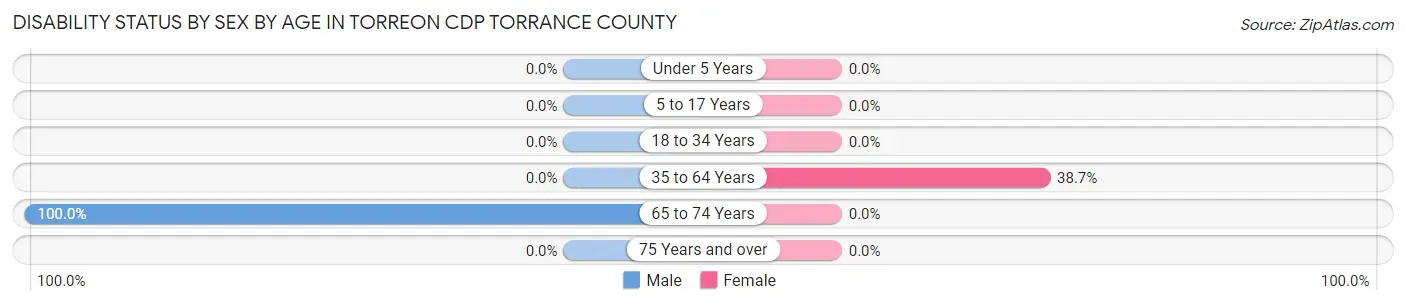
| Age Bracket | Male | Female |
| Under 5 Years | 0 (0.0%) | 0 (0.0%) |
| 5 to 17 Years | 0 (0.0%) | 0 (0.0%) |
| 18 to 34 Years | 0 (0.0%) | 0 (0.0%) |
| 35 to 64 Years | 0 (0.0%) | 29 (38.7%) |
| 65 to 74 Years | 30 (100.0%) | 0 (0.0%) |
| 75 Years and over | 0 (0.0%) | 0 (0.0%) |
Disability Class by Sex by Age in Torreon CDP Torrance County
Disability Class: Hearing Difficulty
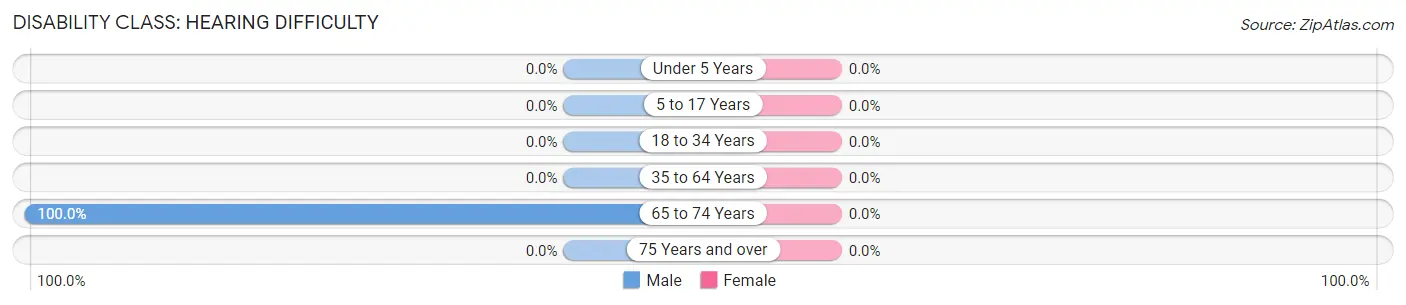
| Age Bracket | Male | Female |
| Under 5 Years | 0 (0.0%) | 0 (0.0%) |
| 5 to 17 Years | 0 (0.0%) | 0 (0.0%) |
| 18 to 34 Years | 0 (0.0%) | 0 (0.0%) |
| 35 to 64 Years | 0 (0.0%) | 0 (0.0%) |
| 65 to 74 Years | 30 (100.0%) | 0 (0.0%) |
| 75 Years and over | 0 (0.0%) | 0 (0.0%) |
Disability Class: Vision Difficulty
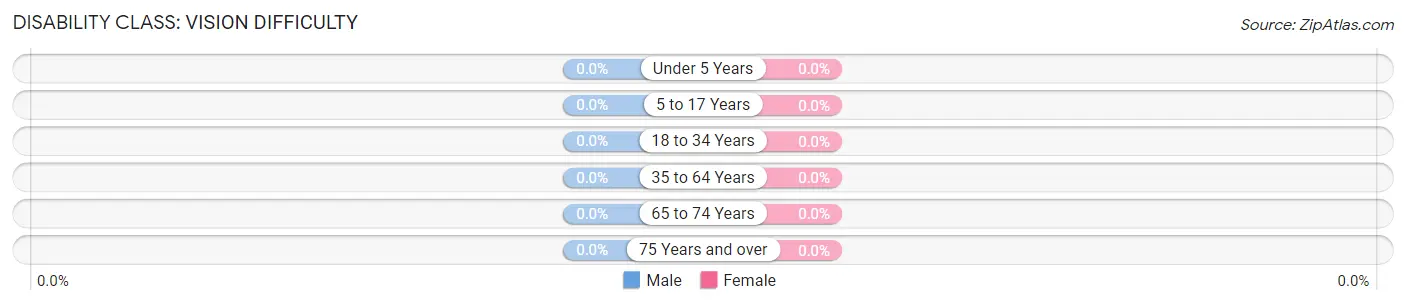
| Age Bracket | Male | Female |
| Under 5 Years | 0 (0.0%) | 0 (0.0%) |
| 5 to 17 Years | 0 (0.0%) | 0 (0.0%) |
| 18 to 34 Years | 0 (0.0%) | 0 (0.0%) |
| 35 to 64 Years | 0 (0.0%) | 0 (0.0%) |
| 65 to 74 Years | 0 (0.0%) | 0 (0.0%) |
| 75 Years and over | 0 (0.0%) | 0 (0.0%) |
Disability Class: Cognitive Difficulty
| Age Bracket | Male | Female |
| 5 to 17 Years | 0 (0.0%) | 0 (0.0%) |
| 18 to 34 Years | 0 (0.0%) | 0 (0.0%) |
| 35 to 64 Years | 0 (0.0%) | 0 (0.0%) |
| 65 to 74 Years | 0 (0.0%) | 0 (0.0%) |
| 75 Years and over | 0 (0.0%) | 0 (0.0%) |
Disability Class: Ambulatory Difficulty
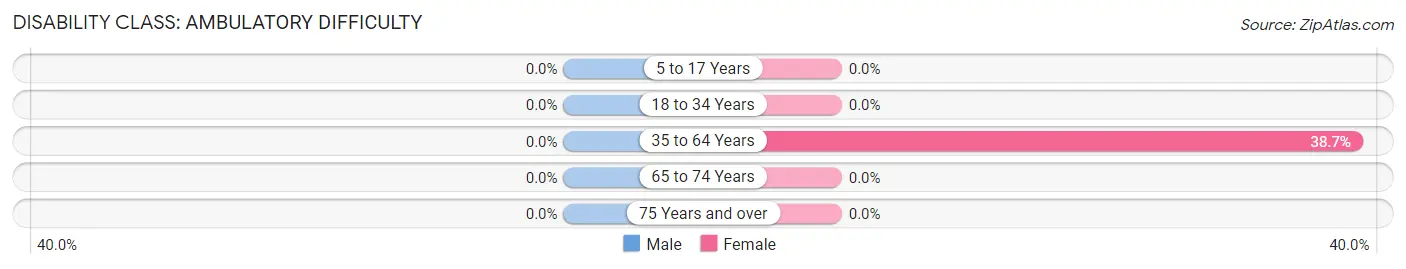
| Age Bracket | Male | Female |
| 5 to 17 Years | 0 (0.0%) | 0 (0.0%) |
| 18 to 34 Years | 0 (0.0%) | 0 (0.0%) |
| 35 to 64 Years | 0 (0.0%) | 29 (38.7%) |
| 65 to 74 Years | 0 (0.0%) | 0 (0.0%) |
| 75 Years and over | 0 (0.0%) | 0 (0.0%) |
Disability Class: Self-Care Difficulty
| Age Bracket | Male | Female |
| 5 to 17 Years | 0 (0.0%) | 0 (0.0%) |
| 18 to 34 Years | 0 (0.0%) | 0 (0.0%) |
| 35 to 64 Years | 0 (0.0%) | 0 (0.0%) |
| 65 to 74 Years | 0 (0.0%) | 0 (0.0%) |
| 75 Years and over | 0 (0.0%) | 0 (0.0%) |
Technology Access in Torreon CDP Torrance County
Computing Device Access in Torreon CDP Torrance County
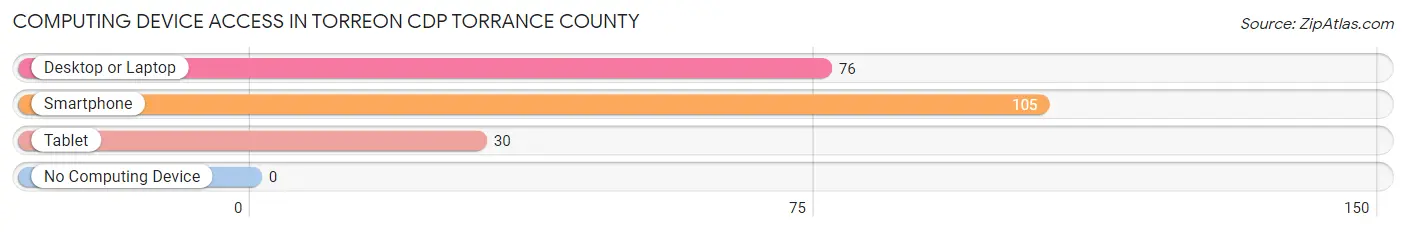
| Device Type | # Households | % Households |
| Desktop or Laptop | 76 | 72.4% |
| Smartphone | 105 | 100.0% |
| Tablet | 30 | 28.6% |
| No Computing Device | 0 | 0.0% |
| Total | 105 | 100.0% |
Internet Access in Torreon CDP Torrance County
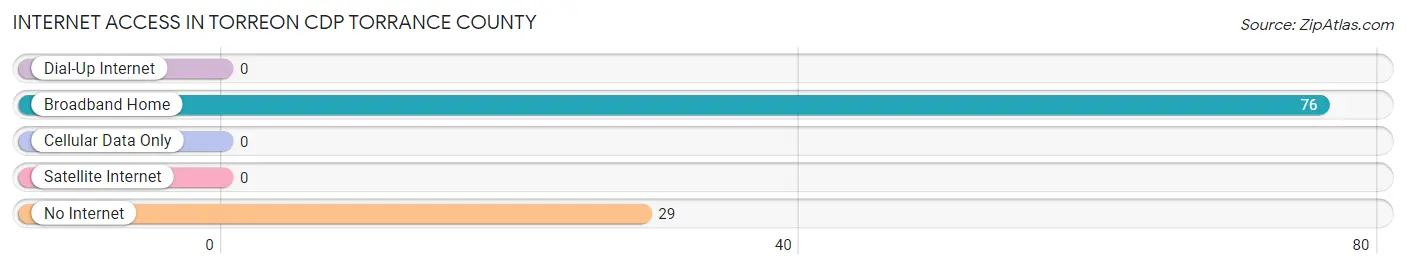
| Internet Type | # Households | % Households |
| Dial-Up Internet | 0 | 0.0% |
| Broadband Home | 76 | 72.4% |
| Cellular Data Only | 0 | 0.0% |
| Satellite Internet | 0 | 0.0% |
| No Internet | 29 | 27.6% |
| Total | 105 | 100.0% |
Torreon CDP Torrance County Summary
Torreon Cdp is a census-designated place (CDP) located in Torrance County, New Mexico. It is situated in the Manzano Mountains, approximately 25 miles southeast of Albuquerque. As of the 2010 census, the population of Torreon Cdp was 1,845.
Geography
Torreon Cdp is located at 35°17'17"N 106°17'17"W (35.288°N 106.288°W). It has an elevation of 6,845 feet (2,089 m). The CDP covers an area of 4.3 square miles (11.2 km2), all of it land.
Climate
Torreon Cdp has a semi-arid climate, with hot summers and cold winters. The average annual temperature is 54°F (12°C). The average annual precipitation is 12.5 inches (318 mm).
Demographics
As of the 2010 census, the population of Torreon Cdp was 1,845. The racial makeup of the CDP was 79.2% White, 0.3% African American, 0.9% Native American, 0.2% Asian, 0.1% Pacific Islander, 16.2% from other races, and 3.3% from two or more races. Hispanic or Latino of any race were 44.2% of the population.
Economy
The economy of Torreon Cdp is largely based on agriculture. The main crops grown in the area are alfalfa, hay, and wheat. Livestock production is also important, with cattle, sheep, and goats being the main animals raised.
The CDP also has a small manufacturing sector, with a few small businesses producing furniture, clothing, and other goods. There are also a few small retail stores in the area.
History
The area that is now Torreon Cdp was first settled by Spanish colonists in the late 1700s. The area was part of the Spanish land grant known as the Manzano Land Grant. The area was later settled by Anglo-American settlers in the late 1800s.
The CDP was officially established in the early 1900s. The name Torreon comes from the Spanish word for “tower”, referring to the nearby Manzano Mountains.
In the early 1900s, the area was largely agricultural, with the main crops being alfalfa, hay, and wheat. The area also had a small manufacturing sector, with a few small businesses producing furniture, clothing, and other goods.
In the mid-1900s, the area began to experience population growth as people moved to the area from other parts of the state. This growth continued into the late 1900s, and the population of Torreon Cdp has remained relatively stable since then.
Common Questions
What is Per Capita Income in Torreon CDP Torrance County?
Per Capita income in Torreon CDP Torrance County is $18,774.
What is the Median Family Income in Torreon CDP Torrance County?
Median Family Income in Torreon CDP Torrance County is $38,060.
What is the Median Household income in Torreon CDP Torrance County?
Median Household Income in Torreon CDP Torrance County is $38,060.
What is Inequality or Gini Index in Torreon CDP Torrance County?
Inequality or Gini Index in Torreon CDP Torrance County is 0.09.
What is the Total Population of Torreon CDP Torrance County?
Total Population of Torreon CDP Torrance County is 232.
What is the Total Male Population of Torreon CDP Torrance County?
Total Male Population of Torreon CDP Torrance County is 103.
What is the Total Female Population of Torreon CDP Torrance County?
Total Female Population of Torreon CDP Torrance County is 129.
What is the Ratio of Males per 100 Females in Torreon CDP Torrance County?
There are 79.84 Males per 100 Females in Torreon CDP Torrance County.
What is the Ratio of Females per 100 Males in Torreon CDP Torrance County?
There are 125.24 Females per 100 Males in Torreon CDP Torrance County.
What is the Median Population Age in Torreon CDP Torrance County?
Median Population Age in Torreon CDP Torrance County is 35.5 Years.
What is the Average Family Size in Torreon CDP Torrance County
Average Family Size in Torreon CDP Torrance County is 2.2 People.
What is the Average Household Size in Torreon CDP Torrance County
Average Household Size in Torreon CDP Torrance County is 2.2 People.
How Large is the Labor Force in Torreon CDP Torrance County?
There are 102 People in the Labor Forcein in Torreon CDP Torrance County.
What is the Percentage of People in the Labor Force in Torreon CDP Torrance County?
50.0% of People are in the Labor Force in Torreon CDP Torrance County.