Manley Hot Springs, AK Map & Demographics
Manley Hot Springs Map
Manley Hot Springs Overview
$81,765
PER CAPITA INCOME
0.28
INEQUALITY / GINI INDEX
17
TOTAL POPULATION
5
MALE POPULATION
12
FEMALE POPULATION
41.67
MALES / 100 FEMALES
240.00
FEMALES / 100 MALES
55.5
MEDIAN AGE
1.8
AVG FAMILY SIZE
1.4
AVG HOUSEHOLD SIZE
14
LABOR FORCE [ PEOPLE ]
82.4%
PERCENT IN LABOR FORCE
Manley Hot Springs Zip Codes
Manley Hot Springs Area Codes
Income in Manley Hot Springs
Income Overview in Manley Hot Springs
| Characteristic | Number | Measure |
| Per Capita Income | 17 | $81,765 |
| Median Family Income | 6 | $0 |
| Mean Family Income | 6 | $0 |
| Median Household Income | 12 | $0 |
| Mean Household Income | 12 | $133,233 |
| Income Deficit | 6 | $0 |
| Wage / Income Gap (%) | 17 | 0.00% |
| Wage / Income Gap ($) | 17 | 100.00¢ per $1 |
| Gini / Inequality Index | 17 | 0.28 |
Earnings by Sex in Manley Hot Springs
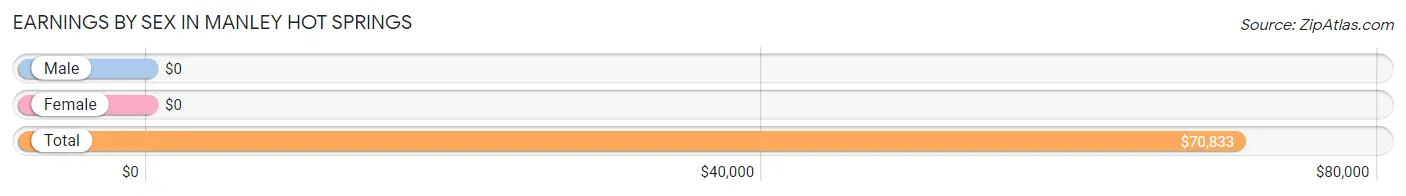
| Sex | Number | Average Earnings |
| Male | 4 (28.6%) | $0 |
| Female | 10 (71.4%) | $0 |
| Total | 14 (100.0%) | $70,833 |
Earnings by Sex by Income Bracket in Manley Hot Springs
The most common earnings brackets in Manley Hot Springs are $100,000+ for men (3 | 75.0%) and $55,000 to $64,999 for women (5 | 50.0%).
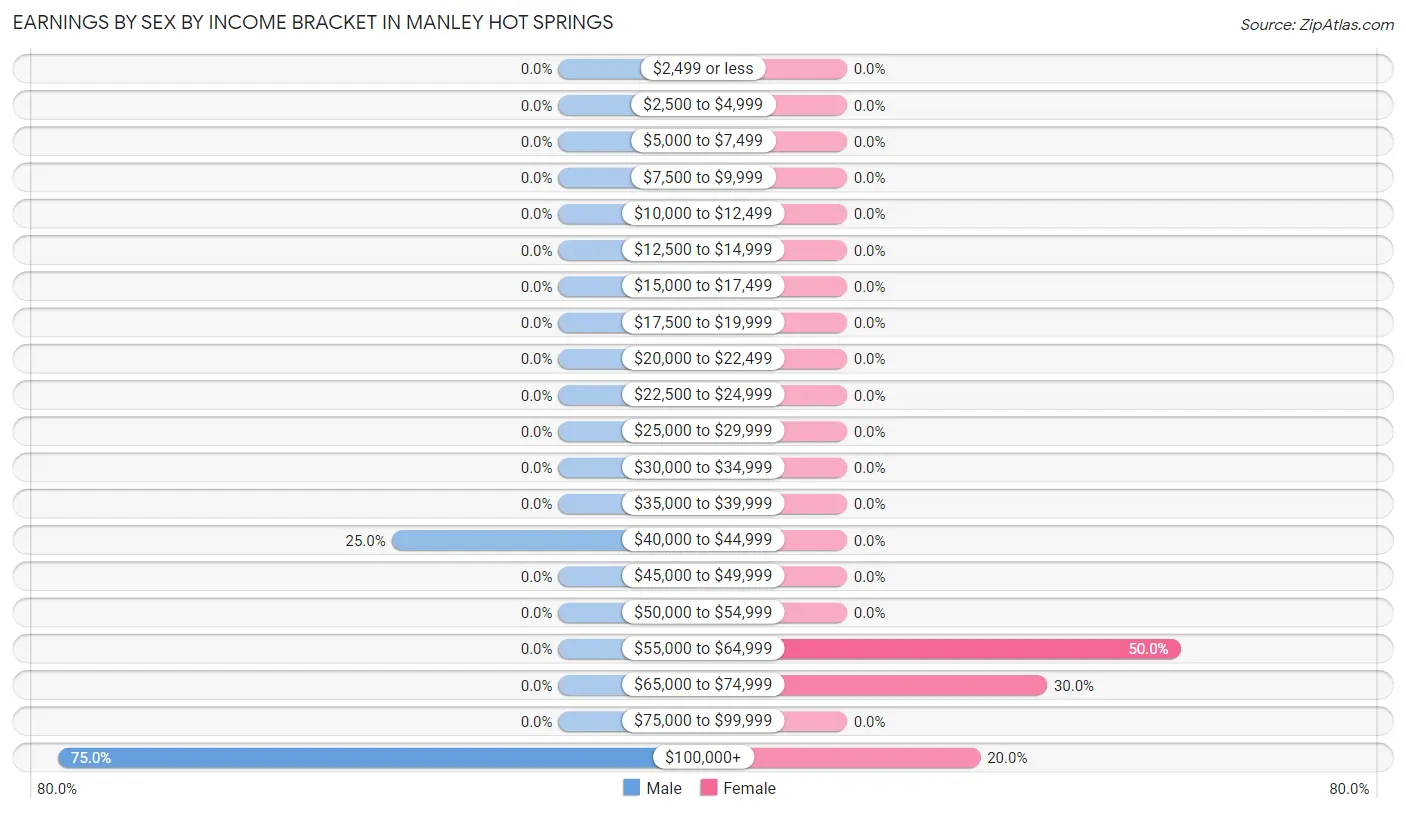
| Income | Male | Female |
| $2,499 or less | 0 (0.0%) | 0 (0.0%) |
| $2,500 to $4,999 | 0 (0.0%) | 0 (0.0%) |
| $5,000 to $7,499 | 0 (0.0%) | 0 (0.0%) |
| $7,500 to $9,999 | 0 (0.0%) | 0 (0.0%) |
| $10,000 to $12,499 | 0 (0.0%) | 0 (0.0%) |
| $12,500 to $14,999 | 0 (0.0%) | 0 (0.0%) |
| $15,000 to $17,499 | 0 (0.0%) | 0 (0.0%) |
| $17,500 to $19,999 | 0 (0.0%) | 0 (0.0%) |
| $20,000 to $22,499 | 0 (0.0%) | 0 (0.0%) |
| $22,500 to $24,999 | 0 (0.0%) | 0 (0.0%) |
| $25,000 to $29,999 | 0 (0.0%) | 0 (0.0%) |
| $30,000 to $34,999 | 0 (0.0%) | 0 (0.0%) |
| $35,000 to $39,999 | 0 (0.0%) | 0 (0.0%) |
| $40,000 to $44,999 | 1 (25.0%) | 0 (0.0%) |
| $45,000 to $49,999 | 0 (0.0%) | 0 (0.0%) |
| $50,000 to $54,999 | 0 (0.0%) | 0 (0.0%) |
| $55,000 to $64,999 | 0 (0.0%) | 5 (50.0%) |
| $65,000 to $74,999 | 0 (0.0%) | 3 (30.0%) |
| $75,000 to $99,999 | 0 (0.0%) | 0 (0.0%) |
| $100,000+ | 3 (75.0%) | 2 (20.0%) |
| Total | 4 (100.0%) | 10 (100.0%) |
Earnings by Sex by Educational Attainment in Manley Hot Springs
| Educational Attainment | Male Income | Female Income |
| Less than High School | - | - |
| High School Diploma | - | - |
| College or Associate's Degree | - | - |
| Bachelor's Degree | - | - |
| Graduate Degree | - | - |
| Total | - | - |
Family Income in Manley Hot Springs
Family Income Brackets in Manley Hot Springs
According to the Manley Hot Springs family income data, there are 5 families falling into the $150,000 to $199,999 income range, which is the most common income bracket and makes up 83.3% of all families.
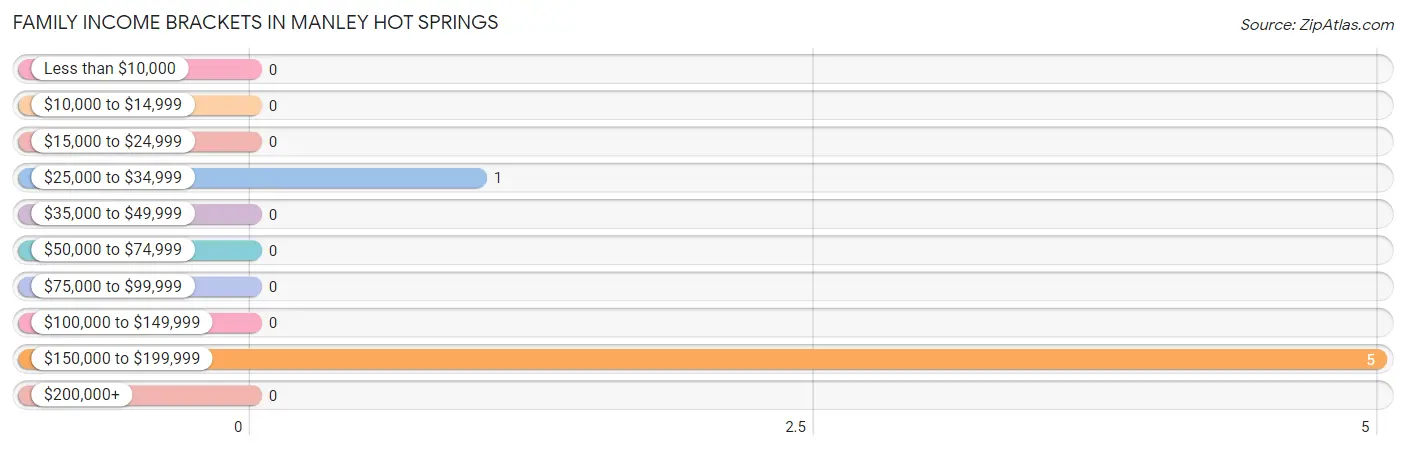
| Income Bracket | # Families | % Families |
| Less than $10,000 | 0 | 0.0% |
| $10,000 to $14,999 | 0 | 0.0% |
| $15,000 to $24,999 | 0 | 0.0% |
| $25,000 to $34,999 | 1 | 16.7% |
| $35,000 to $49,999 | 0 | 0.0% |
| $50,000 to $74,999 | 0 | 0.0% |
| $75,000 to $99,999 | 0 | 0.0% |
| $100,000 to $149,999 | 0 | 0.0% |
| $150,000 to $199,999 | 5 | 83.3% |
| $200,000+ | 0 | 0.0% |
Family Income by Famaliy Size in Manley Hot Springs
| Income Bracket | # Families | Median Income |
| 2-Person Families | 6 (100.0%) | $0 |
| 3-Person Families | 0 (0.0%) | $0 |
| 4-Person Families | 0 (0.0%) | $0 |
| 5-Person Families | 0 (0.0%) | $0 |
| 6-Person Families | 0 (0.0%) | $0 |
| 7+ Person Families | 0 (0.0%) | $0 |
| Total | 6 (100.0%) | $0 |
Family Income by Number of Earners in Manley Hot Springs
| Number of Earners | # Families | Median Income |
| No Earners | 1 (16.7%) | $0 |
| 1 Earner | 0 (0.0%) | $0 |
| 2 Earners | 5 (83.3%) | $0 |
| 3+ Earners | 0 (0.0%) | $0 |
| Total | 6 (100.0%) | $0 |
Household Income in Manley Hot Springs
Household Income Brackets in Manley Hot Springs
With 5 households falling in the category, the $150,000 to $199,999 income range is the most frequent in Manley Hot Springs, accounting for 41.7% of all households.
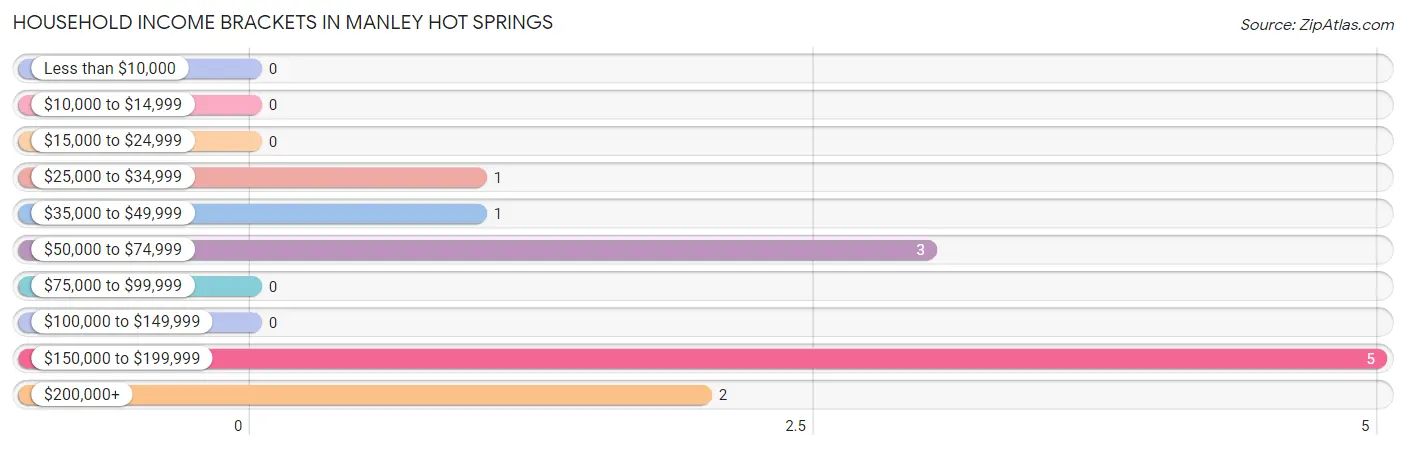
| Income Bracket | # Households | % Households |
| Less than $10,000 | 0 | 0.0% |
| $10,000 to $14,999 | 0 | 0.0% |
| $15,000 to $24,999 | 0 | 0.0% |
| $25,000 to $34,999 | 1 | 8.3% |
| $35,000 to $49,999 | 1 | 8.3% |
| $50,000 to $74,999 | 3 | 25.0% |
| $75,000 to $99,999 | 0 | 0.0% |
| $100,000 to $149,999 | 0 | 0.0% |
| $150,000 to $199,999 | 5 | 41.7% |
| $200,000+ | 2 | 16.7% |
Household Income by Householder Age in Manley Hot Springs
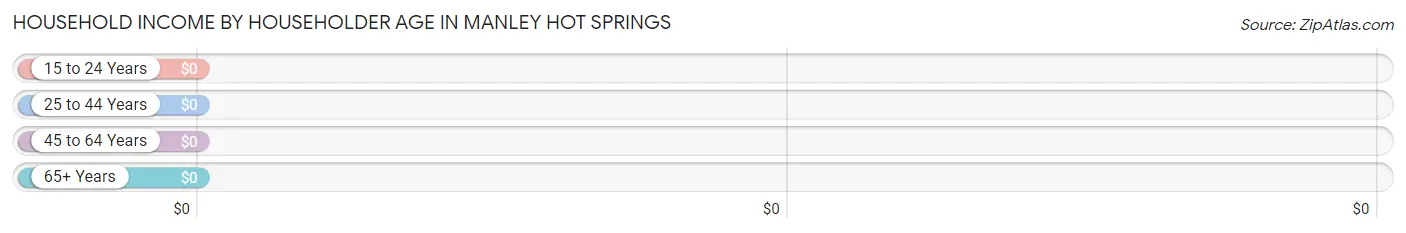
| Income Bracket | # Households | Median Income |
| 15 to 24 Years | 0 (0.0%) | $0 |
| 25 to 44 Years | 0 (0.0%) | $0 |
| 45 to 64 Years | 12 (100.0%) | $0 |
| 65+ Years | 0 (0.0%) | $0 |
| Total | 12 (100.0%) | $0 |
Poverty in Manley Hot Springs
Income Below Poverty by Sex and Age in Manley Hot Springs
| Age Bracket | Male | Female |
| Under 5 Years | 0 (0.0%) | 0 (0.0%) |
| 5 Years | 0 (0.0%) | 0 (0.0%) |
| 6 to 11 Years | 0 (0.0%) | 0 (0.0%) |
| 12 to 14 Years | 0 (0.0%) | 0 (0.0%) |
| 15 Years | 0 (0.0%) | 0 (0.0%) |
| 16 and 17 Years | 0 (0.0%) | 0 (0.0%) |
| 18 to 24 Years | 0 (0.0%) | 0 (0.0%) |
| 25 to 34 Years | 0 (0.0%) | 0 (0.0%) |
| 35 to 44 Years | 0 (0.0%) | 0 (0.0%) |
| 45 to 54 Years | 0 (0.0%) | 0 (0.0%) |
| 55 to 64 Years | 0 (0.0%) | 0 (0.0%) |
| 65 to 74 Years | 0 (0.0%) | 0 (0.0%) |
| 75 Years and over | 0 (0.0%) | 0 (0.0%) |
| Total | 0 (0.0%) | 0 (0.0%) |
Income Above Poverty by Sex and Age in Manley Hot Springs
According to the poverty statistics in Manley Hot Springs, males aged 45 to 54 years and females aged 45 to 54 years are the age groups that are most secure financially, with 100.0% of males and 100.0% of females in these age groups living above the poverty line.
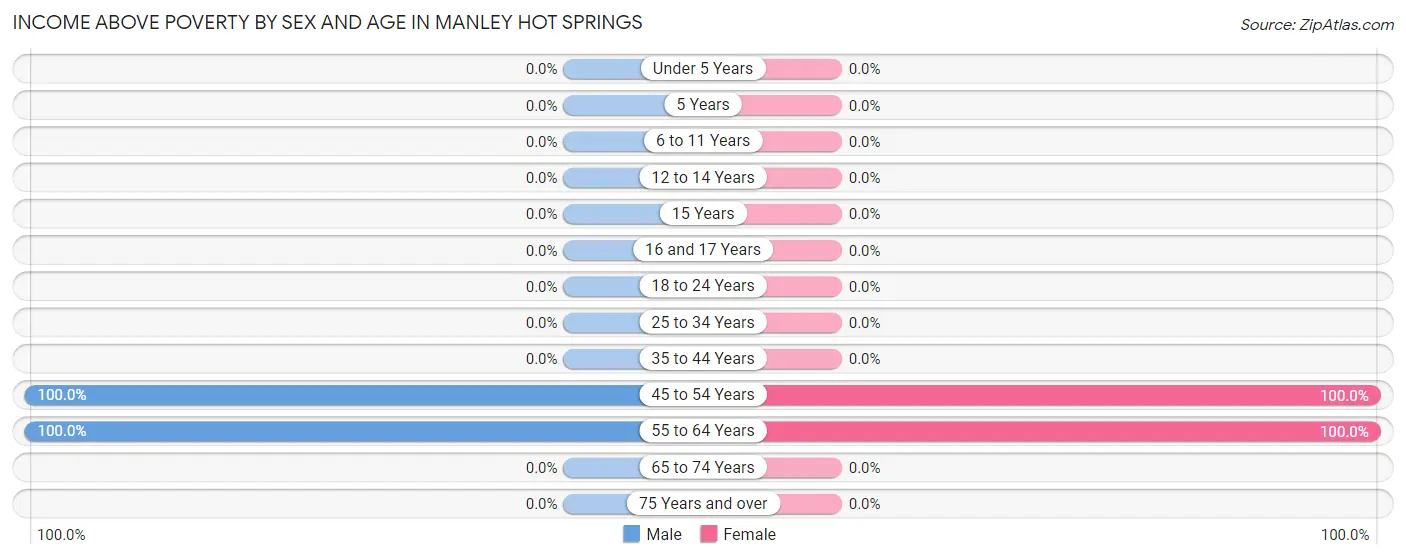
| Age Bracket | Male | Female |
| Under 5 Years | 0 (0.0%) | 0 (0.0%) |
| 5 Years | 0 (0.0%) | 0 (0.0%) |
| 6 to 11 Years | 0 (0.0%) | 0 (0.0%) |
| 12 to 14 Years | 0 (0.0%) | 0 (0.0%) |
| 15 Years | 0 (0.0%) | 0 (0.0%) |
| 16 and 17 Years | 0 (0.0%) | 0 (0.0%) |
| 18 to 24 Years | 0 (0.0%) | 0 (0.0%) |
| 25 to 34 Years | 0 (0.0%) | 0 (0.0%) |
| 35 to 44 Years | 0 (0.0%) | 0 (0.0%) |
| 45 to 54 Years | 3 (100.0%) | 5 (100.0%) |
| 55 to 64 Years | 2 (100.0%) | 7 (100.0%) |
| 65 to 74 Years | 0 (0.0%) | 0 (0.0%) |
| 75 Years and over | 0 (0.0%) | 0 (0.0%) |
| Total | 5 (100.0%) | 12 (100.0%) |
Income Below Poverty Among Married-Couple Families in Manley Hot Springs
| Children | Above Poverty | Below Poverty |
| No Children | 6 (100.0%) | 0 (0.0%) |
| 1 or 2 Children | 0 (0.0%) | 0 (0.0%) |
| 3 or 4 Children | 0 (0.0%) | 0 (0.0%) |
| 5 or more Children | 0 (0.0%) | 0 (0.0%) |
| Total | 6 (100.0%) | 0 (0.0%) |
Income Below Poverty Among Single-Parent Households in Manley Hot Springs
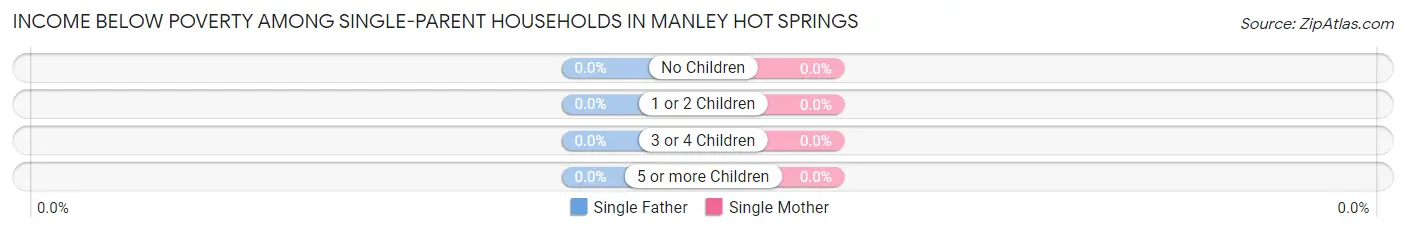
| Children | Single Father | Single Mother |
| No Children | 0 (0.0%) | 0 (0.0%) |
| 1 or 2 Children | 0 (0.0%) | 0 (0.0%) |
| 3 or 4 Children | 0 (0.0%) | 0 (0.0%) |
| 5 or more Children | 0 (0.0%) | 0 (0.0%) |
| Total | 0 (0.0%) | 0 (0.0%) |
Income Below Poverty Among Married-Couple vs Single-Parent Households in Manley Hot Springs
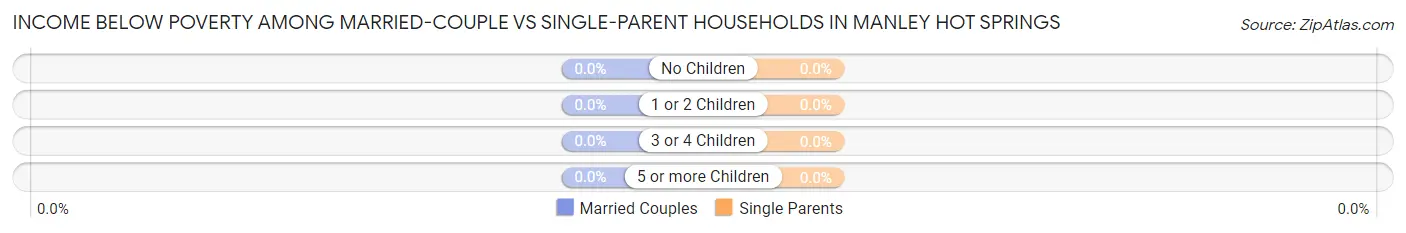
| Children | Married-Couple Families | Single-Parent Households |
| No Children | 0 (0.0%) | 0 (0.0%) |
| 1 or 2 Children | 0 (0.0%) | 0 (0.0%) |
| 3 or 4 Children | 0 (0.0%) | 0 (0.0%) |
| 5 or more Children | 0 (0.0%) | 0 (0.0%) |
| Total | 0 (0.0%) | 0 (0.0%) |
Race in Manley Hot Springs
The most populous races in Manley Hot Springs are White / Caucasian (14 | 82.4%), and Native / Alaskan (3 | 17.6%).
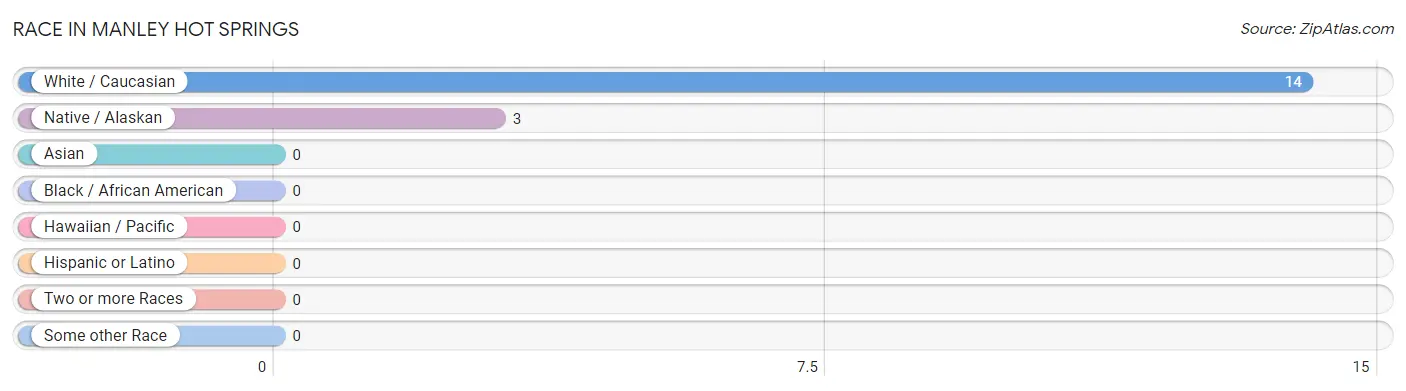
| Race | # Population | % Population |
| Asian | 0 | 0.0% |
| Black / African American | 0 | 0.0% |
| Hawaiian / Pacific | 0 | 0.0% |
| Hispanic or Latino | 0 | 0.0% |
| Native / Alaskan | 3 | 17.6% |
| White / Caucasian | 14 | 82.4% |
| Two or more Races | 0 | 0.0% |
| Some other Race | 0 | 0.0% |
| Total | 17 | 100.0% |
Ancestry in Manley Hot Springs
The most populous ancestries reported in Manley Hot Springs are Swedish (7 | 41.2%), Alaskan Athabascan (3 | 17.6%), French (3 | 17.6%), Polish (3 | 17.6%), and Croatian (2 | 11.8%), together accounting for 105.9% of all Manley Hot Springs residents.
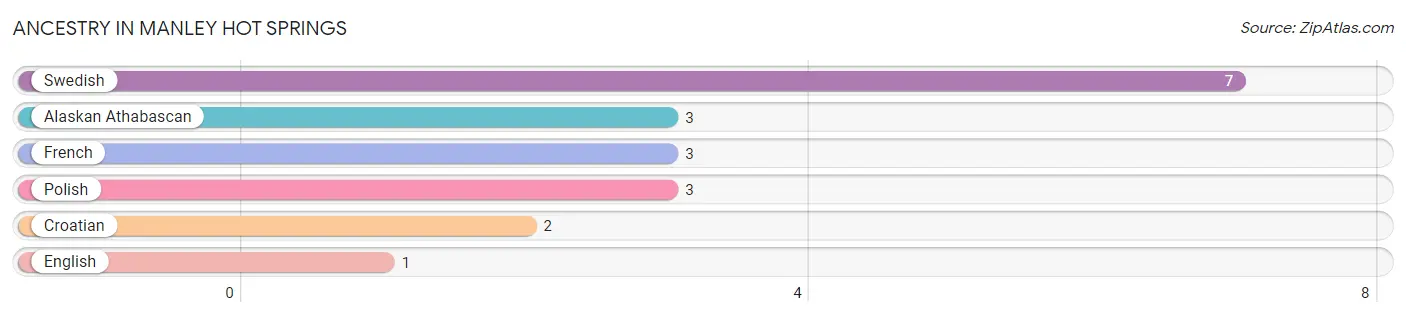
| Ancestry | # Population | % Population |
| Alaskan Athabascan | 3 | 17.6% |
| Croatian | 2 | 11.8% |
| English | 1 | 5.9% |
| French | 3 | 17.6% |
| Polish | 3 | 17.6% |
| Swedish | 7 | 41.2% | View All 6 Rows |
Immigrants in Manley Hot Springs

| Immigration Origin | # Population | % Population | View All 0 Rows |
Sex and Age in Manley Hot Springs
Sex and Age in Manley Hot Springs
The most populous age groups in Manley Hot Springs are 50 to 54 Years (3 | 60.0%) for men and 50 to 54 Years (5 | 41.7%) for women.
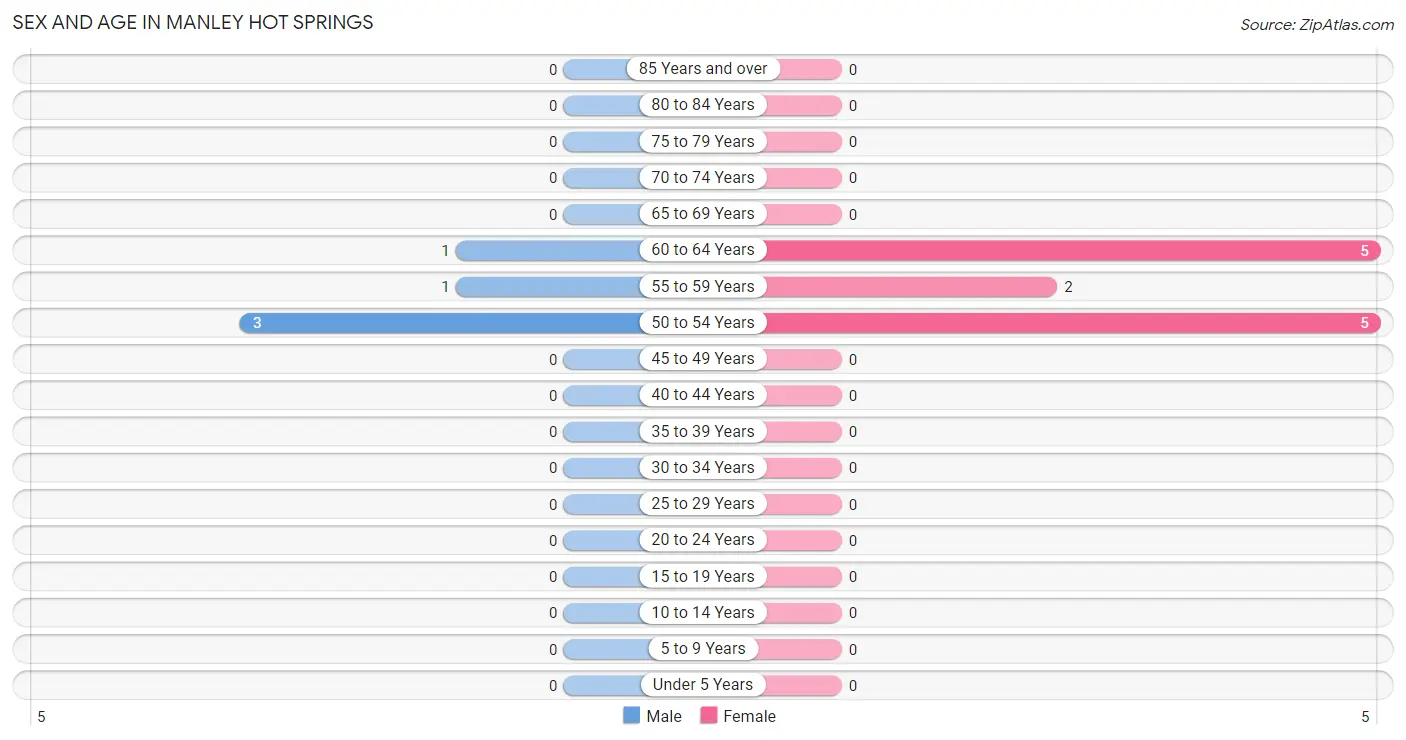
| Age Bracket | Male | Female |
| Under 5 Years | 0 (0.0%) | 0 (0.0%) |
| 5 to 9 Years | 0 (0.0%) | 0 (0.0%) |
| 10 to 14 Years | 0 (0.0%) | 0 (0.0%) |
| 15 to 19 Years | 0 (0.0%) | 0 (0.0%) |
| 20 to 24 Years | 0 (0.0%) | 0 (0.0%) |
| 25 to 29 Years | 0 (0.0%) | 0 (0.0%) |
| 30 to 34 Years | 0 (0.0%) | 0 (0.0%) |
| 35 to 39 Years | 0 (0.0%) | 0 (0.0%) |
| 40 to 44 Years | 0 (0.0%) | 0 (0.0%) |
| 45 to 49 Years | 0 (0.0%) | 0 (0.0%) |
| 50 to 54 Years | 3 (60.0%) | 5 (41.7%) |
| 55 to 59 Years | 1 (20.0%) | 2 (16.7%) |
| 60 to 64 Years | 1 (20.0%) | 5 (41.7%) |
| 65 to 69 Years | 0 (0.0%) | 0 (0.0%) |
| 70 to 74 Years | 0 (0.0%) | 0 (0.0%) |
| 75 to 79 Years | 0 (0.0%) | 0 (0.0%) |
| 80 to 84 Years | 0 (0.0%) | 0 (0.0%) |
| 85 Years and over | 0 (0.0%) | 0 (0.0%) |
| Total | 5 (100.0%) | 12 (100.0%) |
Families and Households in Manley Hot Springs
Median Family Size in Manley Hot Springs
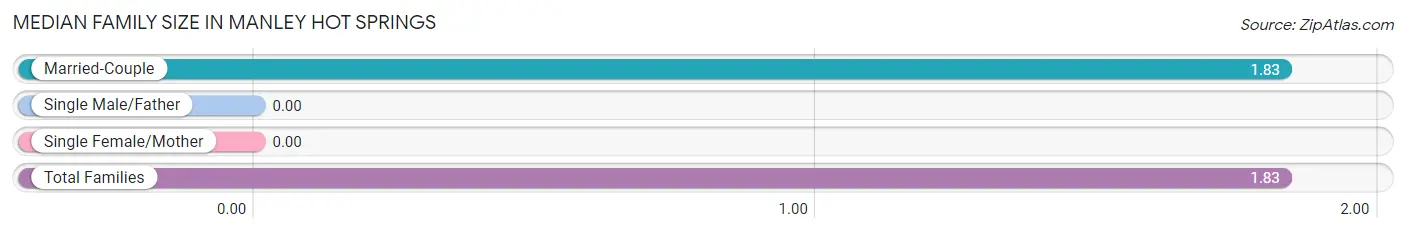
| Family Type | # Families | Family Size |
| Married-Couple | 6 (100.0%) | 1.83 |
| Single Male/Father | 0 (0.0%) | - |
| Single Female/Mother | 0 (0.0%) | - |
| Total Families | 6 (100.0%) | 1.83 |
Median Household Size in Manley Hot Springs
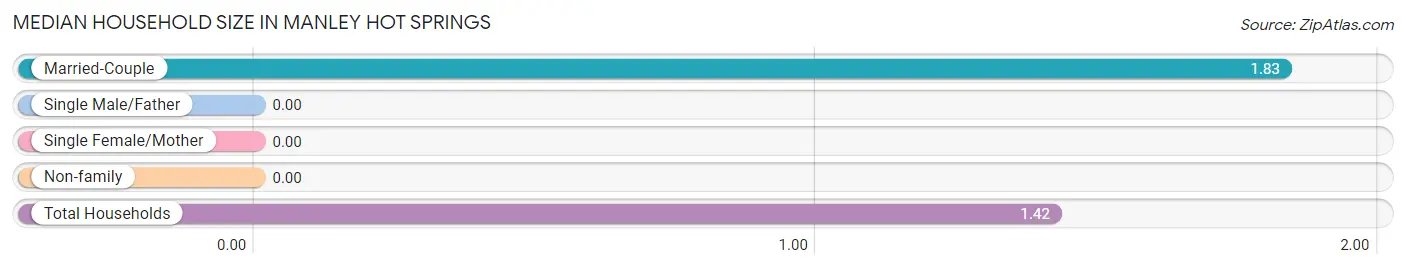
| Household Type | # Households | Household Size |
| Married-Couple | 6 (50.0%) | 1.83 |
| Single Male/Father | 0 (0.0%) | - |
| Single Female/Mother | 0 (0.0%) | - |
| Non-family | 6 (50.0%) | - |
| Total Households | 12 (100.0%) | 1.42 |
Household Size by Marriage Status in Manley Hot Springs
Out of a total of 12 households in Manley Hot Springs, 6 (50.0%) are family households, while 6 (50.0%) are nonfamily households. The most numerous type of family households are 2-person households, comprising 6, and the most common type of nonfamily households are 1-person households, comprising 6.
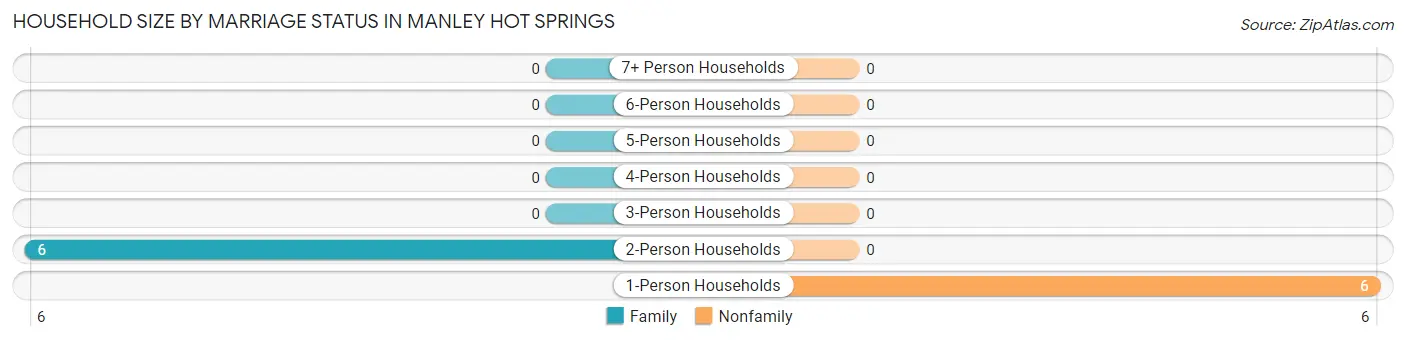
| Household Size | Family Households | Nonfamily Households |
| 1-Person Households | - | 6 (50.0%) |
| 2-Person Households | 6 (50.0%) | 0 (0.0%) |
| 3-Person Households | 0 (0.0%) | 0 (0.0%) |
| 4-Person Households | 0 (0.0%) | 0 (0.0%) |
| 5-Person Households | 0 (0.0%) | 0 (0.0%) |
| 6-Person Households | 0 (0.0%) | 0 (0.0%) |
| 7+ Person Households | 0 (0.0%) | 0 (0.0%) |
| Total | 6 (50.0%) | 6 (50.0%) |
Female Fertility in Manley Hot Springs
Fertility by Age in Manley Hot Springs
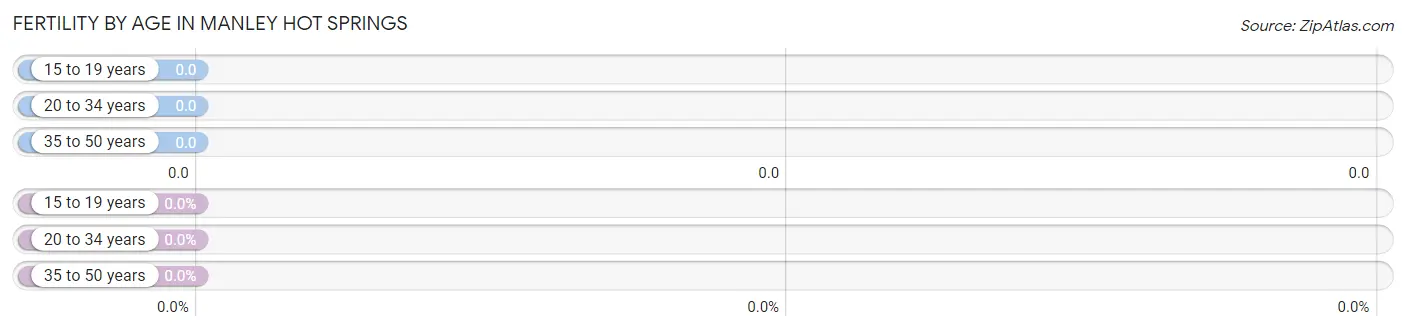
| Age Bracket | Women with Births | Births / 1,000 Women |
| 15 to 19 years | 0 (0.0%) | 0.0 |
| 20 to 34 years | 0 (0.0%) | 0.0 |
| 35 to 50 years | 0 (0.0%) | 0.0 |
| Total | 0 (0.0%) | 0.0 |
Fertility by Age by Marriage Status in Manley Hot Springs
| Age Bracket | Married | Unmarried |
| 15 to 19 years | 0 (0.0%) | 0 (0.0%) |
| 20 to 34 years | 0 (0.0%) | 0 (0.0%) |
| 35 to 50 years | 0 (0.0%) | 0 (0.0%) |
| Total | 0 (0.0%) | 0 (0.0%) |
Fertility by Education in Manley Hot Springs
| Educational Attainment | Women with Births | Births / 1,000 Women |
| Less than High School | 0 (0.0%) | 0.0 |
| High School Diploma | 0 (0.0%) | 0.0 |
| College or Associate's Degree | 0 (0.0%) | 0.0 |
| Bachelor's Degree | 0 (0.0%) | 0.0 |
| Graduate Degree | 0 (0.0%) | 0.0 |
| Total | 0 (0.0%) | 0.0 |
Fertility by Education by Marriage Status in Manley Hot Springs
| Educational Attainment | Married | Unmarried |
| Less than High School | 0 (0.0%) | 0 (0.0%) |
| High School Diploma | 0 (0.0%) | 0 (0.0%) |
| College or Associate's Degree | 0 (0.0%) | 0 (0.0%) |
| Bachelor's Degree | 0 (0.0%) | 0 (0.0%) |
| Graduate Degree | 0 (0.0%) | 0 (0.0%) |
| Total | 0 (0.0%) | 0 (0.0%) |
Employment Characteristics in Manley Hot Springs
Employment by Class of Employer in Manley Hot Springs
Among the 14 employed individuals in Manley Hot Springs, state government employees (8 | 57.1%), federal government employees (3 | 21.4%), and self-employed (incorporated) (2 | 14.3%) make up the most common classes of employment.
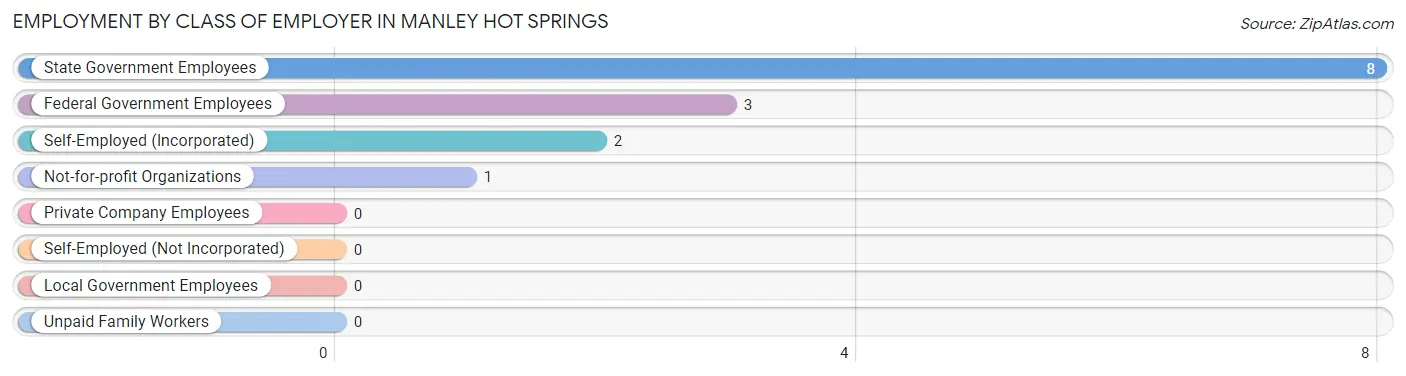
| Employer Class | # Employees | % Employees |
| Private Company Employees | 0 | 0.0% |
| Self-Employed (Incorporated) | 2 | 14.3% |
| Self-Employed (Not Incorporated) | 0 | 0.0% |
| Not-for-profit Organizations | 1 | 7.1% |
| Local Government Employees | 0 | 0.0% |
| State Government Employees | 8 | 57.1% |
| Federal Government Employees | 3 | 21.4% |
| Unpaid Family Workers | 0 | 0.0% |
| Total | 14 | 100.0% |
Employment Status by Age in Manley Hot Springs
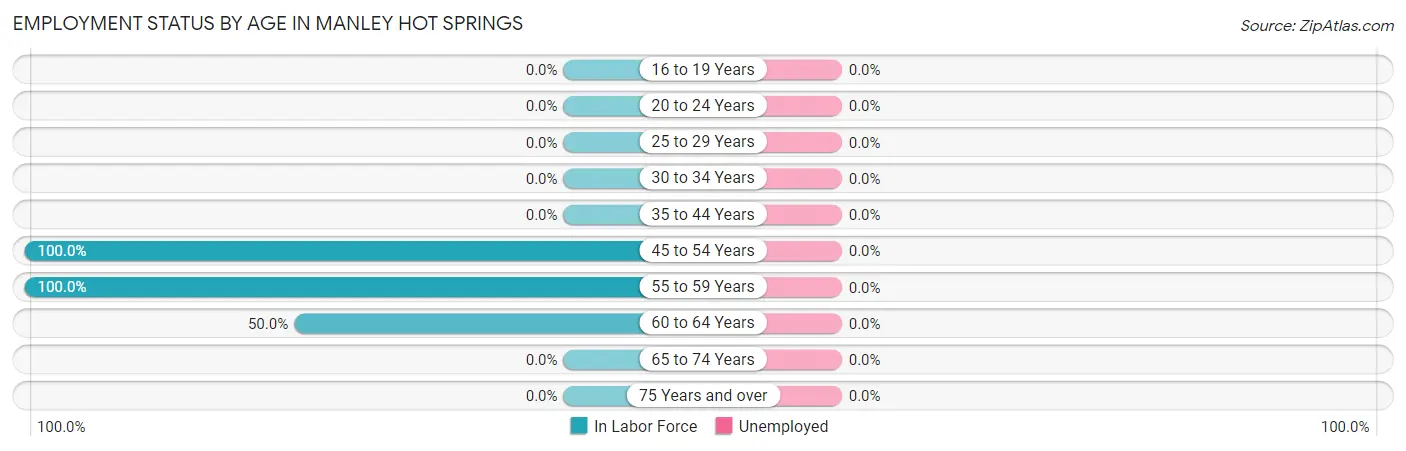
| Age Bracket | In Labor Force | Unemployed |
| 16 to 19 Years | 0 (0.0%) | 0 (0.0%) |
| 20 to 24 Years | 0 (0.0%) | 0 (0.0%) |
| 25 to 29 Years | 0 (0.0%) | 0 (0.0%) |
| 30 to 34 Years | 0 (0.0%) | 0 (0.0%) |
| 35 to 44 Years | 0 (0.0%) | 0 (0.0%) |
| 45 to 54 Years | 8 (100.0%) | 0 (0.0%) |
| 55 to 59 Years | 3 (100.0%) | 0 (0.0%) |
| 60 to 64 Years | 3 (50.0%) | 0 (0.0%) |
| 65 to 74 Years | 0 (0.0%) | 0 (0.0%) |
| 75 Years and over | 0 (0.0%) | 0 (0.0%) |
| Total | 14 (82.4%) | 0 (0.0%) |
Employment Status by Educational Attainment in Manley Hot Springs
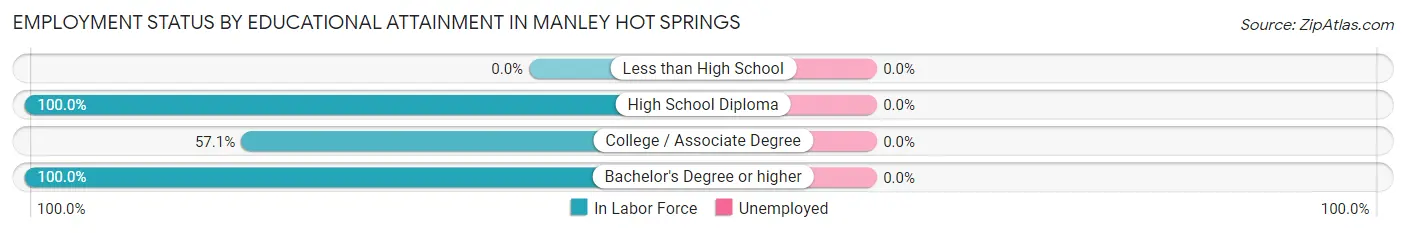
| Educational Attainment | In Labor Force | Unemployed |
| Less than High School | 0 (0.0%) | 0 (0.0%) |
| High School Diploma | 2 (100.0%) | 0 (0.0%) |
| College / Associate Degree | 4 (57.1%) | 0 (0.0%) |
| Bachelor's Degree or higher | 8 (100.0%) | 0 (0.0%) |
| Total | 14 (82.4%) | 0 (0.0%) |
Employment Occupations by Sex in Manley Hot Springs
Management, Business, Science and Arts Occupations
The most common Management, Business, Science and Arts occupations in Manley Hot Springs are Community & Social Service (8 | 57.1%), Education Instruction & Library (8 | 57.1%), and Management (5 | 35.7%).
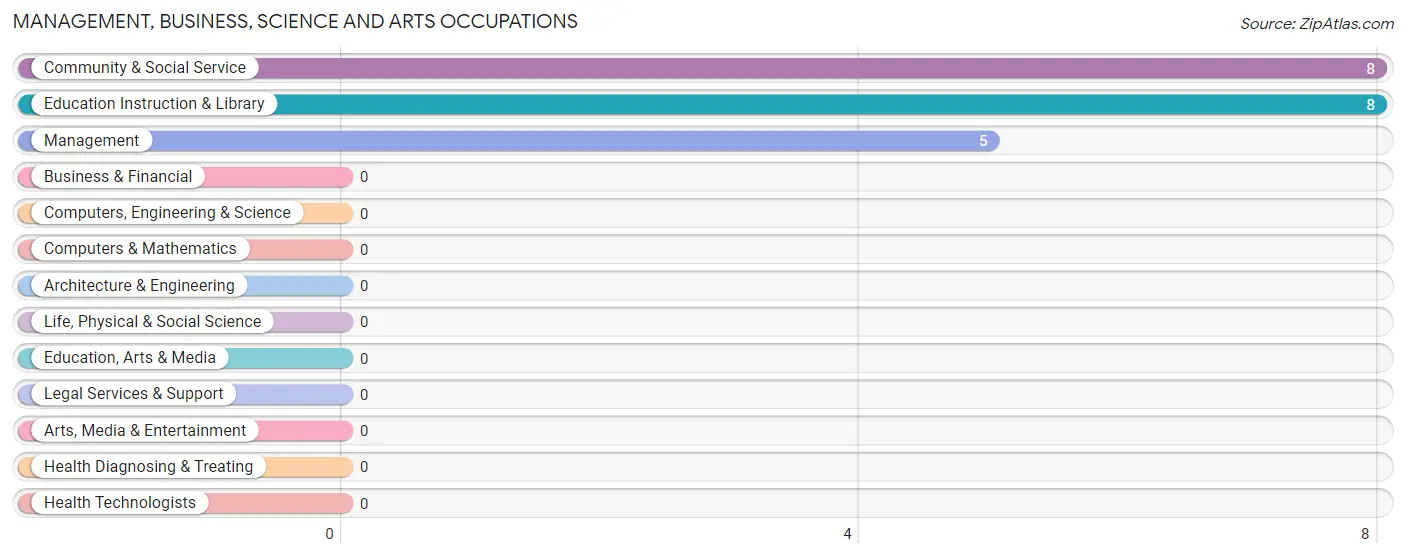
Management, Business, Science and Arts Occupations by Sex
Within the Management, Business, Science and Arts occupations in Manley Hot Springs, the most male-oriented occupations are Community & Social Service (37.5%), and Education Instruction & Library (37.5%), while the most female-oriented occupations are Management (100.0%), Community & Social Service (62.5%), and Education Instruction & Library (62.5%).
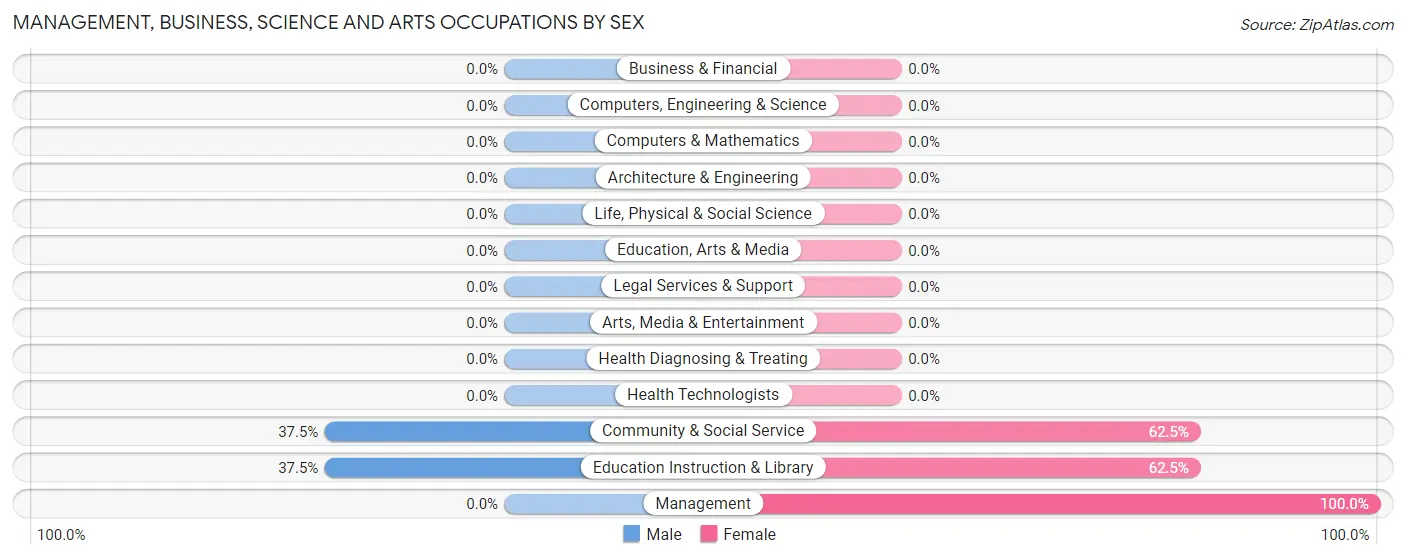
| Occupation | Male | Female |
| Management | 0 (0.0%) | 5 (100.0%) |
| Business & Financial | 0 (0.0%) | 0 (0.0%) |
| Computers, Engineering & Science | 0 (0.0%) | 0 (0.0%) |
| Computers & Mathematics | 0 (0.0%) | 0 (0.0%) |
| Architecture & Engineering | 0 (0.0%) | 0 (0.0%) |
| Life, Physical & Social Science | 0 (0.0%) | 0 (0.0%) |
| Community & Social Service | 3 (37.5%) | 5 (62.5%) |
| Education, Arts & Media | 0 (0.0%) | 0 (0.0%) |
| Legal Services & Support | 0 (0.0%) | 0 (0.0%) |
| Education Instruction & Library | 3 (37.5%) | 5 (62.5%) |
| Arts, Media & Entertainment | 0 (0.0%) | 0 (0.0%) |
| Health Diagnosing & Treating | 0 (0.0%) | 0 (0.0%) |
| Health Technologists | 0 (0.0%) | 0 (0.0%) |
| Total (Category) | 3 (23.1%) | 10 (76.9%) |
| Total (Overall) | 4 (28.6%) | 10 (71.4%) |
Services Occupations
Services Occupations by Sex
| Occupation | Male | Female |
| Healthcare Support | 0 (0.0%) | 0 (0.0%) |
| Security & Protection | 0 (0.0%) | 0 (0.0%) |
| Firefighting & Prevention | 0 (0.0%) | 0 (0.0%) |
| Law Enforcement | 0 (0.0%) | 0 (0.0%) |
| Food Preparation & Serving | 0 (0.0%) | 0 (0.0%) |
| Cleaning & Maintenance | 0 (0.0%) | 0 (0.0%) |
| Personal Care & Service | 0 (0.0%) | 0 (0.0%) |
| Total (Category) | 0 (0.0%) | 0 (0.0%) |
| Total (Overall) | 4 (28.6%) | 10 (71.4%) |
Sales and Office Occupations
The most common Sales and Office occupations in Manley Hot Springs are , and Office & Administration (1 | 7.1%).
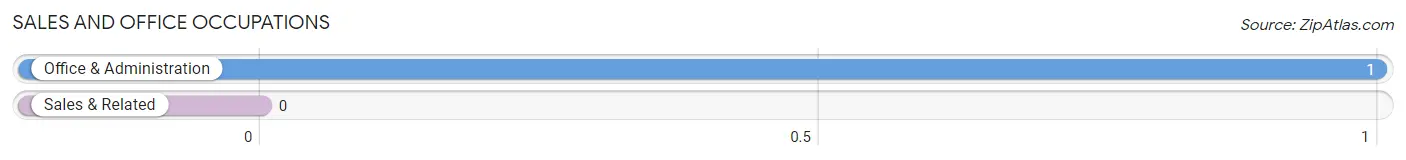
Sales and Office Occupations by Sex
| Occupation | Male | Female |
| Sales & Related | 0 (0.0%) | 0 (0.0%) |
| Office & Administration | 1 (100.0%) | 0 (0.0%) |
| Total (Category) | 1 (100.0%) | 0 (0.0%) |
| Total (Overall) | 4 (28.6%) | 10 (71.4%) |
Natural Resources, Construction and Maintenance Occupations
Natural Resources, Construction and Maintenance Occupations by Sex
| Occupation | Male | Female |
| Farming, Fishing & Forestry | 0 (0.0%) | 0 (0.0%) |
| Construction & Extraction | 0 (0.0%) | 0 (0.0%) |
| Installation, Maintenance & Repair | 0 (0.0%) | 0 (0.0%) |
| Total (Category) | 0 (0.0%) | 0 (0.0%) |
| Total (Overall) | 4 (28.6%) | 10 (71.4%) |
Production, Transportation and Moving Occupations
Production, Transportation and Moving Occupations by Sex
| Occupation | Male | Female |
| Production | 0 (0.0%) | 0 (0.0%) |
| Transportation | 0 (0.0%) | 0 (0.0%) |
| Material Moving | 0 (0.0%) | 0 (0.0%) |
| Total (Category) | 0 (0.0%) | 0 (0.0%) |
| Total (Overall) | 4 (28.6%) | 10 (71.4%) |
Employment Industries by Sex in Manley Hot Springs
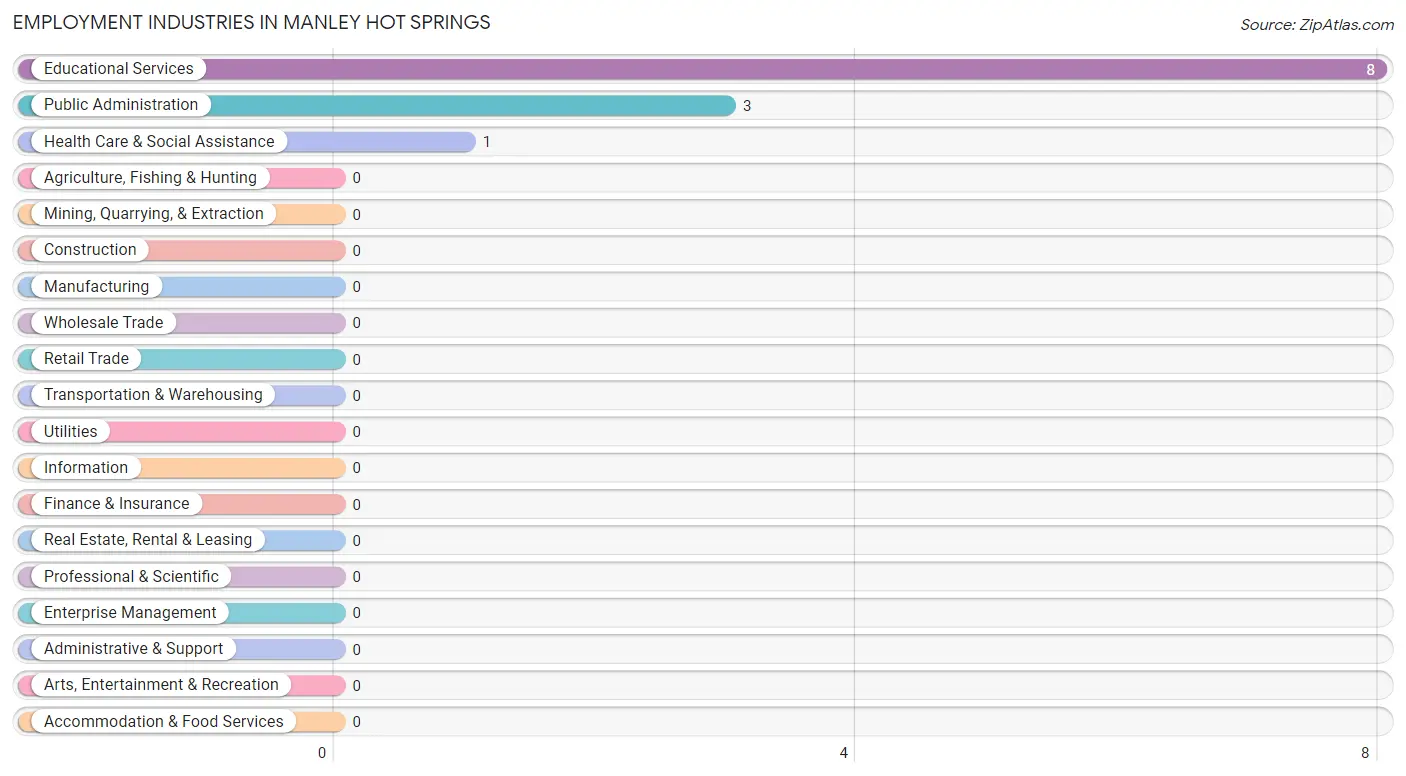
Employment Industries in Manley Hot Springs
The major employment industries in Manley Hot Springs include Educational Services (8 | 57.1%), Public Administration (3 | 21.4%), and Health Care & Social Assistance (1 | 7.1%).
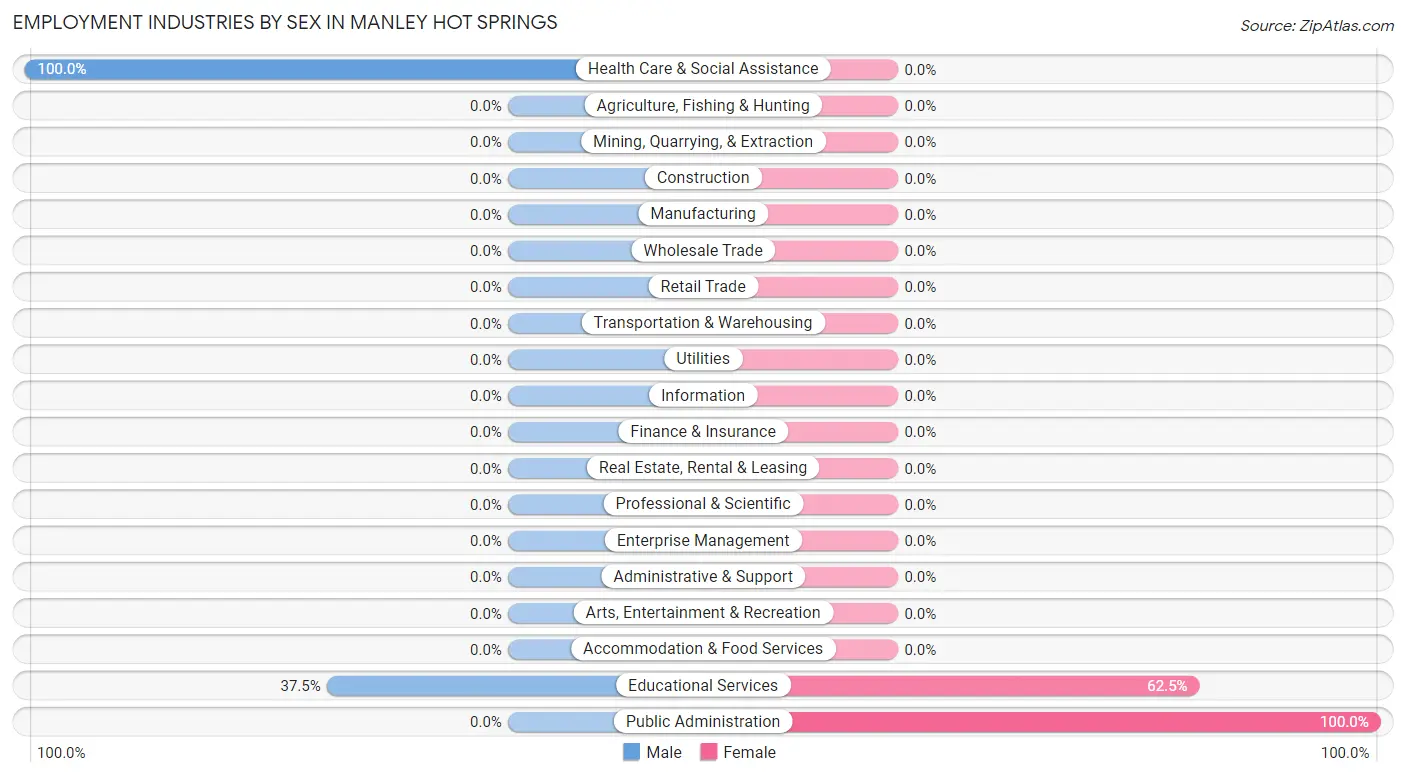
Employment Industries by Sex in Manley Hot Springs
The Manley Hot Springs industries that see more men than women are Health Care & Social Assistance (100.0%), and Educational Services (37.5%), whereas the industries that tend to have a higher number of women are Public Administration (100.0%), and Educational Services (62.5%).
| Industry | Male | Female |
| Agriculture, Fishing & Hunting | 0 (0.0%) | 0 (0.0%) |
| Mining, Quarrying, & Extraction | 0 (0.0%) | 0 (0.0%) |
| Construction | 0 (0.0%) | 0 (0.0%) |
| Manufacturing | 0 (0.0%) | 0 (0.0%) |
| Wholesale Trade | 0 (0.0%) | 0 (0.0%) |
| Retail Trade | 0 (0.0%) | 0 (0.0%) |
| Transportation & Warehousing | 0 (0.0%) | 0 (0.0%) |
| Utilities | 0 (0.0%) | 0 (0.0%) |
| Information | 0 (0.0%) | 0 (0.0%) |
| Finance & Insurance | 0 (0.0%) | 0 (0.0%) |
| Real Estate, Rental & Leasing | 0 (0.0%) | 0 (0.0%) |
| Professional & Scientific | 0 (0.0%) | 0 (0.0%) |
| Enterprise Management | 0 (0.0%) | 0 (0.0%) |
| Administrative & Support | 0 (0.0%) | 0 (0.0%) |
| Educational Services | 3 (37.5%) | 5 (62.5%) |
| Health Care & Social Assistance | 1 (100.0%) | 0 (0.0%) |
| Arts, Entertainment & Recreation | 0 (0.0%) | 0 (0.0%) |
| Accommodation & Food Services | 0 (0.0%) | 0 (0.0%) |
| Public Administration | 0 (0.0%) | 3 (100.0%) |
| Total | 4 (28.6%) | 10 (71.4%) |
Education in Manley Hot Springs
School Enrollment in Manley Hot Springs
| School Level | # Students | % Students |
| Nursery / Preschool | 0 | 0.0% |
| Kindergarten | 0 | 0.0% |
| Elementary School | 0 | 0.0% |
| Middle School | 0 | 0.0% |
| High School | 0 | 0.0% |
| College / Undergraduate | 0 | 0.0% |
| Graduate / Professional | 0 | 0.0% |
| Total | 0 | 0.0% |
School Enrollment by Age by Funding Source in Manley Hot Springs
| Age Bracket | Public School | Private School |
| 3 to 4 Year Olds | 0 (0.0%) | 0 (0.0%) |
| 5 to 9 Year Old | 0 (0.0%) | 0 (0.0%) |
| 10 to 14 Year Olds | 0 (0.0%) | 0 (0.0%) |
| 15 to 17 Year Olds | 0 (0.0%) | 0 (0.0%) |
| 18 to 19 Year Olds | 0 (0.0%) | 0 (0.0%) |
| 20 to 24 Year Olds | 0 (0.0%) | 0 (0.0%) |
| 25 to 34 Year Olds | 0 (0.0%) | 0 (0.0%) |
| 35 Years and over | 0 (0.0%) | 0 (0.0%) |
| Total | 0 (0.0%) | 0 (0.0%) |
Educational Attainment by Field of Study in Manley Hot Springs
Literature & languages (5 | 38.5%), visual & performing arts (5 | 38.5%), and education (3 | 23.1%) are the most common fields of study among 13 individuals in Manley Hot Springs who have obtained a bachelor's degree or higher.
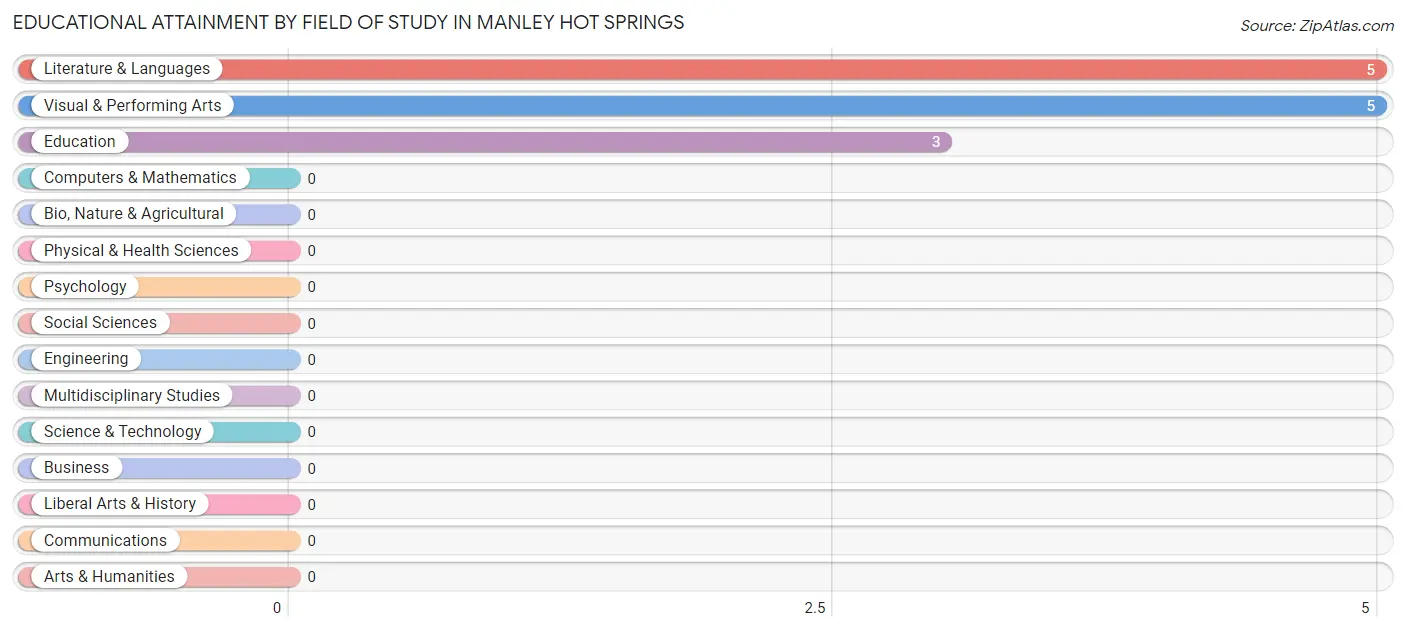
| Field of Study | # Graduates | % Graduates |
| Computers & Mathematics | 0 | 0.0% |
| Bio, Nature & Agricultural | 0 | 0.0% |
| Physical & Health Sciences | 0 | 0.0% |
| Psychology | 0 | 0.0% |
| Social Sciences | 0 | 0.0% |
| Engineering | 0 | 0.0% |
| Multidisciplinary Studies | 0 | 0.0% |
| Science & Technology | 0 | 0.0% |
| Business | 0 | 0.0% |
| Education | 3 | 23.1% |
| Literature & Languages | 5 | 38.5% |
| Liberal Arts & History | 0 | 0.0% |
| Visual & Performing Arts | 5 | 38.5% |
| Communications | 0 | 0.0% |
| Arts & Humanities | 0 | 0.0% |
| Total | 13 | 100.0% |
Transportation & Commute in Manley Hot Springs
Vehicle Availability by Sex in Manley Hot Springs
The most prevalent vehicle ownership categories in Manley Hot Springs are males with 2 vehicles (3, accounting for 75.0%) and females with 2 vehicles (5, making up 30.0%).
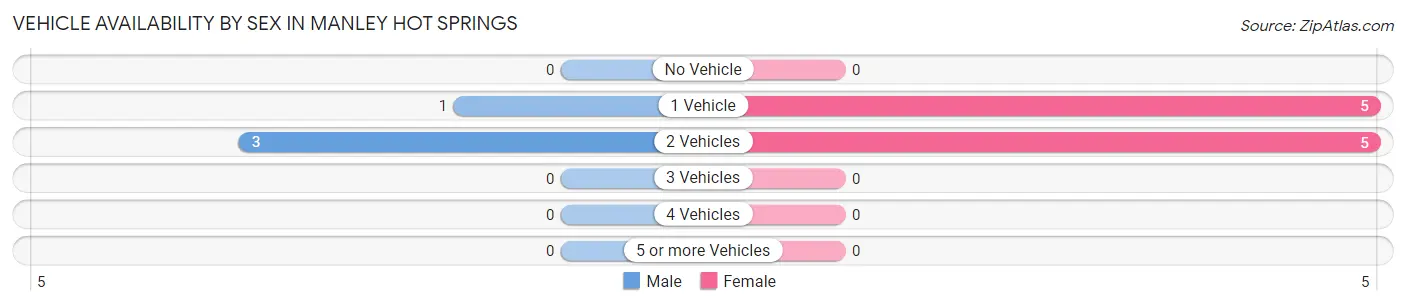
| Vehicles Available | Male | Female |
| No Vehicle | 0 (0.0%) | 0 (0.0%) |
| 1 Vehicle | 1 (25.0%) | 5 (50.0%) |
| 2 Vehicles | 3 (75.0%) | 5 (50.0%) |
| 3 Vehicles | 0 (0.0%) | 0 (0.0%) |
| 4 Vehicles | 0 (0.0%) | 0 (0.0%) |
| 5 or more Vehicles | 0 (0.0%) | 0 (0.0%) |
| Total | 4 (100.0%) | 10 (100.0%) |
Commute Time in Manley Hot Springs
The most frequently occuring commute durations in Manley Hot Springs are less than 5 minutes (12 commuters, 85.7%), 5 to 9 minutes (2 commuters, 14.3%), and 10 to 14 minutes (0 commuters, 0.0%).
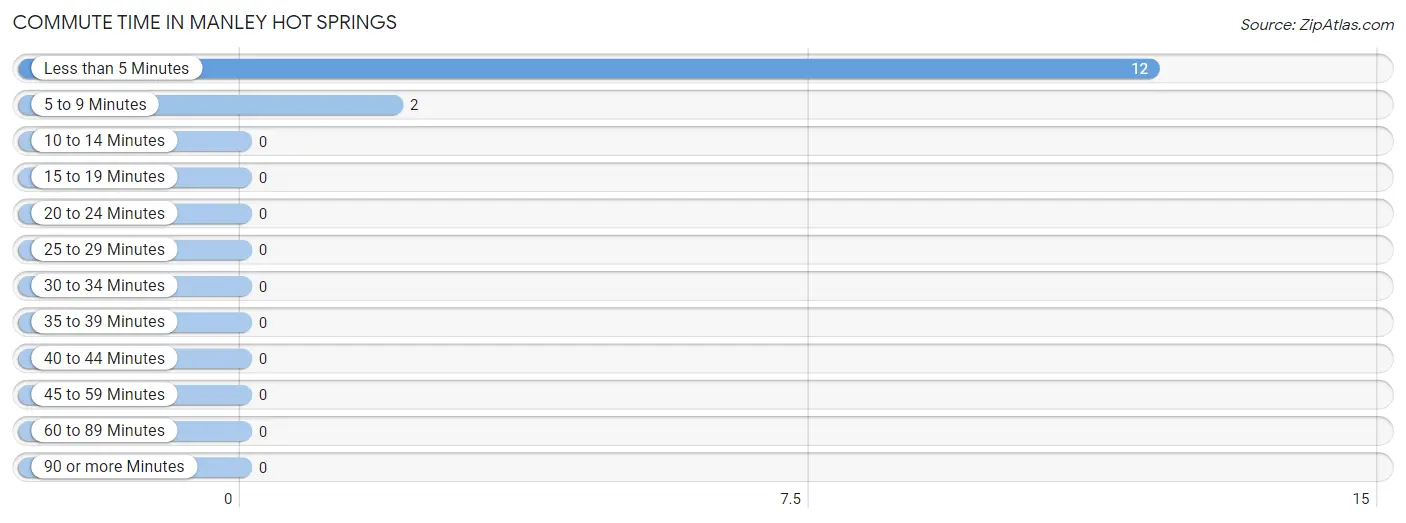
| Commute Time | # Commuters | % Commuters |
| Less than 5 Minutes | 12 | 85.7% |
| 5 to 9 Minutes | 2 | 14.3% |
| 10 to 14 Minutes | 0 | 0.0% |
| 15 to 19 Minutes | 0 | 0.0% |
| 20 to 24 Minutes | 0 | 0.0% |
| 25 to 29 Minutes | 0 | 0.0% |
| 30 to 34 Minutes | 0 | 0.0% |
| 35 to 39 Minutes | 0 | 0.0% |
| 40 to 44 Minutes | 0 | 0.0% |
| 45 to 59 Minutes | 0 | 0.0% |
| 60 to 89 Minutes | 0 | 0.0% |
| 90 or more Minutes | 0 | 0.0% |
Commute Time by Sex in Manley Hot Springs
The most common commute times in Manley Hot Springs are less than 5 minutes (4 commuters, 100.0%) for males and less than 5 minutes (8 commuters, 80.0%) for females.
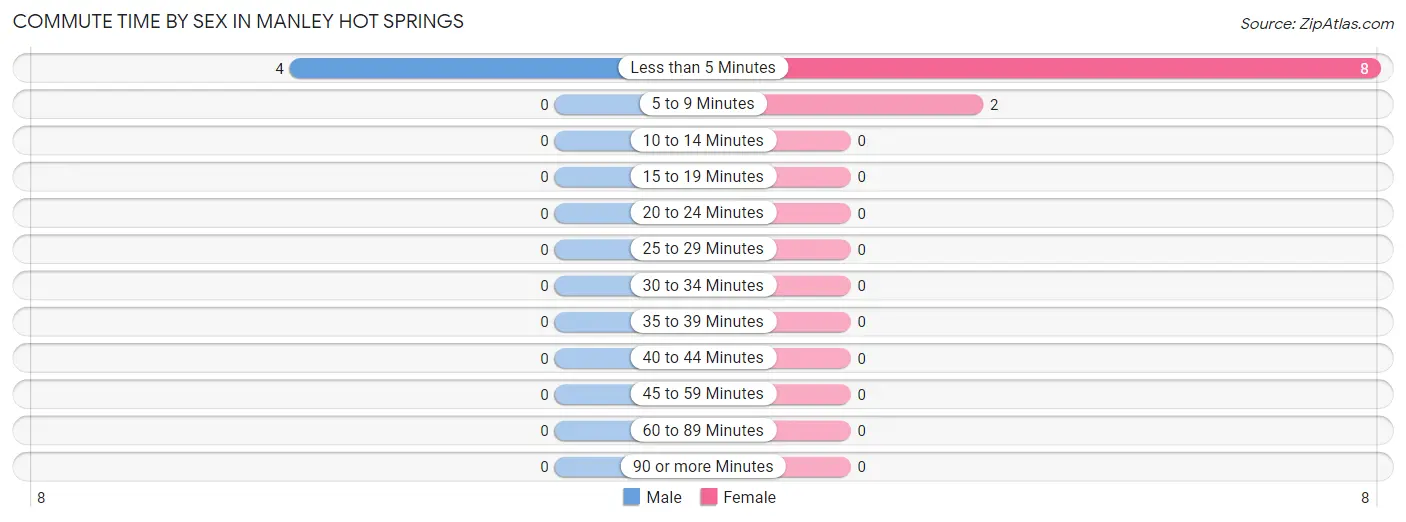
| Commute Time | Male | Female |
| Less than 5 Minutes | 4 (100.0%) | 8 (80.0%) |
| 5 to 9 Minutes | 0 (0.0%) | 2 (20.0%) |
| 10 to 14 Minutes | 0 (0.0%) | 0 (0.0%) |
| 15 to 19 Minutes | 0 (0.0%) | 0 (0.0%) |
| 20 to 24 Minutes | 0 (0.0%) | 0 (0.0%) |
| 25 to 29 Minutes | 0 (0.0%) | 0 (0.0%) |
| 30 to 34 Minutes | 0 (0.0%) | 0 (0.0%) |
| 35 to 39 Minutes | 0 (0.0%) | 0 (0.0%) |
| 40 to 44 Minutes | 0 (0.0%) | 0 (0.0%) |
| 45 to 59 Minutes | 0 (0.0%) | 0 (0.0%) |
| 60 to 89 Minutes | 0 (0.0%) | 0 (0.0%) |
| 90 or more Minutes | 0 (0.0%) | 0 (0.0%) |
Time of Departure to Work by Sex in Manley Hot Springs
The most frequent times of departure to work in Manley Hot Springs are 7:30 AM to 7:59 AM (4, 100.0%) for males and 7:30 AM to 7:59 AM (5, 50.0%) for females.
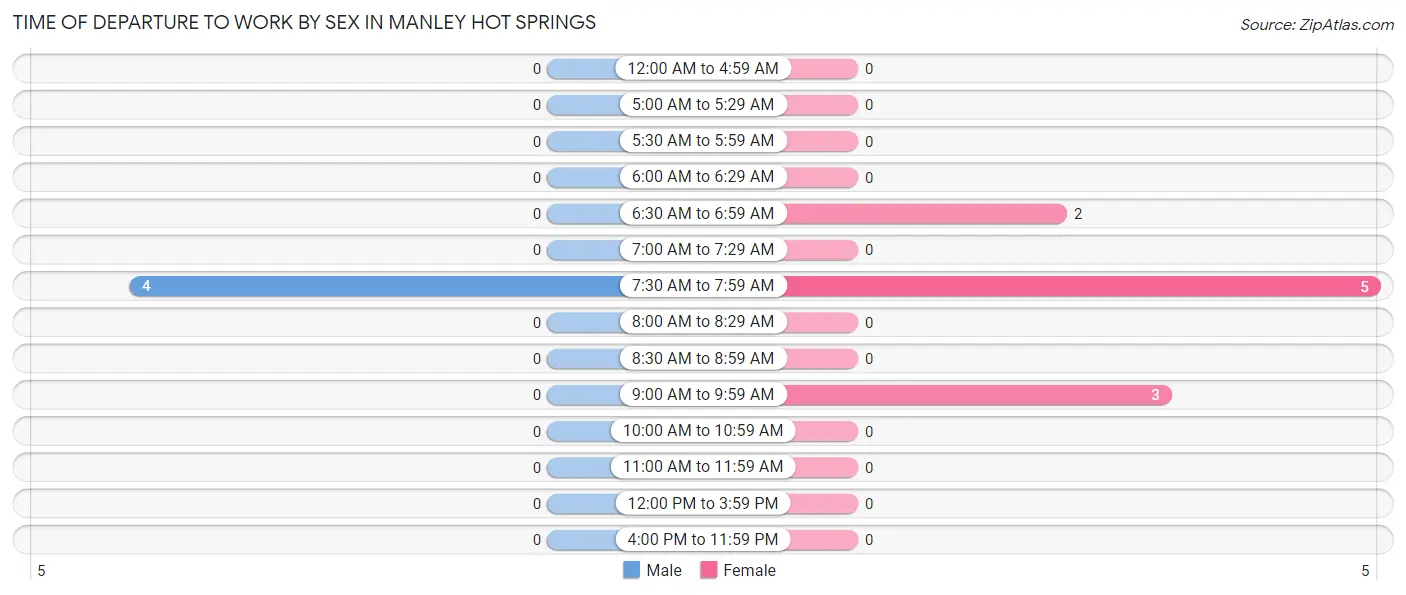
| Time of Departure | Male | Female |
| 12:00 AM to 4:59 AM | 0 (0.0%) | 0 (0.0%) |
| 5:00 AM to 5:29 AM | 0 (0.0%) | 0 (0.0%) |
| 5:30 AM to 5:59 AM | 0 (0.0%) | 0 (0.0%) |
| 6:00 AM to 6:29 AM | 0 (0.0%) | 0 (0.0%) |
| 6:30 AM to 6:59 AM | 0 (0.0%) | 2 (20.0%) |
| 7:00 AM to 7:29 AM | 0 (0.0%) | 0 (0.0%) |
| 7:30 AM to 7:59 AM | 4 (100.0%) | 5 (50.0%) |
| 8:00 AM to 8:29 AM | 0 (0.0%) | 0 (0.0%) |
| 8:30 AM to 8:59 AM | 0 (0.0%) | 0 (0.0%) |
| 9:00 AM to 9:59 AM | 0 (0.0%) | 3 (30.0%) |
| 10:00 AM to 10:59 AM | 0 (0.0%) | 0 (0.0%) |
| 11:00 AM to 11:59 AM | 0 (0.0%) | 0 (0.0%) |
| 12:00 PM to 3:59 PM | 0 (0.0%) | 0 (0.0%) |
| 4:00 PM to 11:59 PM | 0 (0.0%) | 0 (0.0%) |
| Total | 4 (100.0%) | 10 (100.0%) |
Housing Occupancy in Manley Hot Springs
Occupancy by Ownership in Manley Hot Springs
Of the total 12 dwellings in Manley Hot Springs, owner-occupied units account for 6 (50.0%), while renter-occupied units make up 6 (50.0%).
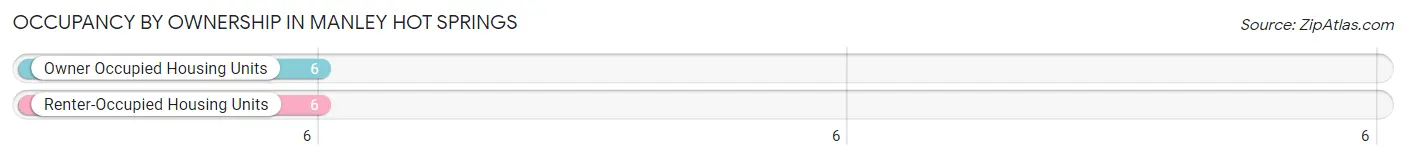
| Occupancy | # Housing Units | % Housing Units |
| Owner Occupied Housing Units | 6 | 50.0% |
| Renter-Occupied Housing Units | 6 | 50.0% |
| Total Occupied Housing Units | 12 | 100.0% |
Occupancy by Household Size in Manley Hot Springs
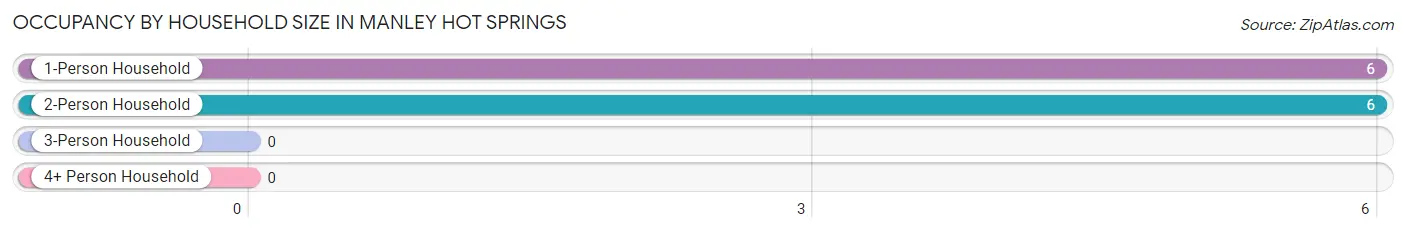
| Household Size | # Housing Units | % Housing Units |
| 1-Person Household | 6 | 50.0% |
| 2-Person Household | 6 | 50.0% |
| 3-Person Household | 0 | 0.0% |
| 4+ Person Household | 0 | 0.0% |
| Total Housing Units | 12 | 100.0% |
Occupancy by Ownership by Household Size in Manley Hot Springs
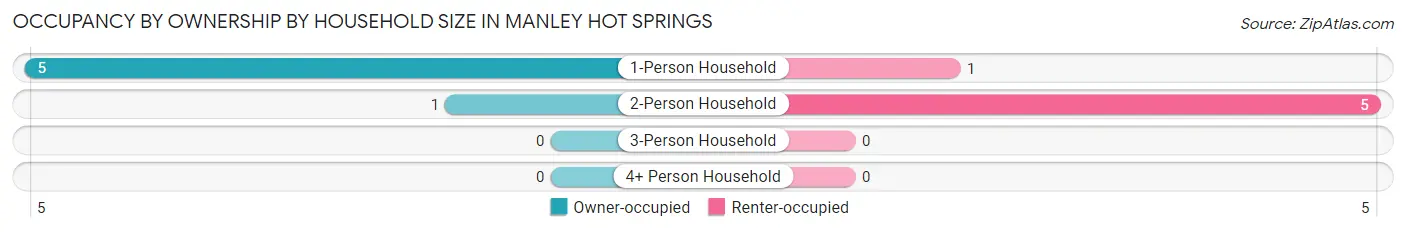
| Household Size | Owner-occupied | Renter-occupied |
| 1-Person Household | 5 (83.3%) | 1 (16.7%) |
| 2-Person Household | 1 (16.7%) | 5 (83.3%) |
| 3-Person Household | 0 (0.0%) | 0 (0.0%) |
| 4+ Person Household | 0 (0.0%) | 0 (0.0%) |
| Total Housing Units | 6 (50.0%) | 6 (50.0%) |
Occupancy by Educational Attainment in Manley Hot Springs
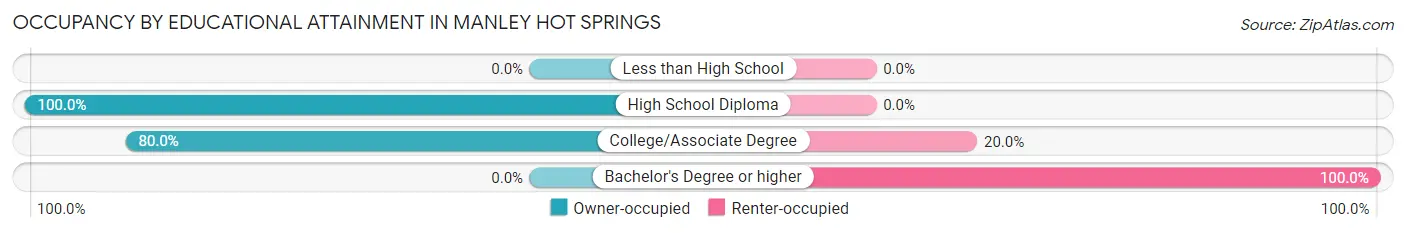
| Household Size | Owner-occupied | Renter-occupied |
| Less than High School | 0 (0.0%) | 0 (0.0%) |
| High School Diploma | 2 (100.0%) | 0 (0.0%) |
| College/Associate Degree | 4 (80.0%) | 1 (20.0%) |
| Bachelor's Degree or higher | 0 (0.0%) | 5 (100.0%) |
Occupancy by Age of Householder in Manley Hot Springs
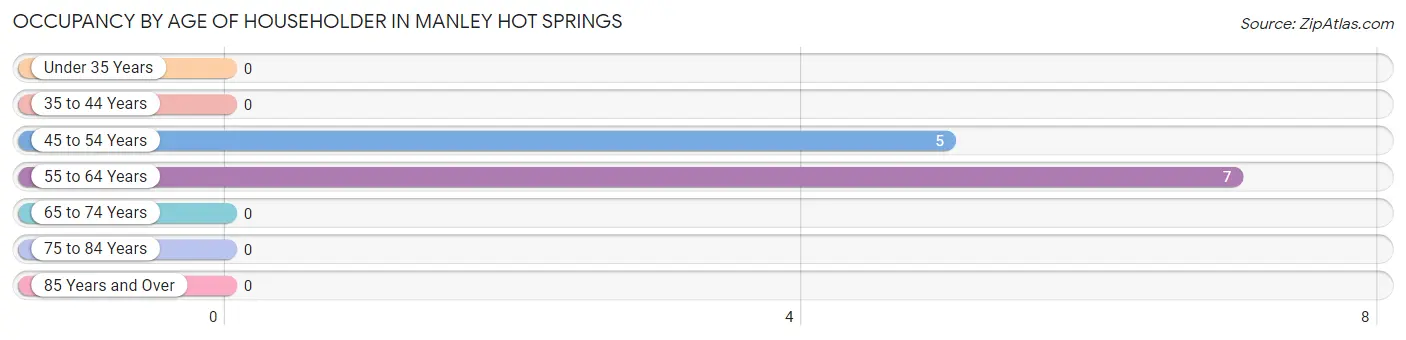
| Age Bracket | # Households | % Households |
| Under 35 Years | 0 | 0.0% |
| 35 to 44 Years | 0 | 0.0% |
| 45 to 54 Years | 5 | 41.7% |
| 55 to 64 Years | 7 | 58.3% |
| 65 to 74 Years | 0 | 0.0% |
| 75 to 84 Years | 0 | 0.0% |
| 85 Years and Over | 0 | 0.0% |
| Total | 12 | 100.0% |
Housing Finances in Manley Hot Springs
Median Income by Occupancy in Manley Hot Springs
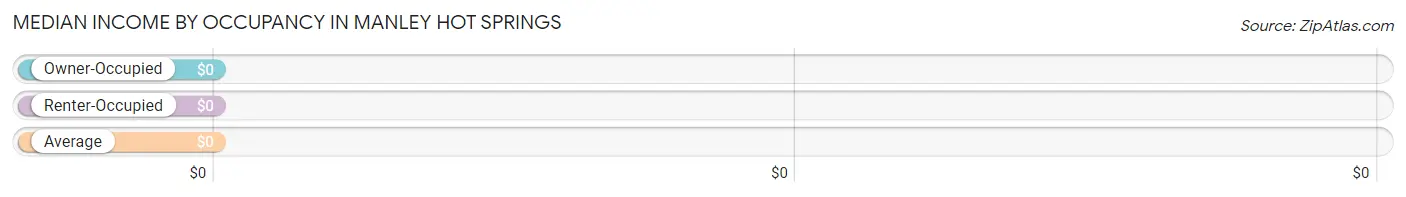
| Occupancy Type | # Households | Median Income |
| Owner-Occupied | 6 (50.0%) | $0 |
| Renter-Occupied | 6 (50.0%) | $0 |
| Average | 12 (100.0%) | $0 |
Occupancy by Householder Income Bracket in Manley Hot Springs
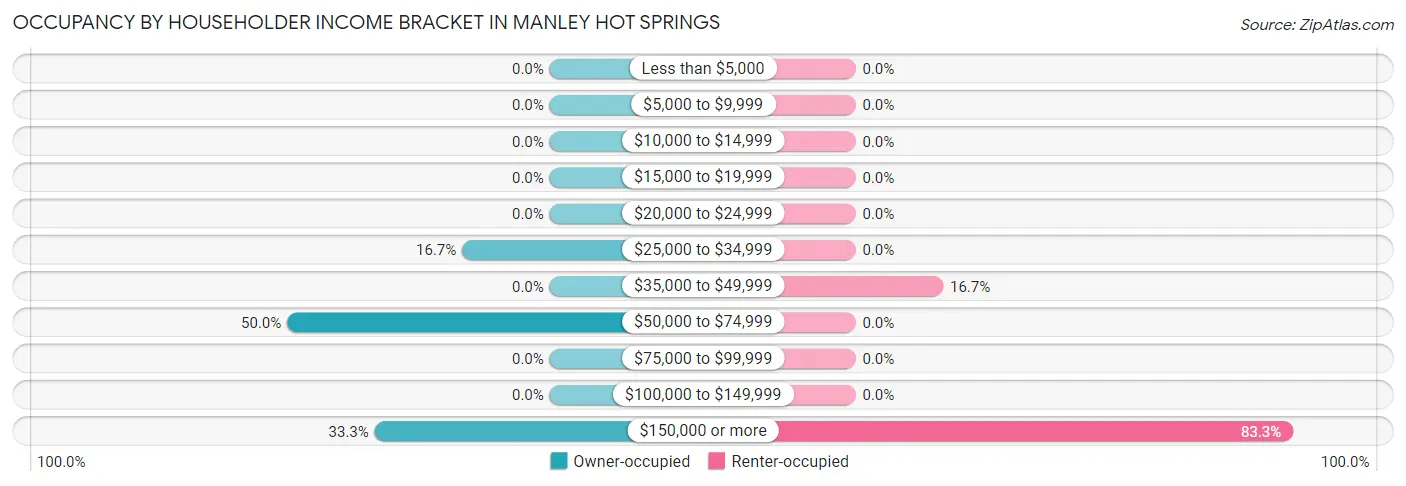
| Income Bracket | Owner-occupied | Renter-occupied |
| Less than $5,000 | 0 (0.0%) | 0 (0.0%) |
| $5,000 to $9,999 | 0 (0.0%) | 0 (0.0%) |
| $10,000 to $14,999 | 0 (0.0%) | 0 (0.0%) |
| $15,000 to $19,999 | 0 (0.0%) | 0 (0.0%) |
| $20,000 to $24,999 | 0 (0.0%) | 0 (0.0%) |
| $25,000 to $34,999 | 1 (16.7%) | 0 (0.0%) |
| $35,000 to $49,999 | 0 (0.0%) | 1 (16.7%) |
| $50,000 to $74,999 | 3 (50.0%) | 0 (0.0%) |
| $75,000 to $99,999 | 0 (0.0%) | 0 (0.0%) |
| $100,000 to $149,999 | 0 (0.0%) | 0 (0.0%) |
| $150,000 or more | 2 (33.3%) | 5 (83.3%) |
| Total | 6 (100.0%) | 6 (100.0%) |
Monthly Housing Cost Tiers in Manley Hot Springs
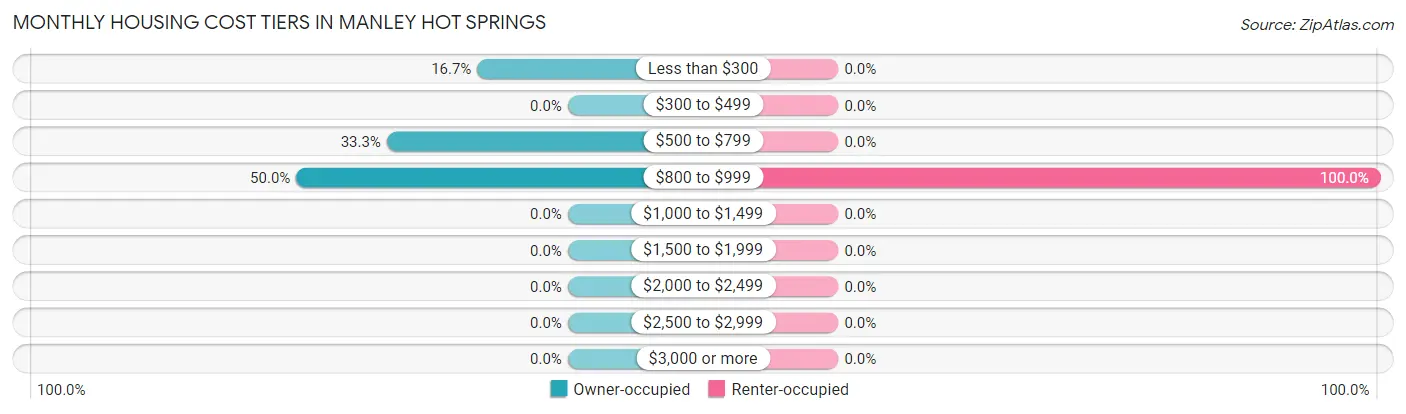
| Monthly Cost | Owner-occupied | Renter-occupied |
| Less than $300 | 1 (16.7%) | 0 (0.0%) |
| $300 to $499 | 0 (0.0%) | 0 (0.0%) |
| $500 to $799 | 2 (33.3%) | 0 (0.0%) |
| $800 to $999 | 3 (50.0%) | 6 (100.0%) |
| $1,000 to $1,499 | 0 (0.0%) | 0 (0.0%) |
| $1,500 to $1,999 | 0 (0.0%) | 0 (0.0%) |
| $2,000 to $2,499 | 0 (0.0%) | 0 (0.0%) |
| $2,500 to $2,999 | 0 (0.0%) | 0 (0.0%) |
| $3,000 or more | 0 (0.0%) | 0 (0.0%) |
| Total | 6 (100.0%) | 6 (100.0%) |
Physical Housing Characteristics in Manley Hot Springs
Housing Structures in Manley Hot Springs
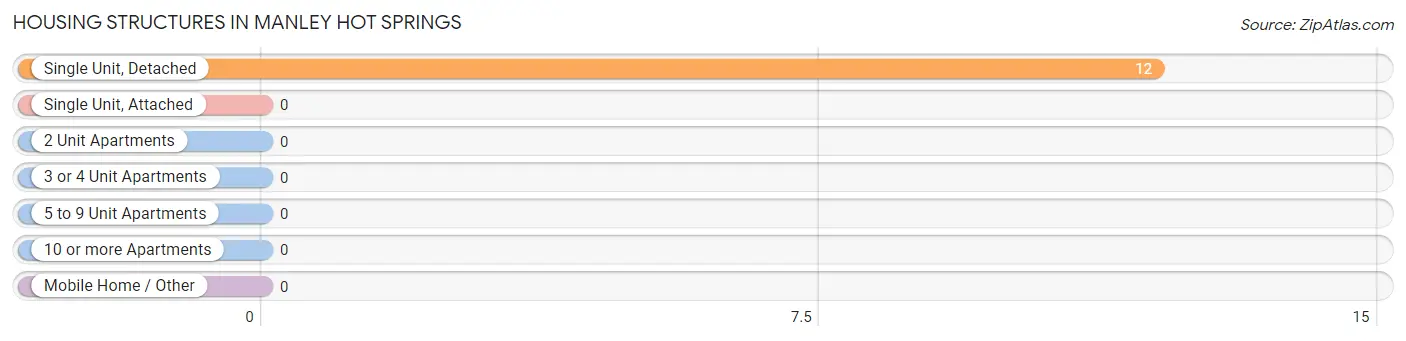
| Structure Type | # Housing Units | % Housing Units |
| Single Unit, Detached | 12 | 100.0% |
| Single Unit, Attached | 0 | 0.0% |
| 2 Unit Apartments | 0 | 0.0% |
| 3 or 4 Unit Apartments | 0 | 0.0% |
| 5 to 9 Unit Apartments | 0 | 0.0% |
| 10 or more Apartments | 0 | 0.0% |
| Mobile Home / Other | 0 | 0.0% |
| Total | 12 | 100.0% |
Housing Structures by Occupancy in Manley Hot Springs
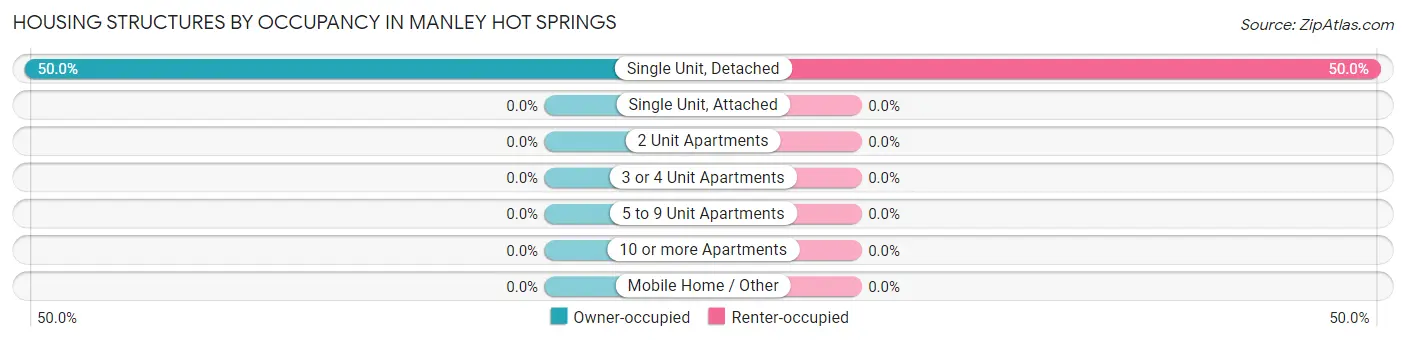
| Structure Type | Owner-occupied | Renter-occupied |
| Single Unit, Detached | 6 (50.0%) | 6 (50.0%) |
| Single Unit, Attached | 0 (0.0%) | 0 (0.0%) |
| 2 Unit Apartments | 0 (0.0%) | 0 (0.0%) |
| 3 or 4 Unit Apartments | 0 (0.0%) | 0 (0.0%) |
| 5 to 9 Unit Apartments | 0 (0.0%) | 0 (0.0%) |
| 10 or more Apartments | 0 (0.0%) | 0 (0.0%) |
| Mobile Home / Other | 0 (0.0%) | 0 (0.0%) |
| Total | 6 (50.0%) | 6 (50.0%) |
Housing Structures by Number of Rooms in Manley Hot Springs
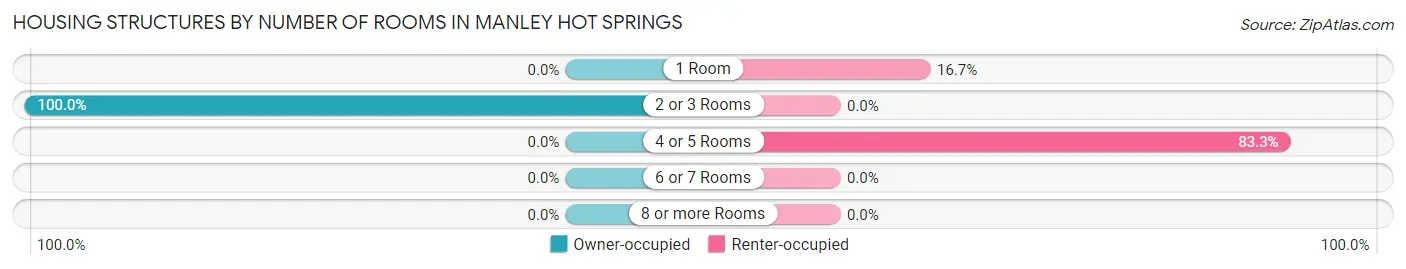
| Number of Rooms | Owner-occupied | Renter-occupied |
| 1 Room | 0 (0.0%) | 1 (16.7%) |
| 2 or 3 Rooms | 6 (100.0%) | 0 (0.0%) |
| 4 or 5 Rooms | 0 (0.0%) | 5 (83.3%) |
| 6 or 7 Rooms | 0 (0.0%) | 0 (0.0%) |
| 8 or more Rooms | 0 (0.0%) | 0 (0.0%) |
| Total | 6 (100.0%) | 6 (100.0%) |
Housing Structure by Heating Type in Manley Hot Springs
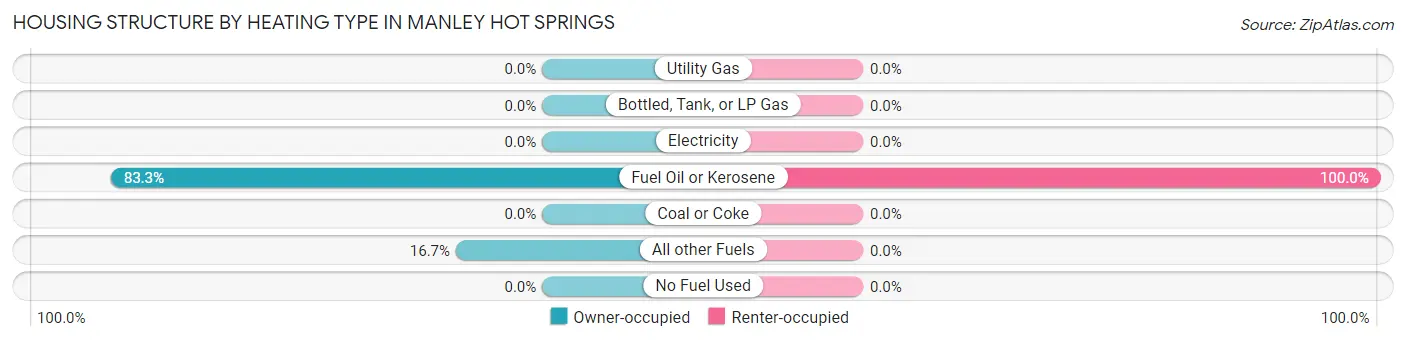
| Heating Type | Owner-occupied | Renter-occupied |
| Utility Gas | 0 (0.0%) | 0 (0.0%) |
| Bottled, Tank, or LP Gas | 0 (0.0%) | 0 (0.0%) |
| Electricity | 0 (0.0%) | 0 (0.0%) |
| Fuel Oil or Kerosene | 5 (83.3%) | 6 (100.0%) |
| Coal or Coke | 0 (0.0%) | 0 (0.0%) |
| All other Fuels | 1 (16.7%) | 0 (0.0%) |
| No Fuel Used | 0 (0.0%) | 0 (0.0%) |
| Total | 6 (100.0%) | 6 (100.0%) |
Household Vehicle Usage in Manley Hot Springs
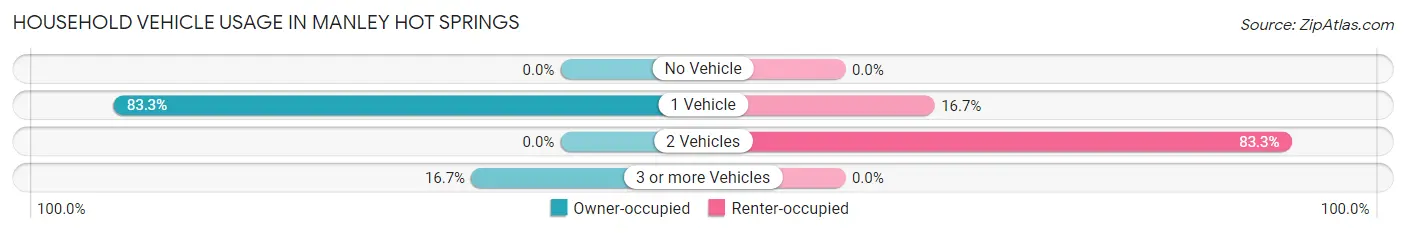
| Vehicles per Household | Owner-occupied | Renter-occupied |
| No Vehicle | 0 (0.0%) | 0 (0.0%) |
| 1 Vehicle | 5 (83.3%) | 1 (16.7%) |
| 2 Vehicles | 0 (0.0%) | 5 (83.3%) |
| 3 or more Vehicles | 1 (16.7%) | 0 (0.0%) |
| Total | 6 (100.0%) | 6 (100.0%) |
Real Estate & Mortgages in Manley Hot Springs
Real Estate and Mortgage Overview in Manley Hot Springs
| Characteristic | Without Mortgage | With Mortgage |
| Housing Units | 3 | 3 |
| Median Property Value | - | - |
| Median Household Income | - | - |
| Monthly Housing Costs | - | - |
| Real Estate Taxes | - | - |
Property Value by Mortgage Status in Manley Hot Springs
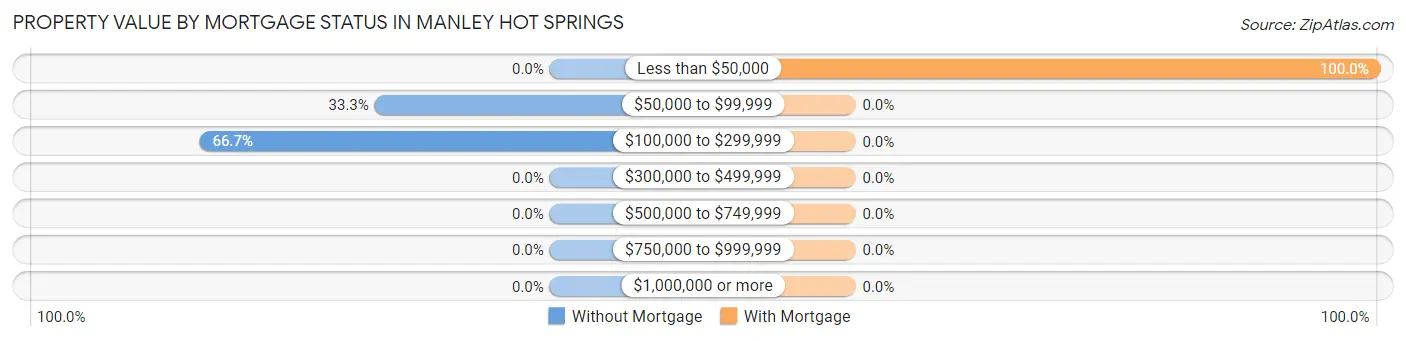
| Property Value | Without Mortgage | With Mortgage |
| Less than $50,000 | 0 (0.0%) | 3 (100.0%) |
| $50,000 to $99,999 | 1 (33.3%) | 0 (0.0%) |
| $100,000 to $299,999 | 2 (66.7%) | 0 (0.0%) |
| $300,000 to $499,999 | 0 (0.0%) | 0 (0.0%) |
| $500,000 to $749,999 | 0 (0.0%) | 0 (0.0%) |
| $750,000 to $999,999 | 0 (0.0%) | 0 (0.0%) |
| $1,000,000 or more | 0 (0.0%) | 0 (0.0%) |
| Total | 3 (100.0%) | 3 (100.0%) |
Household Income by Mortgage Status in Manley Hot Springs
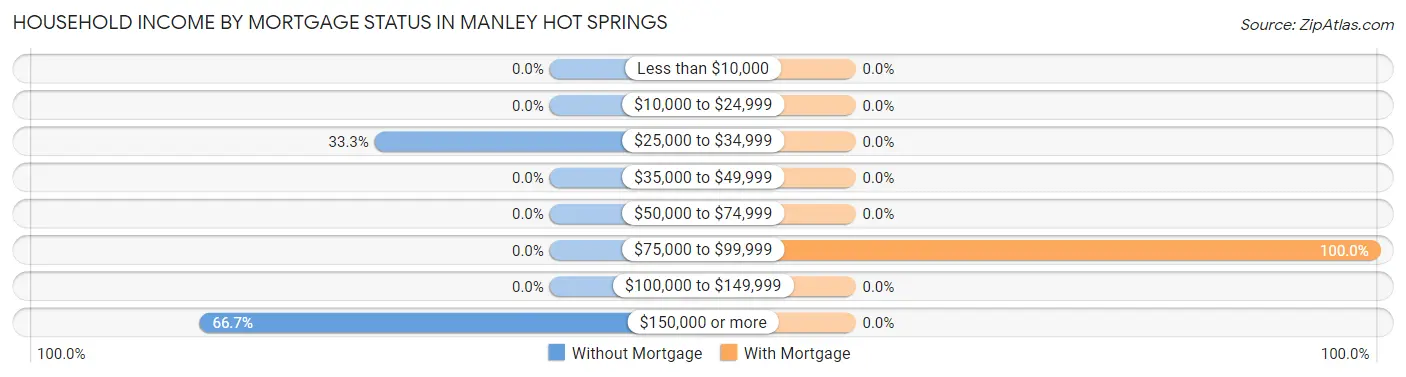
| Household Income | Without Mortgage | With Mortgage |
| Less than $10,000 | 0 (0.0%) | 0 (0.0%) |
| $10,000 to $24,999 | 0 (0.0%) | 0 (0.0%) |
| $25,000 to $34,999 | 1 (33.3%) | 0 (0.0%) |
| $35,000 to $49,999 | 0 (0.0%) | 0 (0.0%) |
| $50,000 to $74,999 | 0 (0.0%) | 0 (0.0%) |
| $75,000 to $99,999 | 0 (0.0%) | 3 (100.0%) |
| $100,000 to $149,999 | 0 (0.0%) | 0 (0.0%) |
| $150,000 or more | 2 (66.7%) | 0 (0.0%) |
| Total | 3 (100.0%) | 3 (100.0%) |
Property Value to Household Income Ratio in Manley Hot Springs
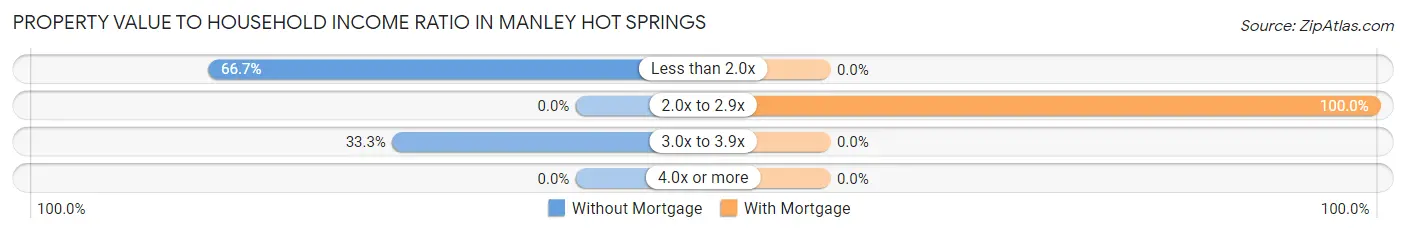
| Value-to-Income Ratio | Without Mortgage | With Mortgage |
| Less than 2.0x | 2 (66.7%) | 0 (0.0%) |
| 2.0x to 2.9x | 0 (0.0%) | 3 (100.0%) |
| 3.0x to 3.9x | 1 (33.3%) | 0 (0.0%) |
| 4.0x or more | 0 (0.0%) | 0 (0.0%) |
| Total | 3 (100.0%) | 3 (100.0%) |
Real Estate Taxes by Mortgage Status in Manley Hot Springs
| Property Taxes | Without Mortgage | With Mortgage |
| Less than $800 | 0 (0.0%) | 0 (0.0%) |
| $800 to $1,499 | 0 (0.0%) | 0 (0.0%) |
| $800 to $1,499 | 0 (0.0%) | 0 (0.0%) |
| Total | 3 (100.0%) | 3 (100.0%) |
Health & Disability in Manley Hot Springs
Health Insurance Coverage by Age in Manley Hot Springs
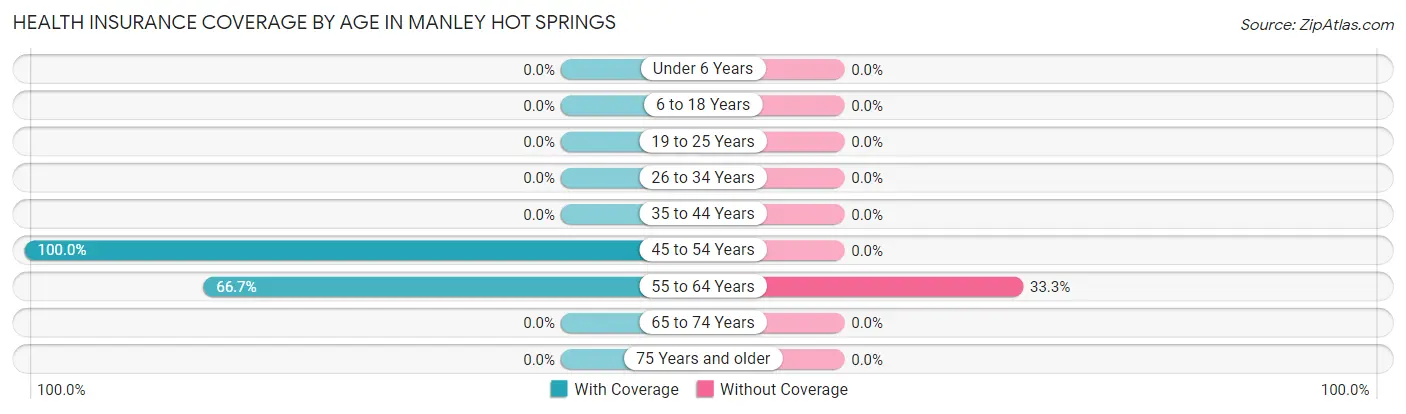
| Age Bracket | With Coverage | Without Coverage |
| Under 6 Years | 0 (0.0%) | 0 (0.0%) |
| 6 to 18 Years | 0 (0.0%) | 0 (0.0%) |
| 19 to 25 Years | 0 (0.0%) | 0 (0.0%) |
| 26 to 34 Years | 0 (0.0%) | 0 (0.0%) |
| 35 to 44 Years | 0 (0.0%) | 0 (0.0%) |
| 45 to 54 Years | 8 (100.0%) | 0 (0.0%) |
| 55 to 64 Years | 6 (66.7%) | 3 (33.3%) |
| 65 to 74 Years | 0 (0.0%) | 0 (0.0%) |
| 75 Years and older | 0 (0.0%) | 0 (0.0%) |
| Total | 14 (82.4%) | 3 (17.6%) |
Health Insurance Coverage by Citizenship Status in Manley Hot Springs
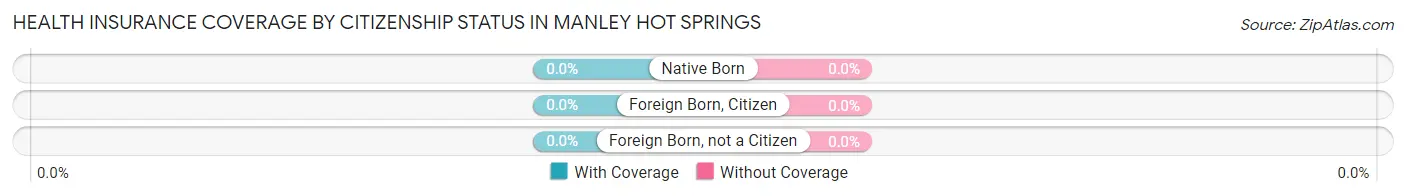
| Citizenship Status | With Coverage | Without Coverage |
| Native Born | 0 (0.0%) | 0 (0.0%) |
| Foreign Born, Citizen | 0 (0.0%) | 0 (0.0%) |
| Foreign Born, not a Citizen | 0 (0.0%) | 0 (0.0%) |
Health Insurance Coverage by Household Income in Manley Hot Springs
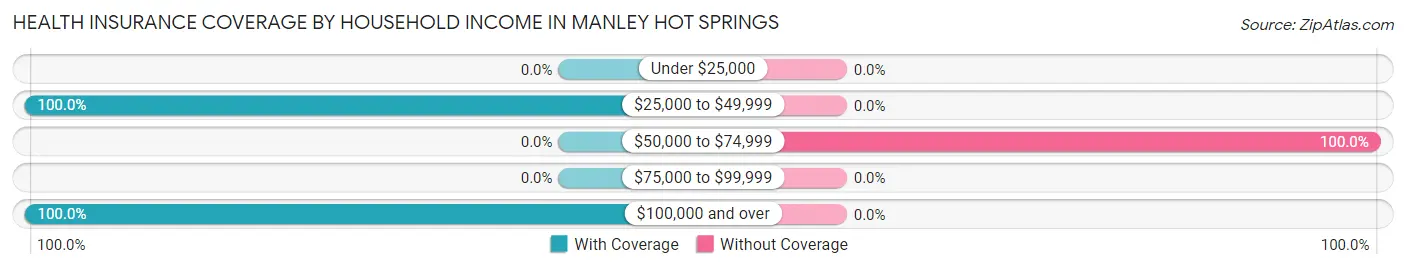
| Household Income | With Coverage | Without Coverage |
| Under $25,000 | 0 (0.0%) | 0 (0.0%) |
| $25,000 to $49,999 | 4 (100.0%) | 0 (0.0%) |
| $50,000 to $74,999 | 0 (0.0%) | 3 (100.0%) |
| $75,000 to $99,999 | 0 (0.0%) | 0 (0.0%) |
| $100,000 and over | 10 (100.0%) | 0 (0.0%) |
Public vs Private Health Insurance Coverage by Age in Manley Hot Springs
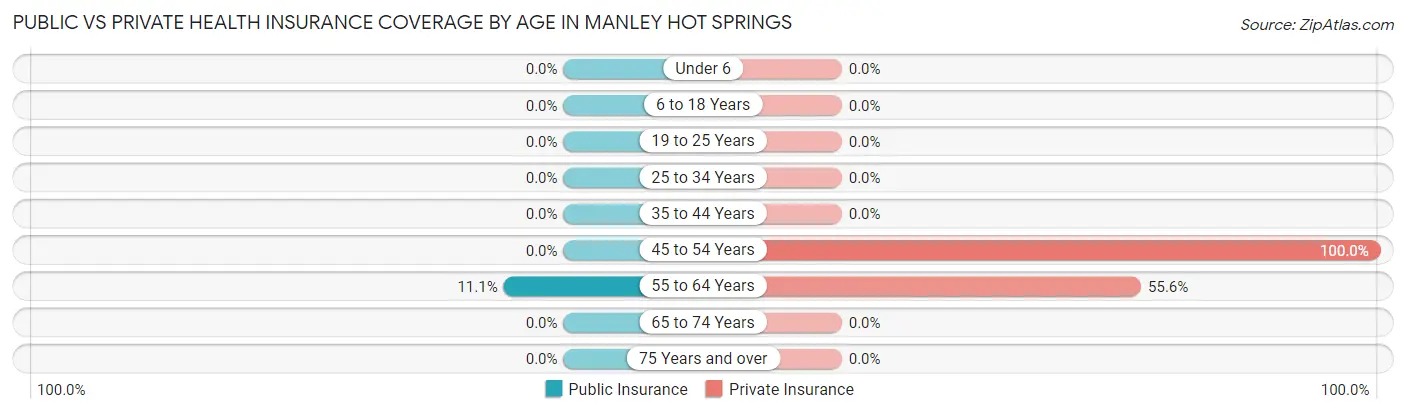
| Age Bracket | Public Insurance | Private Insurance |
| Under 6 | 0 (0.0%) | 0 (0.0%) |
| 6 to 18 Years | 0 (0.0%) | 0 (0.0%) |
| 19 to 25 Years | 0 (0.0%) | 0 (0.0%) |
| 25 to 34 Years | 0 (0.0%) | 0 (0.0%) |
| 35 to 44 Years | 0 (0.0%) | 0 (0.0%) |
| 45 to 54 Years | 0 (0.0%) | 8 (100.0%) |
| 55 to 64 Years | 1 (11.1%) | 5 (55.6%) |
| 65 to 74 Years | 0 (0.0%) | 0 (0.0%) |
| 75 Years and over | 0 (0.0%) | 0 (0.0%) |
| Total | 1 (5.9%) | 13 (76.5%) |
Disability Status by Sex by Age in Manley Hot Springs
| Age Bracket | Male | Female |
| Under 5 Years | 0 (0.0%) | 0 (0.0%) |
| 5 to 17 Years | 0 (0.0%) | 0 (0.0%) |
| 18 to 34 Years | 0 (0.0%) | 0 (0.0%) |
| 35 to 64 Years | 0 (0.0%) | 0 (0.0%) |
| 65 to 74 Years | 0 (0.0%) | 0 (0.0%) |
| 75 Years and over | 0 (0.0%) | 0 (0.0%) |
Disability Class by Sex by Age in Manley Hot Springs
Disability Class: Hearing Difficulty
| Age Bracket | Male | Female |
| Under 5 Years | 0 (0.0%) | 0 (0.0%) |
| 5 to 17 Years | 0 (0.0%) | 0 (0.0%) |
| 18 to 34 Years | 0 (0.0%) | 0 (0.0%) |
| 35 to 64 Years | 0 (0.0%) | 0 (0.0%) |
| 65 to 74 Years | 0 (0.0%) | 0 (0.0%) |
| 75 Years and over | 0 (0.0%) | 0 (0.0%) |
Disability Class: Vision Difficulty
| Age Bracket | Male | Female |
| Under 5 Years | 0 (0.0%) | 0 (0.0%) |
| 5 to 17 Years | 0 (0.0%) | 0 (0.0%) |
| 18 to 34 Years | 0 (0.0%) | 0 (0.0%) |
| 35 to 64 Years | 0 (0.0%) | 0 (0.0%) |
| 65 to 74 Years | 0 (0.0%) | 0 (0.0%) |
| 75 Years and over | 0 (0.0%) | 0 (0.0%) |
Disability Class: Cognitive Difficulty

| Age Bracket | Male | Female |
| 5 to 17 Years | 0 (0.0%) | 0 (0.0%) |
| 18 to 34 Years | 0 (0.0%) | 0 (0.0%) |
| 35 to 64 Years | 0 (0.0%) | 0 (0.0%) |
| 65 to 74 Years | 0 (0.0%) | 0 (0.0%) |
| 75 Years and over | 0 (0.0%) | 0 (0.0%) |
Disability Class: Ambulatory Difficulty
| Age Bracket | Male | Female |
| 5 to 17 Years | 0 (0.0%) | 0 (0.0%) |
| 18 to 34 Years | 0 (0.0%) | 0 (0.0%) |
| 35 to 64 Years | 0 (0.0%) | 0 (0.0%) |
| 65 to 74 Years | 0 (0.0%) | 0 (0.0%) |
| 75 Years and over | 0 (0.0%) | 0 (0.0%) |
Disability Class: Self-Care Difficulty
| Age Bracket | Male | Female |
| 5 to 17 Years | 0 (0.0%) | 0 (0.0%) |
| 18 to 34 Years | 0 (0.0%) | 0 (0.0%) |
| 35 to 64 Years | 0 (0.0%) | 0 (0.0%) |
| 65 to 74 Years | 0 (0.0%) | 0 (0.0%) |
| 75 Years and over | 0 (0.0%) | 0 (0.0%) |
Technology Access in Manley Hot Springs
Computing Device Access in Manley Hot Springs
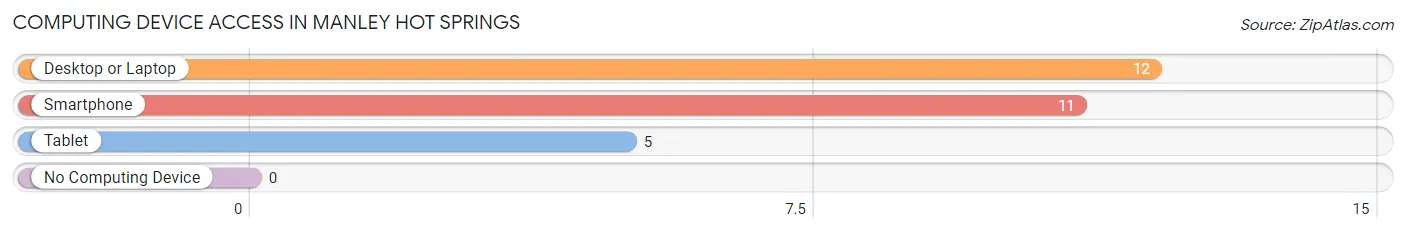
| Device Type | # Households | % Households |
| Desktop or Laptop | 12 | 100.0% |
| Smartphone | 11 | 91.7% |
| Tablet | 5 | 41.7% |
| No Computing Device | 0 | 0.0% |
| Total | 12 | 100.0% |
Internet Access in Manley Hot Springs
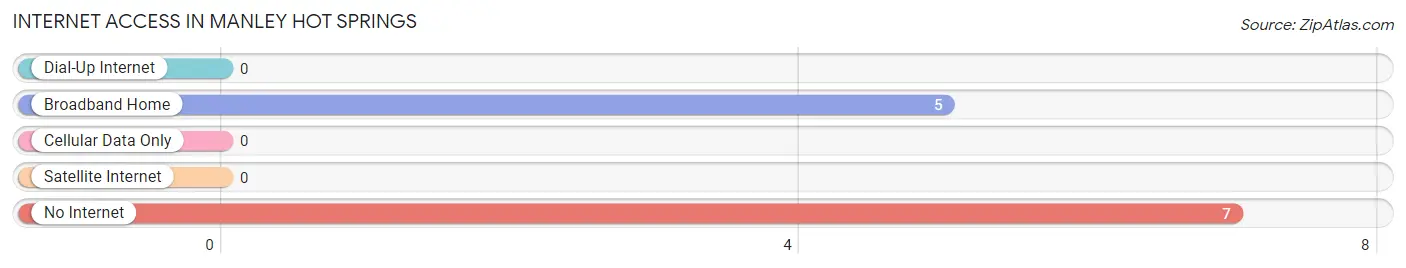
| Internet Type | # Households | % Households |
| Dial-Up Internet | 0 | 0.0% |
| Broadband Home | 5 | 41.7% |
| Cellular Data Only | 0 | 0.0% |
| Satellite Internet | 0 | 0.0% |
| No Internet | 7 | 58.3% |
| Total | 12 | 100.0% |
Manley Hot Springs Summary
Manley Hot Springs is a small unincorporated community located in the Yukon-Koyukuk Census Area of Alaska. It is situated on the south bank of the Yukon River, approximately 100 miles northwest of Fairbanks. The community is named after the hot springs located nearby, which were discovered by prospector John Manley in 1902.
History
The area around Manley Hot Springs has been inhabited for thousands of years by the Koyukon Athabascan people. The first non-native settlers arrived in the area in the late 19th century, drawn by the promise of gold. The first permanent settlement was established in 1902 by prospector John Manley, who discovered the hot springs. The settlement was initially called Hot Springs, but was later renamed Manley Hot Springs in his honor.
In the early 20th century, the community was a popular stopover for travelers on the Yukon River. The first post office was established in 1906, and the first school was built in 1910. The community was connected to the outside world by the Alaska Railroad in 1923.
Geography
Manley Hot Springs is located in the Yukon-Koyukuk Census Area of Alaska, approximately 100 miles northwest of Fairbanks. It is situated on the south bank of the Yukon River, at an elevation of 545 feet. The area is characterized by rolling hills and low mountains, with the White Mountains to the east and the Koyukuk Mountains to the west.
The climate is subarctic, with long, cold winters and short, mild summers. The average temperature in January is -20°F, and the average temperature in July is 65°F. The average annual precipitation is 11 inches.
Economy
The economy of Manley Hot Springs is largely based on subsistence activities, such as hunting, fishing, and trapping. The community is also home to a small tourist industry, with visitors coming to take advantage of the hot springs.
The community is served by the Manley Hot Springs Airport, which has a single gravel runway. There is also a small general store in the community.
Demographics
As of the 2010 census, the population of Manley Hot Springs was 109, with a population density of 0.2 people per square mile. The median age was 37.7 years, and the median household income was $37,500. The racial makeup of the community was 95.4% Native American, 2.8% White, and 1.8% other.
The majority of the population (90.8%) spoke English as their primary language, while 4.6% spoke Koyukon Athabascan and 4.6% spoke Spanish. The majority of the population (90.8%) identified as Christian, while 4.6% identified as non-religious.
Common Questions
What is Per Capita Income in Manley Hot Springs?
Per Capita income in Manley Hot Springs is $81,765.
What is Inequality or Gini Index in Manley Hot Springs?
Inequality or Gini Index in Manley Hot Springs is 0.28.
What is the Total Population of Manley Hot Springs?
Total Population of Manley Hot Springs is 17.
What is the Total Male Population of Manley Hot Springs?
Total Male Population of Manley Hot Springs is 5.
What is the Total Female Population of Manley Hot Springs?
Total Female Population of Manley Hot Springs is 12.
What is the Ratio of Males per 100 Females in Manley Hot Springs?
There are 41.67 Males per 100 Females in Manley Hot Springs.
What is the Ratio of Females per 100 Males in Manley Hot Springs?
There are 240.00 Females per 100 Males in Manley Hot Springs.
What is the Median Population Age in Manley Hot Springs?
Median Population Age in Manley Hot Springs is 55.5 Years.
What is the Average Family Size in Manley Hot Springs
Average Family Size in Manley Hot Springs is 1.8 People.
What is the Average Household Size in Manley Hot Springs
Average Household Size in Manley Hot Springs is 1.4 People.
How Large is the Labor Force in Manley Hot Springs?
There are 14 People in the Labor Forcein in Manley Hot Springs.
What is the Percentage of People in the Labor Force in Manley Hot Springs?
82.4% of People are in the Labor Force in Manley Hot Springs.