Unalakleet, AK Map & Demographics
Unalakleet Map
Unalakleet Overview
$44,740
PER CAPITA INCOME
$96,786
AVG FAMILY INCOME
$84,375
AVG HOUSEHOLD INCOME
13.9%
WAGE / INCOME GAP [ % ]
86.1¢/ $1
WAGE / INCOME GAP [ $ ]
0.41
INEQUALITY / GINI INDEX
743
TOTAL POPULATION
343
MALE POPULATION
400
FEMALE POPULATION
85.75
MALES / 100 FEMALES
116.62
FEMALES / 100 MALES
41.1
MEDIAN AGE
3.1
AVG FAMILY SIZE
3.1
AVG HOUSEHOLD SIZE
426
LABOR FORCE [ PEOPLE ]
75.0%
PERCENT IN LABOR FORCE
7.7%
UNEMPLOYMENT RATE
Unalakleet Zip Codes
Unalakleet Area Codes
Income in Unalakleet
Income Overview in Unalakleet
Per Capita Income in Unalakleet is $44,740, while median incomes of families and households are $96,786 and $84,375 respectively.
| Characteristic | Number | Measure |
| Per Capita Income | 743 | $44,740 |
| Median Family Income | 136 | $96,786 |
| Mean Family Income | 136 | $107,269 |
| Median Household Income | 159 | $84,375 |
| Mean Household Income | 159 | $103,277 |
| Income Deficit | 136 | $0 |
| Wage / Income Gap (%) | 743 | 13.88% |
| Wage / Income Gap ($) | 743 | 86.12¢ per $1 |
| Gini / Inequality Index | 743 | 0.41 |
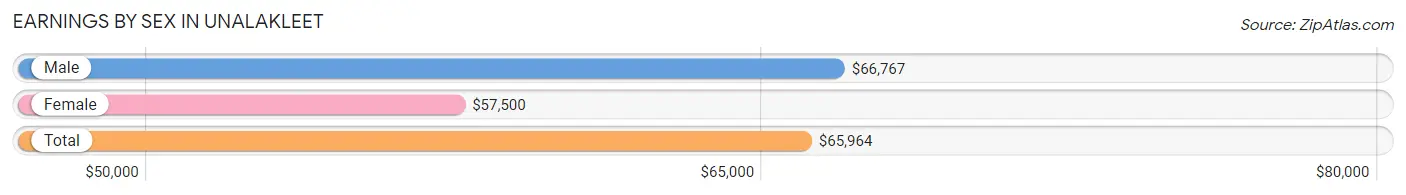
Earnings by Sex in Unalakleet
Average Earnings in Unalakleet are $65,964, $66,767 for men and $57,500 for women, a difference of 13.9%.
| Sex | Number | Average Earnings |
| Male | 231 (49.9%) | $66,767 |
| Female | 232 (50.1%) | $57,500 |
| Total | 463 (100.0%) | $65,964 |
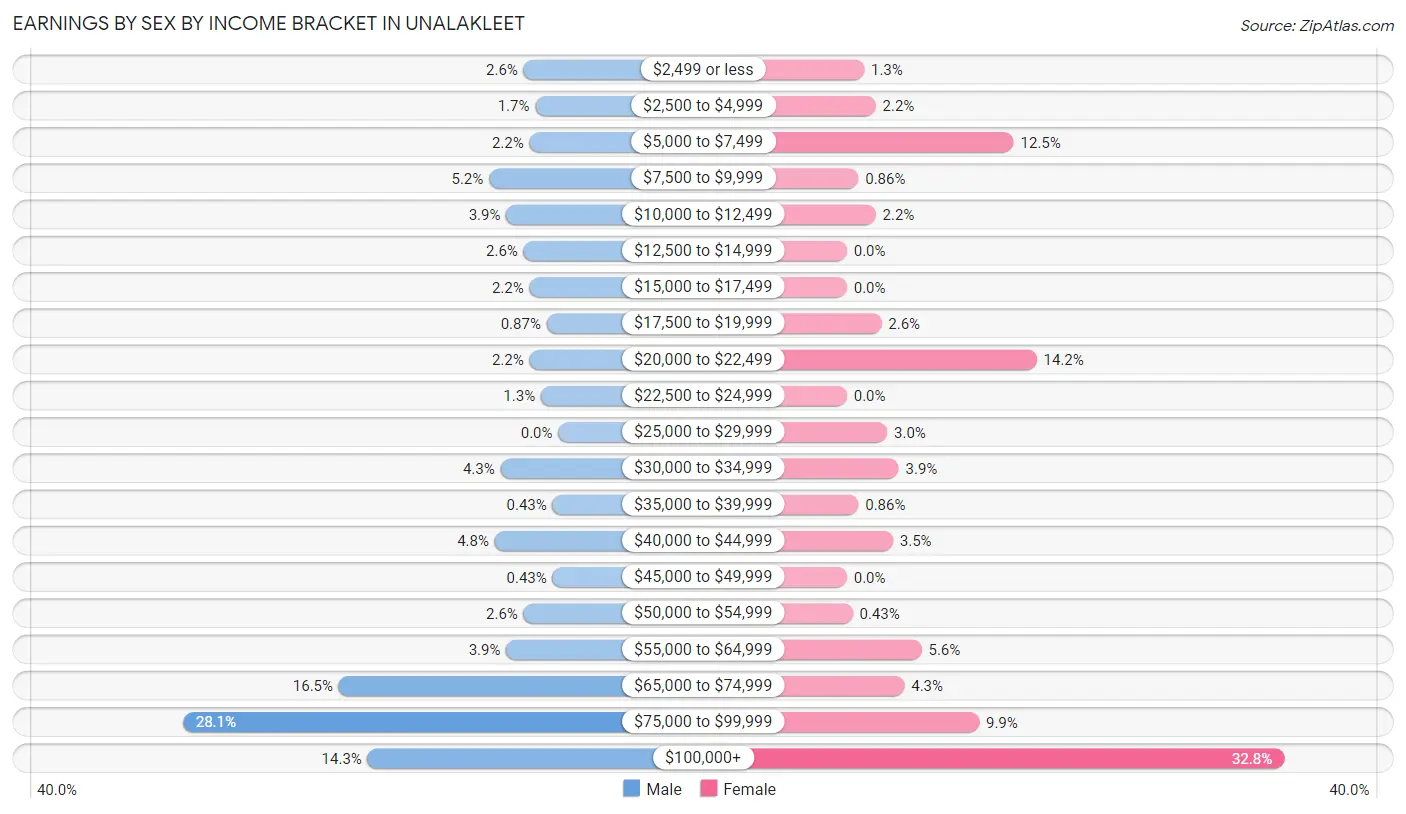
Earnings by Sex by Income Bracket in Unalakleet
The most common earnings brackets in Unalakleet are $75,000 to $99,999 for men (65 | 28.1%) and $100,000+ for women (76 | 32.8%).
| Income | Male | Female |
| $2,499 or less | 6 (2.6%) | 3 (1.3%) |
| $2,500 to $4,999 | 4 (1.7%) | 5 (2.2%) |
| $5,000 to $7,499 | 5 (2.2%) | 29 (12.5%) |
| $7,500 to $9,999 | 12 (5.2%) | 2 (0.9%) |
| $10,000 to $12,499 | 9 (3.9%) | 5 (2.2%) |
| $12,500 to $14,999 | 6 (2.6%) | 0 (0.0%) |
| $15,000 to $17,499 | 5 (2.2%) | 0 (0.0%) |
| $17,500 to $19,999 | 2 (0.9%) | 6 (2.6%) |
| $20,000 to $22,499 | 5 (2.2%) | 33 (14.2%) |
| $22,500 to $24,999 | 3 (1.3%) | 0 (0.0%) |
| $25,000 to $29,999 | 0 (0.0%) | 7 (3.0%) |
| $30,000 to $34,999 | 10 (4.3%) | 9 (3.9%) |
| $35,000 to $39,999 | 1 (0.4%) | 2 (0.9%) |
| $40,000 to $44,999 | 11 (4.8%) | 8 (3.5%) |
| $45,000 to $49,999 | 1 (0.4%) | 0 (0.0%) |
| $50,000 to $54,999 | 6 (2.6%) | 1 (0.4%) |
| $55,000 to $64,999 | 9 (3.9%) | 13 (5.6%) |
| $65,000 to $74,999 | 38 (16.5%) | 10 (4.3%) |
| $75,000 to $99,999 | 65 (28.1%) | 23 (9.9%) |
| $100,000+ | 33 (14.3%) | 76 (32.8%) |
| Total | 231 (100.0%) | 232 (100.0%) |
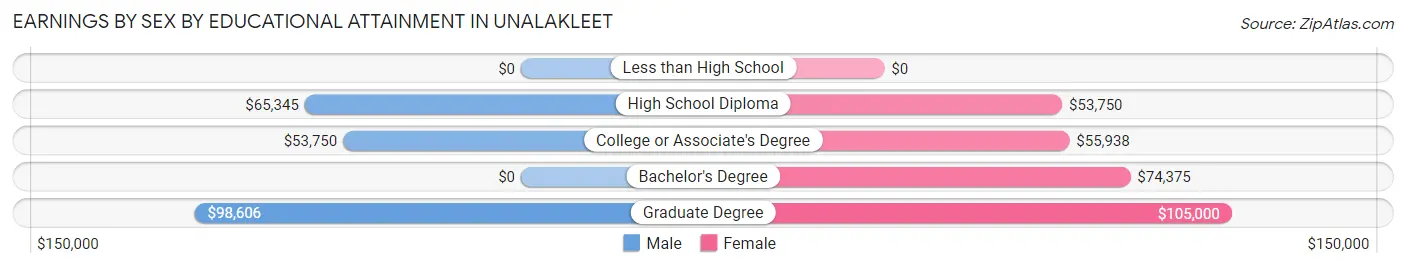
Earnings by Sex by Educational Attainment in Unalakleet
Average earnings in Unalakleet are $72,083 for men and $65,625 for women, a difference of 9.0%. Men with an educational attainment of graduate degree enjoy the highest average annual earnings of $98,606, while those with college or associate's degree education earn the least with $53,750. Women with an educational attainment of graduate degree earn the most with the average annual earnings of $105,000, while those with high school diploma education have the smallest earnings of $53,750.
| Educational Attainment | Male Income | Female Income |
| Less than High School | - | - |
| High School Diploma | $65,345 | $53,750 |
| College or Associate's Degree | $53,750 | $55,938 |
| Bachelor's Degree | - | - |
| Graduate Degree | $98,606 | $105,000 |
| Total | $72,083 | $65,625 |
Family Income in Unalakleet
Family Income Brackets in Unalakleet
According to the Unalakleet family income data, there are 27 families falling into the $100,000 to $149,999 income range, which is the most common income bracket and makes up 19.9% of all families. Conversely, the less than $10,000 income bracket is the least frequent group with only 3 families (2.2%) belonging to this category.
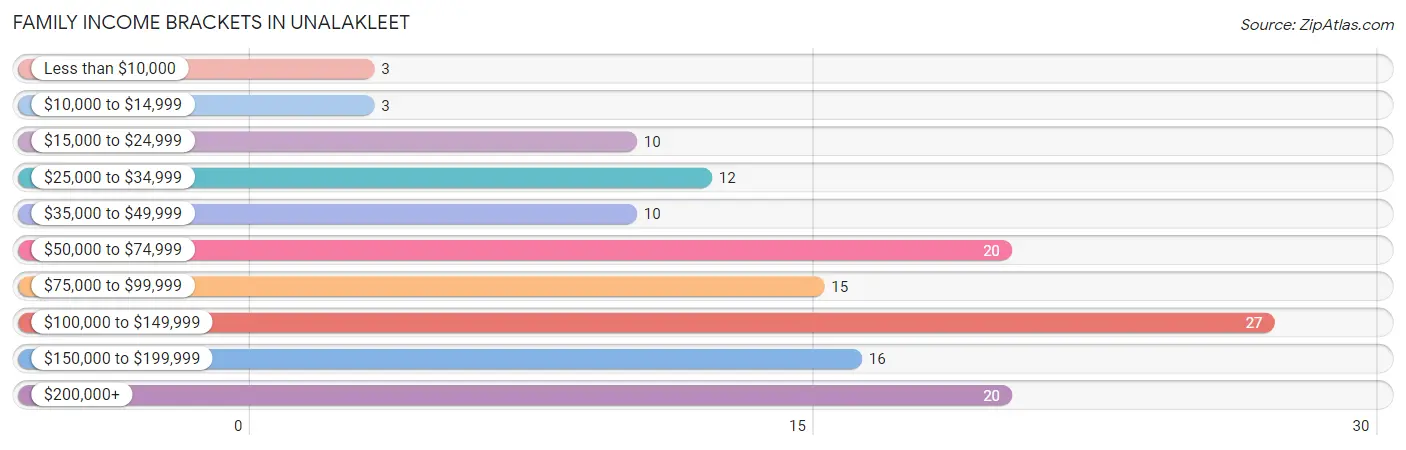
| Income Bracket | # Families | % Families |
| Less than $10,000 | 3 | 2.2% |
| $10,000 to $14,999 | 3 | 2.2% |
| $15,000 to $24,999 | 10 | 7.4% |
| $25,000 to $34,999 | 12 | 8.8% |
| $35,000 to $49,999 | 10 | 7.4% |
| $50,000 to $74,999 | 20 | 14.7% |
| $75,000 to $99,999 | 15 | 11.0% |
| $100,000 to $149,999 | 27 | 19.9% |
| $150,000 to $199,999 | 16 | 11.8% |
| $200,000+ | 20 | 14.7% |
Family Income by Famaliy Size in Unalakleet
5-person families (30 | 22.1%) account for the highest median family income in Unalakleet with $143,333 per family, while 3-person families (21 | 15.4%) have the highest median income of $37,708 per family member.
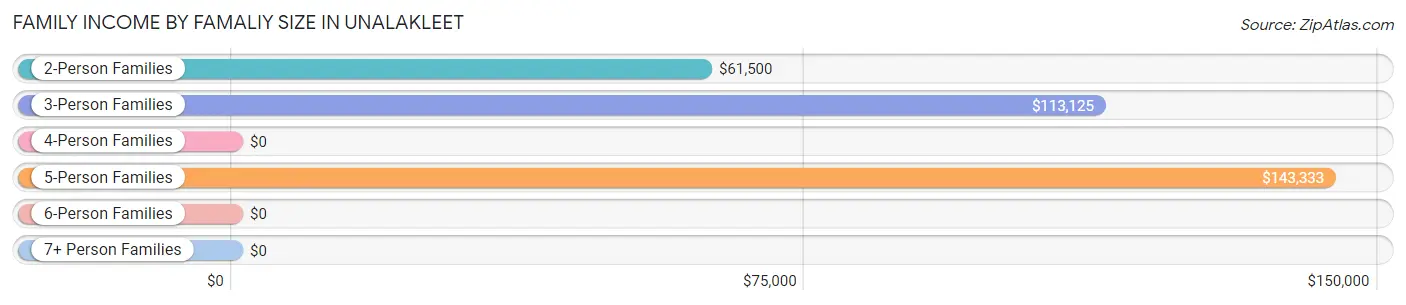
| Income Bracket | # Families | Median Income |
| 2-Person Families | 60 (44.1%) | $61,500 |
| 3-Person Families | 21 (15.4%) | $113,125 |
| 4-Person Families | 18 (13.2%) | $0 |
| 5-Person Families | 30 (22.1%) | $143,333 |
| 6-Person Families | 5 (3.7%) | $0 |
| 7+ Person Families | 2 (1.5%) | $0 |
| Total | 136 (100.0%) | $96,786 |
Family Income by Number of Earners in Unalakleet
The median family income in Unalakleet is $96,786, with families comprising 3+ earners (21) having the highest median family income of $143,542, while families with no earners (16) have the lowest median family income of $46,667, accounting for 15.4% and 11.8% of families, respectively.
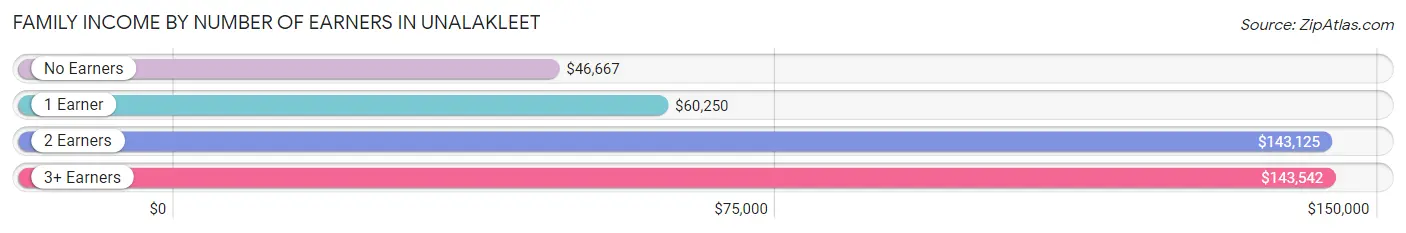
| Number of Earners | # Families | Median Income |
| No Earners | 16 (11.8%) | $46,667 |
| 1 Earner | 53 (39.0%) | $60,250 |
| 2 Earners | 46 (33.8%) | $143,125 |
| 3+ Earners | 21 (15.4%) | $143,542 |
| Total | 136 (100.0%) | $96,786 |
Household Income in Unalakleet
Household Income Brackets in Unalakleet
With 34 households falling in the category, the $100,000 to $149,999 income range is the most frequent in Unalakleet, accounting for 21.4% of all households. In contrast, only 6 households (3.8%) fall into the less than $10,000 income bracket, making it the least populous group.
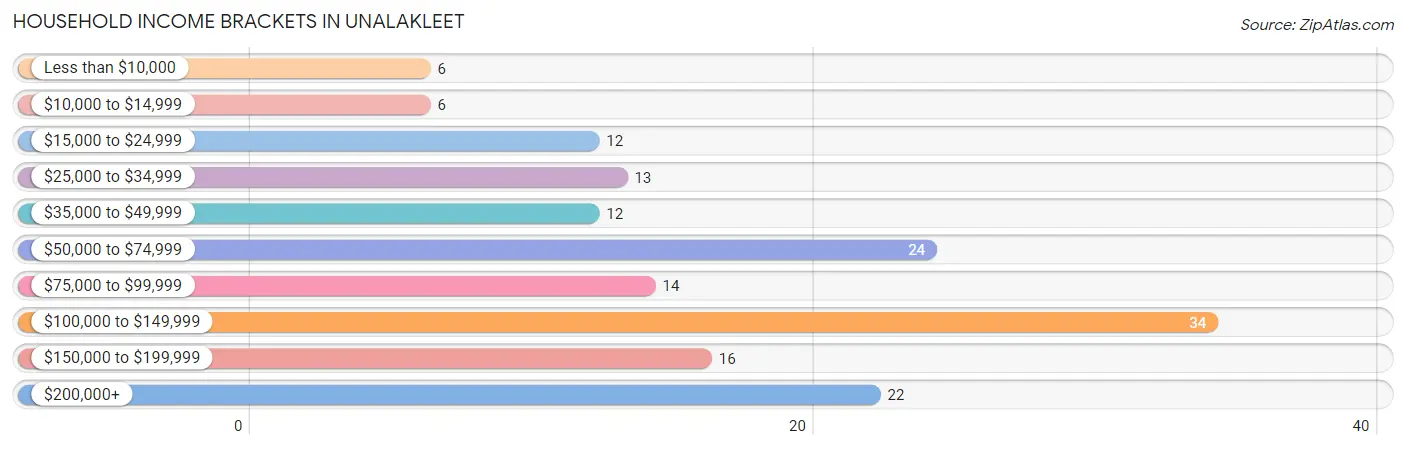
| Income Bracket | # Households | % Households |
| Less than $10,000 | 6 | 3.8% |
| $10,000 to $14,999 | 6 | 3.8% |
| $15,000 to $24,999 | 12 | 7.5% |
| $25,000 to $34,999 | 13 | 8.2% |
| $35,000 to $49,999 | 12 | 7.5% |
| $50,000 to $74,999 | 24 | 15.1% |
| $75,000 to $99,999 | 14 | 8.8% |
| $100,000 to $149,999 | 34 | 21.4% |
| $150,000 to $199,999 | 16 | 10.1% |
| $200,000+ | 22 | 13.8% |
Household Income by Householder Age in Unalakleet
The median household income in Unalakleet is $84,375, with the highest median household income of $128,125 found in the 45 to 64 years age bracket for the primary householder. A total of 61 households (38.4%) fall into this category. Meanwhile, the 15 to 24 years age bracket for the primary householder has the lowest median household income of $0, with 4 households (2.5%) in this group.
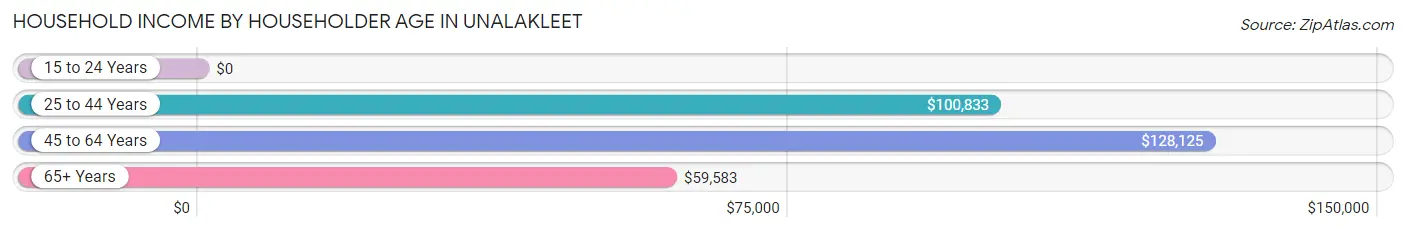
| Income Bracket | # Households | Median Income |
| 15 to 24 Years | 4 (2.5%) | $0 |
| 25 to 44 Years | 40 (25.2%) | $100,833 |
| 45 to 64 Years | 61 (38.4%) | $128,125 |
| 65+ Years | 54 (34.0%) | $59,583 |
| Total | 159 (100.0%) | $84,375 |
Poverty in Unalakleet
Income Below Poverty by Sex and Age in Unalakleet
With 7.9% poverty level for males and 17.1% for females among the residents of Unalakleet, 16 and 17 year old males and 55 to 64 year old females are the most vulnerable to poverty, with 2 males (40.0%) and 29 females (54.7%) in their respective age groups living below the poverty level.
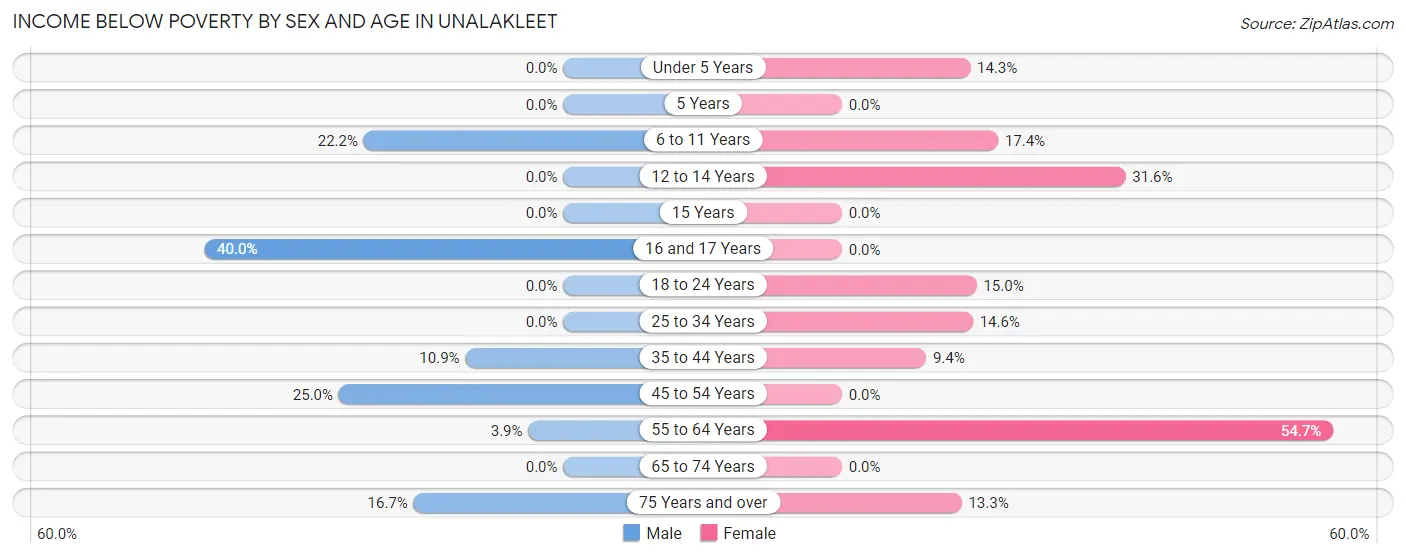
| Age Bracket | Male | Female |
| Under 5 Years | 0 (0.0%) | 2 (14.3%) |
| 5 Years | 0 (0.0%) | 0 (0.0%) |
| 6 to 11 Years | 6 (22.2%) | 4 (17.4%) |
| 12 to 14 Years | 0 (0.0%) | 6 (31.6%) |
| 15 Years | 0 (0.0%) | 0 (0.0%) |
| 16 and 17 Years | 2 (40.0%) | 0 (0.0%) |
| 18 to 24 Years | 0 (0.0%) | 3 (15.0%) |
| 25 to 34 Years | 0 (0.0%) | 7 (14.6%) |
| 35 to 44 Years | 6 (10.9%) | 6 (9.4%) |
| 45 to 54 Years | 8 (25.0%) | 0 (0.0%) |
| 55 to 64 Years | 3 (3.9%) | 29 (54.7%) |
| 65 to 74 Years | 0 (0.0%) | 0 (0.0%) |
| 75 Years and over | 2 (16.7%) | 2 (13.3%) |
| Total | 27 (7.9%) | 59 (17.1%) |
Income Above Poverty by Sex and Age in Unalakleet
According to the poverty statistics in Unalakleet, males aged under 5 years and females aged 5 years are the age groups that are most secure financially, with 100.0% of males and 100.0% of females in these age groups living above the poverty line.
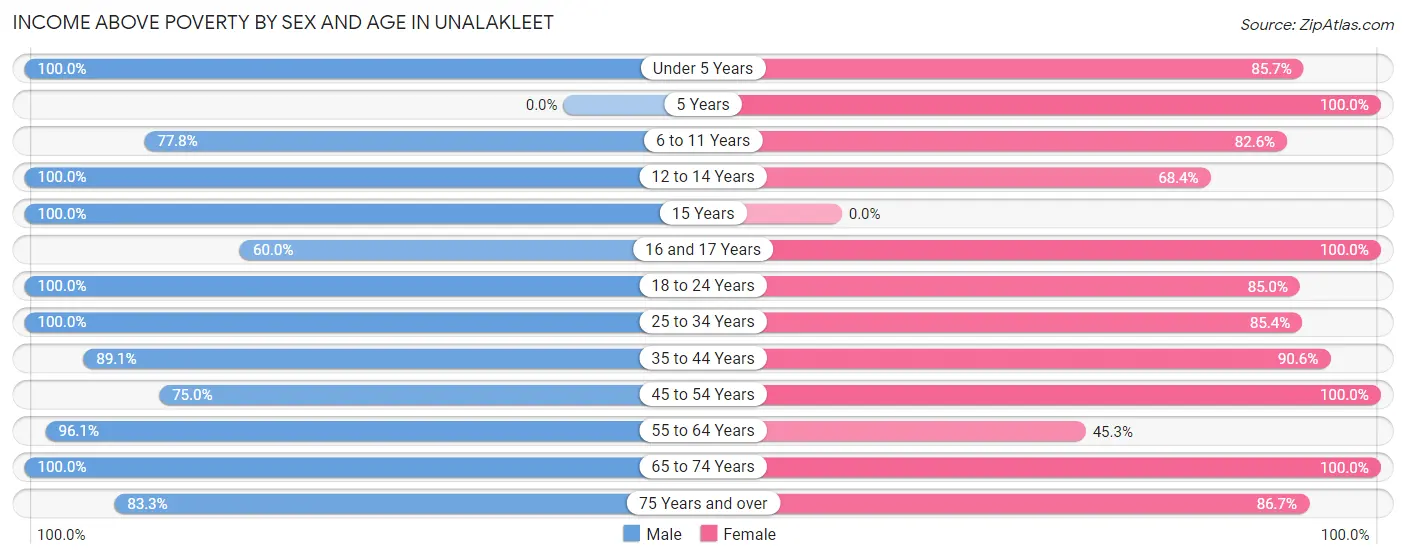
| Age Bracket | Male | Female |
| Under 5 Years | 15 (100.0%) | 12 (85.7%) |
| 5 Years | 0 (0.0%) | 4 (100.0%) |
| 6 to 11 Years | 21 (77.8%) | 19 (82.6%) |
| 12 to 14 Years | 14 (100.0%) | 13 (68.4%) |
| 15 Years | 5 (100.0%) | 0 (0.0%) |
| 16 and 17 Years | 3 (60.0%) | 5 (100.0%) |
| 18 to 24 Years | 38 (100.0%) | 17 (85.0%) |
| 25 to 34 Years | 39 (100.0%) | 41 (85.4%) |
| 35 to 44 Years | 49 (89.1%) | 58 (90.6%) |
| 45 to 54 Years | 24 (75.0%) | 60 (100.0%) |
| 55 to 64 Years | 74 (96.1%) | 24 (45.3%) |
| 65 to 74 Years | 24 (100.0%) | 21 (100.0%) |
| 75 Years and over | 10 (83.3%) | 13 (86.7%) |
| Total | 316 (92.1%) | 287 (83.0%) |
Income Below Poverty Among Married-Couple Families in Unalakleet
The poverty statistics for married-couple families in Unalakleet show that 9.8% or 8 of the total 82 families live below the poverty line. Families with 1 or 2 children have the highest poverty rate of 11.6%, comprising of 5 families. On the other hand, families with 3 or 4 children have the lowest poverty rate of 0.0%, which includes 0 families.
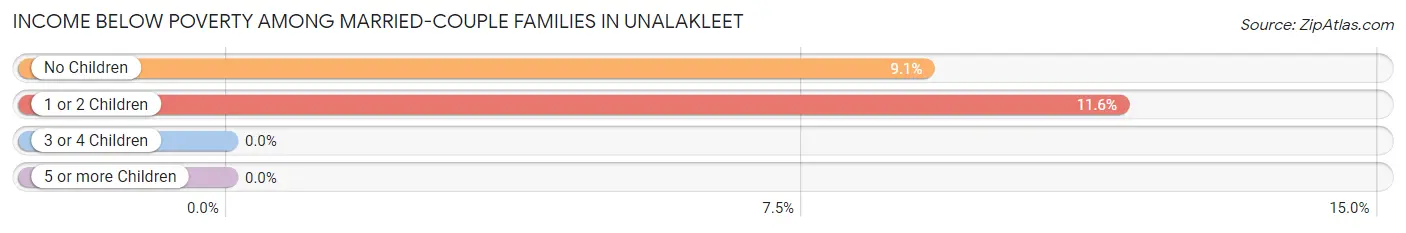
| Children | Above Poverty | Below Poverty |
| No Children | 30 (90.9%) | 3 (9.1%) |
| 1 or 2 Children | 38 (88.4%) | 5 (11.6%) |
| 3 or 4 Children | 6 (100.0%) | 0 (0.0%) |
| 5 or more Children | 0 (0.0%) | 0 (0.0%) |
| Total | 74 (90.2%) | 8 (9.8%) |
Income Below Poverty Among Single-Parent Households in Unalakleet
According to the poverty data in Unalakleet, 10.7% or 3 single-father households and 11.5% or 3 single-mother households are living below the poverty line. Among single-father households, those with 3 or 4 children have the highest poverty rate, with 3 households (100.0%) experiencing poverty. Likewise, among single-mother households, those with 3 or 4 children have the highest poverty rate, with 3 households (100.0%) falling below the poverty line.
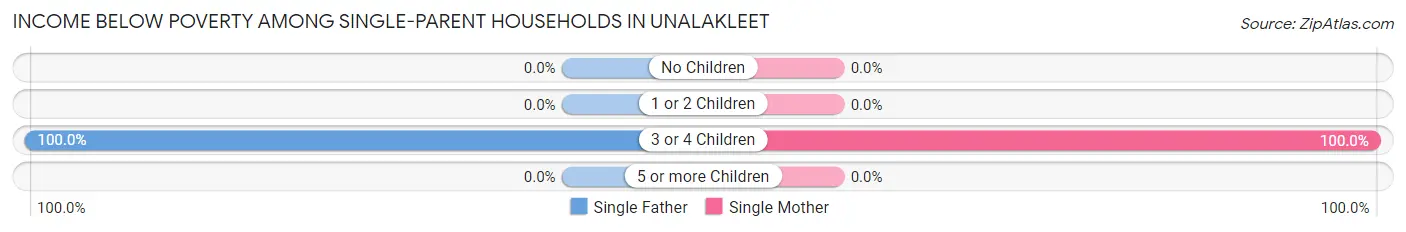
| Children | Single Father | Single Mother |
| No Children | 0 (0.0%) | 0 (0.0%) |
| 1 or 2 Children | 0 (0.0%) | 0 (0.0%) |
| 3 or 4 Children | 3 (100.0%) | 3 (100.0%) |
| 5 or more Children | 0 (0.0%) | 0 (0.0%) |
| Total | 3 (10.7%) | 3 (11.5%) |
Income Below Poverty Among Married-Couple vs Single-Parent Households in Unalakleet
The poverty data for Unalakleet shows that 8 of the married-couple family households (9.8%) and 6 of the single-parent households (11.1%) are living below the poverty level. Within the married-couple family households, those with 1 or 2 children have the highest poverty rate, with 5 households (11.6%) falling below the poverty line. Among the single-parent households, those with 3 or 4 children have the highest poverty rate, with 6 household (100.0%) living below poverty.
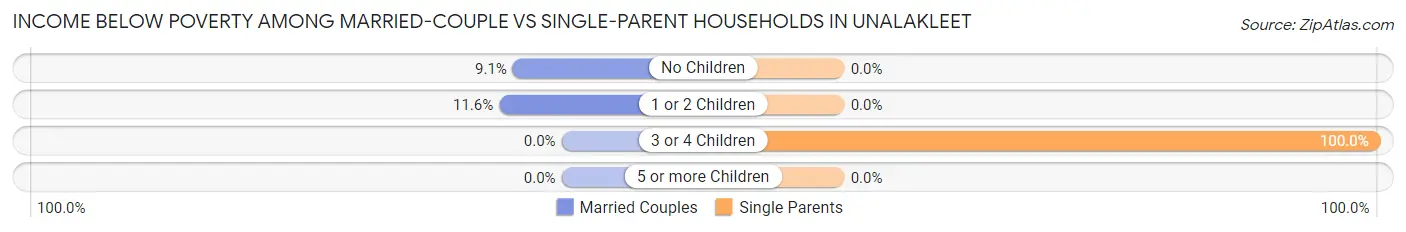
| Children | Married-Couple Families | Single-Parent Households |
| No Children | 3 (9.1%) | 0 (0.0%) |
| 1 or 2 Children | 5 (11.6%) | 0 (0.0%) |
| 3 or 4 Children | 0 (0.0%) | 6 (100.0%) |
| 5 or more Children | 0 (0.0%) | 0 (0.0%) |
| Total | 8 (9.8%) | 6 (11.1%) |
Race in Unalakleet
The most populous races in Unalakleet are Native / Alaskan (504 | 67.8%), White / Caucasian (198 | 26.7%), and Two or more Races (37 | 5.0%).
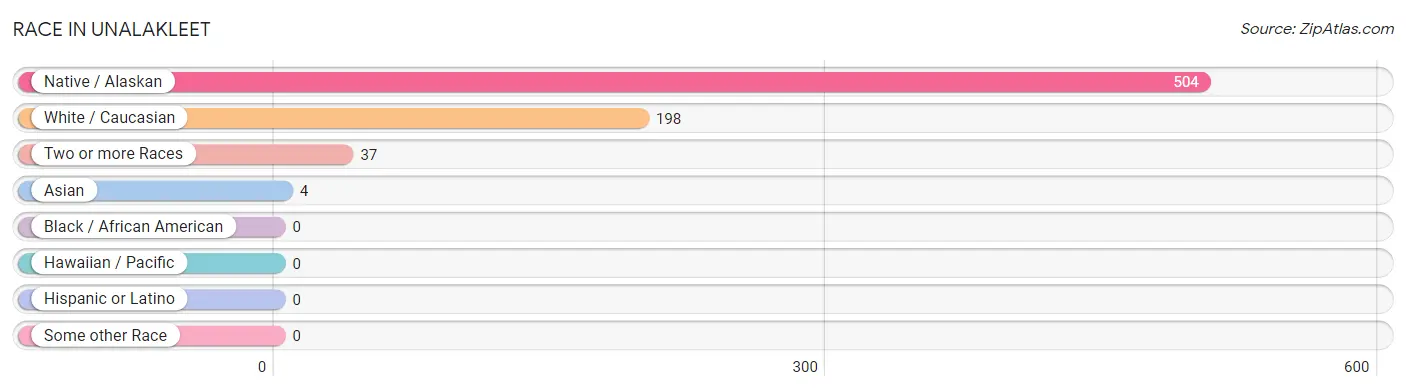
| Race | # Population | % Population |
| Asian | 4 | 0.5% |
| Black / African American | 0 | 0.0% |
| Hawaiian / Pacific | 0 | 0.0% |
| Hispanic or Latino | 0 | 0.0% |
| Native / Alaskan | 504 | 67.8% |
| White / Caucasian | 198 | 26.7% |
| Two or more Races | 37 | 5.0% |
| Some other Race | 0 | 0.0% |
| Total | 743 | 100.0% |
Ancestry in Unalakleet
The most populous ancestries reported in Unalakleet are Inupiat (420 | 56.5%), Alaska Native (97 | 13.1%), German (95 | 12.8%), European (52 | 7.0%), and Scottish (32 | 4.3%), together accounting for 93.7% of all Unalakleet residents.
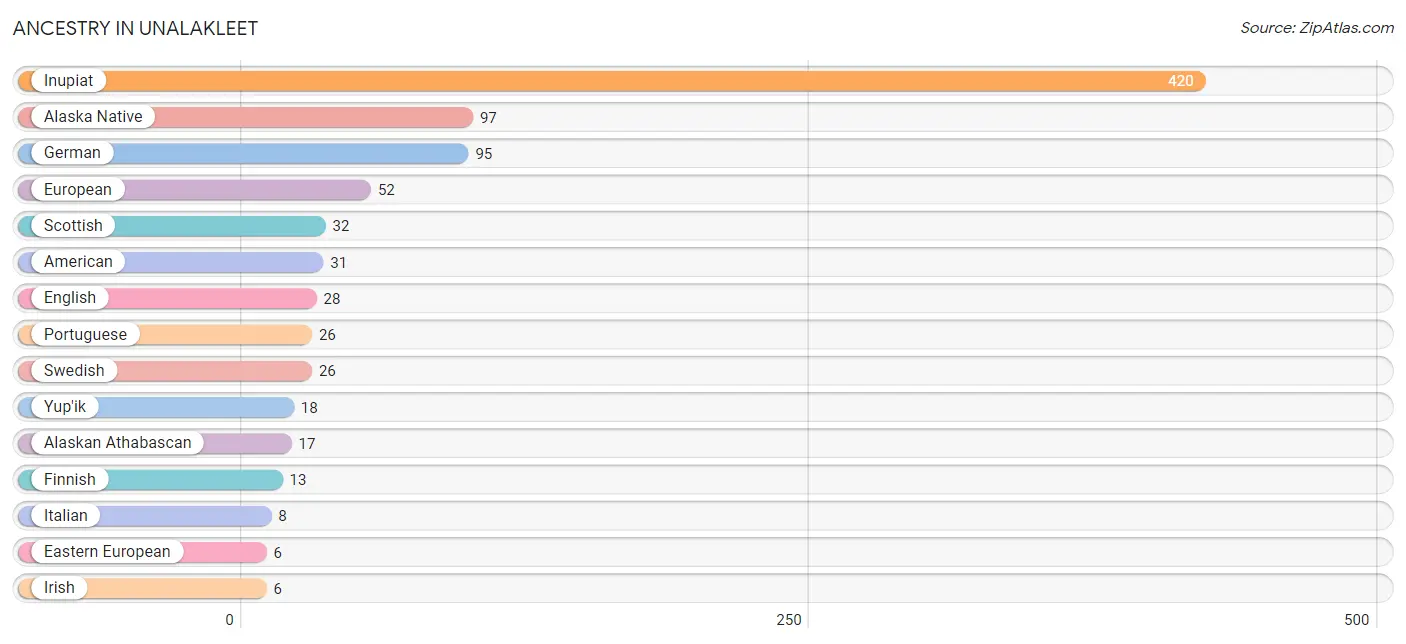
| Ancestry | # Population | % Population |
| Alaska Native | 97 | 13.1% |
| Alaskan Athabascan | 17 | 2.3% |
| American | 31 | 4.2% |
| Czech | 1 | 0.1% |
| Dutch | 1 | 0.1% |
| Eastern European | 6 | 0.8% |
| English | 28 | 3.8% |
| European | 52 | 7.0% |
| Finnish | 13 | 1.8% |
| German | 95 | 12.8% |
| Inupiat | 420 | 56.5% |
| Irish | 6 | 0.8% |
| Italian | 8 | 1.1% |
| Korean | 4 | 0.5% |
| Norwegian | 6 | 0.8% |
| Portuguese | 26 | 3.5% |
| Russian | 2 | 0.3% |
| Scottish | 32 | 4.3% |
| Swedish | 26 | 3.5% |
| Yup'ik | 18 | 2.4% | View All 20 Rows |
Immigrants in Unalakleet
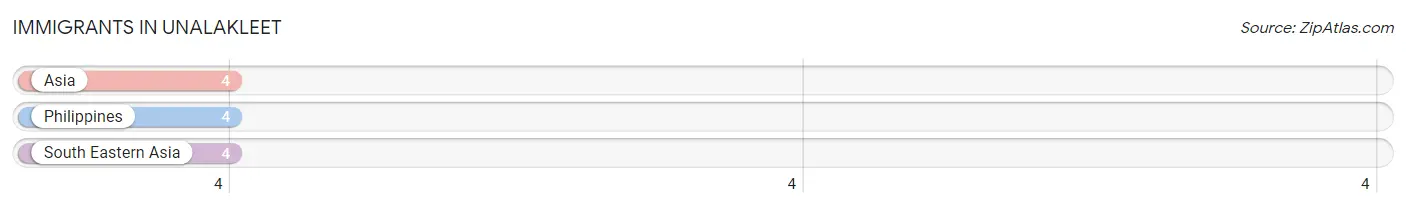
The most numerous immigrant groups reported in Unalakleet came from Asia (4 | 0.5%), Philippines (4 | 0.5%), and South Eastern Asia (4 | 0.5%), together accounting for 1.6% of all Unalakleet residents.
| Immigration Origin | # Population | % Population |
| Asia | 4 | 0.5% |
| Philippines | 4 | 0.5% |
| South Eastern Asia | 4 | 0.5% | View All 3 Rows |
Sex and Age in Unalakleet
Sex and Age in Unalakleet
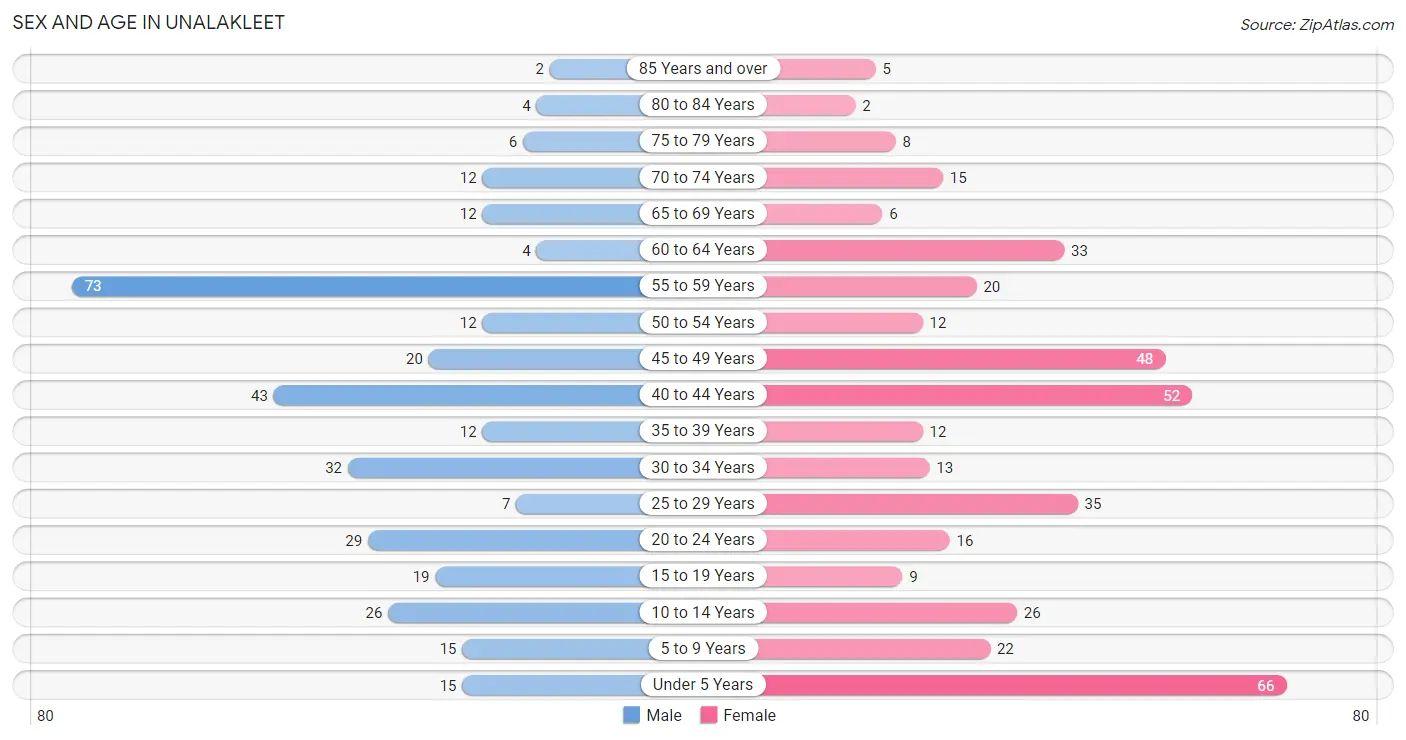
The most populous age groups in Unalakleet are 55 to 59 Years (73 | 21.3%) for men and Under 5 Years (66 | 16.5%) for women.
| Age Bracket | Male | Female |
| Under 5 Years | 15 (4.4%) | 66 (16.5%) |
| 5 to 9 Years | 15 (4.4%) | 22 (5.5%) |
| 10 to 14 Years | 26 (7.6%) | 26 (6.5%) |
| 15 to 19 Years | 19 (5.5%) | 9 (2.2%) |
| 20 to 24 Years | 29 (8.5%) | 16 (4.0%) |
| 25 to 29 Years | 7 (2.0%) | 35 (8.7%) |
| 30 to 34 Years | 32 (9.3%) | 13 (3.3%) |
| 35 to 39 Years | 12 (3.5%) | 12 (3.0%) |
| 40 to 44 Years | 43 (12.5%) | 52 (13.0%) |
| 45 to 49 Years | 20 (5.8%) | 48 (12.0%) |
| 50 to 54 Years | 12 (3.5%) | 12 (3.0%) |
| 55 to 59 Years | 73 (21.3%) | 20 (5.0%) |
| 60 to 64 Years | 4 (1.2%) | 33 (8.3%) |
| 65 to 69 Years | 12 (3.5%) | 6 (1.5%) |
| 70 to 74 Years | 12 (3.5%) | 15 (3.7%) |
| 75 to 79 Years | 6 (1.8%) | 8 (2.0%) |
| 80 to 84 Years | 4 (1.2%) | 2 (0.5%) |
| 85 Years and over | 2 (0.6%) | 5 (1.3%) |
| Total | 343 (100.0%) | 400 (100.0%) |
Families and Households in Unalakleet
Median Family Size in Unalakleet
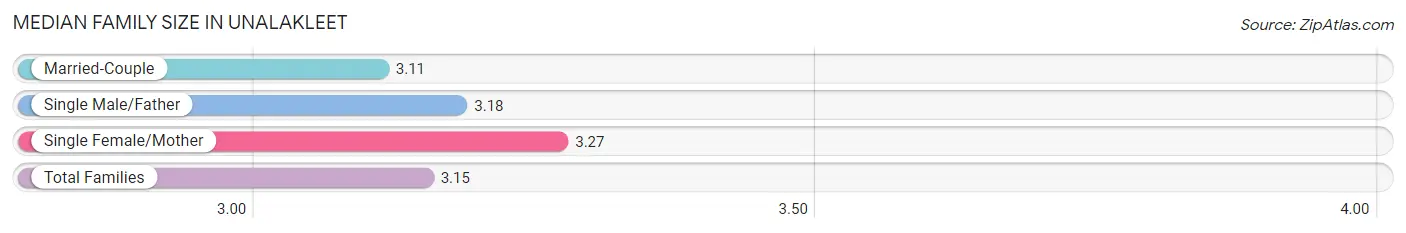
The median family size in Unalakleet is 3.15 persons per family, with single female/mother families (26 | 19.1%) accounting for the largest median family size of 3.27 persons per family. On the other hand, married-couple families (82 | 60.3%) represent the smallest median family size with 3.11 persons per family.
| Family Type | # Families | Family Size |
| Married-Couple | 82 (60.3%) | 3.11 |
| Single Male/Father | 28 (20.6%) | 3.18 |
| Single Female/Mother | 26 (19.1%) | 3.27 |
| Total Families | 136 (100.0%) | 3.15 |
Median Household Size in Unalakleet
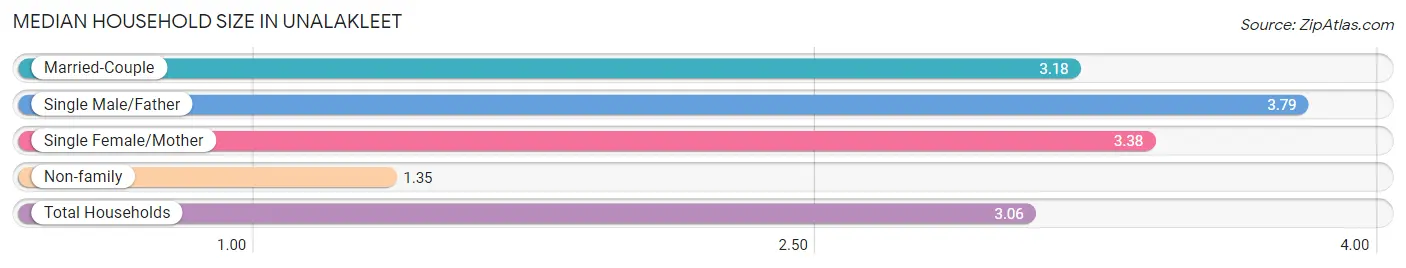
The median household size in Unalakleet is 3.06 persons per household, with single male/father households (28 | 17.6%) accounting for the largest median household size of 3.79 persons per household. non-family households (23 | 14.5%) represent the smallest median household size with 1.35 persons per household.
| Household Type | # Households | Household Size |
| Married-Couple | 82 (51.6%) | 3.18 |
| Single Male/Father | 28 (17.6%) | 3.79 |
| Single Female/Mother | 26 (16.4%) | 3.38 |
| Non-family | 23 (14.5%) | 1.35 |
| Total Households | 159 (100.0%) | 3.06 |
Household Size by Marriage Status in Unalakleet
Out of a total of 159 households in Unalakleet, 136 (85.5%) are family households, while 23 (14.5%) are nonfamily households. The most numerous type of family households are 2-person households, comprising 52, and the most common type of nonfamily households are 1-person households, comprising 15.
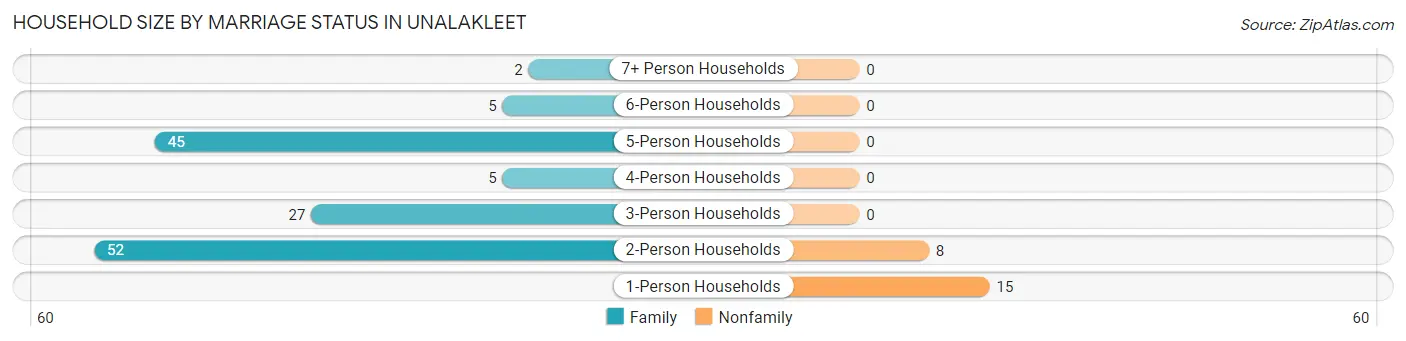
| Household Size | Family Households | Nonfamily Households |
| 1-Person Households | - | 15 (9.4%) |
| 2-Person Households | 52 (32.7%) | 8 (5.0%) |
| 3-Person Households | 27 (17.0%) | 0 (0.0%) |
| 4-Person Households | 5 (3.1%) | 0 (0.0%) |
| 5-Person Households | 45 (28.3%) | 0 (0.0%) |
| 6-Person Households | 5 (3.1%) | 0 (0.0%) |
| 7+ Person Households | 2 (1.3%) | 0 (0.0%) |
| Total | 136 (85.5%) | 23 (14.5%) |
Female Fertility in Unalakleet
Fertility by Age in Unalakleet
Average fertility rate in Unalakleet is 172.0 births per 1,000 women. Women in the age bracket of 20 to 34 years have the highest fertility rate with 422.0 births per 1,000 women. Women in the age bracket of 20 to 34 years acount for 84.4% of all women with births.
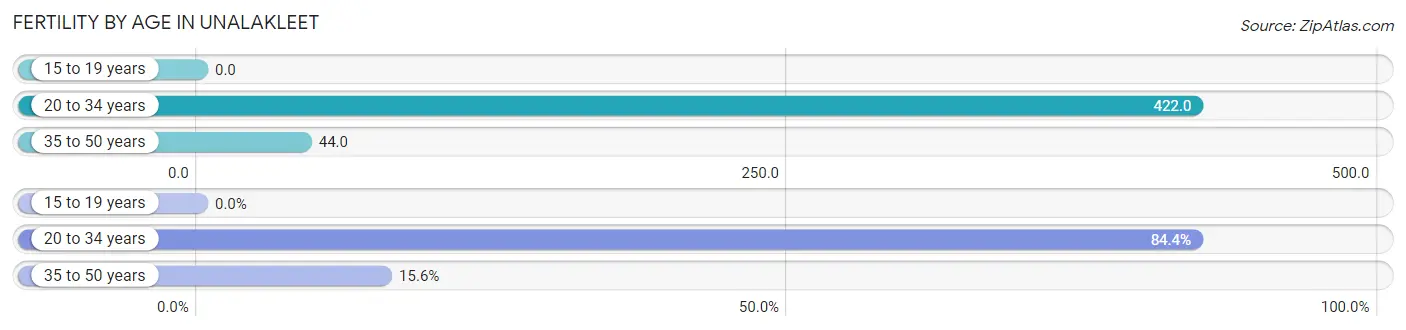
| Age Bracket | Women with Births | Births / 1,000 Women |
| 15 to 19 years | 0 (0.0%) | 0.0 |
| 20 to 34 years | 27 (84.4%) | 422.0 |
| 35 to 50 years | 5 (15.6%) | 44.0 |
| Total | 32 (100.0%) | 172.0 |
Fertility by Age by Marriage Status in Unalakleet
15.6% of women with births (32) in Unalakleet are married. The highest percentage of unmarried women with births falls into 20 to 34 years age bracket with 100.0% of them unmarried at the time of birth, while the lowest percentage of unmarried women with births belong to 35 to 50 years age bracket with 0.0% of them unmarried.
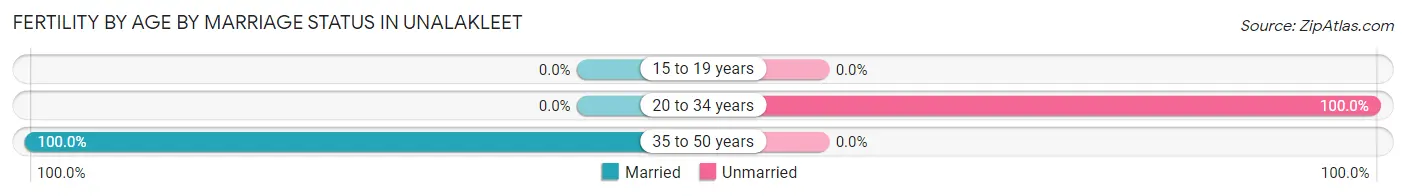
| Age Bracket | Married | Unmarried |
| 15 to 19 years | 0 (0.0%) | 0 (0.0%) |
| 20 to 34 years | 0 (0.0%) | 27 (100.0%) |
| 35 to 50 years | 5 (100.0%) | 0 (0.0%) |
| Total | 5 (15.6%) | 27 (84.4%) |
Fertility by Education in Unalakleet
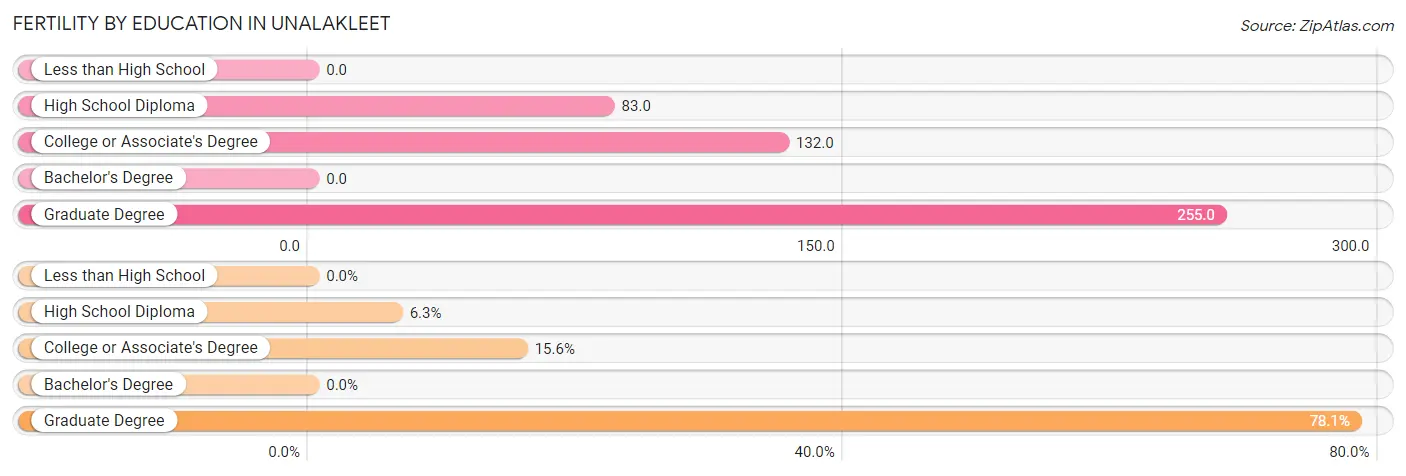
| Educational Attainment | Women with Births | Births / 1,000 Women |
| Less than High School | 0 (0.0%) | 0.0 |
| High School Diploma | 2 (6.2%) | 83.0 |
| College or Associate's Degree | 5 (15.6%) | 132.0 |
| Bachelor's Degree | 0 (0.0%) | 0.0 |
| Graduate Degree | 25 (78.1%) | 255.0 |
| Total | 32 (100.0%) | 172.0 |
Fertility by Education by Marriage Status in Unalakleet
84.4% of women with births in Unalakleet are unmarried. Women with the educational attainment of college or associate's degree are most likely to be married with 100.0% of them married at childbirth, while women with the educational attainment of high school diploma are least likely to be married with 100.0% of them unmarried at childbirth.
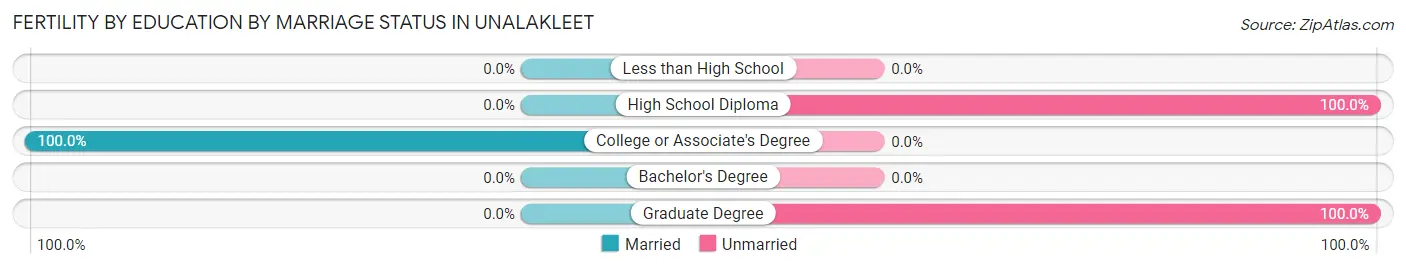
| Educational Attainment | Married | Unmarried |
| Less than High School | 0 (0.0%) | 0 (0.0%) |
| High School Diploma | 0 (0.0%) | 2 (100.0%) |
| College or Associate's Degree | 5 (100.0%) | 0 (0.0%) |
| Bachelor's Degree | 0 (0.0%) | 0 (0.0%) |
| Graduate Degree | 0 (0.0%) | 25 (100.0%) |
| Total | 5 (15.6%) | 27 (84.4%) |
Employment Characteristics in Unalakleet
Employment by Class of Employer in Unalakleet
Among the 390 employed individuals in Unalakleet, state government employees (263 | 67.4%), private company employees (63 | 16.2%), and local government employees (32 | 8.2%) make up the most common classes of employment.
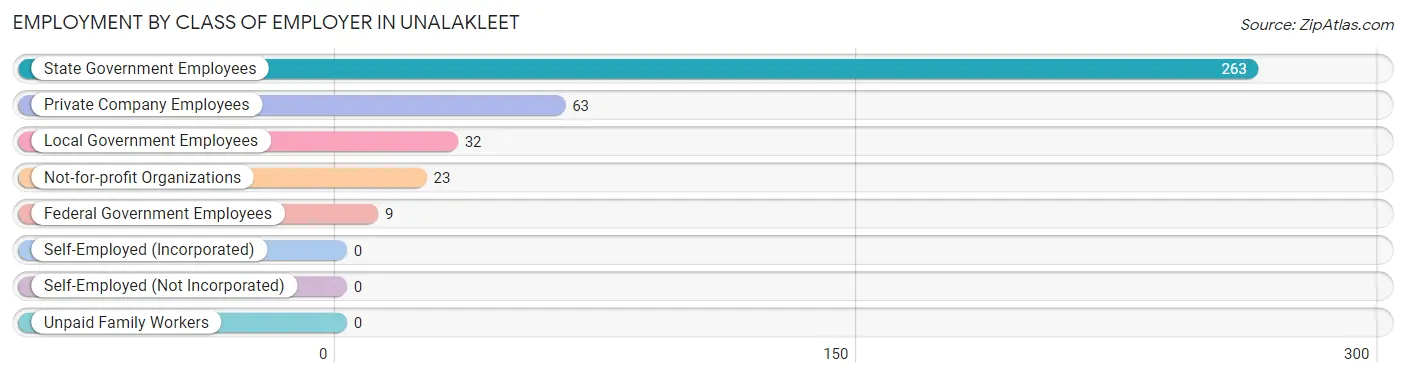
| Employer Class | # Employees | % Employees |
| Private Company Employees | 63 | 16.2% |
| Self-Employed (Incorporated) | 0 | 0.0% |
| Self-Employed (Not Incorporated) | 0 | 0.0% |
| Not-for-profit Organizations | 23 | 5.9% |
| Local Government Employees | 32 | 8.2% |
| State Government Employees | 263 | 67.4% |
| Federal Government Employees | 9 | 2.3% |
| Unpaid Family Workers | 0 | 0.0% |
| Total | 390 | 100.0% |
Employment Status by Age in Unalakleet
According to the labor force statistics for Unalakleet, out of the total population over 16 years of age (568), 75.0% or 426 individuals are in the labor force, with 7.7% or 33 of them unemployed. The age group with the highest labor force participation rate is 25 to 29 years, with 100.0% or 42 individuals in the labor force. Within the labor force, the 45 to 54 years age range has the highest percentage of unemployed individuals, with 14.3% or 12 of them being unemployed.
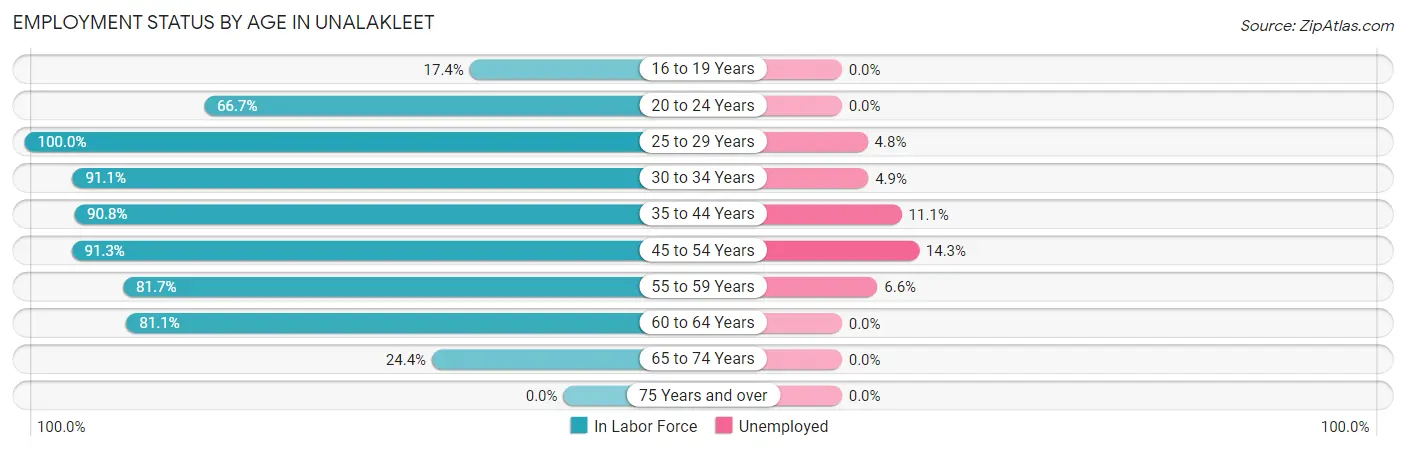
| Age Bracket | In Labor Force | Unemployed |
| 16 to 19 Years | 4 (17.4%) | 0 (0.0%) |
| 20 to 24 Years | 30 (66.7%) | 0 (0.0%) |
| 25 to 29 Years | 42 (100.0%) | 2 (4.8%) |
| 30 to 34 Years | 41 (91.1%) | 2 (4.9%) |
| 35 to 44 Years | 108 (90.8%) | 12 (11.1%) |
| 45 to 54 Years | 84 (91.3%) | 12 (14.3%) |
| 55 to 59 Years | 76 (81.7%) | 5 (6.6%) |
| 60 to 64 Years | 30 (81.1%) | 0 (0.0%) |
| 65 to 74 Years | 11 (24.4%) | 0 (0.0%) |
| 75 Years and over | 0 (0.0%) | 0 (0.0%) |
| Total | 426 (75.0%) | 33 (7.7%) |
Employment Status by Educational Attainment in Unalakleet
According to labor force statistics for Unalakleet, 89.0% of individuals (381) out of the total population between 25 and 64 years of age (428) are in the labor force, with 8.7% or 33 of them being unemployed. The group with the highest labor force participation rate are those with the educational attainment of bachelor's degree or higher, with 98.7% or 221 individuals in the labor force. Within the labor force, individuals with less than high school education have the highest percentage of unemployment, with 60.0% or 6 of them being unemployed.
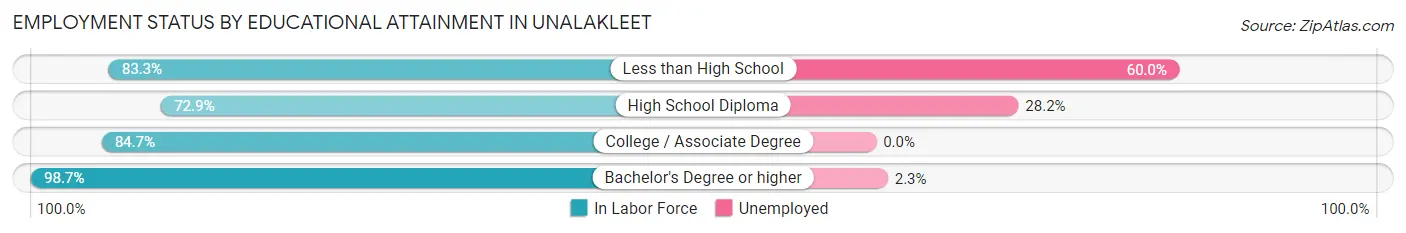
| Educational Attainment | In Labor Force | Unemployed |
| Less than High School | 10 (83.3%) | 7 (60.0%) |
| High School Diploma | 78 (72.9%) | 30 (28.2%) |
| College / Associate Degree | 72 (84.7%) | 0 (0.0%) |
| Bachelor's Degree or higher | 221 (98.7%) | 5 (2.3%) |
| Total | 381 (89.0%) | 37 (8.7%) |
Employment Occupations by Sex in Unalakleet
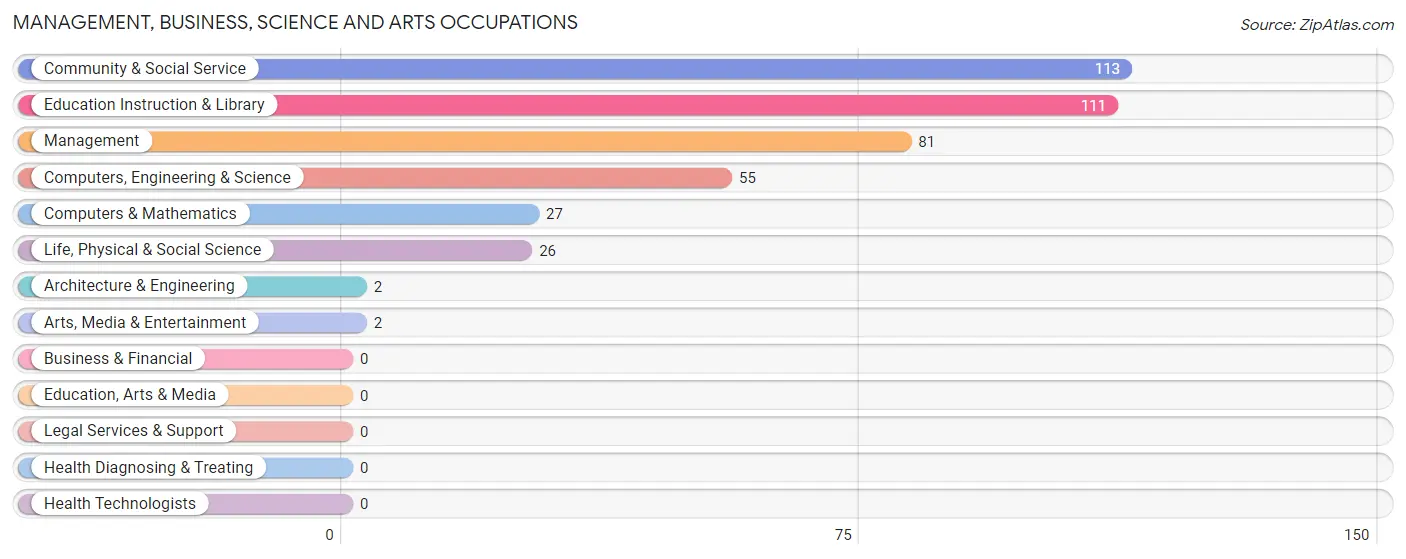
Management, Business, Science and Arts Occupations
The most common Management, Business, Science and Arts occupations in Unalakleet are Community & Social Service (113 | 28.7%), Education Instruction & Library (111 | 28.2%), Management (81 | 20.6%), Computers, Engineering & Science (55 | 14.0%), and Computers & Mathematics (27 | 6.9%).
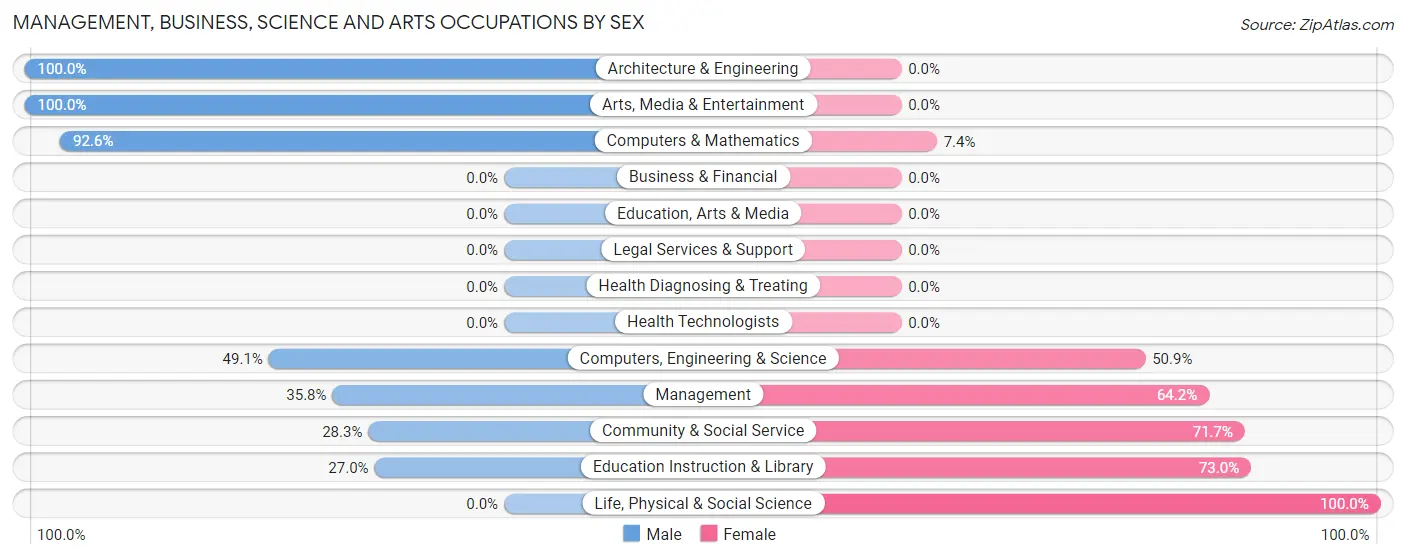
Management, Business, Science and Arts Occupations by Sex
Within the Management, Business, Science and Arts occupations in Unalakleet, the most male-oriented occupations are Architecture & Engineering (100.0%), Arts, Media & Entertainment (100.0%), and Computers & Mathematics (92.6%), while the most female-oriented occupations are Life, Physical & Social Science (100.0%), Education Instruction & Library (73.0%), and Community & Social Service (71.7%).
| Occupation | Male | Female |
| Management | 29 (35.8%) | 52 (64.2%) |
| Business & Financial | 0 (0.0%) | 0 (0.0%) |
| Computers, Engineering & Science | 27 (49.1%) | 28 (50.9%) |
| Computers & Mathematics | 25 (92.6%) | 2 (7.4%) |
| Architecture & Engineering | 2 (100.0%) | 0 (0.0%) |
| Life, Physical & Social Science | 0 (0.0%) | 26 (100.0%) |
| Community & Social Service | 32 (28.3%) | 81 (71.7%) |
| Education, Arts & Media | 0 (0.0%) | 0 (0.0%) |
| Legal Services & Support | 0 (0.0%) | 0 (0.0%) |
| Education Instruction & Library | 30 (27.0%) | 81 (73.0%) |
| Arts, Media & Entertainment | 2 (100.0%) | 0 (0.0%) |
| Health Diagnosing & Treating | 0 (0.0%) | 0 (0.0%) |
| Health Technologists | 0 (0.0%) | 0 (0.0%) |
| Total (Category) | 88 (35.3%) | 161 (64.7%) |
| Total (Overall) | 179 (45.6%) | 214 (54.4%) |
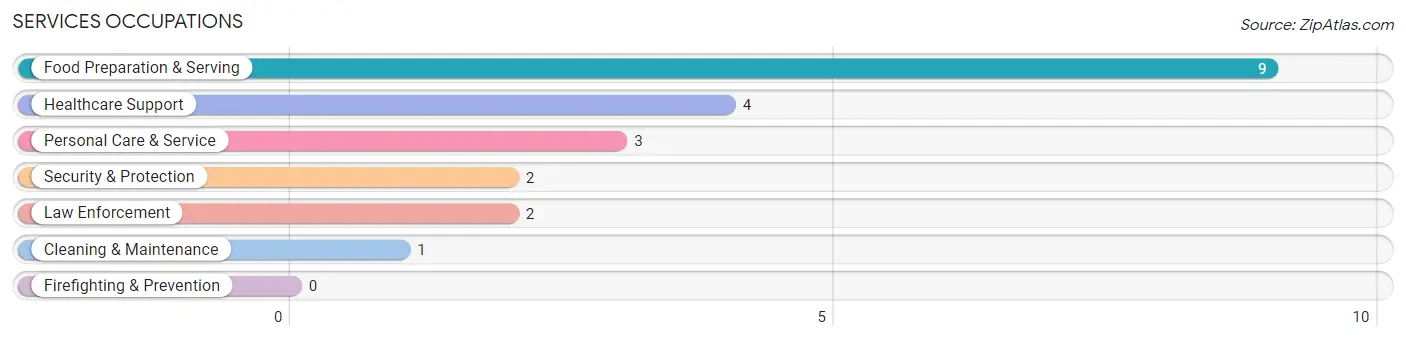
Services Occupations
The most common Services occupations in Unalakleet are Food Preparation & Serving (9 | 2.3%), Healthcare Support (4 | 1.0%), Personal Care & Service (3 | 0.8%), Security & Protection (2 | 0.5%), and Law Enforcement (2 | 0.5%).
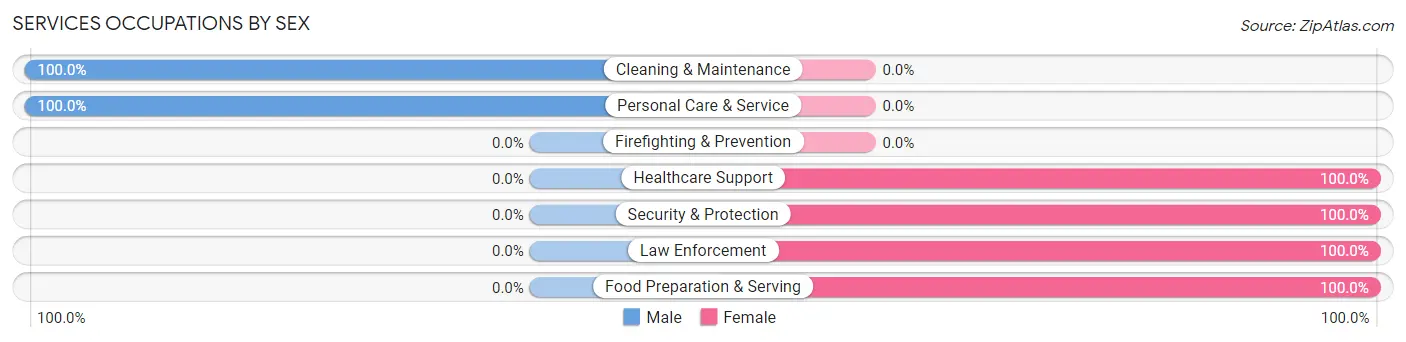
Services Occupations by Sex
Within the Services occupations in Unalakleet, the most male-oriented occupations are Cleaning & Maintenance (100.0%), and Personal Care & Service (100.0%), while the most female-oriented occupations are Healthcare Support (100.0%), Security & Protection (100.0%), and Law Enforcement (100.0%).
| Occupation | Male | Female |
| Healthcare Support | 0 (0.0%) | 4 (100.0%) |
| Security & Protection | 0 (0.0%) | 2 (100.0%) |
| Firefighting & Prevention | 0 (0.0%) | 0 (0.0%) |
| Law Enforcement | 0 (0.0%) | 2 (100.0%) |
| Food Preparation & Serving | 0 (0.0%) | 9 (100.0%) |
| Cleaning & Maintenance | 1 (100.0%) | 0 (0.0%) |
| Personal Care & Service | 3 (100.0%) | 0 (0.0%) |
| Total (Category) | 4 (21.0%) | 15 (78.9%) |
| Total (Overall) | 179 (45.6%) | 214 (54.4%) |
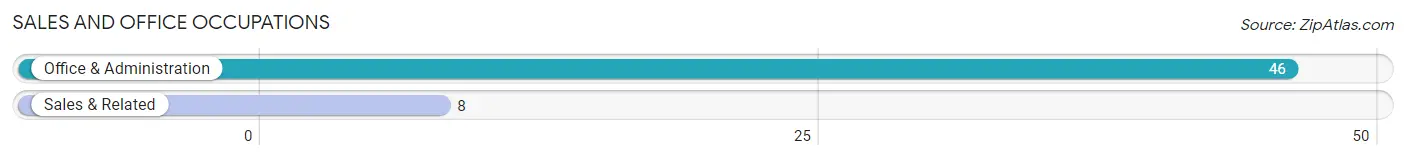
Sales and Office Occupations
The most common Sales and Office occupations in Unalakleet are Office & Administration (46 | 11.7%), and Sales & Related (8 | 2.0%).
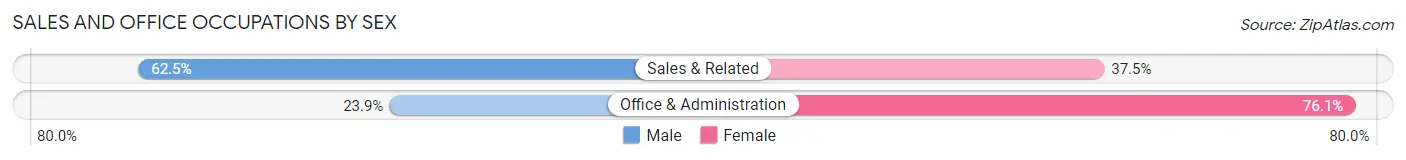
Sales and Office Occupations by Sex
| Occupation | Male | Female |
| Sales & Related | 5 (62.5%) | 3 (37.5%) |
| Office & Administration | 11 (23.9%) | 35 (76.1%) |
| Total (Category) | 16 (29.6%) | 38 (70.4%) |
| Total (Overall) | 179 (45.6%) | 214 (54.4%) |
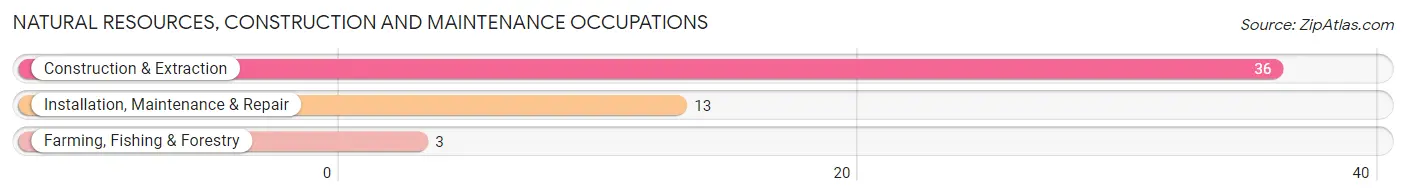
Natural Resources, Construction and Maintenance Occupations
The most common Natural Resources, Construction and Maintenance occupations in Unalakleet are Construction & Extraction (36 | 9.2%), Installation, Maintenance & Repair (13 | 3.3%), and Farming, Fishing & Forestry (3 | 0.8%).
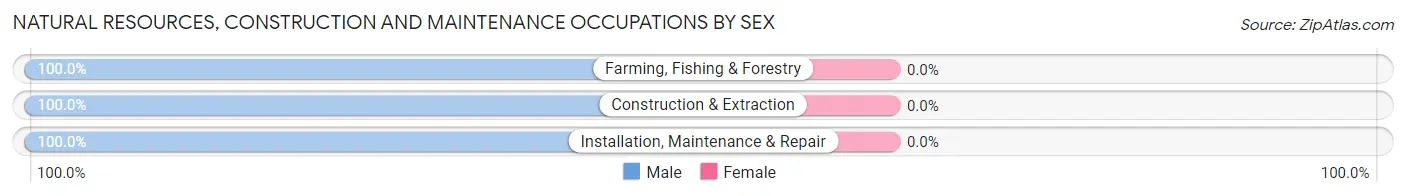
Natural Resources, Construction and Maintenance Occupations by Sex
| Occupation | Male | Female |
| Farming, Fishing & Forestry | 3 (100.0%) | 0 (0.0%) |
| Construction & Extraction | 36 (100.0%) | 0 (0.0%) |
| Installation, Maintenance & Repair | 13 (100.0%) | 0 (0.0%) |
| Total (Category) | 52 (100.0%) | 0 (0.0%) |
| Total (Overall) | 179 (45.6%) | 214 (54.4%) |
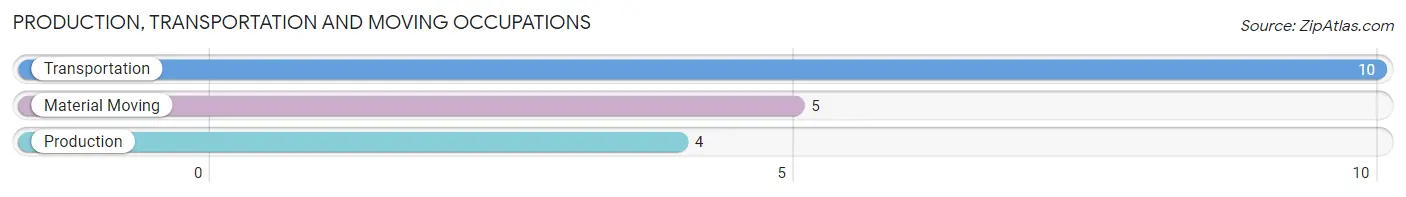
Production, Transportation and Moving Occupations
The most common Production, Transportation and Moving occupations in Unalakleet are Transportation (10 | 2.5%), Material Moving (5 | 1.3%), and Production (4 | 1.0%).
Production, Transportation and Moving Occupations by Sex
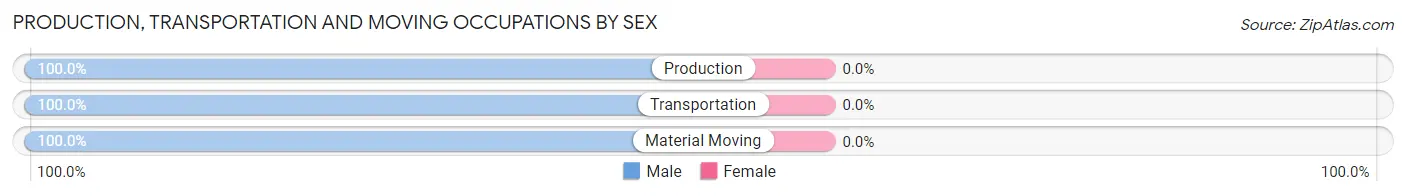
| Occupation | Male | Female |
| Production | 4 (100.0%) | 0 (0.0%) |
| Transportation | 10 (100.0%) | 0 (0.0%) |
| Material Moving | 5 (100.0%) | 0 (0.0%) |
| Total (Category) | 19 (100.0%) | 0 (0.0%) |
| Total (Overall) | 179 (45.6%) | 214 (54.4%) |
Employment Industries by Sex in Unalakleet
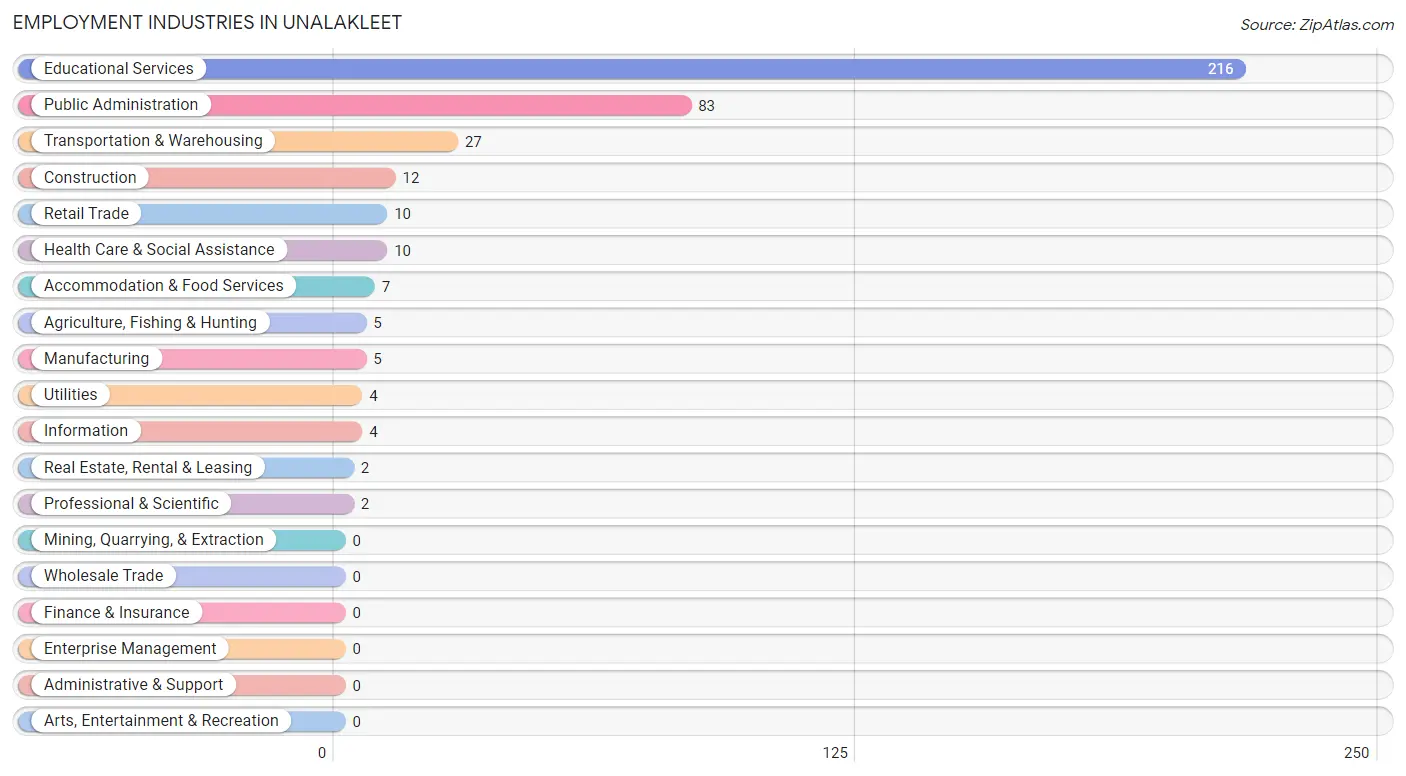
Employment Industries in Unalakleet
The major employment industries in Unalakleet include Educational Services (216 | 55.0%), Public Administration (83 | 21.1%), Transportation & Warehousing (27 | 6.9%), Construction (12 | 3.0%), and Retail Trade (10 | 2.5%).
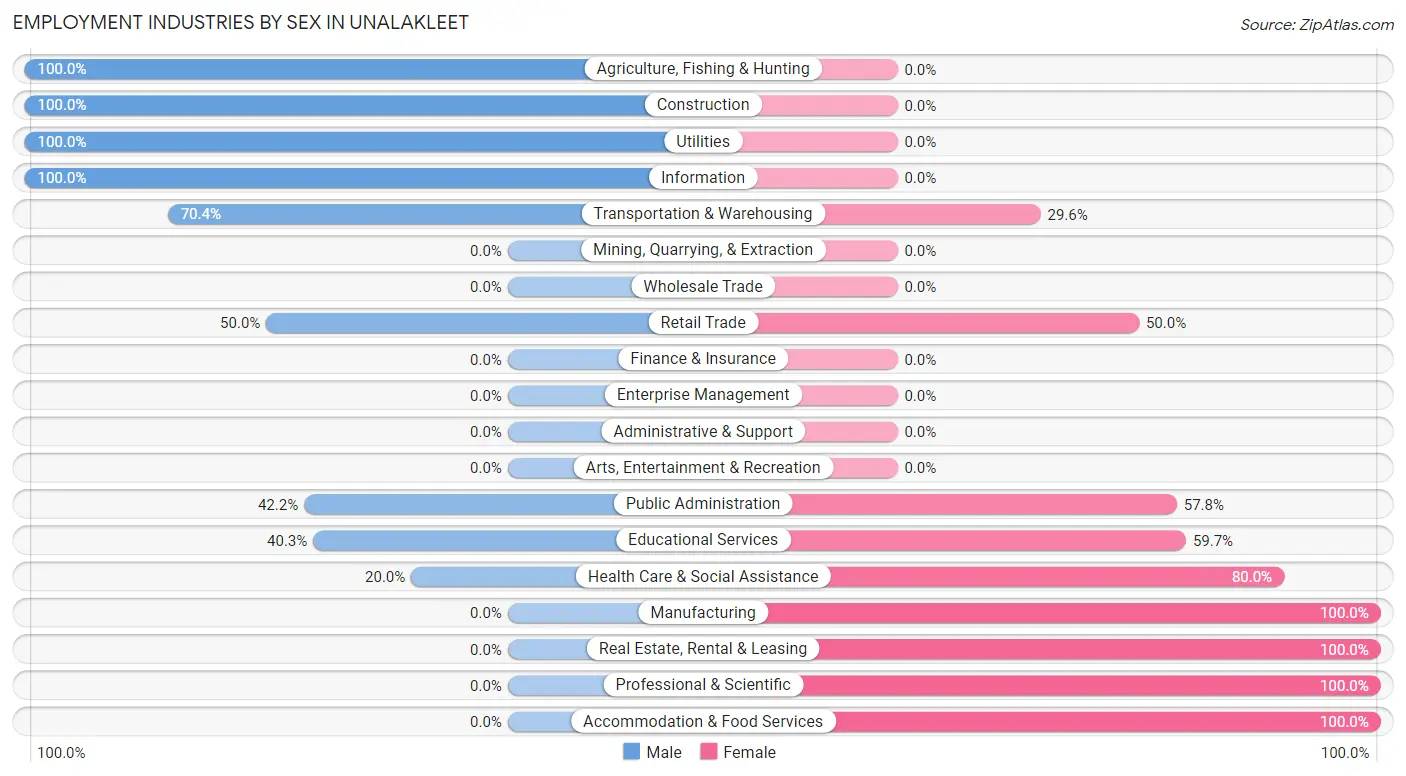
Employment Industries by Sex in Unalakleet
The Unalakleet industries that see more men than women are Agriculture, Fishing & Hunting (100.0%), Construction (100.0%), and Utilities (100.0%), whereas the industries that tend to have a higher number of women are Manufacturing (100.0%), Real Estate, Rental & Leasing (100.0%), and Professional & Scientific (100.0%).
| Industry | Male | Female |
| Agriculture, Fishing & Hunting | 5 (100.0%) | 0 (0.0%) |
| Mining, Quarrying, & Extraction | 0 (0.0%) | 0 (0.0%) |
| Construction | 12 (100.0%) | 0 (0.0%) |
| Manufacturing | 0 (0.0%) | 5 (100.0%) |
| Wholesale Trade | 0 (0.0%) | 0 (0.0%) |
| Retail Trade | 5 (50.0%) | 5 (50.0%) |
| Transportation & Warehousing | 19 (70.4%) | 8 (29.6%) |
| Utilities | 4 (100.0%) | 0 (0.0%) |
| Information | 4 (100.0%) | 0 (0.0%) |
| Finance & Insurance | 0 (0.0%) | 0 (0.0%) |
| Real Estate, Rental & Leasing | 0 (0.0%) | 2 (100.0%) |
| Professional & Scientific | 0 (0.0%) | 2 (100.0%) |
| Enterprise Management | 0 (0.0%) | 0 (0.0%) |
| Administrative & Support | 0 (0.0%) | 0 (0.0%) |
| Educational Services | 87 (40.3%) | 129 (59.7%) |
| Health Care & Social Assistance | 2 (20.0%) | 8 (80.0%) |
| Arts, Entertainment & Recreation | 0 (0.0%) | 0 (0.0%) |
| Accommodation & Food Services | 0 (0.0%) | 7 (100.0%) |
| Public Administration | 35 (42.2%) | 48 (57.8%) |
| Total | 179 (45.6%) | 214 (54.4%) |
Education in Unalakleet
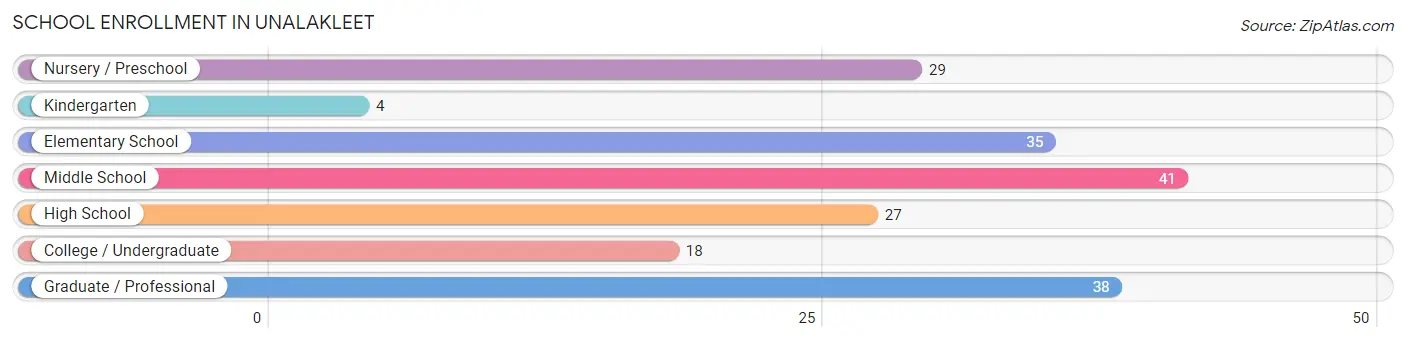
School Enrollment in Unalakleet
The most common levels of schooling among the 192 students in Unalakleet are middle school (41 | 21.3%), graduate / professional (38 | 19.8%), and elementary school (35 | 18.2%).
| School Level | # Students | % Students |
| Nursery / Preschool | 29 | 15.1% |
| Kindergarten | 4 | 2.1% |
| Elementary School | 35 | 18.2% |
| Middle School | 41 | 21.3% |
| High School | 27 | 14.1% |
| College / Undergraduate | 18 | 9.4% |
| Graduate / Professional | 38 | 19.8% |
| Total | 192 | 100.0% |
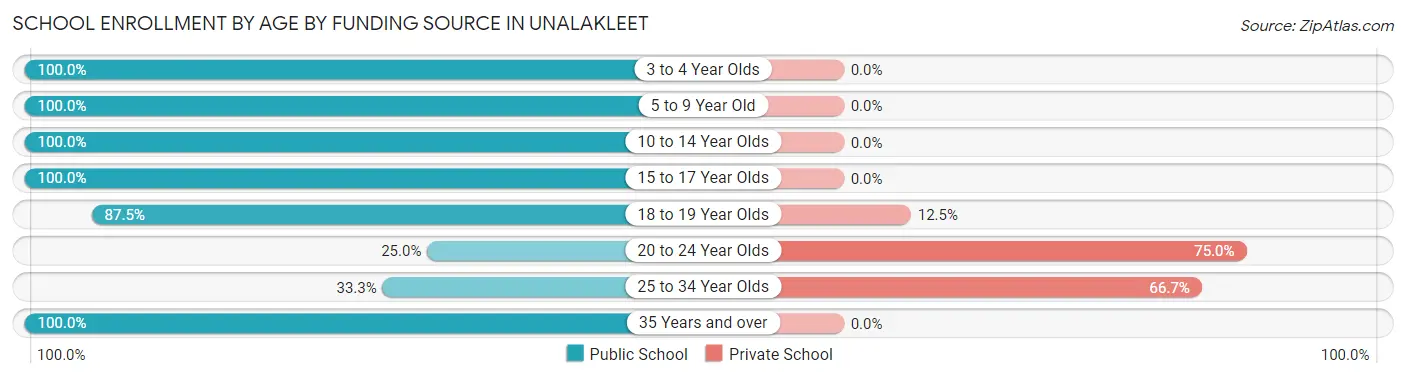
School Enrollment by Age by Funding Source in Unalakleet
Out of a total of 192 students who are enrolled in schools in Unalakleet, 11 (5.7%) attend a private institution, while the remaining 181 (94.3%) are enrolled in public schools. The age group of 20 to 24 year olds has the highest likelihood of being enrolled in private schools, with 6 (75.0% in the age bracket) enrolled. Conversely, the age group of 3 to 4 year olds has the lowest likelihood of being enrolled in a private school, with 29 (100.0% in the age bracket) attending a public institution.
| Age Bracket | Public School | Private School |
| 3 to 4 Year Olds | 29 (100.0%) | 0 (0.0%) |
| 5 to 9 Year Old | 37 (100.0%) | 0 (0.0%) |
| 10 to 14 Year Olds | 52 (100.0%) | 0 (0.0%) |
| 15 to 17 Year Olds | 14 (100.0%) | 0 (0.0%) |
| 18 to 19 Year Olds | 7 (87.5%) | 1 (12.5%) |
| 20 to 24 Year Olds | 2 (25.0%) | 6 (75.0%) |
| 25 to 34 Year Olds | 2 (33.3%) | 4 (66.7%) |
| 35 Years and over | 38 (100.0%) | 0 (0.0%) |
| Total | 181 (94.3%) | 11 (5.7%) |
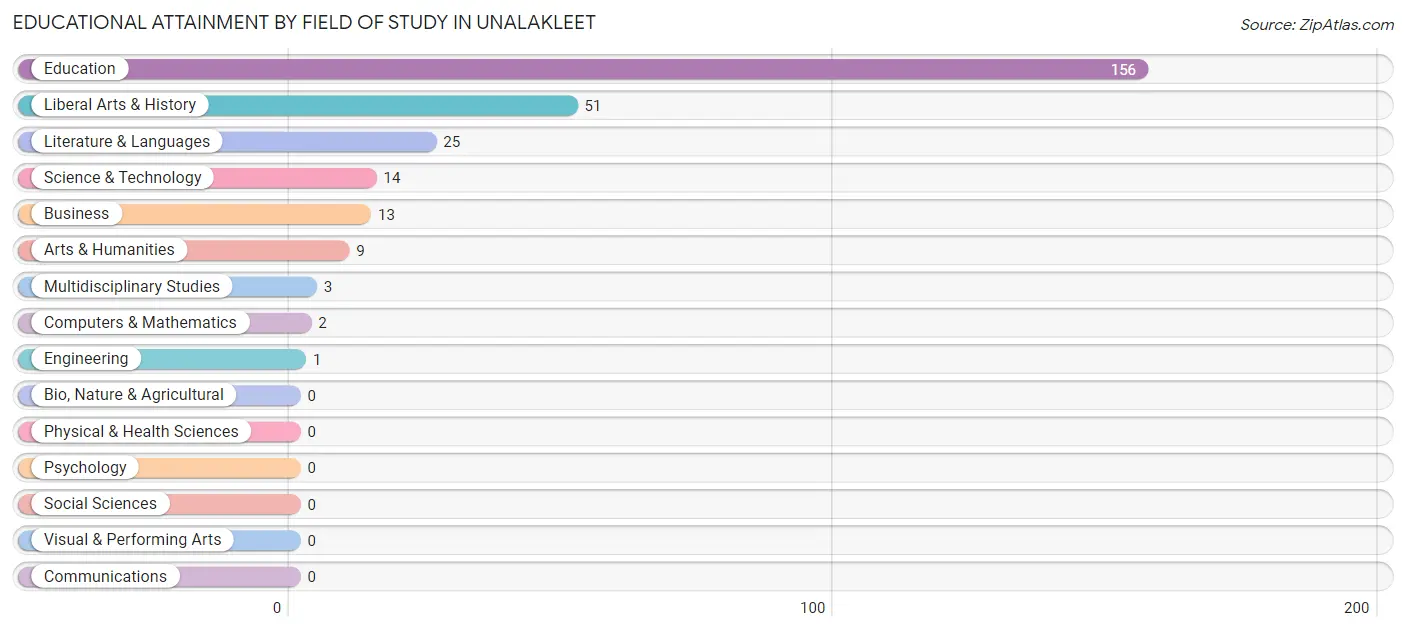
Educational Attainment by Field of Study in Unalakleet
Education (156 | 56.9%), liberal arts & history (51 | 18.6%), literature & languages (25 | 9.1%), science & technology (14 | 5.1%), and business (13 | 4.7%) are the most common fields of study among 274 individuals in Unalakleet who have obtained a bachelor's degree or higher.
| Field of Study | # Graduates | % Graduates |
| Computers & Mathematics | 2 | 0.7% |
| Bio, Nature & Agricultural | 0 | 0.0% |
| Physical & Health Sciences | 0 | 0.0% |
| Psychology | 0 | 0.0% |
| Social Sciences | 0 | 0.0% |
| Engineering | 1 | 0.4% |
| Multidisciplinary Studies | 3 | 1.1% |
| Science & Technology | 14 | 5.1% |
| Business | 13 | 4.7% |
| Education | 156 | 56.9% |
| Literature & Languages | 25 | 9.1% |
| Liberal Arts & History | 51 | 18.6% |
| Visual & Performing Arts | 0 | 0.0% |
| Communications | 0 | 0.0% |
| Arts & Humanities | 9 | 3.3% |
| Total | 274 | 100.0% |
Transportation & Commute in Unalakleet
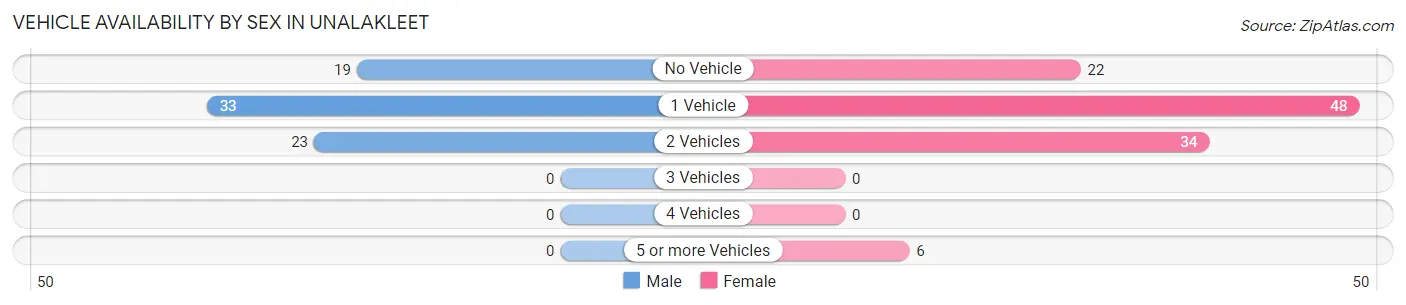
Vehicle Availability by Sex in Unalakleet
The most prevalent vehicle ownership categories in Unalakleet are males with 1 vehicle (33, accounting for 44.0%) and females with 1 vehicle (48, making up 30.0%).
| Vehicles Available | Male | Female |
| No Vehicle | 19 (25.3%) | 22 (20.0%) |
| 1 Vehicle | 33 (44.0%) | 48 (43.6%) |
| 2 Vehicles | 23 (30.7%) | 34 (30.9%) |
| 3 Vehicles | 0 (0.0%) | 0 (0.0%) |
| 4 Vehicles | 0 (0.0%) | 0 (0.0%) |
| 5 or more Vehicles | 0 (0.0%) | 6 (5.4%) |
| Total | 75 (100.0%) | 110 (100.0%) |
Commute Time in Unalakleet
The most frequently occuring commute durations in Unalakleet are less than 5 minutes (268 commuters, 74.9%), 5 to 9 minutes (67 commuters, 18.7%), and 10 to 14 minutes (20 commuters, 5.6%).
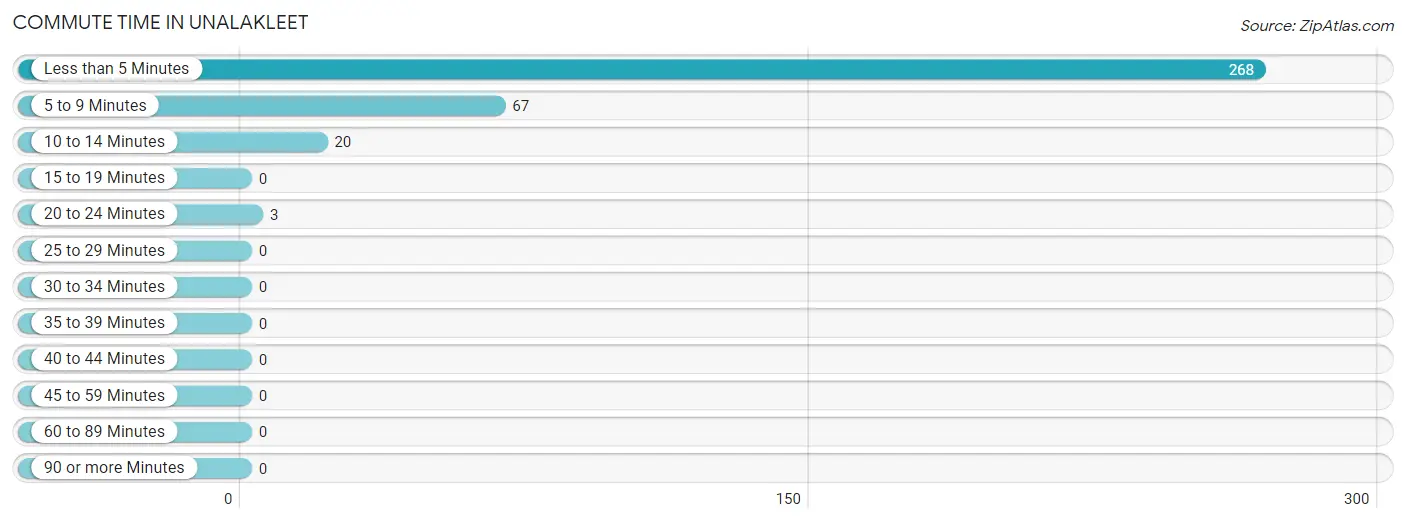
| Commute Time | # Commuters | % Commuters |
| Less than 5 Minutes | 268 | 74.9% |
| 5 to 9 Minutes | 67 | 18.7% |
| 10 to 14 Minutes | 20 | 5.6% |
| 15 to 19 Minutes | 0 | 0.0% |
| 20 to 24 Minutes | 3 | 0.8% |
| 25 to 29 Minutes | 0 | 0.0% |
| 30 to 34 Minutes | 0 | 0.0% |
| 35 to 39 Minutes | 0 | 0.0% |
| 40 to 44 Minutes | 0 | 0.0% |
| 45 to 59 Minutes | 0 | 0.0% |
| 60 to 89 Minutes | 0 | 0.0% |
| 90 or more Minutes | 0 | 0.0% |
Commute Time by Sex in Unalakleet
The most common commute times in Unalakleet are less than 5 minutes (152 commuters, 86.4%) for males and less than 5 minutes (116 commuters, 63.7%) for females.
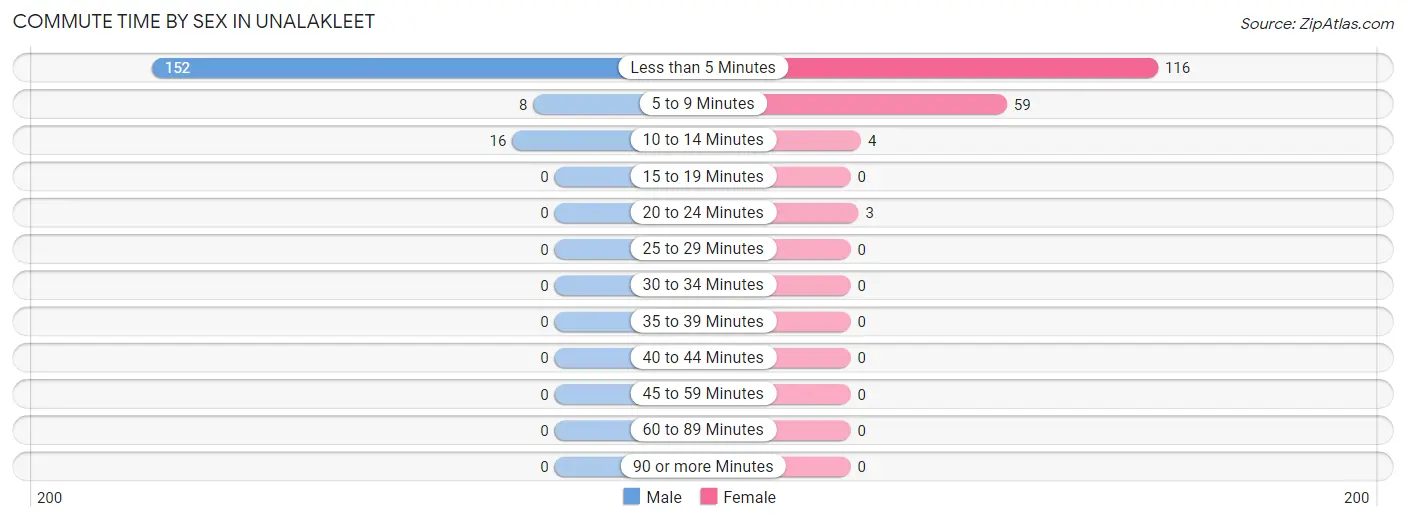
| Commute Time | Male | Female |
| Less than 5 Minutes | 152 (86.4%) | 116 (63.7%) |
| 5 to 9 Minutes | 8 (4.5%) | 59 (32.4%) |
| 10 to 14 Minutes | 16 (9.1%) | 4 (2.2%) |
| 15 to 19 Minutes | 0 (0.0%) | 0 (0.0%) |
| 20 to 24 Minutes | 0 (0.0%) | 3 (1.7%) |
| 25 to 29 Minutes | 0 (0.0%) | 0 (0.0%) |
| 30 to 34 Minutes | 0 (0.0%) | 0 (0.0%) |
| 35 to 39 Minutes | 0 (0.0%) | 0 (0.0%) |
| 40 to 44 Minutes | 0 (0.0%) | 0 (0.0%) |
| 45 to 59 Minutes | 0 (0.0%) | 0 (0.0%) |
| 60 to 89 Minutes | 0 (0.0%) | 0 (0.0%) |
| 90 or more Minutes | 0 (0.0%) | 0 (0.0%) |
Time of Departure to Work by Sex in Unalakleet
The most frequent times of departure to work in Unalakleet are 8:00 AM to 8:29 AM (61, 34.7%) for males and 7:30 AM to 7:59 AM (90, 49.4%) for females.
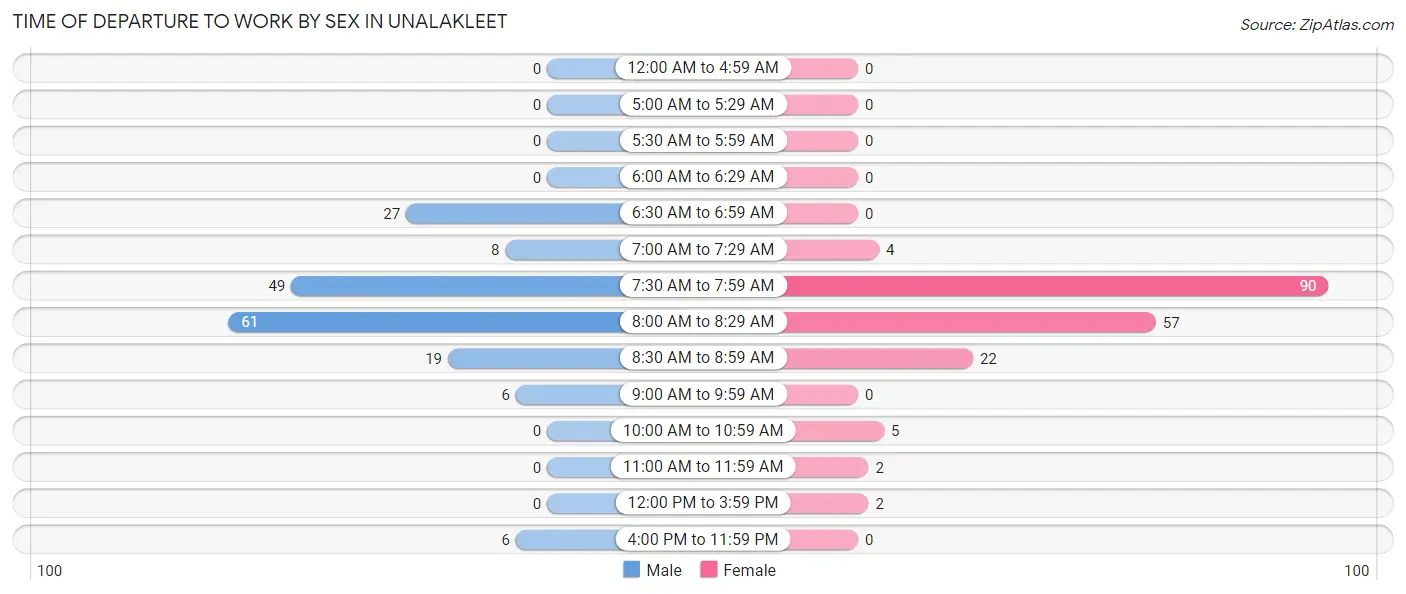
| Time of Departure | Male | Female |
| 12:00 AM to 4:59 AM | 0 (0.0%) | 0 (0.0%) |
| 5:00 AM to 5:29 AM | 0 (0.0%) | 0 (0.0%) |
| 5:30 AM to 5:59 AM | 0 (0.0%) | 0 (0.0%) |
| 6:00 AM to 6:29 AM | 0 (0.0%) | 0 (0.0%) |
| 6:30 AM to 6:59 AM | 27 (15.3%) | 0 (0.0%) |
| 7:00 AM to 7:29 AM | 8 (4.5%) | 4 (2.2%) |
| 7:30 AM to 7:59 AM | 49 (27.8%) | 90 (49.4%) |
| 8:00 AM to 8:29 AM | 61 (34.7%) | 57 (31.3%) |
| 8:30 AM to 8:59 AM | 19 (10.8%) | 22 (12.1%) |
| 9:00 AM to 9:59 AM | 6 (3.4%) | 0 (0.0%) |
| 10:00 AM to 10:59 AM | 0 (0.0%) | 5 (2.8%) |
| 11:00 AM to 11:59 AM | 0 (0.0%) | 2 (1.1%) |
| 12:00 PM to 3:59 PM | 0 (0.0%) | 2 (1.1%) |
| 4:00 PM to 11:59 PM | 6 (3.4%) | 0 (0.0%) |
| Total | 176 (100.0%) | 182 (100.0%) |
Housing Occupancy in Unalakleet
Occupancy by Ownership in Unalakleet
Of the total 159 dwellings in Unalakleet, owner-occupied units account for 103 (64.8%), while renter-occupied units make up 56 (35.2%).
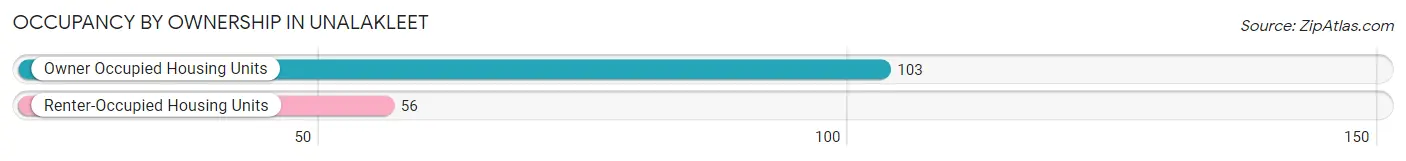
| Occupancy | # Housing Units | % Housing Units |
| Owner Occupied Housing Units | 103 | 64.8% |
| Renter-Occupied Housing Units | 56 | 35.2% |
| Total Occupied Housing Units | 159 | 100.0% |
Occupancy by Household Size in Unalakleet
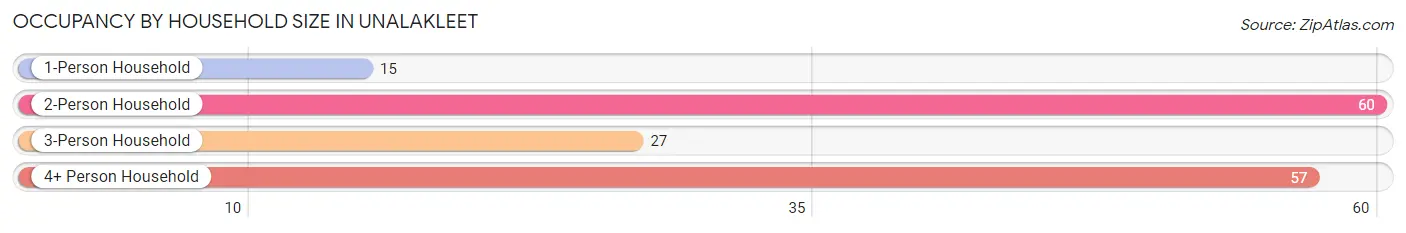
| Household Size | # Housing Units | % Housing Units |
| 1-Person Household | 15 | 9.4% |
| 2-Person Household | 60 | 37.7% |
| 3-Person Household | 27 | 17.0% |
| 4+ Person Household | 57 | 35.8% |
| Total Housing Units | 159 | 100.0% |
Occupancy by Ownership by Household Size in Unalakleet
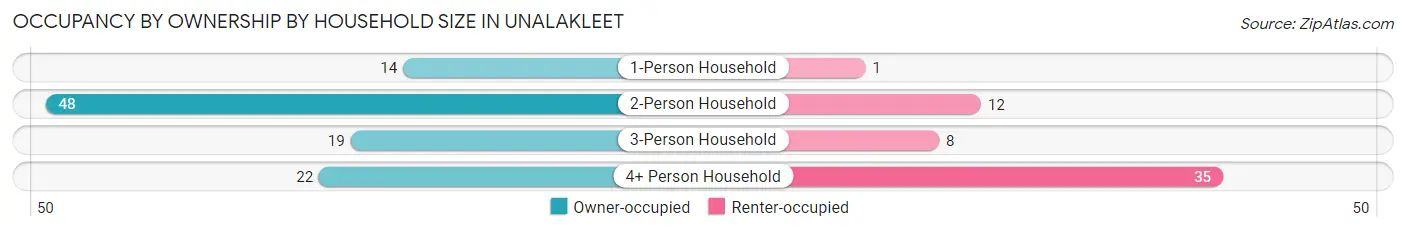
| Household Size | Owner-occupied | Renter-occupied |
| 1-Person Household | 14 (93.3%) | 1 (6.7%) |
| 2-Person Household | 48 (80.0%) | 12 (20.0%) |
| 3-Person Household | 19 (70.4%) | 8 (29.6%) |
| 4+ Person Household | 22 (38.6%) | 35 (61.4%) |
| Total Housing Units | 103 (64.8%) | 56 (35.2%) |
Occupancy by Educational Attainment in Unalakleet
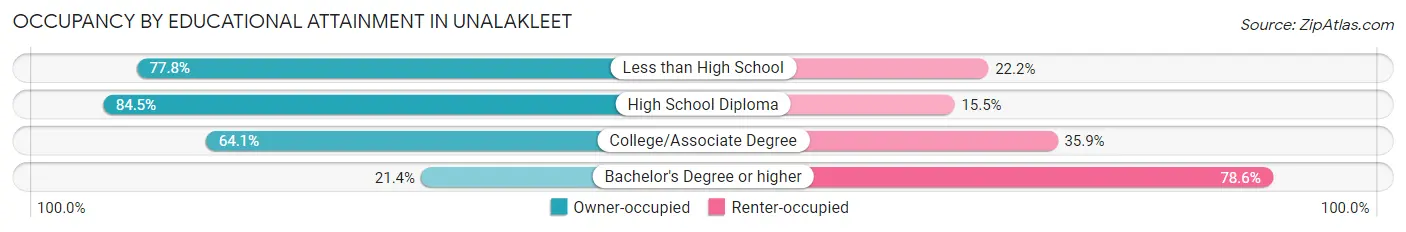
| Household Size | Owner-occupied | Renter-occupied |
| Less than High School | 7 (77.8%) | 2 (22.2%) |
| High School Diploma | 49 (84.5%) | 9 (15.5%) |
| College/Associate Degree | 41 (64.1%) | 23 (35.9%) |
| Bachelor's Degree or higher | 6 (21.4%) | 22 (78.6%) |
Occupancy by Age of Householder in Unalakleet
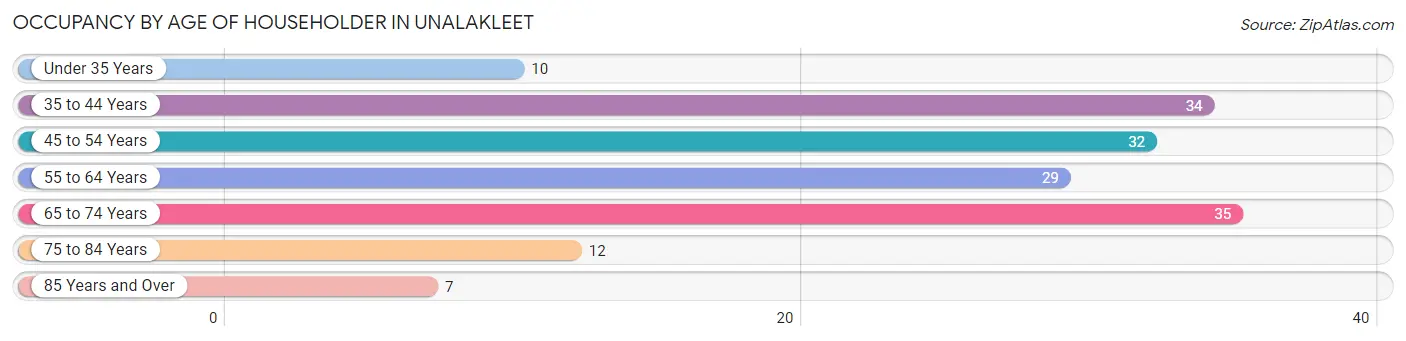
| Age Bracket | # Households | % Households |
| Under 35 Years | 10 | 6.3% |
| 35 to 44 Years | 34 | 21.4% |
| 45 to 54 Years | 32 | 20.1% |
| 55 to 64 Years | 29 | 18.2% |
| 65 to 74 Years | 35 | 22.0% |
| 75 to 84 Years | 12 | 7.5% |
| 85 Years and Over | 7 | 4.4% |
| Total | 159 | 100.0% |
Housing Finances in Unalakleet
Median Income by Occupancy in Unalakleet
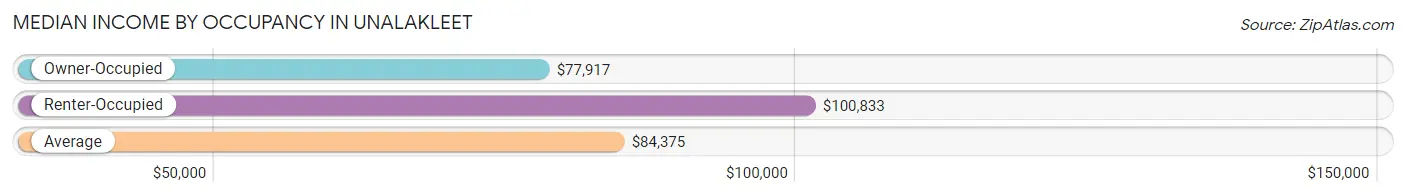
| Occupancy Type | # Households | Median Income |
| Owner-Occupied | 103 (64.8%) | $77,917 |
| Renter-Occupied | 56 (35.2%) | $100,833 |
| Average | 159 (100.0%) | $84,375 |
Occupancy by Householder Income Bracket in Unalakleet
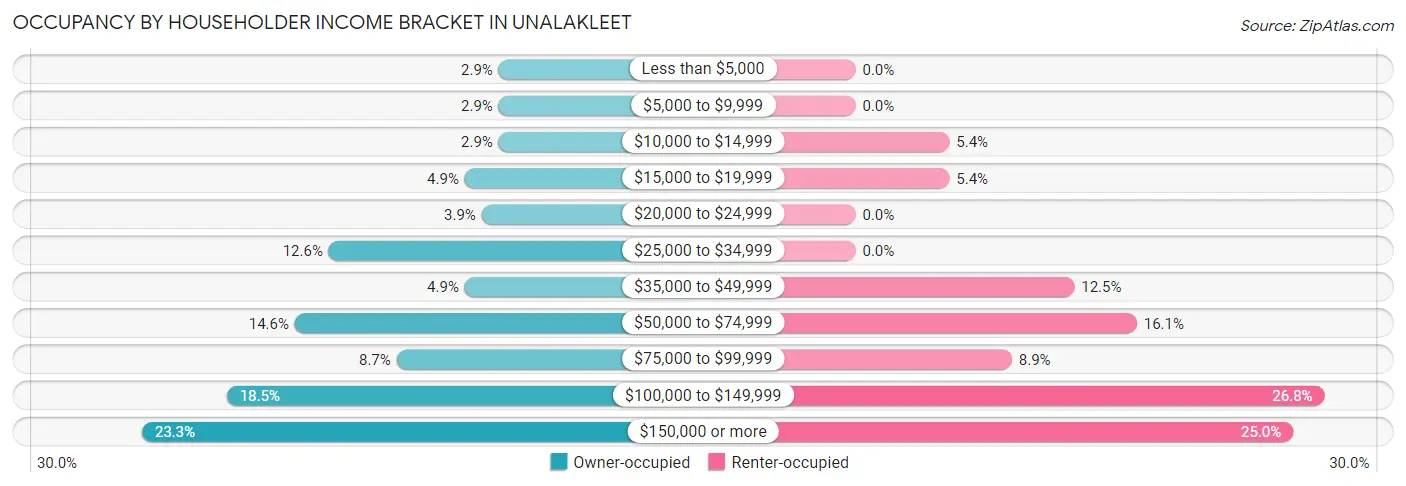
| Income Bracket | Owner-occupied | Renter-occupied |
| Less than $5,000 | 3 (2.9%) | 0 (0.0%) |
| $5,000 to $9,999 | 3 (2.9%) | 0 (0.0%) |
| $10,000 to $14,999 | 3 (2.9%) | 3 (5.4%) |
| $15,000 to $19,999 | 5 (4.9%) | 3 (5.4%) |
| $20,000 to $24,999 | 4 (3.9%) | 0 (0.0%) |
| $25,000 to $34,999 | 13 (12.6%) | 0 (0.0%) |
| $35,000 to $49,999 | 5 (4.9%) | 7 (12.5%) |
| $50,000 to $74,999 | 15 (14.6%) | 9 (16.1%) |
| $75,000 to $99,999 | 9 (8.7%) | 5 (8.9%) |
| $100,000 to $149,999 | 19 (18.4%) | 15 (26.8%) |
| $150,000 or more | 24 (23.3%) | 14 (25.0%) |
| Total | 103 (100.0%) | 56 (100.0%) |
Monthly Housing Cost Tiers in Unalakleet
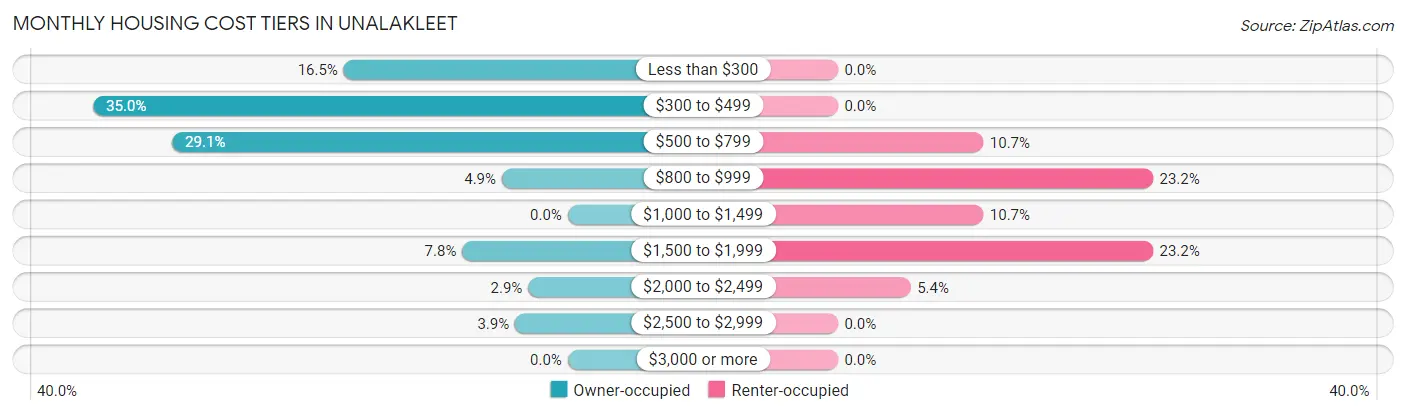
| Monthly Cost | Owner-occupied | Renter-occupied |
| Less than $300 | 17 (16.5%) | 0 (0.0%) |
| $300 to $499 | 36 (34.9%) | 0 (0.0%) |
| $500 to $799 | 30 (29.1%) | 6 (10.7%) |
| $800 to $999 | 5 (4.9%) | 13 (23.2%) |
| $1,000 to $1,499 | 0 (0.0%) | 6 (10.7%) |
| $1,500 to $1,999 | 8 (7.8%) | 13 (23.2%) |
| $2,000 to $2,499 | 3 (2.9%) | 3 (5.4%) |
| $2,500 to $2,999 | 4 (3.9%) | 0 (0.0%) |
| $3,000 or more | 0 (0.0%) | 0 (0.0%) |
| Total | 103 (100.0%) | 56 (100.0%) |
Physical Housing Characteristics in Unalakleet
Housing Structures in Unalakleet
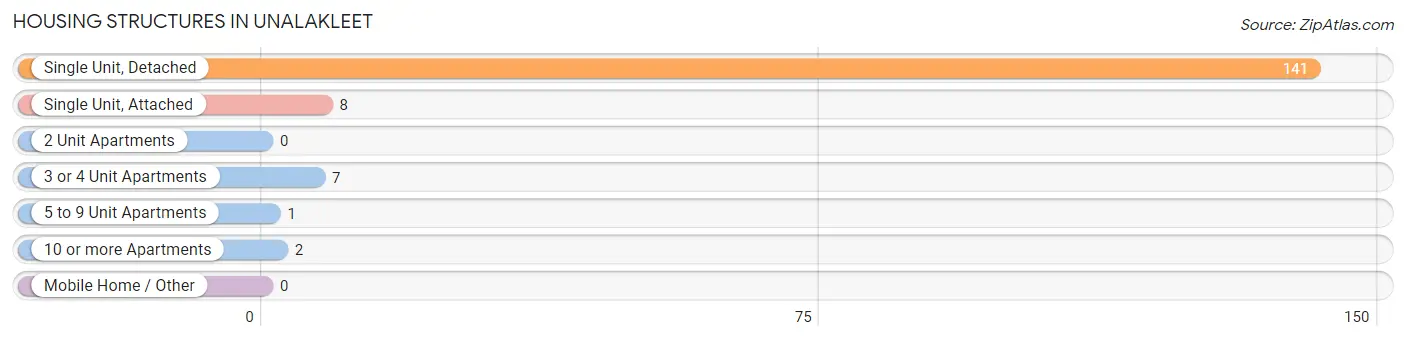
| Structure Type | # Housing Units | % Housing Units |
| Single Unit, Detached | 141 | 88.7% |
| Single Unit, Attached | 8 | 5.0% |
| 2 Unit Apartments | 0 | 0.0% |
| 3 or 4 Unit Apartments | 7 | 4.4% |
| 5 to 9 Unit Apartments | 1 | 0.6% |
| 10 or more Apartments | 2 | 1.3% |
| Mobile Home / Other | 0 | 0.0% |
| Total | 159 | 100.0% |
Housing Structures by Occupancy in Unalakleet
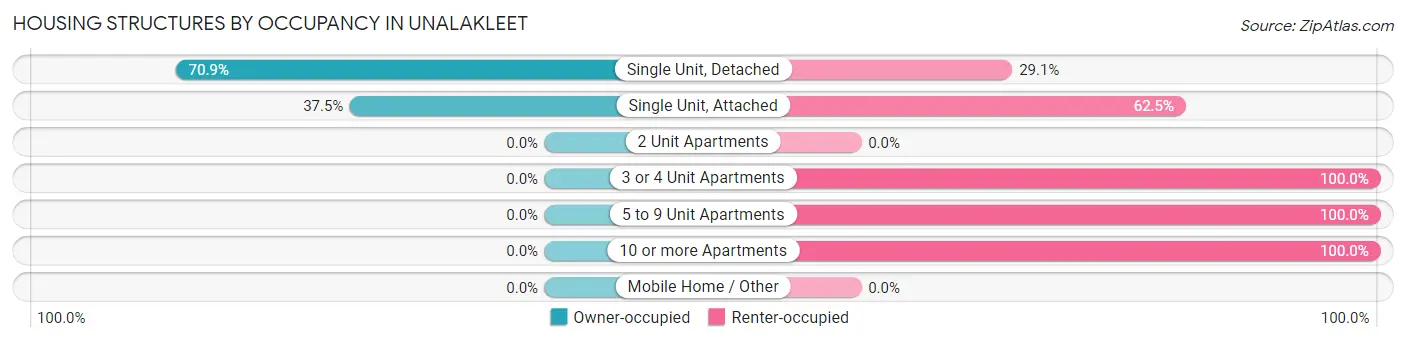
| Structure Type | Owner-occupied | Renter-occupied |
| Single Unit, Detached | 100 (70.9%) | 41 (29.1%) |
| Single Unit, Attached | 3 (37.5%) | 5 (62.5%) |
| 2 Unit Apartments | 0 (0.0%) | 0 (0.0%) |
| 3 or 4 Unit Apartments | 0 (0.0%) | 7 (100.0%) |
| 5 to 9 Unit Apartments | 0 (0.0%) | 1 (100.0%) |
| 10 or more Apartments | 0 (0.0%) | 2 (100.0%) |
| Mobile Home / Other | 0 (0.0%) | 0 (0.0%) |
| Total | 103 (64.8%) | 56 (35.2%) |
Housing Structures by Number of Rooms in Unalakleet
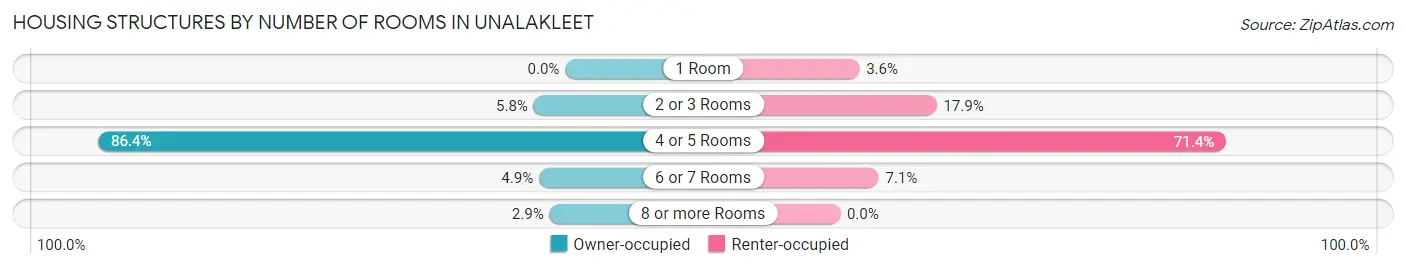
| Number of Rooms | Owner-occupied | Renter-occupied |
| 1 Room | 0 (0.0%) | 2 (3.6%) |
| 2 or 3 Rooms | 6 (5.8%) | 10 (17.9%) |
| 4 or 5 Rooms | 89 (86.4%) | 40 (71.4%) |
| 6 or 7 Rooms | 5 (4.9%) | 4 (7.1%) |
| 8 or more Rooms | 3 (2.9%) | 0 (0.0%) |
| Total | 103 (100.0%) | 56 (100.0%) |
Housing Structure by Heating Type in Unalakleet
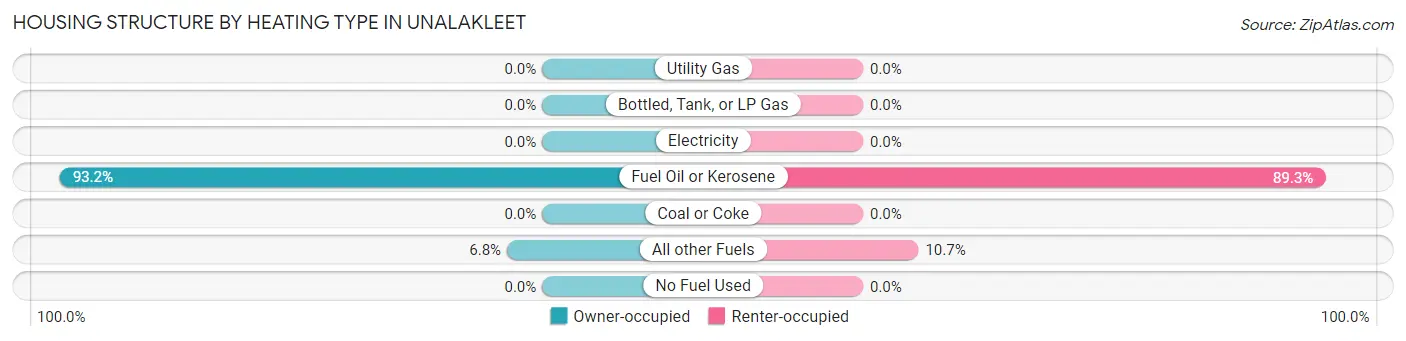
| Heating Type | Owner-occupied | Renter-occupied |
| Utility Gas | 0 (0.0%) | 0 (0.0%) |
| Bottled, Tank, or LP Gas | 0 (0.0%) | 0 (0.0%) |
| Electricity | 0 (0.0%) | 0 (0.0%) |
| Fuel Oil or Kerosene | 96 (93.2%) | 50 (89.3%) |
| Coal or Coke | 0 (0.0%) | 0 (0.0%) |
| All other Fuels | 7 (6.8%) | 6 (10.7%) |
| No Fuel Used | 0 (0.0%) | 0 (0.0%) |
| Total | 103 (100.0%) | 56 (100.0%) |
Household Vehicle Usage in Unalakleet
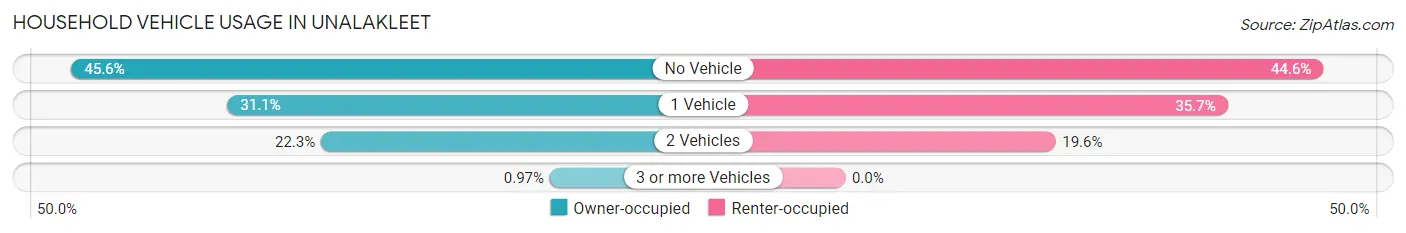
| Vehicles per Household | Owner-occupied | Renter-occupied |
| No Vehicle | 47 (45.6%) | 25 (44.6%) |
| 1 Vehicle | 32 (31.1%) | 20 (35.7%) |
| 2 Vehicles | 23 (22.3%) | 11 (19.6%) |
| 3 or more Vehicles | 1 (1.0%) | 0 (0.0%) |
| Total | 103 (100.0%) | 56 (100.0%) |
Real Estate & Mortgages in Unalakleet
Real Estate and Mortgage Overview in Unalakleet
| Characteristic | Without Mortgage | With Mortgage |
| Housing Units | 83 | 20 |
| Median Property Value | $112,500 | $283,300 |
| Median Household Income | $58,125 | $14 |
| Monthly Housing Costs | $443 | $0 |
| Real Estate Taxes | - | - |
Property Value by Mortgage Status in Unalakleet
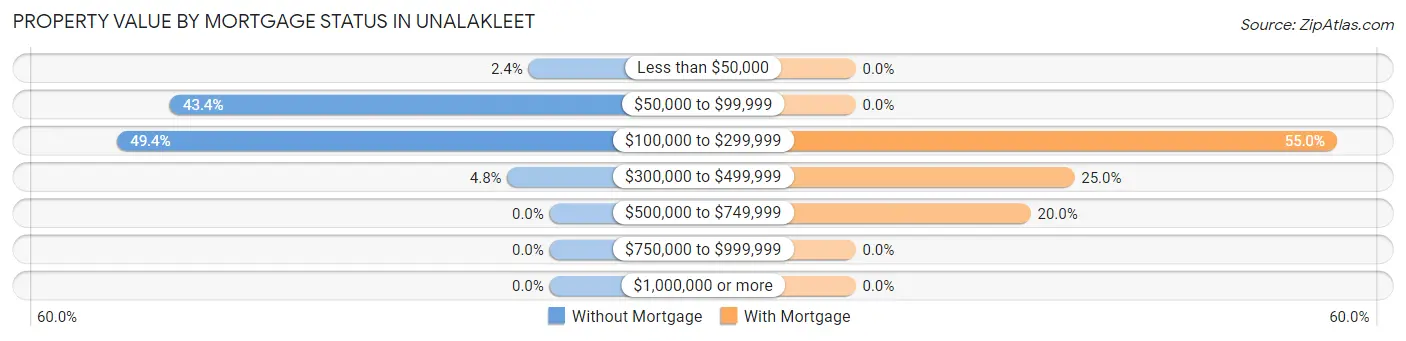
| Property Value | Without Mortgage | With Mortgage |
| Less than $50,000 | 2 (2.4%) | 0 (0.0%) |
| $50,000 to $99,999 | 36 (43.4%) | 0 (0.0%) |
| $100,000 to $299,999 | 41 (49.4%) | 11 (55.0%) |
| $300,000 to $499,999 | 4 (4.8%) | 5 (25.0%) |
| $500,000 to $749,999 | 0 (0.0%) | 4 (20.0%) |
| $750,000 to $999,999 | 0 (0.0%) | 0 (0.0%) |
| $1,000,000 or more | 0 (0.0%) | 0 (0.0%) |
| Total | 83 (100.0%) | 20 (100.0%) |
Household Income by Mortgage Status in Unalakleet
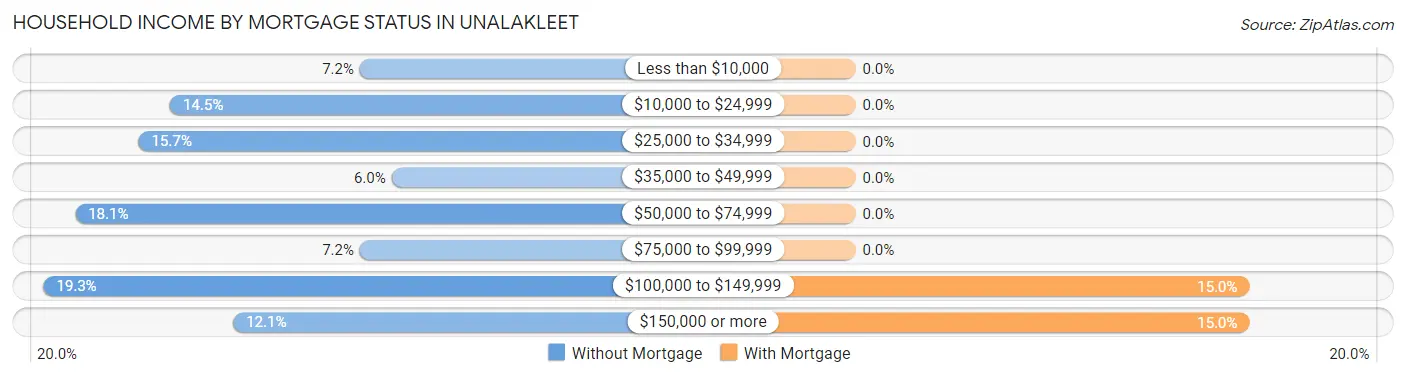
| Household Income | Without Mortgage | With Mortgage |
| Less than $10,000 | 6 (7.2%) | 0 (0.0%) |
| $10,000 to $24,999 | 12 (14.5%) | 0 (0.0%) |
| $25,000 to $34,999 | 13 (15.7%) | 0 (0.0%) |
| $35,000 to $49,999 | 5 (6.0%) | 0 (0.0%) |
| $50,000 to $74,999 | 15 (18.1%) | 0 (0.0%) |
| $75,000 to $99,999 | 6 (7.2%) | 0 (0.0%) |
| $100,000 to $149,999 | 16 (19.3%) | 3 (15.0%) |
| $150,000 or more | 10 (12.0%) | 3 (15.0%) |
| Total | 83 (100.0%) | 20 (100.0%) |
Property Value to Household Income Ratio in Unalakleet
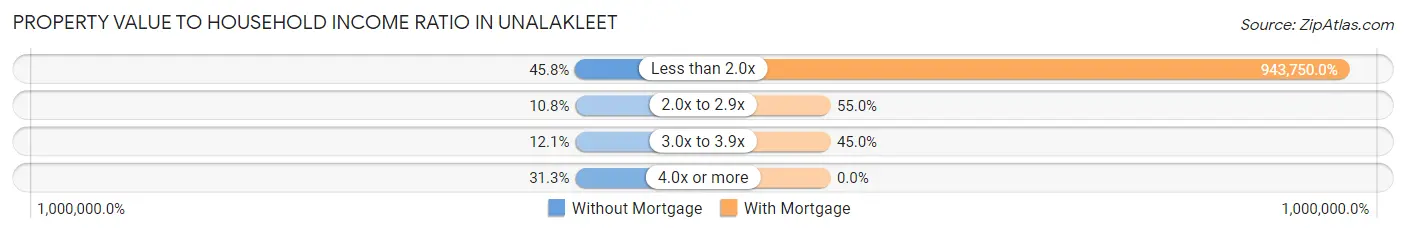
| Value-to-Income Ratio | Without Mortgage | With Mortgage |
| Less than 2.0x | 38 (45.8%) | 188,750 (943,750.0%) |
| 2.0x to 2.9x | 9 (10.8%) | 11 (55.0%) |
| 3.0x to 3.9x | 10 (12.0%) | 9 (45.0%) |
| 4.0x or more | 26 (31.3%) | 0 (0.0%) |
| Total | 83 (100.0%) | 20 (100.0%) |
Real Estate Taxes by Mortgage Status in Unalakleet
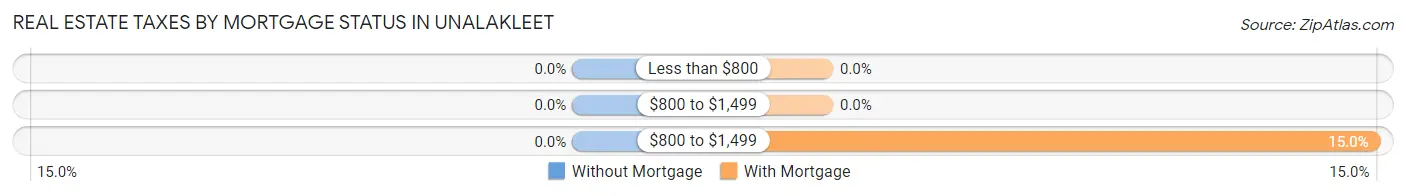
| Property Taxes | Without Mortgage | With Mortgage |
| Less than $800 | 0 (0.0%) | 0 (0.0%) |
| $800 to $1,499 | 0 (0.0%) | 0 (0.0%) |
| $800 to $1,499 | 0 (0.0%) | 3 (15.0%) |
| Total | 83 (100.0%) | 20 (100.0%) |
Health & Disability in Unalakleet
Health Insurance Coverage by Age in Unalakleet
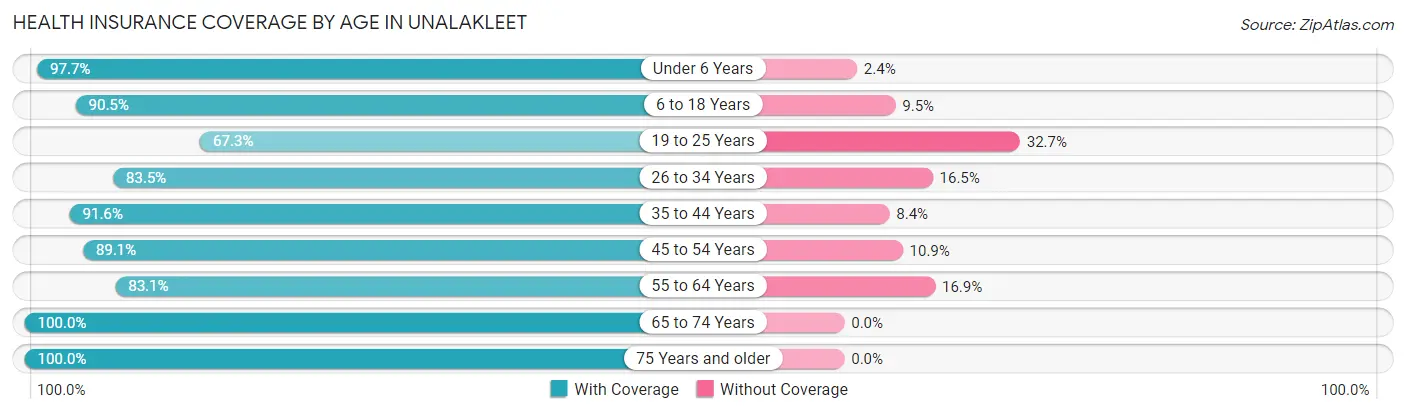
| Age Bracket | With Coverage | Without Coverage |
| Under 6 Years | 83 (97.7%) | 2 (2.4%) |
| 6 to 18 Years | 95 (90.5%) | 10 (9.5%) |
| 19 to 25 Years | 37 (67.3%) | 18 (32.7%) |
| 26 to 34 Years | 71 (83.5%) | 14 (16.5%) |
| 35 to 44 Years | 109 (91.6%) | 10 (8.4%) |
| 45 to 54 Years | 82 (89.1%) | 10 (10.9%) |
| 55 to 64 Years | 108 (83.1%) | 22 (16.9%) |
| 65 to 74 Years | 45 (100.0%) | 0 (0.0%) |
| 75 Years and older | 27 (100.0%) | 0 (0.0%) |
| Total | 657 (88.4%) | 86 (11.6%) |
Health Insurance Coverage by Citizenship Status in Unalakleet
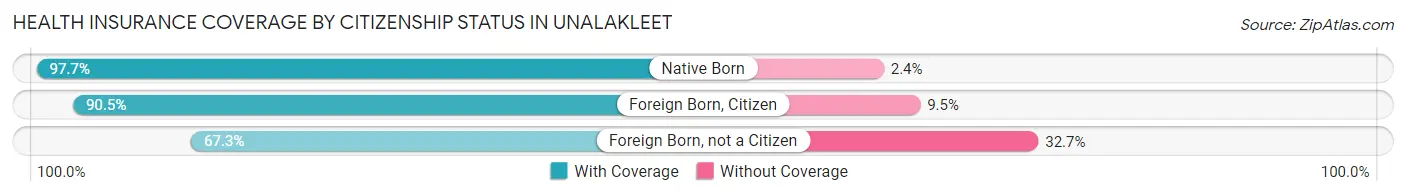
| Citizenship Status | With Coverage | Without Coverage |
| Native Born | 83 (97.7%) | 2 (2.4%) |
| Foreign Born, Citizen | 95 (90.5%) | 10 (9.5%) |
| Foreign Born, not a Citizen | 37 (67.3%) | 18 (32.7%) |
Health Insurance Coverage by Household Income in Unalakleet
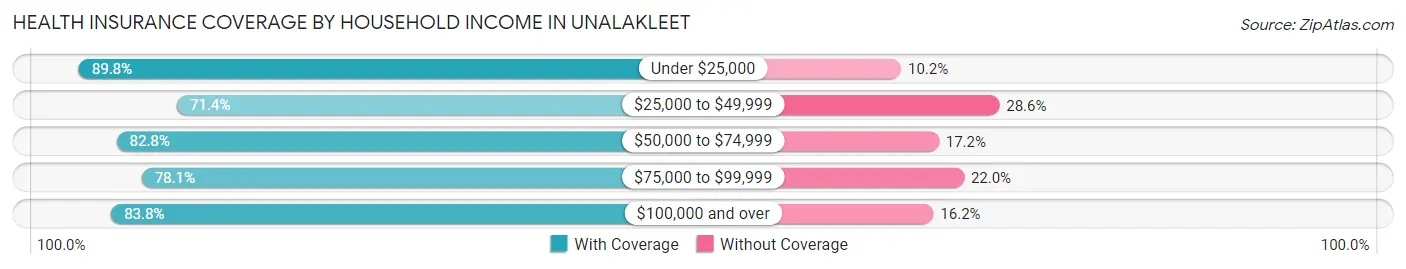
| Household Income | With Coverage | Without Coverage |
| Under $25,000 | 53 (89.8%) | 6 (10.2%) |
| $25,000 to $49,999 | 45 (71.4%) | 18 (28.6%) |
| $50,000 to $74,999 | 48 (82.8%) | 10 (17.2%) |
| $75,000 to $99,999 | 32 (78.0%) | 9 (22.0%) |
| $100,000 and over | 222 (83.8%) | 43 (16.2%) |
Public vs Private Health Insurance Coverage by Age in Unalakleet
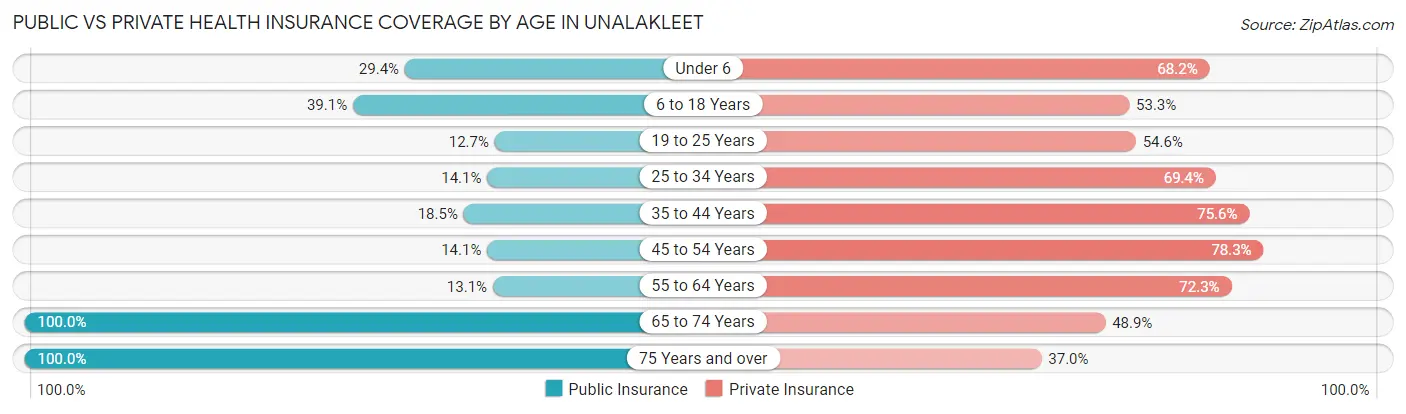
| Age Bracket | Public Insurance | Private Insurance |
| Under 6 | 25 (29.4%) | 58 (68.2%) |
| 6 to 18 Years | 41 (39.1%) | 56 (53.3%) |
| 19 to 25 Years | 7 (12.7%) | 30 (54.5%) |
| 25 to 34 Years | 12 (14.1%) | 59 (69.4%) |
| 35 to 44 Years | 22 (18.5%) | 90 (75.6%) |
| 45 to 54 Years | 13 (14.1%) | 72 (78.3%) |
| 55 to 64 Years | 17 (13.1%) | 94 (72.3%) |
| 65 to 74 Years | 45 (100.0%) | 22 (48.9%) |
| 75 Years and over | 27 (100.0%) | 10 (37.0%) |
| Total | 209 (28.1%) | 491 (66.1%) |
Disability Status by Sex by Age in Unalakleet
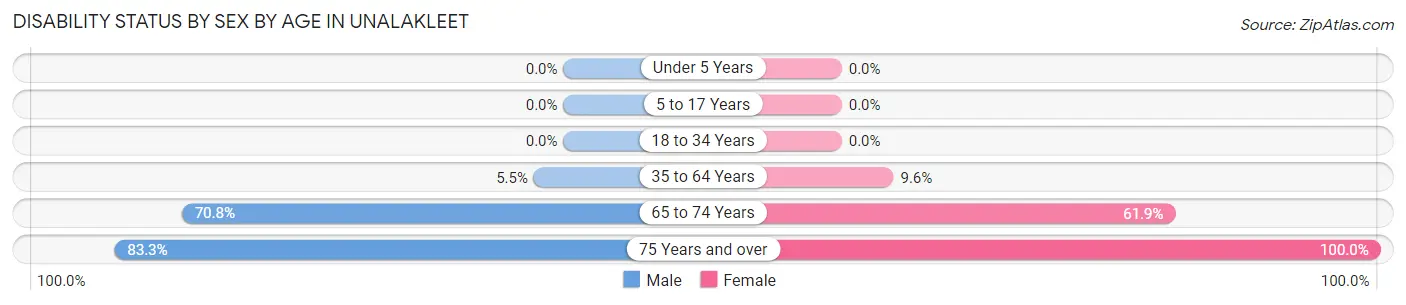
| Age Bracket | Male | Female |
| Under 5 Years | 0 (0.0%) | 0 (0.0%) |
| 5 to 17 Years | 0 (0.0%) | 0 (0.0%) |
| 18 to 34 Years | 0 (0.0%) | 0 (0.0%) |
| 35 to 64 Years | 9 (5.5%) | 17 (9.6%) |
| 65 to 74 Years | 17 (70.8%) | 13 (61.9%) |
| 75 Years and over | 10 (83.3%) | 15 (100.0%) |
Disability Class by Sex by Age in Unalakleet
Disability Class: Hearing Difficulty
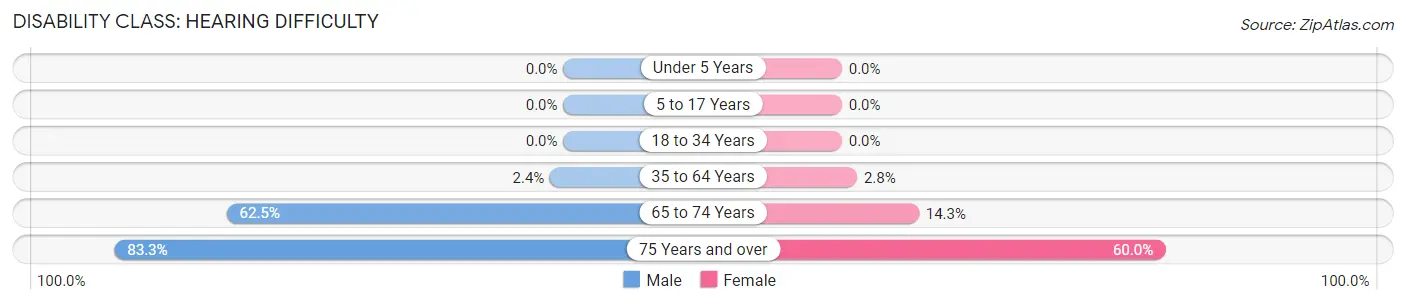
| Age Bracket | Male | Female |
| Under 5 Years | 0 (0.0%) | 0 (0.0%) |
| 5 to 17 Years | 0 (0.0%) | 0 (0.0%) |
| 18 to 34 Years | 0 (0.0%) | 0 (0.0%) |
| 35 to 64 Years | 4 (2.4%) | 5 (2.8%) |
| 65 to 74 Years | 15 (62.5%) | 3 (14.3%) |
| 75 Years and over | 10 (83.3%) | 9 (60.0%) |
Disability Class: Vision Difficulty
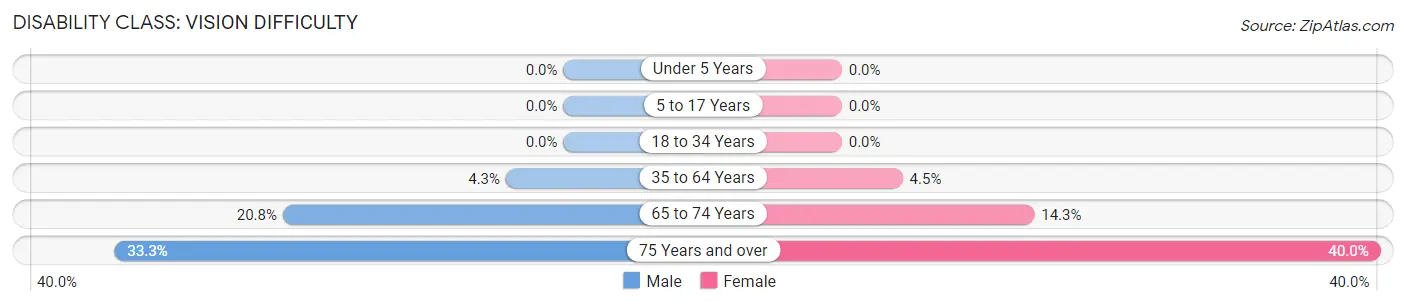
| Age Bracket | Male | Female |
| Under 5 Years | 0 (0.0%) | 0 (0.0%) |
| 5 to 17 Years | 0 (0.0%) | 0 (0.0%) |
| 18 to 34 Years | 0 (0.0%) | 0 (0.0%) |
| 35 to 64 Years | 7 (4.3%) | 8 (4.5%) |
| 65 to 74 Years | 5 (20.8%) | 3 (14.3%) |
| 75 Years and over | 4 (33.3%) | 6 (40.0%) |
Disability Class: Cognitive Difficulty
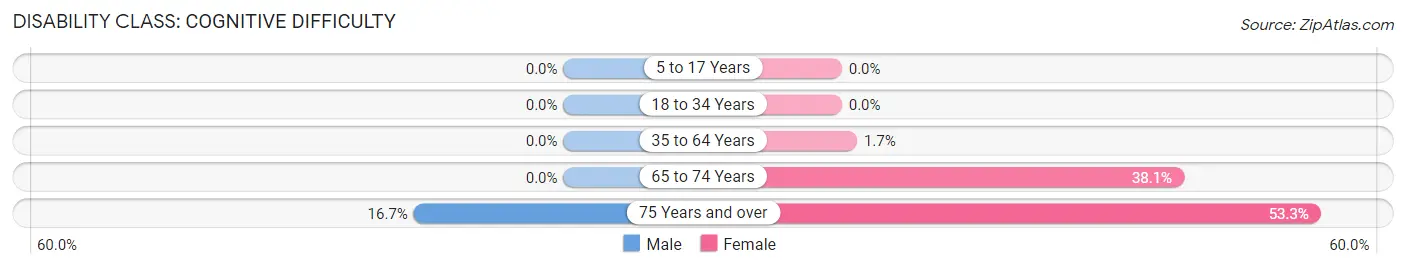
| Age Bracket | Male | Female |
| 5 to 17 Years | 0 (0.0%) | 0 (0.0%) |
| 18 to 34 Years | 0 (0.0%) | 0 (0.0%) |
| 35 to 64 Years | 0 (0.0%) | 3 (1.7%) |
| 65 to 74 Years | 0 (0.0%) | 8 (38.1%) |
| 75 Years and over | 2 (16.7%) | 8 (53.3%) |
Disability Class: Ambulatory Difficulty
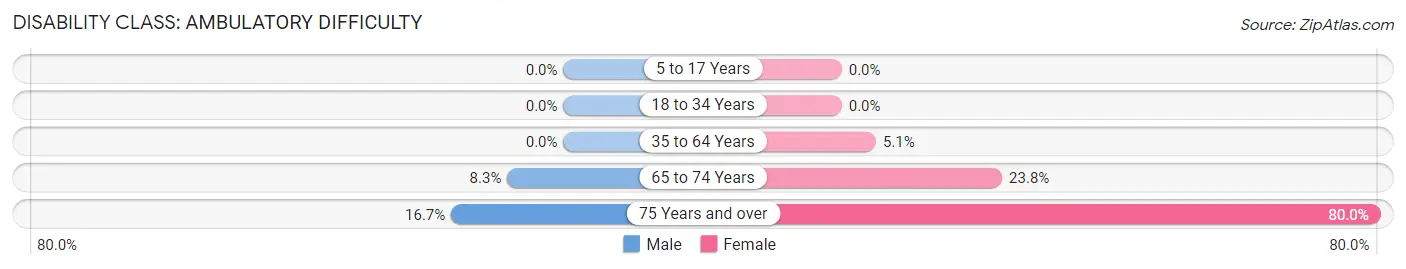
| Age Bracket | Male | Female |
| 5 to 17 Years | 0 (0.0%) | 0 (0.0%) |
| 18 to 34 Years | 0 (0.0%) | 0 (0.0%) |
| 35 to 64 Years | 0 (0.0%) | 9 (5.1%) |
| 65 to 74 Years | 2 (8.3%) | 5 (23.8%) |
| 75 Years and over | 2 (16.7%) | 12 (80.0%) |
Disability Class: Self-Care Difficulty
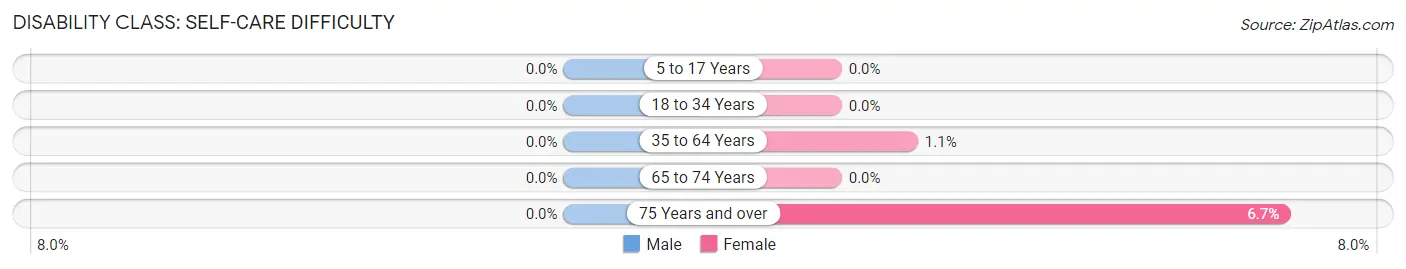
| Age Bracket | Male | Female |
| 5 to 17 Years | 0 (0.0%) | 0 (0.0%) |
| 18 to 34 Years | 0 (0.0%) | 0 (0.0%) |
| 35 to 64 Years | 0 (0.0%) | 2 (1.1%) |
| 65 to 74 Years | 0 (0.0%) | 0 (0.0%) |
| 75 Years and over | 0 (0.0%) | 1 (6.7%) |
Technology Access in Unalakleet
Computing Device Access in Unalakleet
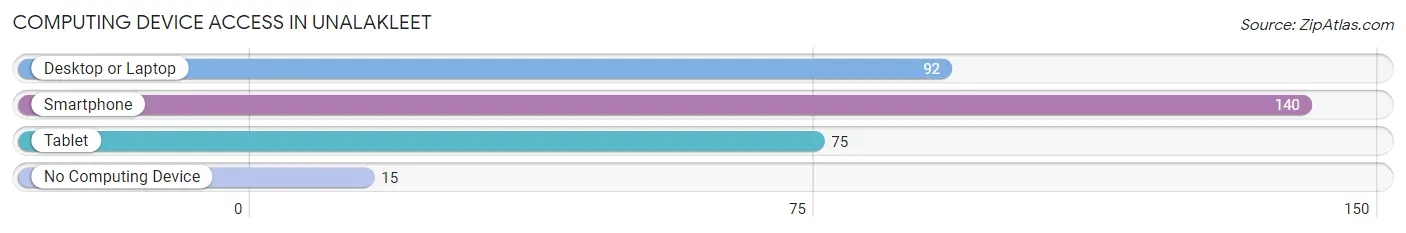
| Device Type | # Households | % Households |
| Desktop or Laptop | 92 | 57.9% |
| Smartphone | 140 | 88.0% |
| Tablet | 75 | 47.2% |
| No Computing Device | 15 | 9.4% |
| Total | 159 | 100.0% |
Internet Access in Unalakleet
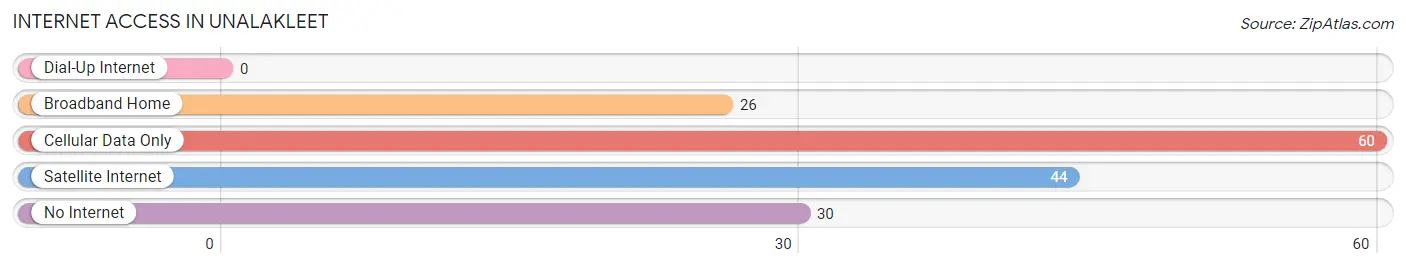
| Internet Type | # Households | % Households |
| Dial-Up Internet | 0 | 0.0% |
| Broadband Home | 26 | 16.4% |
| Cellular Data Only | 60 | 37.7% |
| Satellite Internet | 44 | 27.7% |
| No Internet | 30 | 18.9% |
| Total | 159 | 100.0% |
Unalakleet Summary
Unalakleet, Alaska is a small city located on the Norton Sound of the Bering Sea in the Northwest Arctic Borough of Alaska. It is the largest city in the borough and is home to about 800 people. The city is located on the Unalakleet River, which is a major tributary of the Yukon River. Unalakleet is a traditional Yup'ik Eskimo village and has been inhabited for thousands of years.
Geography
Unalakleet is located on the western coast of Alaska, about 200 miles northwest of Anchorage. The city is situated on the Unalakleet River, which is a major tributary of the Yukon River. The city is surrounded by mountains and is located in a valley. The climate in Unalakleet is subarctic, with cold winters and mild summers. The average temperature in the summer is around 50°F and in the winter it is around 10°F.
Economy
Unalakleet’s economy is largely based on fishing and subsistence activities. The city is home to a number of commercial fishing operations, which provide employment for many of the city’s residents. The city also has a small tourism industry, with visitors coming to experience the traditional Yup'ik culture and to take part in outdoor activities such as fishing, hunting, and camping.
Demographics
As of the 2010 census, Unalakleet had a population of 803 people. The racial makeup of the city was 95.3% Native American, 2.2% White, 0.2% Asian, 0.1% Pacific Islander, 0.1% from other races, and 1.9% from two or more races. The median age in Unalakleet was 28.5 years, with 24.3% of the population under the age of 18 and 11.2% over the age of 65.
History
Unalakleet has been inhabited for thousands of years by the Yup'ik Eskimos. The city was first visited by Europeans in 1741, when the Russian explorer Vitus Bering sailed through the area. In the late 19th century, the city became a trading post for fur traders and whalers. In the early 20th century, the city was a major hub for the Alaska Railroad. In the 1950s, the city was connected to the rest of Alaska by the Alaska Highway.
Today, Unalakleet is a small city with a population of about 800 people. The city is still home to a number of traditional Yup'ik Eskimo activities, such as fishing, hunting, and subsistence activities. The city is also home to a number of modern amenities, such as a hospital, a library, and a post office. Unalakleet is a popular destination for tourists, who come to experience the traditional Yup'ik culture and to take part in outdoor activities such as fishing, hunting, and camping.
Common Questions
What is Per Capita Income in Unalakleet?
Per Capita income in Unalakleet is $44,740.
What is the Median Family Income in Unalakleet?
Median Family Income in Unalakleet is $96,786.
What is the Median Household income in Unalakleet?
Median Household Income in Unalakleet is $84,375.
What is Income or Wage Gap in Unalakleet?
Income or Wage Gap in Unalakleet is 13.9%.
Women in Unalakleet earn 86.1 cents for every dollar earned by a man.
What is Inequality or Gini Index in Unalakleet?
Inequality or Gini Index in Unalakleet is 0.41.
What is the Total Population of Unalakleet?
Total Population of Unalakleet is 743.
What is the Total Male Population of Unalakleet?
Total Male Population of Unalakleet is 343.
What is the Total Female Population of Unalakleet?
Total Female Population of Unalakleet is 400.
What is the Ratio of Males per 100 Females in Unalakleet?
There are 85.75 Males per 100 Females in Unalakleet.
What is the Ratio of Females per 100 Males in Unalakleet?
There are 116.62 Females per 100 Males in Unalakleet.
What is the Median Population Age in Unalakleet?
Median Population Age in Unalakleet is 41.1 Years.
What is the Average Family Size in Unalakleet
Average Family Size in Unalakleet is 3.1 People.
What is the Average Household Size in Unalakleet
Average Household Size in Unalakleet is 3.1 People.
How Large is the Labor Force in Unalakleet?
There are 426 People in the Labor Forcein in Unalakleet.
What is the Percentage of People in the Labor Force in Unalakleet?
75.0% of People are in the Labor Force in Unalakleet.
What is the Unemployment Rate in Unalakleet?
Unemployment Rate in Unalakleet is 7.7%.