Lavelle, PA Map & Demographics
Lavelle Map
Lavelle Overview
$30,272
PER CAPITA INCOME
$67,692
AVG FAMILY INCOME
$67,692
AVG HOUSEHOLD INCOME
48.0%
WAGE / INCOME GAP [ % ]
52.0¢/ $1
WAGE / INCOME GAP [ $ ]
0.29
INEQUALITY / GINI INDEX
388
TOTAL POPULATION
162
MALE POPULATION
226
FEMALE POPULATION
71.68
MALES / 100 FEMALES
139.51
FEMALES / 100 MALES
59.6
MEDIAN AGE
2.2
AVG FAMILY SIZE
2.0
AVG HOUSEHOLD SIZE
255
LABOR FORCE [ PEOPLE ]
68.7%
PERCENT IN LABOR FORCE
Lavelle Zip Codes
Income in Lavelle
Income Overview in Lavelle
Per Capita Income in Lavelle is $30,272, while median incomes of families and households are $67,692 and $67,692 respectively.
| Characteristic | Number | Measure |
| Per Capita Income | 388 | $30,272 |
| Median Family Income | 152 | $67,692 |
| Mean Family Income | 152 | $62,489 |
| Median Household Income | 190 | $67,692 |
| Mean Household Income | 190 | $61,574 |
| Income Deficit | 152 | $0 |
| Wage / Income Gap (%) | 388 | 47.98% |
| Wage / Income Gap ($) | 388 | 52.02¢ per $1 |
| Gini / Inequality Index | 388 | 0.29 |
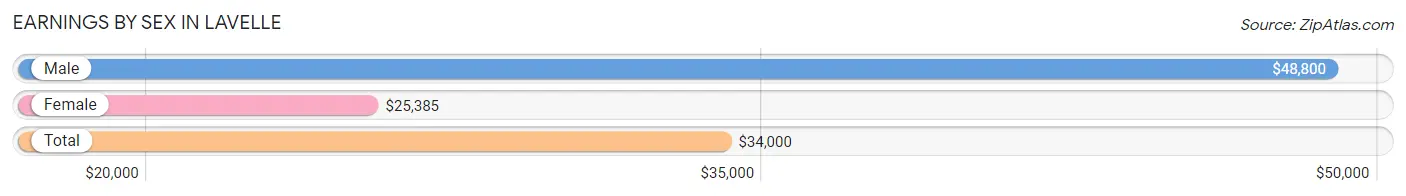
Earnings by Sex in Lavelle
Average Earnings in Lavelle are $34,000, $48,800 for men and $25,385 for women, a difference of 48.0%.
| Sex | Number | Average Earnings |
| Male | 140 (48.6%) | $48,800 |
| Female | 148 (51.4%) | $25,385 |
| Total | 288 (100.0%) | $34,000 |
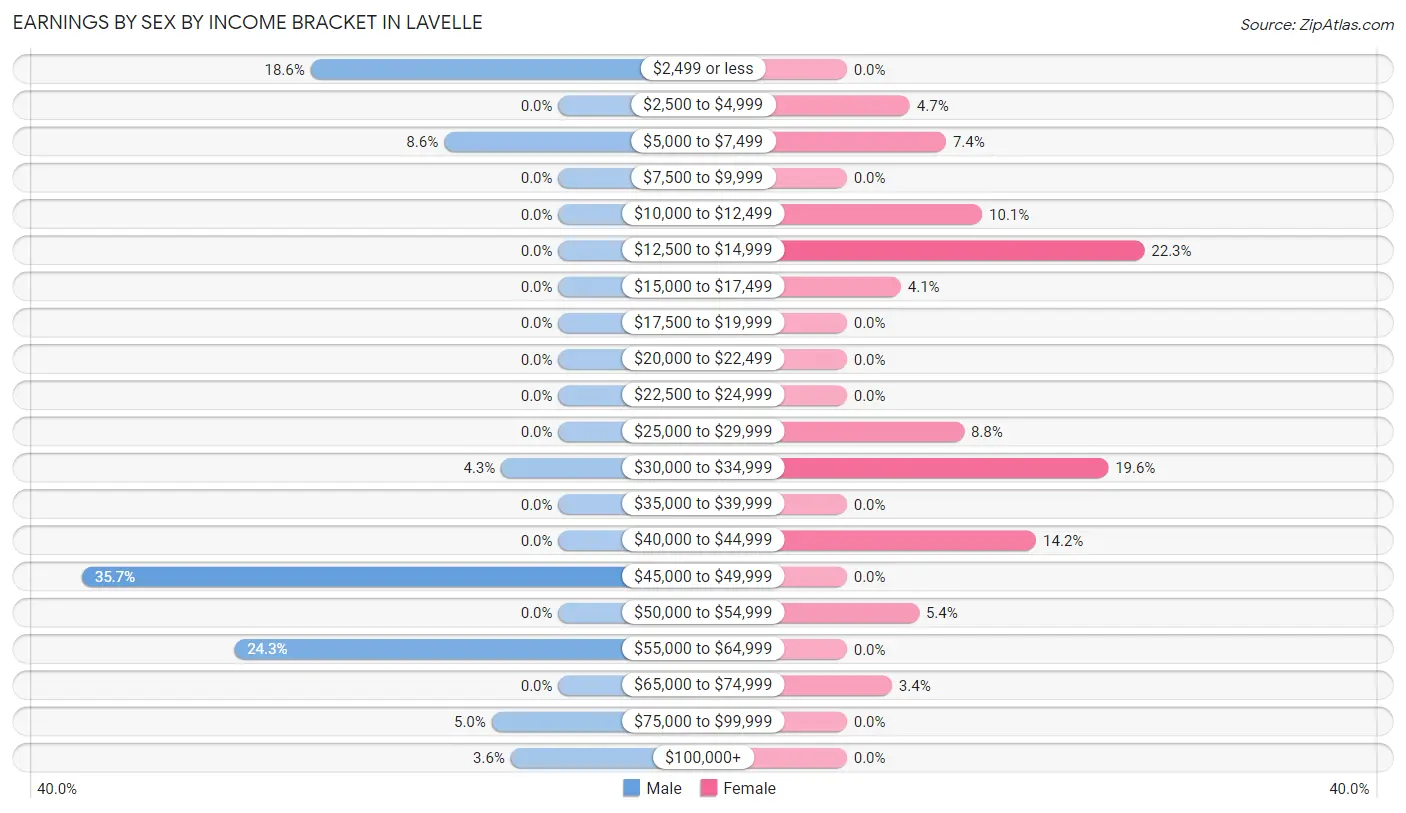
Earnings by Sex by Income Bracket in Lavelle
The most common earnings brackets in Lavelle are $45,000 to $49,999 for men (50 | 35.7%) and $12,500 to $14,999 for women (33 | 22.3%).
| Income | Male | Female |
| $2,499 or less | 26 (18.6%) | 0 (0.0%) |
| $2,500 to $4,999 | 0 (0.0%) | 7 (4.7%) |
| $5,000 to $7,499 | 12 (8.6%) | 11 (7.4%) |
| $7,500 to $9,999 | 0 (0.0%) | 0 (0.0%) |
| $10,000 to $12,499 | 0 (0.0%) | 15 (10.1%) |
| $12,500 to $14,999 | 0 (0.0%) | 33 (22.3%) |
| $15,000 to $17,499 | 0 (0.0%) | 6 (4.1%) |
| $17,500 to $19,999 | 0 (0.0%) | 0 (0.0%) |
| $20,000 to $22,499 | 0 (0.0%) | 0 (0.0%) |
| $22,500 to $24,999 | 0 (0.0%) | 0 (0.0%) |
| $25,000 to $29,999 | 0 (0.0%) | 13 (8.8%) |
| $30,000 to $34,999 | 6 (4.3%) | 29 (19.6%) |
| $35,000 to $39,999 | 0 (0.0%) | 0 (0.0%) |
| $40,000 to $44,999 | 0 (0.0%) | 21 (14.2%) |
| $45,000 to $49,999 | 50 (35.7%) | 0 (0.0%) |
| $50,000 to $54,999 | 0 (0.0%) | 8 (5.4%) |
| $55,000 to $64,999 | 34 (24.3%) | 0 (0.0%) |
| $65,000 to $74,999 | 0 (0.0%) | 5 (3.4%) |
| $75,000 to $99,999 | 7 (5.0%) | 0 (0.0%) |
| $100,000+ | 5 (3.6%) | 0 (0.0%) |
| Total | 140 (100.0%) | 148 (100.0%) |
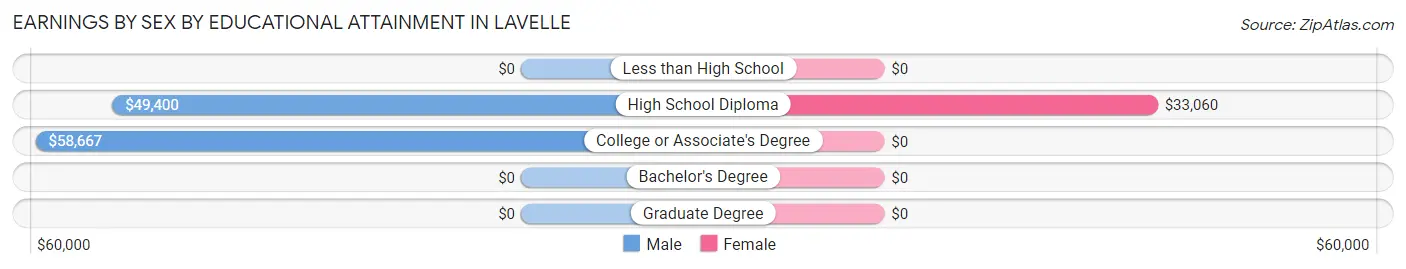
Earnings by Sex by Educational Attainment in Lavelle
Average earnings in Lavelle are $48,800 for men and $26,058 for women, a difference of 46.6%. Men with an educational attainment of college or associate's degree enjoy the highest average annual earnings of $58,667, while those with high school diploma education earn the least with $49,400. Women with an educational attainment of high school diploma earn the most with the average annual earnings of $33,060, while those with high school diploma education have the smallest earnings of $33,060.
| Educational Attainment | Male Income | Female Income |
| Less than High School | - | - |
| High School Diploma | $49,400 | $33,060 |
| College or Associate's Degree | $58,667 | $0 |
| Bachelor's Degree | - | - |
| Graduate Degree | - | - |
| Total | $48,800 | $26,058 |
Family Income in Lavelle
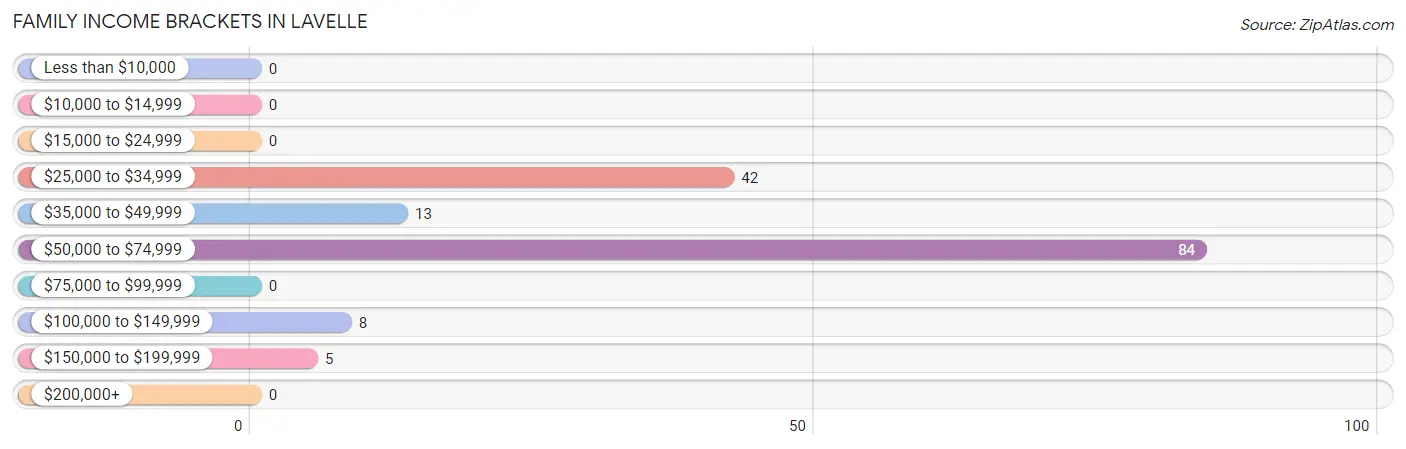
Family Income Brackets in Lavelle
According to the Lavelle family income data, there are 84 families falling into the $50,000 to $74,999 income range, which is the most common income bracket and makes up 55.3% of all families.
| Income Bracket | # Families | % Families |
| Less than $10,000 | 0 | 0.0% |
| $10,000 to $14,999 | 0 | 0.0% |
| $15,000 to $24,999 | 0 | 0.0% |
| $25,000 to $34,999 | 42 | 27.6% |
| $35,000 to $49,999 | 13 | 8.6% |
| $50,000 to $74,999 | 84 | 55.3% |
| $75,000 to $99,999 | 0 | 0.0% |
| $100,000 to $149,999 | 8 | 5.3% |
| $150,000 to $199,999 | 5 | 3.3% |
| $200,000+ | 0 | 0.0% |
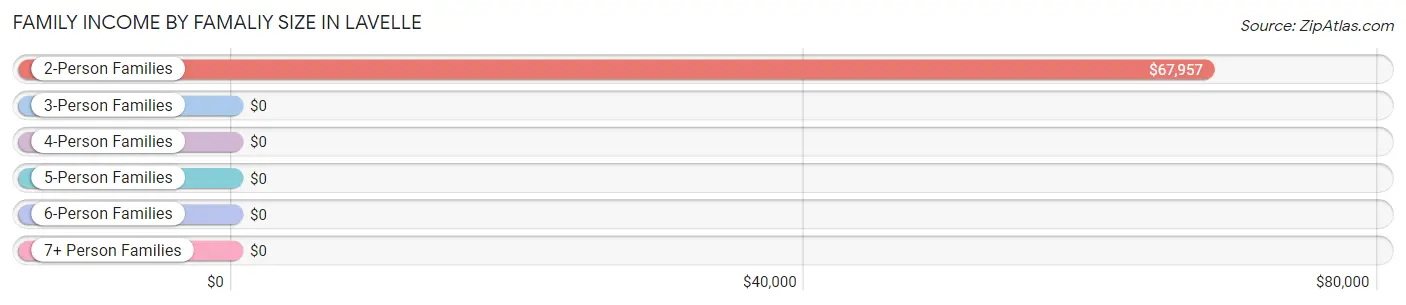
Family Income by Famaliy Size in Lavelle
2-person families (131 | 86.2%) account for the highest median family income in Lavelle with $67,957 per family, while 2-person families (131 | 86.2%) have the highest median income of $33,978 per family member.
| Income Bracket | # Families | Median Income |
| 2-Person Families | 131 (86.2%) | $67,957 |
| 3-Person Families | 16 (10.5%) | $0 |
| 4-Person Families | 0 (0.0%) | $0 |
| 5-Person Families | 5 (3.3%) | $0 |
| 6-Person Families | 0 (0.0%) | $0 |
| 7+ Person Families | 0 (0.0%) | $0 |
| Total | 152 (100.0%) | $67,692 |
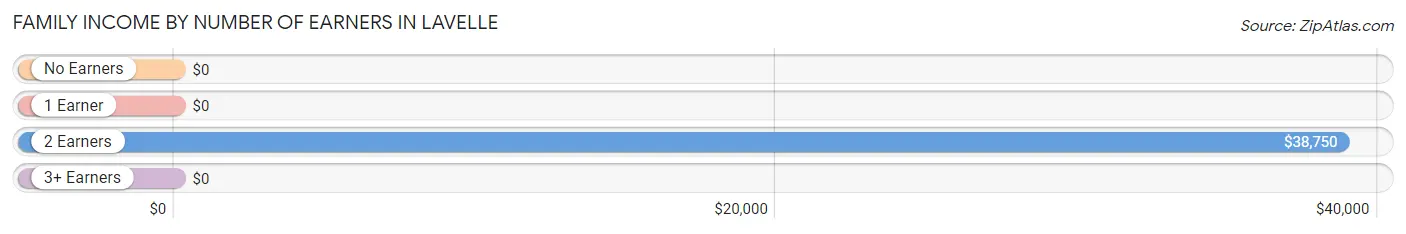
Family Income by Number of Earners in Lavelle
| Number of Earners | # Families | Median Income |
| No Earners | 0 (0.0%) | $0 |
| 1 Earner | 63 (41.4%) | $0 |
| 2 Earners | 84 (55.3%) | $38,750 |
| 3+ Earners | 5 (3.3%) | $0 |
| Total | 152 (100.0%) | $67,692 |
Household Income in Lavelle
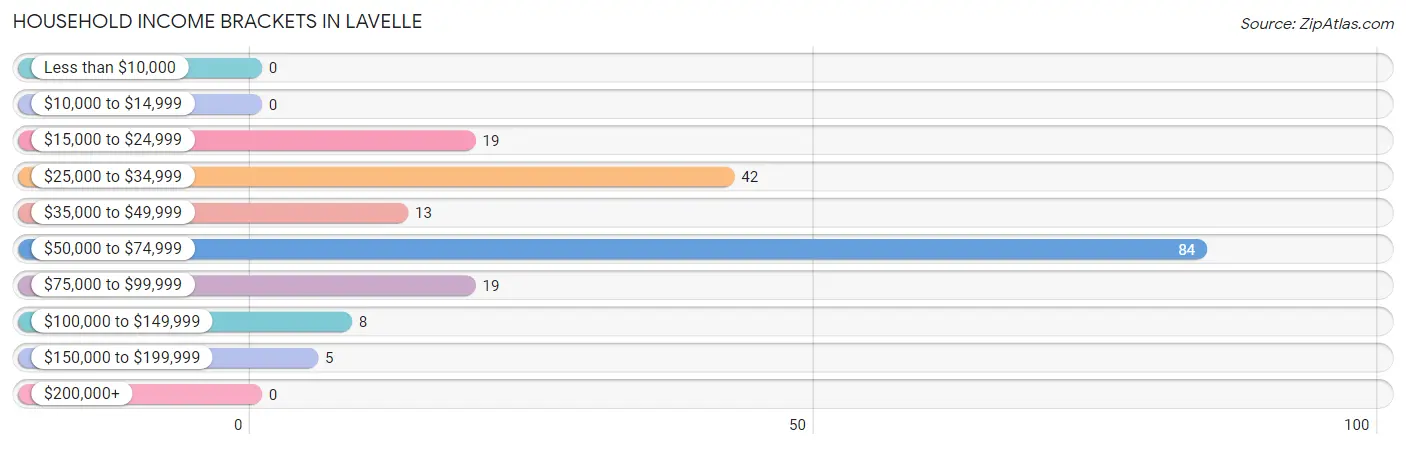
Household Income Brackets in Lavelle
With 84 households falling in the category, the $50,000 to $74,999 income range is the most frequent in Lavelle, accounting for 44.2% of all households.
| Income Bracket | # Households | % Households |
| Less than $10,000 | 0 | 0.0% |
| $10,000 to $14,999 | 0 | 0.0% |
| $15,000 to $24,999 | 19 | 10.0% |
| $25,000 to $34,999 | 42 | 22.1% |
| $35,000 to $49,999 | 13 | 6.8% |
| $50,000 to $74,999 | 84 | 44.2% |
| $75,000 to $99,999 | 19 | 10.0% |
| $100,000 to $149,999 | 8 | 4.2% |
| $150,000 to $199,999 | 5 | 2.6% |
| $200,000+ | 0 | 0.0% |
Household Income by Householder Age in Lavelle
The median household income in Lavelle is $67,692, with the highest median household income of $68,678 found in the 45 to 64 years age bracket for the primary householder. A total of 119 households (62.6%) fall into this category.
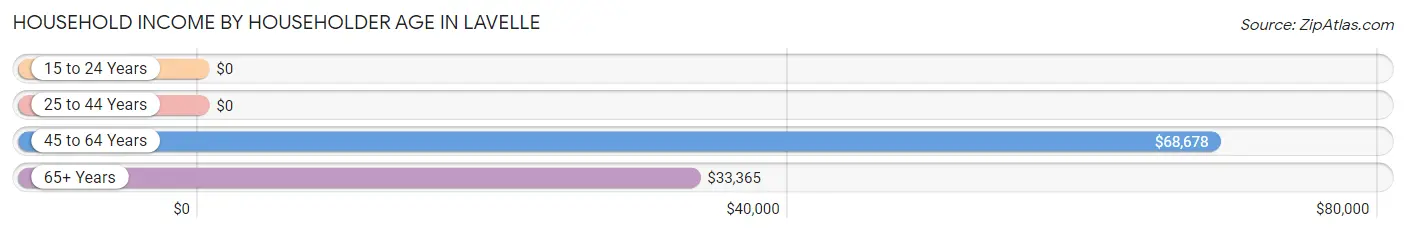
| Income Bracket | # Households | Median Income |
| 15 to 24 Years | 0 (0.0%) | $0 |
| 25 to 44 Years | 15 (7.9%) | $0 |
| 45 to 64 Years | 119 (62.6%) | $68,678 |
| 65+ Years | 56 (29.5%) | $33,365 |
| Total | 190 (100.0%) | $67,692 |
Poverty in Lavelle
Income Below Poverty by Sex and Age in Lavelle
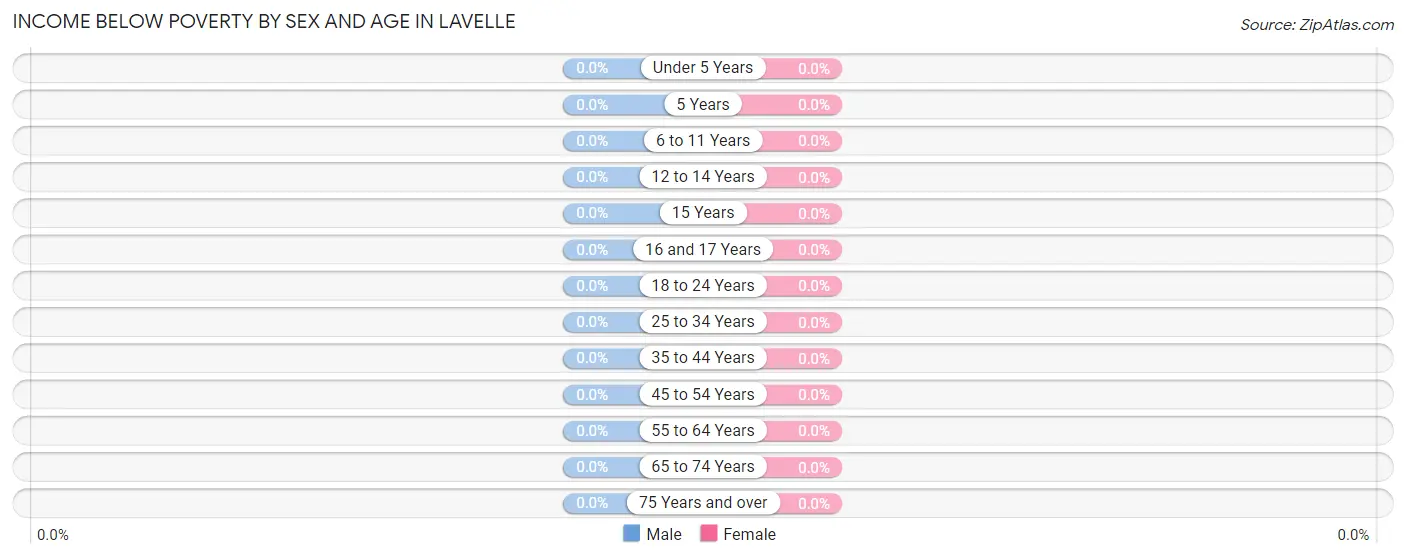
| Age Bracket | Male | Female |
| Under 5 Years | 0 (0.0%) | 0 (0.0%) |
| 5 Years | 0 (0.0%) | 0 (0.0%) |
| 6 to 11 Years | 0 (0.0%) | 0 (0.0%) |
| 12 to 14 Years | 0 (0.0%) | 0 (0.0%) |
| 15 Years | 0 (0.0%) | 0 (0.0%) |
| 16 and 17 Years | 0 (0.0%) | 0 (0.0%) |
| 18 to 24 Years | 0 (0.0%) | 0 (0.0%) |
| 25 to 34 Years | 0 (0.0%) | 0 (0.0%) |
| 35 to 44 Years | 0 (0.0%) | 0 (0.0%) |
| 45 to 54 Years | 0 (0.0%) | 0 (0.0%) |
| 55 to 64 Years | 0 (0.0%) | 0 (0.0%) |
| 65 to 74 Years | 0 (0.0%) | 0 (0.0%) |
| 75 Years and over | 0 (0.0%) | 0 (0.0%) |
| Total | 0 (0.0%) | 0 (0.0%) |
Income Above Poverty by Sex and Age in Lavelle
According to the poverty statistics in Lavelle, males aged 12 to 14 years and females aged 6 to 11 years are the age groups that are most secure financially, with 100.0% of males and 100.0% of females in these age groups living above the poverty line.
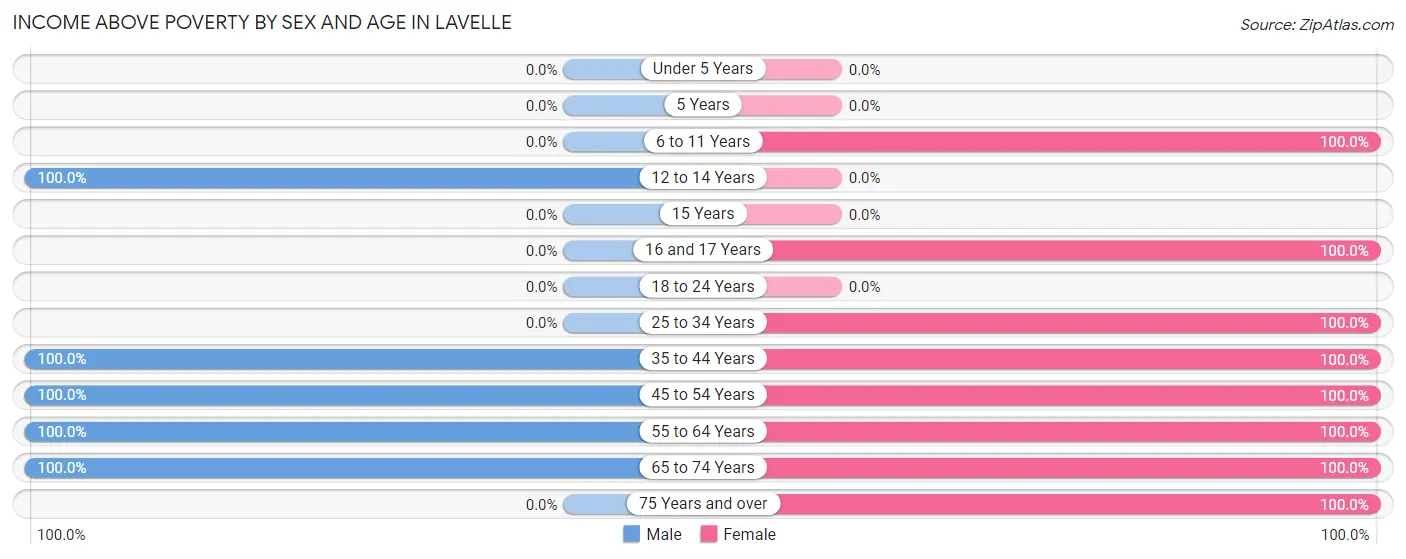
| Age Bracket | Male | Female |
| Under 5 Years | 0 (0.0%) | 0 (0.0%) |
| 5 Years | 0 (0.0%) | 0 (0.0%) |
| 6 to 11 Years | 0 (0.0%) | 7 (100.0%) |
| 12 to 14 Years | 10 (100.0%) | 0 (0.0%) |
| 15 Years | 0 (0.0%) | 0 (0.0%) |
| 16 and 17 Years | 0 (0.0%) | 7 (100.0%) |
| 18 to 24 Years | 0 (0.0%) | 0 (0.0%) |
| 25 to 34 Years | 0 (0.0%) | 21 (100.0%) |
| 35 to 44 Years | 15 (100.0%) | 5 (100.0%) |
| 45 to 54 Years | 30 (100.0%) | 46 (100.0%) |
| 55 to 64 Years | 69 (100.0%) | 110 (100.0%) |
| 65 to 74 Years | 38 (100.0%) | 11 (100.0%) |
| 75 Years and over | 0 (0.0%) | 19 (100.0%) |
| Total | 162 (100.0%) | 226 (100.0%) |
Income Below Poverty Among Married-Couple Families in Lavelle
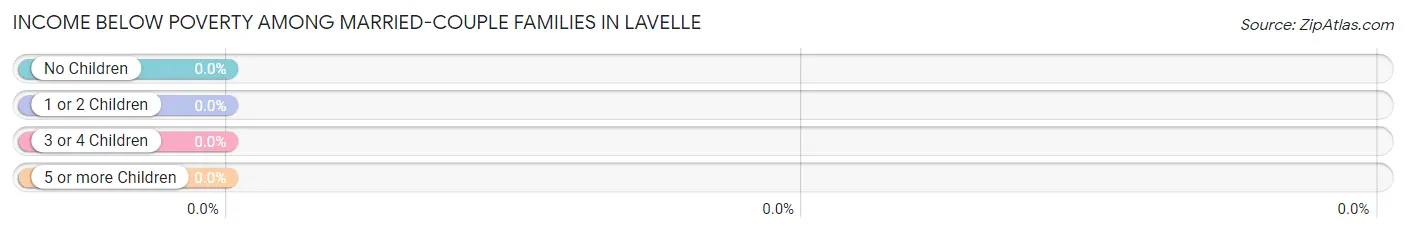
| Children | Above Poverty | Below Poverty |
| No Children | 131 (100.0%) | 0 (0.0%) |
| 1 or 2 Children | 16 (100.0%) | 0 (0.0%) |
| 3 or 4 Children | 5 (100.0%) | 0 (0.0%) |
| 5 or more Children | 0 (0.0%) | 0 (0.0%) |
| Total | 152 (100.0%) | 0 (0.0%) |
Income Below Poverty Among Single-Parent Households in Lavelle
| Children | Single Father | Single Mother |
| No Children | 0 (0.0%) | 0 (0.0%) |
| 1 or 2 Children | 0 (0.0%) | 0 (0.0%) |
| 3 or 4 Children | 0 (0.0%) | 0 (0.0%) |
| 5 or more Children | 0 (0.0%) | 0 (0.0%) |
| Total | 0 (0.0%) | 0 (0.0%) |
Income Below Poverty Among Married-Couple vs Single-Parent Households in Lavelle
| Children | Married-Couple Families | Single-Parent Households |
| No Children | 0 (0.0%) | 0 (0.0%) |
| 1 or 2 Children | 0 (0.0%) | 0 (0.0%) |
| 3 or 4 Children | 0 (0.0%) | 0 (0.0%) |
| 5 or more Children | 0 (0.0%) | 0 (0.0%) |
| Total | 0 (0.0%) | 0 (0.0%) |
Race in Lavelle
The most populous races in Lavelle are White / Caucasian (342 | 88.1%), Native / Alaskan (40 | 10.3%), and Hispanic or Latino (39 | 10.1%).
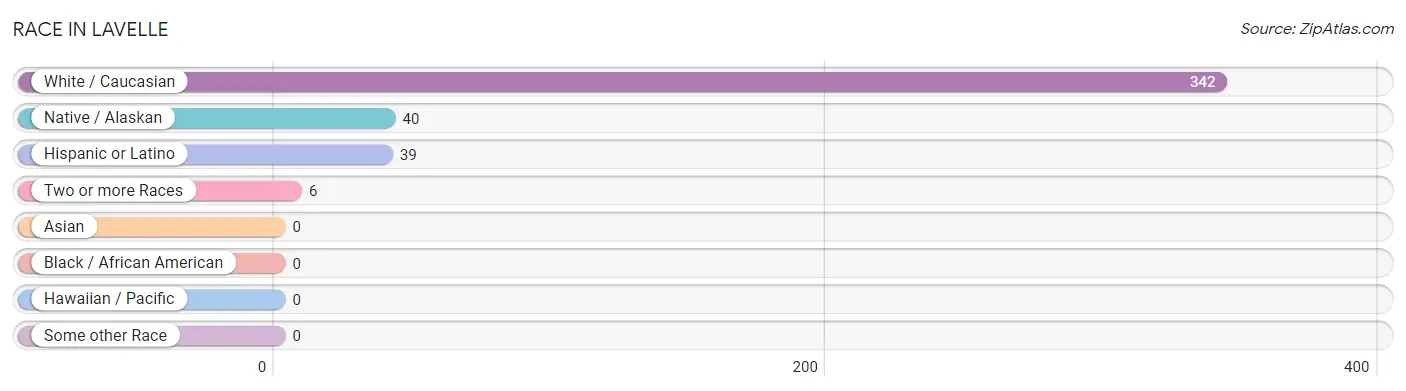
| Race | # Population | % Population |
| Asian | 0 | 0.0% |
| Black / African American | 0 | 0.0% |
| Hawaiian / Pacific | 0 | 0.0% |
| Hispanic or Latino | 39 | 10.1% |
| Native / Alaskan | 40 | 10.3% |
| White / Caucasian | 342 | 88.1% |
| Two or more Races | 6 | 1.5% |
| Some other Race | 0 | 0.0% |
| Total | 388 | 100.0% |
Ancestry in Lavelle
The most populous ancestries reported in Lavelle are German (182 | 46.9%), Irish (73 | 18.8%), English (65 | 16.8%), Italian (60 | 15.5%), and Pennsylvania German (23 | 5.9%), together accounting for 103.9% of all Lavelle residents.
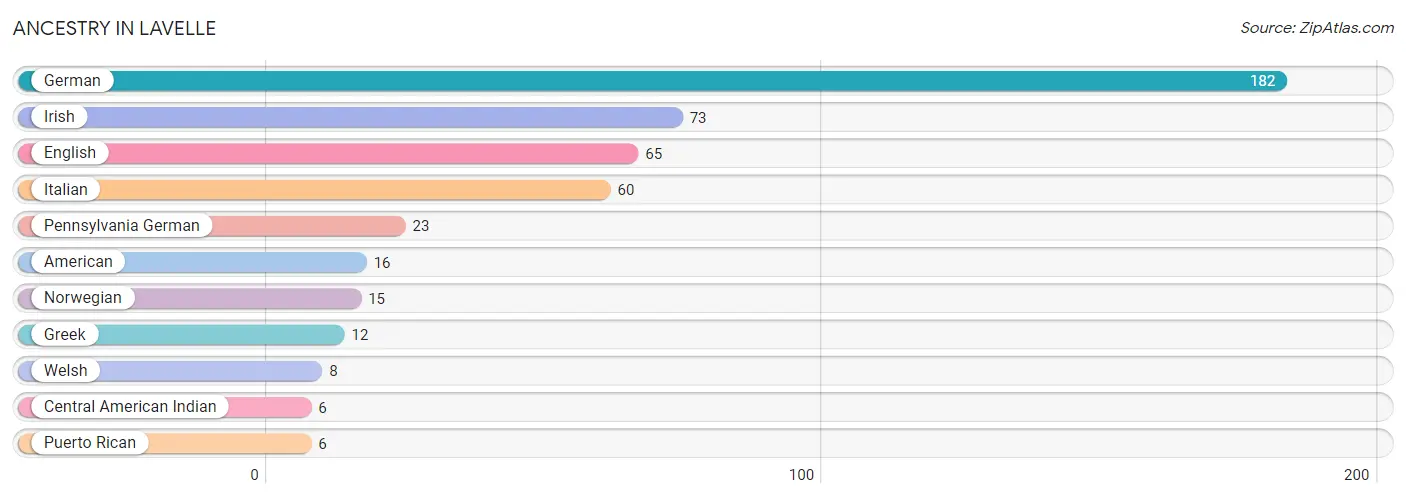
| Ancestry | # Population | % Population |
| American | 16 | 4.1% |
| Central American Indian | 6 | 1.5% |
| English | 65 | 16.8% |
| German | 182 | 46.9% |
| Greek | 12 | 3.1% |
| Irish | 73 | 18.8% |
| Italian | 60 | 15.5% |
| Norwegian | 15 | 3.9% |
| Pennsylvania German | 23 | 5.9% |
| Puerto Rican | 6 | 1.5% |
| Welsh | 8 | 2.1% | View All 11 Rows |
Immigrants in Lavelle

| Immigration Origin | # Population | % Population | View All 0 Rows |
Sex and Age in Lavelle
Sex and Age in Lavelle
The most populous age groups in Lavelle are 60 to 64 Years (69 | 42.6%) for men and 55 to 59 Years (73 | 32.3%) for women.
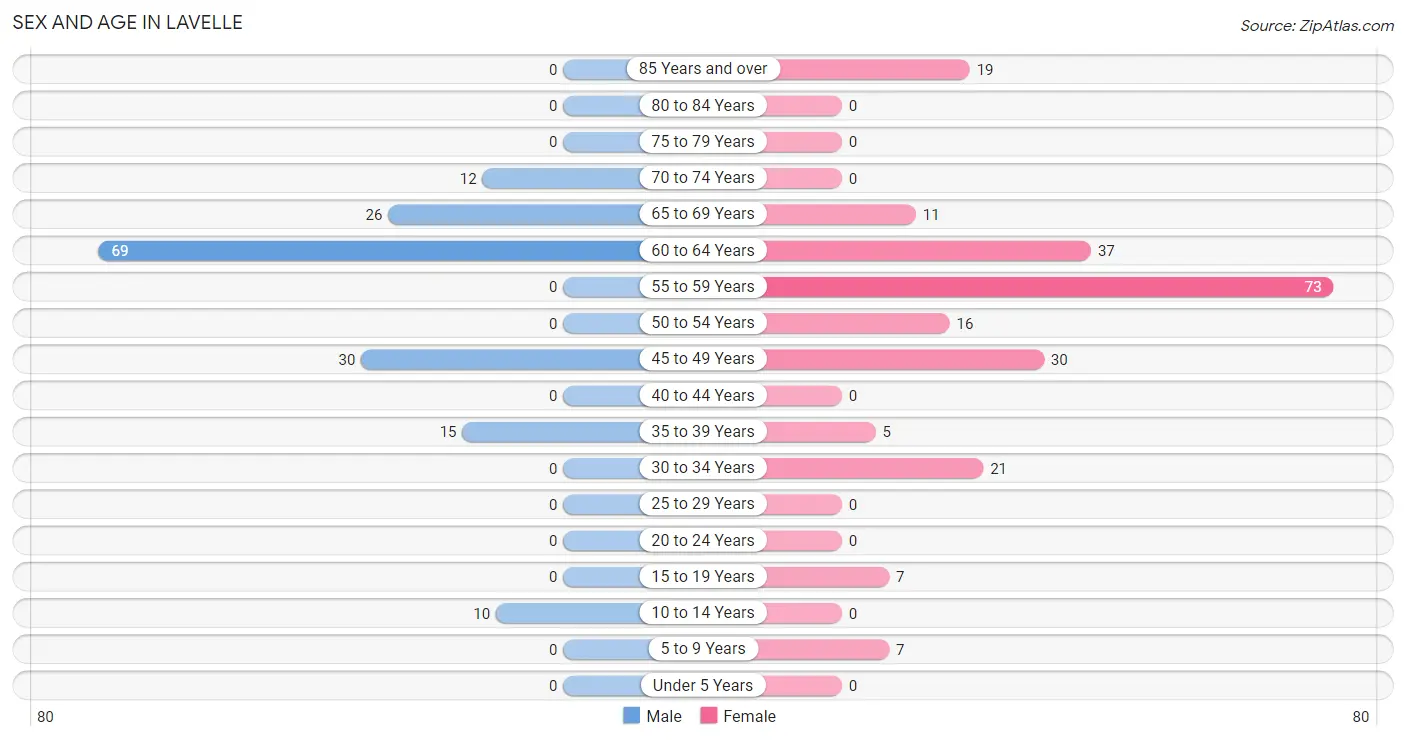
| Age Bracket | Male | Female |
| Under 5 Years | 0 (0.0%) | 0 (0.0%) |
| 5 to 9 Years | 0 (0.0%) | 7 (3.1%) |
| 10 to 14 Years | 10 (6.2%) | 0 (0.0%) |
| 15 to 19 Years | 0 (0.0%) | 7 (3.1%) |
| 20 to 24 Years | 0 (0.0%) | 0 (0.0%) |
| 25 to 29 Years | 0 (0.0%) | 0 (0.0%) |
| 30 to 34 Years | 0 (0.0%) | 21 (9.3%) |
| 35 to 39 Years | 15 (9.3%) | 5 (2.2%) |
| 40 to 44 Years | 0 (0.0%) | 0 (0.0%) |
| 45 to 49 Years | 30 (18.5%) | 30 (13.3%) |
| 50 to 54 Years | 0 (0.0%) | 16 (7.1%) |
| 55 to 59 Years | 0 (0.0%) | 73 (32.3%) |
| 60 to 64 Years | 69 (42.6%) | 37 (16.4%) |
| 65 to 69 Years | 26 (16.1%) | 11 (4.9%) |
| 70 to 74 Years | 12 (7.4%) | 0 (0.0%) |
| 75 to 79 Years | 0 (0.0%) | 0 (0.0%) |
| 80 to 84 Years | 0 (0.0%) | 0 (0.0%) |
| 85 Years and over | 0 (0.0%) | 19 (8.4%) |
| Total | 162 (100.0%) | 226 (100.0%) |
Families and Households in Lavelle
Median Family Size in Lavelle
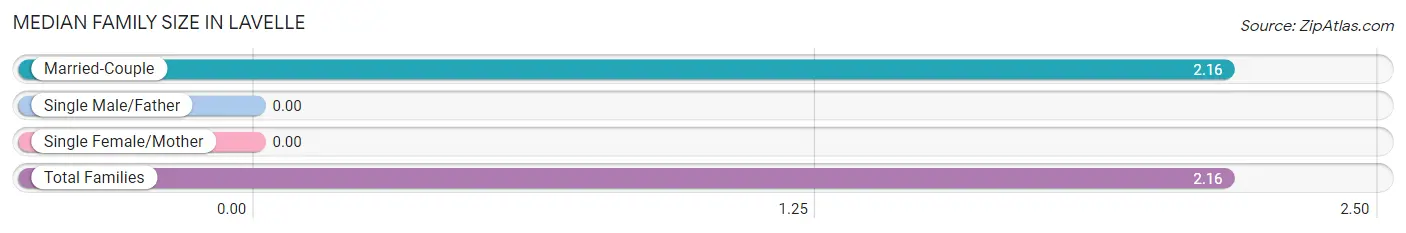
| Family Type | # Families | Family Size |
| Married-Couple | 152 (100.0%) | 2.16 |
| Single Male/Father | 0 (0.0%) | - |
| Single Female/Mother | 0 (0.0%) | - |
| Total Families | 152 (100.0%) | 2.16 |
Median Household Size in Lavelle
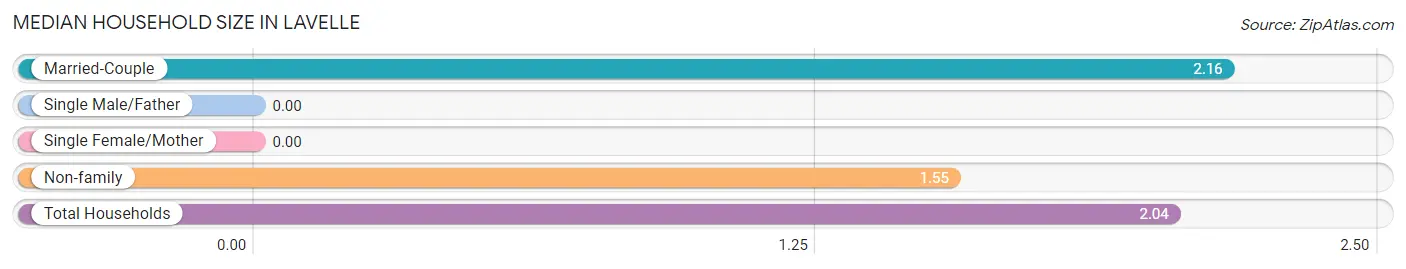
| Household Type | # Households | Household Size |
| Married-Couple | 152 (80.0%) | 2.16 |
| Single Male/Father | 0 (0.0%) | - |
| Single Female/Mother | 0 (0.0%) | - |
| Non-family | 38 (20.0%) | 1.55 |
| Total Households | 190 (100.0%) | 2.04 |
Household Size by Marriage Status in Lavelle
Out of a total of 190 households in Lavelle, 152 (80.0%) are family households, while 38 (20.0%) are nonfamily households. The most numerous type of family households are 2-person households, comprising 131, and the most common type of nonfamily households are 1-person households, comprising 19.
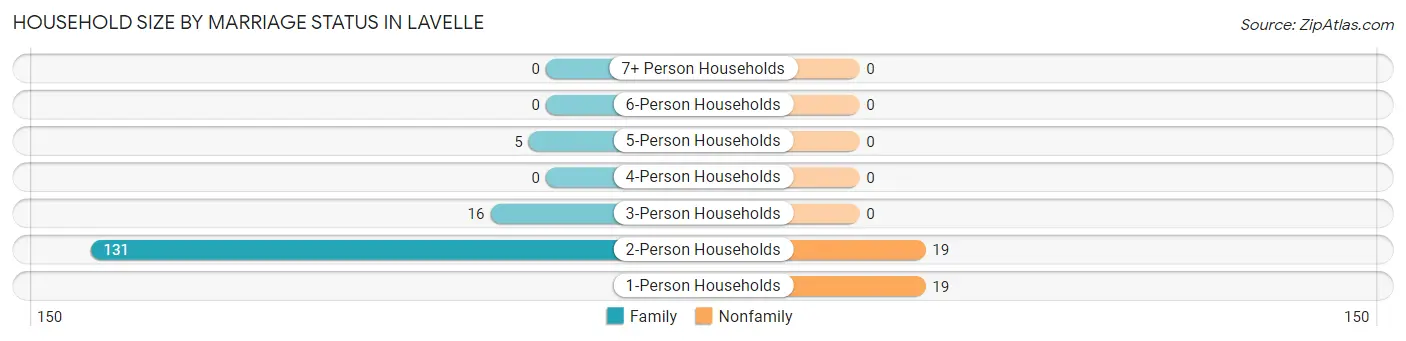
| Household Size | Family Households | Nonfamily Households |
| 1-Person Households | - | 19 (10.0%) |
| 2-Person Households | 131 (69.0%) | 19 (10.0%) |
| 3-Person Households | 16 (8.4%) | 0 (0.0%) |
| 4-Person Households | 0 (0.0%) | 0 (0.0%) |
| 5-Person Households | 5 (2.6%) | 0 (0.0%) |
| 6-Person Households | 0 (0.0%) | 0 (0.0%) |
| 7+ Person Households | 0 (0.0%) | 0 (0.0%) |
| Total | 152 (80.0%) | 38 (20.0%) |
Female Fertility in Lavelle
Fertility by Age in Lavelle
| Age Bracket | Women with Births | Births / 1,000 Women |
| 15 to 19 years | 0 (0.0%) | 0.0 |
| 20 to 34 years | 0 (0.0%) | 0.0 |
| 35 to 50 years | 0 (0.0%) | 0.0 |
| Total | 0 (0.0%) | 0.0 |
Fertility by Age by Marriage Status in Lavelle
| Age Bracket | Married | Unmarried |
| 15 to 19 years | 0 (0.0%) | 0 (0.0%) |
| 20 to 34 years | 0 (0.0%) | 0 (0.0%) |
| 35 to 50 years | 0 (0.0%) | 0 (0.0%) |
| Total | 0 (0.0%) | 0 (0.0%) |
Fertility by Education in Lavelle
| Educational Attainment | Women with Births | Births / 1,000 Women |
| Less than High School | 0 (0.0%) | 0.0 |
| High School Diploma | 0 (0.0%) | 0.0 |
| College or Associate's Degree | 0 (0.0%) | 0.0 |
| Bachelor's Degree | 0 (0.0%) | 0.0 |
| Graduate Degree | 0 (0.0%) | 0.0 |
| Total | 0 (0.0%) | 0.0 |
Fertility by Education by Marriage Status in Lavelle
| Educational Attainment | Married | Unmarried |
| Less than High School | 0 (0.0%) | 0 (0.0%) |
| High School Diploma | 0 (0.0%) | 0 (0.0%) |
| College or Associate's Degree | 0 (0.0%) | 0 (0.0%) |
| Bachelor's Degree | 0 (0.0%) | 0 (0.0%) |
| Graduate Degree | 0 (0.0%) | 0 (0.0%) |
| Total | 0 (0.0%) | 0 (0.0%) |
Employment Characteristics in Lavelle
Employment by Class of Employer in Lavelle
Among the 255 employed individuals in Lavelle, private company employees (222 | 87.1%), and self-employed (incorporated) (33 | 12.9%) make up the most common classes of employment.
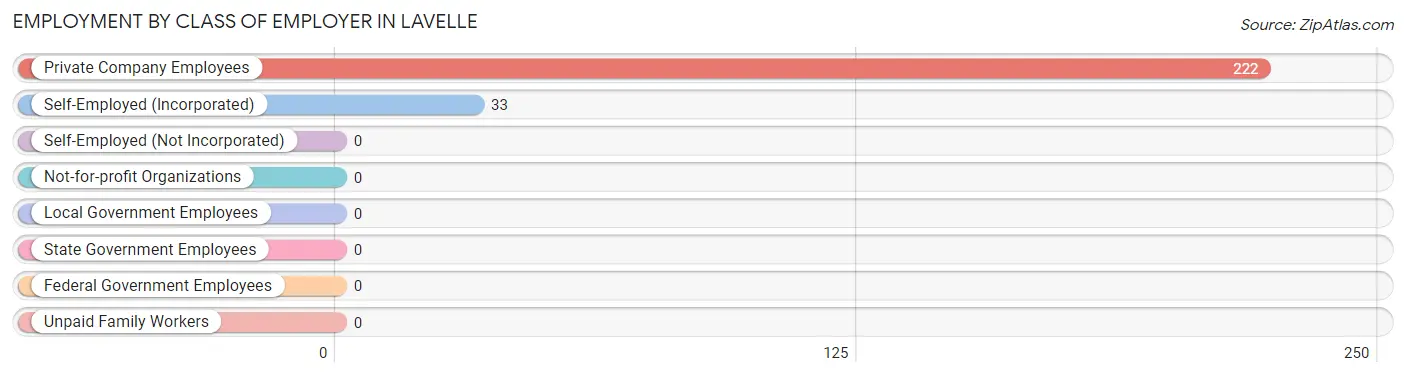
| Employer Class | # Employees | % Employees |
| Private Company Employees | 222 | 87.1% |
| Self-Employed (Incorporated) | 33 | 12.9% |
| Self-Employed (Not Incorporated) | 0 | 0.0% |
| Not-for-profit Organizations | 0 | 0.0% |
| Local Government Employees | 0 | 0.0% |
| State Government Employees | 0 | 0.0% |
| Federal Government Employees | 0 | 0.0% |
| Unpaid Family Workers | 0 | 0.0% |
| Total | 255 | 100.0% |
Employment Status by Age in Lavelle
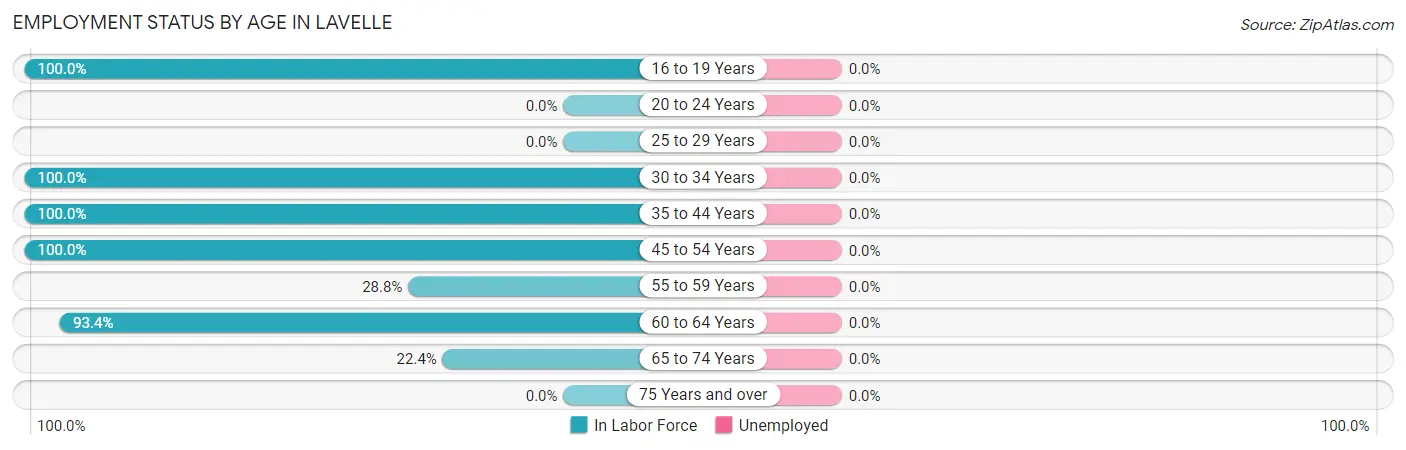
| Age Bracket | In Labor Force | Unemployed |
| 16 to 19 Years | 7 (100.0%) | 0 (0.0%) |
| 20 to 24 Years | 0 (0.0%) | 0 (0.0%) |
| 25 to 29 Years | 0 (0.0%) | 0 (0.0%) |
| 30 to 34 Years | 21 (100.0%) | 0 (0.0%) |
| 35 to 44 Years | 20 (100.0%) | 0 (0.0%) |
| 45 to 54 Years | 76 (100.0%) | 0 (0.0%) |
| 55 to 59 Years | 21 (28.8%) | 0 (0.0%) |
| 60 to 64 Years | 99 (93.4%) | 0 (0.0%) |
| 65 to 74 Years | 11 (22.4%) | 0 (0.0%) |
| 75 Years and over | 0 (0.0%) | 0 (0.0%) |
| Total | 255 (68.7%) | 0 (0.0%) |
Employment Status by Educational Attainment in Lavelle
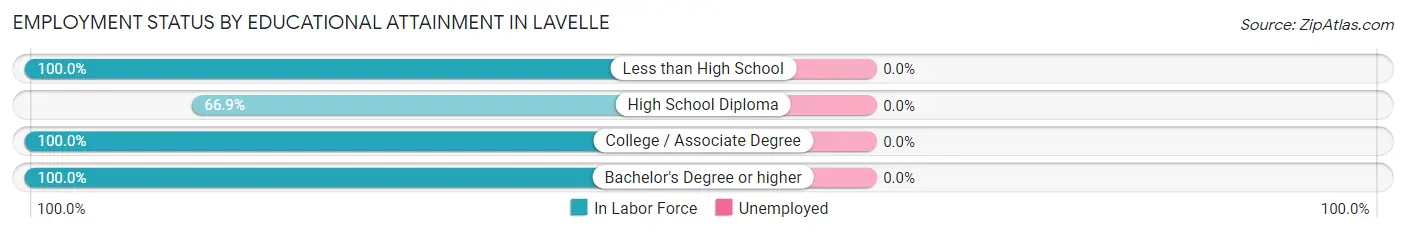
| Educational Attainment | In Labor Force | Unemployed |
| Less than High School | 12 (100.0%) | 0 (0.0%) |
| High School Diploma | 119 (66.9%) | 0 (0.0%) |
| College / Associate Degree | 100 (100.0%) | 0 (0.0%) |
| Bachelor's Degree or higher | 6 (100.0%) | 0 (0.0%) |
| Total | 237 (80.1%) | 0 (0.0%) |
Employment Occupations by Sex in Lavelle
Management, Business, Science and Arts Occupations
The most common Management, Business, Science and Arts occupations in Lavelle are Health Diagnosing & Treating (26 | 10.2%), Management (19 | 7.4%), and Health Technologists (5 | 2.0%).
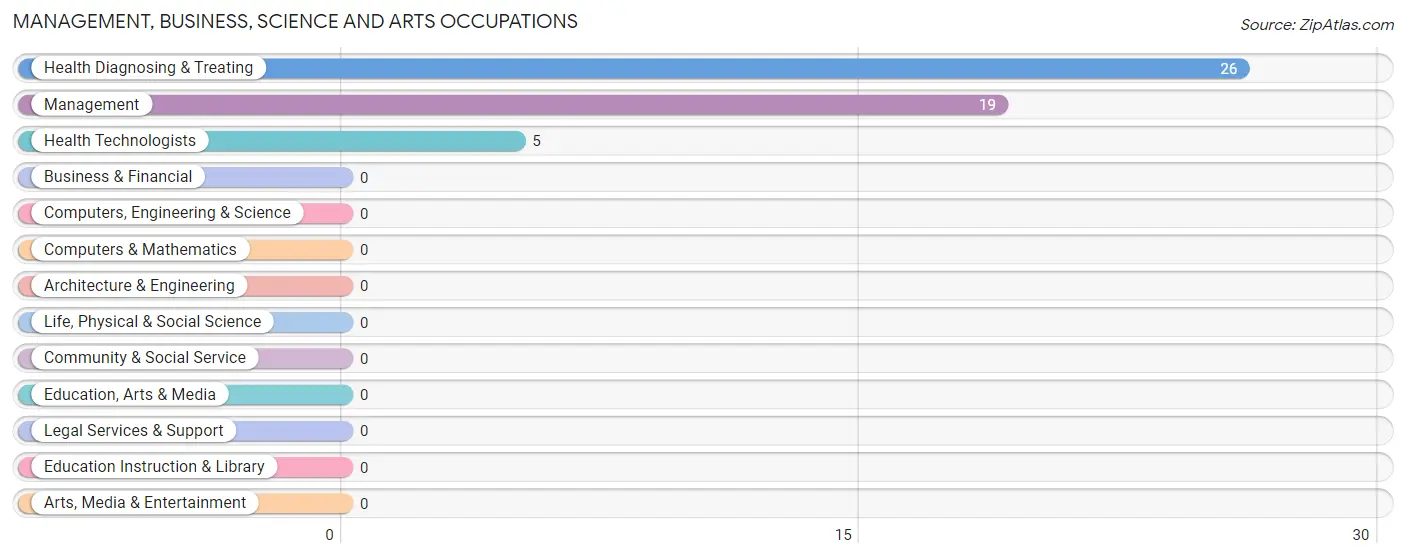
Management, Business, Science and Arts Occupations by Sex
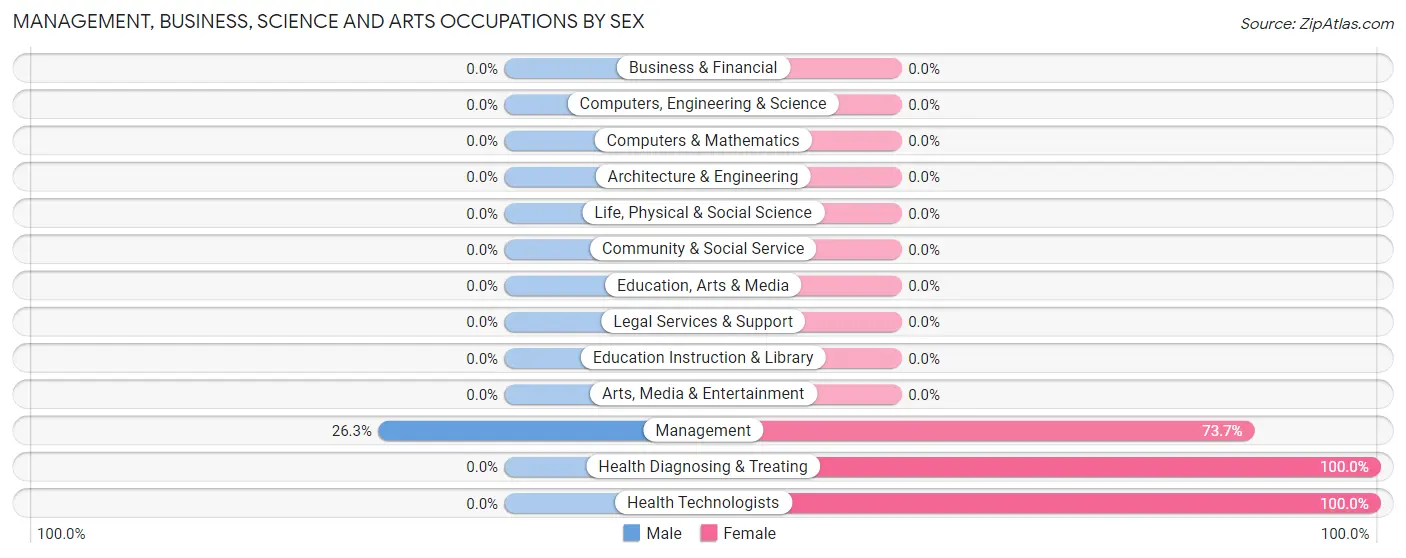
| Occupation | Male | Female |
| Management | 5 (26.3%) | 14 (73.7%) |
| Business & Financial | 0 (0.0%) | 0 (0.0%) |
| Computers, Engineering & Science | 0 (0.0%) | 0 (0.0%) |
| Computers & Mathematics | 0 (0.0%) | 0 (0.0%) |
| Architecture & Engineering | 0 (0.0%) | 0 (0.0%) |
| Life, Physical & Social Science | 0 (0.0%) | 0 (0.0%) |
| Community & Social Service | 0 (0.0%) | 0 (0.0%) |
| Education, Arts & Media | 0 (0.0%) | 0 (0.0%) |
| Legal Services & Support | 0 (0.0%) | 0 (0.0%) |
| Education Instruction & Library | 0 (0.0%) | 0 (0.0%) |
| Arts, Media & Entertainment | 0 (0.0%) | 0 (0.0%) |
| Health Diagnosing & Treating | 0 (0.0%) | 26 (100.0%) |
| Health Technologists | 0 (0.0%) | 5 (100.0%) |
| Total (Category) | 5 (11.1%) | 40 (88.9%) |
| Total (Overall) | 107 (42.0%) | 148 (58.0%) |
Services Occupations
The most common Services occupations in Lavelle are Healthcare Support (15 | 5.9%), and Personal Care & Service (7 | 2.8%).
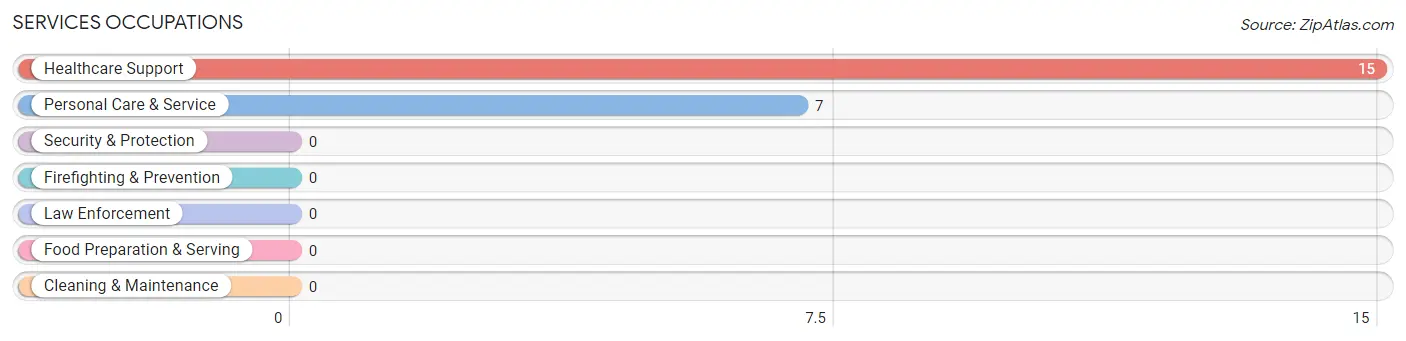
Services Occupations by Sex
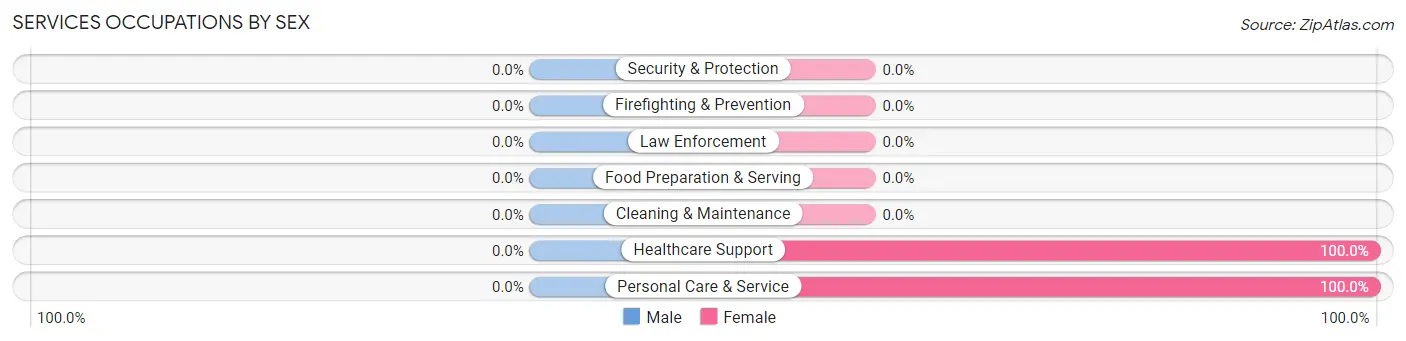
| Occupation | Male | Female |
| Healthcare Support | 0 (0.0%) | 15 (100.0%) |
| Security & Protection | 0 (0.0%) | 0 (0.0%) |
| Firefighting & Prevention | 0 (0.0%) | 0 (0.0%) |
| Law Enforcement | 0 (0.0%) | 0 (0.0%) |
| Food Preparation & Serving | 0 (0.0%) | 0 (0.0%) |
| Cleaning & Maintenance | 0 (0.0%) | 0 (0.0%) |
| Personal Care & Service | 0 (0.0%) | 7 (100.0%) |
| Total (Category) | 0 (0.0%) | 22 (100.0%) |
| Total (Overall) | 107 (42.0%) | 148 (58.0%) |
Sales and Office Occupations
The most common Sales and Office occupations in Lavelle are , and Sales & Related (11 | 4.3%).
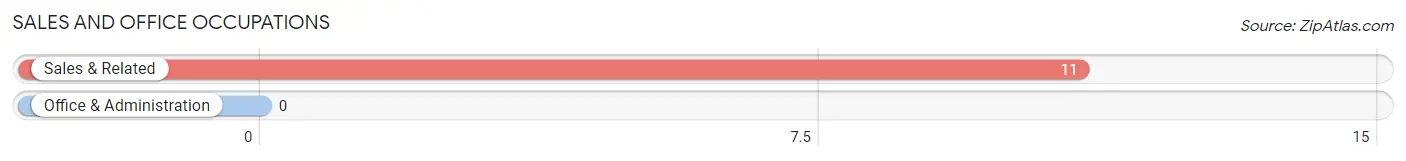
Sales and Office Occupations by Sex
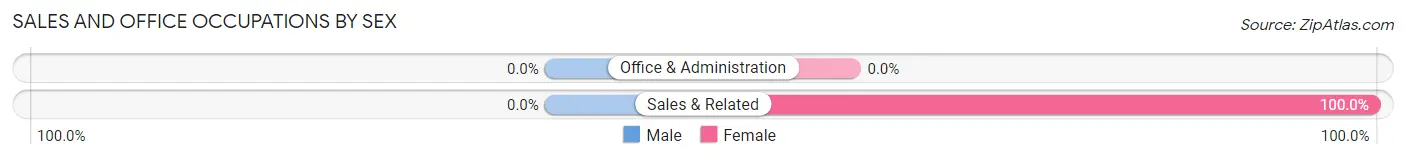
| Occupation | Male | Female |
| Sales & Related | 0 (0.0%) | 11 (100.0%) |
| Office & Administration | 0 (0.0%) | 0 (0.0%) |
| Total (Category) | 0 (0.0%) | 11 (100.0%) |
| Total (Overall) | 107 (42.0%) | 148 (58.0%) |
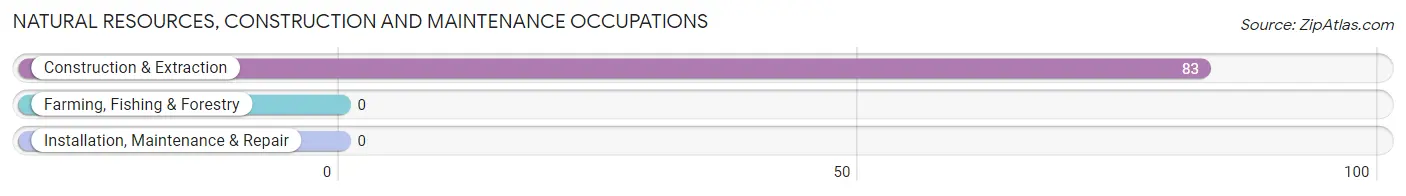
Natural Resources, Construction and Maintenance Occupations
The most common Natural Resources, Construction and Maintenance occupations in Lavelle are , and Construction & Extraction (83 | 32.6%).
Natural Resources, Construction and Maintenance Occupations by Sex
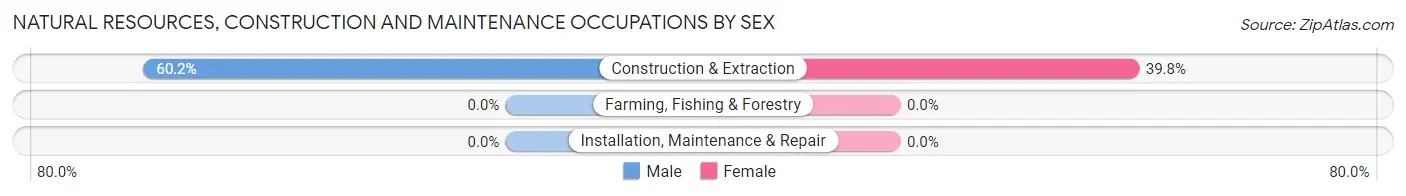
| Occupation | Male | Female |
| Farming, Fishing & Forestry | 0 (0.0%) | 0 (0.0%) |
| Construction & Extraction | 50 (60.2%) | 33 (39.8%) |
| Installation, Maintenance & Repair | 0 (0.0%) | 0 (0.0%) |
| Total (Category) | 50 (60.2%) | 33 (39.8%) |
| Total (Overall) | 107 (42.0%) | 148 (58.0%) |
Production, Transportation and Moving Occupations
The most common Production, Transportation and Moving occupations in Lavelle are , and Production (94 | 36.9%).
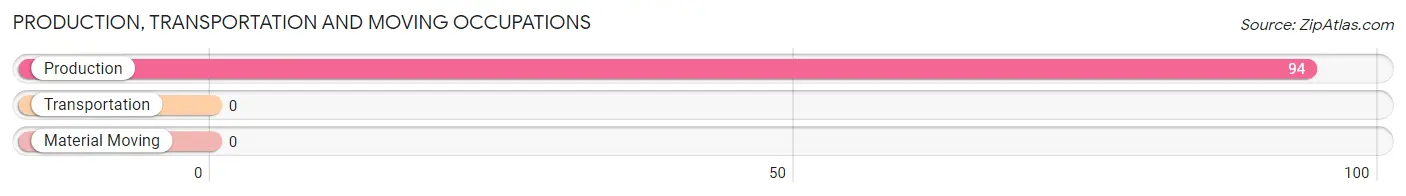
Production, Transportation and Moving Occupations by Sex
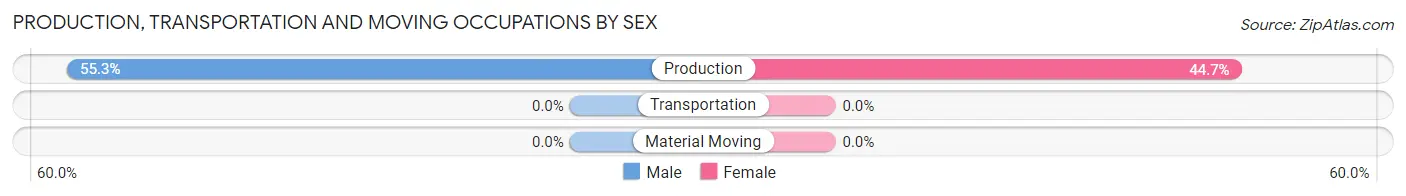
| Occupation | Male | Female |
| Production | 52 (55.3%) | 42 (44.7%) |
| Transportation | 0 (0.0%) | 0 (0.0%) |
| Material Moving | 0 (0.0%) | 0 (0.0%) |
| Total (Category) | 52 (55.3%) | 42 (44.7%) |
| Total (Overall) | 107 (42.0%) | 148 (58.0%) |
Employment Industries by Sex in Lavelle
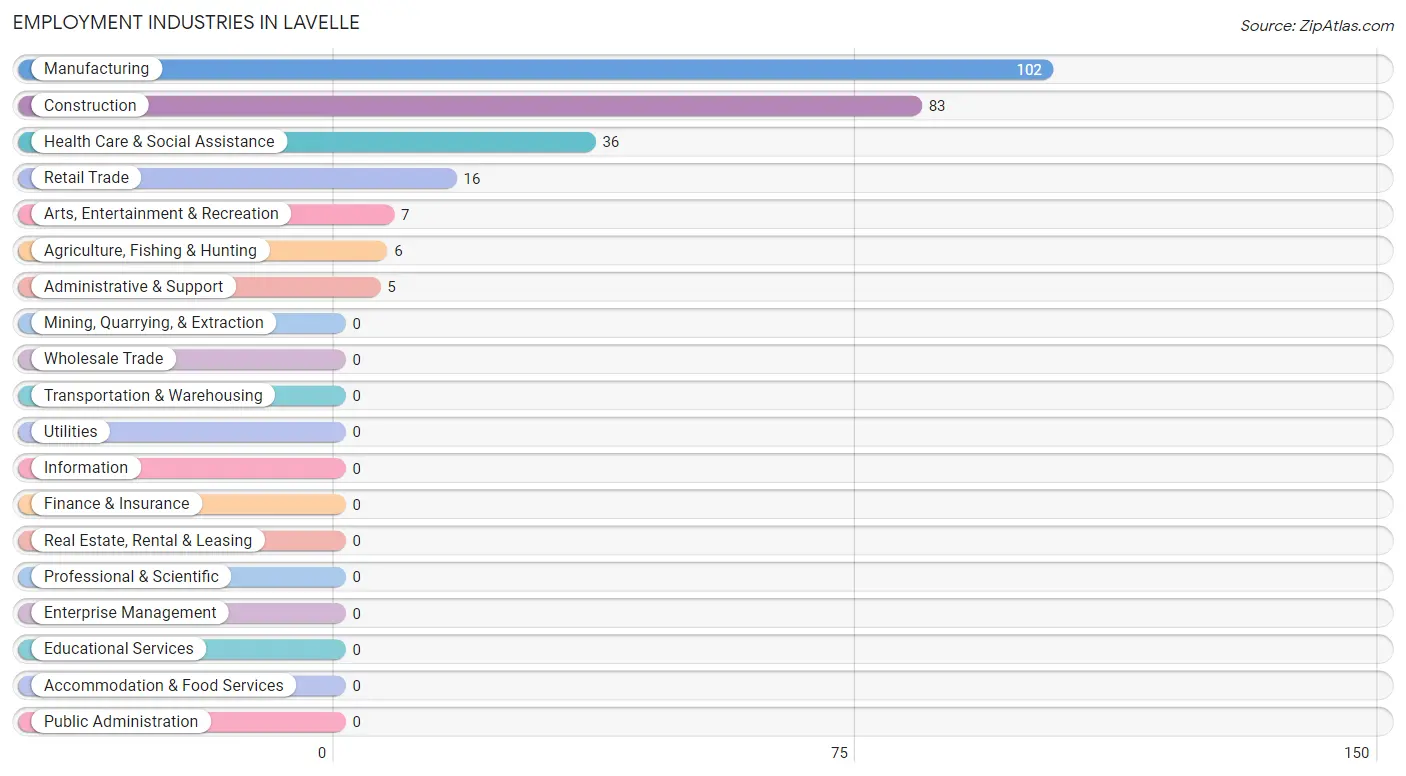
Employment Industries in Lavelle
The major employment industries in Lavelle include Manufacturing (102 | 40.0%), Construction (83 | 32.6%), Health Care & Social Assistance (36 | 14.1%), Retail Trade (16 | 6.3%), and Arts, Entertainment & Recreation (7 | 2.8%).
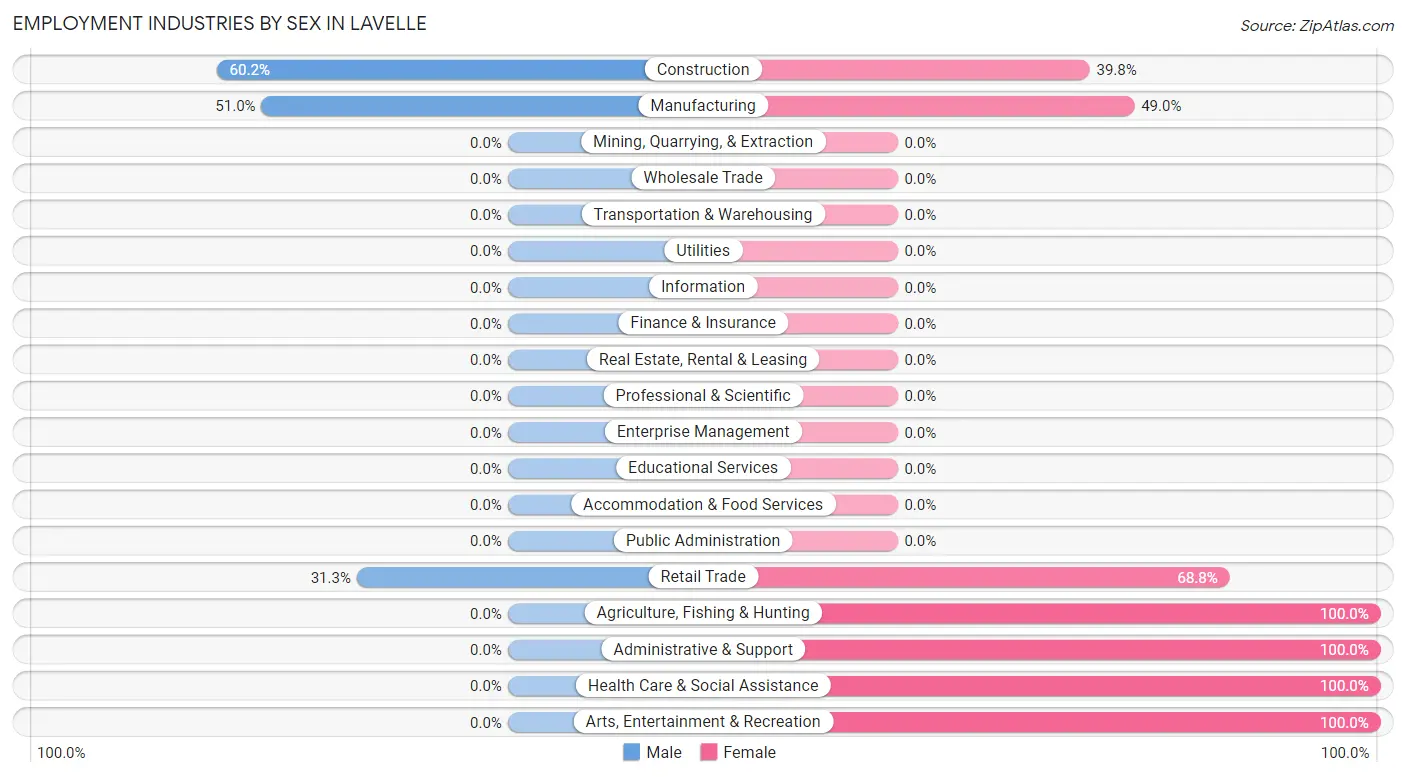
Employment Industries by Sex in Lavelle
The Lavelle industries that see more men than women are Construction (60.2%), Manufacturing (51.0%), and Retail Trade (31.2%), whereas the industries that tend to have a higher number of women are Agriculture, Fishing & Hunting (100.0%), Administrative & Support (100.0%), and Health Care & Social Assistance (100.0%).
| Industry | Male | Female |
| Agriculture, Fishing & Hunting | 0 (0.0%) | 6 (100.0%) |
| Mining, Quarrying, & Extraction | 0 (0.0%) | 0 (0.0%) |
| Construction | 50 (60.2%) | 33 (39.8%) |
| Manufacturing | 52 (51.0%) | 50 (49.0%) |
| Wholesale Trade | 0 (0.0%) | 0 (0.0%) |
| Retail Trade | 5 (31.2%) | 11 (68.8%) |
| Transportation & Warehousing | 0 (0.0%) | 0 (0.0%) |
| Utilities | 0 (0.0%) | 0 (0.0%) |
| Information | 0 (0.0%) | 0 (0.0%) |
| Finance & Insurance | 0 (0.0%) | 0 (0.0%) |
| Real Estate, Rental & Leasing | 0 (0.0%) | 0 (0.0%) |
| Professional & Scientific | 0 (0.0%) | 0 (0.0%) |
| Enterprise Management | 0 (0.0%) | 0 (0.0%) |
| Administrative & Support | 0 (0.0%) | 5 (100.0%) |
| Educational Services | 0 (0.0%) | 0 (0.0%) |
| Health Care & Social Assistance | 0 (0.0%) | 36 (100.0%) |
| Arts, Entertainment & Recreation | 0 (0.0%) | 7 (100.0%) |
| Accommodation & Food Services | 0 (0.0%) | 0 (0.0%) |
| Public Administration | 0 (0.0%) | 0 (0.0%) |
| Total | 107 (42.0%) | 148 (58.0%) |
Education in Lavelle
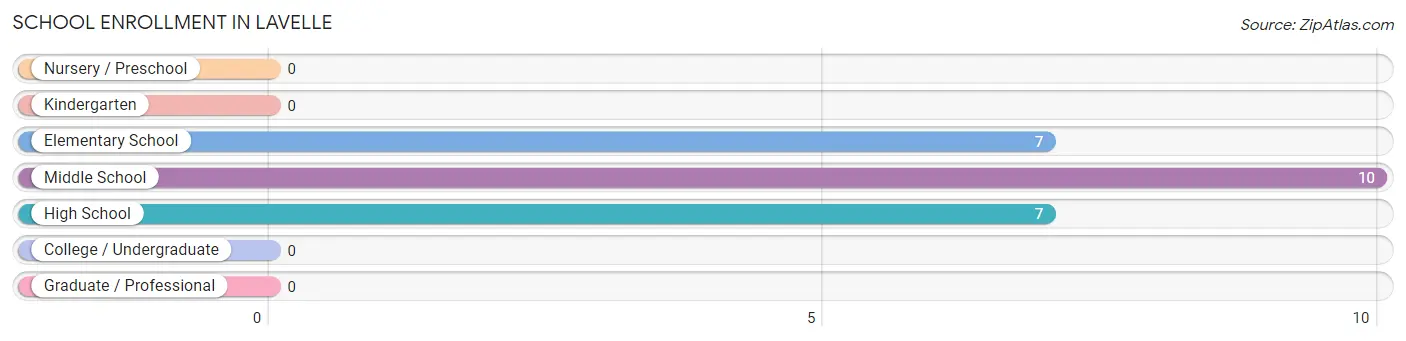
School Enrollment in Lavelle
The most common levels of schooling among the 24 students in Lavelle are middle school (10 | 41.7%), elementary school (7 | 29.2%), and high school (7 | 29.2%).
| School Level | # Students | % Students |
| Nursery / Preschool | 0 | 0.0% |
| Kindergarten | 0 | 0.0% |
| Elementary School | 7 | 29.2% |
| Middle School | 10 | 41.7% |
| High School | 7 | 29.2% |
| College / Undergraduate | 0 | 0.0% |
| Graduate / Professional | 0 | 0.0% |
| Total | 24 | 100.0% |
School Enrollment by Age by Funding Source in Lavelle
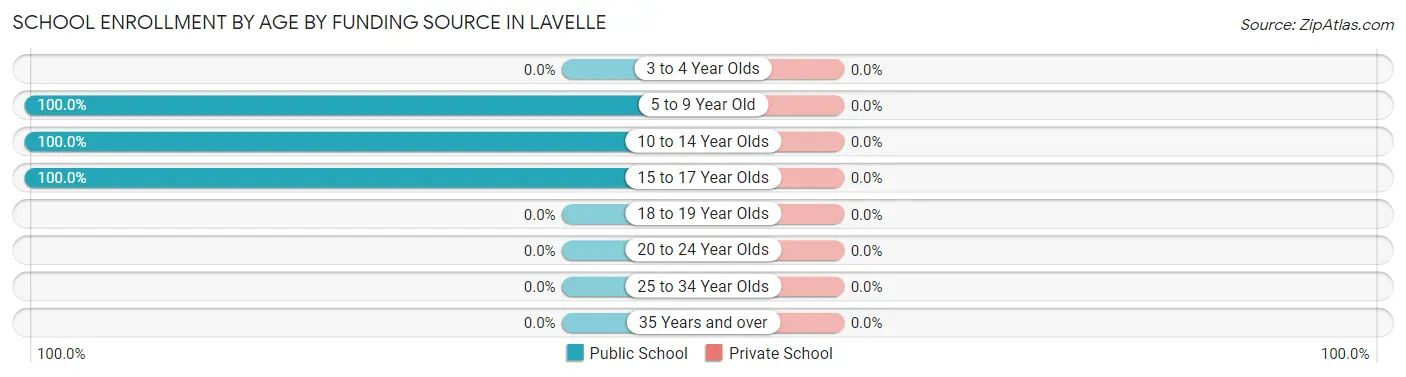
| Age Bracket | Public School | Private School |
| 3 to 4 Year Olds | 0 (0.0%) | 0 (0.0%) |
| 5 to 9 Year Old | 7 (100.0%) | 0 (0.0%) |
| 10 to 14 Year Olds | 10 (100.0%) | 0 (0.0%) |
| 15 to 17 Year Olds | 7 (100.0%) | 0 (0.0%) |
| 18 to 19 Year Olds | 0 (0.0%) | 0 (0.0%) |
| 20 to 24 Year Olds | 0 (0.0%) | 0 (0.0%) |
| 25 to 34 Year Olds | 0 (0.0%) | 0 (0.0%) |
| 35 Years and over | 0 (0.0%) | 0 (0.0%) |
| Total | 24 (100.0%) | 0 (0.0%) |
Educational Attainment by Field of Study in Lavelle
, and social sciences (6 | 100.0%) are the most common fields of study among 6 individuals in Lavelle who have obtained a bachelor's degree or higher.
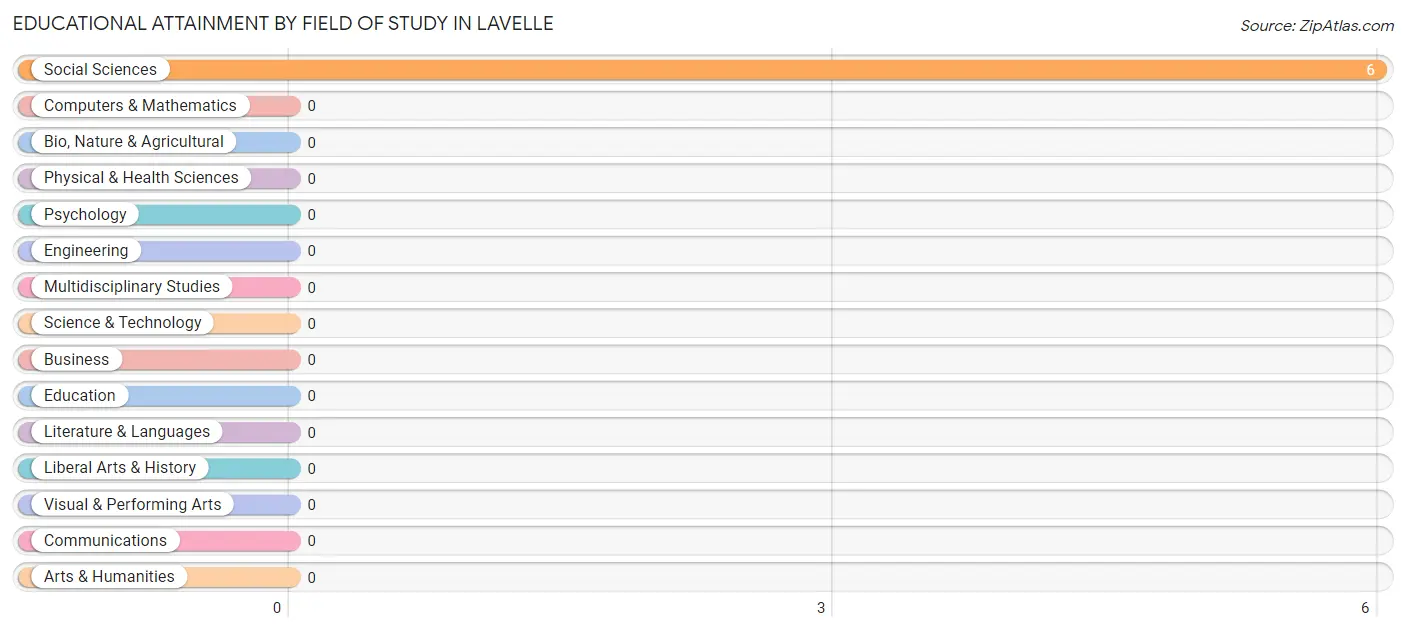
| Field of Study | # Graduates | % Graduates |
| Computers & Mathematics | 0 | 0.0% |
| Bio, Nature & Agricultural | 0 | 0.0% |
| Physical & Health Sciences | 0 | 0.0% |
| Psychology | 0 | 0.0% |
| Social Sciences | 6 | 100.0% |
| Engineering | 0 | 0.0% |
| Multidisciplinary Studies | 0 | 0.0% |
| Science & Technology | 0 | 0.0% |
| Business | 0 | 0.0% |
| Education | 0 | 0.0% |
| Literature & Languages | 0 | 0.0% |
| Liberal Arts & History | 0 | 0.0% |
| Visual & Performing Arts | 0 | 0.0% |
| Communications | 0 | 0.0% |
| Arts & Humanities | 0 | 0.0% |
| Total | 6 | 100.0% |
Transportation & Commute in Lavelle
Vehicle Availability by Sex in Lavelle
The most prevalent vehicle ownership categories in Lavelle are males with 2 vehicles (87, accounting for 81.3%) and females with 2 vehicles (84, making up 58.8%).
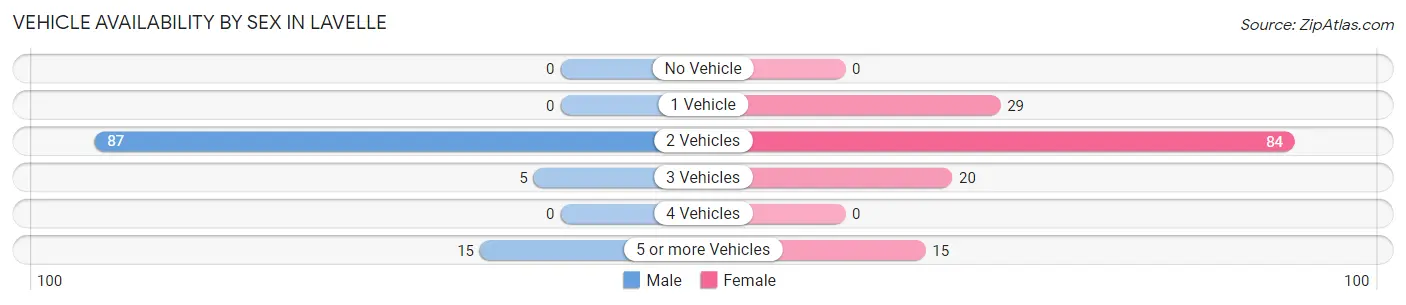
| Vehicles Available | Male | Female |
| No Vehicle | 0 (0.0%) | 0 (0.0%) |
| 1 Vehicle | 0 (0.0%) | 29 (19.6%) |
| 2 Vehicles | 87 (81.3%) | 84 (56.8%) |
| 3 Vehicles | 5 (4.7%) | 20 (13.5%) |
| 4 Vehicles | 0 (0.0%) | 0 (0.0%) |
| 5 or more Vehicles | 15 (14.0%) | 15 (10.1%) |
| Total | 107 (100.0%) | 148 (100.0%) |
Commute Time in Lavelle
The most frequently occuring commute durations in Lavelle are 5 to 9 minutes (67 commuters, 28.0%), 30 to 34 minutes (55 commuters, 23.0%), and 10 to 14 minutes (49 commuters, 20.5%).
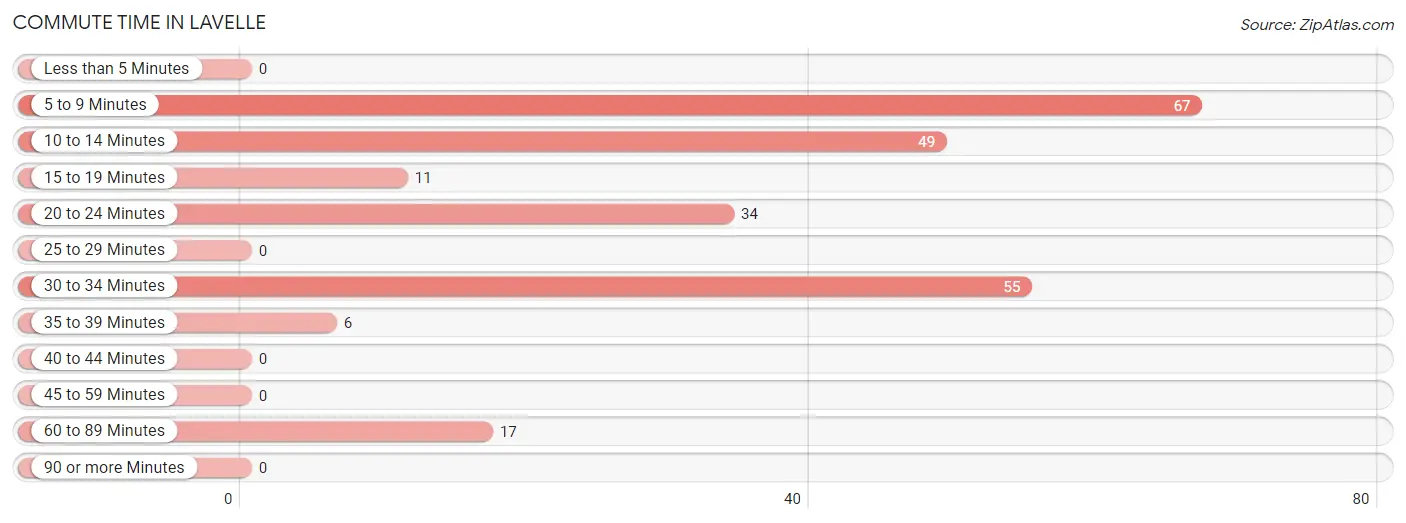
| Commute Time | # Commuters | % Commuters |
| Less than 5 Minutes | 0 | 0.0% |
| 5 to 9 Minutes | 67 | 28.0% |
| 10 to 14 Minutes | 49 | 20.5% |
| 15 to 19 Minutes | 11 | 4.6% |
| 20 to 24 Minutes | 34 | 14.2% |
| 25 to 29 Minutes | 0 | 0.0% |
| 30 to 34 Minutes | 55 | 23.0% |
| 35 to 39 Minutes | 6 | 2.5% |
| 40 to 44 Minutes | 0 | 0.0% |
| 45 to 59 Minutes | 0 | 0.0% |
| 60 to 89 Minutes | 17 | 7.1% |
| 90 or more Minutes | 0 | 0.0% |
Commute Time by Sex in Lavelle
The most common commute times in Lavelle are 30 to 34 minutes (50 commuters, 46.7%) for males and 5 to 9 minutes (50 commuters, 37.9%) for females.
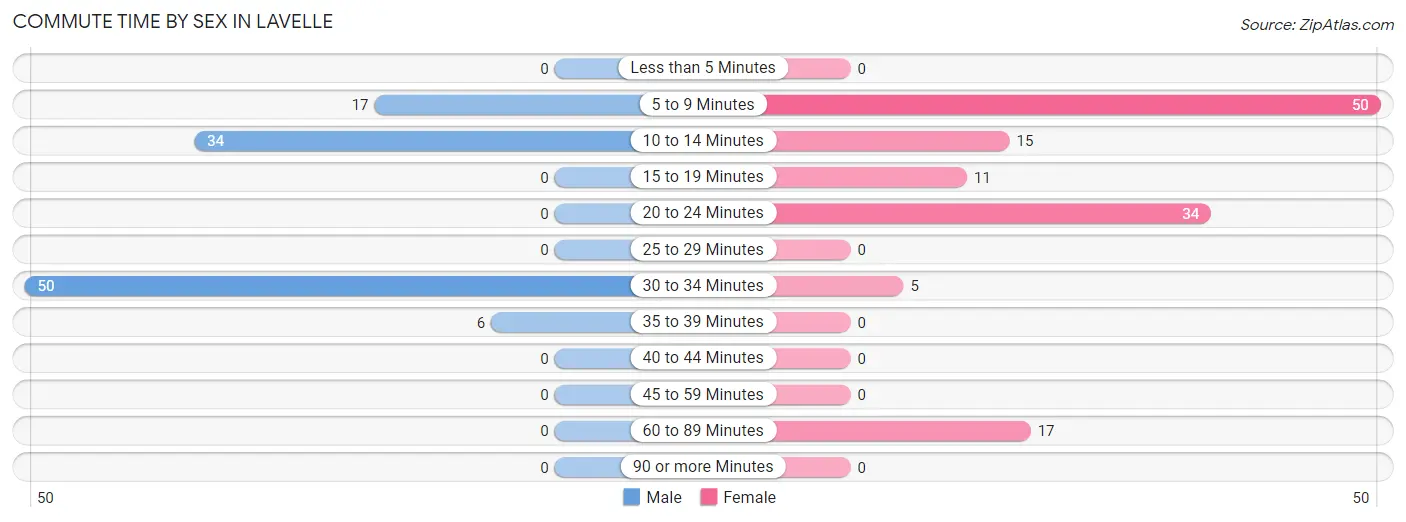
| Commute Time | Male | Female |
| Less than 5 Minutes | 0 (0.0%) | 0 (0.0%) |
| 5 to 9 Minutes | 17 (15.9%) | 50 (37.9%) |
| 10 to 14 Minutes | 34 (31.8%) | 15 (11.4%) |
| 15 to 19 Minutes | 0 (0.0%) | 11 (8.3%) |
| 20 to 24 Minutes | 0 (0.0%) | 34 (25.8%) |
| 25 to 29 Minutes | 0 (0.0%) | 0 (0.0%) |
| 30 to 34 Minutes | 50 (46.7%) | 5 (3.8%) |
| 35 to 39 Minutes | 6 (5.6%) | 0 (0.0%) |
| 40 to 44 Minutes | 0 (0.0%) | 0 (0.0%) |
| 45 to 59 Minutes | 0 (0.0%) | 0 (0.0%) |
| 60 to 89 Minutes | 0 (0.0%) | 17 (12.9%) |
| 90 or more Minutes | 0 (0.0%) | 0 (0.0%) |
Time of Departure to Work by Sex in Lavelle
The most frequent times of departure to work in Lavelle are 6:00 AM to 6:29 AM (50, 46.7%) for males and 6:30 AM to 6:59 AM (50, 37.9%) for females.
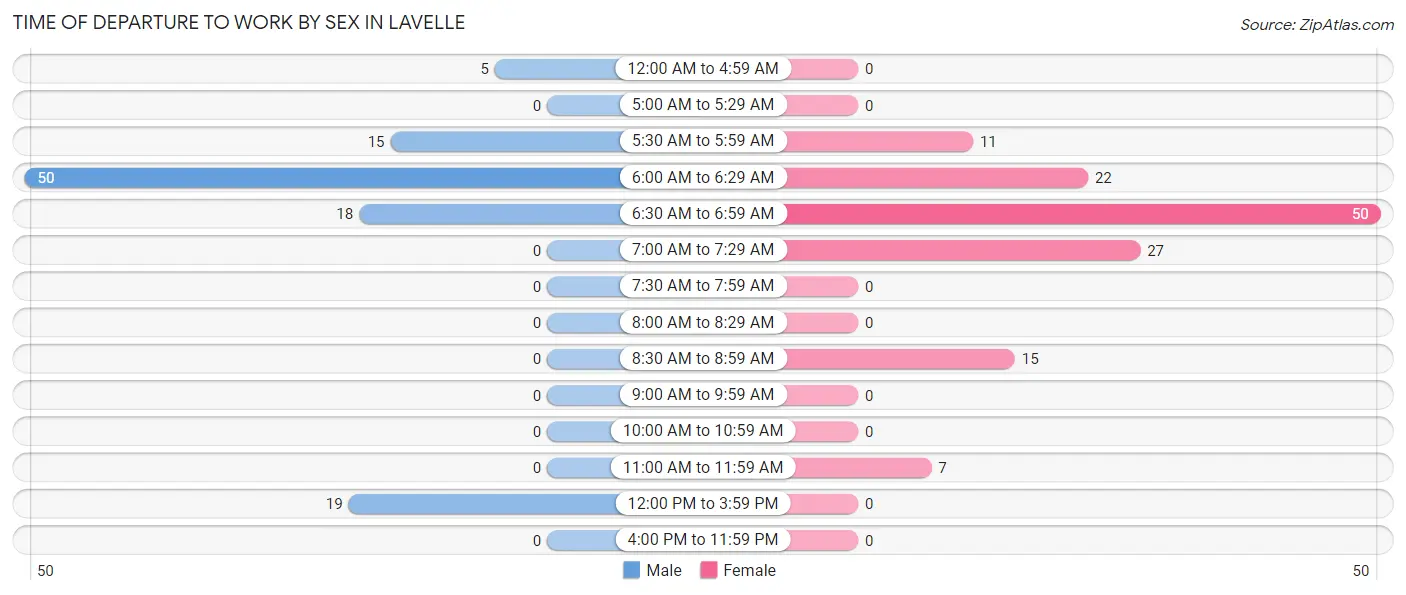
| Time of Departure | Male | Female |
| 12:00 AM to 4:59 AM | 5 (4.7%) | 0 (0.0%) |
| 5:00 AM to 5:29 AM | 0 (0.0%) | 0 (0.0%) |
| 5:30 AM to 5:59 AM | 15 (14.0%) | 11 (8.3%) |
| 6:00 AM to 6:29 AM | 50 (46.7%) | 22 (16.7%) |
| 6:30 AM to 6:59 AM | 18 (16.8%) | 50 (37.9%) |
| 7:00 AM to 7:29 AM | 0 (0.0%) | 27 (20.4%) |
| 7:30 AM to 7:59 AM | 0 (0.0%) | 0 (0.0%) |
| 8:00 AM to 8:29 AM | 0 (0.0%) | 0 (0.0%) |
| 8:30 AM to 8:59 AM | 0 (0.0%) | 15 (11.4%) |
| 9:00 AM to 9:59 AM | 0 (0.0%) | 0 (0.0%) |
| 10:00 AM to 10:59 AM | 0 (0.0%) | 0 (0.0%) |
| 11:00 AM to 11:59 AM | 0 (0.0%) | 7 (5.3%) |
| 12:00 PM to 3:59 PM | 19 (17.8%) | 0 (0.0%) |
| 4:00 PM to 11:59 PM | 0 (0.0%) | 0 (0.0%) |
| Total | 107 (100.0%) | 132 (100.0%) |
Housing Occupancy in Lavelle
Occupancy by Ownership in Lavelle
Of the total 190 dwellings in Lavelle, owner-occupied units account for 190 (100.0%), while renter-occupied units make up 0 (0.0%).
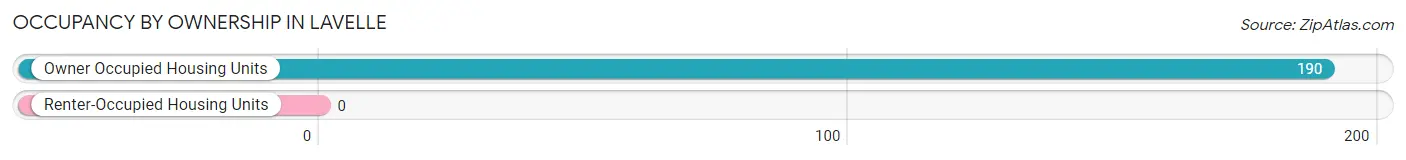
| Occupancy | # Housing Units | % Housing Units |
| Owner Occupied Housing Units | 190 | 100.0% |
| Renter-Occupied Housing Units | 0 | 0.0% |
| Total Occupied Housing Units | 190 | 100.0% |
Occupancy by Household Size in Lavelle
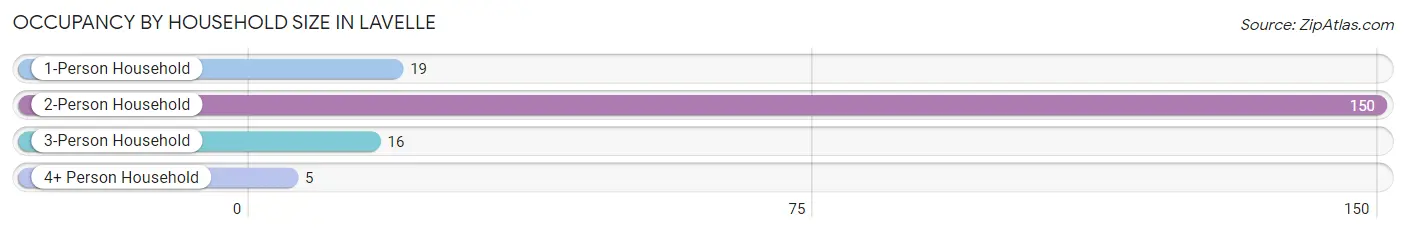
| Household Size | # Housing Units | % Housing Units |
| 1-Person Household | 19 | 10.0% |
| 2-Person Household | 150 | 78.9% |
| 3-Person Household | 16 | 8.4% |
| 4+ Person Household | 5 | 2.6% |
| Total Housing Units | 190 | 100.0% |
Occupancy by Ownership by Household Size in Lavelle
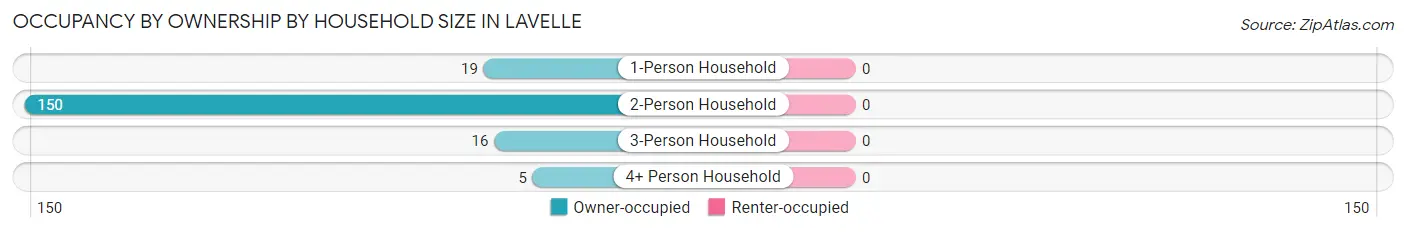
| Household Size | Owner-occupied | Renter-occupied |
| 1-Person Household | 19 (100.0%) | 0 (0.0%) |
| 2-Person Household | 150 (100.0%) | 0 (0.0%) |
| 3-Person Household | 16 (100.0%) | 0 (0.0%) |
| 4+ Person Household | 5 (100.0%) | 0 (0.0%) |
| Total Housing Units | 190 (100.0%) | 0 (0.0%) |
Occupancy by Educational Attainment in Lavelle
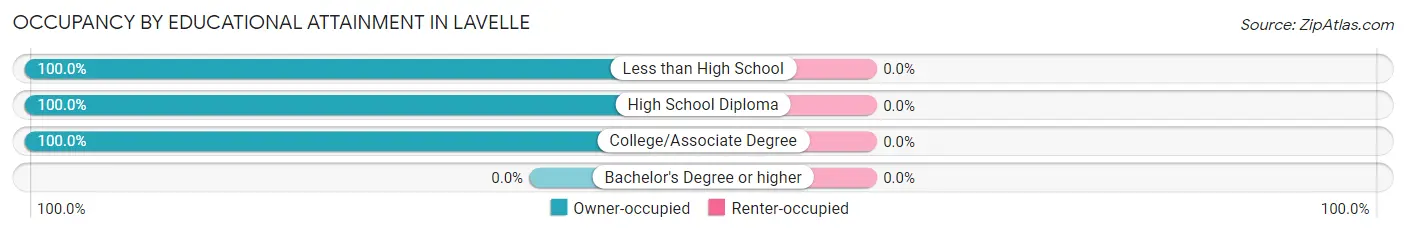
| Household Size | Owner-occupied | Renter-occupied |
| Less than High School | 45 (100.0%) | 0 (0.0%) |
| High School Diploma | 103 (100.0%) | 0 (0.0%) |
| College/Associate Degree | 42 (100.0%) | 0 (0.0%) |
| Bachelor's Degree or higher | 0 (0.0%) | 0 (0.0%) |
Occupancy by Age of Householder in Lavelle
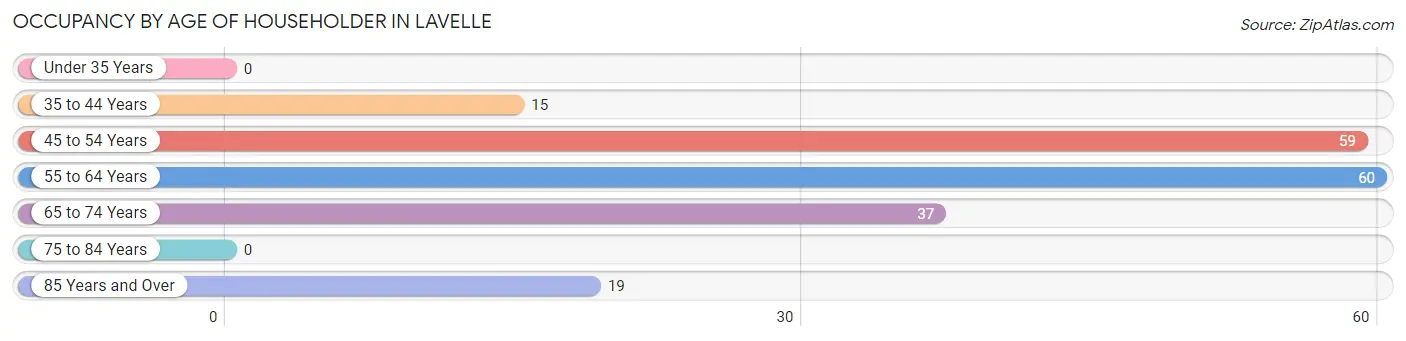
| Age Bracket | # Households | % Households |
| Under 35 Years | 0 | 0.0% |
| 35 to 44 Years | 15 | 7.9% |
| 45 to 54 Years | 59 | 31.0% |
| 55 to 64 Years | 60 | 31.6% |
| 65 to 74 Years | 37 | 19.5% |
| 75 to 84 Years | 0 | 0.0% |
| 85 Years and Over | 19 | 10.0% |
| Total | 190 | 100.0% |
Housing Finances in Lavelle
Median Income by Occupancy in Lavelle
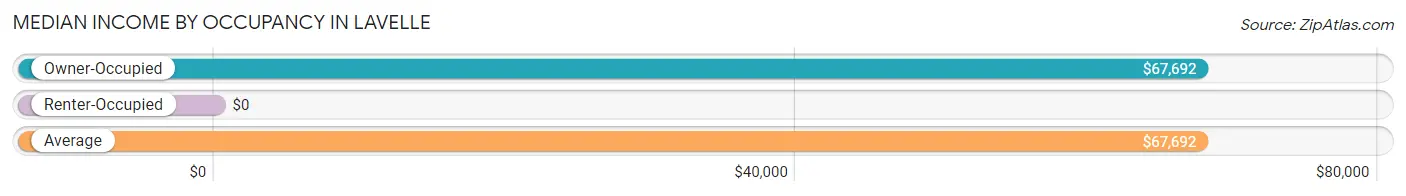
| Occupancy Type | # Households | Median Income |
| Owner-Occupied | 190 (100.0%) | $67,692 |
| Renter-Occupied | 0 (0.0%) | $0 |
| Average | 190 (100.0%) | $67,692 |
Occupancy by Householder Income Bracket in Lavelle
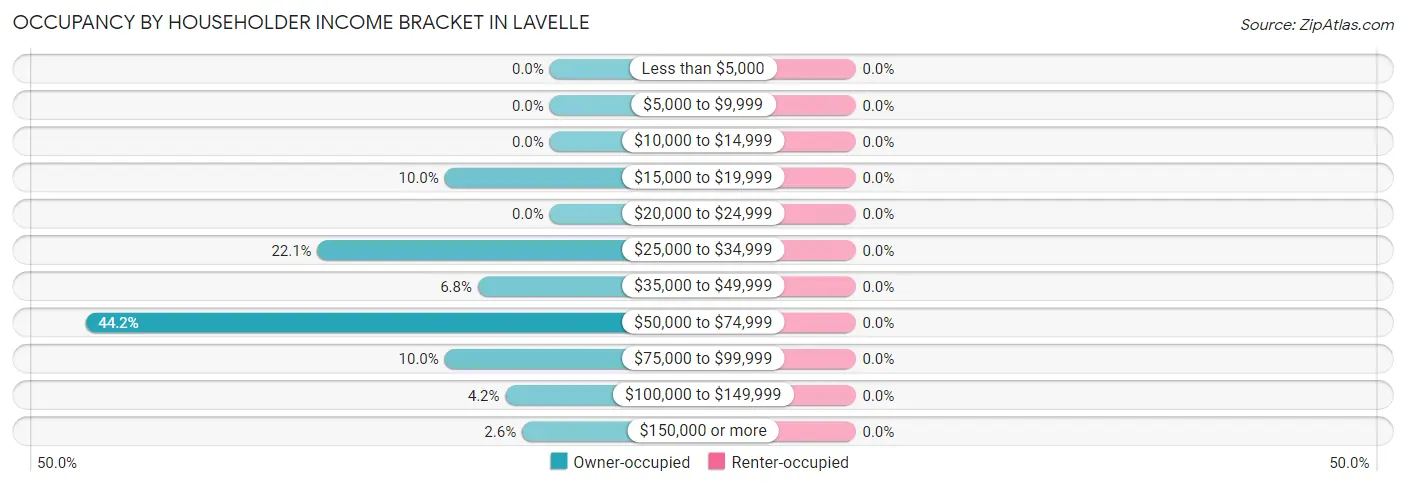
| Income Bracket | Owner-occupied | Renter-occupied |
| Less than $5,000 | 0 (0.0%) | 0 (0.0%) |
| $5,000 to $9,999 | 0 (0.0%) | 0 (0.0%) |
| $10,000 to $14,999 | 0 (0.0%) | 0 (0.0%) |
| $15,000 to $19,999 | 19 (10.0%) | 0 (0.0%) |
| $20,000 to $24,999 | 0 (0.0%) | 0 (0.0%) |
| $25,000 to $34,999 | 42 (22.1%) | 0 (0.0%) |
| $35,000 to $49,999 | 13 (6.8%) | 0 (0.0%) |
| $50,000 to $74,999 | 84 (44.2%) | 0 (0.0%) |
| $75,000 to $99,999 | 19 (10.0%) | 0 (0.0%) |
| $100,000 to $149,999 | 8 (4.2%) | 0 (0.0%) |
| $150,000 or more | 5 (2.6%) | 0 (0.0%) |
| Total | 190 (100.0%) | 0 (0.0%) |
Monthly Housing Cost Tiers in Lavelle
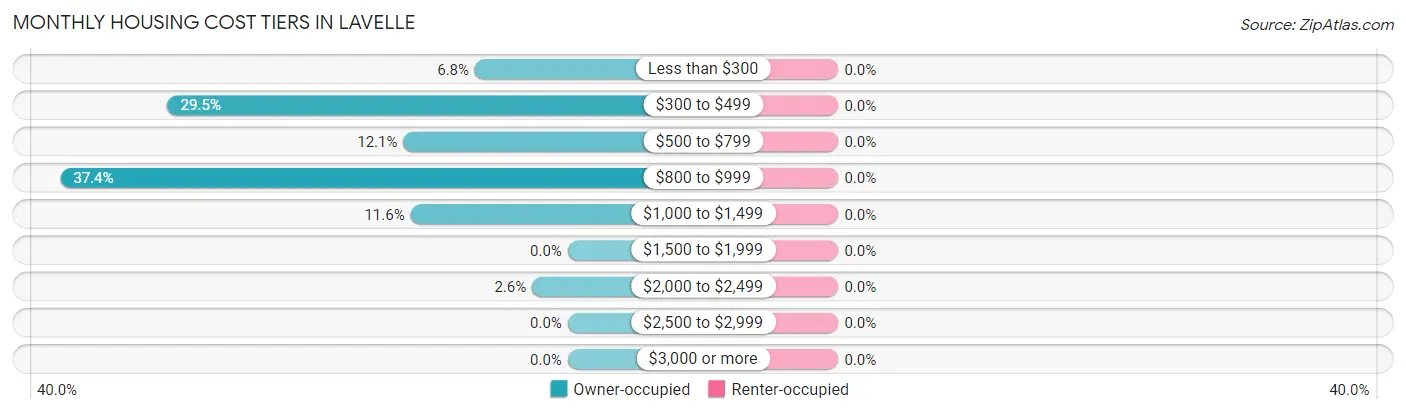
| Monthly Cost | Owner-occupied | Renter-occupied |
| Less than $300 | 13 (6.8%) | 0 (0.0%) |
| $300 to $499 | 56 (29.5%) | 0 (0.0%) |
| $500 to $799 | 23 (12.1%) | 0 (0.0%) |
| $800 to $999 | 71 (37.4%) | 0 (0.0%) |
| $1,000 to $1,499 | 22 (11.6%) | 0 (0.0%) |
| $1,500 to $1,999 | 0 (0.0%) | 0 (0.0%) |
| $2,000 to $2,499 | 5 (2.6%) | 0 (0.0%) |
| $2,500 to $2,999 | 0 (0.0%) | 0 (0.0%) |
| $3,000 or more | 0 (0.0%) | 0 (0.0%) |
| Total | 190 (100.0%) | 0 (0.0%) |
Physical Housing Characteristics in Lavelle
Housing Structures in Lavelle
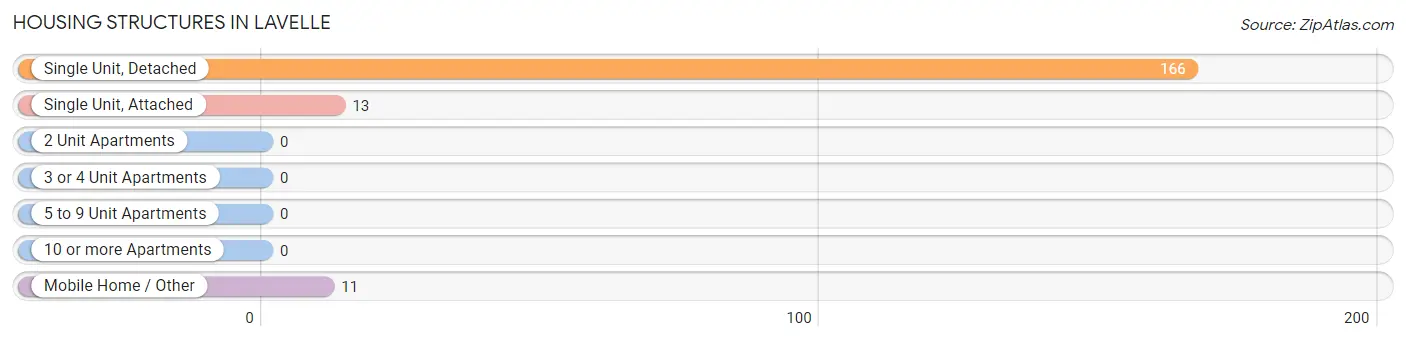
| Structure Type | # Housing Units | % Housing Units |
| Single Unit, Detached | 166 | 87.4% |
| Single Unit, Attached | 13 | 6.8% |
| 2 Unit Apartments | 0 | 0.0% |
| 3 or 4 Unit Apartments | 0 | 0.0% |
| 5 to 9 Unit Apartments | 0 | 0.0% |
| 10 or more Apartments | 0 | 0.0% |
| Mobile Home / Other | 11 | 5.8% |
| Total | 190 | 100.0% |
Housing Structures by Occupancy in Lavelle
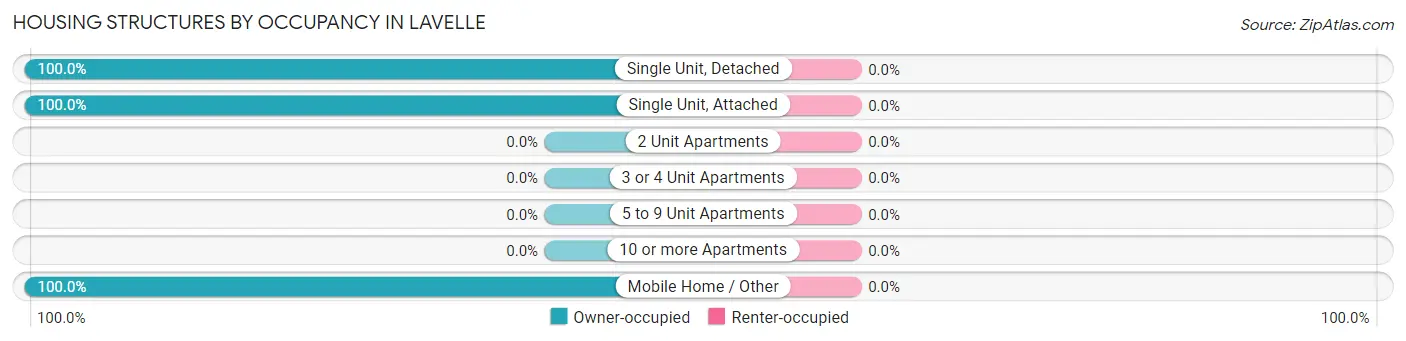
| Structure Type | Owner-occupied | Renter-occupied |
| Single Unit, Detached | 166 (100.0%) | 0 (0.0%) |
| Single Unit, Attached | 13 (100.0%) | 0 (0.0%) |
| 2 Unit Apartments | 0 (0.0%) | 0 (0.0%) |
| 3 or 4 Unit Apartments | 0 (0.0%) | 0 (0.0%) |
| 5 to 9 Unit Apartments | 0 (0.0%) | 0 (0.0%) |
| 10 or more Apartments | 0 (0.0%) | 0 (0.0%) |
| Mobile Home / Other | 11 (100.0%) | 0 (0.0%) |
| Total | 190 (100.0%) | 0 (0.0%) |
Housing Structures by Number of Rooms in Lavelle
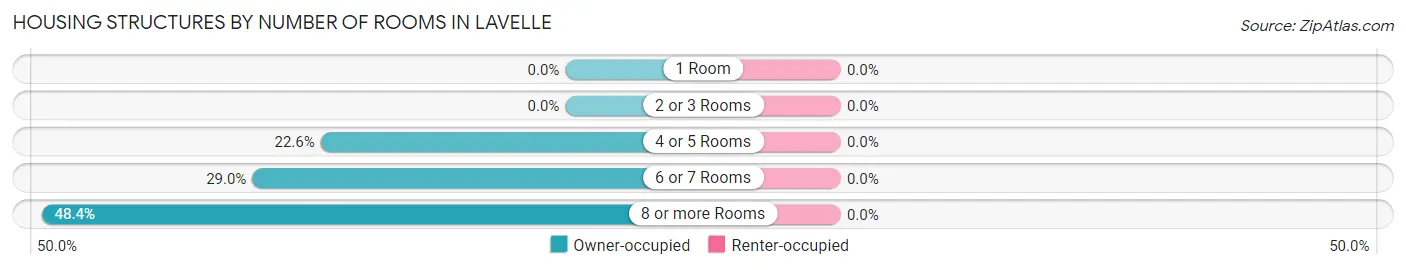
| Number of Rooms | Owner-occupied | Renter-occupied |
| 1 Room | 0 (0.0%) | 0 (0.0%) |
| 2 or 3 Rooms | 0 (0.0%) | 0 (0.0%) |
| 4 or 5 Rooms | 43 (22.6%) | 0 (0.0%) |
| 6 or 7 Rooms | 55 (28.9%) | 0 (0.0%) |
| 8 or more Rooms | 92 (48.4%) | 0 (0.0%) |
| Total | 190 (100.0%) | 0 (0.0%) |
Housing Structure by Heating Type in Lavelle
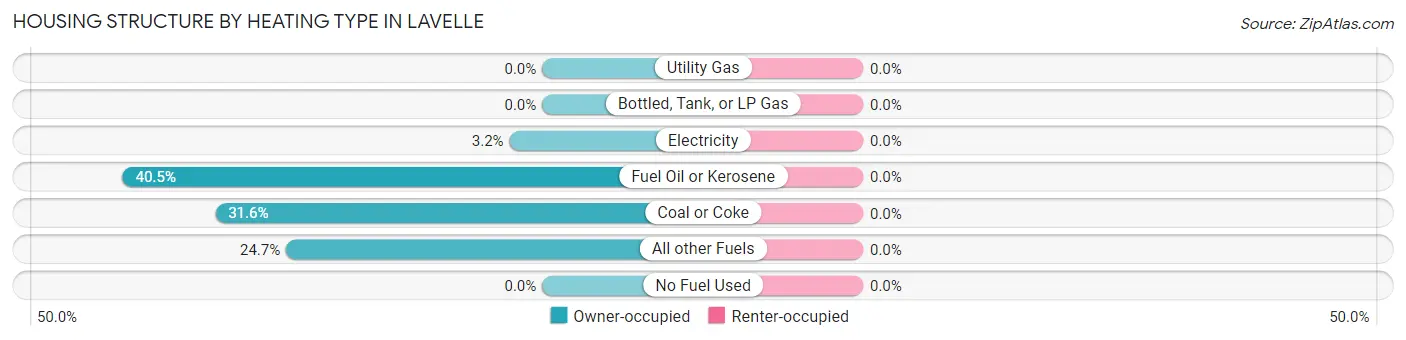
| Heating Type | Owner-occupied | Renter-occupied |
| Utility Gas | 0 (0.0%) | 0 (0.0%) |
| Bottled, Tank, or LP Gas | 0 (0.0%) | 0 (0.0%) |
| Electricity | 6 (3.2%) | 0 (0.0%) |
| Fuel Oil or Kerosene | 77 (40.5%) | 0 (0.0%) |
| Coal or Coke | 60 (31.6%) | 0 (0.0%) |
| All other Fuels | 47 (24.7%) | 0 (0.0%) |
| No Fuel Used | 0 (0.0%) | 0 (0.0%) |
| Total | 190 (100.0%) | 0 (0.0%) |
Household Vehicle Usage in Lavelle
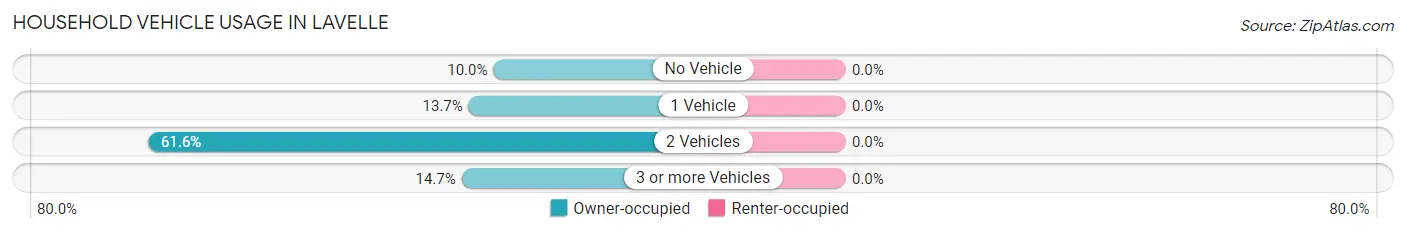
| Vehicles per Household | Owner-occupied | Renter-occupied |
| No Vehicle | 19 (10.0%) | 0 (0.0%) |
| 1 Vehicle | 26 (13.7%) | 0 (0.0%) |
| 2 Vehicles | 117 (61.6%) | 0 (0.0%) |
| 3 or more Vehicles | 28 (14.7%) | 0 (0.0%) |
| Total | 190 (100.0%) | 0 (0.0%) |
Real Estate & Mortgages in Lavelle
Real Estate and Mortgage Overview in Lavelle
| Characteristic | Without Mortgage | With Mortgage |
| Housing Units | 145 | 45 |
| Median Property Value | $159,900 | $92,300 |
| Median Household Income | $44,712 | $5 |
| Monthly Housing Costs | $644 | $0 |
| Real Estate Taxes | - | - |
Property Value by Mortgage Status in Lavelle
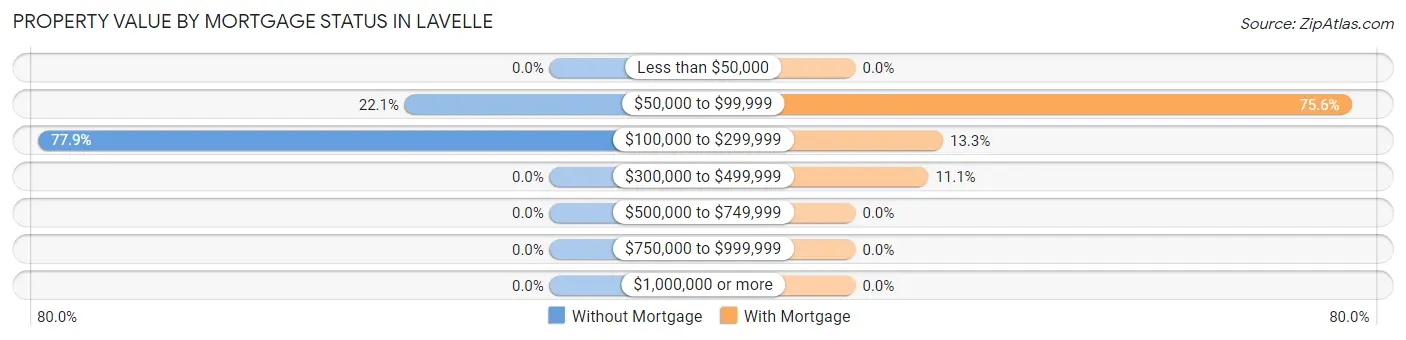
| Property Value | Without Mortgage | With Mortgage |
| Less than $50,000 | 0 (0.0%) | 0 (0.0%) |
| $50,000 to $99,999 | 32 (22.1%) | 34 (75.6%) |
| $100,000 to $299,999 | 113 (77.9%) | 6 (13.3%) |
| $300,000 to $499,999 | 0 (0.0%) | 5 (11.1%) |
| $500,000 to $749,999 | 0 (0.0%) | 0 (0.0%) |
| $750,000 to $999,999 | 0 (0.0%) | 0 (0.0%) |
| $1,000,000 or more | 0 (0.0%) | 0 (0.0%) |
| Total | 145 (100.0%) | 45 (100.0%) |
Household Income by Mortgage Status in Lavelle
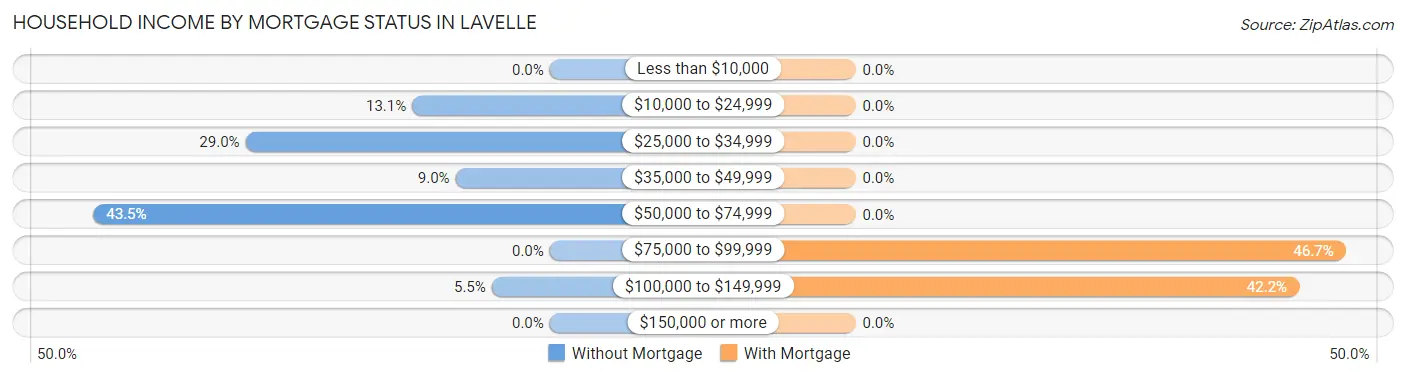
| Household Income | Without Mortgage | With Mortgage |
| Less than $10,000 | 0 (0.0%) | 0 (0.0%) |
| $10,000 to $24,999 | 19 (13.1%) | 0 (0.0%) |
| $25,000 to $34,999 | 42 (29.0%) | 0 (0.0%) |
| $35,000 to $49,999 | 13 (9.0%) | 0 (0.0%) |
| $50,000 to $74,999 | 63 (43.4%) | 0 (0.0%) |
| $75,000 to $99,999 | 0 (0.0%) | 21 (46.7%) |
| $100,000 to $149,999 | 8 (5.5%) | 19 (42.2%) |
| $150,000 or more | 0 (0.0%) | 0 (0.0%) |
| Total | 145 (100.0%) | 45 (100.0%) |
Property Value to Household Income Ratio in Lavelle
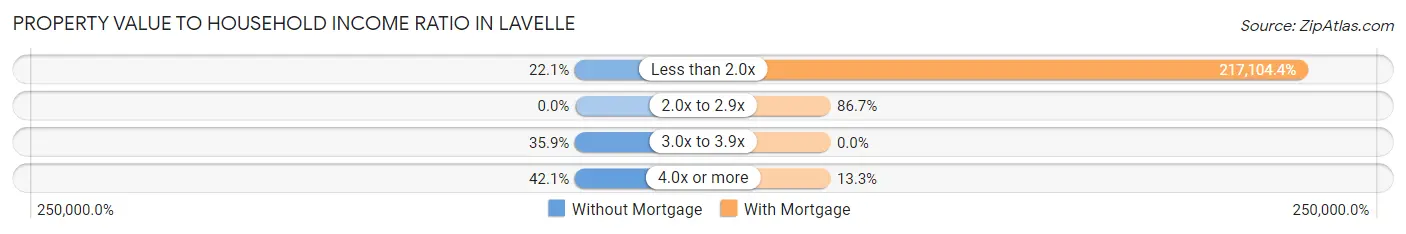
| Value-to-Income Ratio | Without Mortgage | With Mortgage |
| Less than 2.0x | 32 (22.1%) | 97,697 (217,104.4%) |
| 2.0x to 2.9x | 0 (0.0%) | 39 (86.7%) |
| 3.0x to 3.9x | 52 (35.9%) | 0 (0.0%) |
| 4.0x or more | 61 (42.1%) | 6 (13.3%) |
| Total | 145 (100.0%) | 45 (100.0%) |
Real Estate Taxes by Mortgage Status in Lavelle
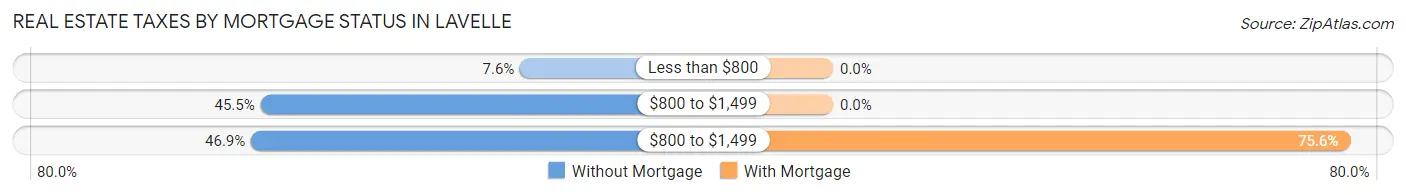
| Property Taxes | Without Mortgage | With Mortgage |
| Less than $800 | 11 (7.6%) | 0 (0.0%) |
| $800 to $1,499 | 66 (45.5%) | 0 (0.0%) |
| $800 to $1,499 | 68 (46.9%) | 34 (75.6%) |
| Total | 145 (100.0%) | 45 (100.0%) |
Health & Disability in Lavelle
Health Insurance Coverage by Age in Lavelle
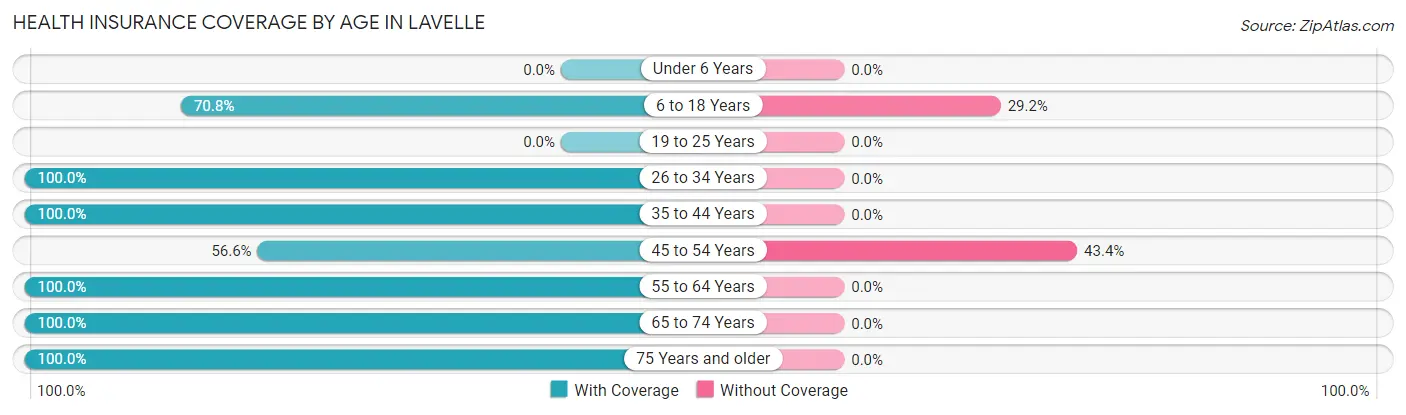
| Age Bracket | With Coverage | Without Coverage |
| Under 6 Years | 0 (0.0%) | 0 (0.0%) |
| 6 to 18 Years | 17 (70.8%) | 7 (29.2%) |
| 19 to 25 Years | 0 (0.0%) | 0 (0.0%) |
| 26 to 34 Years | 21 (100.0%) | 0 (0.0%) |
| 35 to 44 Years | 20 (100.0%) | 0 (0.0%) |
| 45 to 54 Years | 43 (56.6%) | 33 (43.4%) |
| 55 to 64 Years | 179 (100.0%) | 0 (0.0%) |
| 65 to 74 Years | 49 (100.0%) | 0 (0.0%) |
| 75 Years and older | 19 (100.0%) | 0 (0.0%) |
| Total | 348 (89.7%) | 40 (10.3%) |
Health Insurance Coverage by Citizenship Status in Lavelle
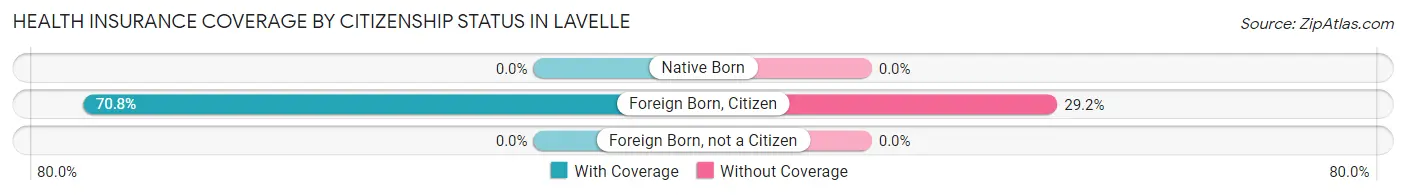
| Citizenship Status | With Coverage | Without Coverage |
| Native Born | 0 (0.0%) | 0 (0.0%) |
| Foreign Born, Citizen | 17 (70.8%) | 7 (29.2%) |
| Foreign Born, not a Citizen | 0 (0.0%) | 0 (0.0%) |
Health Insurance Coverage by Household Income in Lavelle
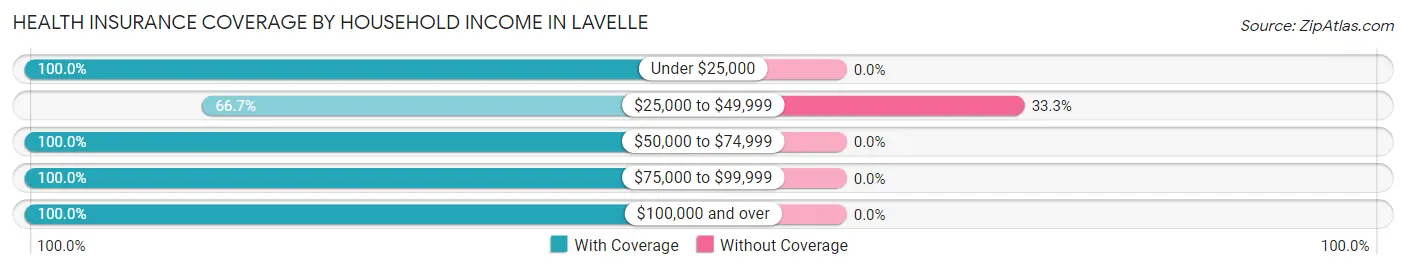
| Household Income | With Coverage | Without Coverage |
| Under $25,000 | 19 (100.0%) | 0 (0.0%) |
| $25,000 to $49,999 | 80 (66.7%) | 40 (33.3%) |
| $50,000 to $74,999 | 167 (100.0%) | 0 (0.0%) |
| $75,000 to $99,999 | 40 (100.0%) | 0 (0.0%) |
| $100,000 and over | 42 (100.0%) | 0 (0.0%) |
Public vs Private Health Insurance Coverage by Age in Lavelle
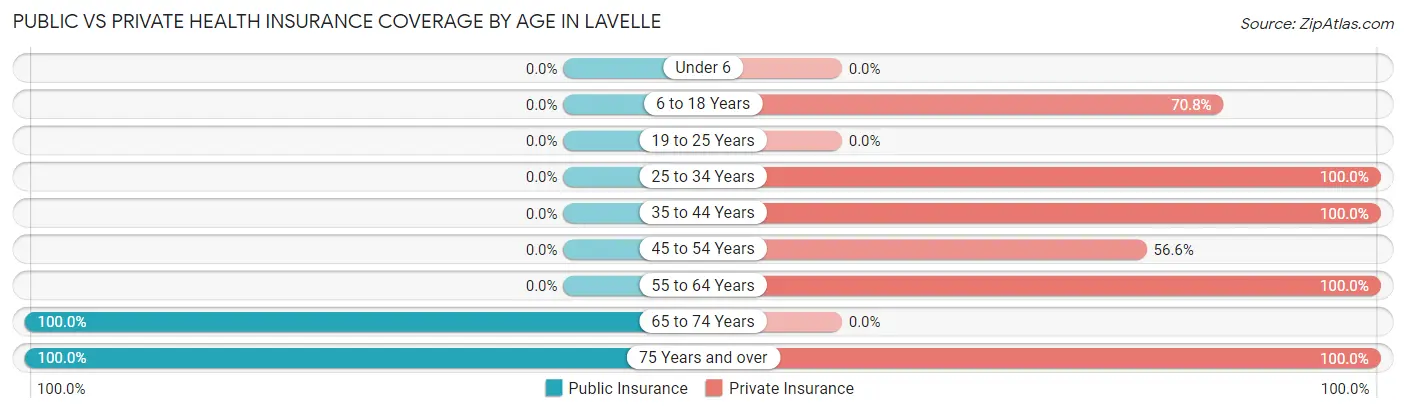
| Age Bracket | Public Insurance | Private Insurance |
| Under 6 | 0 (0.0%) | 0 (0.0%) |
| 6 to 18 Years | 0 (0.0%) | 17 (70.8%) |
| 19 to 25 Years | 0 (0.0%) | 0 (0.0%) |
| 25 to 34 Years | 0 (0.0%) | 21 (100.0%) |
| 35 to 44 Years | 0 (0.0%) | 20 (100.0%) |
| 45 to 54 Years | 0 (0.0%) | 43 (56.6%) |
| 55 to 64 Years | 0 (0.0%) | 179 (100.0%) |
| 65 to 74 Years | 49 (100.0%) | 0 (0.0%) |
| 75 Years and over | 19 (100.0%) | 19 (100.0%) |
| Total | 68 (17.5%) | 299 (77.1%) |
Disability Status by Sex by Age in Lavelle
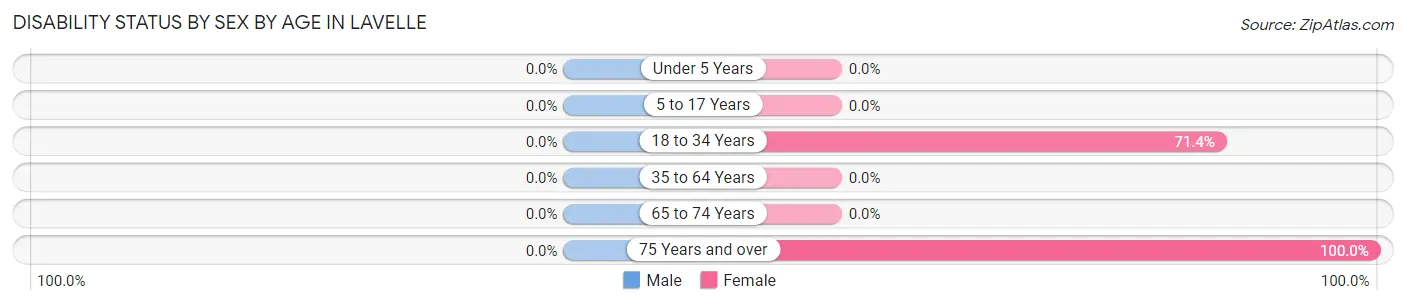
| Age Bracket | Male | Female |
| Under 5 Years | 0 (0.0%) | 0 (0.0%) |
| 5 to 17 Years | 0 (0.0%) | 0 (0.0%) |
| 18 to 34 Years | 0 (0.0%) | 15 (71.4%) |
| 35 to 64 Years | 0 (0.0%) | 0 (0.0%) |
| 65 to 74 Years | 0 (0.0%) | 0 (0.0%) |
| 75 Years and over | 0 (0.0%) | 19 (100.0%) |
Disability Class by Sex by Age in Lavelle
Disability Class: Hearing Difficulty
| Age Bracket | Male | Female |
| Under 5 Years | 0 (0.0%) | 0 (0.0%) |
| 5 to 17 Years | 0 (0.0%) | 0 (0.0%) |
| 18 to 34 Years | 0 (0.0%) | 0 (0.0%) |
| 35 to 64 Years | 0 (0.0%) | 0 (0.0%) |
| 65 to 74 Years | 0 (0.0%) | 0 (0.0%) |
| 75 Years and over | 0 (0.0%) | 0 (0.0%) |
Disability Class: Vision Difficulty
| Age Bracket | Male | Female |
| Under 5 Years | 0 (0.0%) | 0 (0.0%) |
| 5 to 17 Years | 0 (0.0%) | 0 (0.0%) |
| 18 to 34 Years | 0 (0.0%) | 0 (0.0%) |
| 35 to 64 Years | 0 (0.0%) | 0 (0.0%) |
| 65 to 74 Years | 0 (0.0%) | 0 (0.0%) |
| 75 Years and over | 0 (0.0%) | 0 (0.0%) |
Disability Class: Cognitive Difficulty
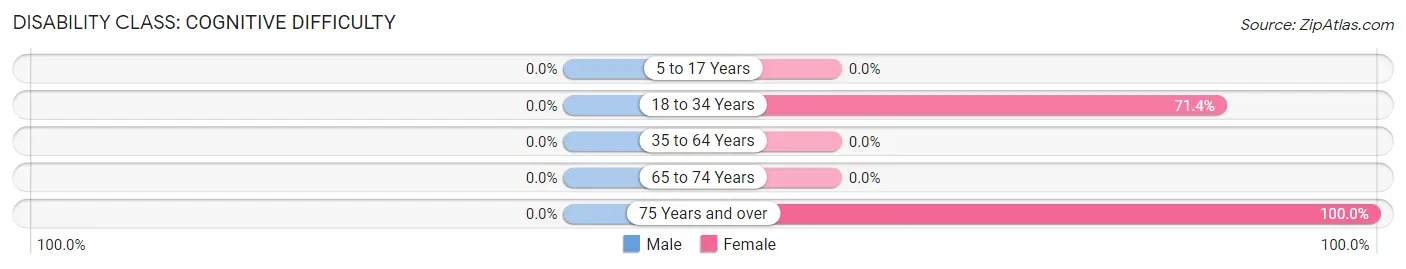
| Age Bracket | Male | Female |
| 5 to 17 Years | 0 (0.0%) | 0 (0.0%) |
| 18 to 34 Years | 0 (0.0%) | 15 (71.4%) |
| 35 to 64 Years | 0 (0.0%) | 0 (0.0%) |
| 65 to 74 Years | 0 (0.0%) | 0 (0.0%) |
| 75 Years and over | 0 (0.0%) | 19 (100.0%) |
Disability Class: Ambulatory Difficulty
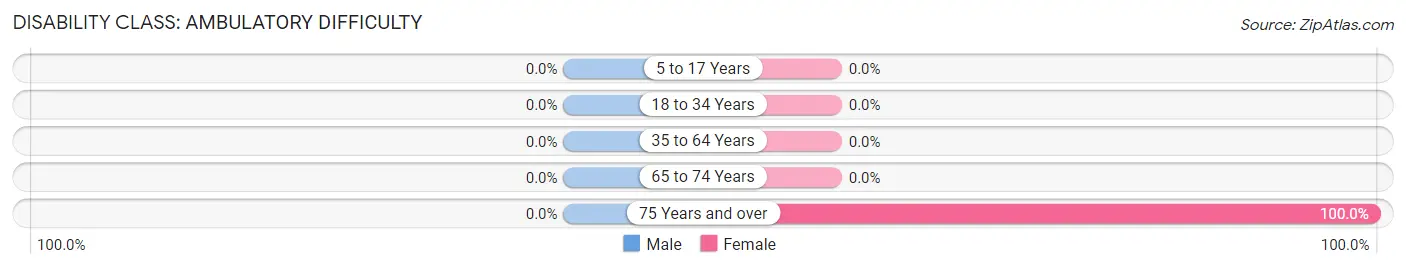
| Age Bracket | Male | Female |
| 5 to 17 Years | 0 (0.0%) | 0 (0.0%) |
| 18 to 34 Years | 0 (0.0%) | 0 (0.0%) |
| 35 to 64 Years | 0 (0.0%) | 0 (0.0%) |
| 65 to 74 Years | 0 (0.0%) | 0 (0.0%) |
| 75 Years and over | 0 (0.0%) | 19 (100.0%) |
Disability Class: Self-Care Difficulty
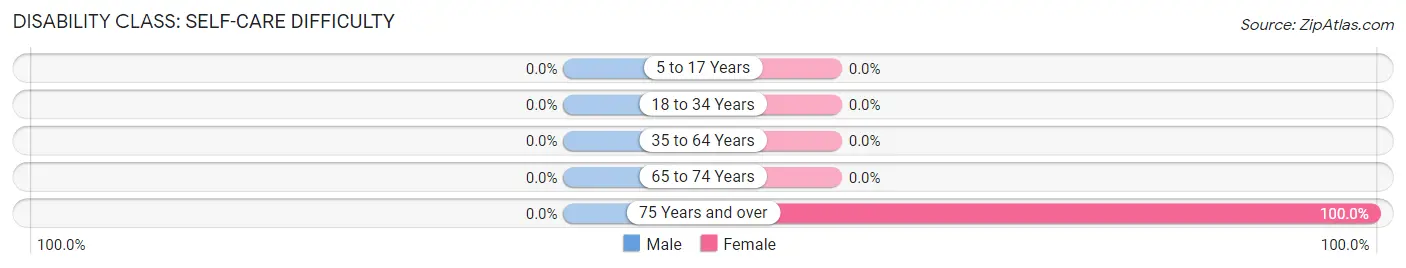
| Age Bracket | Male | Female |
| 5 to 17 Years | 0 (0.0%) | 0 (0.0%) |
| 18 to 34 Years | 0 (0.0%) | 0 (0.0%) |
| 35 to 64 Years | 0 (0.0%) | 0 (0.0%) |
| 65 to 74 Years | 0 (0.0%) | 0 (0.0%) |
| 75 Years and over | 0 (0.0%) | 19 (100.0%) |
Technology Access in Lavelle
Computing Device Access in Lavelle
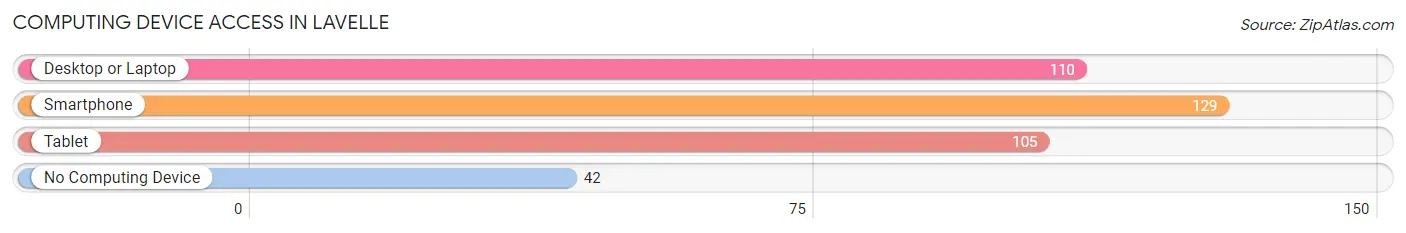
| Device Type | # Households | % Households |
| Desktop or Laptop | 110 | 57.9% |
| Smartphone | 129 | 67.9% |
| Tablet | 105 | 55.3% |
| No Computing Device | 42 | 22.1% |
| Total | 190 | 100.0% |
Internet Access in Lavelle
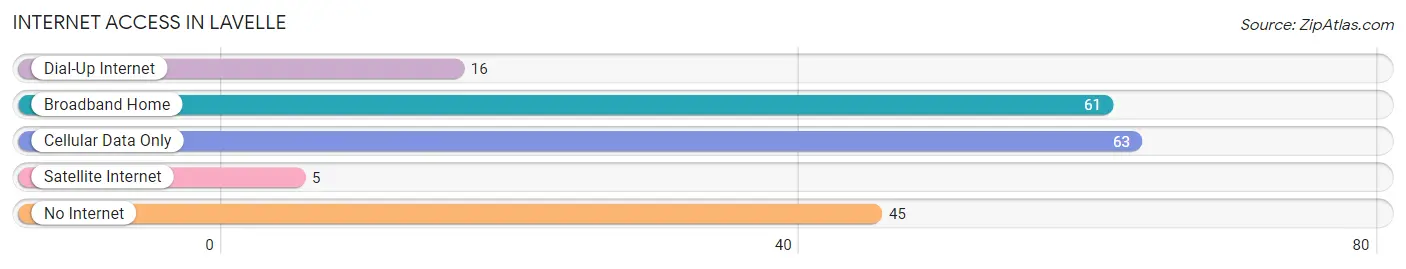
| Internet Type | # Households | % Households |
| Dial-Up Internet | 16 | 8.4% |
| Broadband Home | 61 | 32.1% |
| Cellular Data Only | 63 | 33.2% |
| Satellite Internet | 5 | 2.6% |
| No Internet | 45 | 23.7% |
| Total | 190 | 100.0% |
Lavelle Summary
Lavelle is a small borough located in Schuylkill County, Pennsylvania. It is situated in the southern part of the county, approximately five miles south of the county seat of Pottsville. Lavelle is a rural community with a population of just over 500 people.
History
Lavelle was founded in 1845 by John Lavelle, a coal miner from Ireland. He purchased a tract of land in the area and began to develop it into a small village. The village was originally known as Lavelle’s Settlement, but was later changed to Lavelle. The first post office was established in 1851 and the first school was built in 1854.
In the late 19th century, Lavelle was a thriving coal mining town. The coal industry was the main source of employment for the residents of Lavelle. The town also had several stores, a hotel, a bank, and a newspaper.
In the early 20th century, the coal industry began to decline and many of the residents of Lavelle moved away. The population of the town decreased significantly and the town began to decline.
Geography
Lavelle is located in the southern part of Schuylkill County, approximately five miles south of the county seat of Pottsville. The borough is situated in the Appalachian Mountains and is surrounded by rolling hills and forests. The town is located along the Schuylkill River and is bordered by the towns of Pine Grove, Tremont, and Minersville.
The climate in Lavelle is humid continental, with cold winters and hot, humid summers. The average annual temperature is around 50 degrees Fahrenheit. The average annual precipitation is around 40 inches.
Economy
The economy of Lavelle is largely based on agriculture and tourism. The town is home to several small farms that produce a variety of crops, including corn, soybeans, and hay. The town also has several small businesses, including a grocery store, a hardware store, and a restaurant.
Tourism is an important part of the economy of Lavelle. The town is home to several attractions, including the Lavelle Railroad Museum, the Lavelle Historical Society, and the Lavelle Arts Center. The town also hosts several festivals throughout the year, including the Lavelle Fall Festival and the Lavelle Summer Festival.
Demographics
As of the 2010 census, the population of Lavelle was 514 people. The racial makeup of the town was 97.3% White, 0.6% African American, 0.2% Native American, 0.4% Asian, and 1.5% from other races. The median household income was $37,500 and the median family income was $45,000.
The population of Lavelle is largely made up of people of German, Irish, and Italian descent. The town is also home to a small population of Amish people. The town is served by the Pottsville Area School District.
Lavelle is a small, rural community with a rich history and a strong sense of community. The town is home to a variety of businesses and attractions, and is a popular destination for tourists. The town is also home to a diverse population of people from a variety of backgrounds. Lavelle is a great place to live, work, and visit.
Common Questions
What is Per Capita Income in Lavelle?
Per Capita income in Lavelle is $30,272.
What is the Median Family Income in Lavelle?
Median Family Income in Lavelle is $67,692.
What is the Median Household income in Lavelle?
Median Household Income in Lavelle is $67,692.
What is Income or Wage Gap in Lavelle?
Income or Wage Gap in Lavelle is 48.0%.
Women in Lavelle earn 52.0 cents for every dollar earned by a man.
What is Inequality or Gini Index in Lavelle?
Inequality or Gini Index in Lavelle is 0.29.
What is the Total Population of Lavelle?
Total Population of Lavelle is 388.
What is the Total Male Population of Lavelle?
Total Male Population of Lavelle is 162.
What is the Total Female Population of Lavelle?
Total Female Population of Lavelle is 226.
What is the Ratio of Males per 100 Females in Lavelle?
There are 71.68 Males per 100 Females in Lavelle.
What is the Ratio of Females per 100 Males in Lavelle?
There are 139.51 Females per 100 Males in Lavelle.
What is the Median Population Age in Lavelle?
Median Population Age in Lavelle is 59.6 Years.
What is the Average Family Size in Lavelle
Average Family Size in Lavelle is 2.2 People.
What is the Average Household Size in Lavelle
Average Household Size in Lavelle is 2.0 People.
How Large is the Labor Force in Lavelle?
There are 255 People in the Labor Forcein in Lavelle.
What is the Percentage of People in the Labor Force in Lavelle?
68.7% of People are in the Labor Force in Lavelle.