Pike, NY Map & Demographics
Pike Map
Pike Overview
$27,020
PER CAPITA INCOME
$67,500
AVG FAMILY INCOME
$65,750
AVG HOUSEHOLD INCOME
69.8%
WAGE / INCOME GAP [ % ]
30.2¢/ $1
WAGE / INCOME GAP [ $ ]
0.38
INEQUALITY / GINI INDEX
253
TOTAL POPULATION
141
MALE POPULATION
112
FEMALE POPULATION
125.89
MALES / 100 FEMALES
79.43
FEMALES / 100 MALES
40.7
MEDIAN AGE
3.0
AVG FAMILY SIZE
2.5
AVG HOUSEHOLD SIZE
144
LABOR FORCE [ PEOPLE ]
73.1%
PERCENT IN LABOR FORCE
6.3%
UNEMPLOYMENT RATE
Pike Zip Codes
Pike Area Codes
Income in Pike
Income Overview in Pike
Per Capita Income in Pike is $27,020, while median incomes of families and households are $67,500 and $65,750 respectively.
| Characteristic | Number | Measure |
| Per Capita Income | 253 | $27,020 |
| Median Family Income | 70 | $67,500 |
| Mean Family Income | 70 | $80,250 |
| Median Household Income | 103 | $65,750 |
| Mean Household Income | 103 | $66,855 |
| Income Deficit | 70 | $0 |
| Wage / Income Gap (%) | 253 | 69.81% |
| Wage / Income Gap ($) | 253 | 30.19¢ per $1 |
| Gini / Inequality Index | 253 | 0.38 |
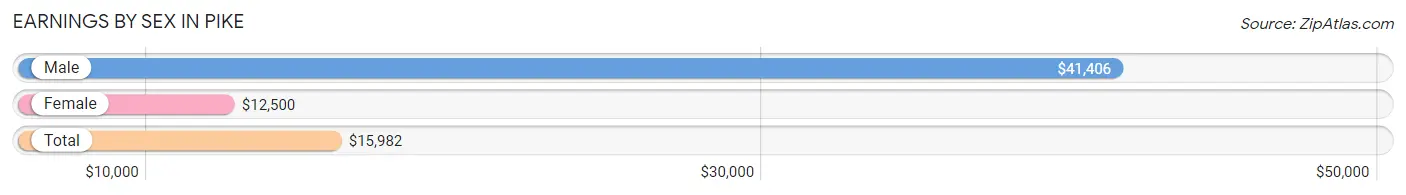
Earnings by Sex in Pike
Average Earnings in Pike are $15,982, $41,406 for men and $12,500 for women, a difference of 69.8%.
| Sex | Number | Average Earnings |
| Male | 69 (43.4%) | $41,406 |
| Female | 90 (56.6%) | $12,500 |
| Total | 159 (100.0%) | $15,982 |
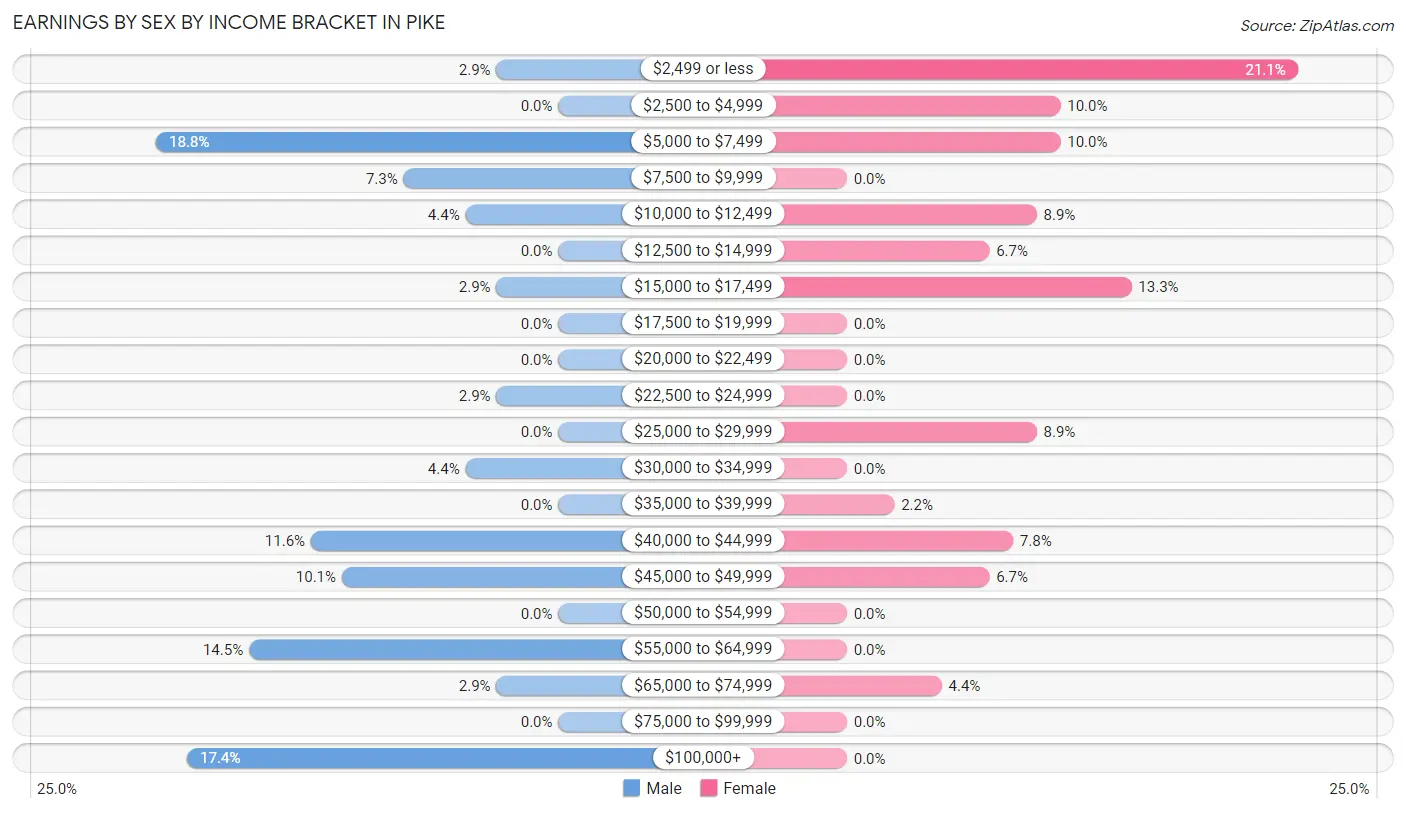
Earnings by Sex by Income Bracket in Pike
The most common earnings brackets in Pike are $5,000 to $7,499 for men (13 | 18.8%) and $2,499 or less for women (19 | 21.1%).
| Income | Male | Female |
| $2,499 or less | 2 (2.9%) | 19 (21.1%) |
| $2,500 to $4,999 | 0 (0.0%) | 9 (10.0%) |
| $5,000 to $7,499 | 13 (18.8%) | 9 (10.0%) |
| $7,500 to $9,999 | 5 (7.2%) | 0 (0.0%) |
| $10,000 to $12,499 | 3 (4.3%) | 8 (8.9%) |
| $12,500 to $14,999 | 0 (0.0%) | 6 (6.7%) |
| $15,000 to $17,499 | 2 (2.9%) | 12 (13.3%) |
| $17,500 to $19,999 | 0 (0.0%) | 0 (0.0%) |
| $20,000 to $22,499 | 0 (0.0%) | 0 (0.0%) |
| $22,500 to $24,999 | 2 (2.9%) | 0 (0.0%) |
| $25,000 to $29,999 | 0 (0.0%) | 8 (8.9%) |
| $30,000 to $34,999 | 3 (4.3%) | 0 (0.0%) |
| $35,000 to $39,999 | 0 (0.0%) | 2 (2.2%) |
| $40,000 to $44,999 | 8 (11.6%) | 7 (7.8%) |
| $45,000 to $49,999 | 7 (10.1%) | 6 (6.7%) |
| $50,000 to $54,999 | 0 (0.0%) | 0 (0.0%) |
| $55,000 to $64,999 | 10 (14.5%) | 0 (0.0%) |
| $65,000 to $74,999 | 2 (2.9%) | 4 (4.4%) |
| $75,000 to $99,999 | 0 (0.0%) | 0 (0.0%) |
| $100,000+ | 12 (17.4%) | 0 (0.0%) |
| Total | 69 (100.0%) | 90 (100.0%) |
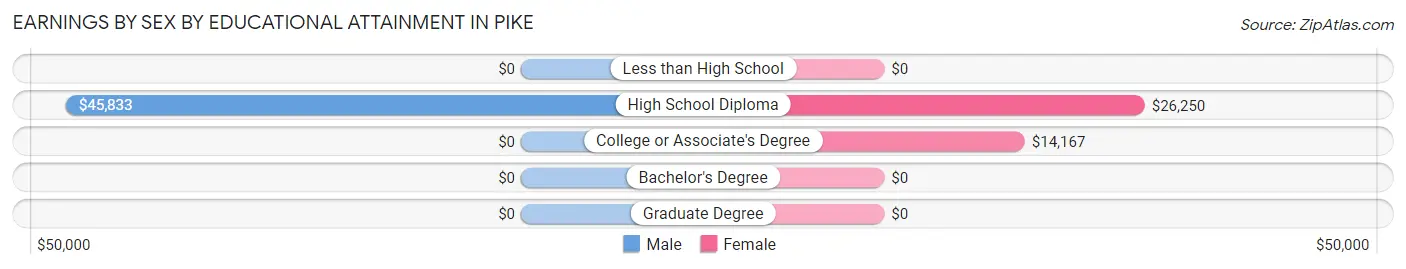
Earnings by Sex by Educational Attainment in Pike
Average earnings in Pike are $42,031 for men and $15,417 for women, a difference of 63.3%. Men with an educational attainment of high school diploma enjoy the highest average annual earnings of $45,833, while those with high school diploma education earn the least with $45,833. Women with an educational attainment of high school diploma earn the most with the average annual earnings of $26,250, while those with college or associate's degree education have the smallest earnings of $14,167.
| Educational Attainment | Male Income | Female Income |
| Less than High School | - | - |
| High School Diploma | $45,833 | $26,250 |
| College or Associate's Degree | - | - |
| Bachelor's Degree | - | - |
| Graduate Degree | - | - |
| Total | $42,031 | $15,417 |
Family Income in Pike
Family Income Brackets in Pike
According to the Pike family income data, there are 24 families falling into the $50,000 to $74,999 income range, which is the most common income bracket and makes up 34.3% of all families.
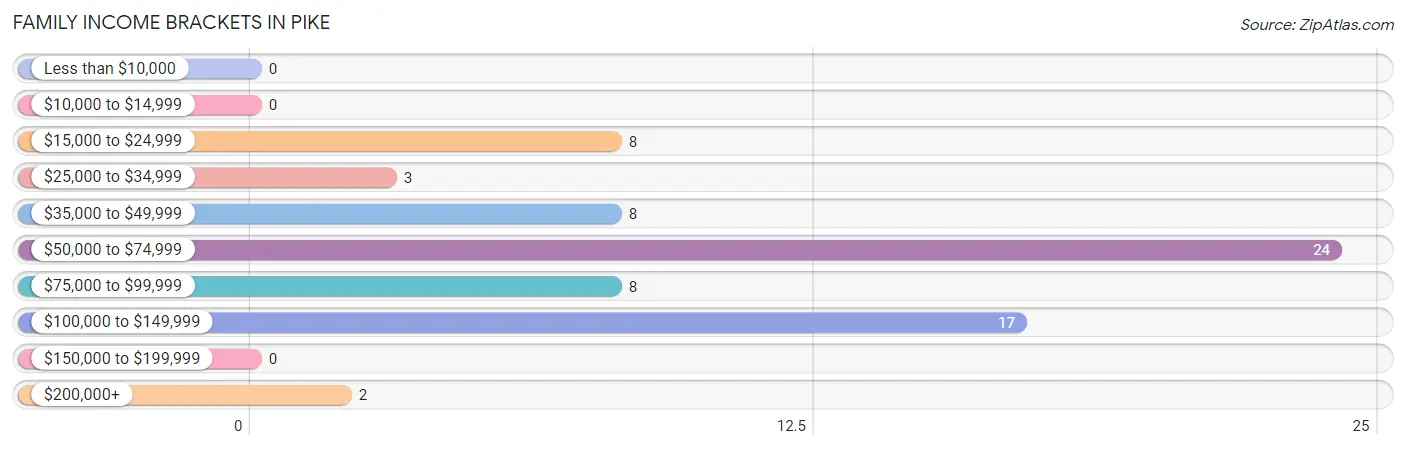
| Income Bracket | # Families | % Families |
| Less than $10,000 | 0 | 0.0% |
| $10,000 to $14,999 | 0 | 0.0% |
| $15,000 to $24,999 | 8 | 11.4% |
| $25,000 to $34,999 | 3 | 4.3% |
| $35,000 to $49,999 | 8 | 11.4% |
| $50,000 to $74,999 | 24 | 34.3% |
| $75,000 to $99,999 | 8 | 11.4% |
| $100,000 to $149,999 | 17 | 24.3% |
| $150,000 to $199,999 | 0 | 0.0% |
| $200,000+ | 2 | 2.9% |
Family Income by Famaliy Size in Pike
3-person families (24 | 34.3%) account for the highest median family income in Pike with $142,917 per family, while 3-person families (24 | 34.3%) have the highest median income of $47,639 per family member.
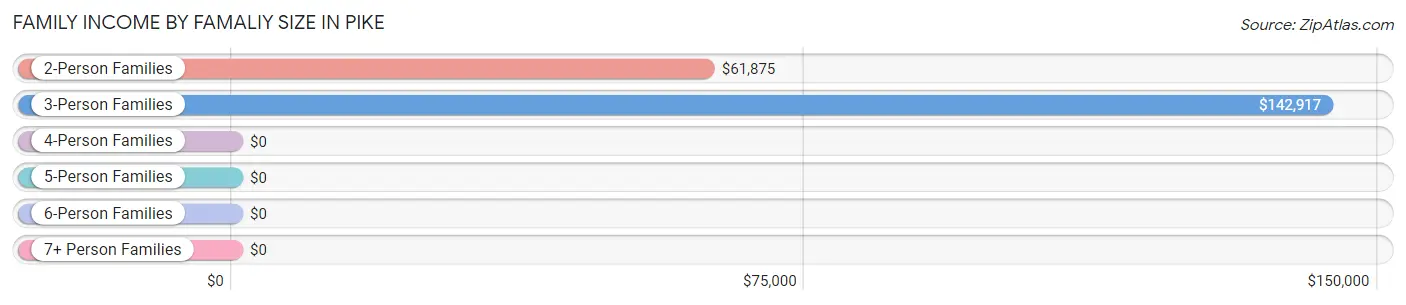
| Income Bracket | # Families | Median Income |
| 2-Person Families | 23 (32.9%) | $61,875 |
| 3-Person Families | 24 (34.3%) | $142,917 |
| 4-Person Families | 14 (20.0%) | $0 |
| 5-Person Families | 9 (12.9%) | $0 |
| 6-Person Families | 0 (0.0%) | $0 |
| 7+ Person Families | 0 (0.0%) | $0 |
| Total | 70 (100.0%) | $67,500 |
Family Income by Number of Earners in Pike
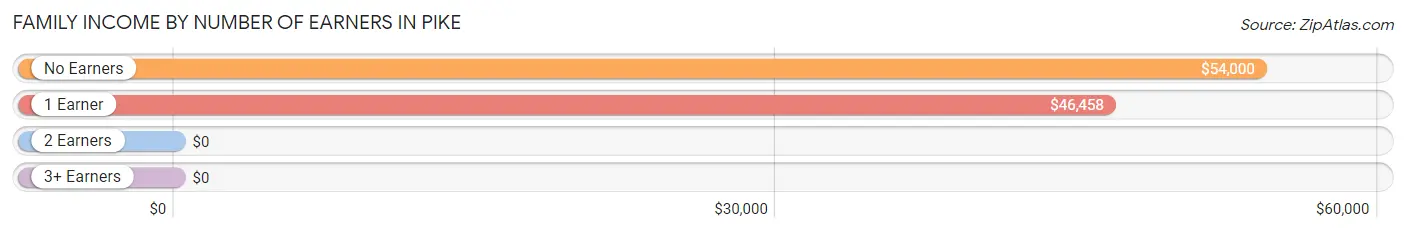
| Number of Earners | # Families | Median Income |
| No Earners | 10 (14.3%) | $54,000 |
| 1 Earner | 25 (35.7%) | $46,458 |
| 2 Earners | 4 (5.7%) | $0 |
| 3+ Earners | 31 (44.3%) | $0 |
| Total | 70 (100.0%) | $67,500 |
Household Income in Pike
Household Income Brackets in Pike
With 30 households falling in the category, the $50,000 to $74,999 income range is the most frequent in Pike, accounting for 29.1% of all households.
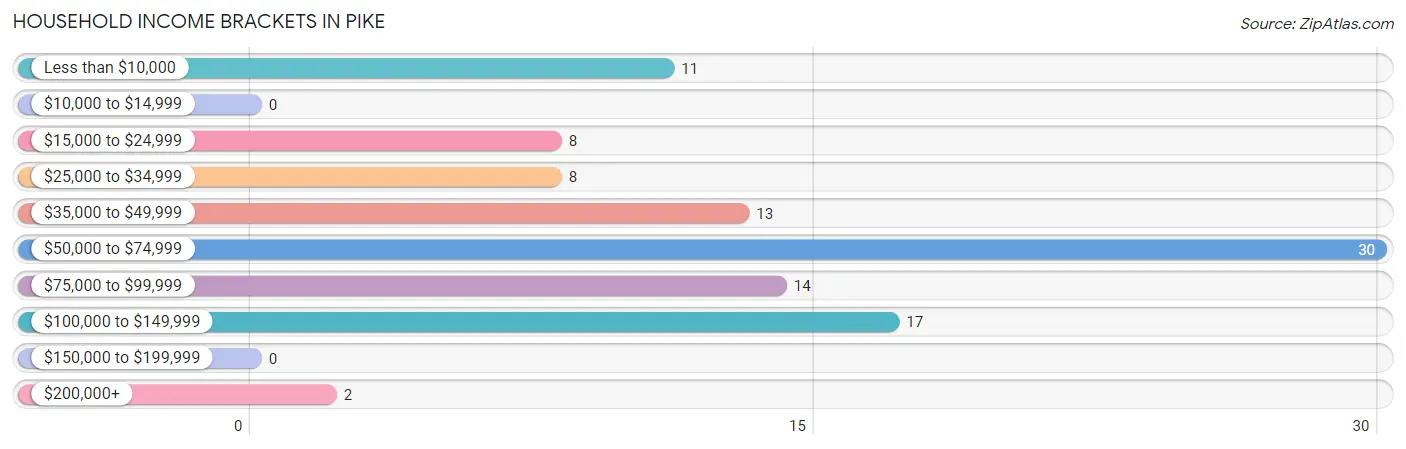
| Income Bracket | # Households | % Households |
| Less than $10,000 | 11 | 10.7% |
| $10,000 to $14,999 | 0 | 0.0% |
| $15,000 to $24,999 | 8 | 7.8% |
| $25,000 to $34,999 | 8 | 7.8% |
| $35,000 to $49,999 | 13 | 12.6% |
| $50,000 to $74,999 | 30 | 29.1% |
| $75,000 to $99,999 | 14 | 13.6% |
| $100,000 to $149,999 | 17 | 16.5% |
| $150,000 to $199,999 | 0 | 0.0% |
| $200,000+ | 2 | 1.9% |
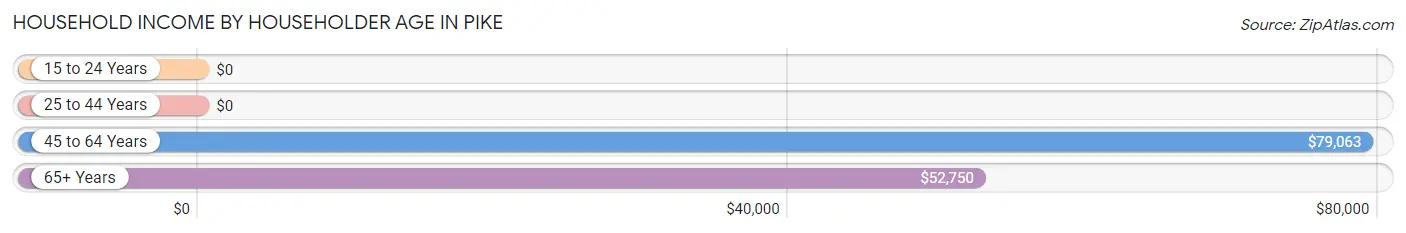
Household Income by Householder Age in Pike
The median household income in Pike is $65,750, with the highest median household income of $79,063 found in the 45 to 64 years age bracket for the primary householder. A total of 34 households (33.0%) fall into this category.
| Income Bracket | # Households | Median Income |
| 15 to 24 Years | 0 (0.0%) | $0 |
| 25 to 44 Years | 32 (31.1%) | $0 |
| 45 to 64 Years | 34 (33.0%) | $79,063 |
| 65+ Years | 37 (35.9%) | $52,750 |
| Total | 103 (100.0%) | $65,750 |
Poverty in Pike
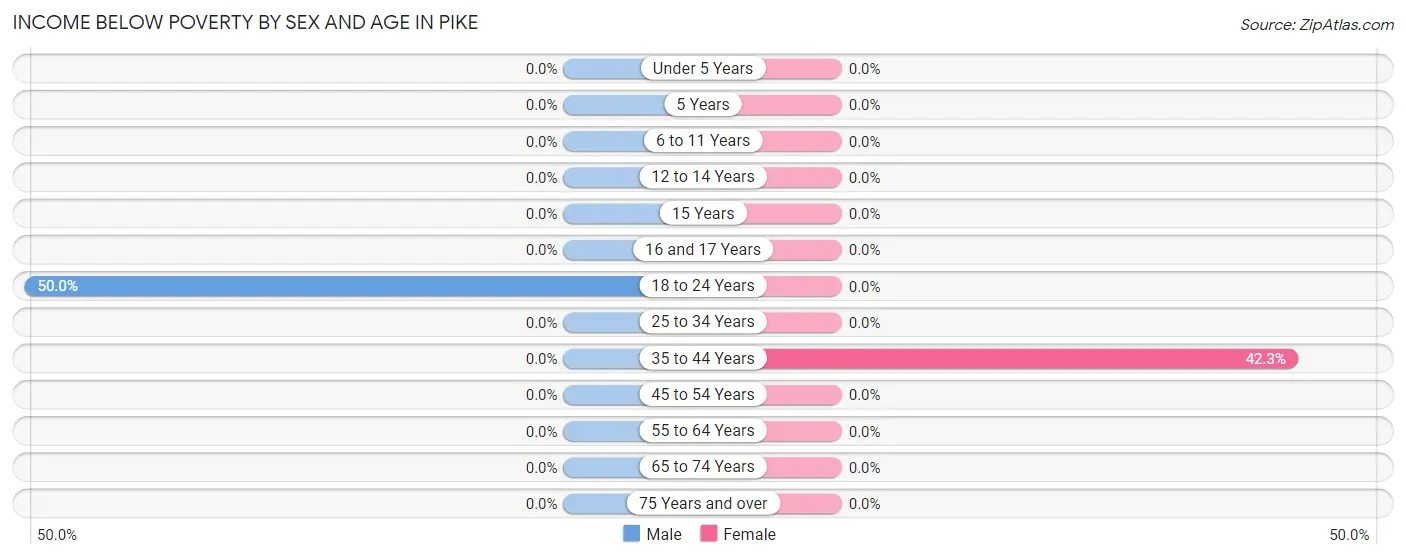
Income Below Poverty by Sex and Age in Pike
With 1.5% poverty level for males and 9.8% for females among the residents of Pike, 18 to 24 year old males and 35 to 44 year old females are the most vulnerable to poverty, with 2 males (50.0%) and 11 females (42.3%) in their respective age groups living below the poverty level.
| Age Bracket | Male | Female |
| Under 5 Years | 0 (0.0%) | 0 (0.0%) |
| 5 Years | 0 (0.0%) | 0 (0.0%) |
| 6 to 11 Years | 0 (0.0%) | 0 (0.0%) |
| 12 to 14 Years | 0 (0.0%) | 0 (0.0%) |
| 15 Years | 0 (0.0%) | 0 (0.0%) |
| 16 and 17 Years | 0 (0.0%) | 0 (0.0%) |
| 18 to 24 Years | 2 (50.0%) | 0 (0.0%) |
| 25 to 34 Years | 0 (0.0%) | 0 (0.0%) |
| 35 to 44 Years | 0 (0.0%) | 11 (42.3%) |
| 45 to 54 Years | 0 (0.0%) | 0 (0.0%) |
| 55 to 64 Years | 0 (0.0%) | 0 (0.0%) |
| 65 to 74 Years | 0 (0.0%) | 0 (0.0%) |
| 75 Years and over | 0 (0.0%) | 0 (0.0%) |
| Total | 2 (1.5%) | 11 (9.8%) |
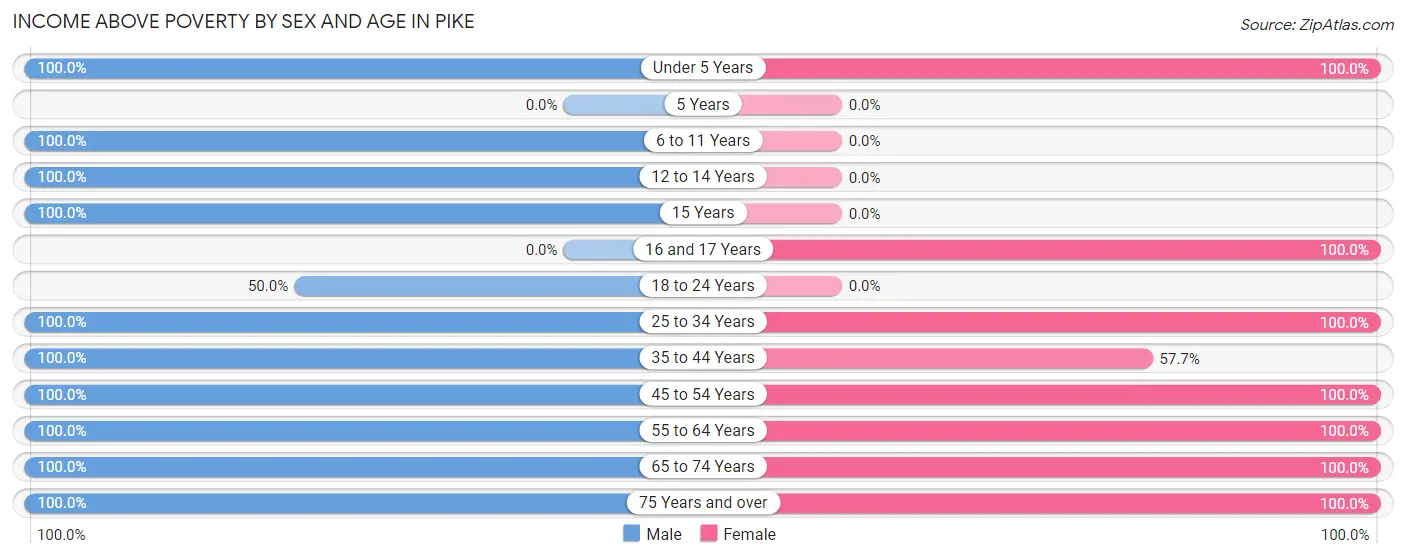
Income Above Poverty by Sex and Age in Pike
According to the poverty statistics in Pike, males aged under 5 years and females aged under 5 years are the age groups that are most secure financially, with 100.0% of males and 100.0% of females in these age groups living above the poverty line.
| Age Bracket | Male | Female |
| Under 5 Years | 8 (100.0%) | 4 (100.0%) |
| 5 Years | 0 (0.0%) | 0 (0.0%) |
| 6 to 11 Years | 4 (100.0%) | 0 (0.0%) |
| 12 to 14 Years | 29 (100.0%) | 0 (0.0%) |
| 15 Years | 4 (100.0%) | 0 (0.0%) |
| 16 and 17 Years | 0 (0.0%) | 16 (100.0%) |
| 18 to 24 Years | 2 (50.0%) | 0 (0.0%) |
| 25 to 34 Years | 6 (100.0%) | 18 (100.0%) |
| 35 to 44 Years | 12 (100.0%) | 15 (57.7%) |
| 45 to 54 Years | 12 (100.0%) | 24 (100.0%) |
| 55 to 64 Years | 16 (100.0%) | 9 (100.0%) |
| 65 to 74 Years | 18 (100.0%) | 5 (100.0%) |
| 75 Years and over | 21 (100.0%) | 10 (100.0%) |
| Total | 132 (98.5%) | 101 (90.2%) |
Income Below Poverty Among Married-Couple Families in Pike
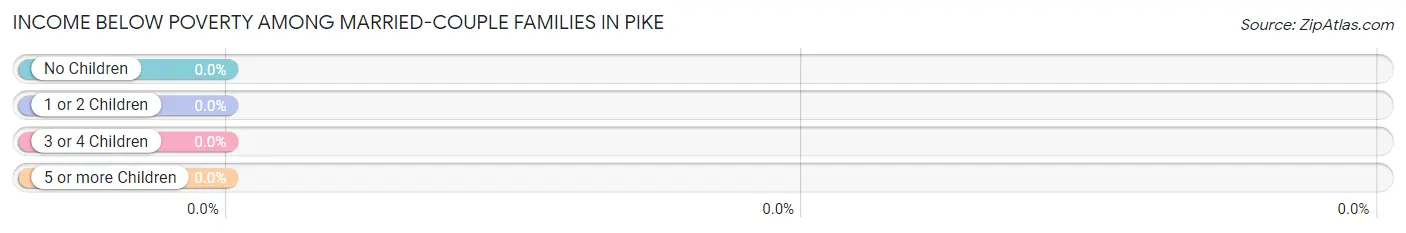
| Children | Above Poverty | Below Poverty |
| No Children | 33 (100.0%) | 0 (0.0%) |
| 1 or 2 Children | 10 (100.0%) | 0 (0.0%) |
| 3 or 4 Children | 9 (100.0%) | 0 (0.0%) |
| 5 or more Children | 0 (0.0%) | 0 (0.0%) |
| Total | 52 (100.0%) | 0 (0.0%) |
Income Below Poverty Among Single-Parent Households in Pike
| Children | Single Father | Single Mother |
| No Children | 0 (0.0%) | 0 (0.0%) |
| 1 or 2 Children | 0 (0.0%) | 0 (0.0%) |
| 3 or 4 Children | 0 (0.0%) | 0 (0.0%) |
| 5 or more Children | 0 (0.0%) | 0 (0.0%) |
| Total | 0 (0.0%) | 0 (0.0%) |
Income Below Poverty Among Married-Couple vs Single-Parent Households in Pike
| Children | Married-Couple Families | Single-Parent Households |
| No Children | 0 (0.0%) | 0 (0.0%) |
| 1 or 2 Children | 0 (0.0%) | 0 (0.0%) |
| 3 or 4 Children | 0 (0.0%) | 0 (0.0%) |
| 5 or more Children | 0 (0.0%) | 0 (0.0%) |
| Total | 0 (0.0%) | 0 (0.0%) |
Race in Pike
The most populous races in Pike are White / Caucasian (246 | 97.2%), and Black / African American (7 | 2.8%).
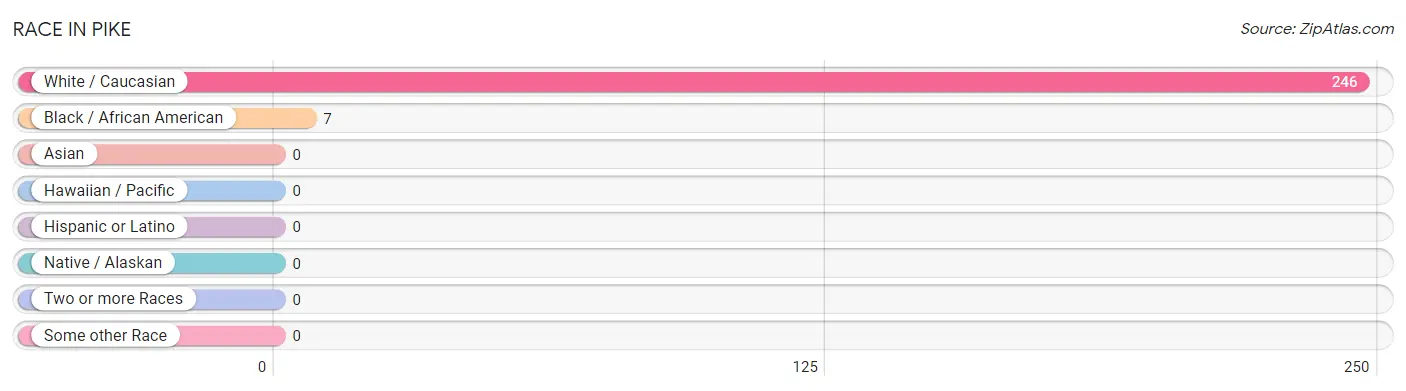
| Race | # Population | % Population |
| Asian | 0 | 0.0% |
| Black / African American | 7 | 2.8% |
| Hawaiian / Pacific | 0 | 0.0% |
| Hispanic or Latino | 0 | 0.0% |
| Native / Alaskan | 0 | 0.0% |
| White / Caucasian | 246 | 97.2% |
| Two or more Races | 0 | 0.0% |
| Some other Race | 0 | 0.0% |
| Total | 253 | 100.0% |
Ancestry in Pike
The most populous ancestries reported in Pike are Irish (56 | 22.1%), German (46 | 18.2%), English (28 | 11.1%), American (26 | 10.3%), and Ukrainian (6 | 2.4%), together accounting for 64.0% of all Pike residents.
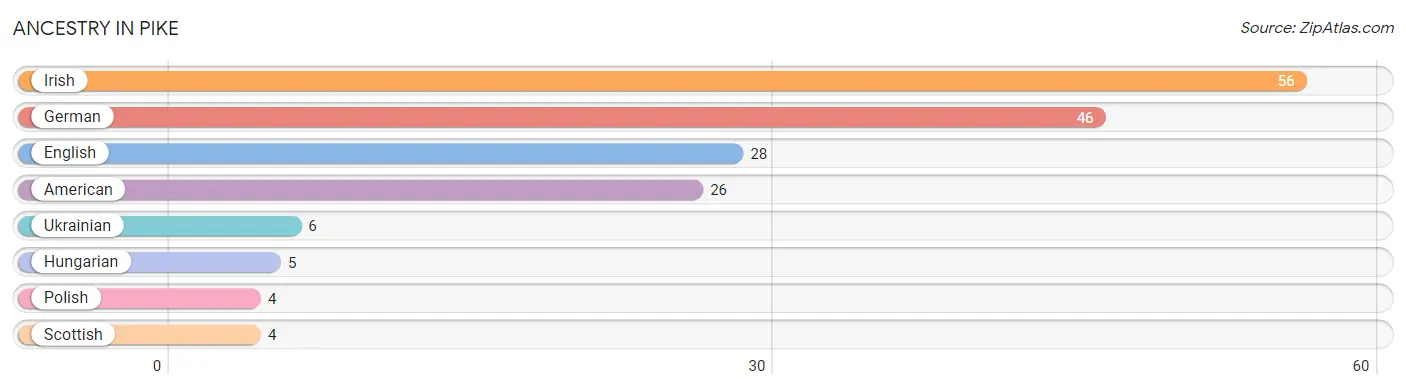
| Ancestry | # Population | % Population |
| American | 26 | 10.3% |
| English | 28 | 11.1% |
| German | 46 | 18.2% |
| Hungarian | 5 | 2.0% |
| Irish | 56 | 22.1% |
| Polish | 4 | 1.6% |
| Scottish | 4 | 1.6% |
| Ukrainian | 6 | 2.4% | View All 8 Rows |
Immigrants in Pike

| Immigration Origin | # Population | % Population | View All 0 Rows |
Sex and Age in Pike
Sex and Age in Pike
The most populous age groups in Pike are 10 to 14 Years (36 | 25.5%) for men and 40 to 44 Years (17 | 15.2%) for women.
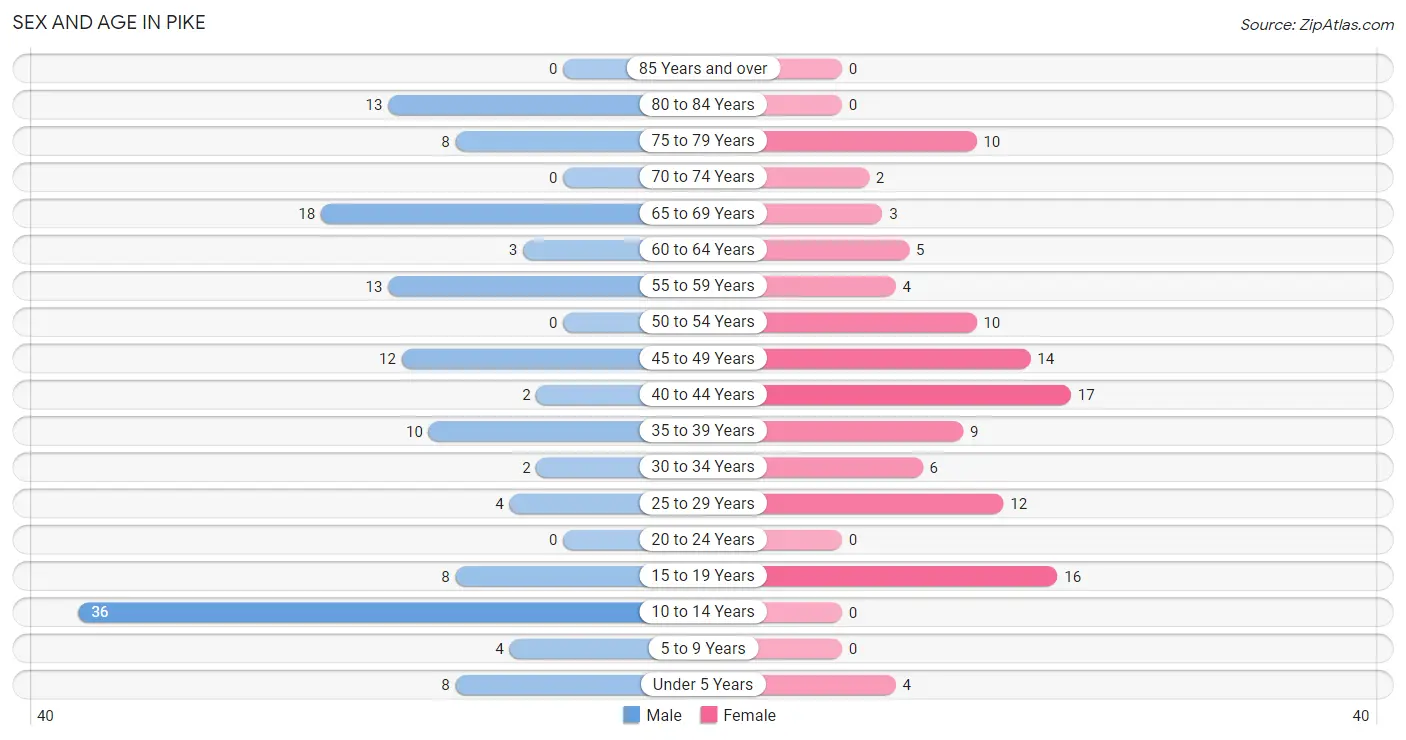
| Age Bracket | Male | Female |
| Under 5 Years | 8 (5.7%) | 4 (3.6%) |
| 5 to 9 Years | 4 (2.8%) | 0 (0.0%) |
| 10 to 14 Years | 36 (25.5%) | 0 (0.0%) |
| 15 to 19 Years | 8 (5.7%) | 16 (14.3%) |
| 20 to 24 Years | 0 (0.0%) | 0 (0.0%) |
| 25 to 29 Years | 4 (2.8%) | 12 (10.7%) |
| 30 to 34 Years | 2 (1.4%) | 6 (5.4%) |
| 35 to 39 Years | 10 (7.1%) | 9 (8.0%) |
| 40 to 44 Years | 2 (1.4%) | 17 (15.2%) |
| 45 to 49 Years | 12 (8.5%) | 14 (12.5%) |
| 50 to 54 Years | 0 (0.0%) | 10 (8.9%) |
| 55 to 59 Years | 13 (9.2%) | 4 (3.6%) |
| 60 to 64 Years | 3 (2.1%) | 5 (4.5%) |
| 65 to 69 Years | 18 (12.8%) | 3 (2.7%) |
| 70 to 74 Years | 0 (0.0%) | 2 (1.8%) |
| 75 to 79 Years | 8 (5.7%) | 10 (8.9%) |
| 80 to 84 Years | 13 (9.2%) | 0 (0.0%) |
| 85 Years and over | 0 (0.0%) | 0 (0.0%) |
| Total | 141 (100.0%) | 112 (100.0%) |
Families and Households in Pike
Median Family Size in Pike
The median family size in Pike is 2.96 persons per family, with married-couple families (52 | 74.3%) accounting for the largest median family size of 3.17 persons per family. On the other hand, single male/father families (3 | 4.3%) represent the smallest median family size with 2.00 persons per family.
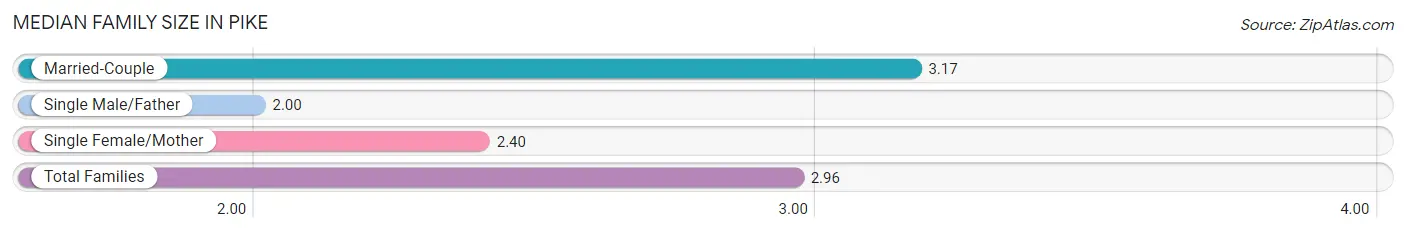
| Family Type | # Families | Family Size |
| Married-Couple | 52 (74.3%) | 3.17 |
| Single Male/Father | 3 (4.3%) | 2.00 |
| Single Female/Mother | 15 (21.4%) | 2.40 |
| Total Families | 70 (100.0%) | 2.96 |
Median Household Size in Pike
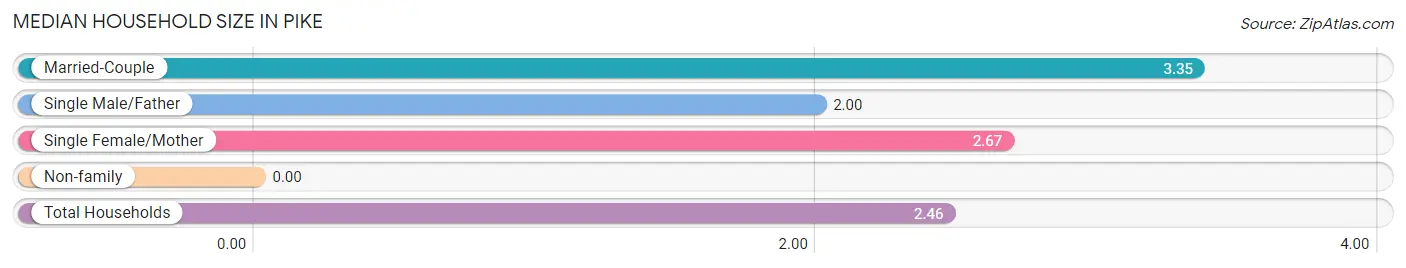
| Household Type | # Households | Household Size |
| Married-Couple | 52 (50.5%) | 3.35 |
| Single Male/Father | 3 (2.9%) | 2.00 |
| Single Female/Mother | 15 (14.6%) | 2.67 |
| Non-family | 33 (32.0%) | - |
| Total Households | 103 (100.0%) | 2.46 |
Household Size by Marriage Status in Pike
Out of a total of 103 households in Pike, 70 (68.0%) are family households, while 33 (32.0%) are nonfamily households. The most numerous type of family households are 2-person households, comprising 23, and the most common type of nonfamily households are 1-person households, comprising 33.
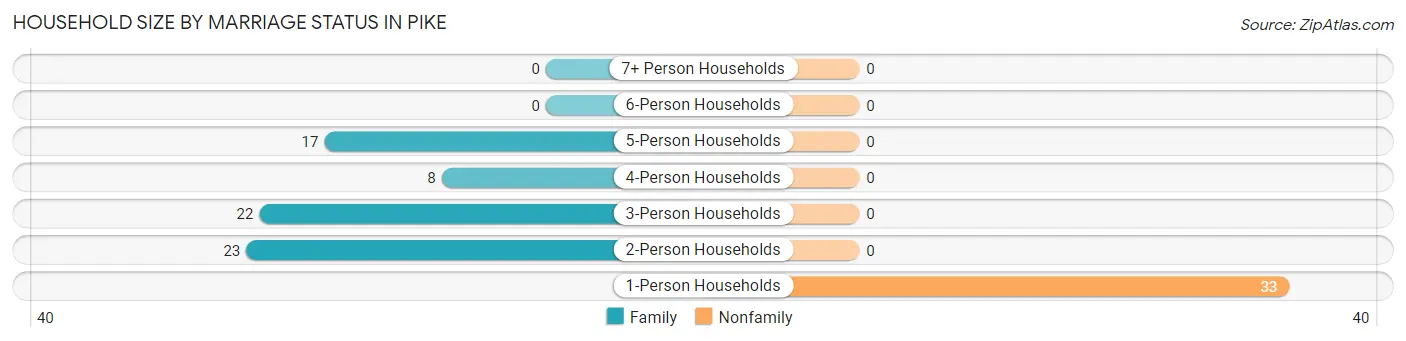
| Household Size | Family Households | Nonfamily Households |
| 1-Person Households | - | 33 (32.0%) |
| 2-Person Households | 23 (22.3%) | 0 (0.0%) |
| 3-Person Households | 22 (21.4%) | 0 (0.0%) |
| 4-Person Households | 8 (7.8%) | 0 (0.0%) |
| 5-Person Households | 17 (16.5%) | 0 (0.0%) |
| 6-Person Households | 0 (0.0%) | 0 (0.0%) |
| 7+ Person Households | 0 (0.0%) | 0 (0.0%) |
| Total | 70 (68.0%) | 33 (32.0%) |
Female Fertility in Pike
Fertility by Age in Pike
| Age Bracket | Women with Births | Births / 1,000 Women |
| 15 to 19 years | 0 (0.0%) | 0.0 |
| 20 to 34 years | 0 (0.0%) | 0.0 |
| 35 to 50 years | 0 (0.0%) | 0.0 |
| Total | 0 (0.0%) | 0.0 |
Fertility by Age by Marriage Status in Pike
| Age Bracket | Married | Unmarried |
| 15 to 19 years | 0 (0.0%) | 0 (0.0%) |
| 20 to 34 years | 0 (0.0%) | 0 (0.0%) |
| 35 to 50 years | 0 (0.0%) | 0 (0.0%) |
| Total | 0 (0.0%) | 0 (0.0%) |
Fertility by Education in Pike
| Educational Attainment | Women with Births | Births / 1,000 Women |
| Less than High School | 0 (0.0%) | 0.0 |
| High School Diploma | 0 (0.0%) | 0.0 |
| College or Associate's Degree | 0 (0.0%) | 0.0 |
| Bachelor's Degree | 0 (0.0%) | 0.0 |
| Graduate Degree | 0 (0.0%) | 0.0 |
| Total | 0 (0.0%) | 0.0 |
Fertility by Education by Marriage Status in Pike
| Educational Attainment | Married | Unmarried |
| Less than High School | 0 (0.0%) | 0 (0.0%) |
| High School Diploma | 0 (0.0%) | 0 (0.0%) |
| College or Associate's Degree | 0 (0.0%) | 0 (0.0%) |
| Bachelor's Degree | 0 (0.0%) | 0 (0.0%) |
| Graduate Degree | 0 (0.0%) | 0 (0.0%) |
| Total | 0 (0.0%) | 0 (0.0%) |
Employment Characteristics in Pike
Employment by Class of Employer in Pike
Among the 135 employed individuals in Pike, private company employees (77 | 57.0%), local government employees (26 | 19.3%), and self-employed (not incorporated) (11 | 8.2%) make up the most common classes of employment.
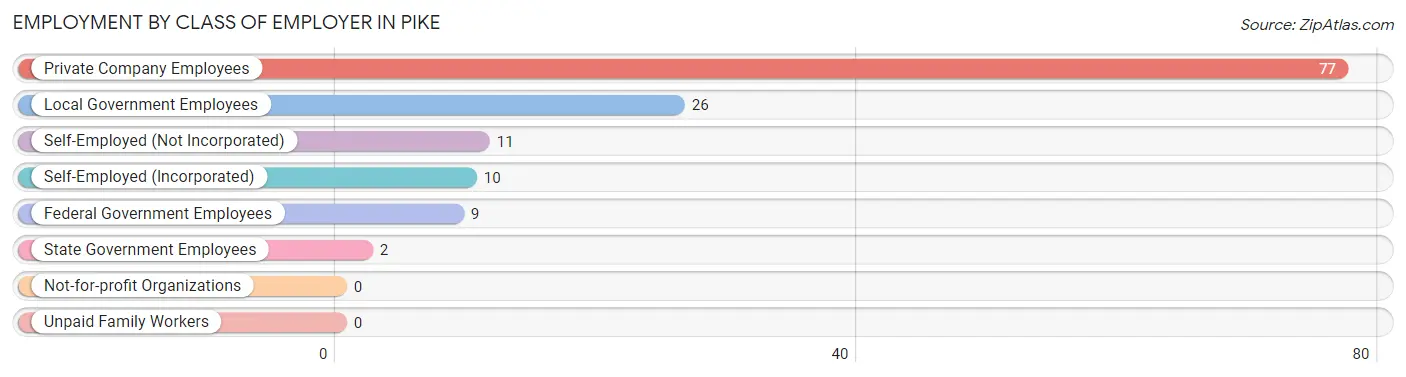
| Employer Class | # Employees | % Employees |
| Private Company Employees | 77 | 57.0% |
| Self-Employed (Incorporated) | 10 | 7.4% |
| Self-Employed (Not Incorporated) | 11 | 8.2% |
| Not-for-profit Organizations | 0 | 0.0% |
| Local Government Employees | 26 | 19.3% |
| State Government Employees | 2 | 1.5% |
| Federal Government Employees | 9 | 6.7% |
| Unpaid Family Workers | 0 | 0.0% |
| Total | 135 | 100.0% |
Employment Status by Age in Pike
According to the labor force statistics for Pike, out of the total population over 16 years of age (197), 73.1% or 144 individuals are in the labor force, with 6.3% or 9 of them unemployed. The age group with the highest labor force participation rate is 25 to 29 years, with 100.0% or 16 individuals in the labor force. Within the labor force, the 45 to 54 years age range has the highest percentage of unemployed individuals, with 27.3% or 9 of them being unemployed.
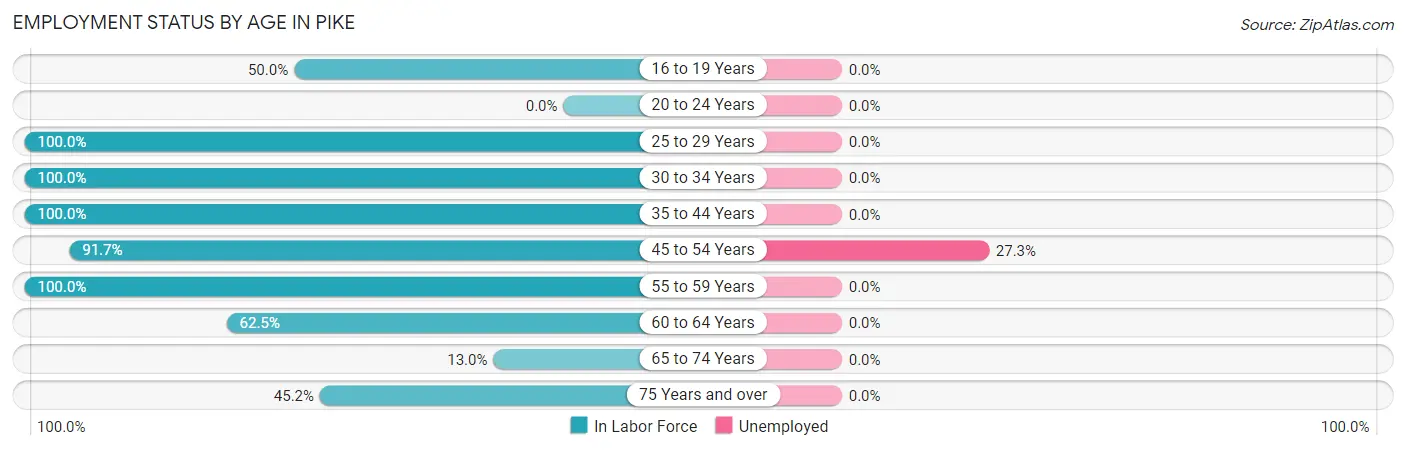
| Age Bracket | In Labor Force | Unemployed |
| 16 to 19 Years | 10 (50.0%) | 0 (0.0%) |
| 20 to 24 Years | 0 (0.0%) | 0 (0.0%) |
| 25 to 29 Years | 16 (100.0%) | 0 (0.0%) |
| 30 to 34 Years | 8 (100.0%) | 0 (0.0%) |
| 35 to 44 Years | 38 (100.0%) | 0 (0.0%) |
| 45 to 54 Years | 33 (91.7%) | 9 (27.3%) |
| 55 to 59 Years | 17 (100.0%) | 0 (0.0%) |
| 60 to 64 Years | 5 (62.5%) | 0 (0.0%) |
| 65 to 74 Years | 3 (13.0%) | 0 (0.0%) |
| 75 Years and over | 14 (45.2%) | 0 (0.0%) |
| Total | 144 (73.1%) | 9 (6.3%) |
Employment Status by Educational Attainment in Pike
According to labor force statistics for Pike, 95.1% of individuals (117) out of the total population between 25 and 64 years of age (123) are in the labor force, with 7.7% or 9 of them being unemployed. The group with the highest labor force participation rate are those with the educational attainment of college / associate degree, with 100.0% or 56 individuals in the labor force. Within the labor force, individuals with college / associate degree education have the highest percentage of unemployment, with 16.1% or 9 of them being unemployed.
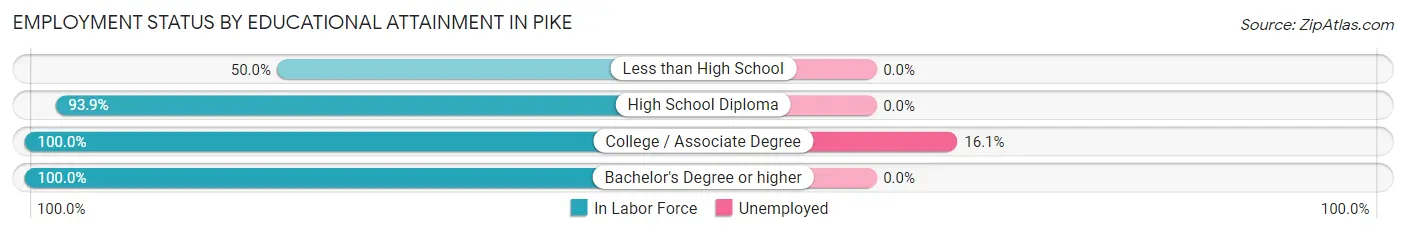
| Educational Attainment | In Labor Force | Unemployed |
| Less than High School | 3 (50.0%) | 0 (0.0%) |
| High School Diploma | 46 (93.9%) | 0 (0.0%) |
| College / Associate Degree | 56 (100.0%) | 9 (16.1%) |
| Bachelor's Degree or higher | 12 (100.0%) | 0 (0.0%) |
| Total | 117 (95.1%) | 9 (7.7%) |
Employment Occupations by Sex in Pike
Management, Business, Science and Arts Occupations
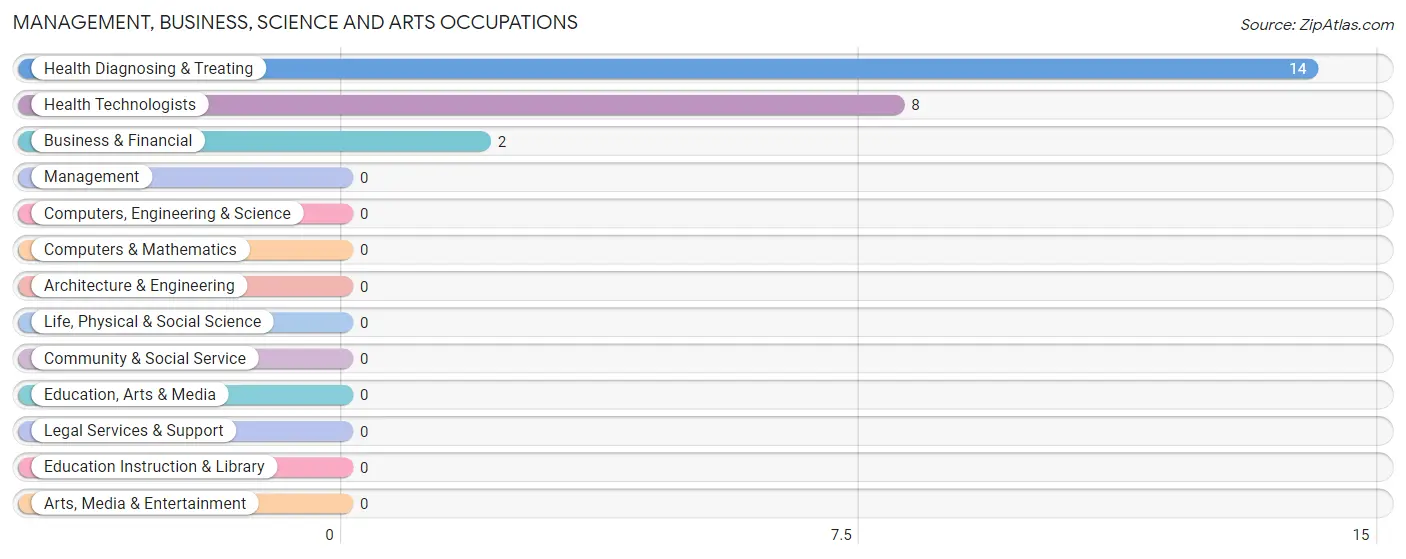
The most common Management, Business, Science and Arts occupations in Pike are Health Diagnosing & Treating (14 | 10.4%), Health Technologists (8 | 5.9%), and Business & Financial (2 | 1.5%).
Management, Business, Science and Arts Occupations by Sex
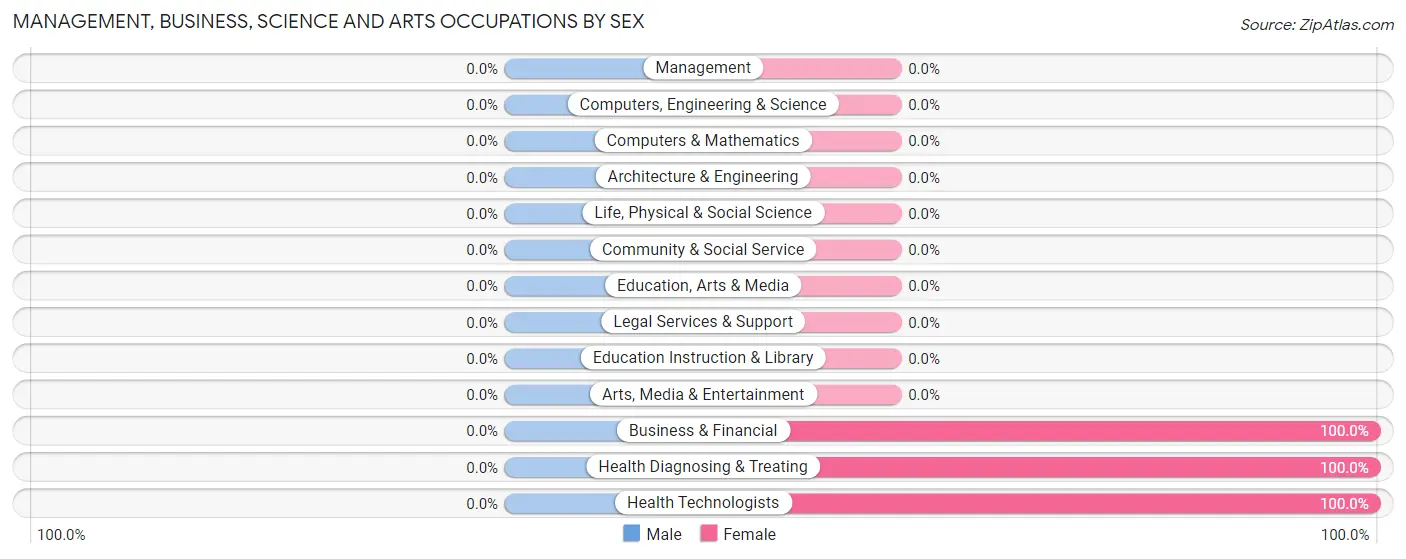
| Occupation | Male | Female |
| Management | 0 (0.0%) | 0 (0.0%) |
| Business & Financial | 0 (0.0%) | 2 (100.0%) |
| Computers, Engineering & Science | 0 (0.0%) | 0 (0.0%) |
| Computers & Mathematics | 0 (0.0%) | 0 (0.0%) |
| Architecture & Engineering | 0 (0.0%) | 0 (0.0%) |
| Life, Physical & Social Science | 0 (0.0%) | 0 (0.0%) |
| Community & Social Service | 0 (0.0%) | 0 (0.0%) |
| Education, Arts & Media | 0 (0.0%) | 0 (0.0%) |
| Legal Services & Support | 0 (0.0%) | 0 (0.0%) |
| Education Instruction & Library | 0 (0.0%) | 0 (0.0%) |
| Arts, Media & Entertainment | 0 (0.0%) | 0 (0.0%) |
| Health Diagnosing & Treating | 0 (0.0%) | 14 (100.0%) |
| Health Technologists | 0 (0.0%) | 8 (100.0%) |
| Total (Category) | 0 (0.0%) | 16 (100.0%) |
| Total (Overall) | 62 (45.9%) | 73 (54.1%) |
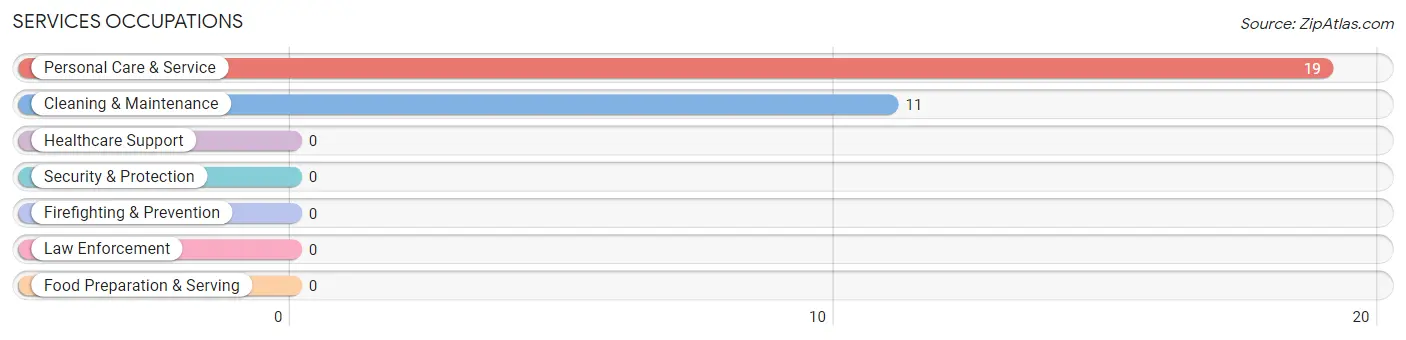
Services Occupations
The most common Services occupations in Pike are Personal Care & Service (19 | 14.1%), and Cleaning & Maintenance (11 | 8.2%).
Services Occupations by Sex
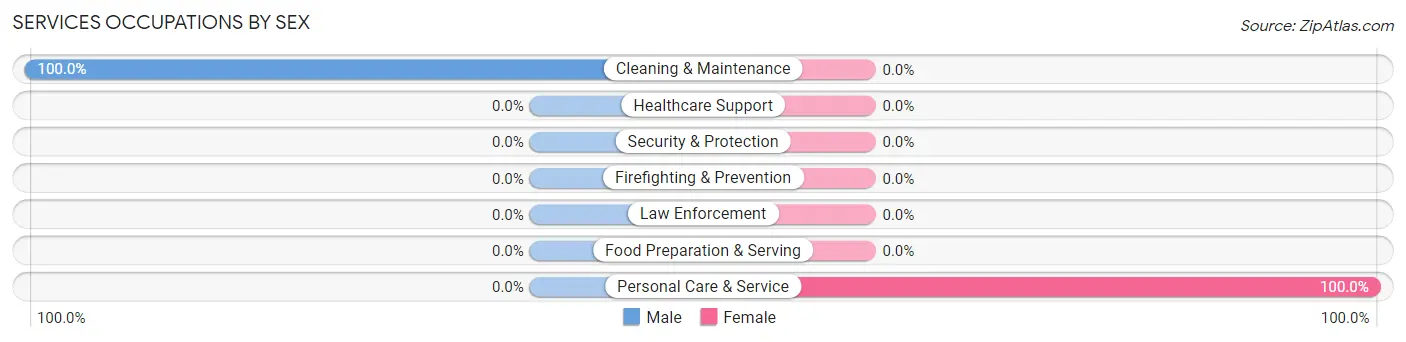
| Occupation | Male | Female |
| Healthcare Support | 0 (0.0%) | 0 (0.0%) |
| Security & Protection | 0 (0.0%) | 0 (0.0%) |
| Firefighting & Prevention | 0 (0.0%) | 0 (0.0%) |
| Law Enforcement | 0 (0.0%) | 0 (0.0%) |
| Food Preparation & Serving | 0 (0.0%) | 0 (0.0%) |
| Cleaning & Maintenance | 11 (100.0%) | 0 (0.0%) |
| Personal Care & Service | 0 (0.0%) | 19 (100.0%) |
| Total (Category) | 11 (36.7%) | 19 (63.3%) |
| Total (Overall) | 62 (45.9%) | 73 (54.1%) |
Sales and Office Occupations
The most common Sales and Office occupations in Pike are Office & Administration (29 | 21.5%), and Sales & Related (10 | 7.4%).
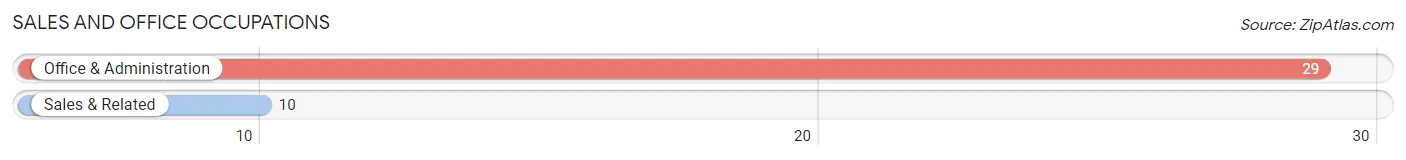
Sales and Office Occupations by Sex

| Occupation | Male | Female |
| Sales & Related | 2 (20.0%) | 8 (80.0%) |
| Office & Administration | 4 (13.8%) | 25 (86.2%) |
| Total (Category) | 6 (15.4%) | 33 (84.6%) |
| Total (Overall) | 62 (45.9%) | 73 (54.1%) |
Natural Resources, Construction and Maintenance Occupations
The most common Natural Resources, Construction and Maintenance occupations in Pike are Installation, Maintenance & Repair (7 | 5.2%), and Construction & Extraction (3 | 2.2%).

Natural Resources, Construction and Maintenance Occupations by Sex
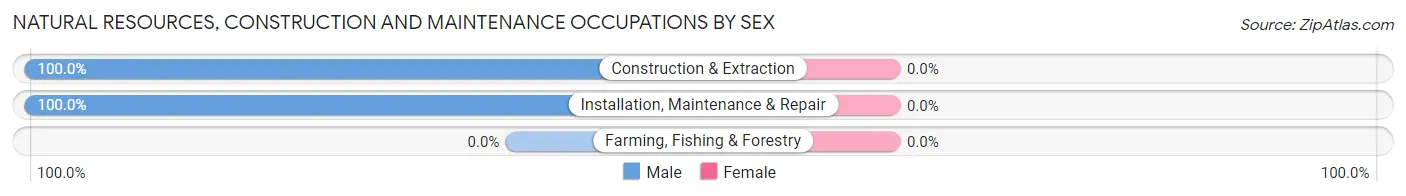
| Occupation | Male | Female |
| Farming, Fishing & Forestry | 0 (0.0%) | 0 (0.0%) |
| Construction & Extraction | 3 (100.0%) | 0 (0.0%) |
| Installation, Maintenance & Repair | 7 (100.0%) | 0 (0.0%) |
| Total (Category) | 10 (100.0%) | 0 (0.0%) |
| Total (Overall) | 62 (45.9%) | 73 (54.1%) |
Production, Transportation and Moving Occupations
The most common Production, Transportation and Moving occupations in Pike are Production (29 | 21.5%), and Transportation (11 | 8.2%).
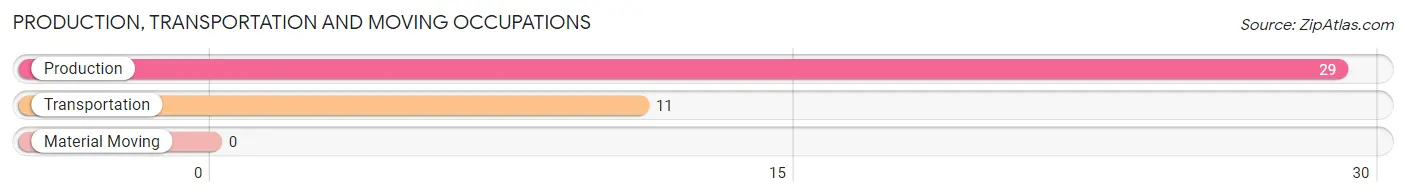
Production, Transportation and Moving Occupations by Sex
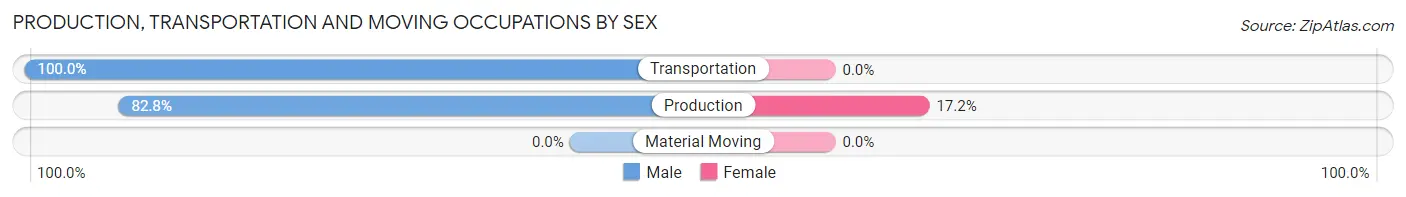
| Occupation | Male | Female |
| Production | 24 (82.8%) | 5 (17.2%) |
| Transportation | 11 (100.0%) | 0 (0.0%) |
| Material Moving | 0 (0.0%) | 0 (0.0%) |
| Total (Category) | 35 (87.5%) | 5 (12.5%) |
| Total (Overall) | 62 (45.9%) | 73 (54.1%) |
Employment Industries by Sex in Pike
Employment Industries in Pike
The major employment industries in Pike include Health Care & Social Assistance (26 | 19.3%), Utilities (22 | 16.3%), Transportation & Warehousing (17 | 12.6%), Manufacturing (14 | 10.4%), and Retail Trade (12 | 8.9%).
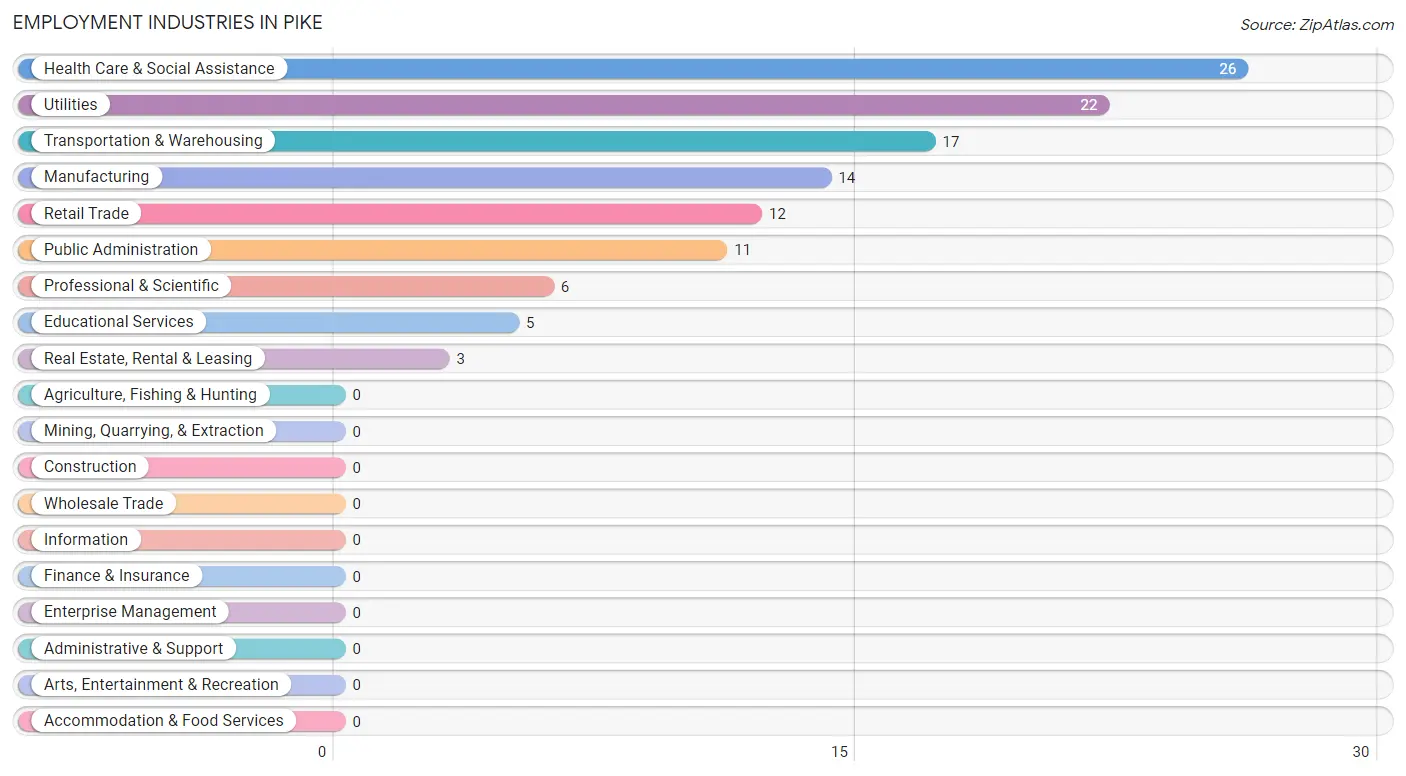
Employment Industries by Sex in Pike
The Pike industries that see more men than women are Utilities (100.0%), Real Estate, Rental & Leasing (100.0%), and Professional & Scientific (100.0%), whereas the industries that tend to have a higher number of women are Health Care & Social Assistance (100.0%), Retail Trade (66.7%), and Manufacturing (64.3%).
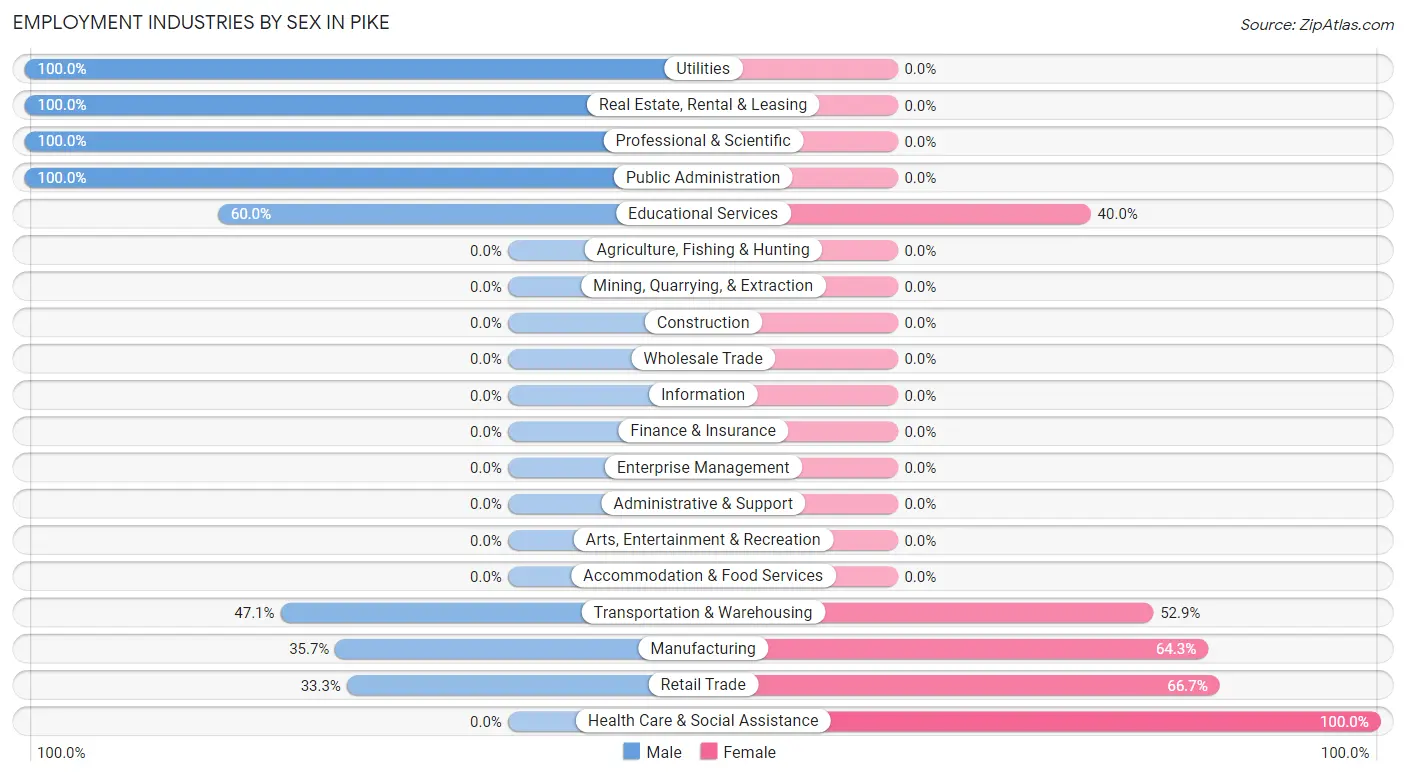
| Industry | Male | Female |
| Agriculture, Fishing & Hunting | 0 (0.0%) | 0 (0.0%) |
| Mining, Quarrying, & Extraction | 0 (0.0%) | 0 (0.0%) |
| Construction | 0 (0.0%) | 0 (0.0%) |
| Manufacturing | 5 (35.7%) | 9 (64.3%) |
| Wholesale Trade | 0 (0.0%) | 0 (0.0%) |
| Retail Trade | 4 (33.3%) | 8 (66.7%) |
| Transportation & Warehousing | 8 (47.1%) | 9 (52.9%) |
| Utilities | 22 (100.0%) | 0 (0.0%) |
| Information | 0 (0.0%) | 0 (0.0%) |
| Finance & Insurance | 0 (0.0%) | 0 (0.0%) |
| Real Estate, Rental & Leasing | 3 (100.0%) | 0 (0.0%) |
| Professional & Scientific | 6 (100.0%) | 0 (0.0%) |
| Enterprise Management | 0 (0.0%) | 0 (0.0%) |
| Administrative & Support | 0 (0.0%) | 0 (0.0%) |
| Educational Services | 3 (60.0%) | 2 (40.0%) |
| Health Care & Social Assistance | 0 (0.0%) | 26 (100.0%) |
| Arts, Entertainment & Recreation | 0 (0.0%) | 0 (0.0%) |
| Accommodation & Food Services | 0 (0.0%) | 0 (0.0%) |
| Public Administration | 11 (100.0%) | 0 (0.0%) |
| Total | 62 (45.9%) | 73 (54.1%) |
Education in Pike
School Enrollment in Pike
The most common levels of schooling among the 56 students in Pike are middle school (34 | 60.7%), high school (16 | 28.6%), and elementary school (4 | 7.1%).
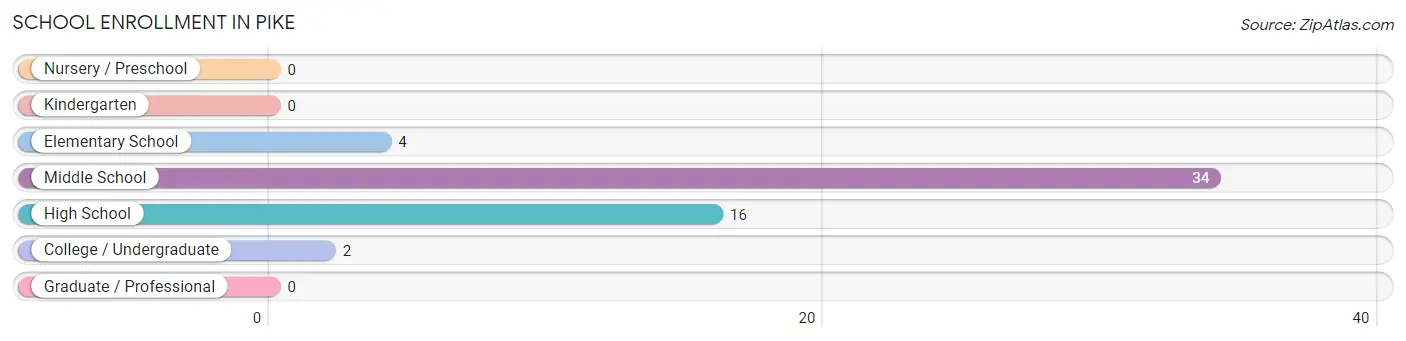
| School Level | # Students | % Students |
| Nursery / Preschool | 0 | 0.0% |
| Kindergarten | 0 | 0.0% |
| Elementary School | 4 | 7.1% |
| Middle School | 34 | 60.7% |
| High School | 16 | 28.6% |
| College / Undergraduate | 2 | 3.6% |
| Graduate / Professional | 0 | 0.0% |
| Total | 56 | 100.0% |
School Enrollment by Age by Funding Source in Pike
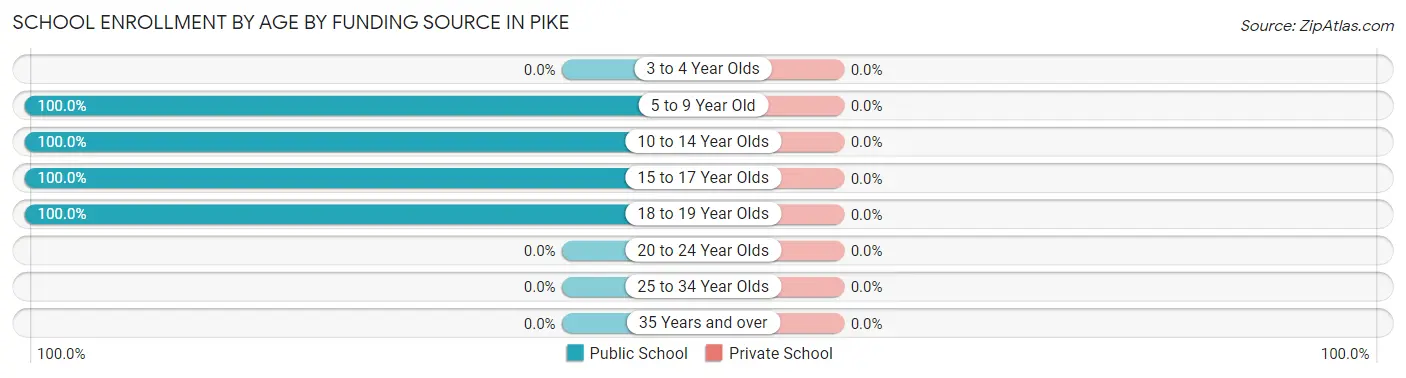
| Age Bracket | Public School | Private School |
| 3 to 4 Year Olds | 0 (0.0%) | 0 (0.0%) |
| 5 to 9 Year Old | 4 (100.0%) | 0 (0.0%) |
| 10 to 14 Year Olds | 36 (100.0%) | 0 (0.0%) |
| 15 to 17 Year Olds | 12 (100.0%) | 0 (0.0%) |
| 18 to 19 Year Olds | 4 (100.0%) | 0 (0.0%) |
| 20 to 24 Year Olds | 0 (0.0%) | 0 (0.0%) |
| 25 to 34 Year Olds | 0 (0.0%) | 0 (0.0%) |
| 35 Years and over | 0 (0.0%) | 0 (0.0%) |
| Total | 56 (100.0%) | 0 (0.0%) |
Educational Attainment by Field of Study in Pike
Bio, nature & agricultural (15 | 78.9%), science & technology (3 | 15.8%), and physical & health sciences (1 | 5.3%) are the most common fields of study among 19 individuals in Pike who have obtained a bachelor's degree or higher.
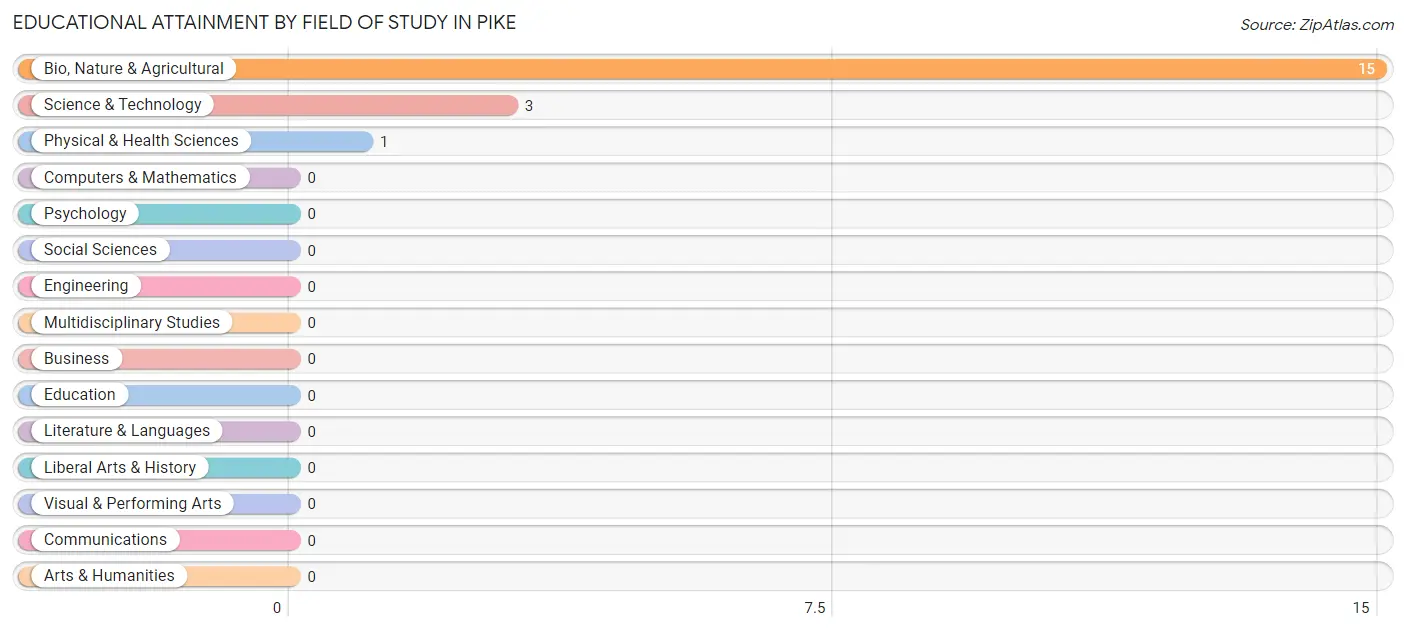
| Field of Study | # Graduates | % Graduates |
| Computers & Mathematics | 0 | 0.0% |
| Bio, Nature & Agricultural | 15 | 78.9% |
| Physical & Health Sciences | 1 | 5.3% |
| Psychology | 0 | 0.0% |
| Social Sciences | 0 | 0.0% |
| Engineering | 0 | 0.0% |
| Multidisciplinary Studies | 0 | 0.0% |
| Science & Technology | 3 | 15.8% |
| Business | 0 | 0.0% |
| Education | 0 | 0.0% |
| Literature & Languages | 0 | 0.0% |
| Liberal Arts & History | 0 | 0.0% |
| Visual & Performing Arts | 0 | 0.0% |
| Communications | 0 | 0.0% |
| Arts & Humanities | 0 | 0.0% |
| Total | 19 | 100.0% |
Transportation & Commute in Pike
Vehicle Availability by Sex in Pike
The most prevalent vehicle ownership categories in Pike are males with 2 vehicles (31, accounting for 50.0%) and females with 2 vehicles (22, making up 42.5%).
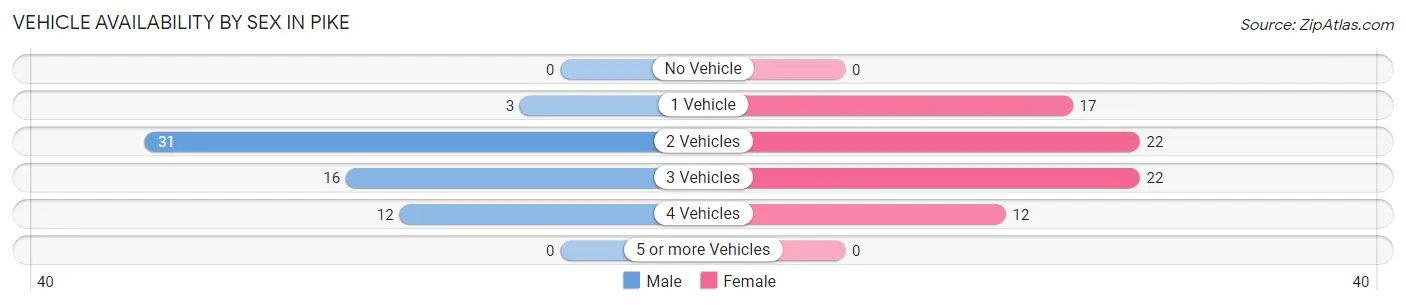
| Vehicles Available | Male | Female |
| No Vehicle | 0 (0.0%) | 0 (0.0%) |
| 1 Vehicle | 3 (4.8%) | 17 (23.3%) |
| 2 Vehicles | 31 (50.0%) | 22 (30.1%) |
| 3 Vehicles | 16 (25.8%) | 22 (30.1%) |
| 4 Vehicles | 12 (19.4%) | 12 (16.4%) |
| 5 or more Vehicles | 0 (0.0%) | 0 (0.0%) |
| Total | 62 (100.0%) | 73 (100.0%) |
Commute Time in Pike
The most frequently occuring commute durations in Pike are 10 to 14 minutes (46 commuters, 37.1%), 25 to 29 minutes (36 commuters, 29.0%), and less than 5 minutes (11 commuters, 8.9%).
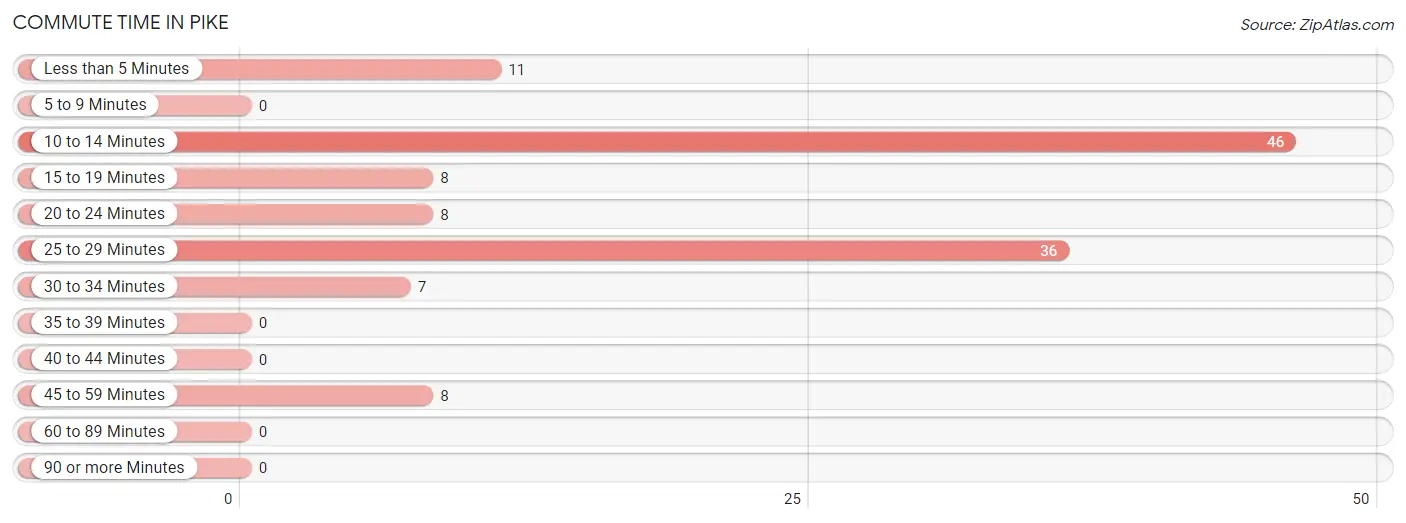
| Commute Time | # Commuters | % Commuters |
| Less than 5 Minutes | 11 | 8.9% |
| 5 to 9 Minutes | 0 | 0.0% |
| 10 to 14 Minutes | 46 | 37.1% |
| 15 to 19 Minutes | 8 | 6.5% |
| 20 to 24 Minutes | 8 | 6.5% |
| 25 to 29 Minutes | 36 | 29.0% |
| 30 to 34 Minutes | 7 | 5.7% |
| 35 to 39 Minutes | 0 | 0.0% |
| 40 to 44 Minutes | 0 | 0.0% |
| 45 to 59 Minutes | 8 | 6.5% |
| 60 to 89 Minutes | 0 | 0.0% |
| 90 or more Minutes | 0 | 0.0% |
Commute Time by Sex in Pike
The most common commute times in Pike are 10 to 14 minutes (23 commuters, 37.1%) for males and 10 to 14 minutes (23 commuters, 37.1%) for females.
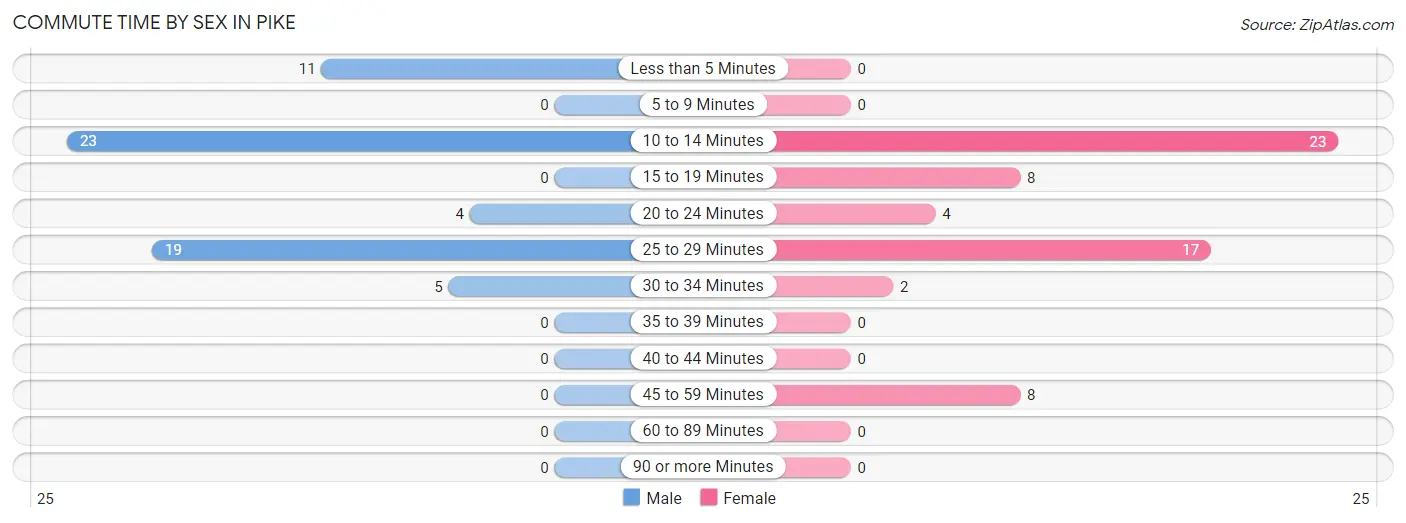
| Commute Time | Male | Female |
| Less than 5 Minutes | 11 (17.7%) | 0 (0.0%) |
| 5 to 9 Minutes | 0 (0.0%) | 0 (0.0%) |
| 10 to 14 Minutes | 23 (37.1%) | 23 (37.1%) |
| 15 to 19 Minutes | 0 (0.0%) | 8 (12.9%) |
| 20 to 24 Minutes | 4 (6.5%) | 4 (6.5%) |
| 25 to 29 Minutes | 19 (30.6%) | 17 (27.4%) |
| 30 to 34 Minutes | 5 (8.1%) | 2 (3.2%) |
| 35 to 39 Minutes | 0 (0.0%) | 0 (0.0%) |
| 40 to 44 Minutes | 0 (0.0%) | 0 (0.0%) |
| 45 to 59 Minutes | 0 (0.0%) | 8 (12.9%) |
| 60 to 89 Minutes | 0 (0.0%) | 0 (0.0%) |
| 90 or more Minutes | 0 (0.0%) | 0 (0.0%) |
Time of Departure to Work by Sex in Pike
The most frequent times of departure to work in Pike are 5:00 AM to 5:29 AM (14, 22.6%) for males and 7:30 AM to 7:59 AM (41, 66.1%) for females.
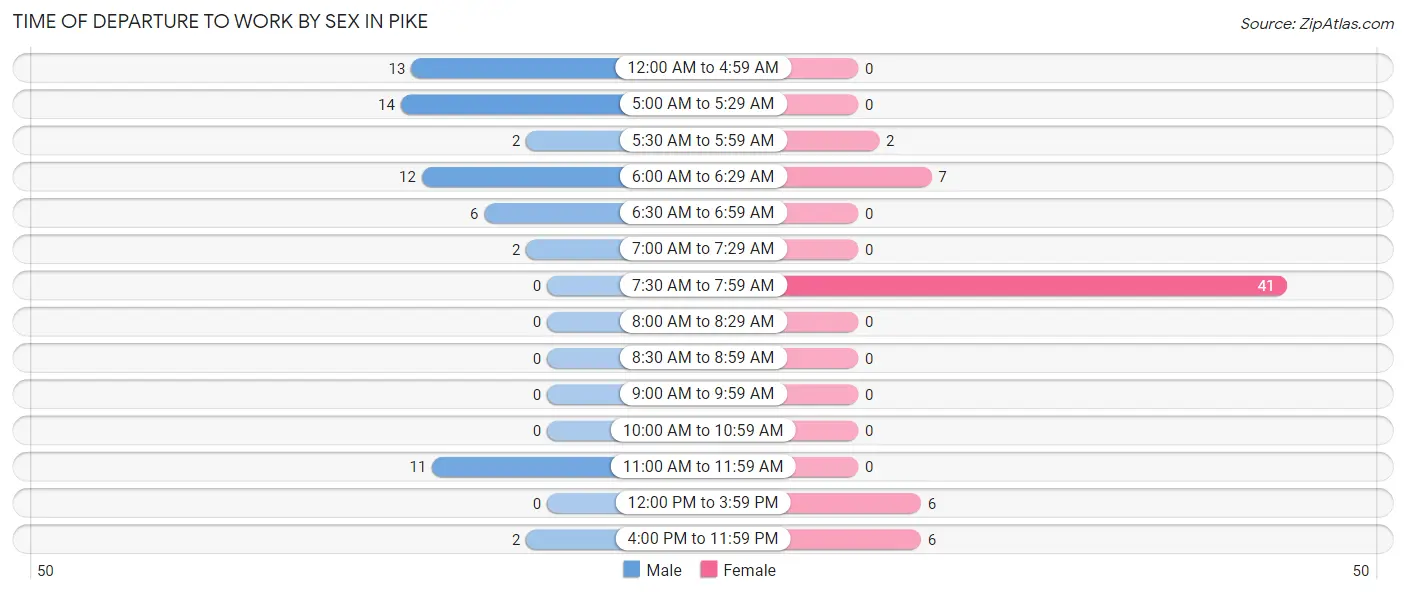
| Time of Departure | Male | Female |
| 12:00 AM to 4:59 AM | 13 (21.0%) | 0 (0.0%) |
| 5:00 AM to 5:29 AM | 14 (22.6%) | 0 (0.0%) |
| 5:30 AM to 5:59 AM | 2 (3.2%) | 2 (3.2%) |
| 6:00 AM to 6:29 AM | 12 (19.4%) | 7 (11.3%) |
| 6:30 AM to 6:59 AM | 6 (9.7%) | 0 (0.0%) |
| 7:00 AM to 7:29 AM | 2 (3.2%) | 0 (0.0%) |
| 7:30 AM to 7:59 AM | 0 (0.0%) | 41 (66.1%) |
| 8:00 AM to 8:29 AM | 0 (0.0%) | 0 (0.0%) |
| 8:30 AM to 8:59 AM | 0 (0.0%) | 0 (0.0%) |
| 9:00 AM to 9:59 AM | 0 (0.0%) | 0 (0.0%) |
| 10:00 AM to 10:59 AM | 0 (0.0%) | 0 (0.0%) |
| 11:00 AM to 11:59 AM | 11 (17.7%) | 0 (0.0%) |
| 12:00 PM to 3:59 PM | 0 (0.0%) | 6 (9.7%) |
| 4:00 PM to 11:59 PM | 2 (3.2%) | 6 (9.7%) |
| Total | 62 (100.0%) | 62 (100.0%) |
Housing Occupancy in Pike
Occupancy by Ownership in Pike
Of the total 103 dwellings in Pike, owner-occupied units account for 97 (94.2%), while renter-occupied units make up 6 (5.8%).
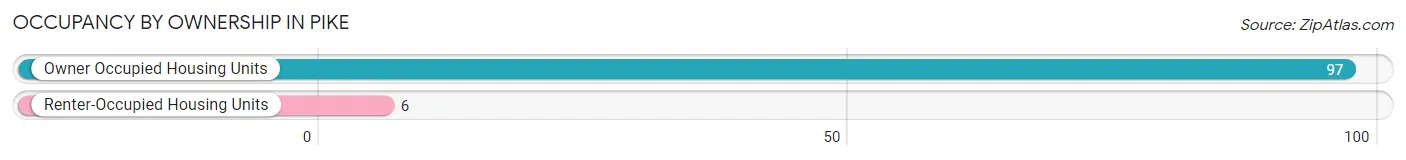
| Occupancy | # Housing Units | % Housing Units |
| Owner Occupied Housing Units | 97 | 94.2% |
| Renter-Occupied Housing Units | 6 | 5.8% |
| Total Occupied Housing Units | 103 | 100.0% |
Occupancy by Household Size in Pike
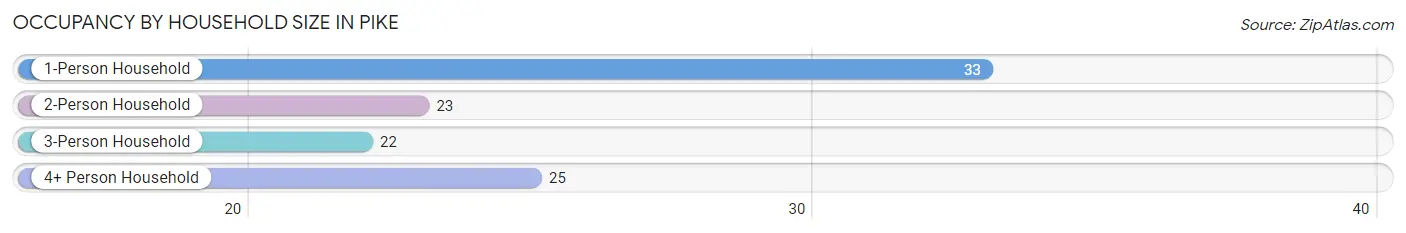
| Household Size | # Housing Units | % Housing Units |
| 1-Person Household | 33 | 32.0% |
| 2-Person Household | 23 | 22.3% |
| 3-Person Household | 22 | 21.4% |
| 4+ Person Household | 25 | 24.3% |
| Total Housing Units | 103 | 100.0% |
Occupancy by Ownership by Household Size in Pike
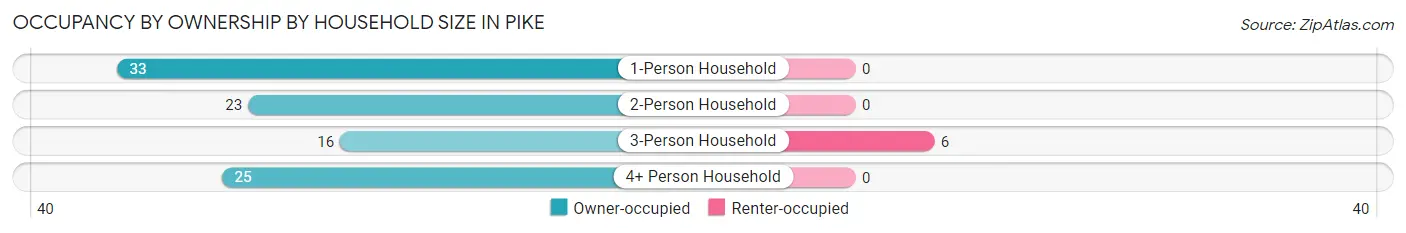
| Household Size | Owner-occupied | Renter-occupied |
| 1-Person Household | 33 (100.0%) | 0 (0.0%) |
| 2-Person Household | 23 (100.0%) | 0 (0.0%) |
| 3-Person Household | 16 (72.7%) | 6 (27.3%) |
| 4+ Person Household | 25 (100.0%) | 0 (0.0%) |
| Total Housing Units | 97 (94.2%) | 6 (5.8%) |
Occupancy by Educational Attainment in Pike
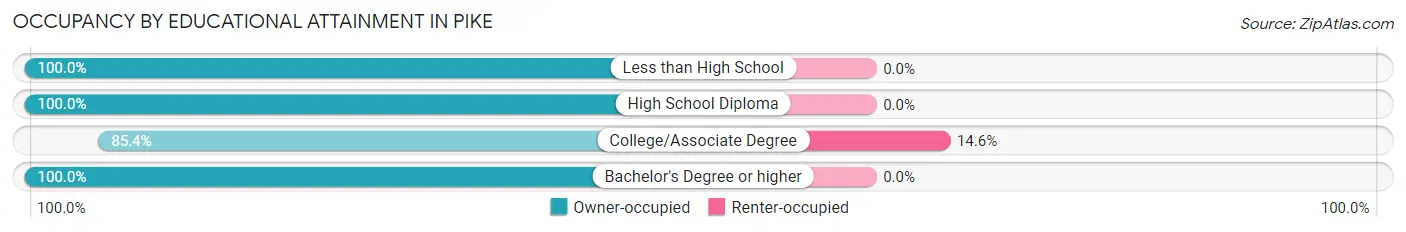
| Household Size | Owner-occupied | Renter-occupied |
| Less than High School | 3 (100.0%) | 0 (0.0%) |
| High School Diploma | 41 (100.0%) | 0 (0.0%) |
| College/Associate Degree | 35 (85.4%) | 6 (14.6%) |
| Bachelor's Degree or higher | 18 (100.0%) | 0 (0.0%) |
Occupancy by Age of Householder in Pike
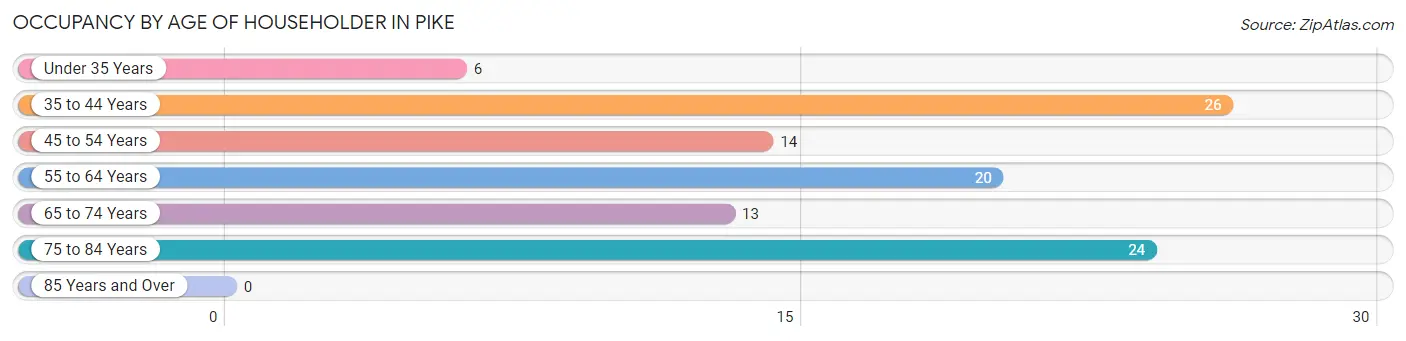
| Age Bracket | # Households | % Households |
| Under 35 Years | 6 | 5.8% |
| 35 to 44 Years | 26 | 25.2% |
| 45 to 54 Years | 14 | 13.6% |
| 55 to 64 Years | 20 | 19.4% |
| 65 to 74 Years | 13 | 12.6% |
| 75 to 84 Years | 24 | 23.3% |
| 85 Years and Over | 0 | 0.0% |
| Total | 103 | 100.0% |
Housing Finances in Pike
Median Income by Occupancy in Pike
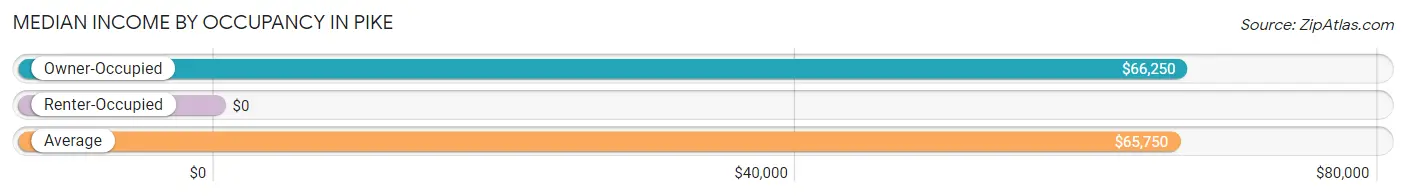
| Occupancy Type | # Households | Median Income |
| Owner-Occupied | 97 (94.2%) | $66,250 |
| Renter-Occupied | 6 (5.8%) | $0 |
| Average | 103 (100.0%) | $65,750 |
Occupancy by Householder Income Bracket in Pike
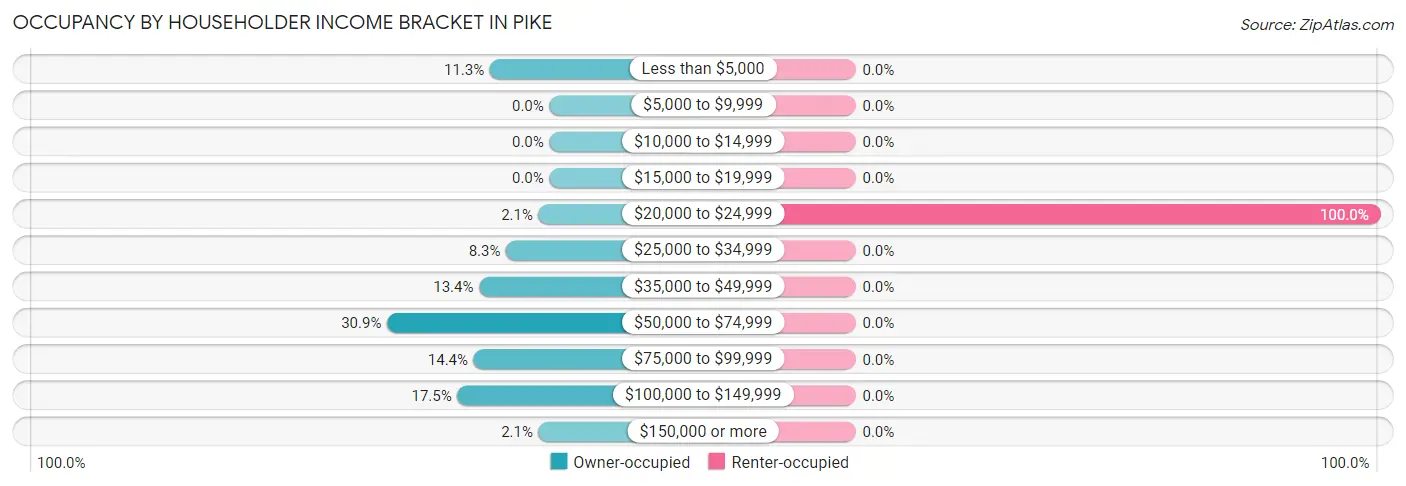
| Income Bracket | Owner-occupied | Renter-occupied |
| Less than $5,000 | 11 (11.3%) | 0 (0.0%) |
| $5,000 to $9,999 | 0 (0.0%) | 0 (0.0%) |
| $10,000 to $14,999 | 0 (0.0%) | 0 (0.0%) |
| $15,000 to $19,999 | 0 (0.0%) | 0 (0.0%) |
| $20,000 to $24,999 | 2 (2.1%) | 6 (100.0%) |
| $25,000 to $34,999 | 8 (8.3%) | 0 (0.0%) |
| $35,000 to $49,999 | 13 (13.4%) | 0 (0.0%) |
| $50,000 to $74,999 | 30 (30.9%) | 0 (0.0%) |
| $75,000 to $99,999 | 14 (14.4%) | 0 (0.0%) |
| $100,000 to $149,999 | 17 (17.5%) | 0 (0.0%) |
| $150,000 or more | 2 (2.1%) | 0 (0.0%) |
| Total | 97 (100.0%) | 6 (100.0%) |
Monthly Housing Cost Tiers in Pike
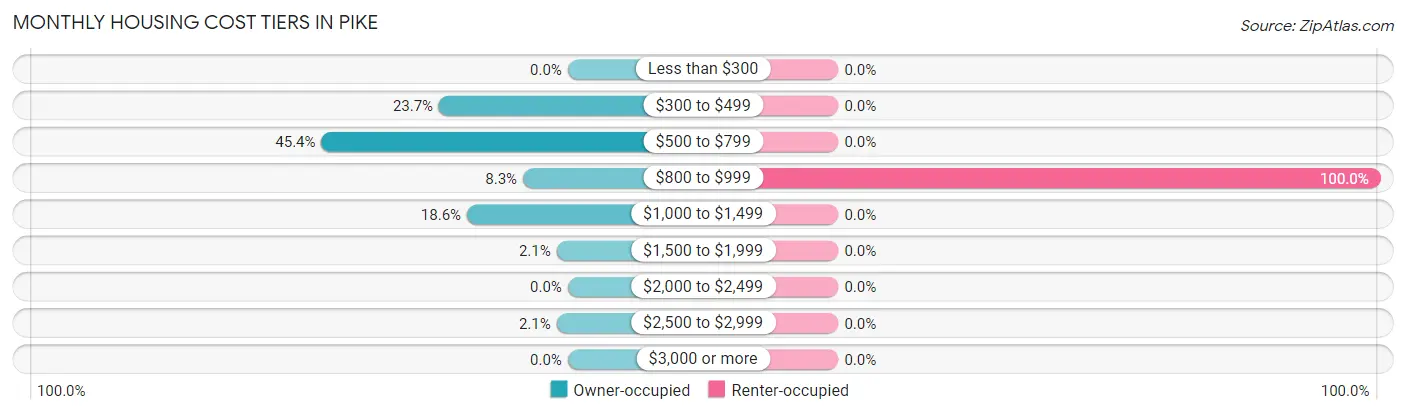
| Monthly Cost | Owner-occupied | Renter-occupied |
| Less than $300 | 0 (0.0%) | 0 (0.0%) |
| $300 to $499 | 23 (23.7%) | 0 (0.0%) |
| $500 to $799 | 44 (45.4%) | 0 (0.0%) |
| $800 to $999 | 8 (8.3%) | 6 (100.0%) |
| $1,000 to $1,499 | 18 (18.6%) | 0 (0.0%) |
| $1,500 to $1,999 | 2 (2.1%) | 0 (0.0%) |
| $2,000 to $2,499 | 0 (0.0%) | 0 (0.0%) |
| $2,500 to $2,999 | 2 (2.1%) | 0 (0.0%) |
| $3,000 or more | 0 (0.0%) | 0 (0.0%) |
| Total | 97 (100.0%) | 6 (100.0%) |
Physical Housing Characteristics in Pike
Housing Structures in Pike
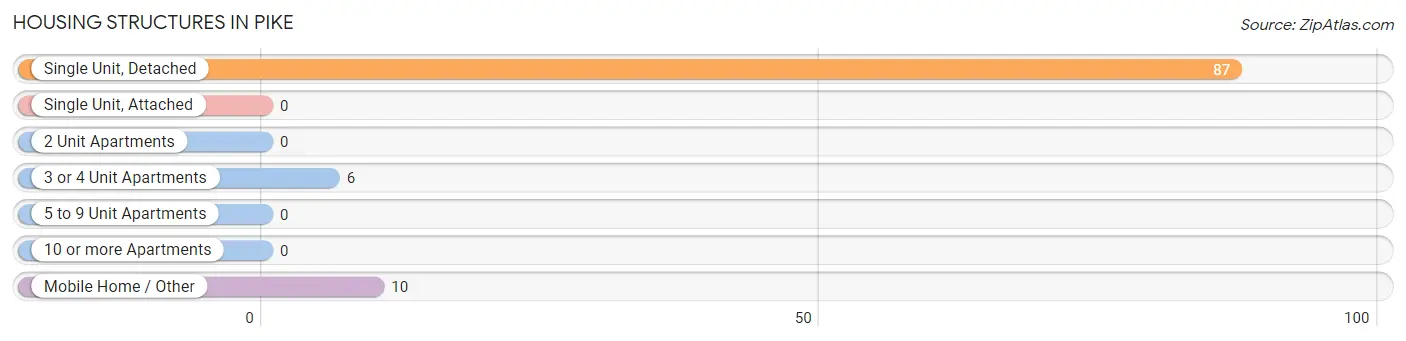
| Structure Type | # Housing Units | % Housing Units |
| Single Unit, Detached | 87 | 84.5% |
| Single Unit, Attached | 0 | 0.0% |
| 2 Unit Apartments | 0 | 0.0% |
| 3 or 4 Unit Apartments | 6 | 5.8% |
| 5 to 9 Unit Apartments | 0 | 0.0% |
| 10 or more Apartments | 0 | 0.0% |
| Mobile Home / Other | 10 | 9.7% |
| Total | 103 | 100.0% |
Housing Structures by Occupancy in Pike
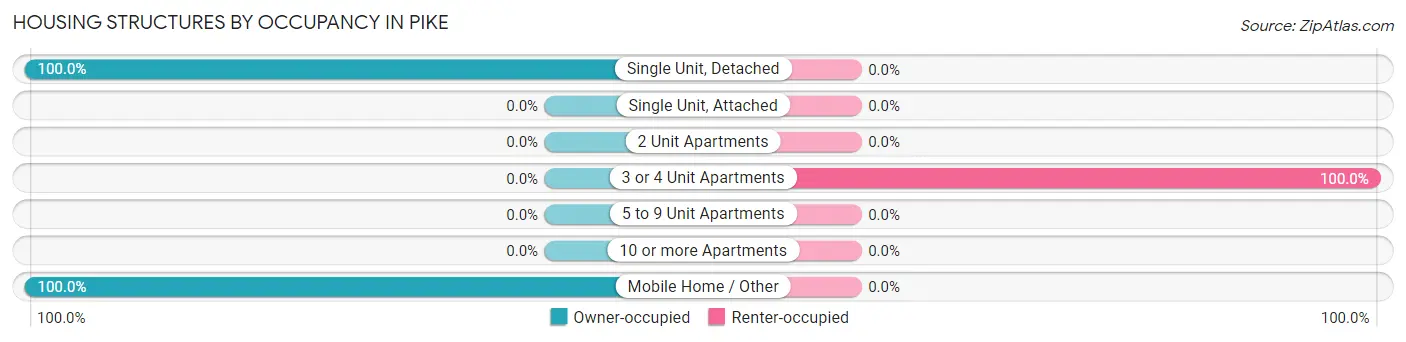
| Structure Type | Owner-occupied | Renter-occupied |
| Single Unit, Detached | 87 (100.0%) | 0 (0.0%) |
| Single Unit, Attached | 0 (0.0%) | 0 (0.0%) |
| 2 Unit Apartments | 0 (0.0%) | 0 (0.0%) |
| 3 or 4 Unit Apartments | 0 (0.0%) | 6 (100.0%) |
| 5 to 9 Unit Apartments | 0 (0.0%) | 0 (0.0%) |
| 10 or more Apartments | 0 (0.0%) | 0 (0.0%) |
| Mobile Home / Other | 10 (100.0%) | 0 (0.0%) |
| Total | 97 (94.2%) | 6 (5.8%) |
Housing Structures by Number of Rooms in Pike
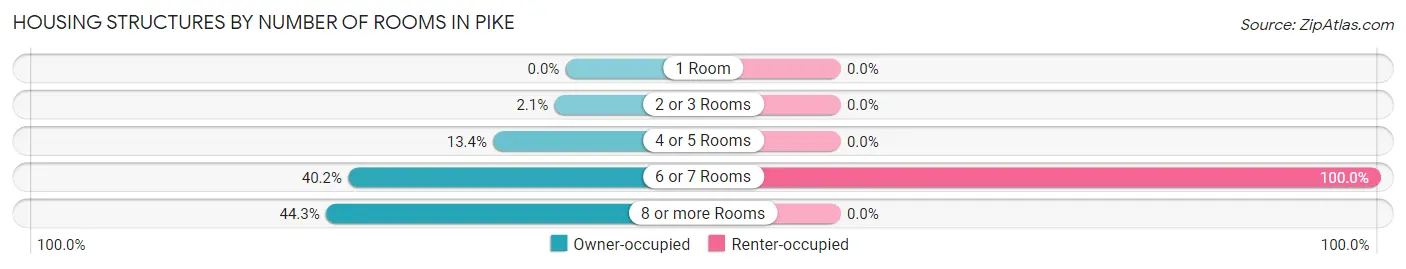
| Number of Rooms | Owner-occupied | Renter-occupied |
| 1 Room | 0 (0.0%) | 0 (0.0%) |
| 2 or 3 Rooms | 2 (2.1%) | 0 (0.0%) |
| 4 or 5 Rooms | 13 (13.4%) | 0 (0.0%) |
| 6 or 7 Rooms | 39 (40.2%) | 6 (100.0%) |
| 8 or more Rooms | 43 (44.3%) | 0 (0.0%) |
| Total | 97 (100.0%) | 6 (100.0%) |
Housing Structure by Heating Type in Pike
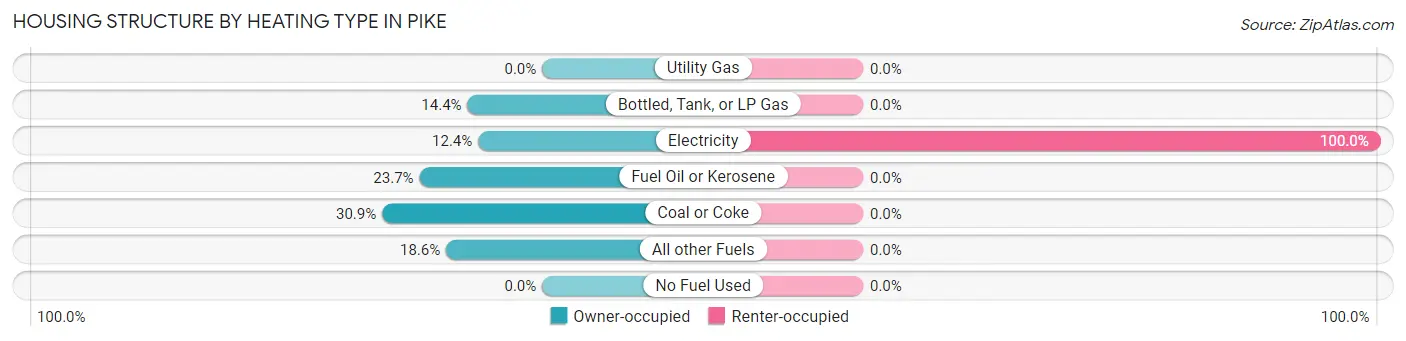
| Heating Type | Owner-occupied | Renter-occupied |
| Utility Gas | 0 (0.0%) | 0 (0.0%) |
| Bottled, Tank, or LP Gas | 14 (14.4%) | 0 (0.0%) |
| Electricity | 12 (12.4%) | 6 (100.0%) |
| Fuel Oil or Kerosene | 23 (23.7%) | 0 (0.0%) |
| Coal or Coke | 30 (30.9%) | 0 (0.0%) |
| All other Fuels | 18 (18.6%) | 0 (0.0%) |
| No Fuel Used | 0 (0.0%) | 0 (0.0%) |
| Total | 97 (100.0%) | 6 (100.0%) |
Household Vehicle Usage in Pike
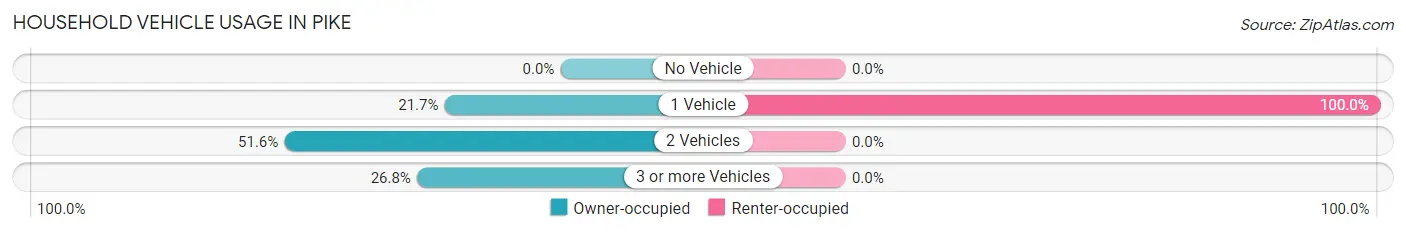
| Vehicles per Household | Owner-occupied | Renter-occupied |
| No Vehicle | 0 (0.0%) | 0 (0.0%) |
| 1 Vehicle | 21 (21.6%) | 6 (100.0%) |
| 2 Vehicles | 50 (51.5%) | 0 (0.0%) |
| 3 or more Vehicles | 26 (26.8%) | 0 (0.0%) |
| Total | 97 (100.0%) | 6 (100.0%) |
Real Estate & Mortgages in Pike
Real Estate and Mortgage Overview in Pike
| Characteristic | Without Mortgage | With Mortgage |
| Housing Units | 69 | 28 |
| Median Property Value | $87,900 | $86,700 |
| Median Household Income | $60,625 | $2 |
| Monthly Housing Costs | $543 | $0 |
| Real Estate Taxes | $2,130 | $0 |
Property Value by Mortgage Status in Pike
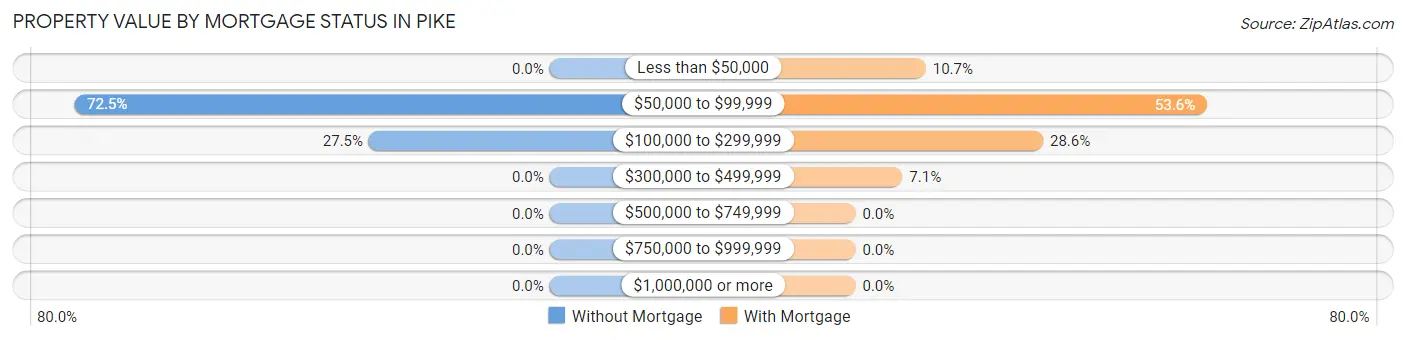
| Property Value | Without Mortgage | With Mortgage |
| Less than $50,000 | 0 (0.0%) | 3 (10.7%) |
| $50,000 to $99,999 | 50 (72.5%) | 15 (53.6%) |
| $100,000 to $299,999 | 19 (27.5%) | 8 (28.6%) |
| $300,000 to $499,999 | 0 (0.0%) | 2 (7.1%) |
| $500,000 to $749,999 | 0 (0.0%) | 0 (0.0%) |
| $750,000 to $999,999 | 0 (0.0%) | 0 (0.0%) |
| $1,000,000 or more | 0 (0.0%) | 0 (0.0%) |
| Total | 69 (100.0%) | 28 (100.0%) |
Household Income by Mortgage Status in Pike
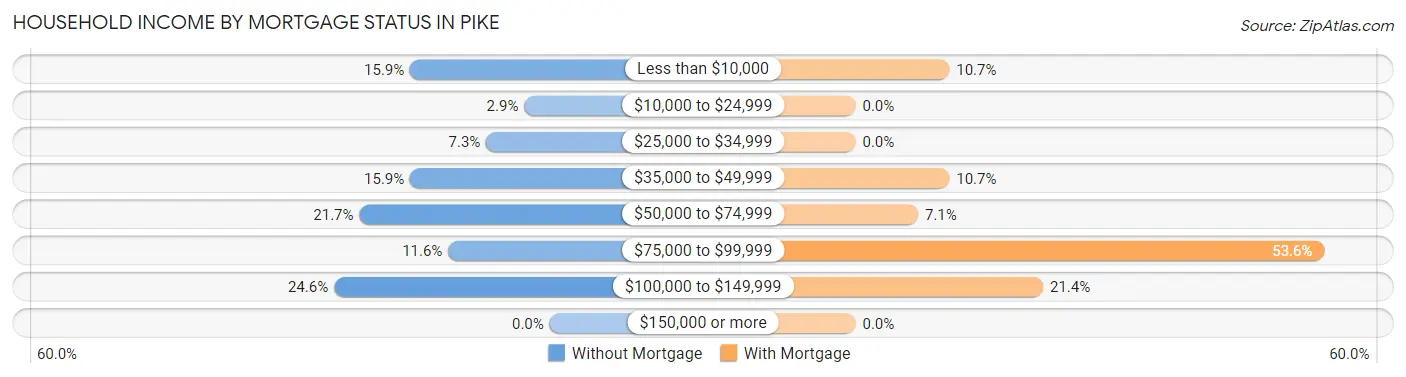
| Household Income | Without Mortgage | With Mortgage |
| Less than $10,000 | 11 (15.9%) | 3 (10.7%) |
| $10,000 to $24,999 | 2 (2.9%) | 0 (0.0%) |
| $25,000 to $34,999 | 5 (7.2%) | 0 (0.0%) |
| $35,000 to $49,999 | 11 (15.9%) | 3 (10.7%) |
| $50,000 to $74,999 | 15 (21.7%) | 2 (7.1%) |
| $75,000 to $99,999 | 8 (11.6%) | 15 (53.6%) |
| $100,000 to $149,999 | 17 (24.6%) | 6 (21.4%) |
| $150,000 or more | 0 (0.0%) | 0 (0.0%) |
| Total | 69 (100.0%) | 28 (100.0%) |
Property Value to Household Income Ratio in Pike
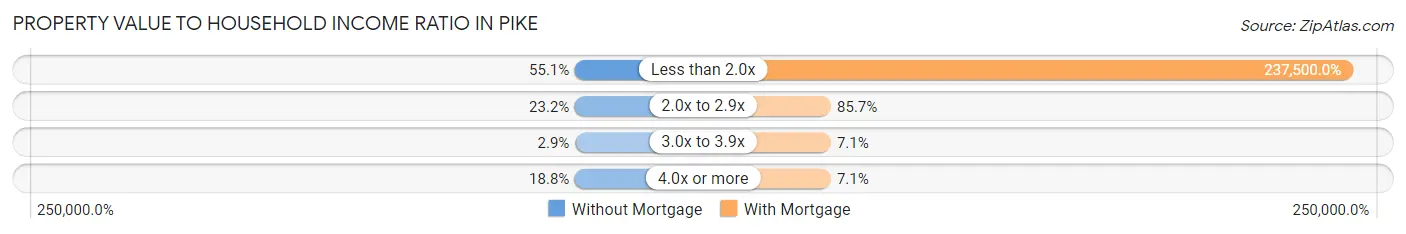
| Value-to-Income Ratio | Without Mortgage | With Mortgage |
| Less than 2.0x | 38 (55.1%) | 66,500 (237,500.0%) |
| 2.0x to 2.9x | 16 (23.2%) | 24 (85.7%) |
| 3.0x to 3.9x | 2 (2.9%) | 2 (7.1%) |
| 4.0x or more | 13 (18.8%) | 2 (7.1%) |
| Total | 69 (100.0%) | 28 (100.0%) |
Real Estate Taxes by Mortgage Status in Pike
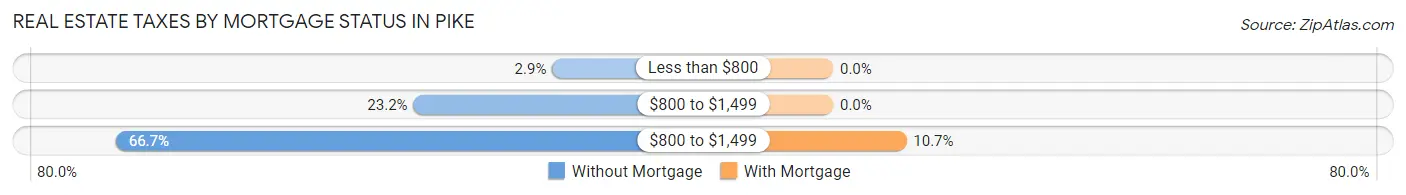
| Property Taxes | Without Mortgage | With Mortgage |
| Less than $800 | 2 (2.9%) | 0 (0.0%) |
| $800 to $1,499 | 16 (23.2%) | 0 (0.0%) |
| $800 to $1,499 | 46 (66.7%) | 3 (10.7%) |
| Total | 69 (100.0%) | 28 (100.0%) |
Health & Disability in Pike
Health Insurance Coverage by Age in Pike
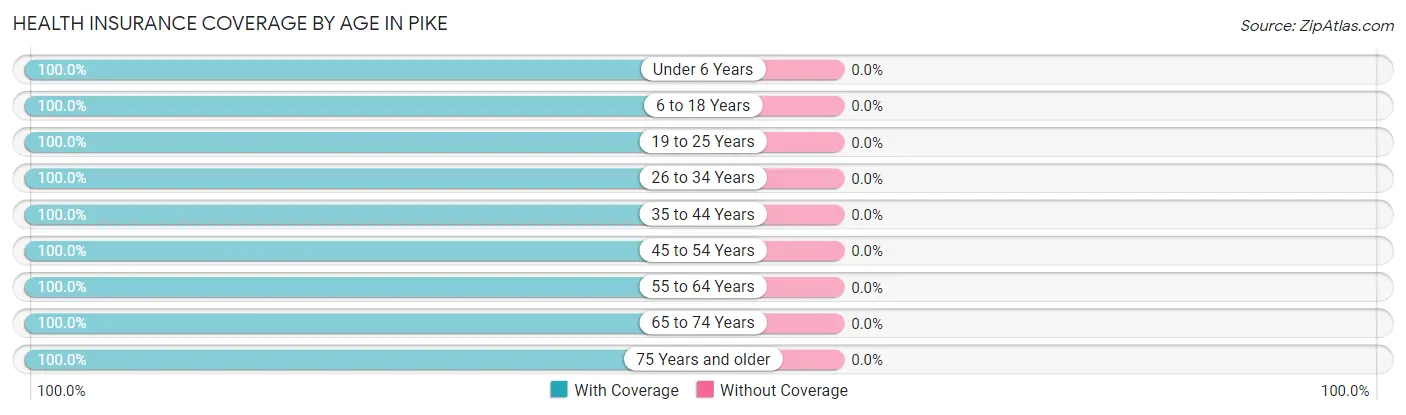
| Age Bracket | With Coverage | Without Coverage |
| Under 6 Years | 12 (100.0%) | 0 (0.0%) |
| 6 to 18 Years | 60 (100.0%) | 0 (0.0%) |
| 19 to 25 Years | 4 (100.0%) | 0 (0.0%) |
| 26 to 34 Years | 24 (100.0%) | 0 (0.0%) |
| 35 to 44 Years | 38 (100.0%) | 0 (0.0%) |
| 45 to 54 Years | 36 (100.0%) | 0 (0.0%) |
| 55 to 64 Years | 25 (100.0%) | 0 (0.0%) |
| 65 to 74 Years | 23 (100.0%) | 0 (0.0%) |
| 75 Years and older | 31 (100.0%) | 0 (0.0%) |
| Total | 253 (100.0%) | 0 (0.0%) |
Health Insurance Coverage by Citizenship Status in Pike
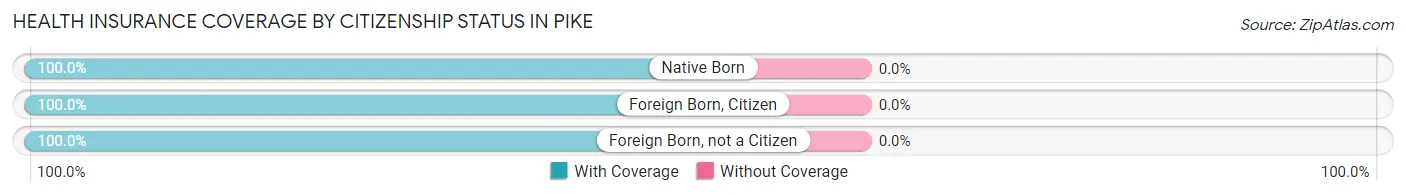
| Citizenship Status | With Coverage | Without Coverage |
| Native Born | 12 (100.0%) | 0 (0.0%) |
| Foreign Born, Citizen | 60 (100.0%) | 0 (0.0%) |
| Foreign Born, not a Citizen | 4 (100.0%) | 0 (0.0%) |
Health Insurance Coverage by Household Income in Pike
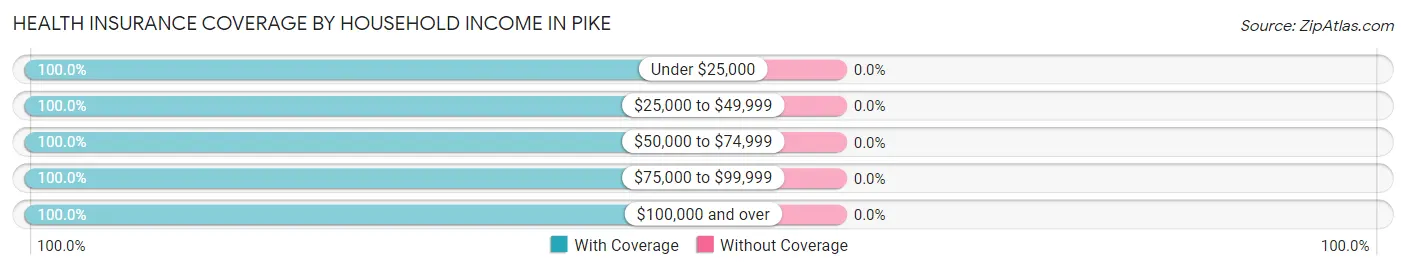
| Household Income | With Coverage | Without Coverage |
| Under $25,000 | 29 (100.0%) | 0 (0.0%) |
| $25,000 to $49,999 | 37 (100.0%) | 0 (0.0%) |
| $50,000 to $74,999 | 82 (100.0%) | 0 (0.0%) |
| $75,000 to $99,999 | 54 (100.0%) | 0 (0.0%) |
| $100,000 and over | 51 (100.0%) | 0 (0.0%) |
Public vs Private Health Insurance Coverage by Age in Pike
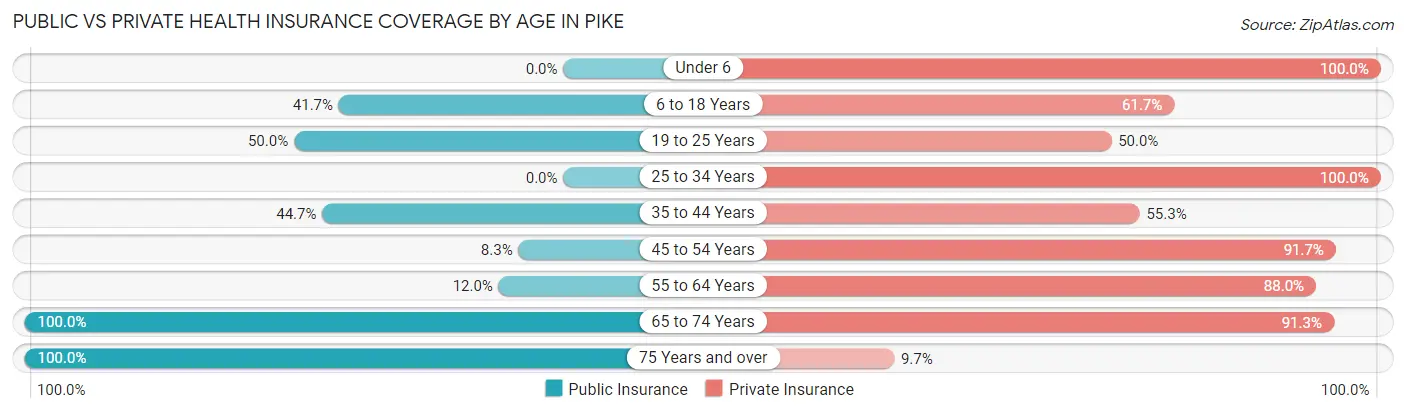
| Age Bracket | Public Insurance | Private Insurance |
| Under 6 | 0 (0.0%) | 12 (100.0%) |
| 6 to 18 Years | 25 (41.7%) | 37 (61.7%) |
| 19 to 25 Years | 2 (50.0%) | 2 (50.0%) |
| 25 to 34 Years | 0 (0.0%) | 24 (100.0%) |
| 35 to 44 Years | 17 (44.7%) | 21 (55.3%) |
| 45 to 54 Years | 3 (8.3%) | 33 (91.7%) |
| 55 to 64 Years | 3 (12.0%) | 22 (88.0%) |
| 65 to 74 Years | 23 (100.0%) | 21 (91.3%) |
| 75 Years and over | 31 (100.0%) | 3 (9.7%) |
| Total | 104 (41.1%) | 175 (69.2%) |
Disability Status by Sex by Age in Pike
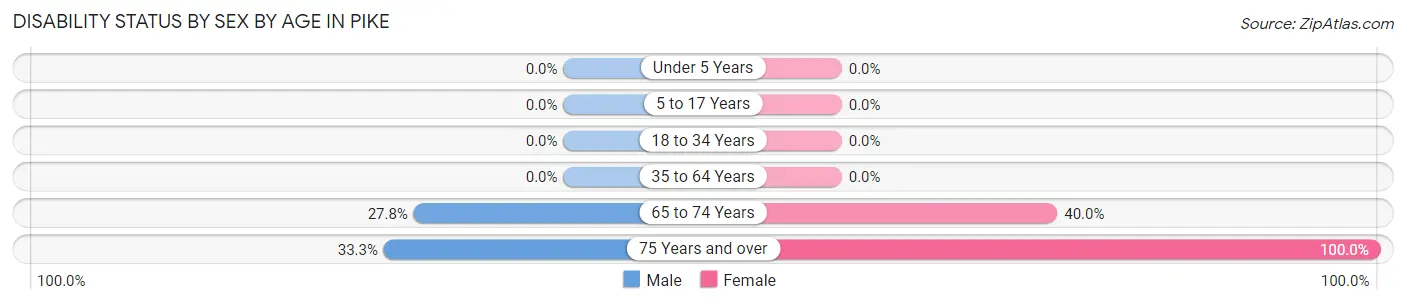
| Age Bracket | Male | Female |
| Under 5 Years | 0 (0.0%) | 0 (0.0%) |
| 5 to 17 Years | 0 (0.0%) | 0 (0.0%) |
| 18 to 34 Years | 0 (0.0%) | 0 (0.0%) |
| 35 to 64 Years | 0 (0.0%) | 0 (0.0%) |
| 65 to 74 Years | 5 (27.8%) | 2 (40.0%) |
| 75 Years and over | 7 (33.3%) | 10 (100.0%) |
Disability Class by Sex by Age in Pike
Disability Class: Hearing Difficulty
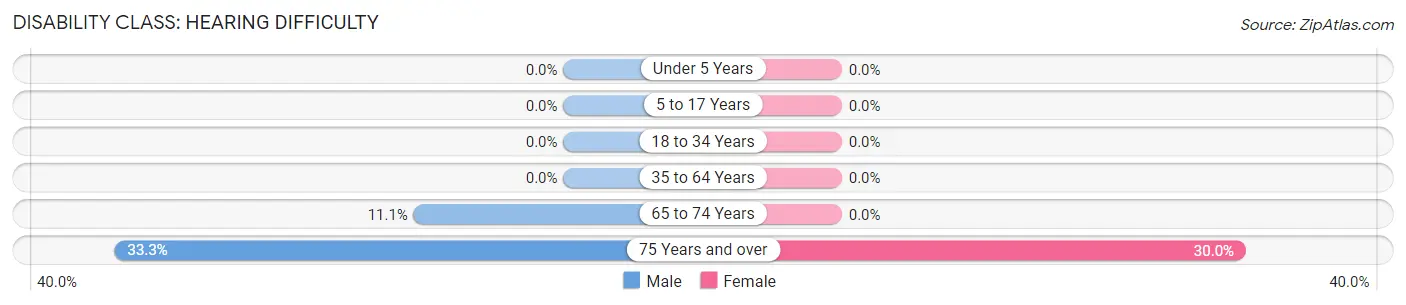
| Age Bracket | Male | Female |
| Under 5 Years | 0 (0.0%) | 0 (0.0%) |
| 5 to 17 Years | 0 (0.0%) | 0 (0.0%) |
| 18 to 34 Years | 0 (0.0%) | 0 (0.0%) |
| 35 to 64 Years | 0 (0.0%) | 0 (0.0%) |
| 65 to 74 Years | 2 (11.1%) | 0 (0.0%) |
| 75 Years and over | 7 (33.3%) | 3 (30.0%) |
Disability Class: Vision Difficulty
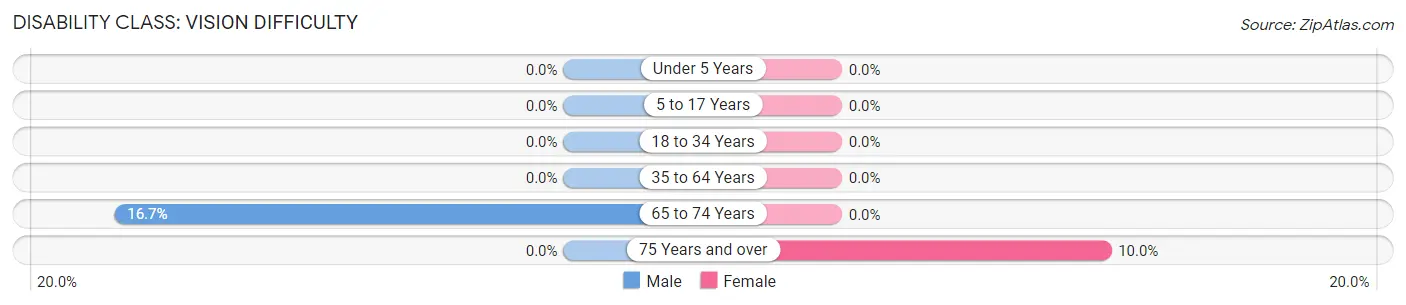
| Age Bracket | Male | Female |
| Under 5 Years | 0 (0.0%) | 0 (0.0%) |
| 5 to 17 Years | 0 (0.0%) | 0 (0.0%) |
| 18 to 34 Years | 0 (0.0%) | 0 (0.0%) |
| 35 to 64 Years | 0 (0.0%) | 0 (0.0%) |
| 65 to 74 Years | 3 (16.7%) | 0 (0.0%) |
| 75 Years and over | 0 (0.0%) | 1 (10.0%) |
Disability Class: Cognitive Difficulty
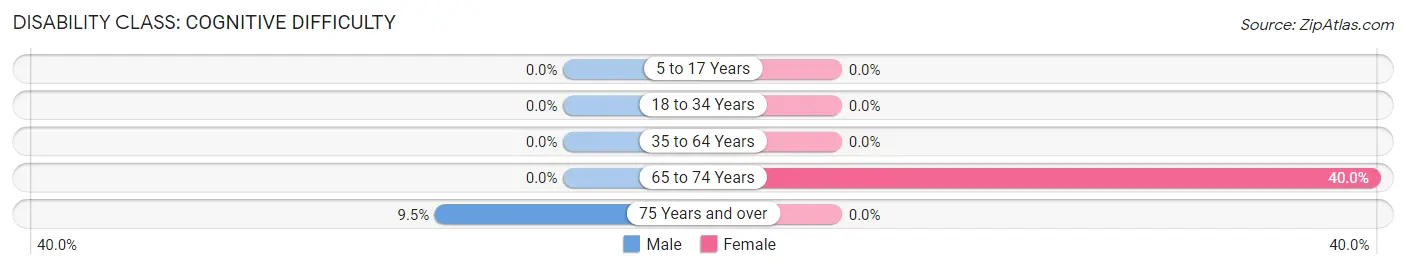
| Age Bracket | Male | Female |
| 5 to 17 Years | 0 (0.0%) | 0 (0.0%) |
| 18 to 34 Years | 0 (0.0%) | 0 (0.0%) |
| 35 to 64 Years | 0 (0.0%) | 0 (0.0%) |
| 65 to 74 Years | 0 (0.0%) | 2 (40.0%) |
| 75 Years and over | 2 (9.5%) | 0 (0.0%) |
Disability Class: Ambulatory Difficulty
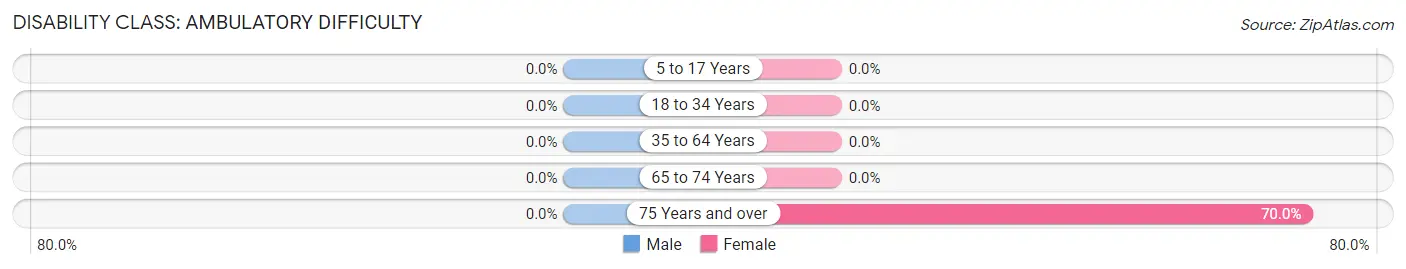
| Age Bracket | Male | Female |
| 5 to 17 Years | 0 (0.0%) | 0 (0.0%) |
| 18 to 34 Years | 0 (0.0%) | 0 (0.0%) |
| 35 to 64 Years | 0 (0.0%) | 0 (0.0%) |
| 65 to 74 Years | 0 (0.0%) | 0 (0.0%) |
| 75 Years and over | 0 (0.0%) | 7 (70.0%) |
Disability Class: Self-Care Difficulty
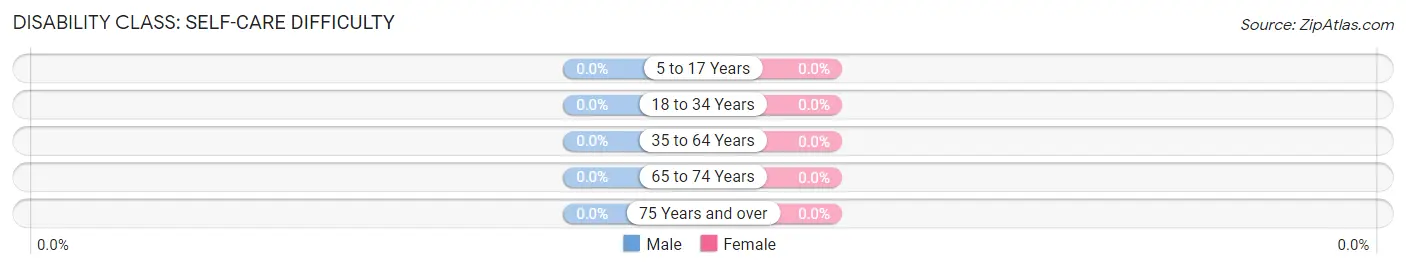
| Age Bracket | Male | Female |
| 5 to 17 Years | 0 (0.0%) | 0 (0.0%) |
| 18 to 34 Years | 0 (0.0%) | 0 (0.0%) |
| 35 to 64 Years | 0 (0.0%) | 0 (0.0%) |
| 65 to 74 Years | 0 (0.0%) | 0 (0.0%) |
| 75 Years and over | 0 (0.0%) | 0 (0.0%) |
Technology Access in Pike
Computing Device Access in Pike
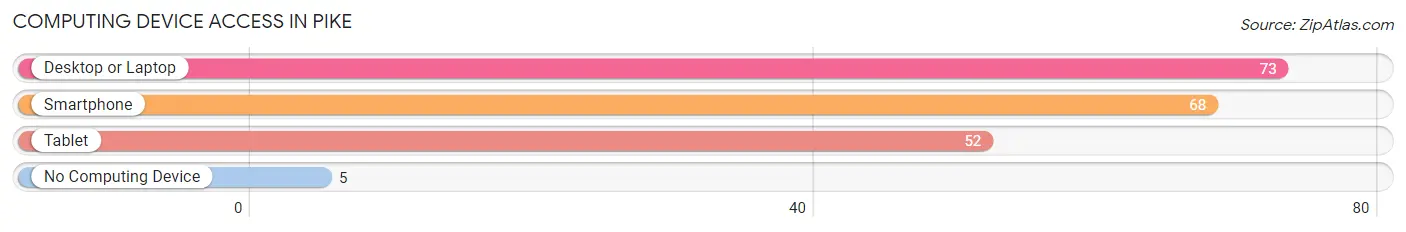
| Device Type | # Households | % Households |
| Desktop or Laptop | 73 | 70.9% |
| Smartphone | 68 | 66.0% |
| Tablet | 52 | 50.5% |
| No Computing Device | 5 | 4.9% |
| Total | 103 | 100.0% |
Internet Access in Pike
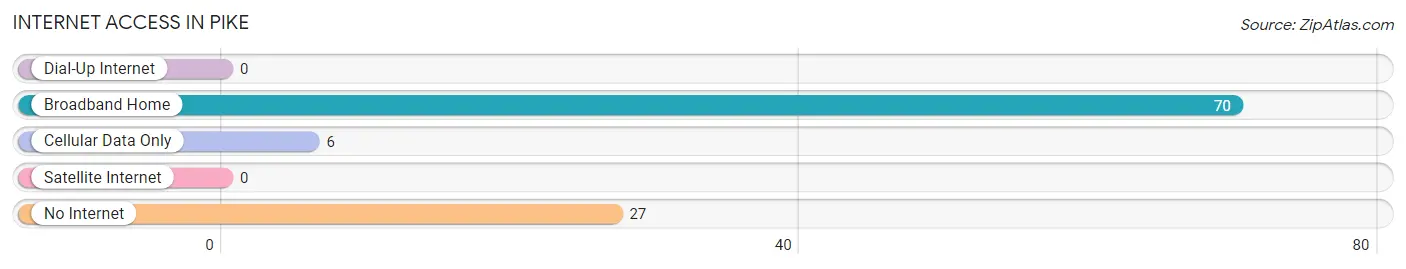
| Internet Type | # Households | % Households |
| Dial-Up Internet | 0 | 0.0% |
| Broadband Home | 70 | 68.0% |
| Cellular Data Only | 6 | 5.8% |
| Satellite Internet | 0 | 0.0% |
| No Internet | 27 | 26.2% |
| Total | 103 | 100.0% |
Pike Summary
Pike is a town located in Wyoming County, New York, United States. The population was 2,845 at the 2010 census. The town is named after General Zebulon Pike, an explorer and soldier for the United States.
Geography
Pike is located in the northwest corner of Wyoming County, bordered by Genesee County to the north, Livingston County to the west, and Cattaraugus County to the south. According to the United States Census Bureau, the town has a total area of 36.2sqmi, of which 36.1sqmi is land and 0.1sqmi, or 0.22%, is water.
The town is in the Finger Lakes region of New York. The northern part of the town is in the Genesee Valley, while the southern part is in the Allegheny Plateau. The Genesee River flows through the town, passing through the hamlet of Pike.
Demographics
As of the census of 2000, there were 2,845 people, 1,093 households, and 790 families residing in the town. The population density was 78.7 people per square mile (30.4/km^2). There were 1,220 housing units at an average density of 33.7 per square mile (13.0/km^2). The racial makeup of the town was 98.45% White, 0.21% African American, 0.14% Native American, 0.14% Asian, 0.14% from other races, and 0.93% from two or more races. Hispanic or Latino of any race were 0.53% of the population.
There were 1,093 households, out of which 33.2% had children under the age of 18 living with them, 58.2% were married couples living together, 8.7% had a female householder with no husband present, and 28.2% were non-families. 22.7% of all households were made up of individuals, and 10.2% had someone living alone who was 65 years of age or older. The average household size was 2.60 and the average family size was 3.05.
In the town, the population was spread out, with 26.2% under the age of 18, 7.2% from 18 to 24, 28.2% from 25 to 44, 24.2% from 45 to 64, and 14.2% who were 65 years of age or older. The median age was 38 years. For every 100 females, there were 97.2 males. For every 100 females age 18 and over, there were 94.2 males.
The median income for a household in the town was $37,917, and the median income for a family was $43,750. Males had a median income of $31,964 versus $22,917 for females. The per capita income for the town was $17,845. About 6.2% of families and 8.7% of the population were below the poverty line, including 10.2% of those under age 18 and 8.2% of those age 65 or over.
Economy
The economy of Pike is largely based on agriculture and tourism. The town is home to several dairy farms, as well as a number of fruit and vegetable farms. The town is also home to several wineries, which attract tourists from all over the region.
The town is also home to a number of small businesses, including a few restaurants, a few retail stores, and a few service businesses. The town is also home to a few small manufacturing businesses, including a furniture maker and a woodworking shop.
The town is served by the Wyoming County Airport, which is located just outside of the town. The airport is used primarily for general aviation, but also serves as a hub for air cargo operations.
Conclusion
Pike is a small town located in Wyoming County, New York. The town is home to a number of dairy farms, fruit and vegetable farms, wineries, and small businesses. The town is served by the Wyoming County Airport, which is used primarily for general aviation and air cargo operations. The town has a population of 2,845 as of the 2010 census, and the median household income is $37,917. Pike is a great place to live and work, and is a great place to visit for its natural beauty and its many attractions.
Common Questions
What is Per Capita Income in Pike?
Per Capita income in Pike is $27,020.
What is the Median Family Income in Pike?
Median Family Income in Pike is $67,500.
What is the Median Household income in Pike?
Median Household Income in Pike is $65,750.
What is Income or Wage Gap in Pike?
Income or Wage Gap in Pike is 69.8%.
Women in Pike earn 30.2 cents for every dollar earned by a man.
What is Inequality or Gini Index in Pike?
Inequality or Gini Index in Pike is 0.38.
What is the Total Population of Pike?
Total Population of Pike is 253.
What is the Total Male Population of Pike?
Total Male Population of Pike is 141.
What is the Total Female Population of Pike?
Total Female Population of Pike is 112.
What is the Ratio of Males per 100 Females in Pike?
There are 125.89 Males per 100 Females in Pike.
What is the Ratio of Females per 100 Males in Pike?
There are 79.43 Females per 100 Males in Pike.
What is the Median Population Age in Pike?
Median Population Age in Pike is 40.7 Years.
What is the Average Family Size in Pike
Average Family Size in Pike is 3.0 People.
What is the Average Household Size in Pike
Average Household Size in Pike is 2.5 People.
How Large is the Labor Force in Pike?
There are 144 People in the Labor Forcein in Pike.
What is the Percentage of People in the Labor Force in Pike?
73.1% of People are in the Labor Force in Pike.
What is the Unemployment Rate in Pike?
Unemployment Rate in Pike is 6.3%.