Grassflat, PA Map & Demographics
Grassflat Map
Grassflat Overview
$28,402
PER CAPITA INCOME
$78,542
AVG FAMILY INCOME
$61,750
AVG HOUSEHOLD INCOME
57.9%
WAGE / INCOME GAP [ % ]
42.1¢/ $1
WAGE / INCOME GAP [ $ ]
0.35
INEQUALITY / GINI INDEX
406
TOTAL POPULATION
206
MALE POPULATION
200
FEMALE POPULATION
103.00
MALES / 100 FEMALES
97.09
FEMALES / 100 MALES
35.8
MEDIAN AGE
3.2
AVG FAMILY SIZE
2.8
AVG HOUSEHOLD SIZE
200
LABOR FORCE [ PEOPLE ]
60.8%
PERCENT IN LABOR FORCE
6.6%
UNEMPLOYMENT RATE
Grassflat Zip Codes
Grassflat Area Codes
Income in Grassflat
Income Overview in Grassflat
Per Capita Income in Grassflat is $28,402, while median incomes of families and households are $78,542 and $61,750 respectively.
| Characteristic | Number | Measure |
| Per Capita Income | 406 | $28,402 |
| Median Family Income | 113 | $78,542 |
| Mean Family Income | 113 | $86,252 |
| Median Household Income | 147 | $61,750 |
| Mean Household Income | 147 | $78,610 |
| Income Deficit | 113 | $0 |
| Wage / Income Gap (%) | 406 | 57.90% |
| Wage / Income Gap ($) | 406 | 42.10¢ per $1 |
| Gini / Inequality Index | 406 | 0.35 |
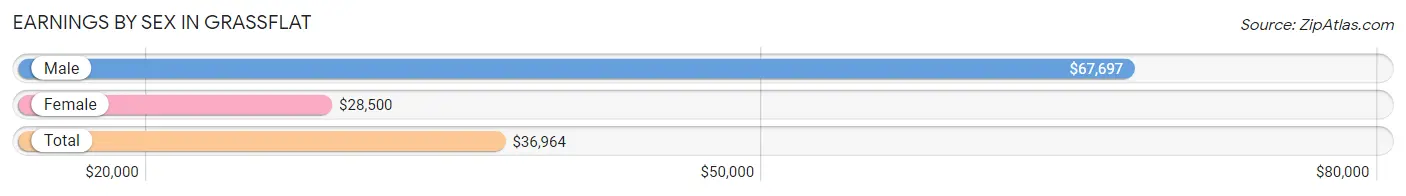
Earnings by Sex in Grassflat
Average Earnings in Grassflat are $36,964, $67,697 for men and $28,500 for women, a difference of 57.9%.
| Sex | Number | Average Earnings |
| Male | 117 (59.4%) | $67,697 |
| Female | 80 (40.6%) | $28,500 |
| Total | 197 (100.0%) | $36,964 |
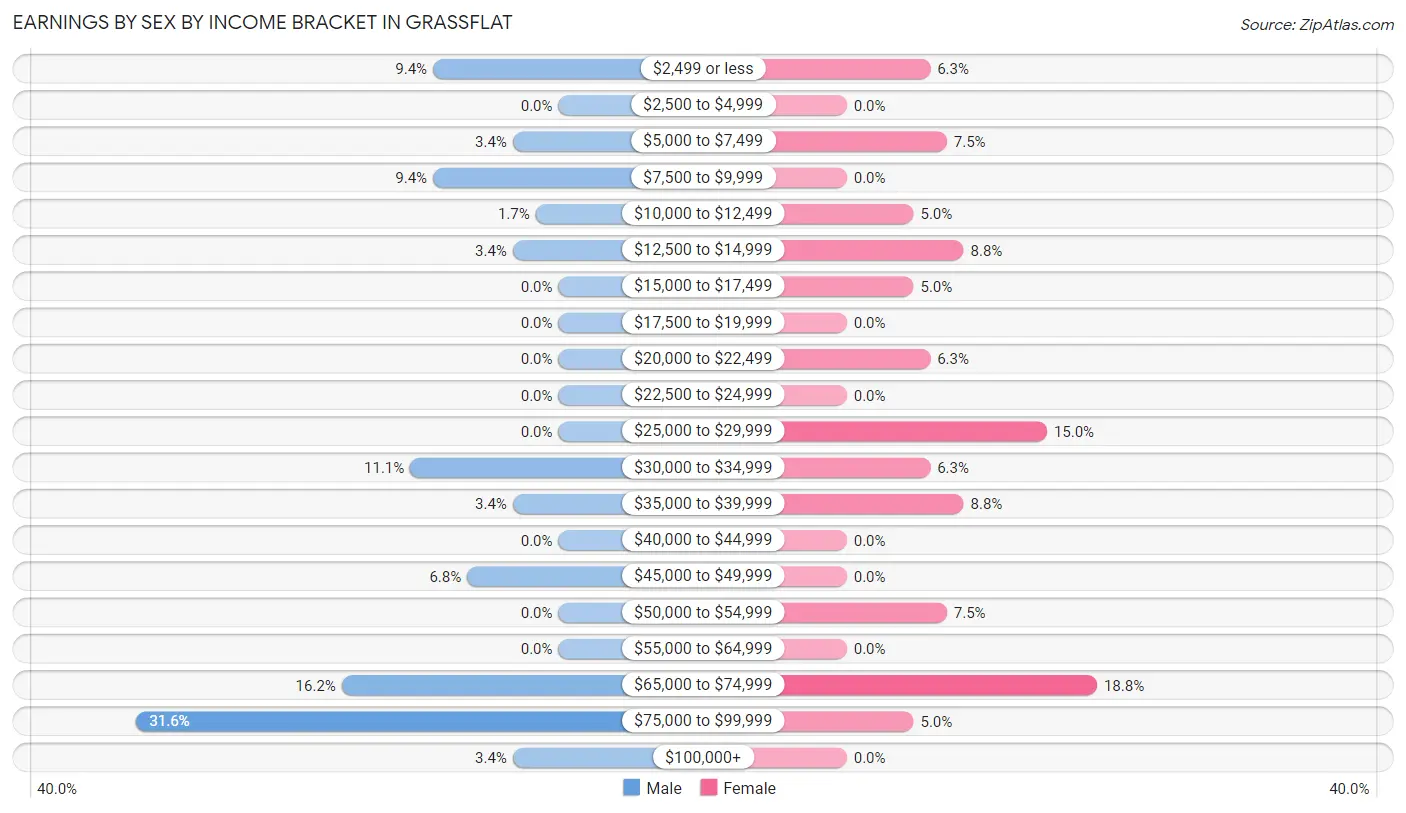
Earnings by Sex by Income Bracket in Grassflat
The most common earnings brackets in Grassflat are $75,000 to $99,999 for men (37 | 31.6%) and $65,000 to $74,999 for women (15 | 18.8%).
| Income | Male | Female |
| $2,499 or less | 11 (9.4%) | 5 (6.2%) |
| $2,500 to $4,999 | 0 (0.0%) | 0 (0.0%) |
| $5,000 to $7,499 | 4 (3.4%) | 6 (7.5%) |
| $7,500 to $9,999 | 11 (9.4%) | 0 (0.0%) |
| $10,000 to $12,499 | 2 (1.7%) | 4 (5.0%) |
| $12,500 to $14,999 | 4 (3.4%) | 7 (8.7%) |
| $15,000 to $17,499 | 0 (0.0%) | 4 (5.0%) |
| $17,500 to $19,999 | 0 (0.0%) | 0 (0.0%) |
| $20,000 to $22,499 | 0 (0.0%) | 5 (6.2%) |
| $22,500 to $24,999 | 0 (0.0%) | 0 (0.0%) |
| $25,000 to $29,999 | 0 (0.0%) | 12 (15.0%) |
| $30,000 to $34,999 | 13 (11.1%) | 5 (6.2%) |
| $35,000 to $39,999 | 4 (3.4%) | 7 (8.7%) |
| $40,000 to $44,999 | 0 (0.0%) | 0 (0.0%) |
| $45,000 to $49,999 | 8 (6.8%) | 0 (0.0%) |
| $50,000 to $54,999 | 0 (0.0%) | 6 (7.5%) |
| $55,000 to $64,999 | 0 (0.0%) | 0 (0.0%) |
| $65,000 to $74,999 | 19 (16.2%) | 15 (18.8%) |
| $75,000 to $99,999 | 37 (31.6%) | 4 (5.0%) |
| $100,000+ | 4 (3.4%) | 0 (0.0%) |
| Total | 117 (100.0%) | 80 (100.0%) |
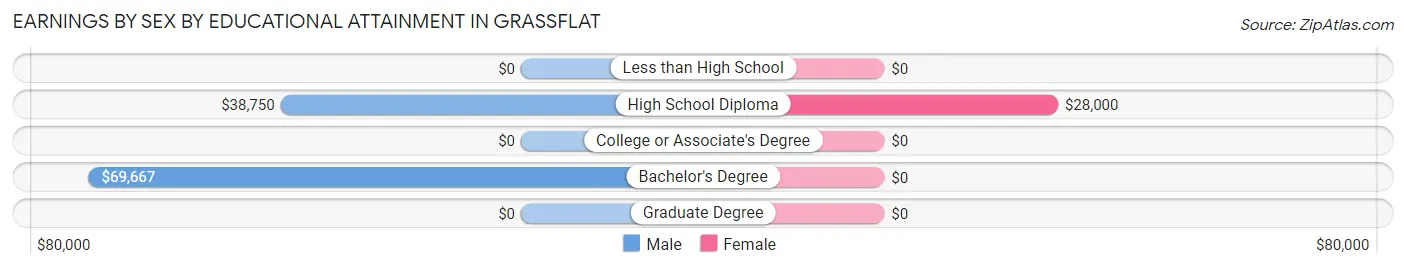
Earnings by Sex by Educational Attainment in Grassflat
Average earnings in Grassflat are $67,961 for men and $29,500 for women, a difference of 56.6%. Men with an educational attainment of bachelor's degree enjoy the highest average annual earnings of $69,667, while those with high school diploma education earn the least with $38,750. Women with an educational attainment of high school diploma earn the most with the average annual earnings of $28,000, while those with high school diploma education have the smallest earnings of $28,000.
| Educational Attainment | Male Income | Female Income |
| Less than High School | - | - |
| High School Diploma | $38,750 | $28,000 |
| College or Associate's Degree | - | - |
| Bachelor's Degree | $69,667 | $0 |
| Graduate Degree | - | - |
| Total | $67,961 | $29,500 |
Family Income in Grassflat
Family Income Brackets in Grassflat
According to the Grassflat family income data, there are 24 families falling into the $75,000 to $99,999 income range, which is the most common income bracket and makes up 21.2% of all families.
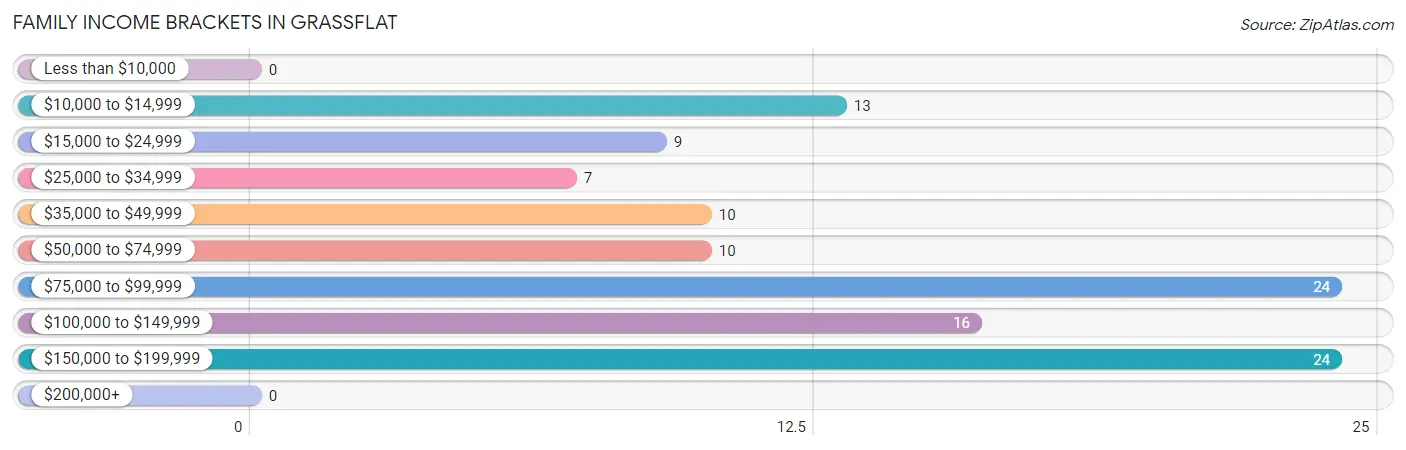
| Income Bracket | # Families | % Families |
| Less than $10,000 | 0 | 0.0% |
| $10,000 to $14,999 | 13 | 11.5% |
| $15,000 to $24,999 | 9 | 8.0% |
| $25,000 to $34,999 | 7 | 6.2% |
| $35,000 to $49,999 | 10 | 8.8% |
| $50,000 to $74,999 | 10 | 8.8% |
| $75,000 to $99,999 | 24 | 21.2% |
| $100,000 to $149,999 | 16 | 14.2% |
| $150,000 to $199,999 | 24 | 21.2% |
| $200,000+ | 0 | 0.0% |
Family Income by Famaliy Size in Grassflat
4-person families (24 | 21.2%) account for the highest median family income in Grassflat with $141,042 per family, while 3-person families (35 | 31.0%) have the highest median income of $36,979 per family member.
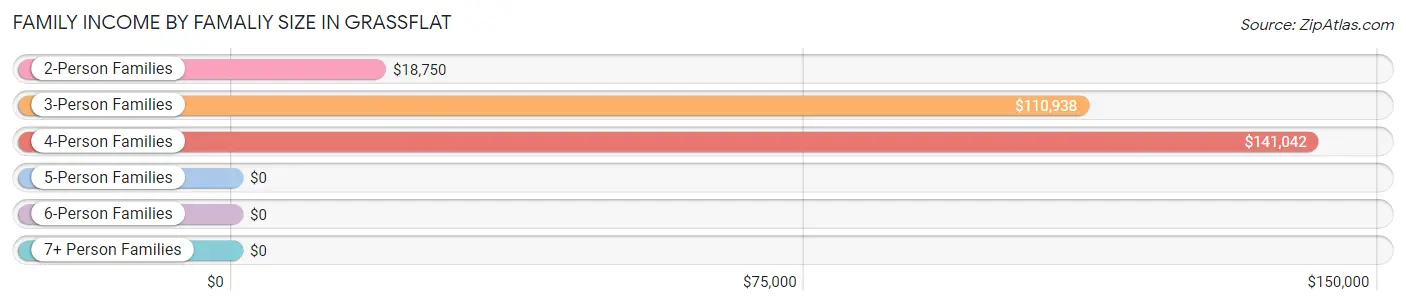
| Income Bracket | # Families | Median Income |
| 2-Person Families | 36 (31.9%) | $18,750 |
| 3-Person Families | 35 (31.0%) | $110,938 |
| 4-Person Families | 24 (21.2%) | $141,042 |
| 5-Person Families | 18 (15.9%) | $0 |
| 6-Person Families | 0 (0.0%) | $0 |
| 7+ Person Families | 0 (0.0%) | $0 |
| Total | 113 (100.0%) | $78,542 |
Family Income by Number of Earners in Grassflat
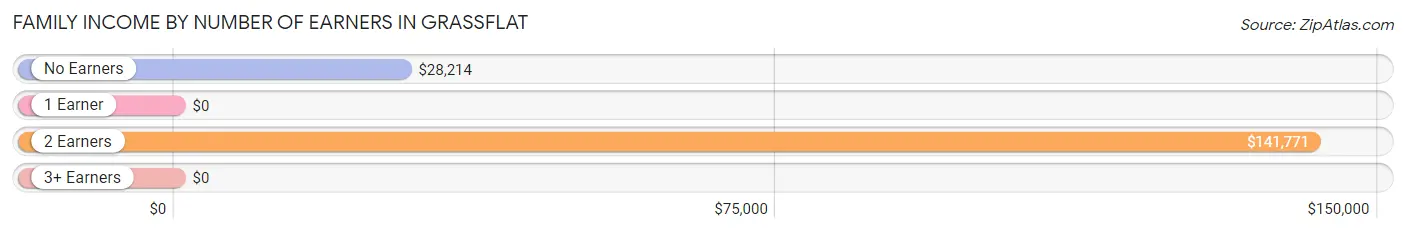
| Number of Earners | # Families | Median Income |
| No Earners | 16 (14.2%) | $28,214 |
| 1 Earner | 32 (28.3%) | $0 |
| 2 Earners | 55 (48.7%) | $141,771 |
| 3+ Earners | 10 (8.8%) | $0 |
| Total | 113 (100.0%) | $78,542 |
Household Income in Grassflat
Household Income Brackets in Grassflat
With 38 households falling in the category, the $50,000 to $74,999 income range is the most frequent in Grassflat, accounting for 25.9% of all households.
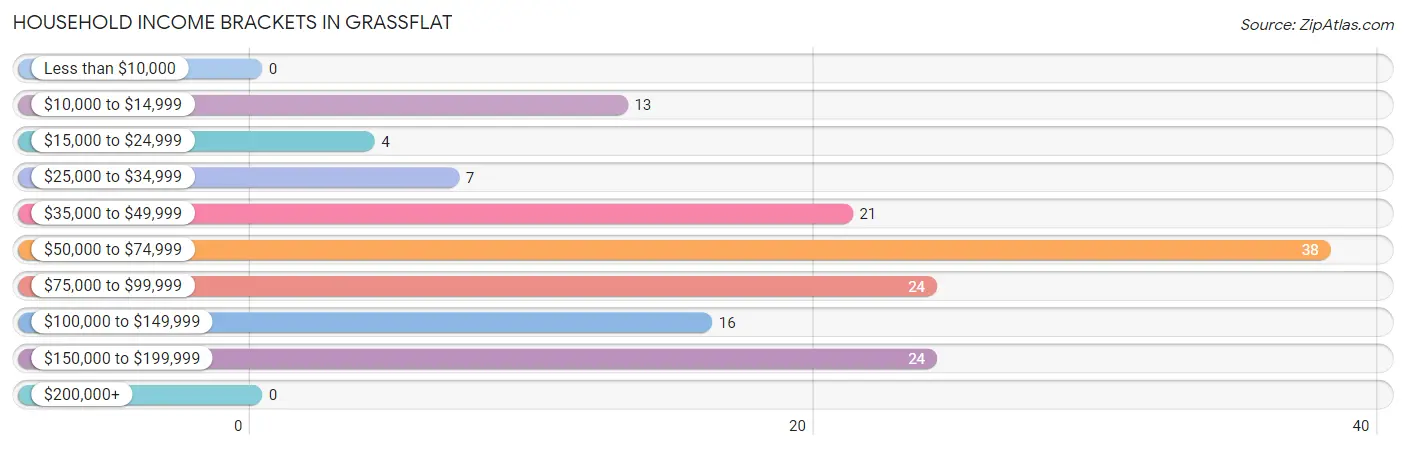
| Income Bracket | # Households | % Households |
| Less than $10,000 | 0 | 0.0% |
| $10,000 to $14,999 | 13 | 8.8% |
| $15,000 to $24,999 | 4 | 2.7% |
| $25,000 to $34,999 | 7 | 4.8% |
| $35,000 to $49,999 | 21 | 14.3% |
| $50,000 to $74,999 | 38 | 25.9% |
| $75,000 to $99,999 | 24 | 16.3% |
| $100,000 to $149,999 | 16 | 10.9% |
| $150,000 to $199,999 | 24 | 16.3% |
| $200,000+ | 0 | 0.0% |
Household Income by Householder Age in Grassflat
The median household income in Grassflat is $61,750, with the highest median household income of $99,792 found in the 45 to 64 years age bracket for the primary householder. A total of 51 households (34.7%) fall into this category.
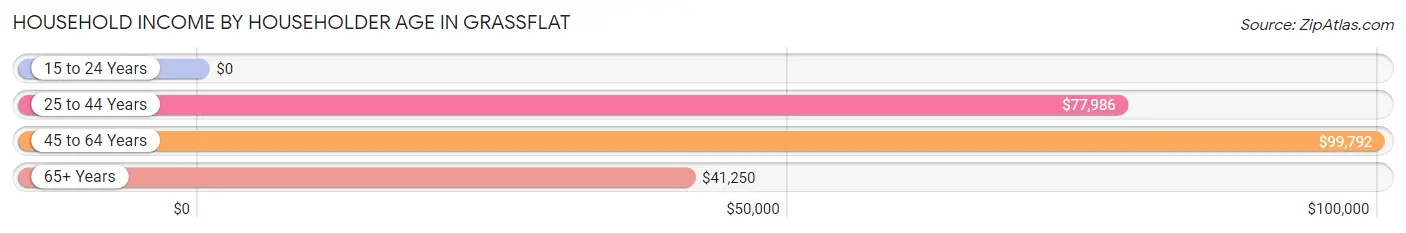
| Income Bracket | # Households | Median Income |
| 15 to 24 Years | 0 (0.0%) | $0 |
| 25 to 44 Years | 59 (40.1%) | $77,986 |
| 45 to 64 Years | 51 (34.7%) | $99,792 |
| 65+ Years | 37 (25.2%) | $41,250 |
| Total | 147 (100.0%) | $61,750 |
Poverty in Grassflat
Income Below Poverty by Sex and Age in Grassflat
With 10.7% poverty level for males and 9.0% for females among the residents of Grassflat, 12 to 14 year old males and 75 year old and over females are the most vulnerable to poverty, with 4 males (100.0%) and 6 females (60.0%) in their respective age groups living below the poverty level.
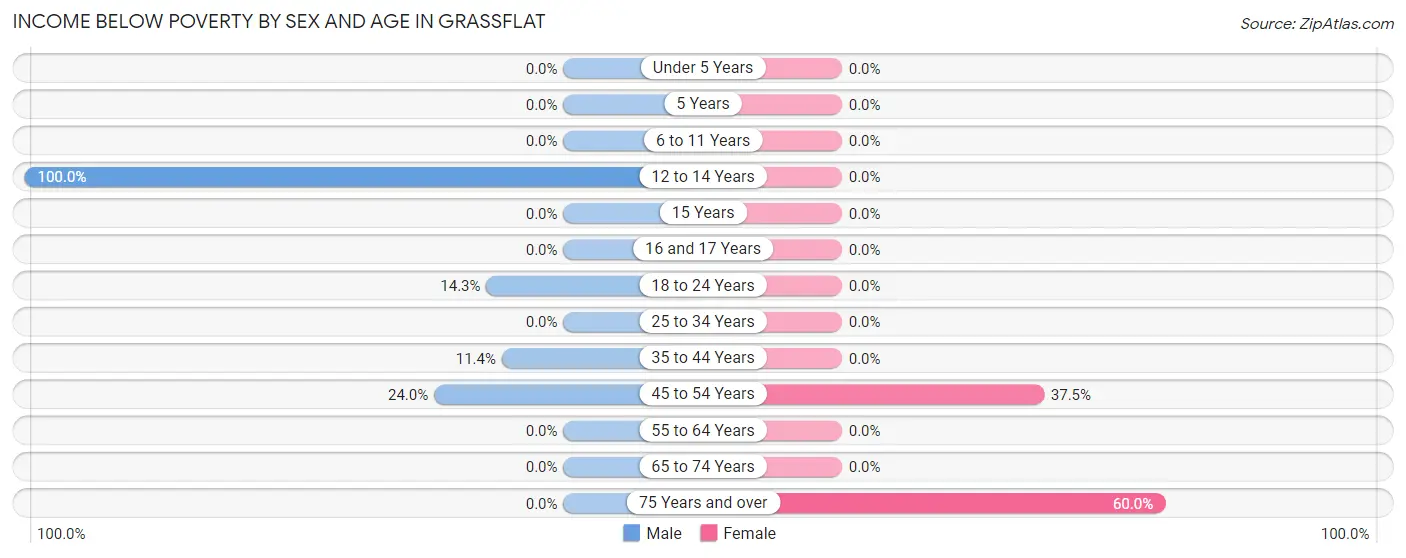
| Age Bracket | Male | Female |
| Under 5 Years | 0 (0.0%) | 0 (0.0%) |
| 5 Years | 0 (0.0%) | 0 (0.0%) |
| 6 to 11 Years | 0 (0.0%) | 0 (0.0%) |
| 12 to 14 Years | 4 (100.0%) | 0 (0.0%) |
| 15 Years | 0 (0.0%) | 0 (0.0%) |
| 16 and 17 Years | 0 (0.0%) | 0 (0.0%) |
| 18 to 24 Years | 4 (14.3%) | 0 (0.0%) |
| 25 to 34 Years | 0 (0.0%) | 0 (0.0%) |
| 35 to 44 Years | 8 (11.4%) | 0 (0.0%) |
| 45 to 54 Years | 6 (24.0%) | 12 (37.5%) |
| 55 to 64 Years | 0 (0.0%) | 0 (0.0%) |
| 65 to 74 Years | 0 (0.0%) | 0 (0.0%) |
| 75 Years and over | 0 (0.0%) | 6 (60.0%) |
| Total | 22 (10.7%) | 18 (9.0%) |
Income Above Poverty by Sex and Age in Grassflat
According to the poverty statistics in Grassflat, males aged 5 years and females aged under 5 years are the age groups that are most secure financially, with 100.0% of males and 100.0% of females in these age groups living above the poverty line.
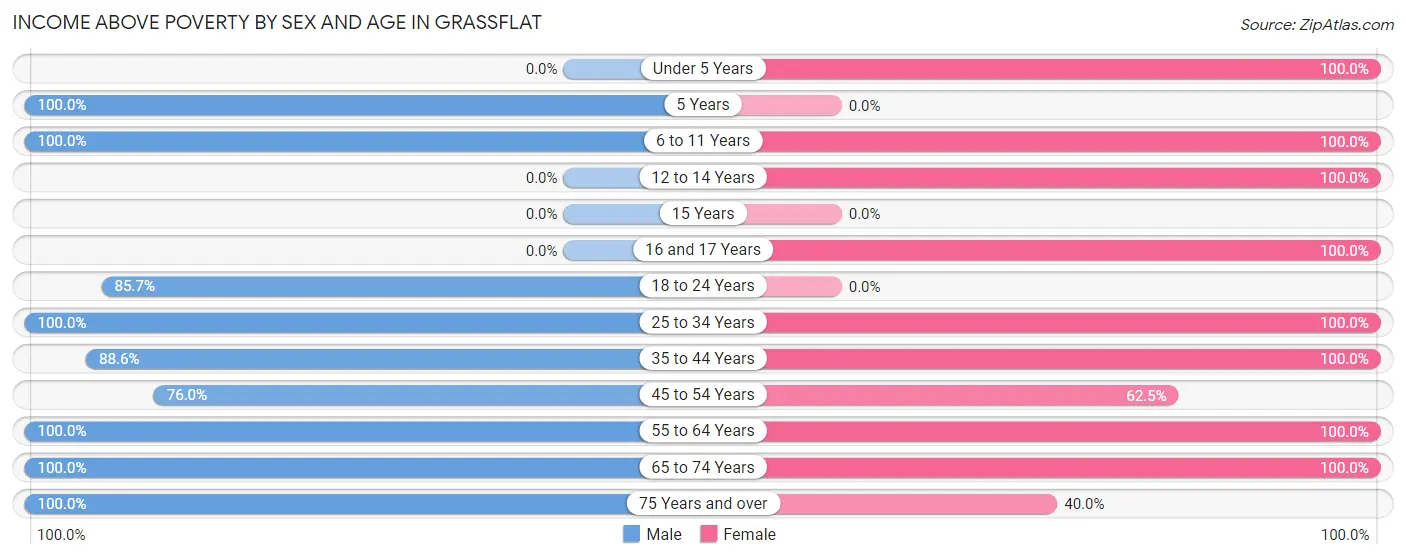
| Age Bracket | Male | Female |
| Under 5 Years | 0 (0.0%) | 14 (100.0%) |
| 5 Years | 12 (100.0%) | 0 (0.0%) |
| 6 to 11 Years | 4 (100.0%) | 25 (100.0%) |
| 12 to 14 Years | 0 (0.0%) | 18 (100.0%) |
| 15 Years | 0 (0.0%) | 0 (0.0%) |
| 16 and 17 Years | 0 (0.0%) | 4 (100.0%) |
| 18 to 24 Years | 24 (85.7%) | 0 (0.0%) |
| 25 to 34 Years | 19 (100.0%) | 33 (100.0%) |
| 35 to 44 Years | 62 (88.6%) | 34 (100.0%) |
| 45 to 54 Years | 19 (76.0%) | 20 (62.5%) |
| 55 to 64 Years | 17 (100.0%) | 20 (100.0%) |
| 65 to 74 Years | 3 (100.0%) | 10 (100.0%) |
| 75 Years and over | 24 (100.0%) | 4 (40.0%) |
| Total | 184 (89.3%) | 182 (91.0%) |
Income Below Poverty Among Married-Couple Families in Grassflat
The poverty statistics for married-couple families in Grassflat show that 6.9% or 7 of the total 102 families live below the poverty line. Families with no children have the highest poverty rate of 17.1%, comprising of 7 families. On the other hand, families with 1 or 2 children have the lowest poverty rate of 0.0%, which includes 0 families.
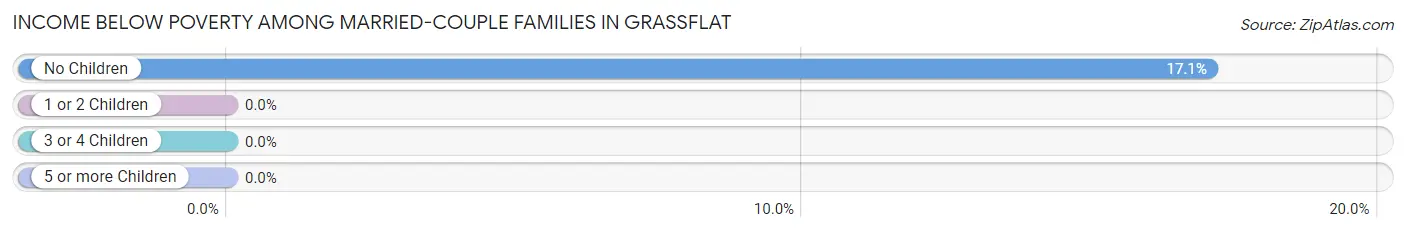
| Children | Above Poverty | Below Poverty |
| No Children | 34 (82.9%) | 7 (17.1%) |
| 1 or 2 Children | 61 (100.0%) | 0 (0.0%) |
| 3 or 4 Children | 0 (0.0%) | 0 (0.0%) |
| 5 or more Children | 0 (0.0%) | 0 (0.0%) |
| Total | 95 (93.1%) | 7 (6.9%) |
Income Below Poverty Among Single-Parent Households in Grassflat
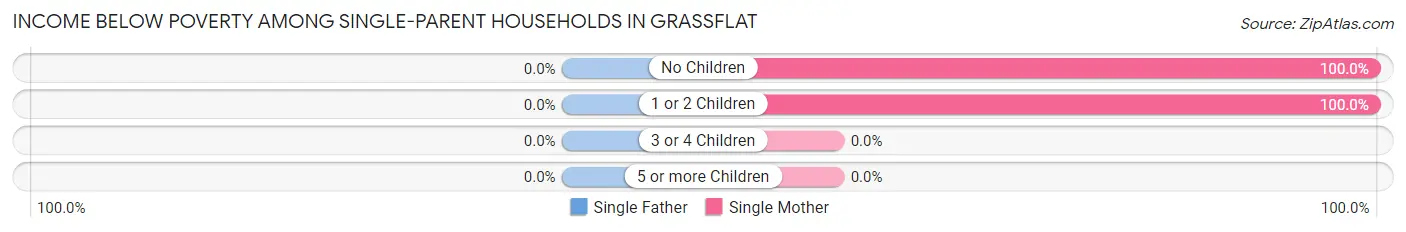
| Children | Single Father | Single Mother |
| No Children | 0 (0.0%) | 6 (100.0%) |
| 1 or 2 Children | 0 (0.0%) | 5 (100.0%) |
| 3 or 4 Children | 0 (0.0%) | 0 (0.0%) |
| 5 or more Children | 0 (0.0%) | 0 (0.0%) |
| Total | 0 (0.0%) | 11 (100.0%) |
Income Below Poverty Among Married-Couple vs Single-Parent Households in Grassflat
The poverty data for Grassflat shows that 7 of the married-couple family households (6.9%) and 11 of the single-parent households (100.0%) are living below the poverty level. Within the married-couple family households, those with no children have the highest poverty rate, with 7 households (17.1%) falling below the poverty line. Among the single-parent households, those with no children have the highest poverty rate, with 6 household (100.0%) living below poverty.
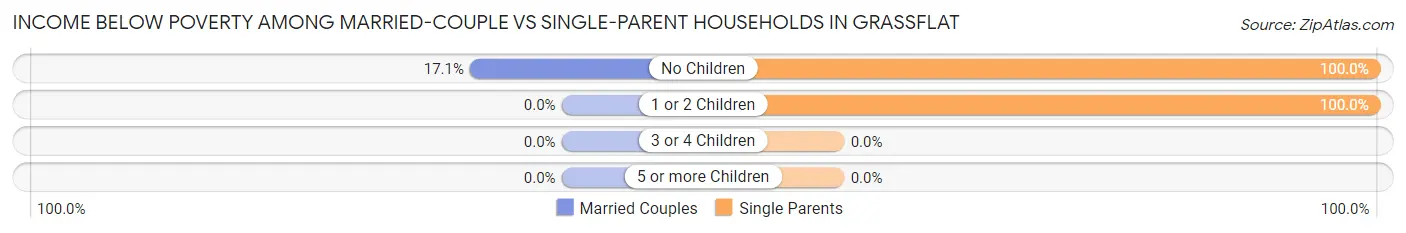
| Children | Married-Couple Families | Single-Parent Households |
| No Children | 7 (17.1%) | 6 (100.0%) |
| 1 or 2 Children | 0 (0.0%) | 5 (100.0%) |
| 3 or 4 Children | 0 (0.0%) | 0 (0.0%) |
| 5 or more Children | 0 (0.0%) | 0 (0.0%) |
| Total | 7 (6.9%) | 11 (100.0%) |
Race in Grassflat
The most populous races in Grassflat are , and White / Caucasian (406 | 100.0%).
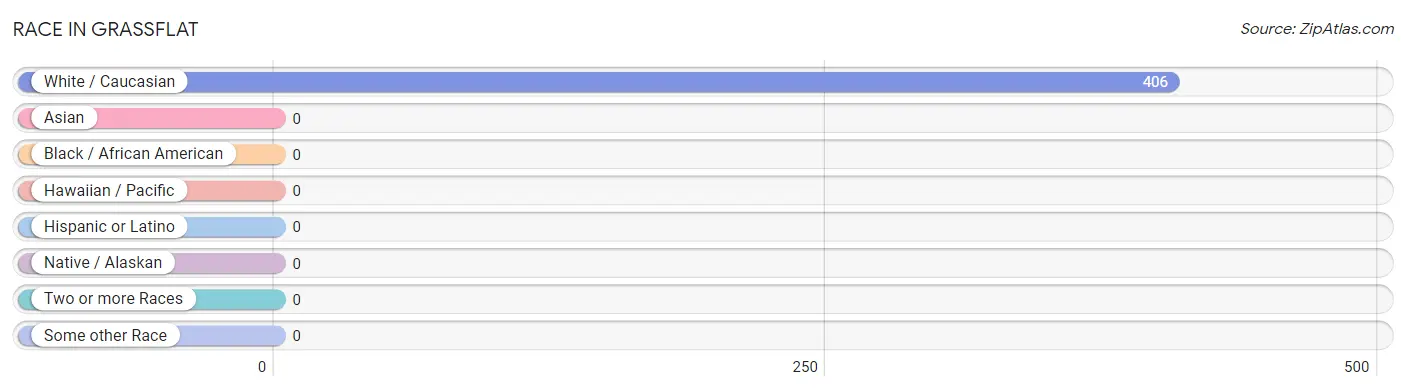
| Race | # Population | % Population |
| Asian | 0 | 0.0% |
| Black / African American | 0 | 0.0% |
| Hawaiian / Pacific | 0 | 0.0% |
| Hispanic or Latino | 0 | 0.0% |
| Native / Alaskan | 0 | 0.0% |
| White / Caucasian | 406 | 100.0% |
| Two or more Races | 0 | 0.0% |
| Some other Race | 0 | 0.0% |
| Total | 406 | 100.0% |
Ancestry in Grassflat
The most populous ancestries reported in Grassflat are European (91 | 22.4%), Italian (85 | 20.9%), German (73 | 18.0%), American (64 | 15.8%), and Slavic (38 | 9.4%), together accounting for 86.4% of all Grassflat residents.
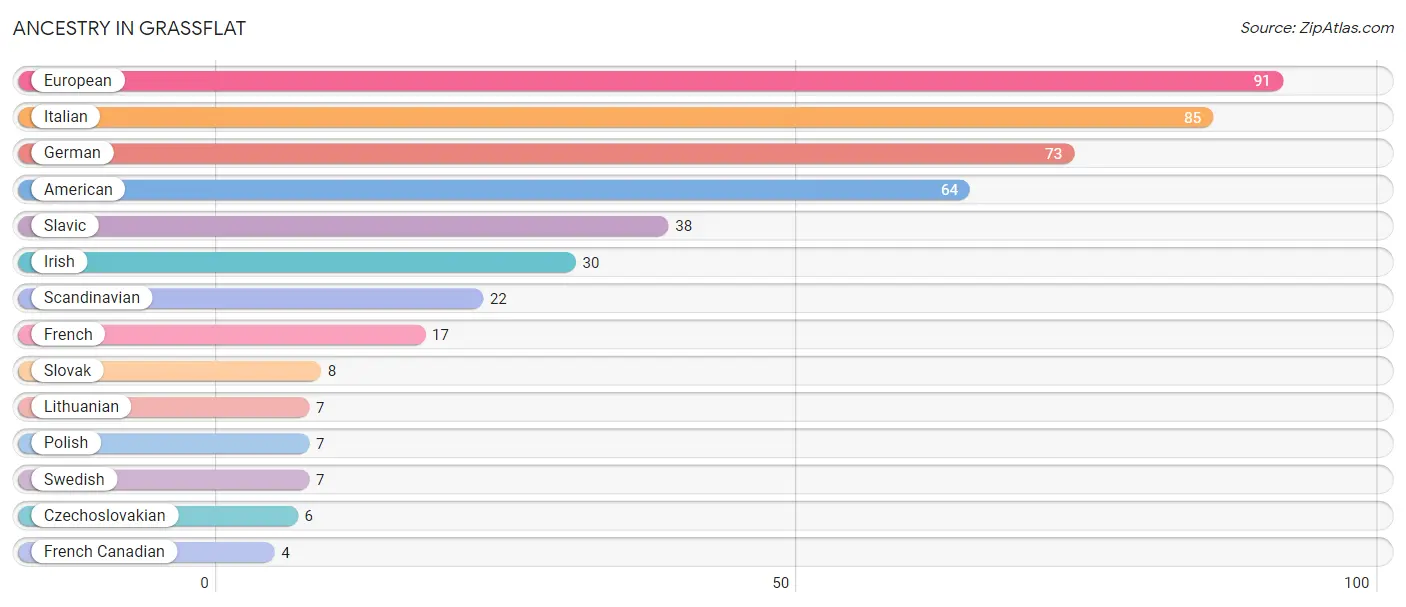
| Ancestry | # Population | % Population |
| American | 64 | 15.8% |
| Czechoslovakian | 6 | 1.5% |
| European | 91 | 22.4% |
| French | 17 | 4.2% |
| French Canadian | 4 | 1.0% |
| German | 73 | 18.0% |
| Irish | 30 | 7.4% |
| Italian | 85 | 20.9% |
| Lithuanian | 7 | 1.7% |
| Polish | 7 | 1.7% |
| Scandinavian | 22 | 5.4% |
| Slavic | 38 | 9.4% |
| Slovak | 8 | 2.0% |
| Swedish | 7 | 1.7% | View All 14 Rows |
Immigrants in Grassflat

| Immigration Origin | # Population | % Population | View All 0 Rows |
Sex and Age in Grassflat
Sex and Age in Grassflat
The most populous age groups in Grassflat are 35 to 39 Years (37 | 18.0%) for men and 10 to 14 Years (26 | 13.0%) for women.
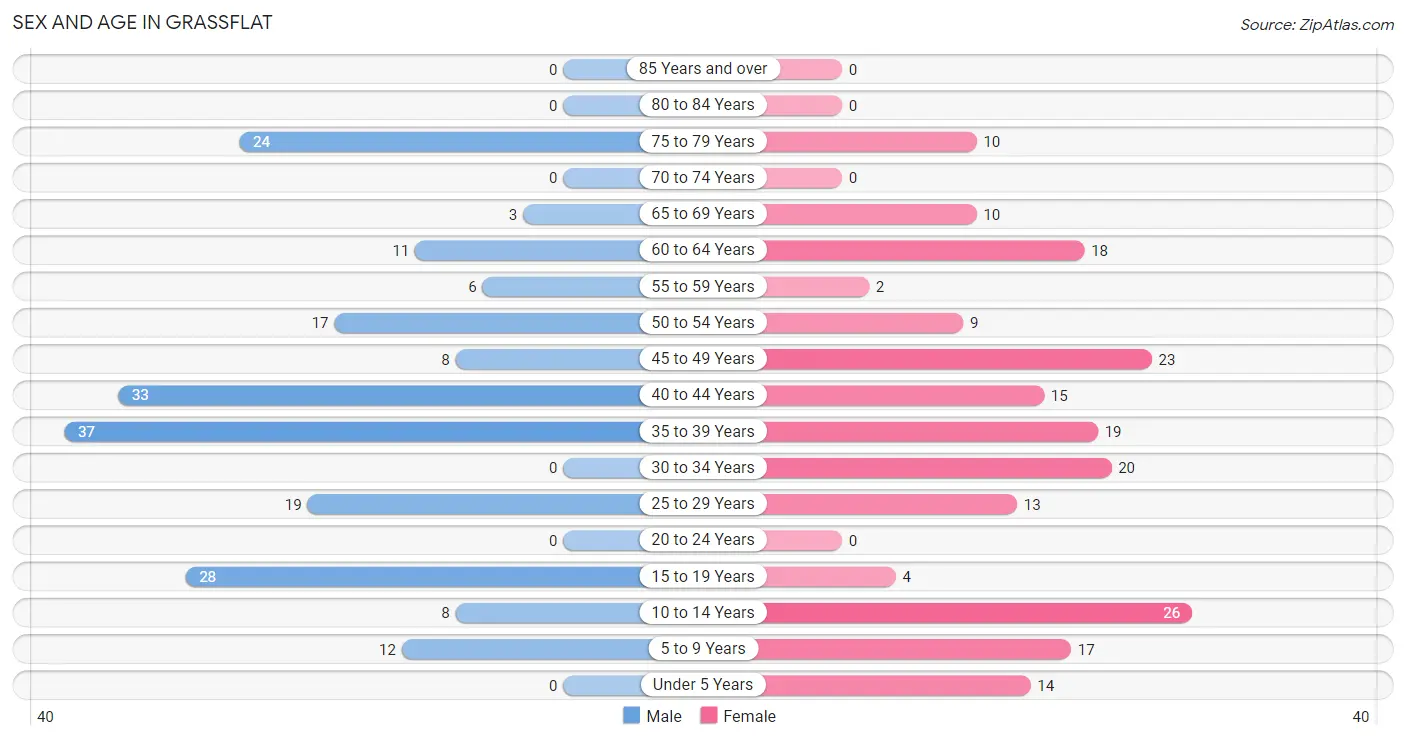
| Age Bracket | Male | Female |
| Under 5 Years | 0 (0.0%) | 14 (7.0%) |
| 5 to 9 Years | 12 (5.8%) | 17 (8.5%) |
| 10 to 14 Years | 8 (3.9%) | 26 (13.0%) |
| 15 to 19 Years | 28 (13.6%) | 4 (2.0%) |
| 20 to 24 Years | 0 (0.0%) | 0 (0.0%) |
| 25 to 29 Years | 19 (9.2%) | 13 (6.5%) |
| 30 to 34 Years | 0 (0.0%) | 20 (10.0%) |
| 35 to 39 Years | 37 (18.0%) | 19 (9.5%) |
| 40 to 44 Years | 33 (16.0%) | 15 (7.5%) |
| 45 to 49 Years | 8 (3.9%) | 23 (11.5%) |
| 50 to 54 Years | 17 (8.3%) | 9 (4.5%) |
| 55 to 59 Years | 6 (2.9%) | 2 (1.0%) |
| 60 to 64 Years | 11 (5.3%) | 18 (9.0%) |
| 65 to 69 Years | 3 (1.5%) | 10 (5.0%) |
| 70 to 74 Years | 0 (0.0%) | 0 (0.0%) |
| 75 to 79 Years | 24 (11.7%) | 10 (5.0%) |
| 80 to 84 Years | 0 (0.0%) | 0 (0.0%) |
| 85 Years and over | 0 (0.0%) | 0 (0.0%) |
| Total | 206 (100.0%) | 200 (100.0%) |
Families and Households in Grassflat
Median Family Size in Grassflat
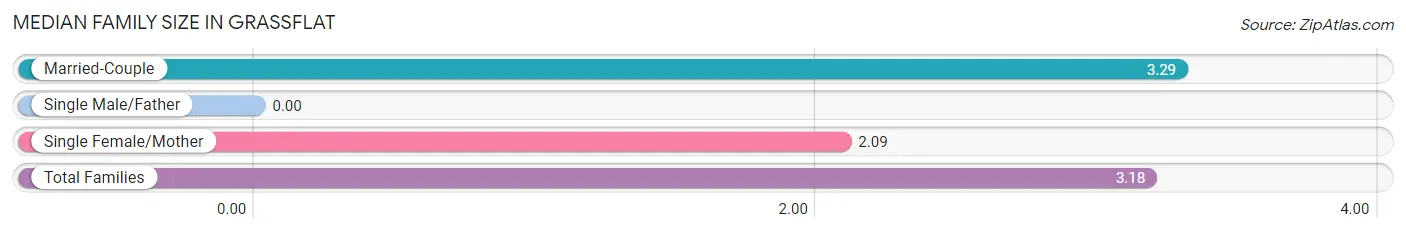
| Family Type | # Families | Family Size |
| Married-Couple | 102 (90.3%) | 3.29 |
| Single Male/Father | 0 (0.0%) | - |
| Single Female/Mother | 11 (9.7%) | 2.09 |
| Total Families | 113 (100.0%) | 3.18 |
Median Household Size in Grassflat
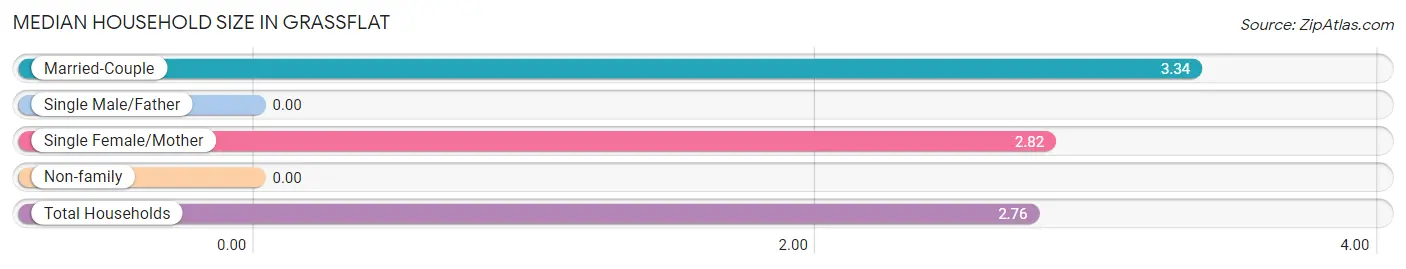
| Household Type | # Households | Household Size |
| Married-Couple | 102 (69.4%) | 3.34 |
| Single Male/Father | 0 (0.0%) | - |
| Single Female/Mother | 11 (7.5%) | 2.82 |
| Non-family | 34 (23.1%) | - |
| Total Households | 147 (100.0%) | 2.76 |
Household Size by Marriage Status in Grassflat
Out of a total of 147 households in Grassflat, 113 (76.9%) are family households, while 34 (23.1%) are nonfamily households. The most numerous type of family households are 3-person households, comprising 39, and the most common type of nonfamily households are 1-person households, comprising 34.
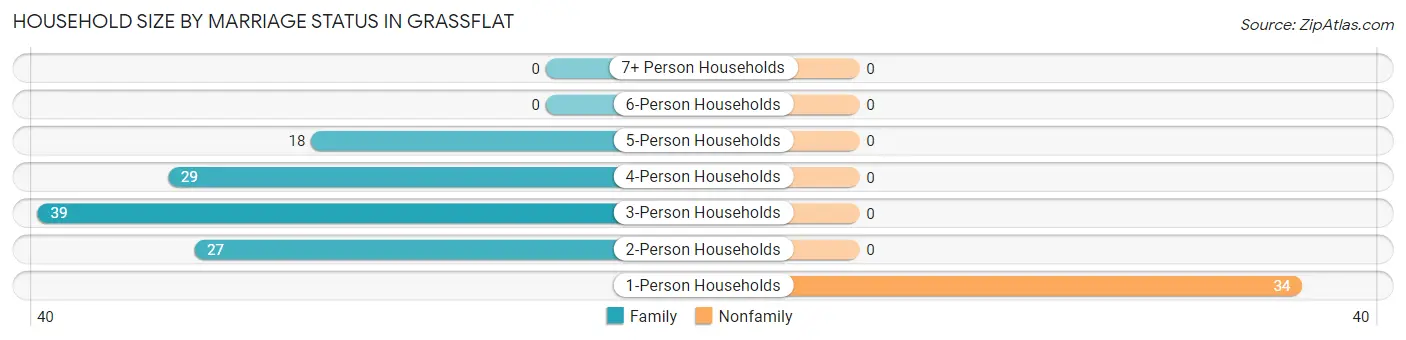
| Household Size | Family Households | Nonfamily Households |
| 1-Person Households | - | 34 (23.1%) |
| 2-Person Households | 27 (18.4%) | 0 (0.0%) |
| 3-Person Households | 39 (26.5%) | 0 (0.0%) |
| 4-Person Households | 29 (19.7%) | 0 (0.0%) |
| 5-Person Households | 18 (12.2%) | 0 (0.0%) |
| 6-Person Households | 0 (0.0%) | 0 (0.0%) |
| 7+ Person Households | 0 (0.0%) | 0 (0.0%) |
| Total | 113 (76.9%) | 34 (23.1%) |
Female Fertility in Grassflat
Fertility by Age in Grassflat

| Age Bracket | Women with Births | Births / 1,000 Women |
| 15 to 19 years | 0 (0.0%) | 0.0 |
| 20 to 34 years | 0 (0.0%) | 0.0 |
| 35 to 50 years | 0 (0.0%) | 0.0 |
| Total | 0 (0.0%) | 0.0 |
Fertility by Age by Marriage Status in Grassflat
| Age Bracket | Married | Unmarried |
| 15 to 19 years | 0 (0.0%) | 0 (0.0%) |
| 20 to 34 years | 0 (0.0%) | 0 (0.0%) |
| 35 to 50 years | 0 (0.0%) | 0 (0.0%) |
| Total | 0 (0.0%) | 0 (0.0%) |
Fertility by Education in Grassflat
| Educational Attainment | Women with Births | Births / 1,000 Women |
| Less than High School | 0 (0.0%) | 0.0 |
| High School Diploma | 0 (0.0%) | 0.0 |
| College or Associate's Degree | 0 (0.0%) | 0.0 |
| Bachelor's Degree | 0 (0.0%) | 0.0 |
| Graduate Degree | 0 (0.0%) | 0.0 |
| Total | 0 (0.0%) | 0.0 |
Fertility by Education by Marriage Status in Grassflat
| Educational Attainment | Married | Unmarried |
| Less than High School | 0 (0.0%) | 0 (0.0%) |
| High School Diploma | 0 (0.0%) | 0 (0.0%) |
| College or Associate's Degree | 0 (0.0%) | 0 (0.0%) |
| Bachelor's Degree | 0 (0.0%) | 0 (0.0%) |
| Graduate Degree | 0 (0.0%) | 0 (0.0%) |
| Total | 0 (0.0%) | 0 (0.0%) |
Employment Characteristics in Grassflat
Employment by Class of Employer in Grassflat
Among the 188 employed individuals in Grassflat, private company employees (82 | 43.6%), not-for-profit organizations (32 | 17.0%), and state government employees (25 | 13.3%) make up the most common classes of employment.
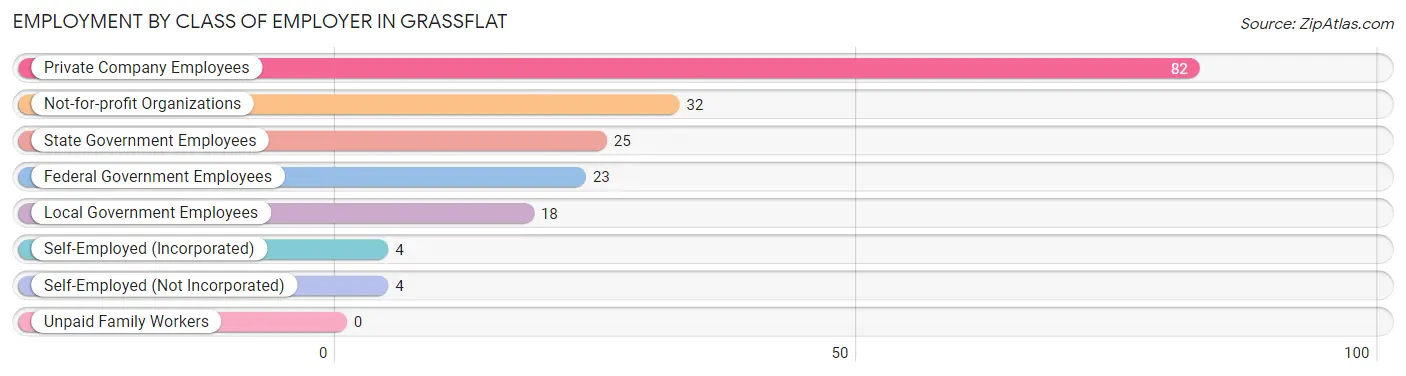
| Employer Class | # Employees | % Employees |
| Private Company Employees | 82 | 43.6% |
| Self-Employed (Incorporated) | 4 | 2.1% |
| Self-Employed (Not Incorporated) | 4 | 2.1% |
| Not-for-profit Organizations | 32 | 17.0% |
| Local Government Employees | 18 | 9.6% |
| State Government Employees | 25 | 13.3% |
| Federal Government Employees | 23 | 12.2% |
| Unpaid Family Workers | 0 | 0.0% |
| Total | 188 | 100.0% |
Employment Status by Age in Grassflat
According to the labor force statistics for Grassflat, out of the total population over 16 years of age (329), 60.8% or 200 individuals are in the labor force, with 6.6% or 13 of them unemployed. The age group with the highest labor force participation rate is 30 to 34 years, with 100.0% or 20 individuals in the labor force. Within the labor force, the 16 to 19 years age range has the highest percentage of unemployed individuals, with 50.0% or 4 of them being unemployed.
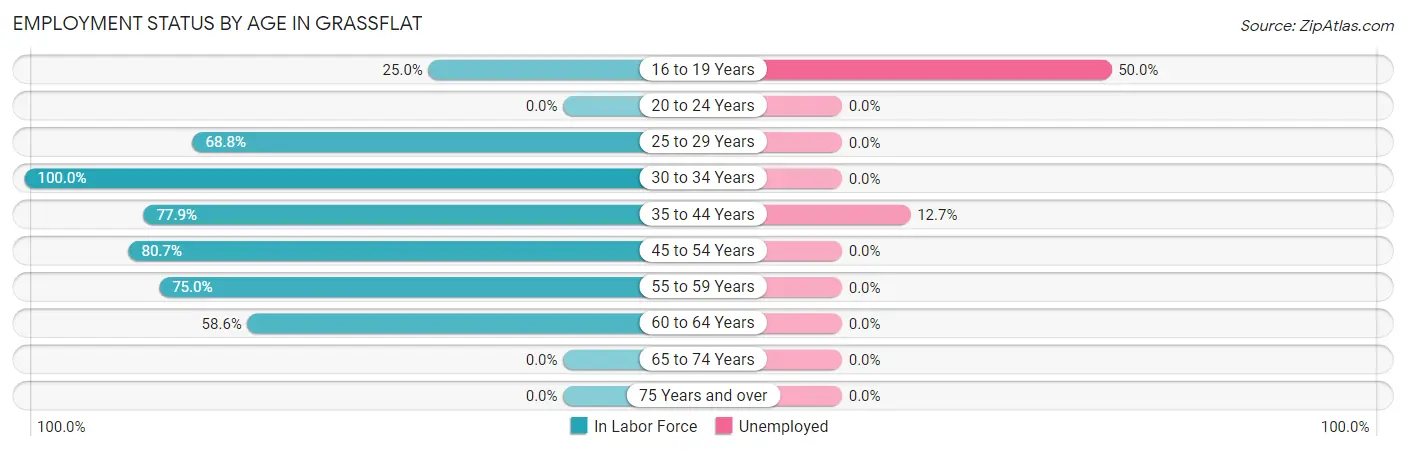
| Age Bracket | In Labor Force | Unemployed |
| 16 to 19 Years | 8 (25.0%) | 4 (50.0%) |
| 20 to 24 Years | 0 (0.0%) | 0 (0.0%) |
| 25 to 29 Years | 22 (68.8%) | 0 (0.0%) |
| 30 to 34 Years | 20 (100.0%) | 0 (0.0%) |
| 35 to 44 Years | 81 (77.9%) | 10 (12.7%) |
| 45 to 54 Years | 46 (80.7%) | 0 (0.0%) |
| 55 to 59 Years | 6 (75.0%) | 0 (0.0%) |
| 60 to 64 Years | 17 (58.6%) | 0 (0.0%) |
| 65 to 74 Years | 0 (0.0%) | 0 (0.0%) |
| 75 Years and over | 0 (0.0%) | 0 (0.0%) |
| Total | 200 (60.8%) | 13 (6.6%) |
Employment Status by Educational Attainment in Grassflat
According to labor force statistics for Grassflat, 76.8% of individuals (192) out of the total population between 25 and 64 years of age (250) are in the labor force, with 4.6% or 9 of them being unemployed. The group with the highest labor force participation rate are those with the educational attainment of less than high school, with 100.0% or 16 individuals in the labor force. Within the labor force, individuals with less than high school education have the highest percentage of unemployment, with 50.0% or 8 of them being unemployed.

| Educational Attainment | In Labor Force | Unemployed |
| Less than High School | 16 (100.0%) | 8 (50.0%) |
| High School Diploma | 80 (85.1%) | 0 (0.0%) |
| College / Associate Degree | 40 (50.0%) | 0 (0.0%) |
| Bachelor's Degree or higher | 56 (93.3%) | 0 (0.0%) |
| Total | 192 (76.8%) | 12 (4.6%) |
Employment Occupations by Sex in Grassflat
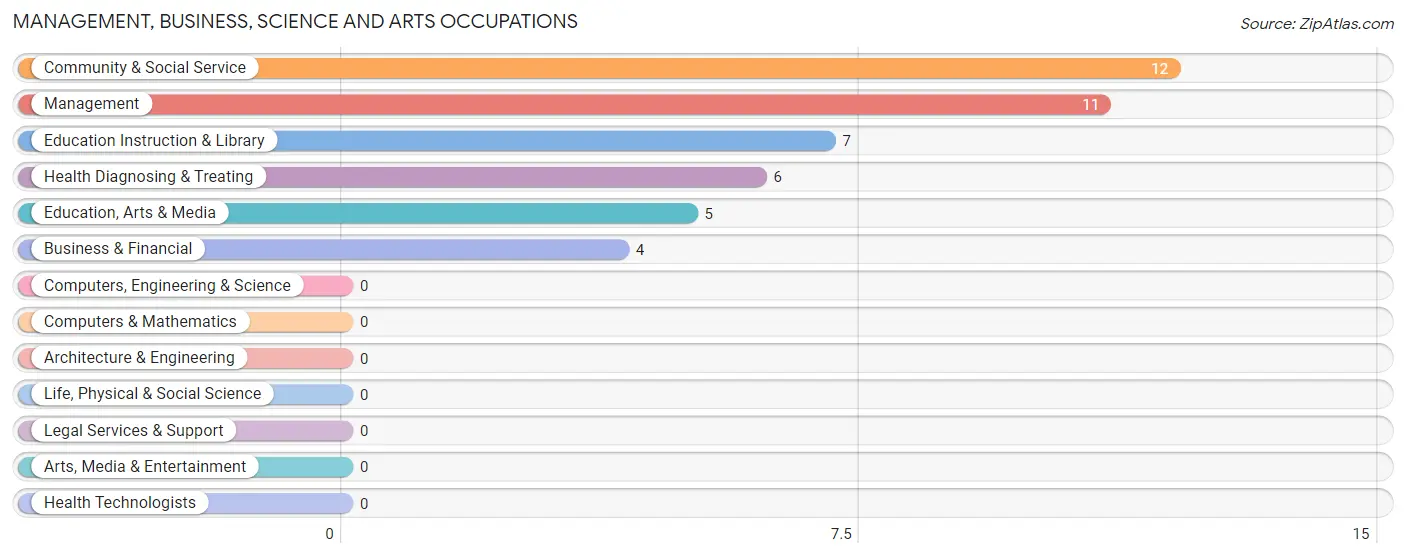
Management, Business, Science and Arts Occupations
The most common Management, Business, Science and Arts occupations in Grassflat are Community & Social Service (12 | 7.1%), Management (11 | 6.5%), Education Instruction & Library (7 | 4.1%), Health Diagnosing & Treating (6 | 3.5%), and Education, Arts & Media (5 | 2.9%).
Management, Business, Science and Arts Occupations by Sex
Within the Management, Business, Science and Arts occupations in Grassflat, the most male-oriented occupations are Management (100.0%), Business & Financial (100.0%), and Education Instruction & Library (100.0%), while the most female-oriented occupations are Education, Arts & Media (100.0%), Health Diagnosing & Treating (100.0%), and Community & Social Service (41.7%).
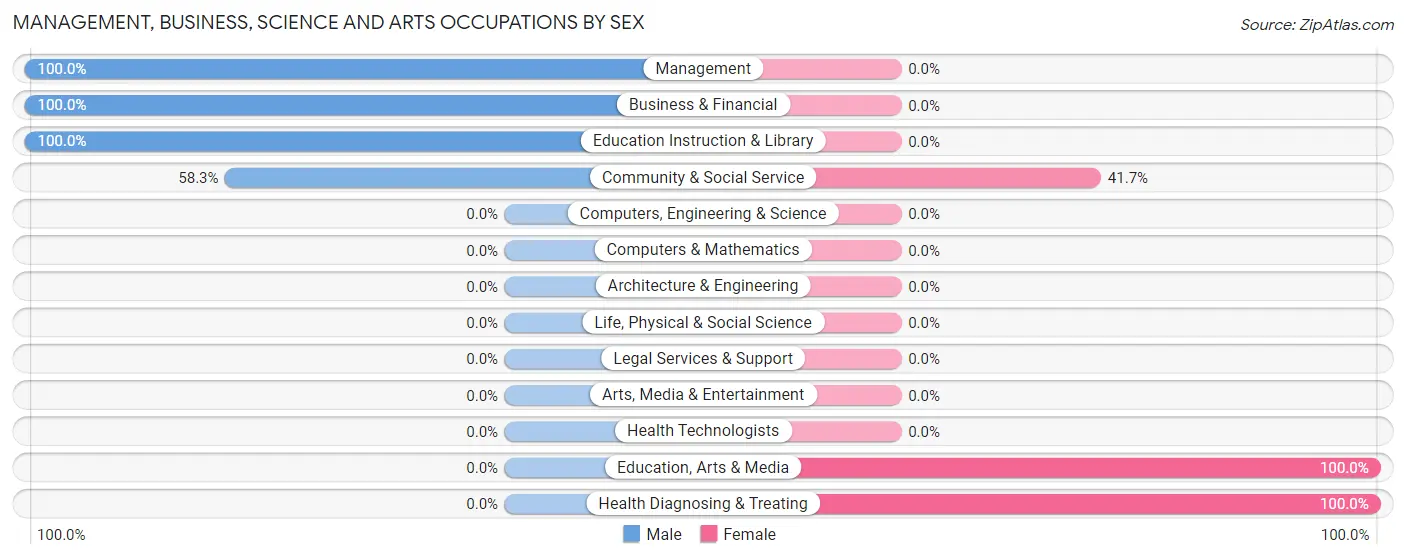
| Occupation | Male | Female |
| Management | 11 (100.0%) | 0 (0.0%) |
| Business & Financial | 4 (100.0%) | 0 (0.0%) |
| Computers, Engineering & Science | 0 (0.0%) | 0 (0.0%) |
| Computers & Mathematics | 0 (0.0%) | 0 (0.0%) |
| Architecture & Engineering | 0 (0.0%) | 0 (0.0%) |
| Life, Physical & Social Science | 0 (0.0%) | 0 (0.0%) |
| Community & Social Service | 7 (58.3%) | 5 (41.7%) |
| Education, Arts & Media | 0 (0.0%) | 5 (100.0%) |
| Legal Services & Support | 0 (0.0%) | 0 (0.0%) |
| Education Instruction & Library | 7 (100.0%) | 0 (0.0%) |
| Arts, Media & Entertainment | 0 (0.0%) | 0 (0.0%) |
| Health Diagnosing & Treating | 0 (0.0%) | 6 (100.0%) |
| Health Technologists | 0 (0.0%) | 0 (0.0%) |
| Total (Category) | 22 (66.7%) | 11 (33.3%) |
| Total (Overall) | 95 (55.9%) | 75 (44.1%) |
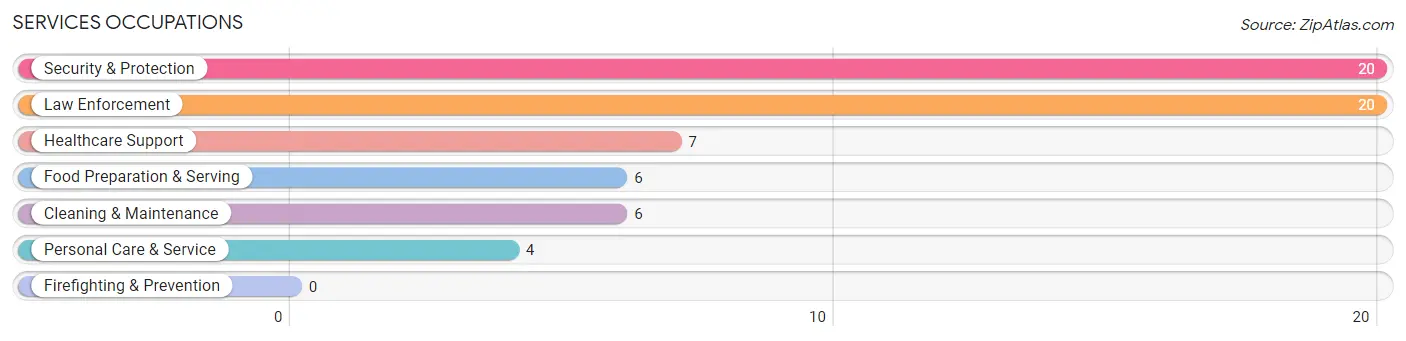
Services Occupations
The most common Services occupations in Grassflat are Security & Protection (20 | 11.8%), Law Enforcement (20 | 11.8%), Healthcare Support (7 | 4.1%), Food Preparation & Serving (6 | 3.5%), and Cleaning & Maintenance (6 | 3.5%).
Services Occupations by Sex
Within the Services occupations in Grassflat, the most male-oriented occupations are Security & Protection (100.0%), Law Enforcement (100.0%), and Cleaning & Maintenance (100.0%), while the most female-oriented occupations are Healthcare Support (100.0%), Personal Care & Service (100.0%), and Food Preparation & Serving (66.7%).
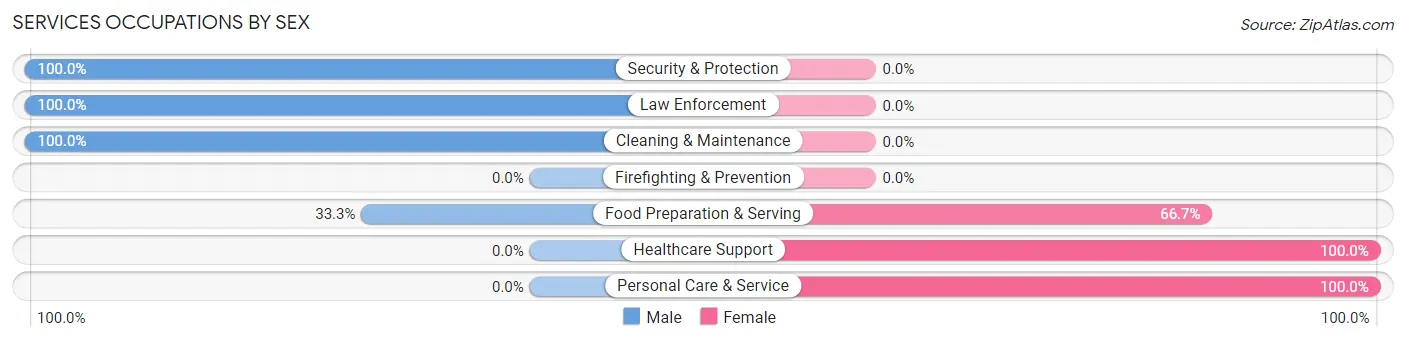
| Occupation | Male | Female |
| Healthcare Support | 0 (0.0%) | 7 (100.0%) |
| Security & Protection | 20 (100.0%) | 0 (0.0%) |
| Firefighting & Prevention | 0 (0.0%) | 0 (0.0%) |
| Law Enforcement | 20 (100.0%) | 0 (0.0%) |
| Food Preparation & Serving | 2 (33.3%) | 4 (66.7%) |
| Cleaning & Maintenance | 6 (100.0%) | 0 (0.0%) |
| Personal Care & Service | 0 (0.0%) | 4 (100.0%) |
| Total (Category) | 28 (65.1%) | 15 (34.9%) |
| Total (Overall) | 95 (55.9%) | 75 (44.1%) |
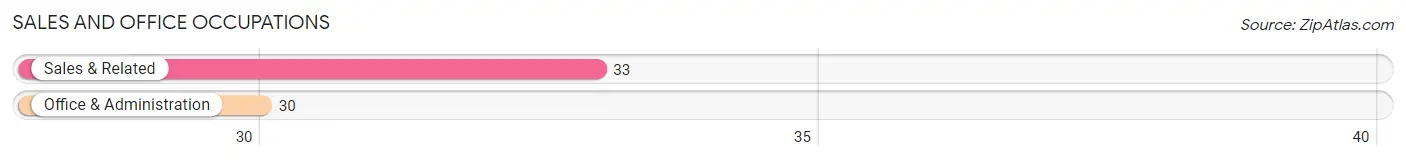
Sales and Office Occupations
The most common Sales and Office occupations in Grassflat are Sales & Related (33 | 19.4%), and Office & Administration (30 | 17.6%).
Sales and Office Occupations by Sex
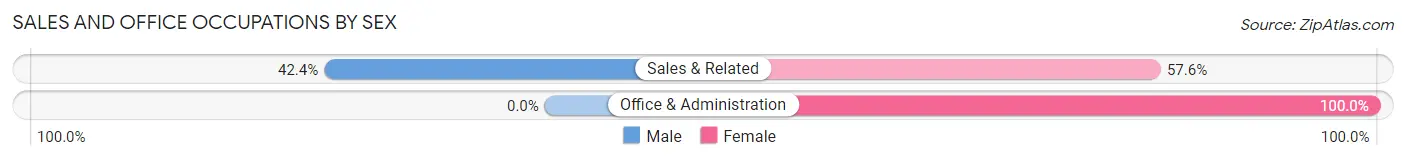
| Occupation | Male | Female |
| Sales & Related | 14 (42.4%) | 19 (57.6%) |
| Office & Administration | 0 (0.0%) | 30 (100.0%) |
| Total (Category) | 14 (22.2%) | 49 (77.8%) |
| Total (Overall) | 95 (55.9%) | 75 (44.1%) |
Natural Resources, Construction and Maintenance Occupations
The most common Natural Resources, Construction and Maintenance occupations in Grassflat are , and Installation, Maintenance & Repair (8 | 4.7%).
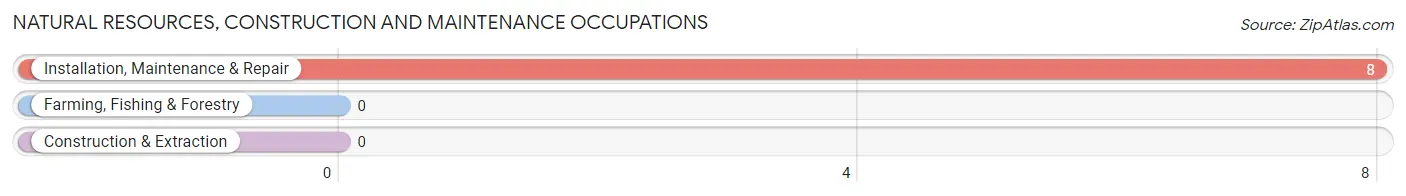
Natural Resources, Construction and Maintenance Occupations by Sex
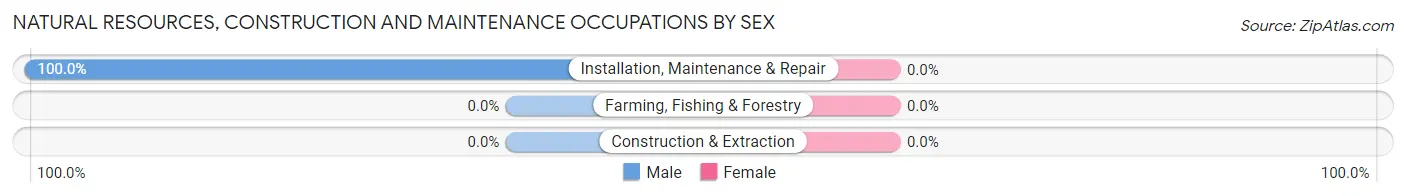
| Occupation | Male | Female |
| Farming, Fishing & Forestry | 0 (0.0%) | 0 (0.0%) |
| Construction & Extraction | 0 (0.0%) | 0 (0.0%) |
| Installation, Maintenance & Repair | 8 (100.0%) | 0 (0.0%) |
| Total (Category) | 8 (100.0%) | 0 (0.0%) |
| Total (Overall) | 95 (55.9%) | 75 (44.1%) |
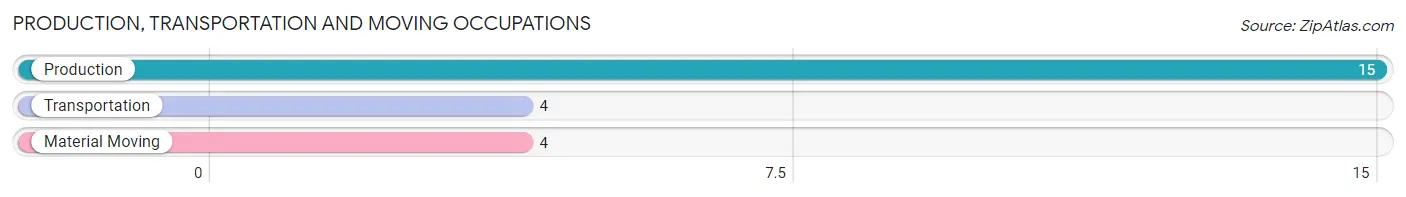
Production, Transportation and Moving Occupations
The most common Production, Transportation and Moving occupations in Grassflat are Production (15 | 8.8%), Transportation (4 | 2.4%), and Material Moving (4 | 2.4%).
Production, Transportation and Moving Occupations by Sex
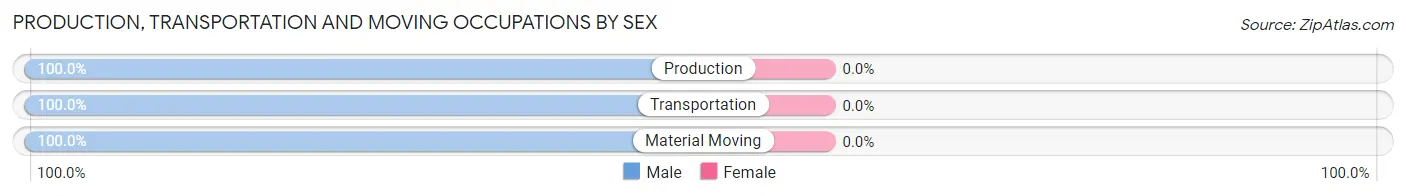
| Occupation | Male | Female |
| Production | 15 (100.0%) | 0 (0.0%) |
| Transportation | 4 (100.0%) | 0 (0.0%) |
| Material Moving | 4 (100.0%) | 0 (0.0%) |
| Total (Category) | 23 (100.0%) | 0 (0.0%) |
| Total (Overall) | 95 (55.9%) | 75 (44.1%) |
Employment Industries by Sex in Grassflat
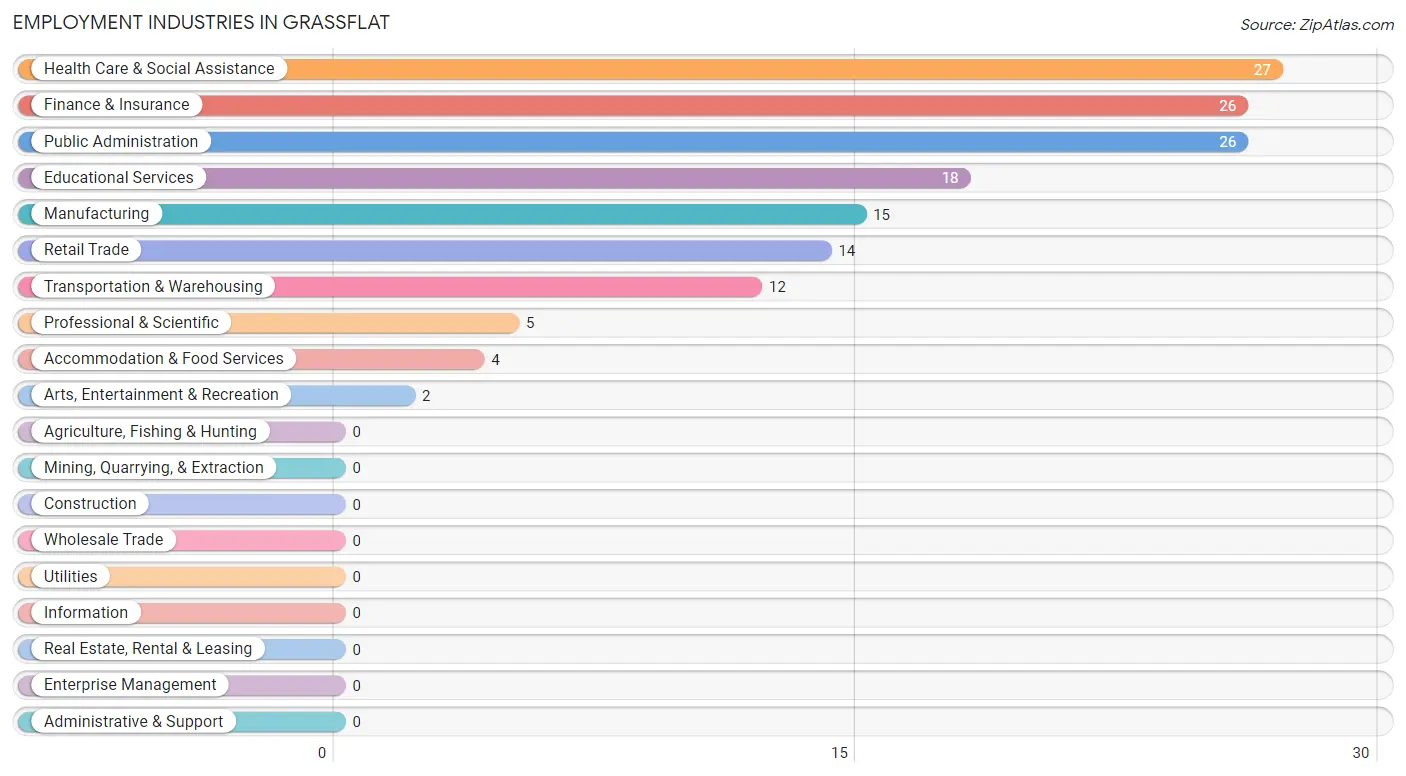
Employment Industries in Grassflat
The major employment industries in Grassflat include Health Care & Social Assistance (27 | 15.9%), Finance & Insurance (26 | 15.3%), Public Administration (26 | 15.3%), Educational Services (18 | 10.6%), and Manufacturing (15 | 8.8%).
Employment Industries by Sex in Grassflat
The Grassflat industries that see more men than women are Manufacturing (100.0%), Transportation & Warehousing (100.0%), and Educational Services (100.0%), whereas the industries that tend to have a higher number of women are Finance & Insurance (100.0%), Professional & Scientific (100.0%), and Accommodation & Food Services (100.0%).
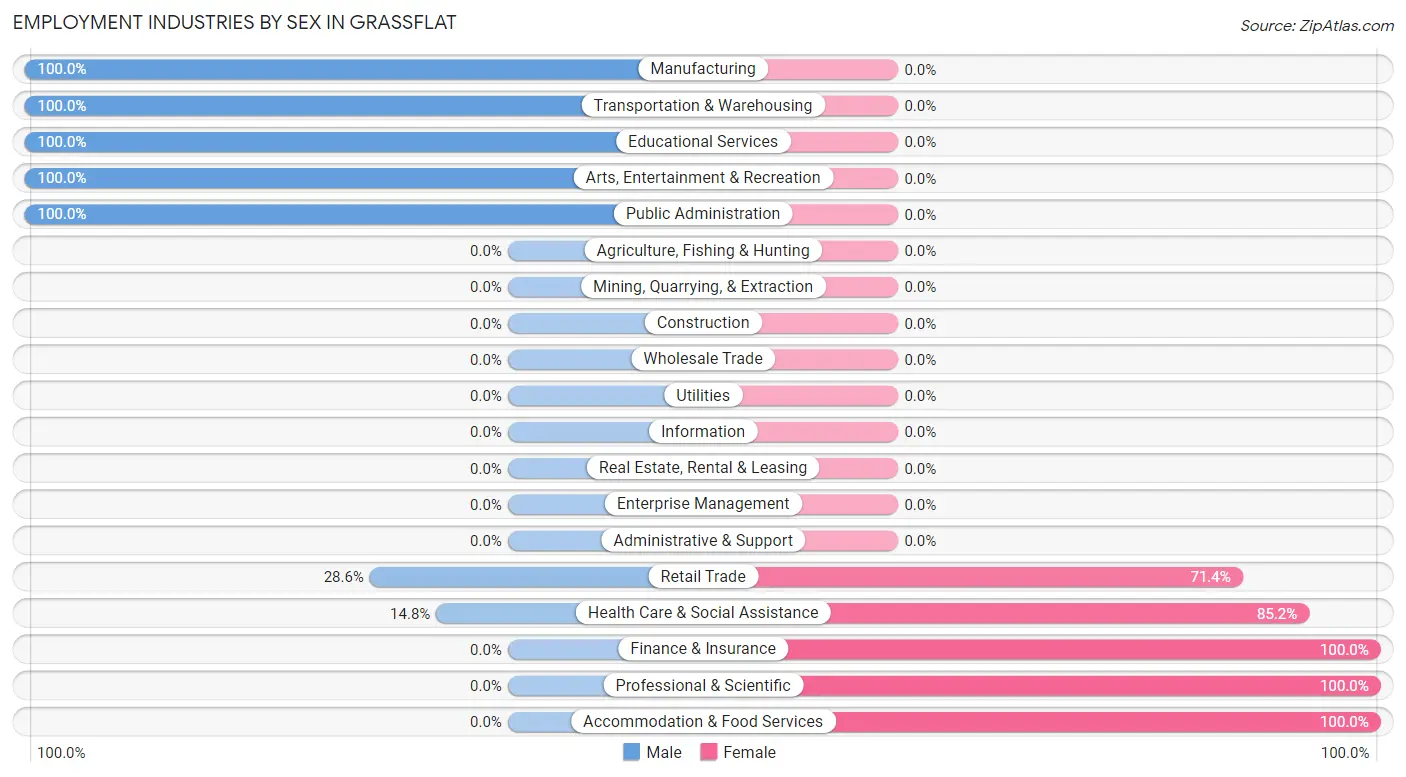
| Industry | Male | Female |
| Agriculture, Fishing & Hunting | 0 (0.0%) | 0 (0.0%) |
| Mining, Quarrying, & Extraction | 0 (0.0%) | 0 (0.0%) |
| Construction | 0 (0.0%) | 0 (0.0%) |
| Manufacturing | 15 (100.0%) | 0 (0.0%) |
| Wholesale Trade | 0 (0.0%) | 0 (0.0%) |
| Retail Trade | 4 (28.6%) | 10 (71.4%) |
| Transportation & Warehousing | 12 (100.0%) | 0 (0.0%) |
| Utilities | 0 (0.0%) | 0 (0.0%) |
| Information | 0 (0.0%) | 0 (0.0%) |
| Finance & Insurance | 0 (0.0%) | 26 (100.0%) |
| Real Estate, Rental & Leasing | 0 (0.0%) | 0 (0.0%) |
| Professional & Scientific | 0 (0.0%) | 5 (100.0%) |
| Enterprise Management | 0 (0.0%) | 0 (0.0%) |
| Administrative & Support | 0 (0.0%) | 0 (0.0%) |
| Educational Services | 18 (100.0%) | 0 (0.0%) |
| Health Care & Social Assistance | 4 (14.8%) | 23 (85.2%) |
| Arts, Entertainment & Recreation | 2 (100.0%) | 0 (0.0%) |
| Accommodation & Food Services | 0 (0.0%) | 4 (100.0%) |
| Public Administration | 26 (100.0%) | 0 (0.0%) |
| Total | 95 (55.9%) | 75 (44.1%) |
Education in Grassflat
School Enrollment in Grassflat
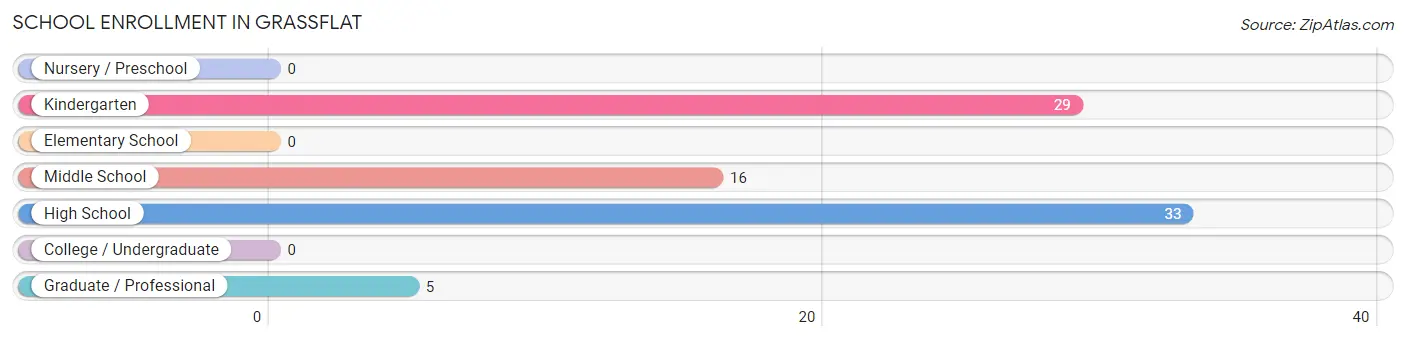
The most common levels of schooling among the 83 students in Grassflat are high school (33 | 39.8%), kindergarten (29 | 34.9%), and middle school (16 | 19.3%).
| School Level | # Students | % Students |
| Nursery / Preschool | 0 | 0.0% |
| Kindergarten | 29 | 34.9% |
| Elementary School | 0 | 0.0% |
| Middle School | 16 | 19.3% |
| High School | 33 | 39.8% |
| College / Undergraduate | 0 | 0.0% |
| Graduate / Professional | 5 | 6.0% |
| Total | 83 | 100.0% |
School Enrollment by Age by Funding Source in Grassflat
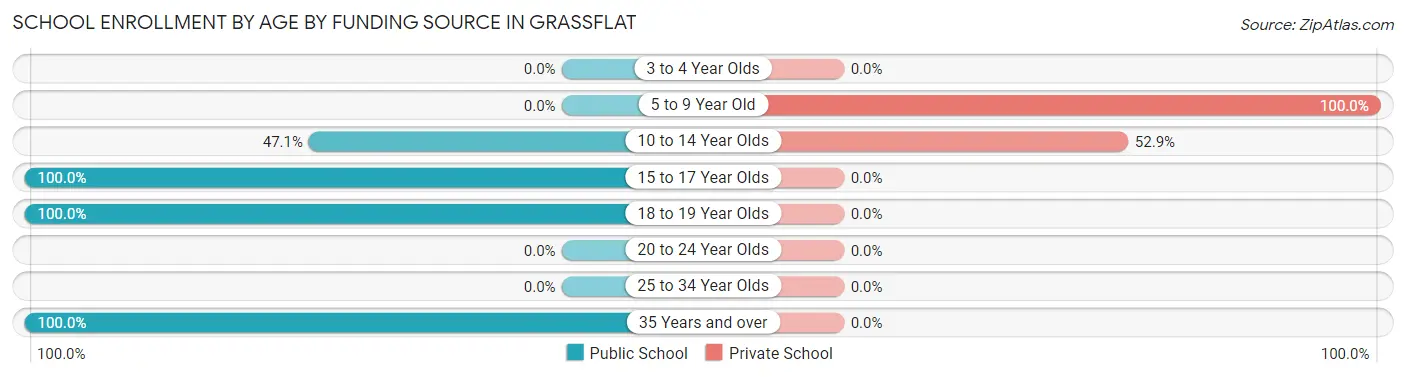
Out of a total of 83 students who are enrolled in schools in Grassflat, 47 (56.6%) attend a private institution, while the remaining 36 (43.4%) are enrolled in public schools. The age group of 5 to 9 year old has the highest likelihood of being enrolled in private schools, with 29 (100.0% in the age bracket) enrolled. Conversely, the age group of 15 to 17 year olds has the lowest likelihood of being enrolled in a private school, with 4 (100.0% in the age bracket) attending a public institution.
| Age Bracket | Public School | Private School |
| 3 to 4 Year Olds | 0 (0.0%) | 0 (0.0%) |
| 5 to 9 Year Old | 0 (0.0%) | 29 (100.0%) |
| 10 to 14 Year Olds | 16 (47.1%) | 18 (52.9%) |
| 15 to 17 Year Olds | 4 (100.0%) | 0 (0.0%) |
| 18 to 19 Year Olds | 11 (100.0%) | 0 (0.0%) |
| 20 to 24 Year Olds | 0 (0.0%) | 0 (0.0%) |
| 25 to 34 Year Olds | 0 (0.0%) | 0 (0.0%) |
| 35 Years and over | 5 (100.0%) | 0 (0.0%) |
| Total | 36 (43.4%) | 47 (56.6%) |
Educational Attainment by Field of Study in Grassflat
Bio, nature & agricultural (18 | 26.5%), liberal arts & history (15 | 22.1%), business (11 | 16.2%), education (11 | 16.2%), and psychology (5 | 7.3%) are the most common fields of study among 68 individuals in Grassflat who have obtained a bachelor's degree or higher.
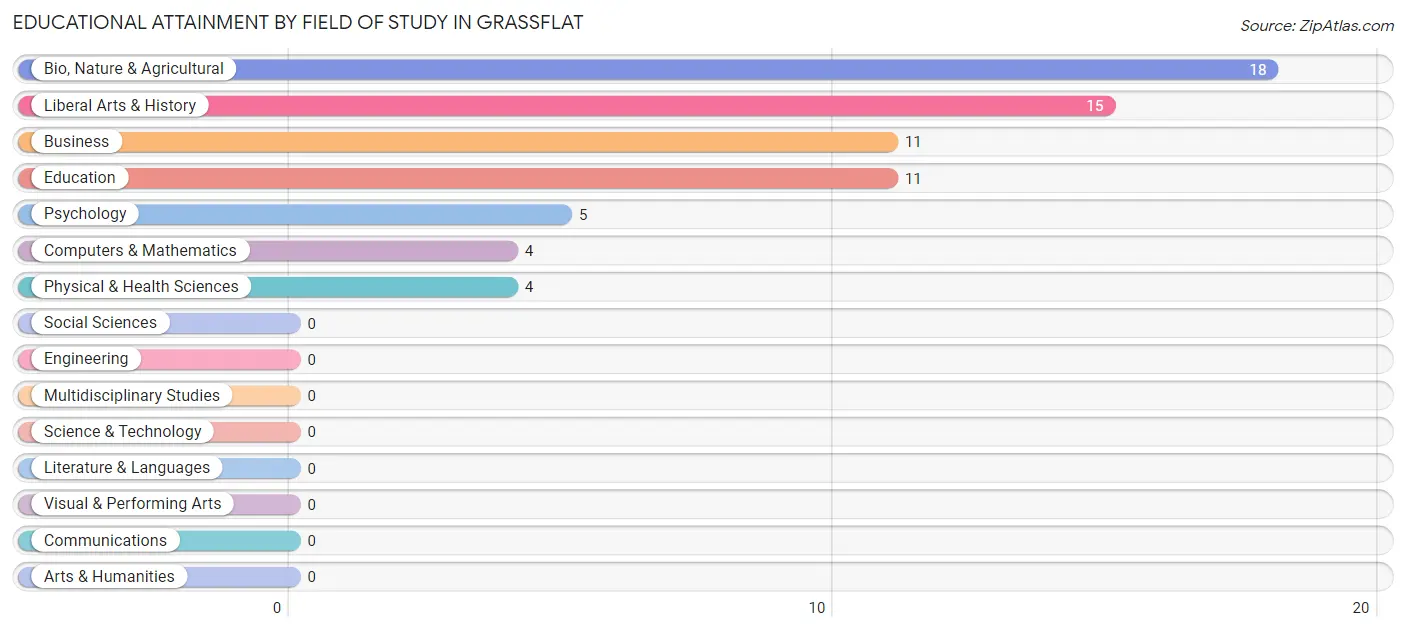
| Field of Study | # Graduates | % Graduates |
| Computers & Mathematics | 4 | 5.9% |
| Bio, Nature & Agricultural | 18 | 26.5% |
| Physical & Health Sciences | 4 | 5.9% |
| Psychology | 5 | 7.3% |
| Social Sciences | 0 | 0.0% |
| Engineering | 0 | 0.0% |
| Multidisciplinary Studies | 0 | 0.0% |
| Science & Technology | 0 | 0.0% |
| Business | 11 | 16.2% |
| Education | 11 | 16.2% |
| Literature & Languages | 0 | 0.0% |
| Liberal Arts & History | 15 | 22.1% |
| Visual & Performing Arts | 0 | 0.0% |
| Communications | 0 | 0.0% |
| Arts & Humanities | 0 | 0.0% |
| Total | 68 | 100.0% |
Transportation & Commute in Grassflat
Vehicle Availability by Sex in Grassflat
The most prevalent vehicle ownership categories in Grassflat are males with 3 vehicles (41, accounting for 36.3%) and females with 3 vehicles (5, making up 54.7%).
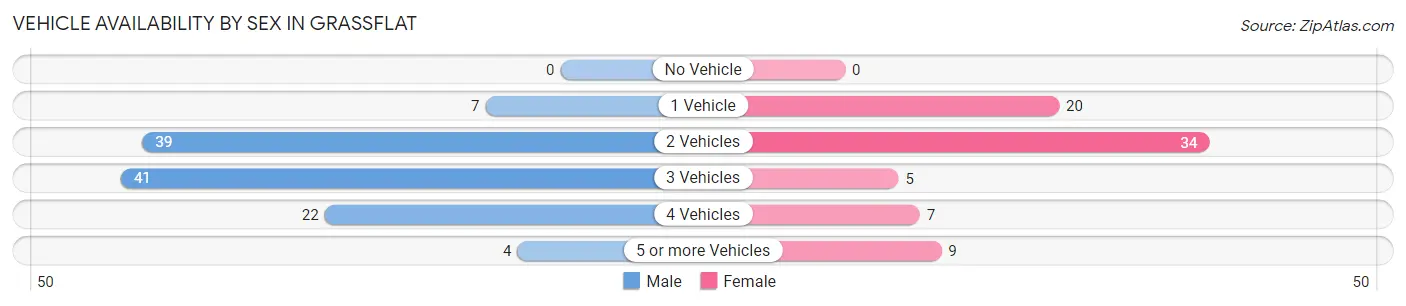
| Vehicles Available | Male | Female |
| No Vehicle | 0 (0.0%) | 0 (0.0%) |
| 1 Vehicle | 7 (6.2%) | 20 (26.7%) |
| 2 Vehicles | 39 (34.5%) | 34 (45.3%) |
| 3 Vehicles | 41 (36.3%) | 5 (6.7%) |
| 4 Vehicles | 22 (19.5%) | 7 (9.3%) |
| 5 or more Vehicles | 4 (3.5%) | 9 (12.0%) |
| Total | 113 (100.0%) | 75 (100.0%) |
Commute Time in Grassflat
The most frequently occuring commute durations in Grassflat are 30 to 34 minutes (39 commuters, 21.4%), 25 to 29 minutes (34 commuters, 18.7%), and 20 to 24 minutes (26 commuters, 14.3%).
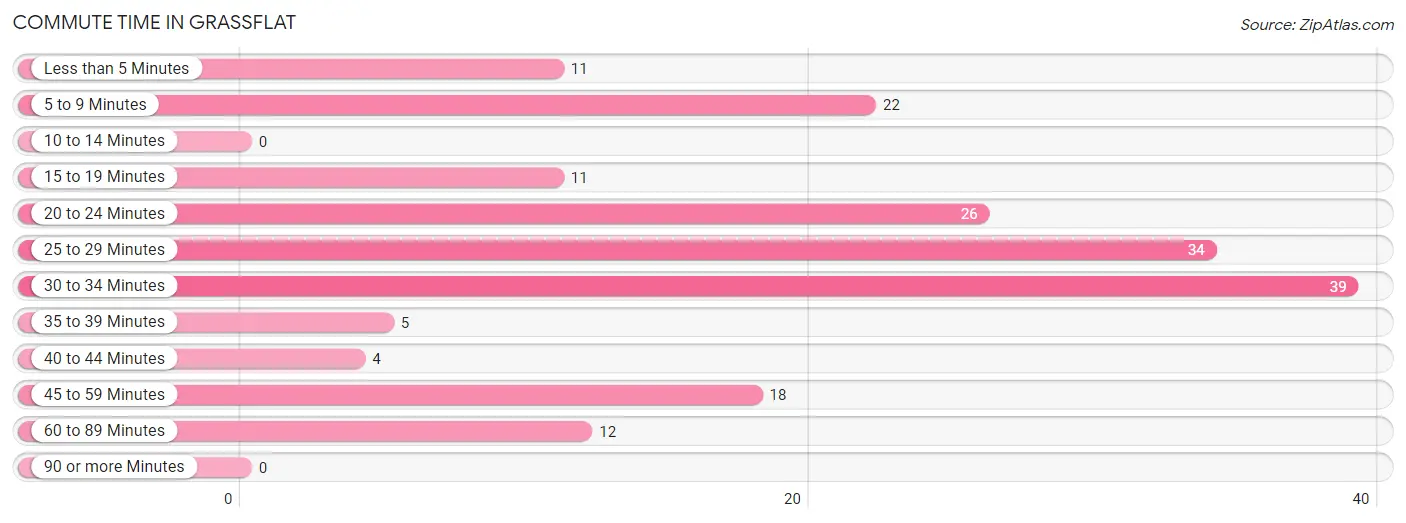
| Commute Time | # Commuters | % Commuters |
| Less than 5 Minutes | 11 | 6.0% |
| 5 to 9 Minutes | 22 | 12.1% |
| 10 to 14 Minutes | 0 | 0.0% |
| 15 to 19 Minutes | 11 | 6.0% |
| 20 to 24 Minutes | 26 | 14.3% |
| 25 to 29 Minutes | 34 | 18.7% |
| 30 to 34 Minutes | 39 | 21.4% |
| 35 to 39 Minutes | 5 | 2.8% |
| 40 to 44 Minutes | 4 | 2.2% |
| 45 to 59 Minutes | 18 | 9.9% |
| 60 to 89 Minutes | 12 | 6.6% |
| 90 or more Minutes | 0 | 0.0% |
Commute Time by Sex in Grassflat
The most common commute times in Grassflat are 30 to 34 minutes (29 commuters, 25.7%) for males and 25 to 29 minutes (23 commuters, 33.3%) for females.
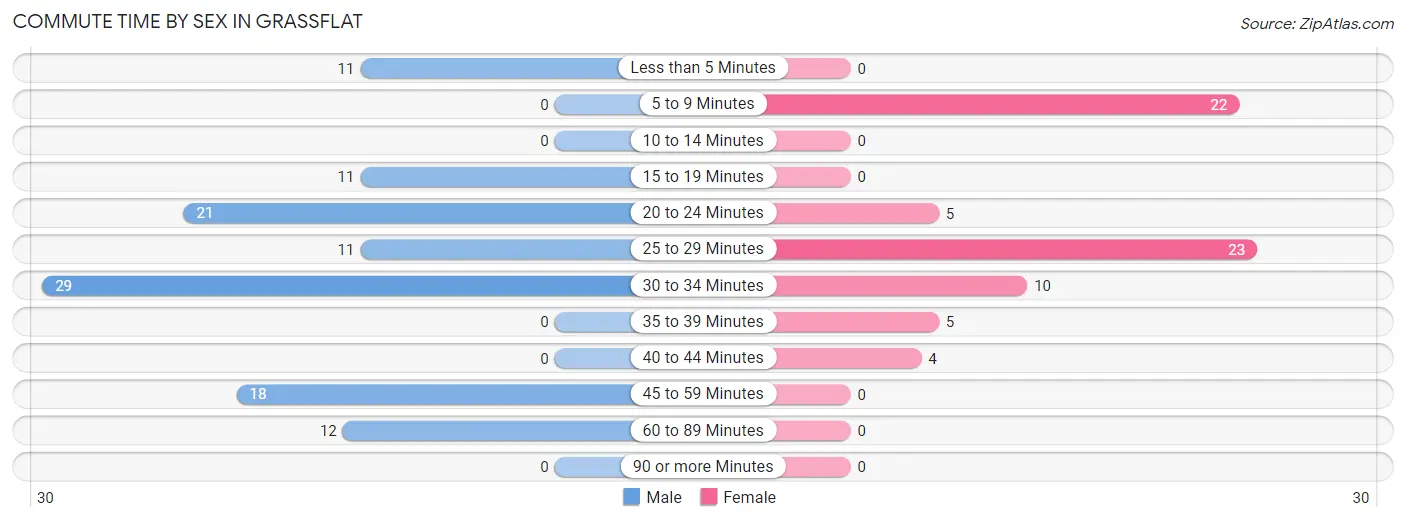
| Commute Time | Male | Female |
| Less than 5 Minutes | 11 (9.7%) | 0 (0.0%) |
| 5 to 9 Minutes | 0 (0.0%) | 22 (31.9%) |
| 10 to 14 Minutes | 0 (0.0%) | 0 (0.0%) |
| 15 to 19 Minutes | 11 (9.7%) | 0 (0.0%) |
| 20 to 24 Minutes | 21 (18.6%) | 5 (7.2%) |
| 25 to 29 Minutes | 11 (9.7%) | 23 (33.3%) |
| 30 to 34 Minutes | 29 (25.7%) | 10 (14.5%) |
| 35 to 39 Minutes | 0 (0.0%) | 5 (7.2%) |
| 40 to 44 Minutes | 0 (0.0%) | 4 (5.8%) |
| 45 to 59 Minutes | 18 (15.9%) | 0 (0.0%) |
| 60 to 89 Minutes | 12 (10.6%) | 0 (0.0%) |
| 90 or more Minutes | 0 (0.0%) | 0 (0.0%) |
Time of Departure to Work by Sex in Grassflat
The most frequent times of departure to work in Grassflat are 6:00 AM to 6:29 AM (46, 40.7%) for males and 8:00 AM to 8:29 AM (15, 21.7%) for females.
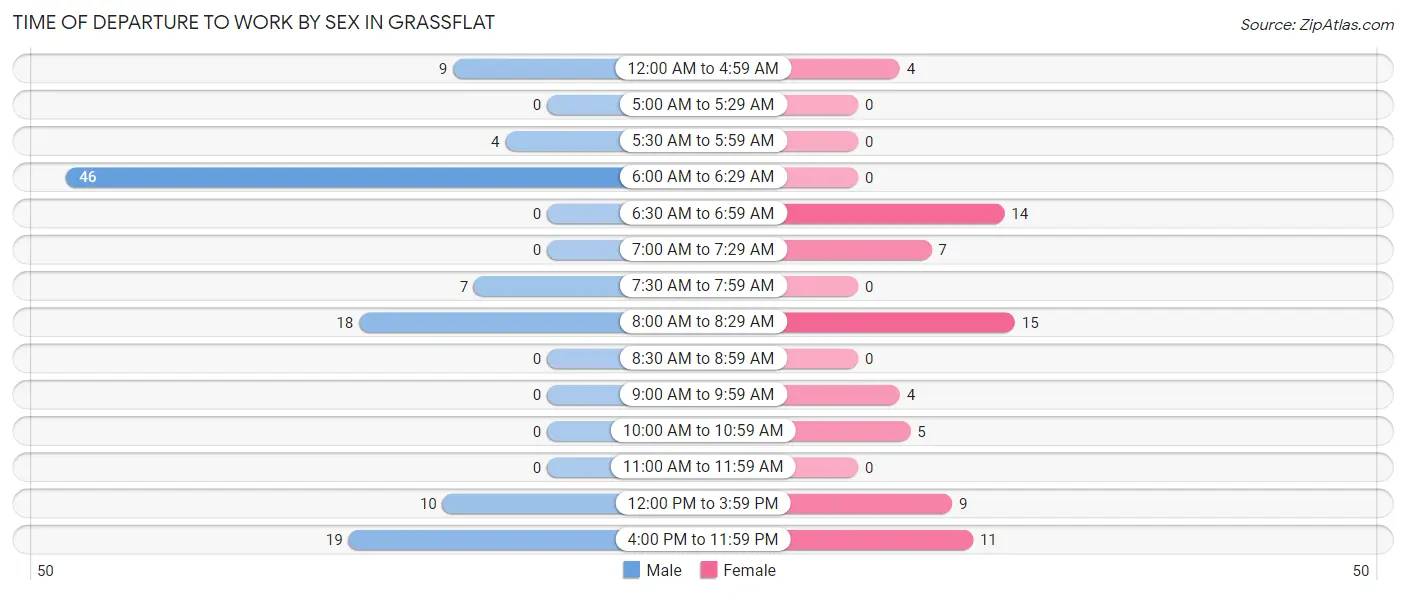
| Time of Departure | Male | Female |
| 12:00 AM to 4:59 AM | 9 (8.0%) | 4 (5.8%) |
| 5:00 AM to 5:29 AM | 0 (0.0%) | 0 (0.0%) |
| 5:30 AM to 5:59 AM | 4 (3.5%) | 0 (0.0%) |
| 6:00 AM to 6:29 AM | 46 (40.7%) | 0 (0.0%) |
| 6:30 AM to 6:59 AM | 0 (0.0%) | 14 (20.3%) |
| 7:00 AM to 7:29 AM | 0 (0.0%) | 7 (10.1%) |
| 7:30 AM to 7:59 AM | 7 (6.2%) | 0 (0.0%) |
| 8:00 AM to 8:29 AM | 18 (15.9%) | 15 (21.7%) |
| 8:30 AM to 8:59 AM | 0 (0.0%) | 0 (0.0%) |
| 9:00 AM to 9:59 AM | 0 (0.0%) | 4 (5.8%) |
| 10:00 AM to 10:59 AM | 0 (0.0%) | 5 (7.2%) |
| 11:00 AM to 11:59 AM | 0 (0.0%) | 0 (0.0%) |
| 12:00 PM to 3:59 PM | 10 (8.8%) | 9 (13.0%) |
| 4:00 PM to 11:59 PM | 19 (16.8%) | 11 (15.9%) |
| Total | 113 (100.0%) | 69 (100.0%) |
Housing Occupancy in Grassflat
Occupancy by Ownership in Grassflat
Of the total 147 dwellings in Grassflat, owner-occupied units account for 143 (97.3%), while renter-occupied units make up 4 (2.7%).
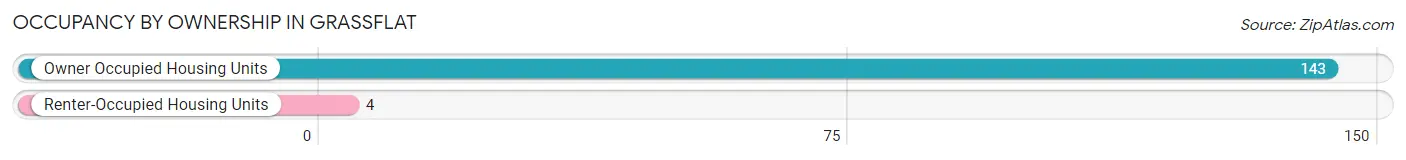
| Occupancy | # Housing Units | % Housing Units |
| Owner Occupied Housing Units | 143 | 97.3% |
| Renter-Occupied Housing Units | 4 | 2.7% |
| Total Occupied Housing Units | 147 | 100.0% |
Occupancy by Household Size in Grassflat
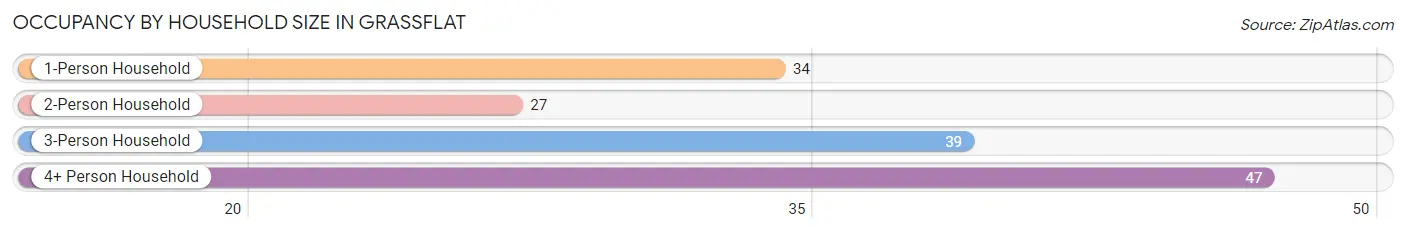
| Household Size | # Housing Units | % Housing Units |
| 1-Person Household | 34 | 23.1% |
| 2-Person Household | 27 | 18.4% |
| 3-Person Household | 39 | 26.5% |
| 4+ Person Household | 47 | 32.0% |
| Total Housing Units | 147 | 100.0% |
Occupancy by Ownership by Household Size in Grassflat
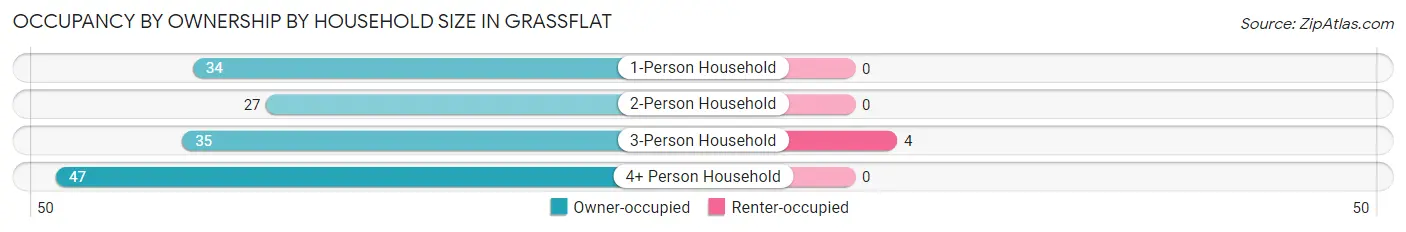
| Household Size | Owner-occupied | Renter-occupied |
| 1-Person Household | 34 (100.0%) | 0 (0.0%) |
| 2-Person Household | 27 (100.0%) | 0 (0.0%) |
| 3-Person Household | 35 (89.7%) | 4 (10.3%) |
| 4+ Person Household | 47 (100.0%) | 0 (0.0%) |
| Total Housing Units | 143 (97.3%) | 4 (2.7%) |
Occupancy by Educational Attainment in Grassflat
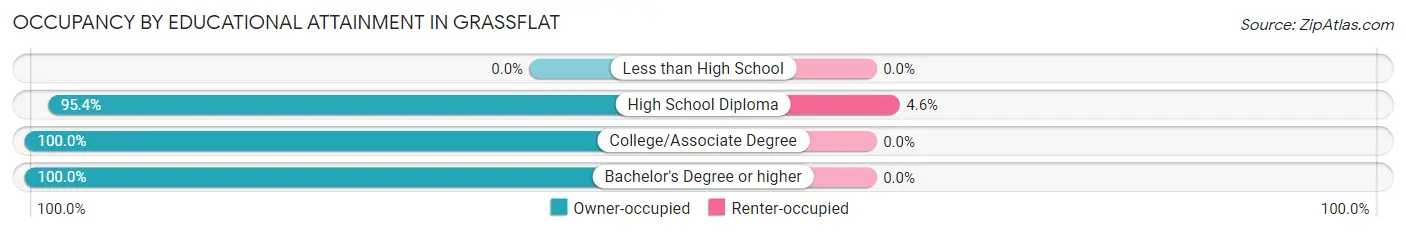
| Household Size | Owner-occupied | Renter-occupied |
| Less than High School | 0 (0.0%) | 0 (0.0%) |
| High School Diploma | 83 (95.4%) | 4 (4.6%) |
| College/Associate Degree | 38 (100.0%) | 0 (0.0%) |
| Bachelor's Degree or higher | 22 (100.0%) | 0 (0.0%) |
Occupancy by Age of Householder in Grassflat
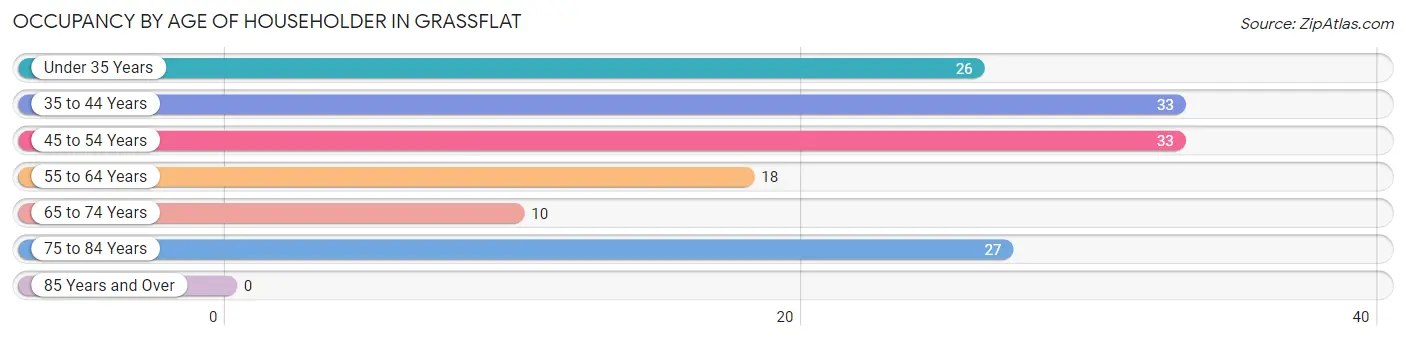
| Age Bracket | # Households | % Households |
| Under 35 Years | 26 | 17.7% |
| 35 to 44 Years | 33 | 22.5% |
| 45 to 54 Years | 33 | 22.5% |
| 55 to 64 Years | 18 | 12.2% |
| 65 to 74 Years | 10 | 6.8% |
| 75 to 84 Years | 27 | 18.4% |
| 85 Years and Over | 0 | 0.0% |
| Total | 147 | 100.0% |
Housing Finances in Grassflat
Median Income by Occupancy in Grassflat
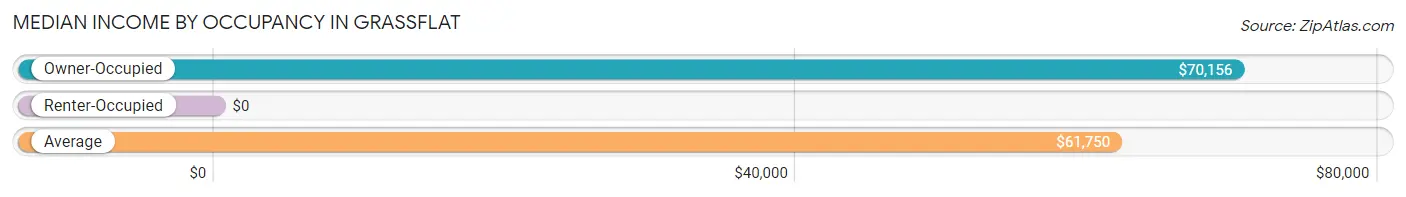
| Occupancy Type | # Households | Median Income |
| Owner-Occupied | 143 (97.3%) | $70,156 |
| Renter-Occupied | 4 (2.7%) | $0 |
| Average | 147 (100.0%) | $61,750 |
Occupancy by Householder Income Bracket in Grassflat
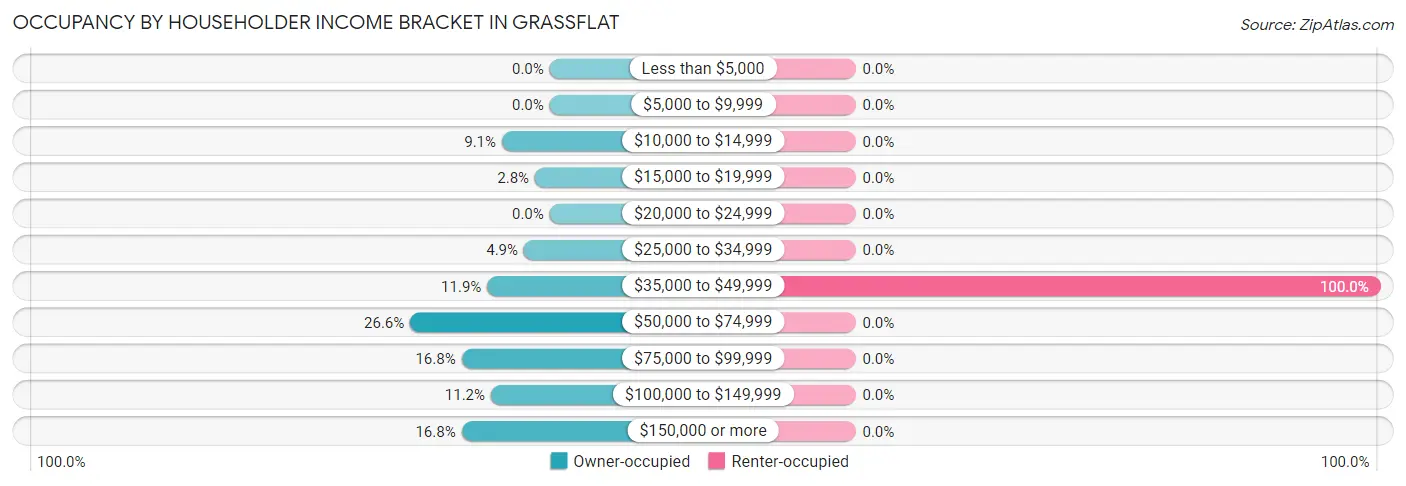
| Income Bracket | Owner-occupied | Renter-occupied |
| Less than $5,000 | 0 (0.0%) | 0 (0.0%) |
| $5,000 to $9,999 | 0 (0.0%) | 0 (0.0%) |
| $10,000 to $14,999 | 13 (9.1%) | 0 (0.0%) |
| $15,000 to $19,999 | 4 (2.8%) | 0 (0.0%) |
| $20,000 to $24,999 | 0 (0.0%) | 0 (0.0%) |
| $25,000 to $34,999 | 7 (4.9%) | 0 (0.0%) |
| $35,000 to $49,999 | 17 (11.9%) | 4 (100.0%) |
| $50,000 to $74,999 | 38 (26.6%) | 0 (0.0%) |
| $75,000 to $99,999 | 24 (16.8%) | 0 (0.0%) |
| $100,000 to $149,999 | 16 (11.2%) | 0 (0.0%) |
| $150,000 or more | 24 (16.8%) | 0 (0.0%) |
| Total | 143 (100.0%) | 4 (100.0%) |
Monthly Housing Cost Tiers in Grassflat
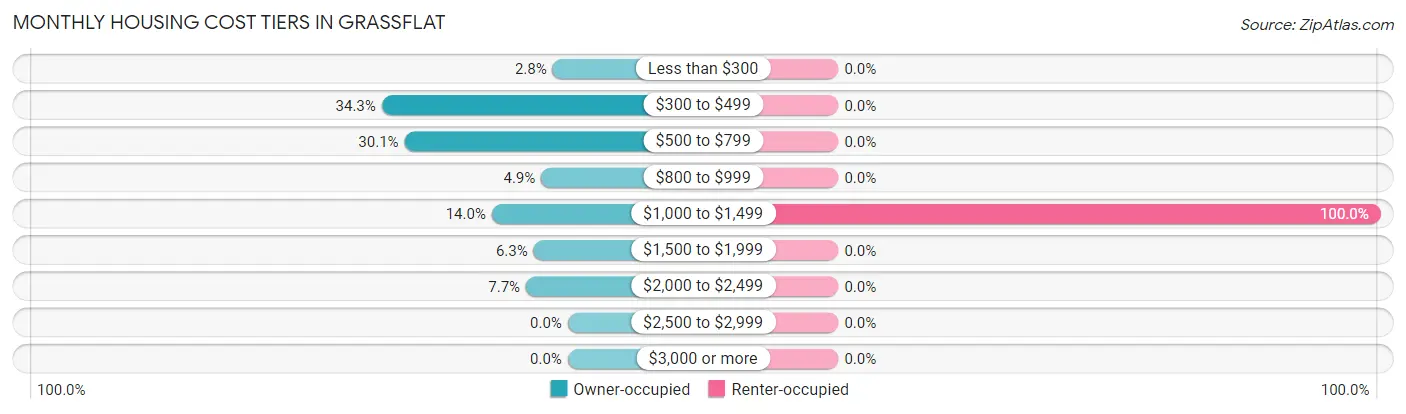
| Monthly Cost | Owner-occupied | Renter-occupied |
| Less than $300 | 4 (2.8%) | 0 (0.0%) |
| $300 to $499 | 49 (34.3%) | 0 (0.0%) |
| $500 to $799 | 43 (30.1%) | 0 (0.0%) |
| $800 to $999 | 7 (4.9%) | 0 (0.0%) |
| $1,000 to $1,499 | 20 (14.0%) | 4 (100.0%) |
| $1,500 to $1,999 | 9 (6.3%) | 0 (0.0%) |
| $2,000 to $2,499 | 11 (7.7%) | 0 (0.0%) |
| $2,500 to $2,999 | 0 (0.0%) | 0 (0.0%) |
| $3,000 or more | 0 (0.0%) | 0 (0.0%) |
| Total | 143 (100.0%) | 4 (100.0%) |
Physical Housing Characteristics in Grassflat
Housing Structures in Grassflat
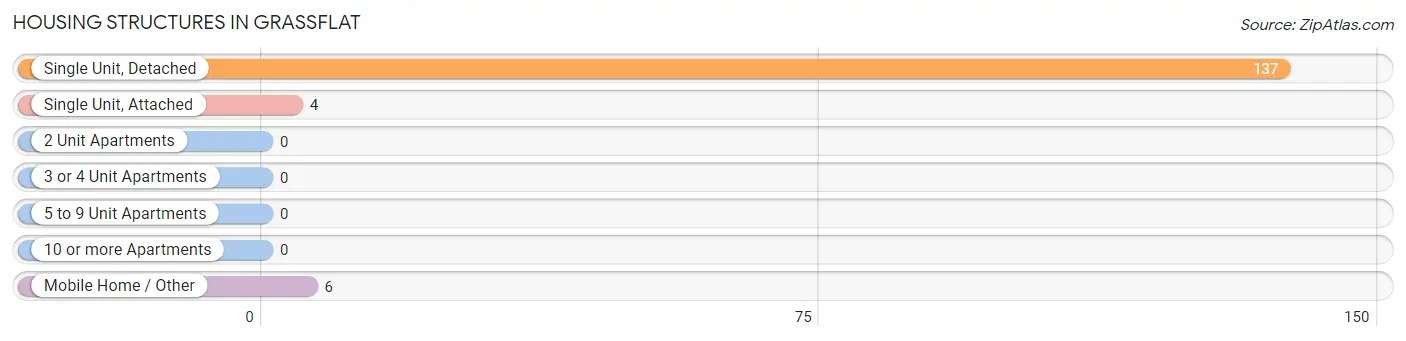
| Structure Type | # Housing Units | % Housing Units |
| Single Unit, Detached | 137 | 93.2% |
| Single Unit, Attached | 4 | 2.7% |
| 2 Unit Apartments | 0 | 0.0% |
| 3 or 4 Unit Apartments | 0 | 0.0% |
| 5 to 9 Unit Apartments | 0 | 0.0% |
| 10 or more Apartments | 0 | 0.0% |
| Mobile Home / Other | 6 | 4.1% |
| Total | 147 | 100.0% |
Housing Structures by Occupancy in Grassflat
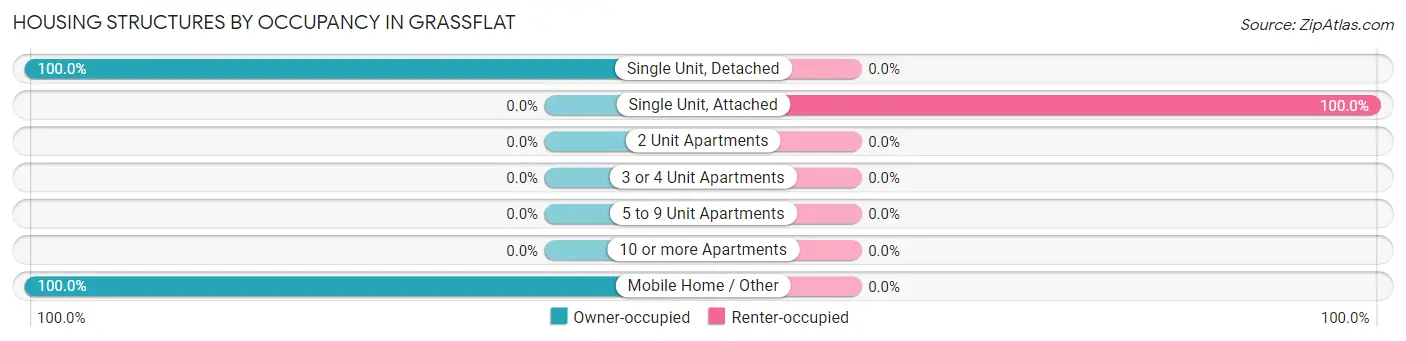
| Structure Type | Owner-occupied | Renter-occupied |
| Single Unit, Detached | 137 (100.0%) | 0 (0.0%) |
| Single Unit, Attached | 0 (0.0%) | 4 (100.0%) |
| 2 Unit Apartments | 0 (0.0%) | 0 (0.0%) |
| 3 or 4 Unit Apartments | 0 (0.0%) | 0 (0.0%) |
| 5 to 9 Unit Apartments | 0 (0.0%) | 0 (0.0%) |
| 10 or more Apartments | 0 (0.0%) | 0 (0.0%) |
| Mobile Home / Other | 6 (100.0%) | 0 (0.0%) |
| Total | 143 (97.3%) | 4 (2.7%) |
Housing Structures by Number of Rooms in Grassflat
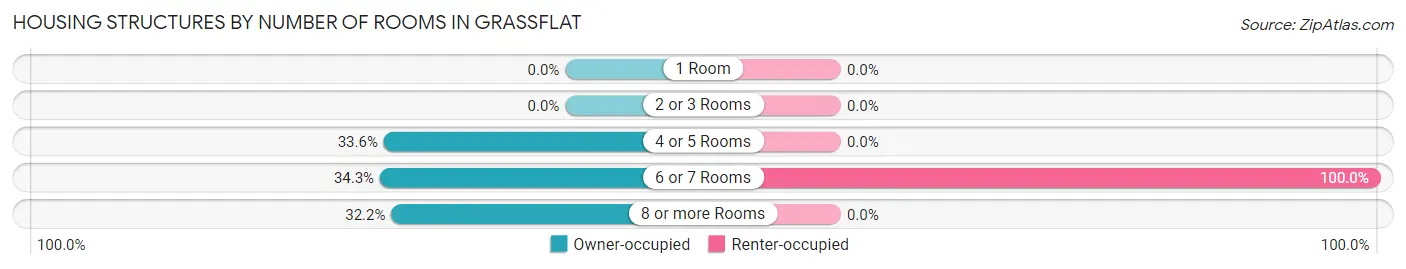
| Number of Rooms | Owner-occupied | Renter-occupied |
| 1 Room | 0 (0.0%) | 0 (0.0%) |
| 2 or 3 Rooms | 0 (0.0%) | 0 (0.0%) |
| 4 or 5 Rooms | 48 (33.6%) | 0 (0.0%) |
| 6 or 7 Rooms | 49 (34.3%) | 4 (100.0%) |
| 8 or more Rooms | 46 (32.2%) | 0 (0.0%) |
| Total | 143 (100.0%) | 4 (100.0%) |
Housing Structure by Heating Type in Grassflat
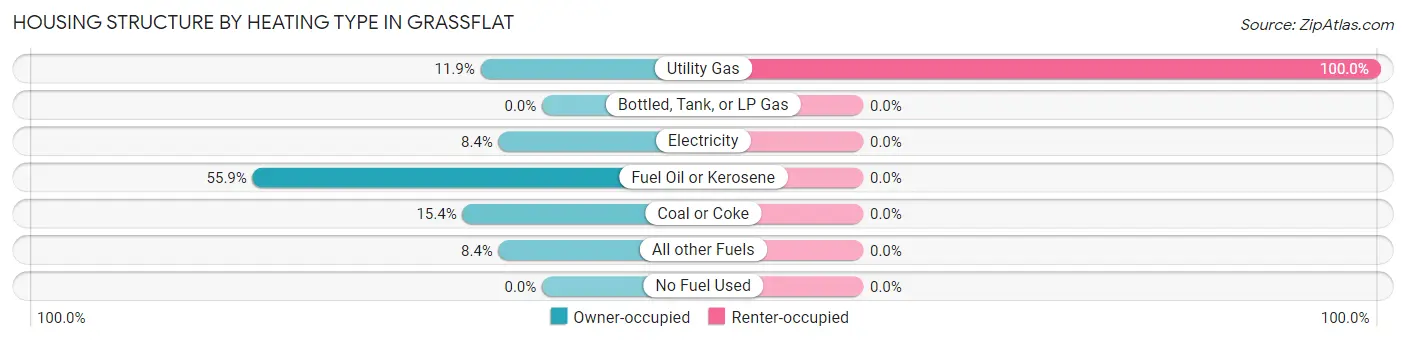
| Heating Type | Owner-occupied | Renter-occupied |
| Utility Gas | 17 (11.9%) | 4 (100.0%) |
| Bottled, Tank, or LP Gas | 0 (0.0%) | 0 (0.0%) |
| Electricity | 12 (8.4%) | 0 (0.0%) |
| Fuel Oil or Kerosene | 80 (55.9%) | 0 (0.0%) |
| Coal or Coke | 22 (15.4%) | 0 (0.0%) |
| All other Fuels | 12 (8.4%) | 0 (0.0%) |
| No Fuel Used | 0 (0.0%) | 0 (0.0%) |
| Total | 143 (100.0%) | 4 (100.0%) |
Household Vehicle Usage in Grassflat
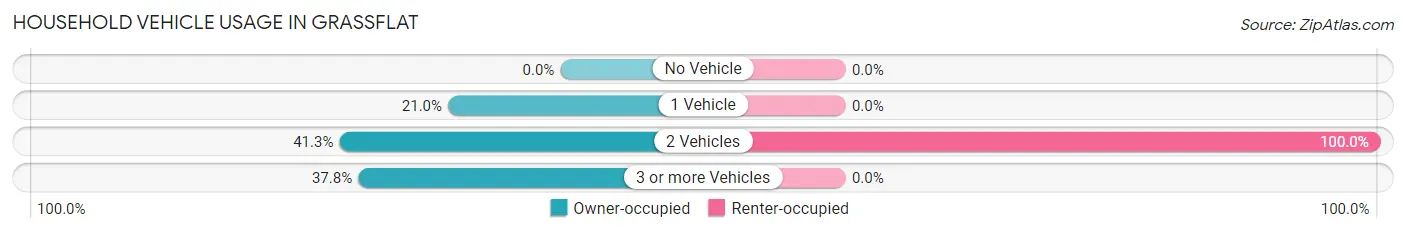
| Vehicles per Household | Owner-occupied | Renter-occupied |
| No Vehicle | 0 (0.0%) | 0 (0.0%) |
| 1 Vehicle | 30 (21.0%) | 0 (0.0%) |
| 2 Vehicles | 59 (41.3%) | 4 (100.0%) |
| 3 or more Vehicles | 54 (37.8%) | 0 (0.0%) |
| Total | 143 (100.0%) | 4 (100.0%) |
Real Estate & Mortgages in Grassflat
Real Estate and Mortgage Overview in Grassflat
| Characteristic | Without Mortgage | With Mortgage |
| Housing Units | 66 | 77 |
| Median Property Value | $148,500 | $99,700 |
| Median Household Income | - | - |
| Monthly Housing Costs | $454 | $0 |
| Real Estate Taxes | $1,667 | $0 |
Property Value by Mortgage Status in Grassflat
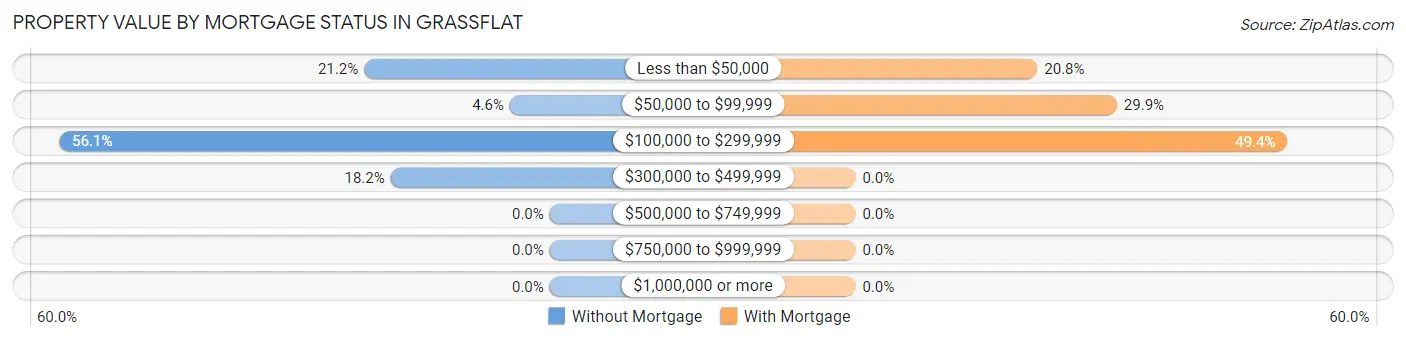
| Property Value | Without Mortgage | With Mortgage |
| Less than $50,000 | 14 (21.2%) | 16 (20.8%) |
| $50,000 to $99,999 | 3 (4.5%) | 23 (29.9%) |
| $100,000 to $299,999 | 37 (56.1%) | 38 (49.3%) |
| $300,000 to $499,999 | 12 (18.2%) | 0 (0.0%) |
| $500,000 to $749,999 | 0 (0.0%) | 0 (0.0%) |
| $750,000 to $999,999 | 0 (0.0%) | 0 (0.0%) |
| $1,000,000 or more | 0 (0.0%) | 0 (0.0%) |
| Total | 66 (100.0%) | 77 (100.0%) |
Household Income by Mortgage Status in Grassflat
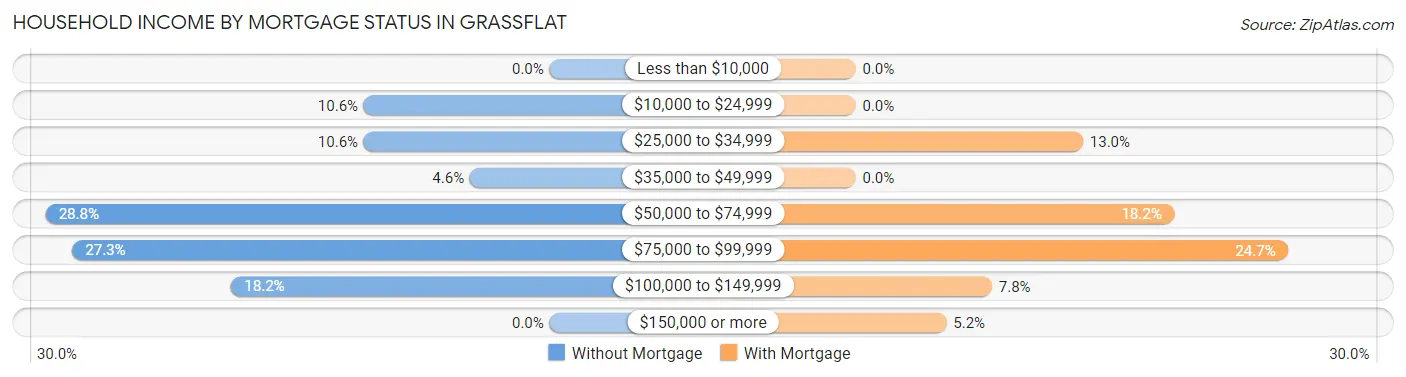
| Household Income | Without Mortgage | With Mortgage |
| Less than $10,000 | 0 (0.0%) | 0 (0.0%) |
| $10,000 to $24,999 | 7 (10.6%) | 0 (0.0%) |
| $25,000 to $34,999 | 7 (10.6%) | 10 (13.0%) |
| $35,000 to $49,999 | 3 (4.5%) | 0 (0.0%) |
| $50,000 to $74,999 | 19 (28.8%) | 14 (18.2%) |
| $75,000 to $99,999 | 18 (27.3%) | 19 (24.7%) |
| $100,000 to $149,999 | 12 (18.2%) | 6 (7.8%) |
| $150,000 or more | 0 (0.0%) | 4 (5.2%) |
| Total | 66 (100.0%) | 77 (100.0%) |
Property Value to Household Income Ratio in Grassflat
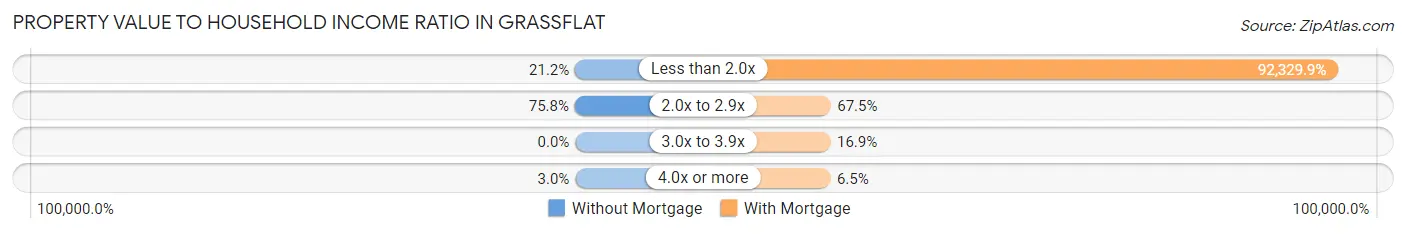
| Value-to-Income Ratio | Without Mortgage | With Mortgage |
| Less than 2.0x | 14 (21.2%) | 71,094 (92,329.9%) |
| 2.0x to 2.9x | 50 (75.8%) | 52 (67.5%) |
| 3.0x to 3.9x | 0 (0.0%) | 13 (16.9%) |
| 4.0x or more | 2 (3.0%) | 5 (6.5%) |
| Total | 66 (100.0%) | 77 (100.0%) |
Real Estate Taxes by Mortgage Status in Grassflat
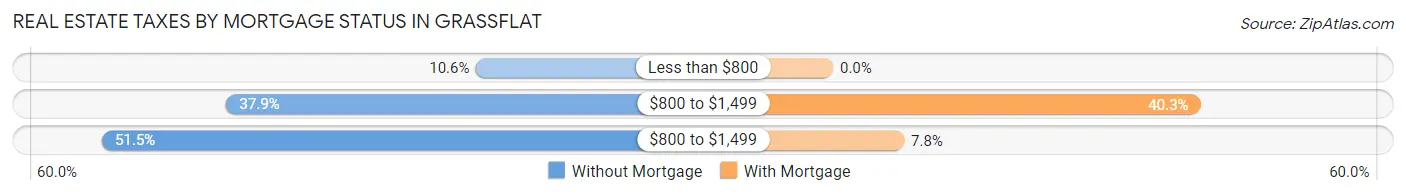
| Property Taxes | Without Mortgage | With Mortgage |
| Less than $800 | 7 (10.6%) | 0 (0.0%) |
| $800 to $1,499 | 25 (37.9%) | 31 (40.3%) |
| $800 to $1,499 | 34 (51.5%) | 6 (7.8%) |
| Total | 66 (100.0%) | 77 (100.0%) |
Health & Disability in Grassflat
Health Insurance Coverage by Age in Grassflat
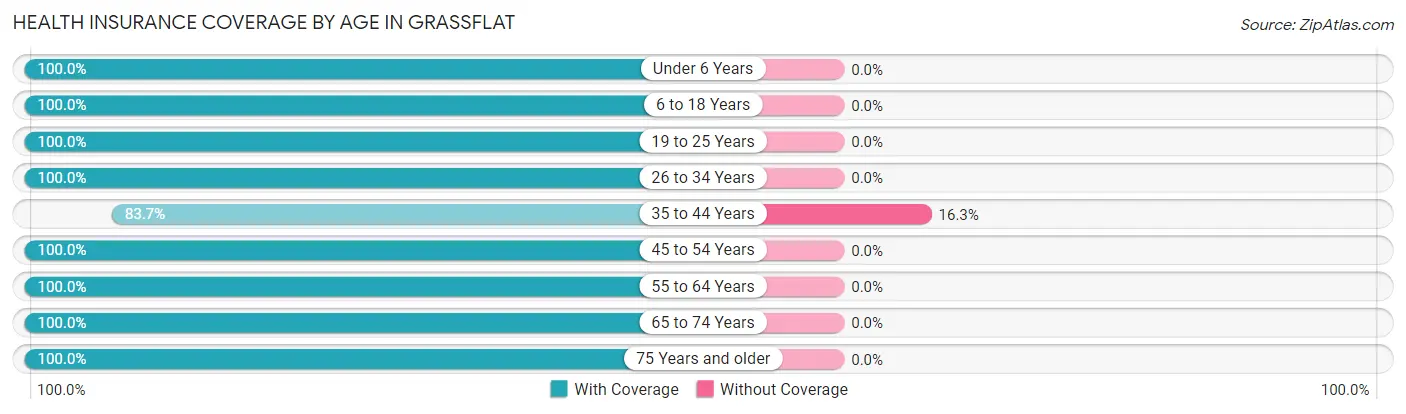
| Age Bracket | With Coverage | Without Coverage |
| Under 6 Years | 26 (100.0%) | 0 (0.0%) |
| 6 to 18 Years | 83 (100.0%) | 0 (0.0%) |
| 19 to 25 Years | 4 (100.0%) | 0 (0.0%) |
| 26 to 34 Years | 48 (100.0%) | 0 (0.0%) |
| 35 to 44 Years | 72 (83.7%) | 14 (16.3%) |
| 45 to 54 Years | 57 (100.0%) | 0 (0.0%) |
| 55 to 64 Years | 37 (100.0%) | 0 (0.0%) |
| 65 to 74 Years | 13 (100.0%) | 0 (0.0%) |
| 75 Years and older | 34 (100.0%) | 0 (0.0%) |
| Total | 374 (96.4%) | 14 (3.6%) |
Health Insurance Coverage by Citizenship Status in Grassflat
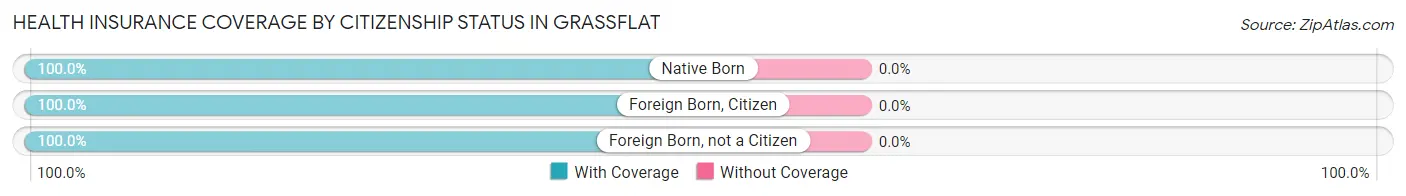
| Citizenship Status | With Coverage | Without Coverage |
| Native Born | 26 (100.0%) | 0 (0.0%) |
| Foreign Born, Citizen | 83 (100.0%) | 0 (0.0%) |
| Foreign Born, not a Citizen | 4 (100.0%) | 0 (0.0%) |
Health Insurance Coverage by Household Income in Grassflat
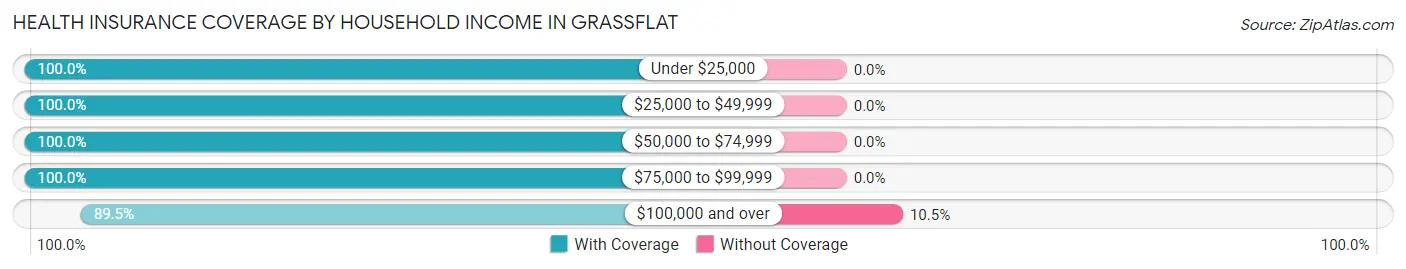
| Household Income | With Coverage | Without Coverage |
| Under $25,000 | 31 (100.0%) | 0 (0.0%) |
| $25,000 to $49,999 | 69 (100.0%) | 0 (0.0%) |
| $50,000 to $74,999 | 70 (100.0%) | 0 (0.0%) |
| $75,000 to $99,999 | 85 (100.0%) | 0 (0.0%) |
| $100,000 and over | 119 (89.5%) | 14 (10.5%) |
Public vs Private Health Insurance Coverage by Age in Grassflat
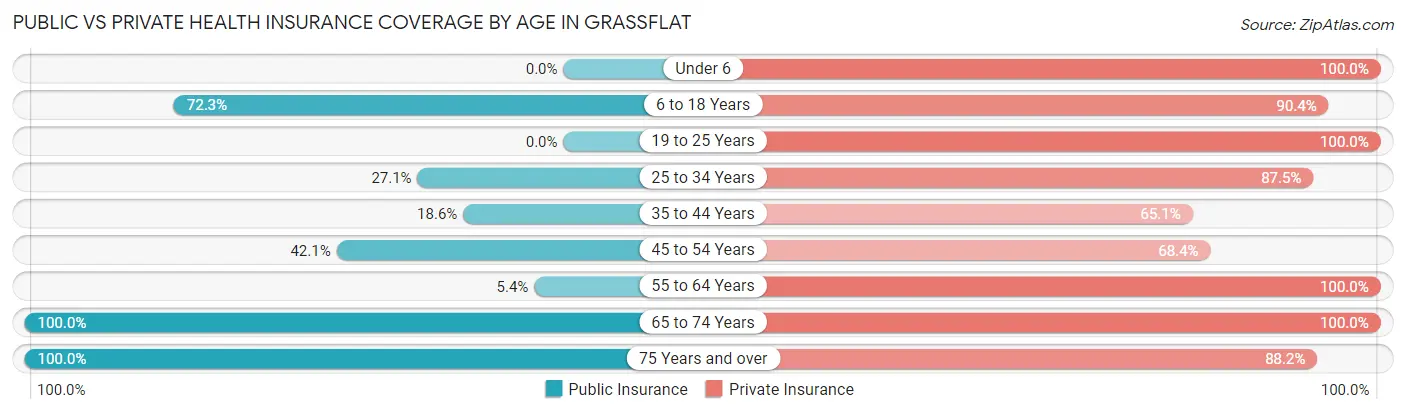
| Age Bracket | Public Insurance | Private Insurance |
| Under 6 | 0 (0.0%) | 26 (100.0%) |
| 6 to 18 Years | 60 (72.3%) | 75 (90.4%) |
| 19 to 25 Years | 0 (0.0%) | 4 (100.0%) |
| 25 to 34 Years | 13 (27.1%) | 42 (87.5%) |
| 35 to 44 Years | 16 (18.6%) | 56 (65.1%) |
| 45 to 54 Years | 24 (42.1%) | 39 (68.4%) |
| 55 to 64 Years | 2 (5.4%) | 37 (100.0%) |
| 65 to 74 Years | 13 (100.0%) | 13 (100.0%) |
| 75 Years and over | 34 (100.0%) | 30 (88.2%) |
| Total | 162 (41.7%) | 322 (83.0%) |
Disability Status by Sex by Age in Grassflat
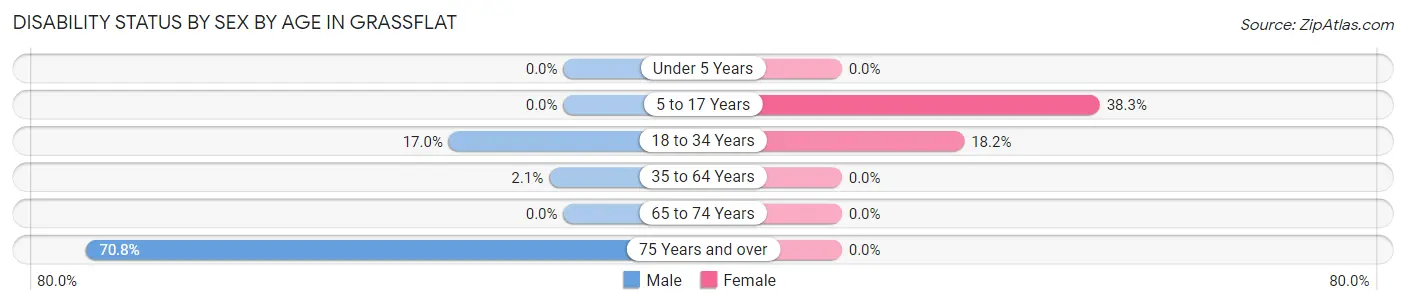
| Age Bracket | Male | Female |
| Under 5 Years | 0 (0.0%) | 0 (0.0%) |
| 5 to 17 Years | 0 (0.0%) | 18 (38.3%) |
| 18 to 34 Years | 8 (17.0%) | 6 (18.2%) |
| 35 to 64 Years | 2 (2.1%) | 0 (0.0%) |
| 65 to 74 Years | 0 (0.0%) | 0 (0.0%) |
| 75 Years and over | 17 (70.8%) | 0 (0.0%) |
Disability Class by Sex by Age in Grassflat
Disability Class: Hearing Difficulty
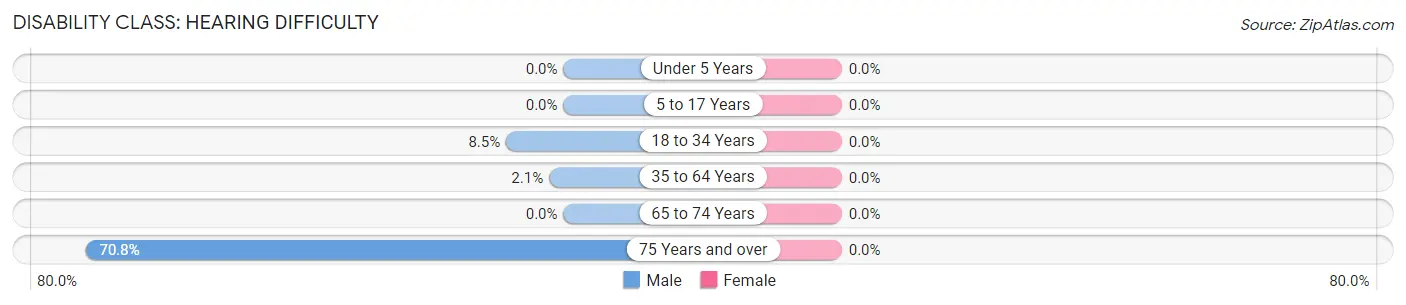
| Age Bracket | Male | Female |
| Under 5 Years | 0 (0.0%) | 0 (0.0%) |
| 5 to 17 Years | 0 (0.0%) | 0 (0.0%) |
| 18 to 34 Years | 4 (8.5%) | 0 (0.0%) |
| 35 to 64 Years | 2 (2.1%) | 0 (0.0%) |
| 65 to 74 Years | 0 (0.0%) | 0 (0.0%) |
| 75 Years and over | 17 (70.8%) | 0 (0.0%) |
Disability Class: Vision Difficulty
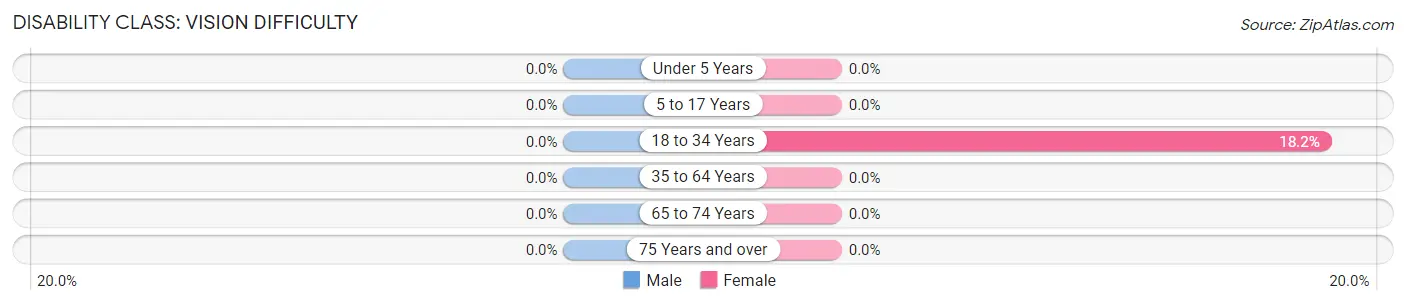
| Age Bracket | Male | Female |
| Under 5 Years | 0 (0.0%) | 0 (0.0%) |
| 5 to 17 Years | 0 (0.0%) | 0 (0.0%) |
| 18 to 34 Years | 0 (0.0%) | 6 (18.2%) |
| 35 to 64 Years | 0 (0.0%) | 0 (0.0%) |
| 65 to 74 Years | 0 (0.0%) | 0 (0.0%) |
| 75 Years and over | 0 (0.0%) | 0 (0.0%) |
Disability Class: Cognitive Difficulty
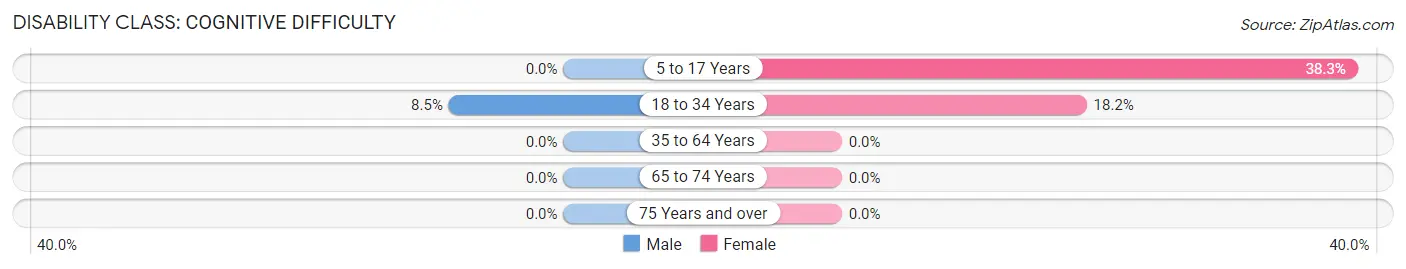
| Age Bracket | Male | Female |
| 5 to 17 Years | 0 (0.0%) | 18 (38.3%) |
| 18 to 34 Years | 4 (8.5%) | 6 (18.2%) |
| 35 to 64 Years | 0 (0.0%) | 0 (0.0%) |
| 65 to 74 Years | 0 (0.0%) | 0 (0.0%) |
| 75 Years and over | 0 (0.0%) | 0 (0.0%) |
Disability Class: Ambulatory Difficulty
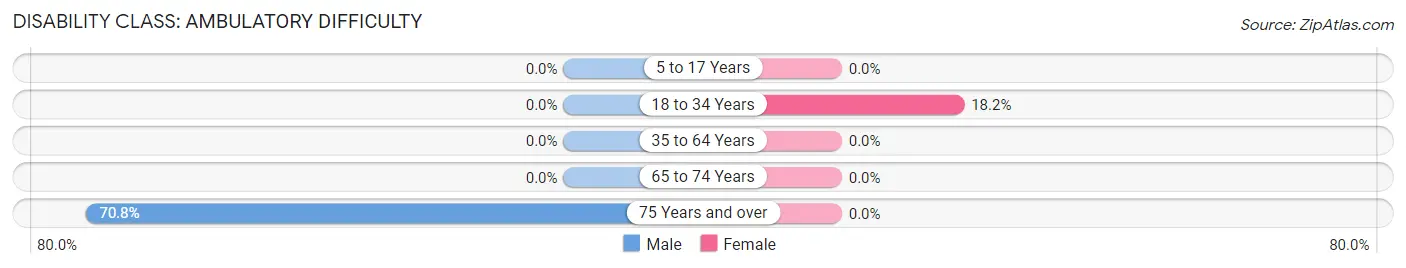
| Age Bracket | Male | Female |
| 5 to 17 Years | 0 (0.0%) | 0 (0.0%) |
| 18 to 34 Years | 0 (0.0%) | 6 (18.2%) |
| 35 to 64 Years | 0 (0.0%) | 0 (0.0%) |
| 65 to 74 Years | 0 (0.0%) | 0 (0.0%) |
| 75 Years and over | 17 (70.8%) | 0 (0.0%) |
Disability Class: Self-Care Difficulty
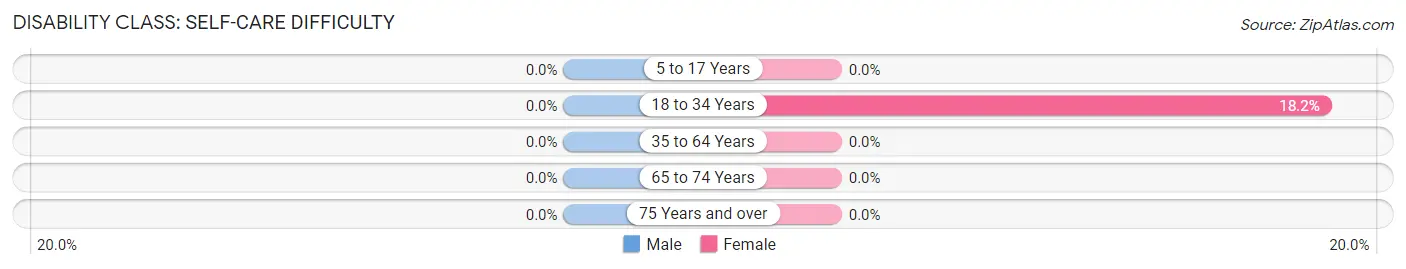
| Age Bracket | Male | Female |
| 5 to 17 Years | 0 (0.0%) | 0 (0.0%) |
| 18 to 34 Years | 0 (0.0%) | 6 (18.2%) |
| 35 to 64 Years | 0 (0.0%) | 0 (0.0%) |
| 65 to 74 Years | 0 (0.0%) | 0 (0.0%) |
| 75 Years and over | 0 (0.0%) | 0 (0.0%) |
Technology Access in Grassflat
Computing Device Access in Grassflat
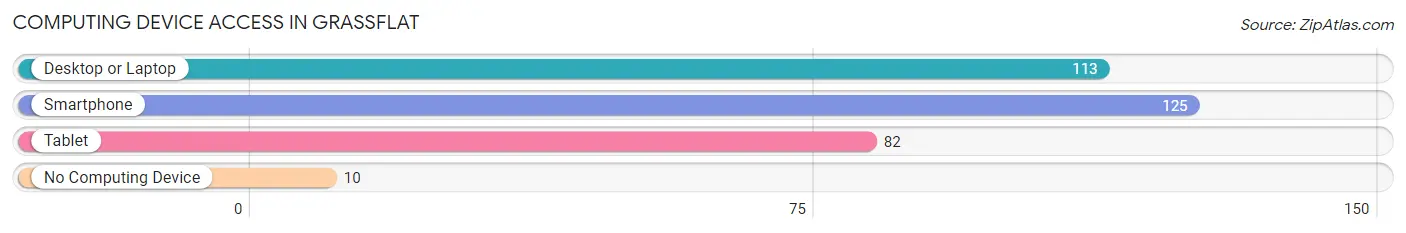
| Device Type | # Households | % Households |
| Desktop or Laptop | 113 | 76.9% |
| Smartphone | 125 | 85.0% |
| Tablet | 82 | 55.8% |
| No Computing Device | 10 | 6.8% |
| Total | 147 | 100.0% |
Internet Access in Grassflat
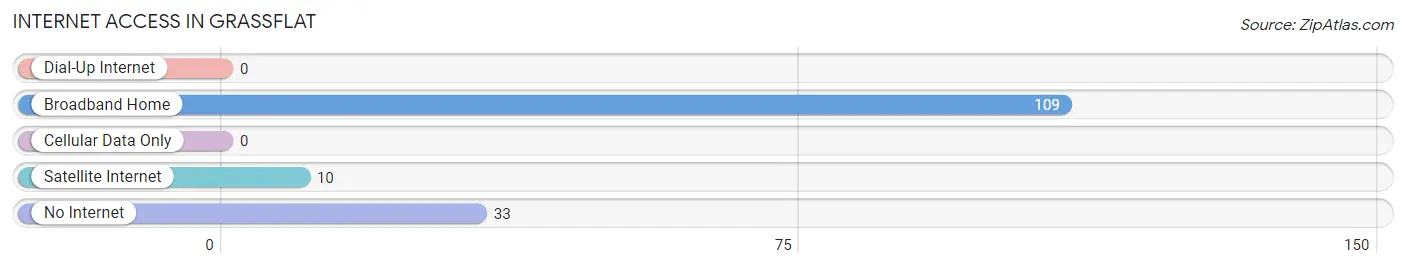
| Internet Type | # Households | % Households |
| Dial-Up Internet | 0 | 0.0% |
| Broadband Home | 109 | 74.2% |
| Cellular Data Only | 0 | 0.0% |
| Satellite Internet | 10 | 6.8% |
| No Internet | 33 | 22.5% |
| Total | 147 | 100.0% |
Grassflat Summary
Grassflat, Pennsylvania is a small borough located in Clearfield County, Pennsylvania. It is situated in the western part of the state, about 30 miles east of the city of Altoona. The population of Grassflat was estimated to be 545 in the year 2000.
Geography
Grassflat is located in the western part of Clearfield County, Pennsylvania. It is situated in the Allegheny Plateau region of the state, which is characterized by rolling hills and valleys. The borough is located in the Moshannon Valley, which is a major tributary of the Susquehanna River. The area is known for its lush forests and abundant wildlife. The borough is located at an elevation of 1,890 feet above sea level.
The climate in Grassflat is classified as humid continental, with cold winters and warm summers. The average annual temperature is around 50 degrees Fahrenheit. The average annual precipitation is around 40 inches.
Economy
The economy of Grassflat is largely based on agriculture and forestry. The borough is home to several farms, which produce a variety of crops, including corn, soybeans, hay, and wheat. The area is also home to several sawmills and lumber companies, which provide employment for many of the borough’s residents.
The borough is also home to several small businesses, including a grocery store, a hardware store, and a few restaurants. The borough is also home to a few small manufacturing companies, which produce a variety of products, including furniture, clothing, and electronics.
Demographics
As of the year 2000, the population of Grassflat was estimated to be 545. The racial makeup of the borough was 97.3% White, 0.7% African American, 0.2% Native American, 0.2% Asian, and 1.6% from other races. The median household income was $30,938, and the median family income was $37,500.
The population of Grassflat is largely rural, with most of the borough’s residents living in single-family homes. The borough is home to several churches, including the First United Methodist Church, the First Presbyterian Church, and the Church of the Nazarene.
Conclusion
Grassflat, Pennsylvania is a small borough located in Clearfield County, Pennsylvania. It is situated in the western part of the state, about 30 miles east of the city of Altoona. The population of Grassflat was estimated to be 545 in the year 2000. The economy of Grassflat is largely based on agriculture and forestry, and the borough is home to several small businesses. The population of Grassflat is largely rural, with most of the borough’s residents living in single-family homes. The racial makeup of the borough was 97.3% White, 0.7% African American, 0.2% Native American, 0.2% Asian, and 1.6% from other races. The median household income was $30,938, and the median family income was $37,500.
Common Questions
What is Per Capita Income in Grassflat?
Per Capita income in Grassflat is $28,402.
What is the Median Family Income in Grassflat?
Median Family Income in Grassflat is $78,542.
What is the Median Household income in Grassflat?
Median Household Income in Grassflat is $61,750.
What is Income or Wage Gap in Grassflat?
Income or Wage Gap in Grassflat is 57.9%.
Women in Grassflat earn 42.1 cents for every dollar earned by a man.
What is Inequality or Gini Index in Grassflat?
Inequality or Gini Index in Grassflat is 0.35.
What is the Total Population of Grassflat?
Total Population of Grassflat is 406.
What is the Total Male Population of Grassflat?
Total Male Population of Grassflat is 206.
What is the Total Female Population of Grassflat?
Total Female Population of Grassflat is 200.
What is the Ratio of Males per 100 Females in Grassflat?
There are 103.00 Males per 100 Females in Grassflat.
What is the Ratio of Females per 100 Males in Grassflat?
There are 97.09 Females per 100 Males in Grassflat.
What is the Median Population Age in Grassflat?
Median Population Age in Grassflat is 35.8 Years.
What is the Average Family Size in Grassflat
Average Family Size in Grassflat is 3.2 People.
What is the Average Household Size in Grassflat
Average Household Size in Grassflat is 2.8 People.
How Large is the Labor Force in Grassflat?
There are 200 People in the Labor Forcein in Grassflat.
What is the Percentage of People in the Labor Force in Grassflat?
60.8% of People are in the Labor Force in Grassflat.
What is the Unemployment Rate in Grassflat?
Unemployment Rate in Grassflat is 6.6%.