Summit Station, PA Map & Demographics
Summit Station Map
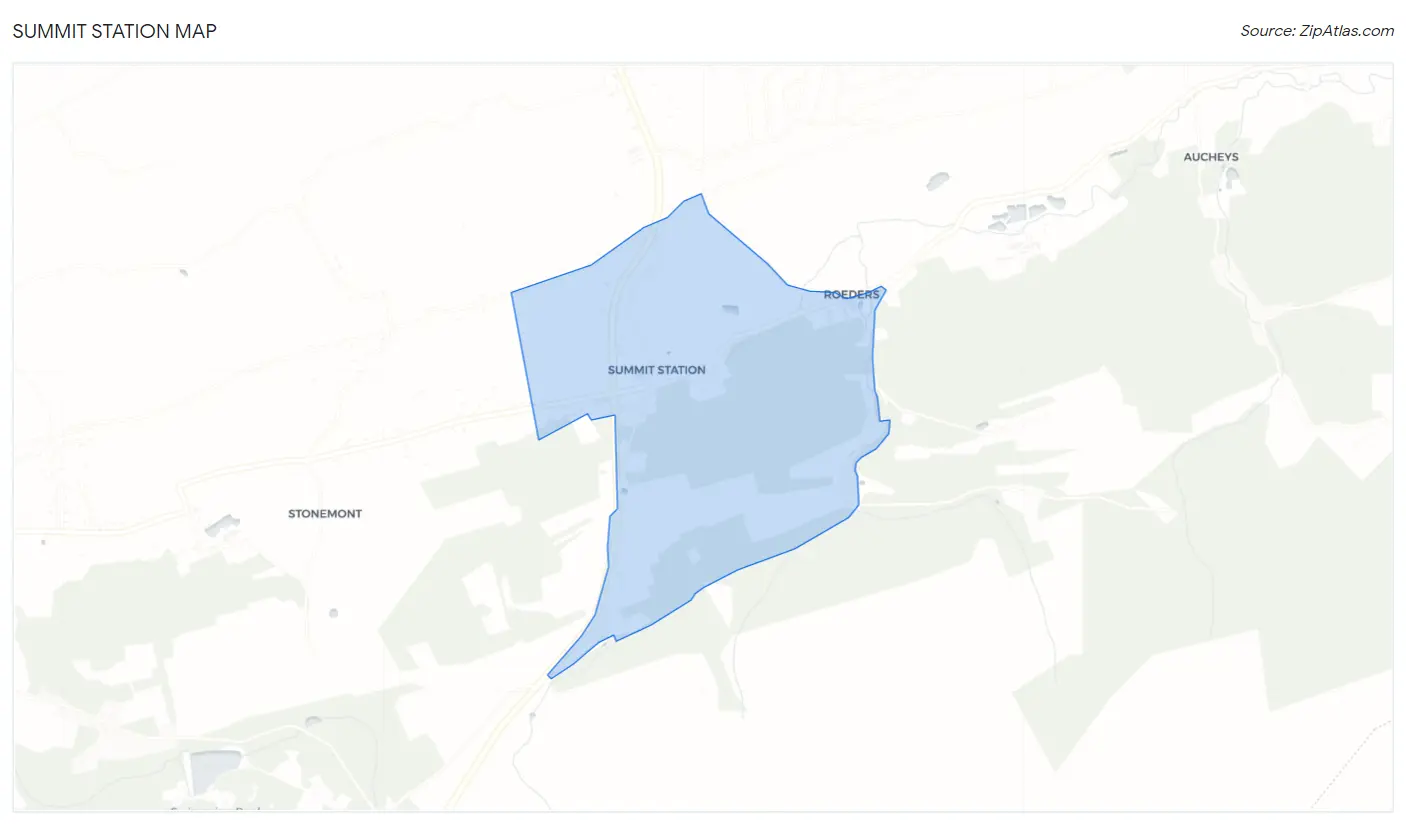
Summit Station Overview
$36,596
PER CAPITA INCOME
$61,429
AVG HOUSEHOLD INCOME
0.36
INEQUALITY / GINI INDEX
219
TOTAL POPULATION
110
MALE POPULATION
109
FEMALE POPULATION
100.92
MALES / 100 FEMALES
99.09
FEMALES / 100 MALES
70.3
MEDIAN AGE
2.9
AVG FAMILY SIZE
1.8
AVG HOUSEHOLD SIZE
53
LABOR FORCE [ PEOPLE ]
24.2%
PERCENT IN LABOR FORCE
Summit Station Zip Codes
Income in Summit Station
Income Overview in Summit Station
| Characteristic | Number | Measure |
| Per Capita Income | 219 | $36,596 |
| Median Family Income | 52 | $0 |
| Mean Family Income | 52 | $96,306 |
| Median Household Income | 122 | $61,429 |
| Mean Household Income | 122 | $65,375 |
| Income Deficit | 52 | $0 |
| Wage / Income Gap (%) | 219 | 0.00% |
| Wage / Income Gap ($) | 219 | 100.00¢ per $1 |
| Gini / Inequality Index | 219 | 0.36 |
Earnings by Sex in Summit Station
| Sex | Number | Average Earnings |
| Male | 25 (37.3%) | $0 |
| Female | 42 (62.7%) | $0 |
| Total | 67 (100.0%) | $0 |
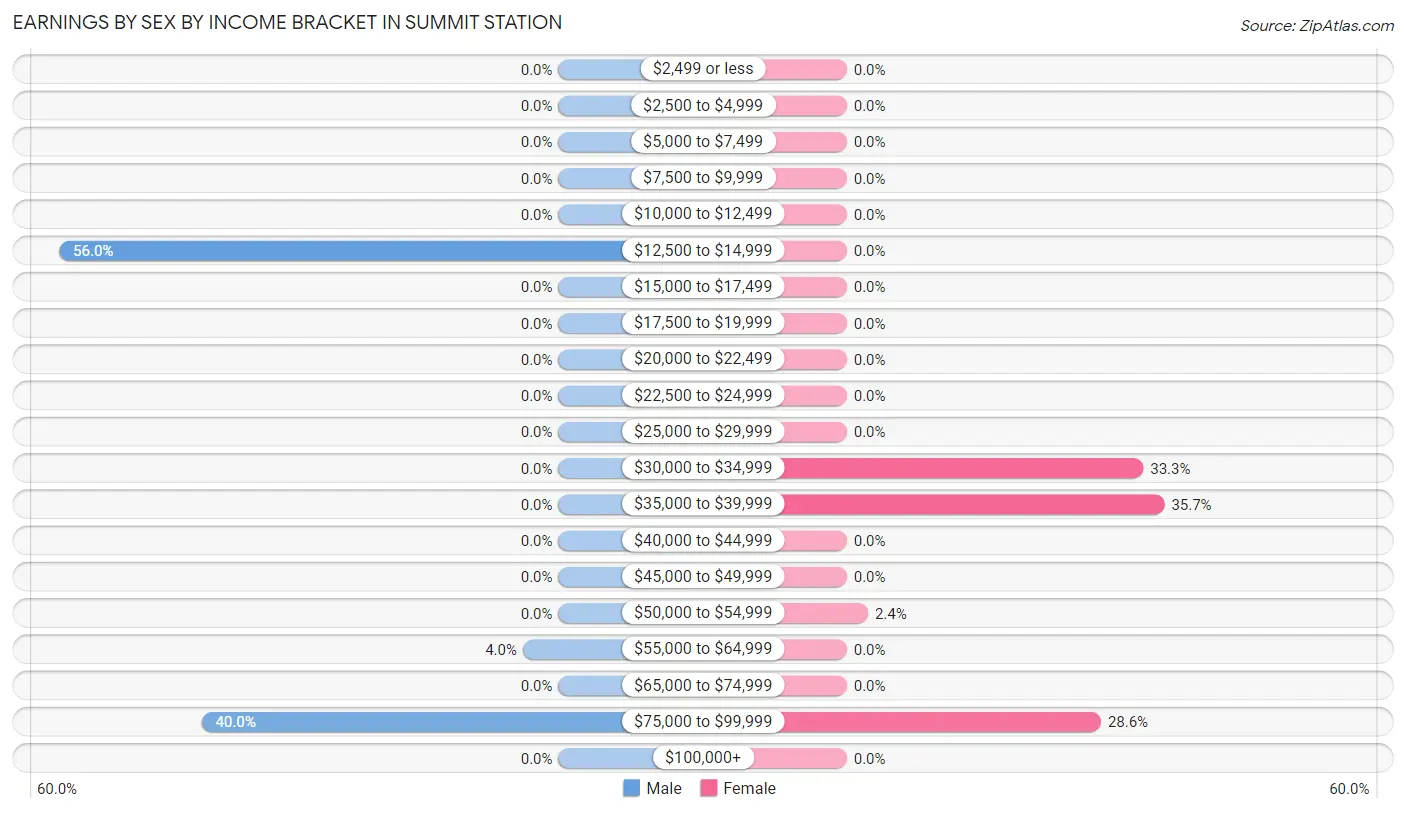
Earnings by Sex by Income Bracket in Summit Station
The most common earnings brackets in Summit Station are $12,500 to $14,999 for men (14 | 56.0%) and $35,000 to $39,999 for women (15 | 35.7%).
| Income | Male | Female |
| $2,499 or less | 0 (0.0%) | 0 (0.0%) |
| $2,500 to $4,999 | 0 (0.0%) | 0 (0.0%) |
| $5,000 to $7,499 | 0 (0.0%) | 0 (0.0%) |
| $7,500 to $9,999 | 0 (0.0%) | 0 (0.0%) |
| $10,000 to $12,499 | 0 (0.0%) | 0 (0.0%) |
| $12,500 to $14,999 | 14 (56.0%) | 0 (0.0%) |
| $15,000 to $17,499 | 0 (0.0%) | 0 (0.0%) |
| $17,500 to $19,999 | 0 (0.0%) | 0 (0.0%) |
| $20,000 to $22,499 | 0 (0.0%) | 0 (0.0%) |
| $22,500 to $24,999 | 0 (0.0%) | 0 (0.0%) |
| $25,000 to $29,999 | 0 (0.0%) | 0 (0.0%) |
| $30,000 to $34,999 | 0 (0.0%) | 14 (33.3%) |
| $35,000 to $39,999 | 0 (0.0%) | 15 (35.7%) |
| $40,000 to $44,999 | 0 (0.0%) | 0 (0.0%) |
| $45,000 to $49,999 | 0 (0.0%) | 0 (0.0%) |
| $50,000 to $54,999 | 0 (0.0%) | 1 (2.4%) |
| $55,000 to $64,999 | 1 (4.0%) | 0 (0.0%) |
| $65,000 to $74,999 | 0 (0.0%) | 0 (0.0%) |
| $75,000 to $99,999 | 10 (40.0%) | 12 (28.6%) |
| $100,000+ | 0 (0.0%) | 0 (0.0%) |
| Total | 25 (100.0%) | 42 (100.0%) |
Earnings by Sex by Educational Attainment in Summit Station
| Educational Attainment | Male Income | Female Income |
| Less than High School | - | - |
| High School Diploma | - | - |
| College or Associate's Degree | - | - |
| Bachelor's Degree | - | - |
| Graduate Degree | - | - |
| Total | - | - |
Family Income in Summit Station
Family Income Brackets in Summit Station
According to the Summit Station family income data, there are 28 families falling into the $50,000 to $74,999 income range, which is the most common income bracket and makes up 53.8% of all families.
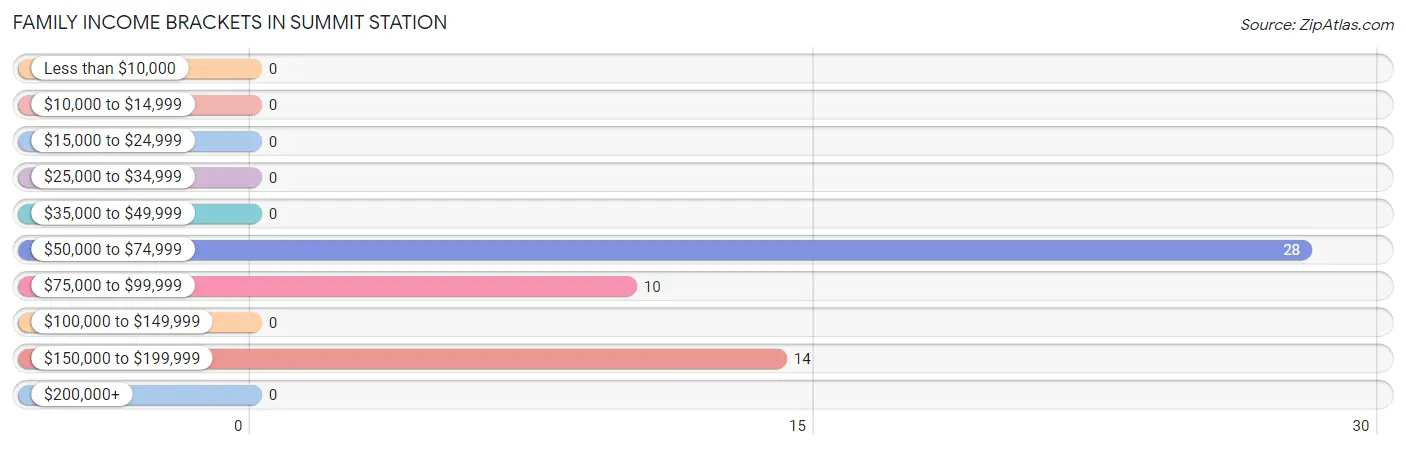
| Income Bracket | # Families | % Families |
| Less than $10,000 | 0 | 0.0% |
| $10,000 to $14,999 | 0 | 0.0% |
| $15,000 to $24,999 | 0 | 0.0% |
| $25,000 to $34,999 | 0 | 0.0% |
| $35,000 to $49,999 | 0 | 0.0% |
| $50,000 to $74,999 | 28 | 53.8% |
| $75,000 to $99,999 | 10 | 19.2% |
| $100,000 to $149,999 | 0 | 0.0% |
| $150,000 to $199,999 | 14 | 26.9% |
| $200,000+ | 0 | 0.0% |
Family Income by Famaliy Size in Summit Station
| Income Bracket | # Families | Median Income |
| 2-Person Families | 10 (19.2%) | $0 |
| 3-Person Families | 42 (80.8%) | $0 |
| 4-Person Families | 0 (0.0%) | $0 |
| 5-Person Families | 0 (0.0%) | $0 |
| 6-Person Families | 0 (0.0%) | $0 |
| 7+ Person Families | 0 (0.0%) | $0 |
| Total | 52 (100.0%) | $0 |
Family Income by Number of Earners in Summit Station
| Number of Earners | # Families | Median Income |
| No Earners | 28 (53.8%) | $0 |
| 1 Earner | 10 (19.2%) | $0 |
| 2 Earners | 0 (0.0%) | $0 |
| 3+ Earners | 14 (26.9%) | $0 |
| Total | 52 (100.0%) | $0 |
Household Income in Summit Station
Household Income Brackets in Summit Station
With 45 households falling in the category, the $15,000 to $24,999 income range is the most frequent in Summit Station, accounting for 36.9% of all households.
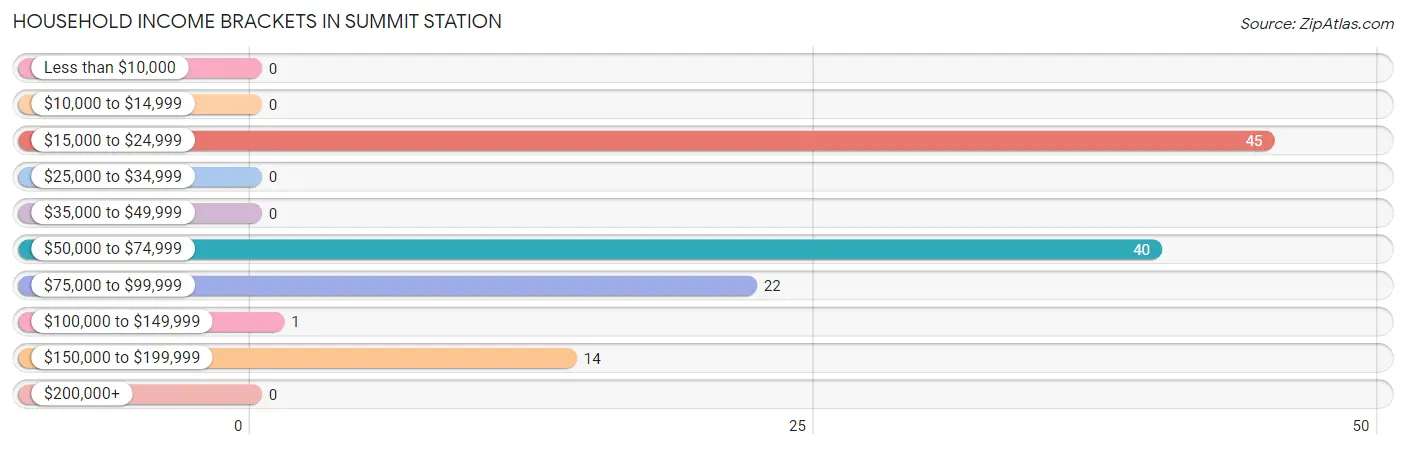
| Income Bracket | # Households | % Households |
| Less than $10,000 | 0 | 0.0% |
| $10,000 to $14,999 | 0 | 0.0% |
| $15,000 to $24,999 | 45 | 36.9% |
| $25,000 to $34,999 | 0 | 0.0% |
| $35,000 to $49,999 | 0 | 0.0% |
| $50,000 to $74,999 | 40 | 32.8% |
| $75,000 to $99,999 | 22 | 18.0% |
| $100,000 to $149,999 | 1 | 0.8% |
| $150,000 to $199,999 | 14 | 11.5% |
| $200,000+ | 0 | 0.0% |
Household Income by Householder Age in Summit Station
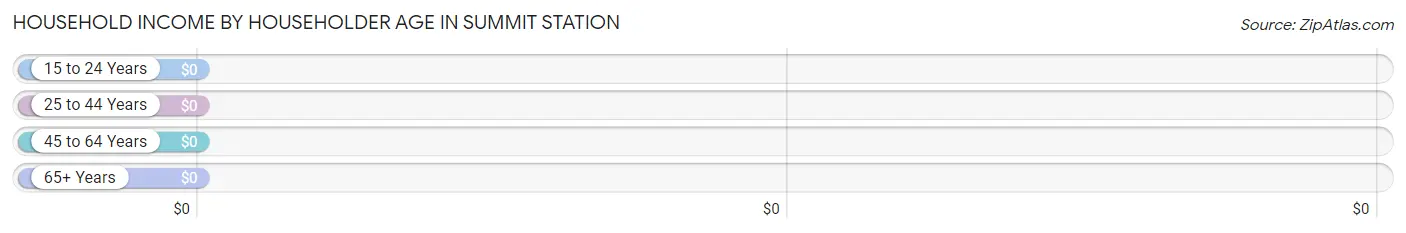
| Income Bracket | # Households | Median Income |
| 15 to 24 Years | 0 (0.0%) | $0 |
| 25 to 44 Years | 12 (9.8%) | $0 |
| 45 to 64 Years | 11 (9.0%) | $0 |
| 65+ Years | 99 (81.1%) | $0 |
| Total | 122 (100.0%) | $61,429 |
Poverty in Summit Station
Income Below Poverty by Sex and Age in Summit Station
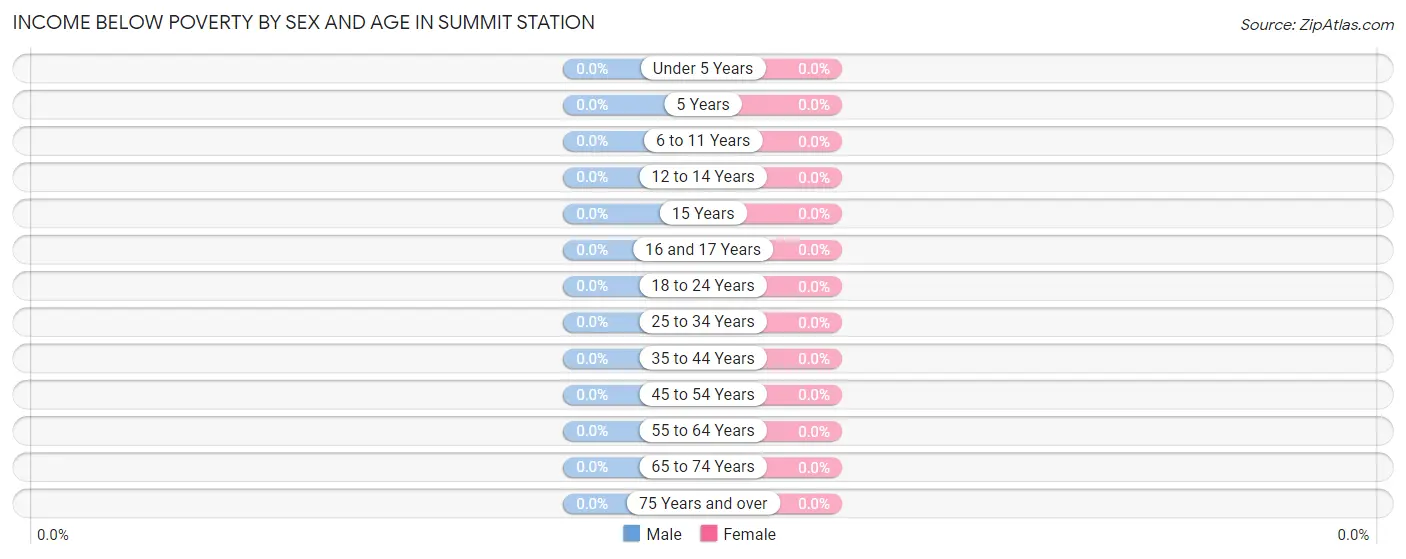
| Age Bracket | Male | Female |
| Under 5 Years | 0 (0.0%) | 0 (0.0%) |
| 5 Years | 0 (0.0%) | 0 (0.0%) |
| 6 to 11 Years | 0 (0.0%) | 0 (0.0%) |
| 12 to 14 Years | 0 (0.0%) | 0 (0.0%) |
| 15 Years | 0 (0.0%) | 0 (0.0%) |
| 16 and 17 Years | 0 (0.0%) | 0 (0.0%) |
| 18 to 24 Years | 0 (0.0%) | 0 (0.0%) |
| 25 to 34 Years | 0 (0.0%) | 0 (0.0%) |
| 35 to 44 Years | 0 (0.0%) | 0 (0.0%) |
| 45 to 54 Years | 0 (0.0%) | 0 (0.0%) |
| 55 to 64 Years | 0 (0.0%) | 0 (0.0%) |
| 65 to 74 Years | 0 (0.0%) | 0 (0.0%) |
| 75 Years and over | 0 (0.0%) | 0 (0.0%) |
| Total | 0 (0.0%) | 0 (0.0%) |
Income Above Poverty by Sex and Age in Summit Station
According to the poverty statistics in Summit Station, males aged 55 to 64 years and females aged 35 to 44 years are the age groups that are most secure financially, with 100.0% of males and 100.0% of females in these age groups living above the poverty line.
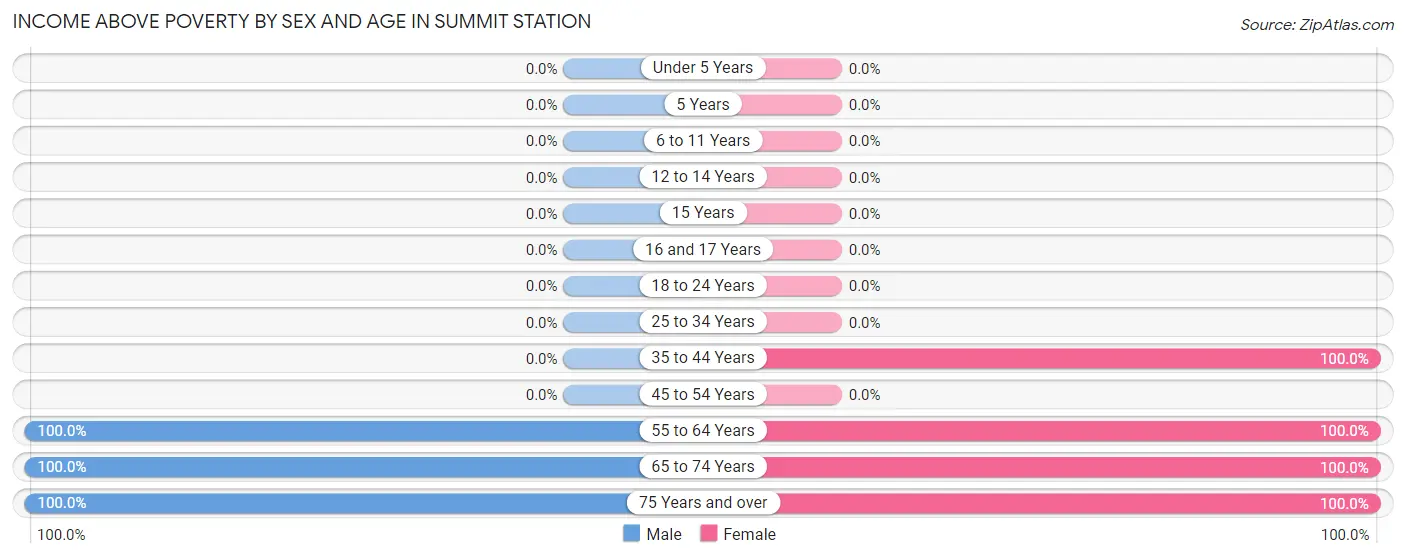
| Age Bracket | Male | Female |
| Under 5 Years | 0 (0.0%) | 0 (0.0%) |
| 5 Years | 0 (0.0%) | 0 (0.0%) |
| 6 to 11 Years | 0 (0.0%) | 0 (0.0%) |
| 12 to 14 Years | 0 (0.0%) | 0 (0.0%) |
| 15 Years | 0 (0.0%) | 0 (0.0%) |
| 16 and 17 Years | 0 (0.0%) | 0 (0.0%) |
| 18 to 24 Years | 0 (0.0%) | 0 (0.0%) |
| 25 to 34 Years | 0 (0.0%) | 0 (0.0%) |
| 35 to 44 Years | 0 (0.0%) | 26 (100.0%) |
| 45 to 54 Years | 0 (0.0%) | 0 (0.0%) |
| 55 to 64 Years | 11 (100.0%) | 27 (100.0%) |
| 65 to 74 Years | 54 (100.0%) | 28 (100.0%) |
| 75 Years and over | 45 (100.0%) | 28 (100.0%) |
| Total | 110 (100.0%) | 109 (100.0%) |
Income Below Poverty Among Married-Couple Families in Summit Station
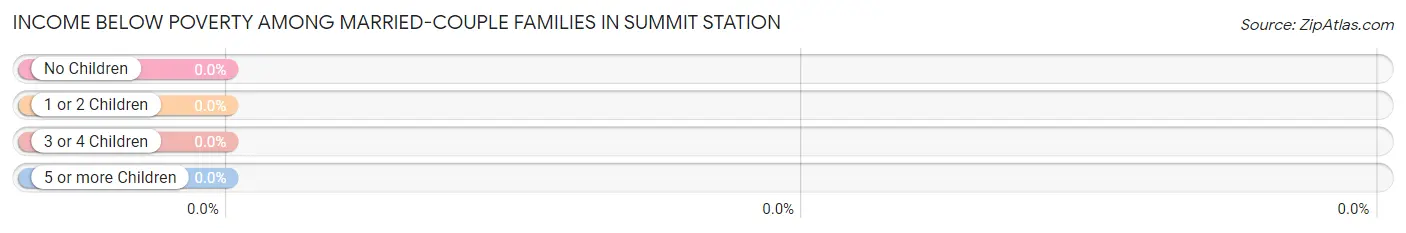
| Children | Above Poverty | Below Poverty |
| No Children | 52 (100.0%) | 0 (0.0%) |
| 1 or 2 Children | 0 (0.0%) | 0 (0.0%) |
| 3 or 4 Children | 0 (0.0%) | 0 (0.0%) |
| 5 or more Children | 0 (0.0%) | 0 (0.0%) |
| Total | 52 (100.0%) | 0 (0.0%) |
Income Below Poverty Among Single-Parent Households in Summit Station
| Children | Single Father | Single Mother |
| No Children | 0 (0.0%) | 0 (0.0%) |
| 1 or 2 Children | 0 (0.0%) | 0 (0.0%) |
| 3 or 4 Children | 0 (0.0%) | 0 (0.0%) |
| 5 or more Children | 0 (0.0%) | 0 (0.0%) |
| Total | 0 (0.0%) | 0 (0.0%) |
Income Below Poverty Among Married-Couple vs Single-Parent Households in Summit Station
| Children | Married-Couple Families | Single-Parent Households |
| No Children | 0 (0.0%) | 0 (0.0%) |
| 1 or 2 Children | 0 (0.0%) | 0 (0.0%) |
| 3 or 4 Children | 0 (0.0%) | 0 (0.0%) |
| 5 or more Children | 0 (0.0%) | 0 (0.0%) |
| Total | 0 (0.0%) | 0 (0.0%) |
Race in Summit Station
The most populous races in Summit Station are , and White / Caucasian (219 | 100.0%).
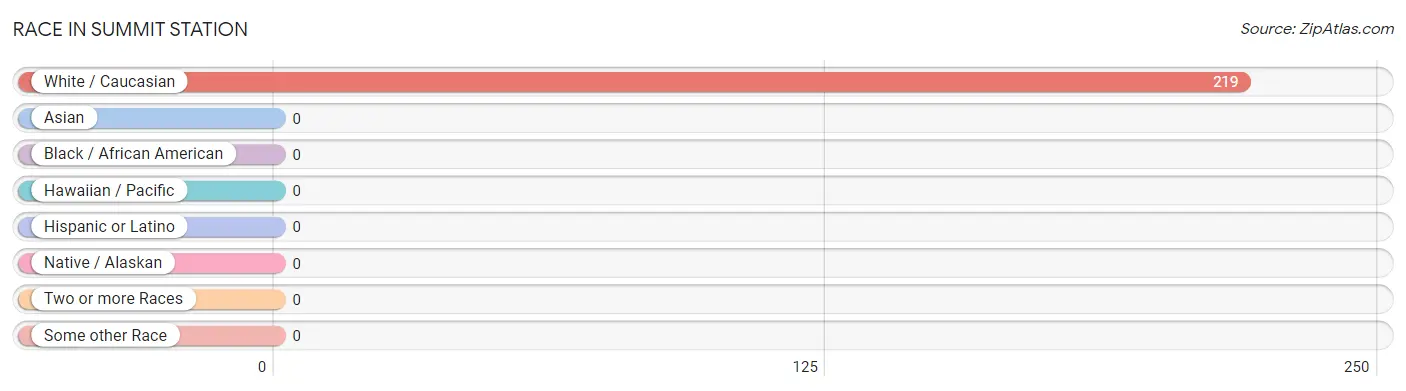
| Race | # Population | % Population |
| Asian | 0 | 0.0% |
| Black / African American | 0 | 0.0% |
| Hawaiian / Pacific | 0 | 0.0% |
| Hispanic or Latino | 0 | 0.0% |
| Native / Alaskan | 0 | 0.0% |
| White / Caucasian | 219 | 100.0% |
| Two or more Races | 0 | 0.0% |
| Some other Race | 0 | 0.0% |
| Total | 219 | 100.0% |
Ancestry in Summit Station
The most populous ancestries reported in Summit Station are German (136 | 62.1%), Dutch (45 | 20.5%), Irish (45 | 20.5%), Italian (22 | 10.1%), and Pennsylvania German (14 | 6.4%), together accounting for 119.6% of all Summit Station residents.
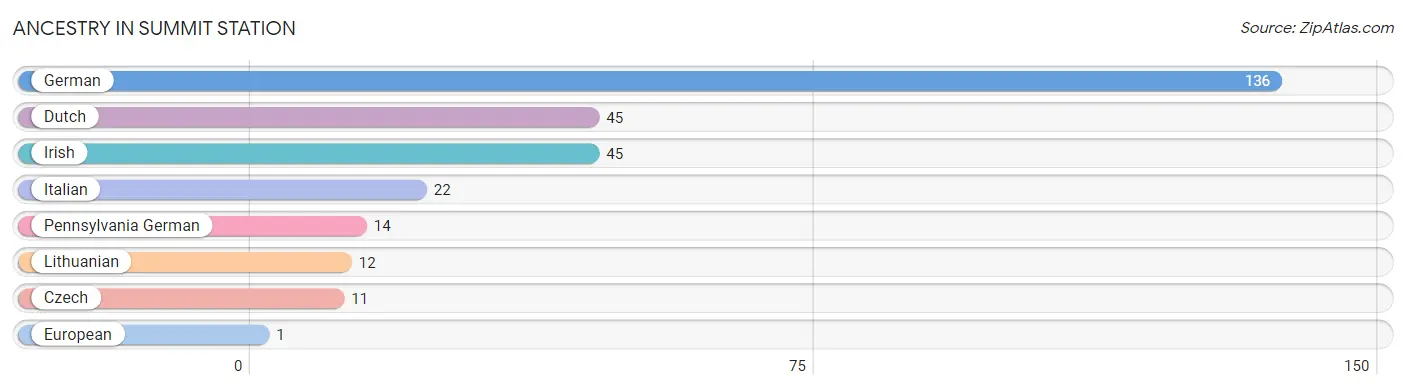
| Ancestry | # Population | % Population |
| Czech | 11 | 5.0% |
| Dutch | 45 | 20.5% |
| European | 1 | 0.5% |
| German | 136 | 62.1% |
| Irish | 45 | 20.5% |
| Italian | 22 | 10.1% |
| Lithuanian | 12 | 5.5% |
| Pennsylvania German | 14 | 6.4% | View All 8 Rows |
Immigrants in Summit Station

| Immigration Origin | # Population | % Population | View All 0 Rows |
Sex and Age in Summit Station
Sex and Age in Summit Station
The most populous age groups in Summit Station are 85 Years and over (45 | 40.9%) for men and 70 to 74 Years (28 | 25.7%) for women.
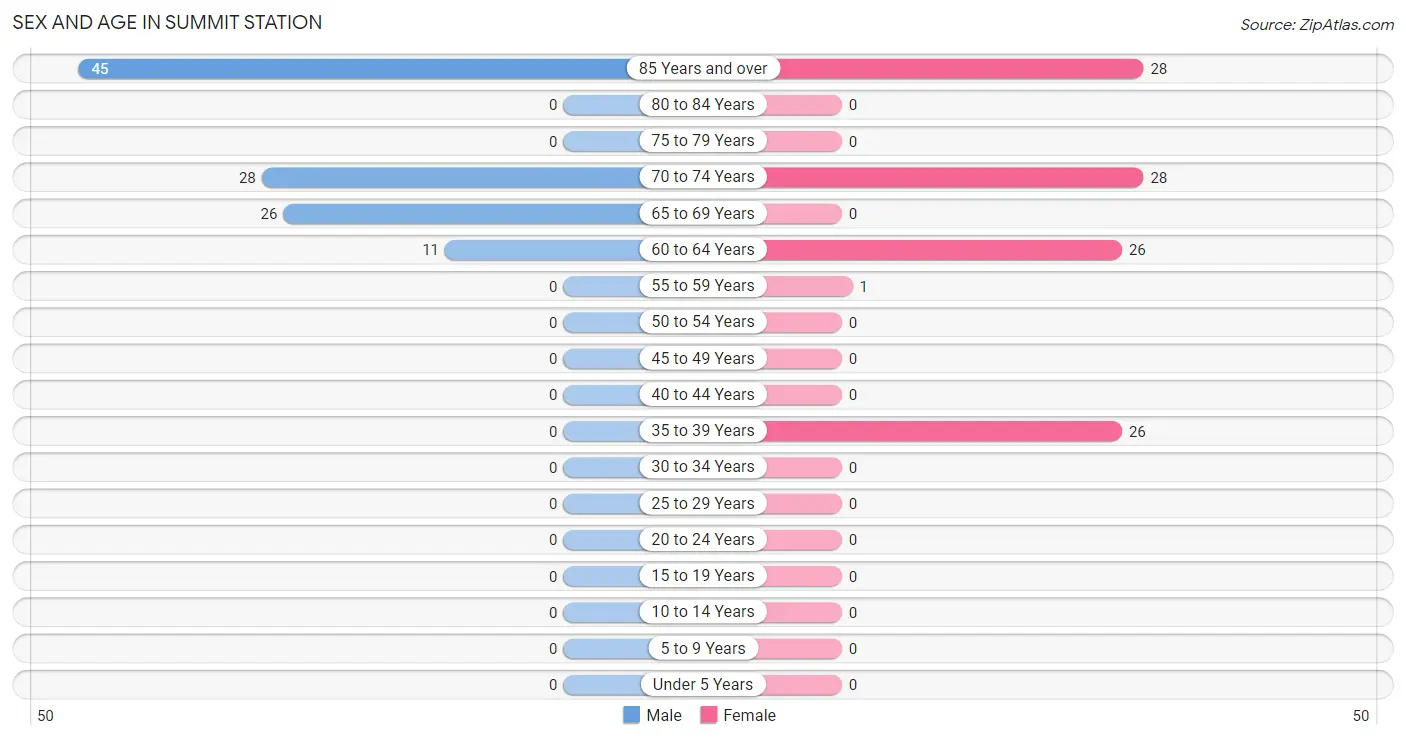
| Age Bracket | Male | Female |
| Under 5 Years | 0 (0.0%) | 0 (0.0%) |
| 5 to 9 Years | 0 (0.0%) | 0 (0.0%) |
| 10 to 14 Years | 0 (0.0%) | 0 (0.0%) |
| 15 to 19 Years | 0 (0.0%) | 0 (0.0%) |
| 20 to 24 Years | 0 (0.0%) | 0 (0.0%) |
| 25 to 29 Years | 0 (0.0%) | 0 (0.0%) |
| 30 to 34 Years | 0 (0.0%) | 0 (0.0%) |
| 35 to 39 Years | 0 (0.0%) | 26 (23.8%) |
| 40 to 44 Years | 0 (0.0%) | 0 (0.0%) |
| 45 to 49 Years | 0 (0.0%) | 0 (0.0%) |
| 50 to 54 Years | 0 (0.0%) | 0 (0.0%) |
| 55 to 59 Years | 0 (0.0%) | 1 (0.9%) |
| 60 to 64 Years | 11 (10.0%) | 26 (23.8%) |
| 65 to 69 Years | 26 (23.6%) | 0 (0.0%) |
| 70 to 74 Years | 28 (25.5%) | 28 (25.7%) |
| 75 to 79 Years | 0 (0.0%) | 0 (0.0%) |
| 80 to 84 Years | 0 (0.0%) | 0 (0.0%) |
| 85 Years and over | 45 (40.9%) | 28 (25.7%) |
| Total | 110 (100.0%) | 109 (100.0%) |
Families and Households in Summit Station
Median Family Size in Summit Station
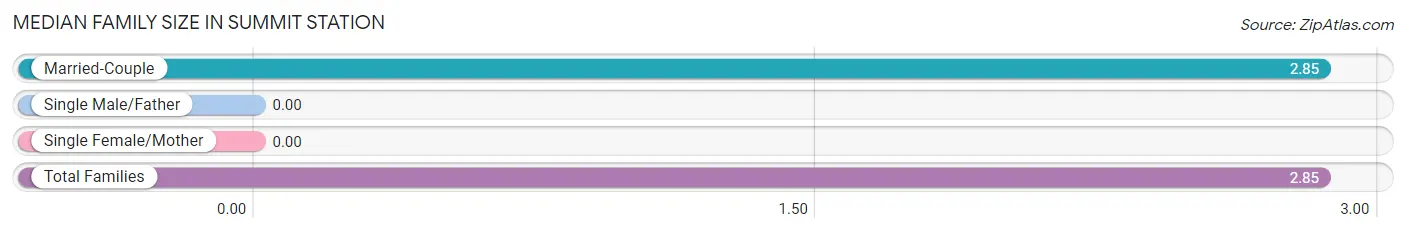
| Family Type | # Families | Family Size |
| Married-Couple | 52 (100.0%) | 2.85 |
| Single Male/Father | 0 (0.0%) | - |
| Single Female/Mother | 0 (0.0%) | - |
| Total Families | 52 (100.0%) | 2.85 |
Median Household Size in Summit Station
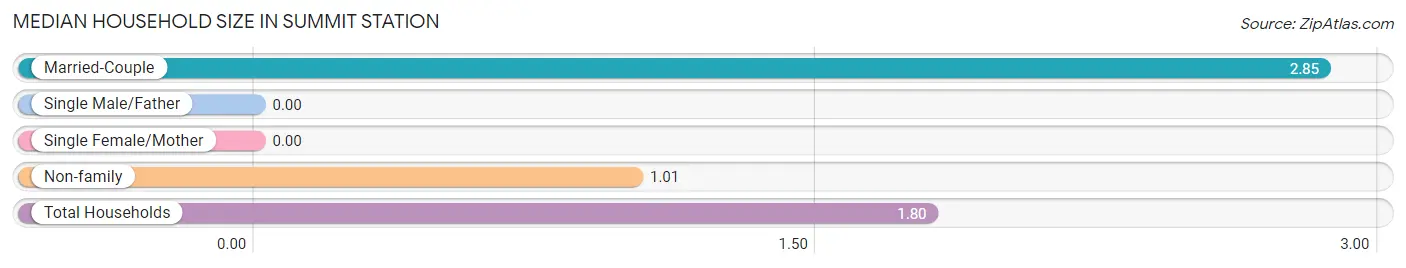
| Household Type | # Households | Household Size |
| Married-Couple | 52 (42.6%) | 2.85 |
| Single Male/Father | 0 (0.0%) | - |
| Single Female/Mother | 0 (0.0%) | - |
| Non-family | 70 (57.4%) | 1.01 |
| Total Households | 122 (100.0%) | 1.80 |
Household Size by Marriage Status in Summit Station
Out of a total of 122 households in Summit Station, 52 (42.6%) are family households, while 70 (57.4%) are nonfamily households. The most numerous type of family households are 3-person households, comprising 42, and the most common type of nonfamily households are 1-person households, comprising 69.
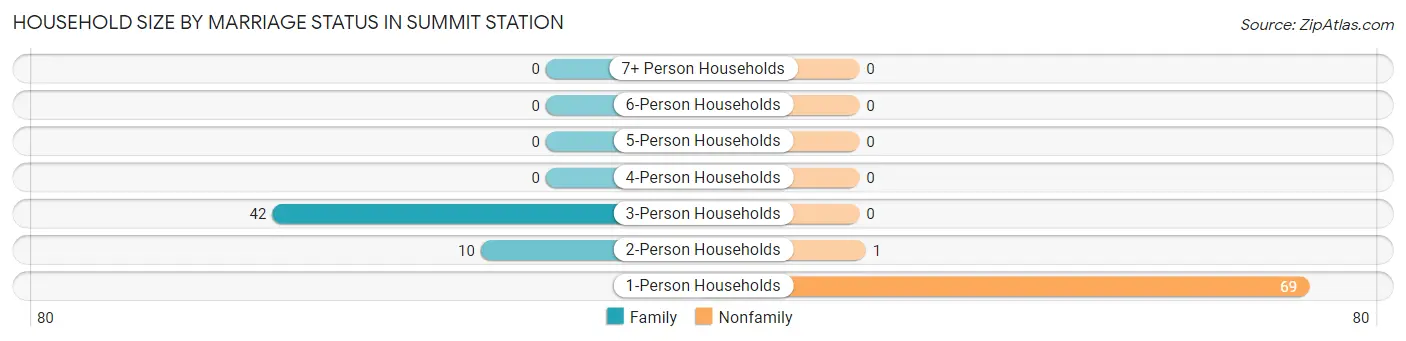
| Household Size | Family Households | Nonfamily Households |
| 1-Person Households | - | 69 (56.6%) |
| 2-Person Households | 10 (8.2%) | 1 (0.8%) |
| 3-Person Households | 42 (34.4%) | 0 (0.0%) |
| 4-Person Households | 0 (0.0%) | 0 (0.0%) |
| 5-Person Households | 0 (0.0%) | 0 (0.0%) |
| 6-Person Households | 0 (0.0%) | 0 (0.0%) |
| 7+ Person Households | 0 (0.0%) | 0 (0.0%) |
| Total | 52 (42.6%) | 70 (57.4%) |
Female Fertility in Summit Station
Fertility by Age in Summit Station
| Age Bracket | Women with Births | Births / 1,000 Women |
| 15 to 19 years | 0 (0.0%) | 0.0 |
| 20 to 34 years | 0 (0.0%) | 0.0 |
| 35 to 50 years | 0 (0.0%) | 0.0 |
| Total | 0 (0.0%) | 0.0 |
Fertility by Age by Marriage Status in Summit Station
| Age Bracket | Married | Unmarried |
| 15 to 19 years | 0 (0.0%) | 0 (0.0%) |
| 20 to 34 years | 0 (0.0%) | 0 (0.0%) |
| 35 to 50 years | 0 (0.0%) | 0 (0.0%) |
| Total | 0 (0.0%) | 0 (0.0%) |
Fertility by Education in Summit Station
| Educational Attainment | Women with Births | Births / 1,000 Women |
| Less than High School | 0 (0.0%) | 0.0 |
| High School Diploma | 0 (0.0%) | 0.0 |
| College or Associate's Degree | 0 (0.0%) | 0.0 |
| Bachelor's Degree | 0 (0.0%) | 0.0 |
| Graduate Degree | 0 (0.0%) | 0.0 |
| Total | 0 (0.0%) | 0.0 |
Fertility by Education by Marriage Status in Summit Station

| Educational Attainment | Married | Unmarried |
| Less than High School | 0 (0.0%) | 0 (0.0%) |
| High School Diploma | 0 (0.0%) | 0 (0.0%) |
| College or Associate's Degree | 0 (0.0%) | 0 (0.0%) |
| Bachelor's Degree | 0 (0.0%) | 0 (0.0%) |
| Graduate Degree | 0 (0.0%) | 0 (0.0%) |
| Total | 0 (0.0%) | 0 (0.0%) |
Employment Characteristics in Summit Station
Employment by Class of Employer in Summit Station
Among the 53 employed individuals in Summit Station, , and private company employees (53 | 100.0%) make up the most common classes of employment.
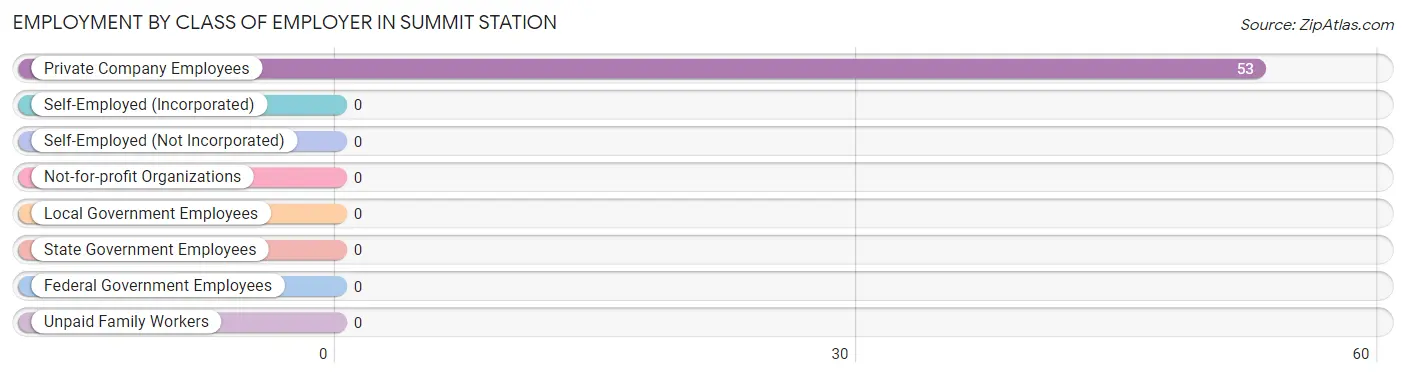
| Employer Class | # Employees | % Employees |
| Private Company Employees | 53 | 100.0% |
| Self-Employed (Incorporated) | 0 | 0.0% |
| Self-Employed (Not Incorporated) | 0 | 0.0% |
| Not-for-profit Organizations | 0 | 0.0% |
| Local Government Employees | 0 | 0.0% |
| State Government Employees | 0 | 0.0% |
| Federal Government Employees | 0 | 0.0% |
| Unpaid Family Workers | 0 | 0.0% |
| Total | 53 | 100.0% |
Employment Status by Age in Summit Station
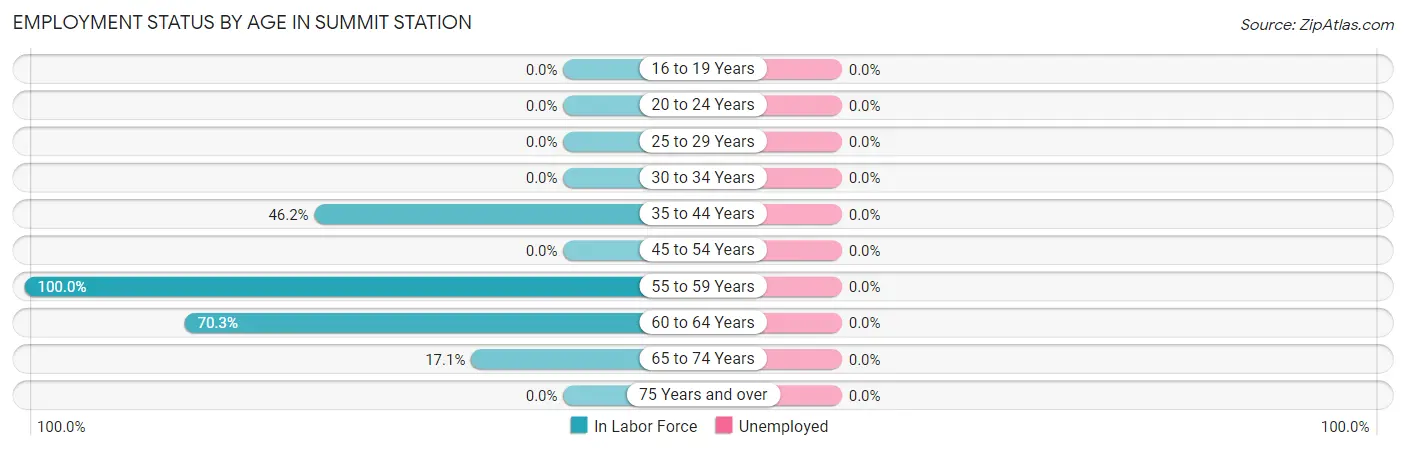
| Age Bracket | In Labor Force | Unemployed |
| 16 to 19 Years | 0 (0.0%) | 0 (0.0%) |
| 20 to 24 Years | 0 (0.0%) | 0 (0.0%) |
| 25 to 29 Years | 0 (0.0%) | 0 (0.0%) |
| 30 to 34 Years | 0 (0.0%) | 0 (0.0%) |
| 35 to 44 Years | 12 (46.2%) | 0 (0.0%) |
| 45 to 54 Years | 0 (0.0%) | 0 (0.0%) |
| 55 to 59 Years | 1 (100.0%) | 0 (0.0%) |
| 60 to 64 Years | 26 (70.3%) | 0 (0.0%) |
| 65 to 74 Years | 14 (17.1%) | 0 (0.0%) |
| 75 Years and over | 0 (0.0%) | 0 (0.0%) |
| Total | 53 (24.2%) | 0 (0.0%) |
Employment Status by Educational Attainment in Summit Station
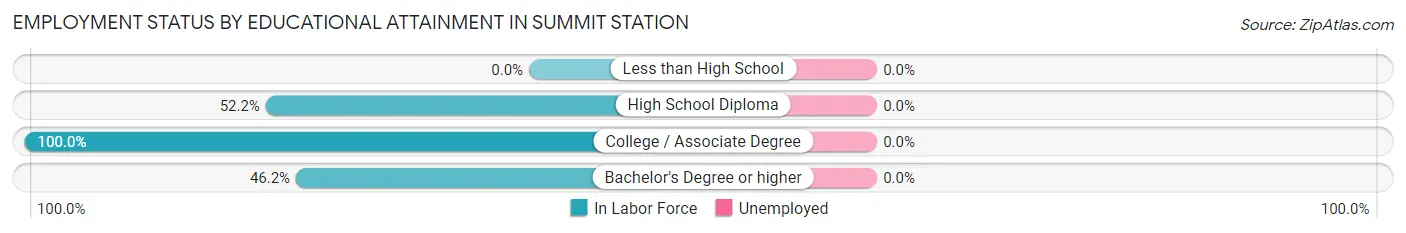
| Educational Attainment | In Labor Force | Unemployed |
| Less than High School | 0 (0.0%) | 0 (0.0%) |
| High School Diploma | 12 (52.2%) | 0 (0.0%) |
| College / Associate Degree | 15 (100.0%) | 0 (0.0%) |
| Bachelor's Degree or higher | 12 (46.2%) | 0 (0.0%) |
| Total | 39 (60.9%) | 0 (0.0%) |
Employment Occupations by Sex in Summit Station
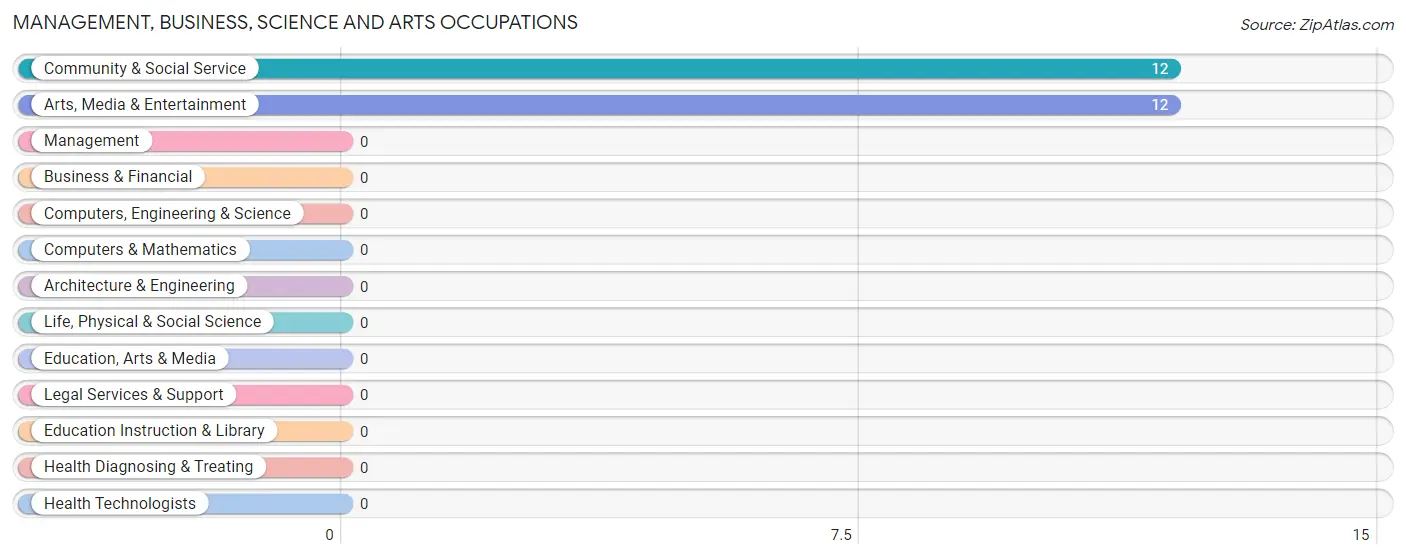
Management, Business, Science and Arts Occupations
The most common Management, Business, Science and Arts occupations in Summit Station are Community & Social Service (12 | 22.6%), and Arts, Media & Entertainment (12 | 22.6%).
Management, Business, Science and Arts Occupations by Sex
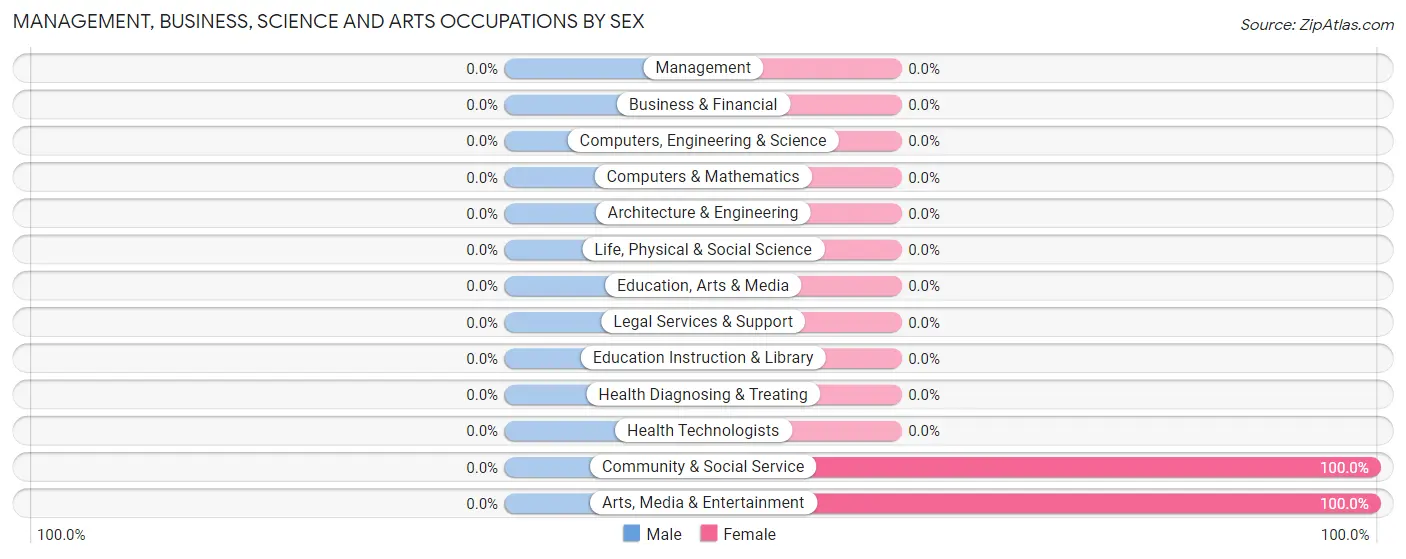
| Occupation | Male | Female |
| Management | 0 (0.0%) | 0 (0.0%) |
| Business & Financial | 0 (0.0%) | 0 (0.0%) |
| Computers, Engineering & Science | 0 (0.0%) | 0 (0.0%) |
| Computers & Mathematics | 0 (0.0%) | 0 (0.0%) |
| Architecture & Engineering | 0 (0.0%) | 0 (0.0%) |
| Life, Physical & Social Science | 0 (0.0%) | 0 (0.0%) |
| Community & Social Service | 0 (0.0%) | 12 (100.0%) |
| Education, Arts & Media | 0 (0.0%) | 0 (0.0%) |
| Legal Services & Support | 0 (0.0%) | 0 (0.0%) |
| Education Instruction & Library | 0 (0.0%) | 0 (0.0%) |
| Arts, Media & Entertainment | 0 (0.0%) | 12 (100.0%) |
| Health Diagnosing & Treating | 0 (0.0%) | 0 (0.0%) |
| Health Technologists | 0 (0.0%) | 0 (0.0%) |
| Total (Category) | 0 (0.0%) | 12 (100.0%) |
| Total (Overall) | 25 (47.2%) | 28 (52.8%) |
Services Occupations
The most common Services occupations in Summit Station are , and Food Preparation & Serving (1 | 1.9%).
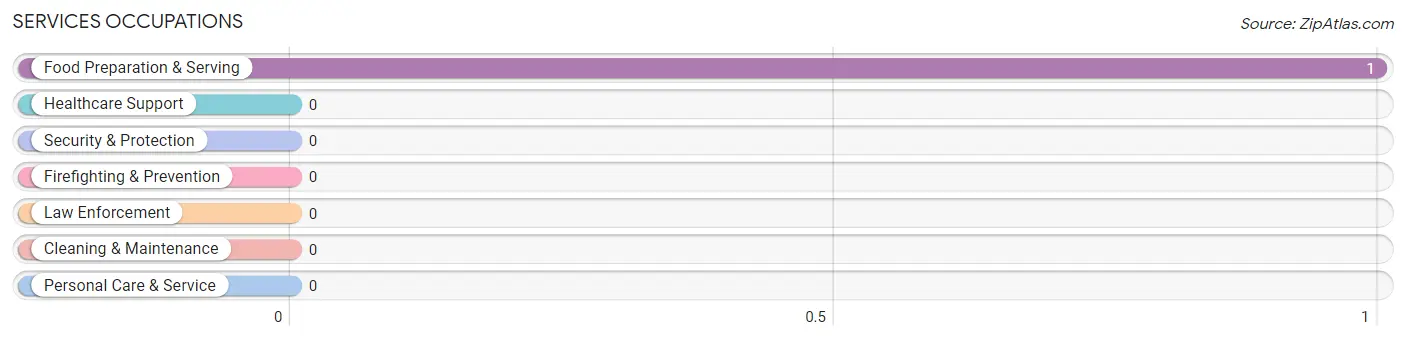
Services Occupations by Sex
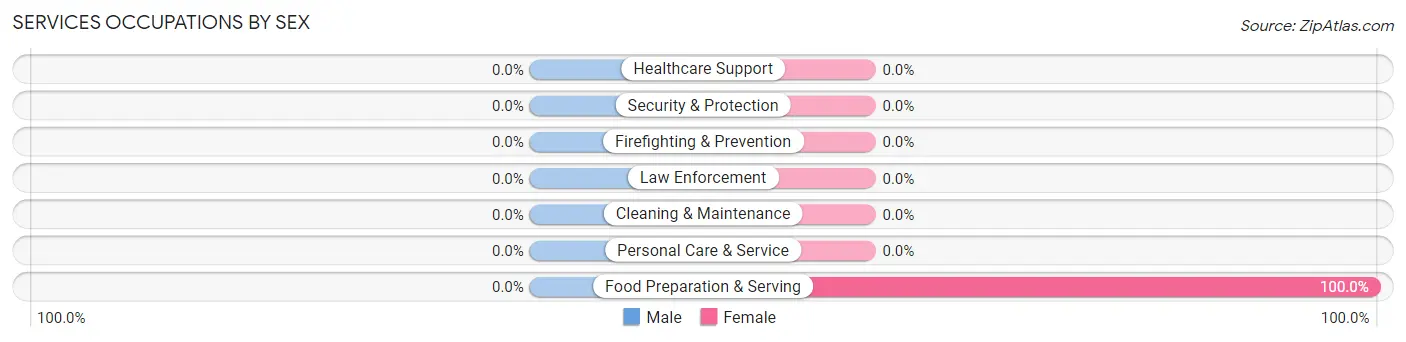
| Occupation | Male | Female |
| Healthcare Support | 0 (0.0%) | 0 (0.0%) |
| Security & Protection | 0 (0.0%) | 0 (0.0%) |
| Firefighting & Prevention | 0 (0.0%) | 0 (0.0%) |
| Law Enforcement | 0 (0.0%) | 0 (0.0%) |
| Food Preparation & Serving | 0 (0.0%) | 1 (100.0%) |
| Cleaning & Maintenance | 0 (0.0%) | 0 (0.0%) |
| Personal Care & Service | 0 (0.0%) | 0 (0.0%) |
| Total (Category) | 0 (0.0%) | 1 (100.0%) |
| Total (Overall) | 25 (47.2%) | 28 (52.8%) |
Sales and Office Occupations
The most common Sales and Office occupations in Summit Station are Office & Administration (15 | 28.3%), and Sales & Related (14 | 26.4%).
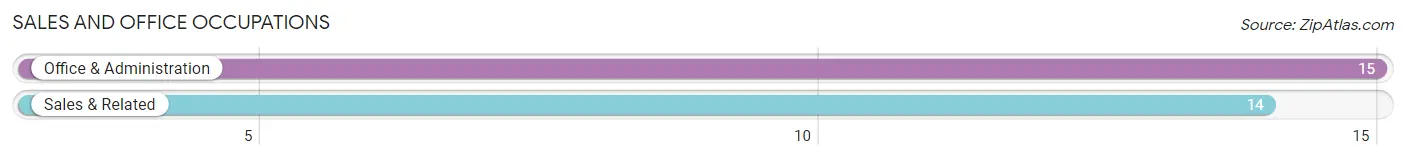
Sales and Office Occupations by Sex

| Occupation | Male | Female |
| Sales & Related | 14 (100.0%) | 0 (0.0%) |
| Office & Administration | 0 (0.0%) | 15 (100.0%) |
| Total (Category) | 14 (48.3%) | 15 (51.7%) |
| Total (Overall) | 25 (47.2%) | 28 (52.8%) |
Natural Resources, Construction and Maintenance Occupations
The most common Natural Resources, Construction and Maintenance occupations in Summit Station are , and Installation, Maintenance & Repair (1 | 1.9%).
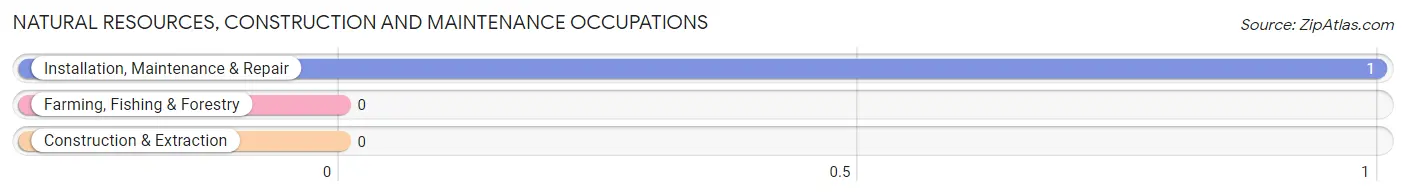
Natural Resources, Construction and Maintenance Occupations by Sex
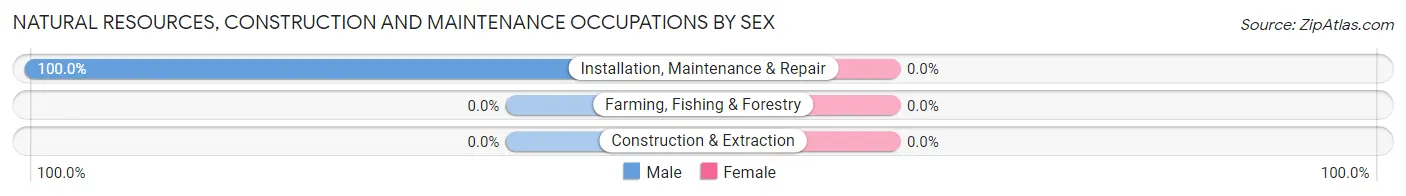
| Occupation | Male | Female |
| Farming, Fishing & Forestry | 0 (0.0%) | 0 (0.0%) |
| Construction & Extraction | 0 (0.0%) | 0 (0.0%) |
| Installation, Maintenance & Repair | 1 (100.0%) | 0 (0.0%) |
| Total (Category) | 1 (100.0%) | 0 (0.0%) |
| Total (Overall) | 25 (47.2%) | 28 (52.8%) |
Production, Transportation and Moving Occupations
The most common Production, Transportation and Moving occupations in Summit Station are , and Transportation (10 | 18.9%).
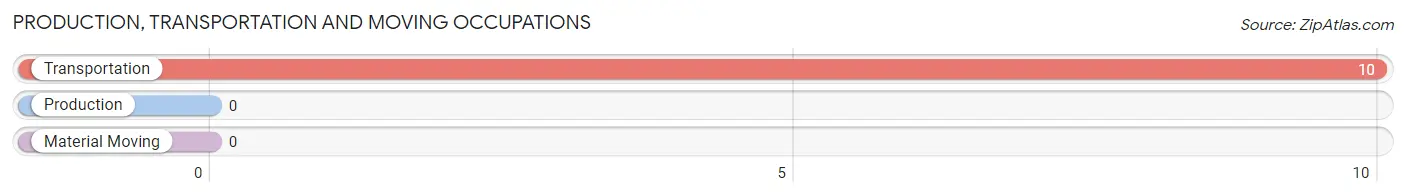
Production, Transportation and Moving Occupations by Sex
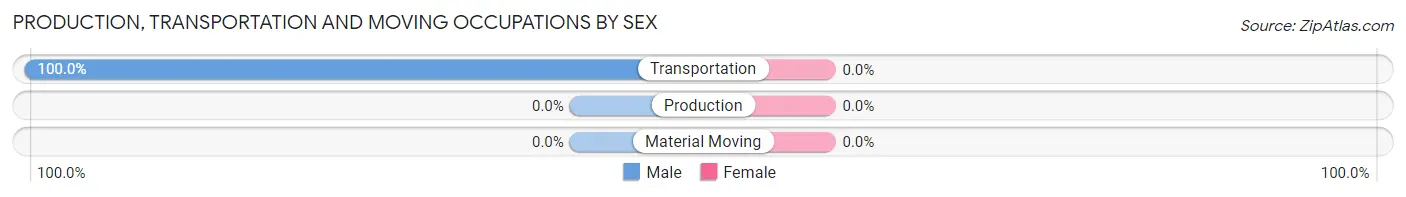
| Occupation | Male | Female |
| Production | 0 (0.0%) | 0 (0.0%) |
| Transportation | 10 (100.0%) | 0 (0.0%) |
| Material Moving | 0 (0.0%) | 0 (0.0%) |
| Total (Category) | 10 (100.0%) | 0 (0.0%) |
| Total (Overall) | 25 (47.2%) | 28 (52.8%) |
Employment Industries by Sex in Summit Station
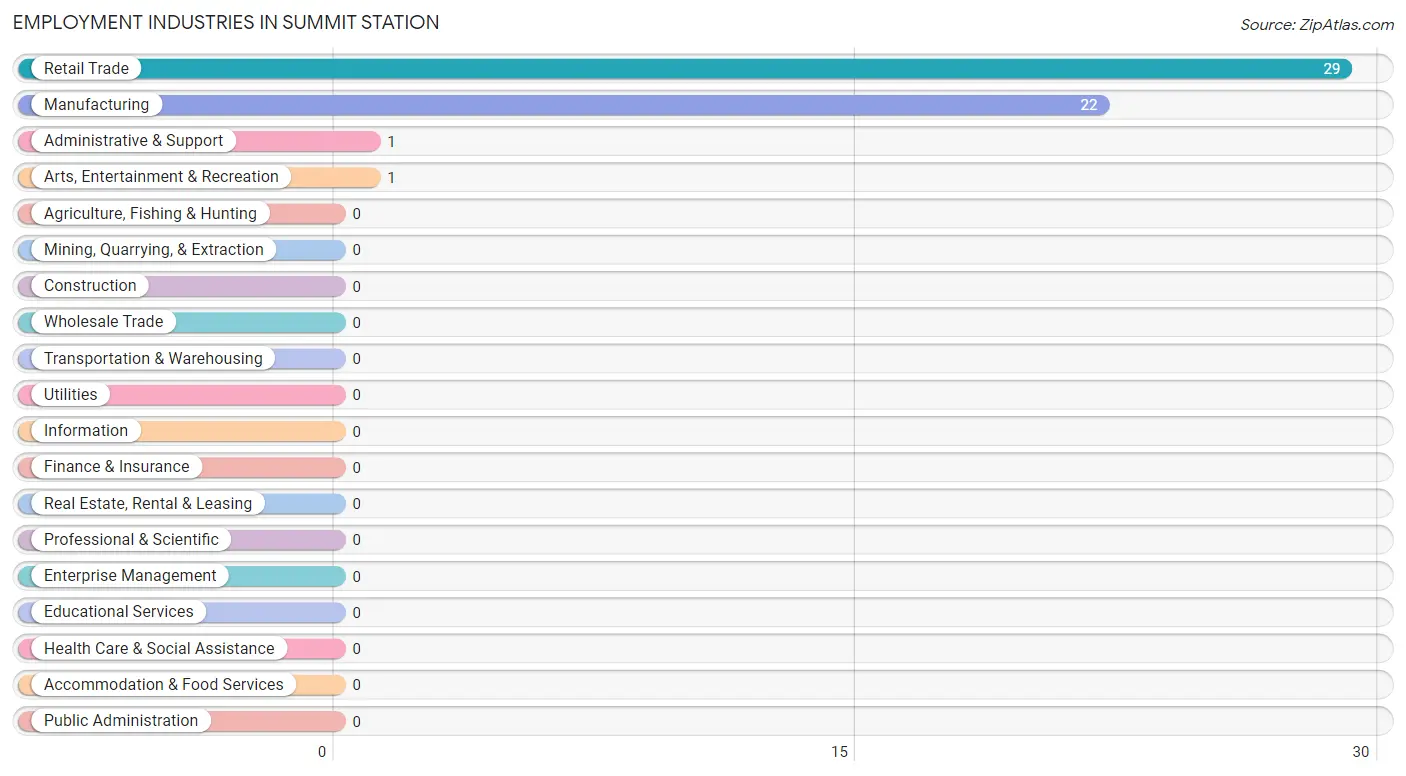
Employment Industries in Summit Station
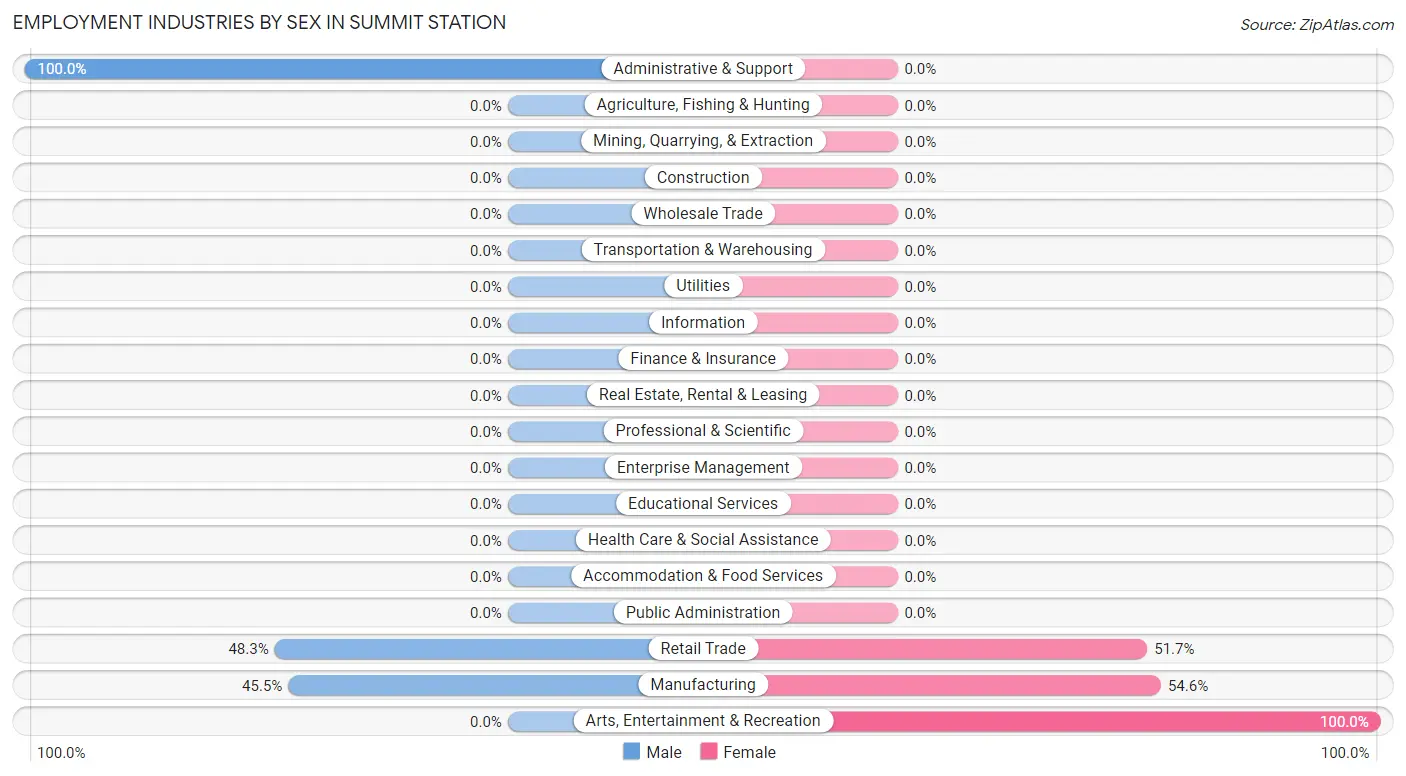
The major employment industries in Summit Station include Retail Trade (29 | 54.7%), Manufacturing (22 | 41.5%), Administrative & Support (1 | 1.9%), and Arts, Entertainment & Recreation (1 | 1.9%).
Employment Industries by Sex in Summit Station
The Summit Station industries that see more men than women are Administrative & Support (100.0%), Retail Trade (48.3%), and Manufacturing (45.5%), whereas the industries that tend to have a higher number of women are Arts, Entertainment & Recreation (100.0%), Manufacturing (54.5%), and Retail Trade (51.7%).
| Industry | Male | Female |
| Agriculture, Fishing & Hunting | 0 (0.0%) | 0 (0.0%) |
| Mining, Quarrying, & Extraction | 0 (0.0%) | 0 (0.0%) |
| Construction | 0 (0.0%) | 0 (0.0%) |
| Manufacturing | 10 (45.5%) | 12 (54.5%) |
| Wholesale Trade | 0 (0.0%) | 0 (0.0%) |
| Retail Trade | 14 (48.3%) | 15 (51.7%) |
| Transportation & Warehousing | 0 (0.0%) | 0 (0.0%) |
| Utilities | 0 (0.0%) | 0 (0.0%) |
| Information | 0 (0.0%) | 0 (0.0%) |
| Finance & Insurance | 0 (0.0%) | 0 (0.0%) |
| Real Estate, Rental & Leasing | 0 (0.0%) | 0 (0.0%) |
| Professional & Scientific | 0 (0.0%) | 0 (0.0%) |
| Enterprise Management | 0 (0.0%) | 0 (0.0%) |
| Administrative & Support | 1 (100.0%) | 0 (0.0%) |
| Educational Services | 0 (0.0%) | 0 (0.0%) |
| Health Care & Social Assistance | 0 (0.0%) | 0 (0.0%) |
| Arts, Entertainment & Recreation | 0 (0.0%) | 1 (100.0%) |
| Accommodation & Food Services | 0 (0.0%) | 0 (0.0%) |
| Public Administration | 0 (0.0%) | 0 (0.0%) |
| Total | 25 (47.2%) | 28 (52.8%) |
Education in Summit Station
School Enrollment in Summit Station
| School Level | # Students | % Students |
| Nursery / Preschool | 0 | 0.0% |
| Kindergarten | 0 | 0.0% |
| Elementary School | 0 | 0.0% |
| Middle School | 0 | 0.0% |
| High School | 0 | 0.0% |
| College / Undergraduate | 0 | 0.0% |
| Graduate / Professional | 0 | 0.0% |
| Total | 0 | 0.0% |
School Enrollment by Age by Funding Source in Summit Station
| Age Bracket | Public School | Private School |
| 3 to 4 Year Olds | 0 (0.0%) | 0 (0.0%) |
| 5 to 9 Year Old | 0 (0.0%) | 0 (0.0%) |
| 10 to 14 Year Olds | 0 (0.0%) | 0 (0.0%) |
| 15 to 17 Year Olds | 0 (0.0%) | 0 (0.0%) |
| 18 to 19 Year Olds | 0 (0.0%) | 0 (0.0%) |
| 20 to 24 Year Olds | 0 (0.0%) | 0 (0.0%) |
| 25 to 34 Year Olds | 0 (0.0%) | 0 (0.0%) |
| 35 Years and over | 0 (0.0%) | 0 (0.0%) |
| Total | 0 (0.0%) | 0 (0.0%) |
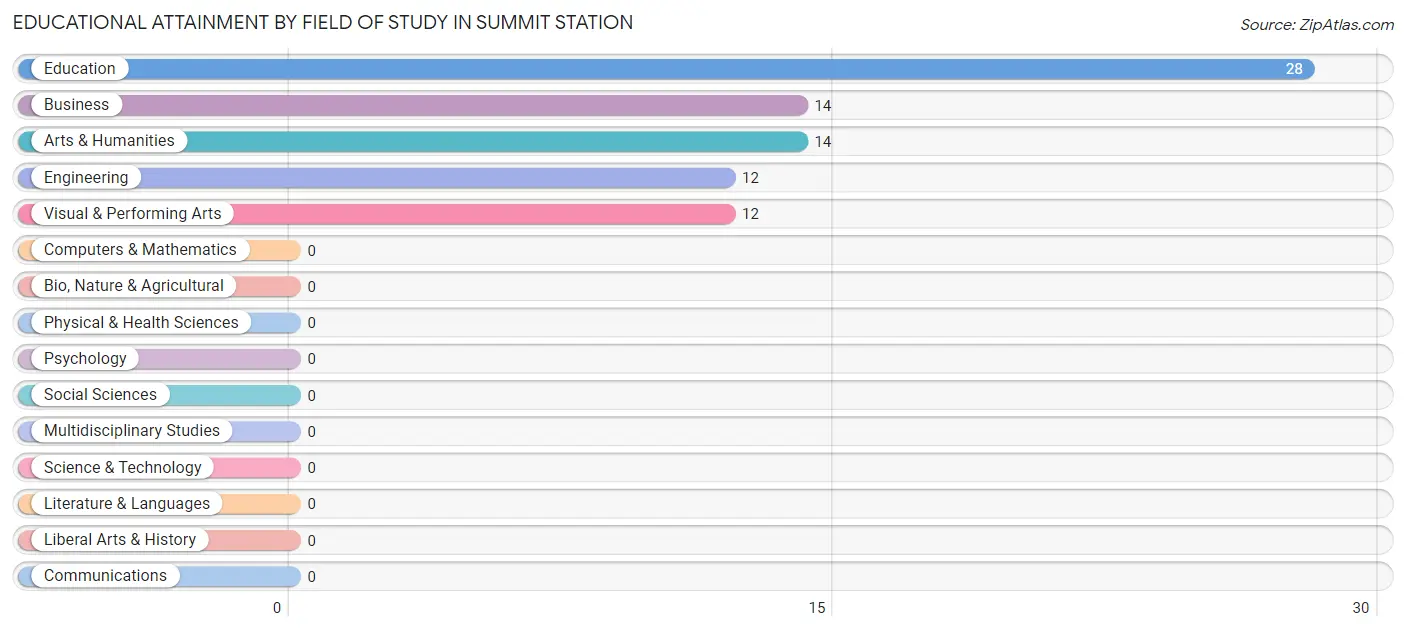
Educational Attainment by Field of Study in Summit Station
Education (28 | 35.0%), business (14 | 17.5%), arts & humanities (14 | 17.5%), engineering (12 | 15.0%), and visual & performing arts (12 | 15.0%) are the most common fields of study among 80 individuals in Summit Station who have obtained a bachelor's degree or higher.
| Field of Study | # Graduates | % Graduates |
| Computers & Mathematics | 0 | 0.0% |
| Bio, Nature & Agricultural | 0 | 0.0% |
| Physical & Health Sciences | 0 | 0.0% |
| Psychology | 0 | 0.0% |
| Social Sciences | 0 | 0.0% |
| Engineering | 12 | 15.0% |
| Multidisciplinary Studies | 0 | 0.0% |
| Science & Technology | 0 | 0.0% |
| Business | 14 | 17.5% |
| Education | 28 | 35.0% |
| Literature & Languages | 0 | 0.0% |
| Liberal Arts & History | 0 | 0.0% |
| Visual & Performing Arts | 12 | 15.0% |
| Communications | 0 | 0.0% |
| Arts & Humanities | 14 | 17.5% |
| Total | 80 | 100.0% |
Transportation & Commute in Summit Station
Vehicle Availability by Sex in Summit Station
The most prevalent vehicle ownership categories in Summit Station are males with 3 vehicles (14, accounting for 56.0%) and females with 3 vehicles (15, making up 50.0%).
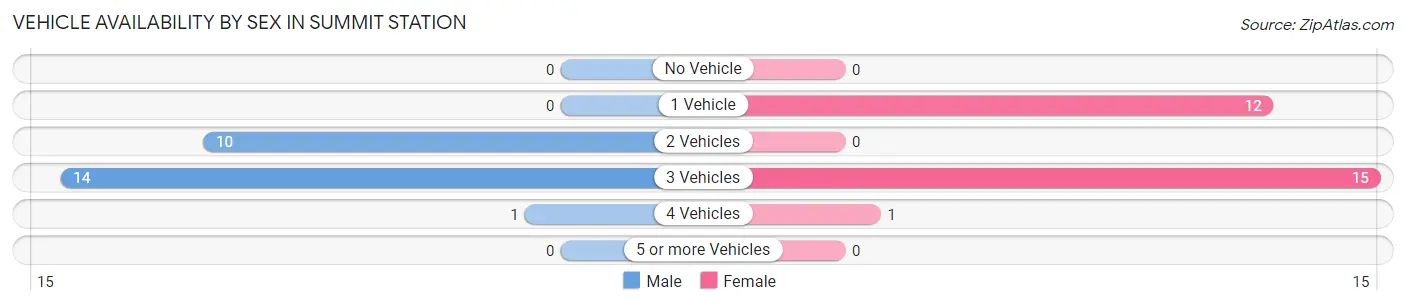
| Vehicles Available | Male | Female |
| No Vehicle | 0 (0.0%) | 0 (0.0%) |
| 1 Vehicle | 0 (0.0%) | 12 (42.9%) |
| 2 Vehicles | 10 (40.0%) | 0 (0.0%) |
| 3 Vehicles | 14 (56.0%) | 15 (53.6%) |
| 4 Vehicles | 1 (4.0%) | 1 (3.6%) |
| 5 or more Vehicles | 0 (0.0%) | 0 (0.0%) |
| Total | 25 (100.0%) | 28 (100.0%) |
Commute Time in Summit Station
The most frequently occuring commute durations in Summit Station are 15 to 19 minutes (15 commuters, 28.3%), 35 to 39 minutes (14 commuters, 26.4%), and 60 to 89 minutes (12 commuters, 22.6%).
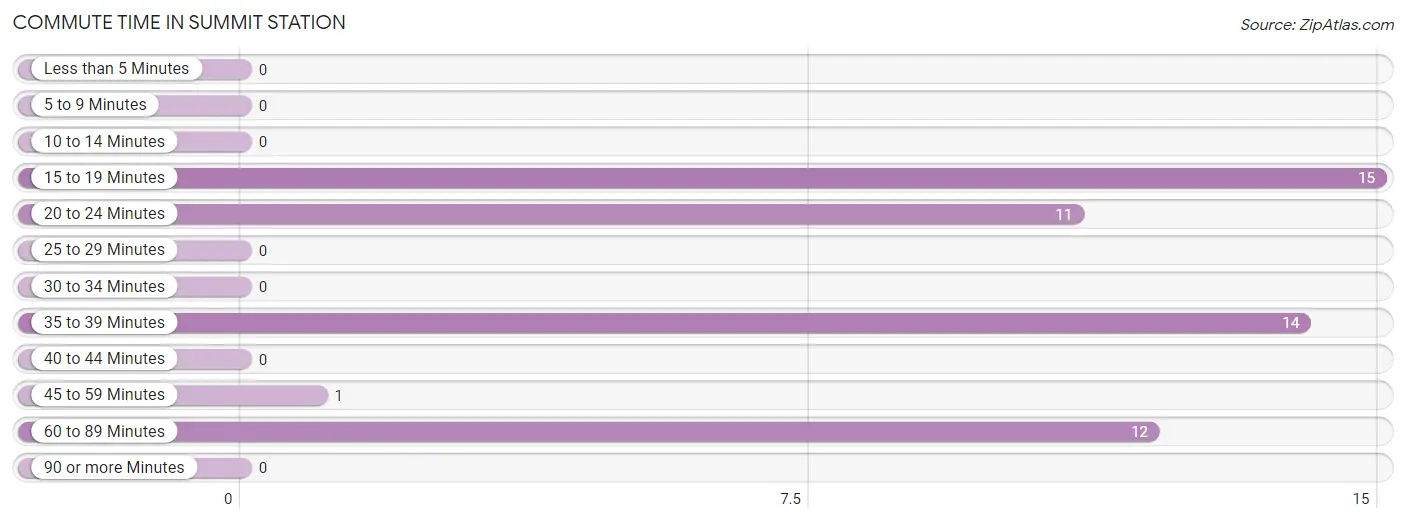
| Commute Time | # Commuters | % Commuters |
| Less than 5 Minutes | 0 | 0.0% |
| 5 to 9 Minutes | 0 | 0.0% |
| 10 to 14 Minutes | 0 | 0.0% |
| 15 to 19 Minutes | 15 | 28.3% |
| 20 to 24 Minutes | 11 | 20.7% |
| 25 to 29 Minutes | 0 | 0.0% |
| 30 to 34 Minutes | 0 | 0.0% |
| 35 to 39 Minutes | 14 | 26.4% |
| 40 to 44 Minutes | 0 | 0.0% |
| 45 to 59 Minutes | 1 | 1.9% |
| 60 to 89 Minutes | 12 | 22.6% |
| 90 or more Minutes | 0 | 0.0% |
Commute Time by Sex in Summit Station
The most common commute times in Summit Station are 35 to 39 minutes (14 commuters, 56.0%) for males and 15 to 19 minutes (15 commuters, 53.6%) for females.
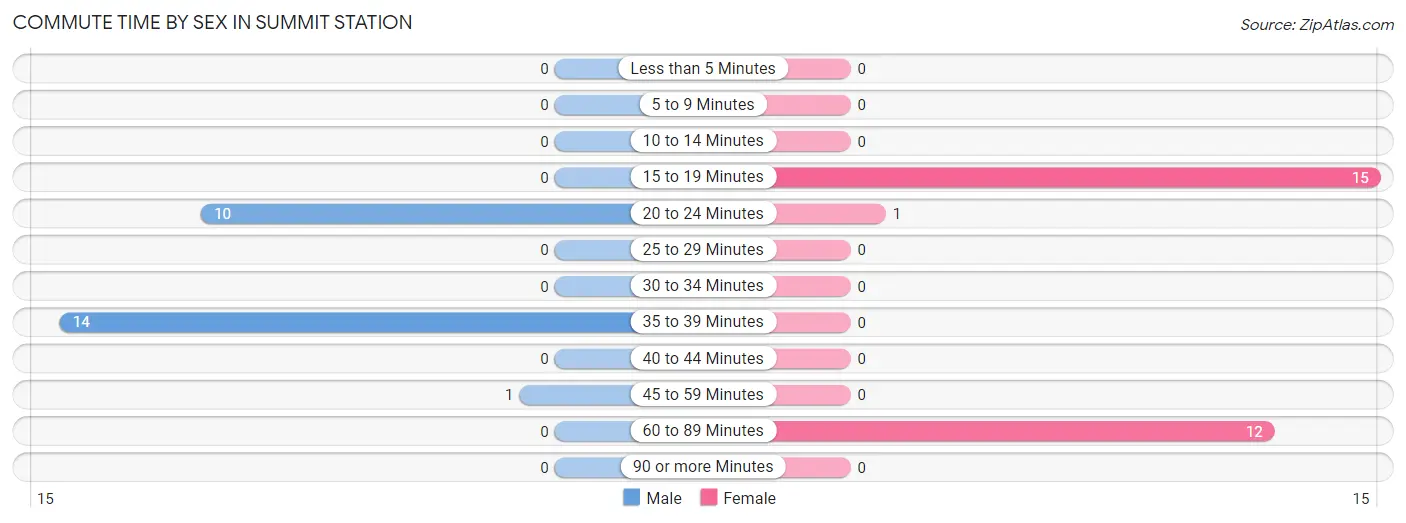
| Commute Time | Male | Female |
| Less than 5 Minutes | 0 (0.0%) | 0 (0.0%) |
| 5 to 9 Minutes | 0 (0.0%) | 0 (0.0%) |
| 10 to 14 Minutes | 0 (0.0%) | 0 (0.0%) |
| 15 to 19 Minutes | 0 (0.0%) | 15 (53.6%) |
| 20 to 24 Minutes | 10 (40.0%) | 1 (3.6%) |
| 25 to 29 Minutes | 0 (0.0%) | 0 (0.0%) |
| 30 to 34 Minutes | 0 (0.0%) | 0 (0.0%) |
| 35 to 39 Minutes | 14 (56.0%) | 0 (0.0%) |
| 40 to 44 Minutes | 0 (0.0%) | 0 (0.0%) |
| 45 to 59 Minutes | 1 (4.0%) | 0 (0.0%) |
| 60 to 89 Minutes | 0 (0.0%) | 12 (42.9%) |
| 90 or more Minutes | 0 (0.0%) | 0 (0.0%) |
Time of Departure to Work by Sex in Summit Station
The most frequent times of departure to work in Summit Station are 5:30 AM to 5:59 AM (14, 56.0%) for males and 5:00 AM to 5:29 AM (15, 53.6%) for females.
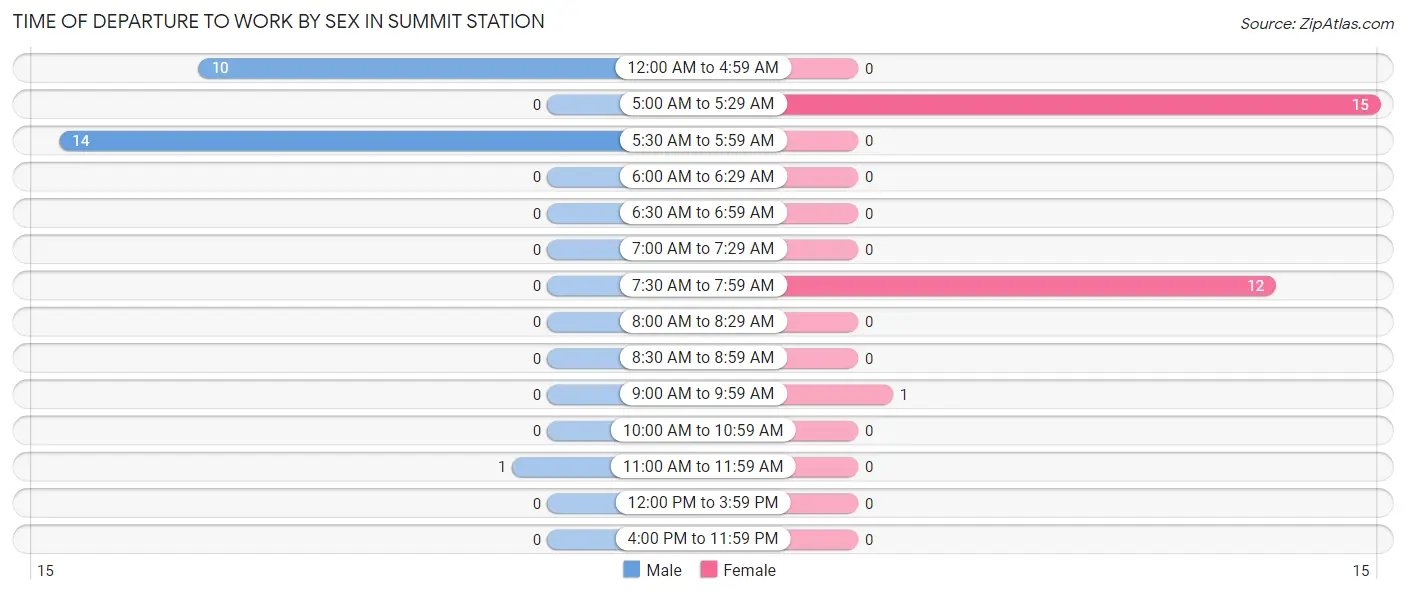
| Time of Departure | Male | Female |
| 12:00 AM to 4:59 AM | 10 (40.0%) | 0 (0.0%) |
| 5:00 AM to 5:29 AM | 0 (0.0%) | 15 (53.6%) |
| 5:30 AM to 5:59 AM | 14 (56.0%) | 0 (0.0%) |
| 6:00 AM to 6:29 AM | 0 (0.0%) | 0 (0.0%) |
| 6:30 AM to 6:59 AM | 0 (0.0%) | 0 (0.0%) |
| 7:00 AM to 7:29 AM | 0 (0.0%) | 0 (0.0%) |
| 7:30 AM to 7:59 AM | 0 (0.0%) | 12 (42.9%) |
| 8:00 AM to 8:29 AM | 0 (0.0%) | 0 (0.0%) |
| 8:30 AM to 8:59 AM | 0 (0.0%) | 0 (0.0%) |
| 9:00 AM to 9:59 AM | 0 (0.0%) | 1 (3.6%) |
| 10:00 AM to 10:59 AM | 0 (0.0%) | 0 (0.0%) |
| 11:00 AM to 11:59 AM | 1 (4.0%) | 0 (0.0%) |
| 12:00 PM to 3:59 PM | 0 (0.0%) | 0 (0.0%) |
| 4:00 PM to 11:59 PM | 0 (0.0%) | 0 (0.0%) |
| Total | 25 (100.0%) | 28 (100.0%) |
Housing Occupancy in Summit Station
Occupancy by Ownership in Summit Station
Of the total 122 dwellings in Summit Station, owner-occupied units account for 122 (100.0%), while renter-occupied units make up 0 (0.0%).
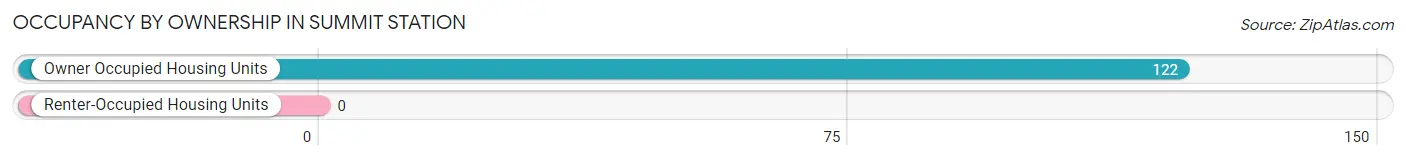
| Occupancy | # Housing Units | % Housing Units |
| Owner Occupied Housing Units | 122 | 100.0% |
| Renter-Occupied Housing Units | 0 | 0.0% |
| Total Occupied Housing Units | 122 | 100.0% |
Occupancy by Household Size in Summit Station
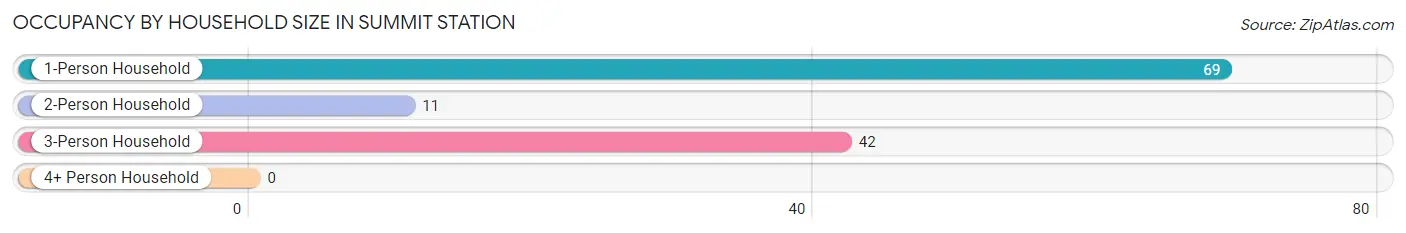
| Household Size | # Housing Units | % Housing Units |
| 1-Person Household | 69 | 56.6% |
| 2-Person Household | 11 | 9.0% |
| 3-Person Household | 42 | 34.4% |
| 4+ Person Household | 0 | 0.0% |
| Total Housing Units | 122 | 100.0% |
Occupancy by Ownership by Household Size in Summit Station
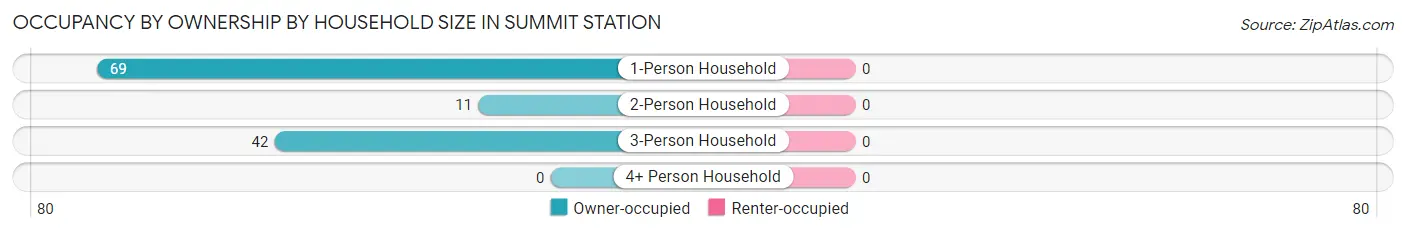
| Household Size | Owner-occupied | Renter-occupied |
| 1-Person Household | 69 (100.0%) | 0 (0.0%) |
| 2-Person Household | 11 (100.0%) | 0 (0.0%) |
| 3-Person Household | 42 (100.0%) | 0 (0.0%) |
| 4+ Person Household | 0 (0.0%) | 0 (0.0%) |
| Total Housing Units | 122 (100.0%) | 0 (0.0%) |
Occupancy by Educational Attainment in Summit Station
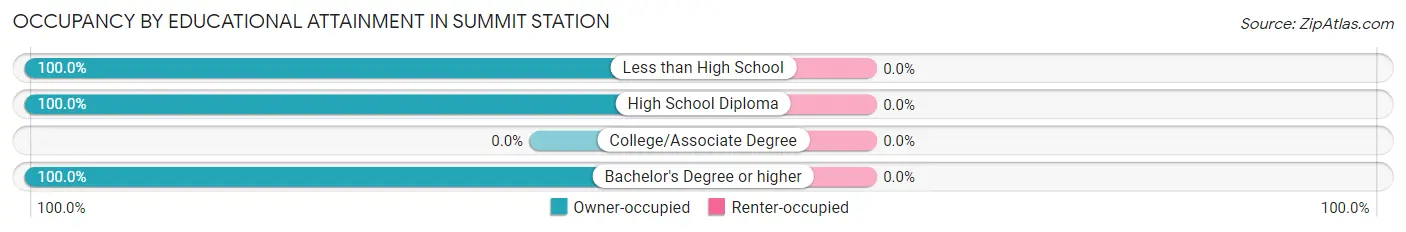
| Household Size | Owner-occupied | Renter-occupied |
| Less than High School | 45 (100.0%) | 0 (0.0%) |
| High School Diploma | 11 (100.0%) | 0 (0.0%) |
| College/Associate Degree | 0 (0.0%) | 0 (0.0%) |
| Bachelor's Degree or higher | 66 (100.0%) | 0 (0.0%) |
Occupancy by Age of Householder in Summit Station
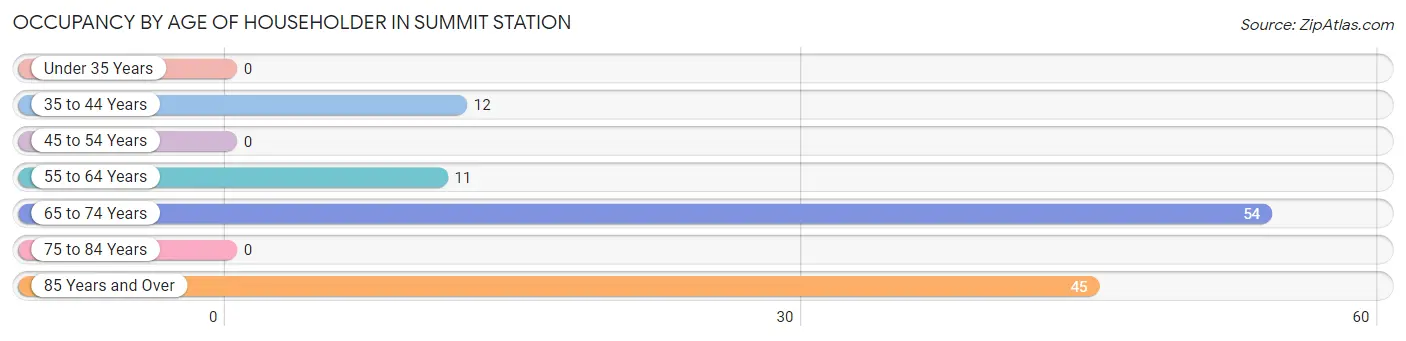
| Age Bracket | # Households | % Households |
| Under 35 Years | 0 | 0.0% |
| 35 to 44 Years | 12 | 9.8% |
| 45 to 54 Years | 0 | 0.0% |
| 55 to 64 Years | 11 | 9.0% |
| 65 to 74 Years | 54 | 44.3% |
| 75 to 84 Years | 0 | 0.0% |
| 85 Years and Over | 45 | 36.9% |
| Total | 122 | 100.0% |
Housing Finances in Summit Station
Median Income by Occupancy in Summit Station
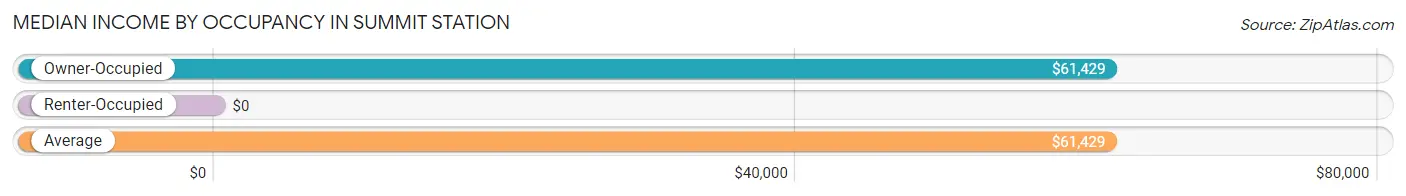
| Occupancy Type | # Households | Median Income |
| Owner-Occupied | 122 (100.0%) | $61,429 |
| Renter-Occupied | 0 (0.0%) | $0 |
| Average | 122 (100.0%) | $61,429 |
Occupancy by Householder Income Bracket in Summit Station
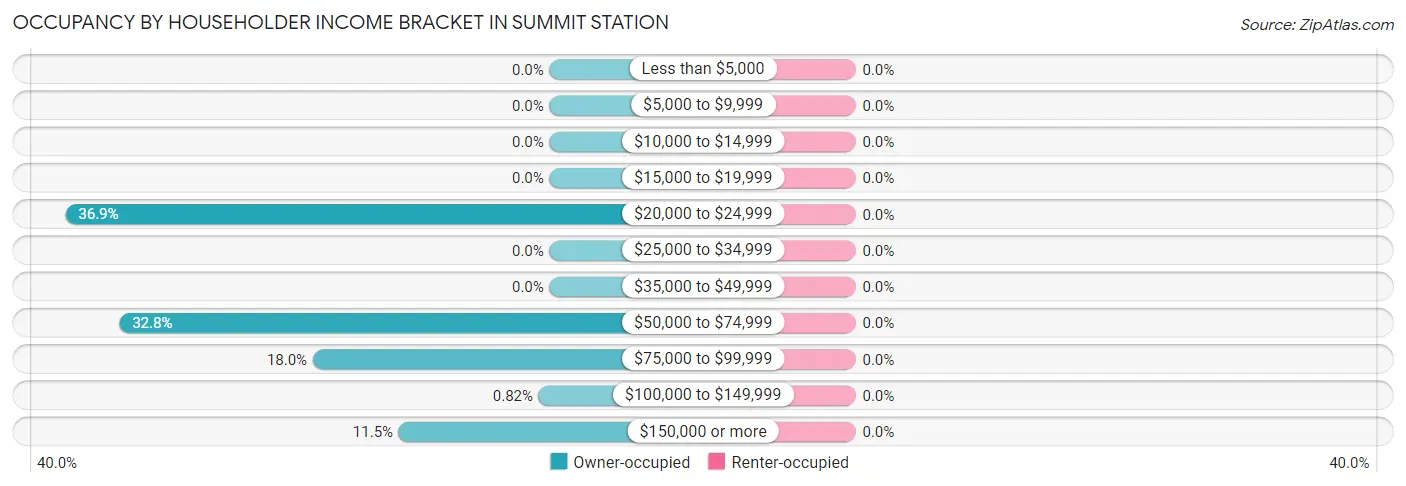
| Income Bracket | Owner-occupied | Renter-occupied |
| Less than $5,000 | 0 (0.0%) | 0 (0.0%) |
| $5,000 to $9,999 | 0 (0.0%) | 0 (0.0%) |
| $10,000 to $14,999 | 0 (0.0%) | 0 (0.0%) |
| $15,000 to $19,999 | 0 (0.0%) | 0 (0.0%) |
| $20,000 to $24,999 | 45 (36.9%) | 0 (0.0%) |
| $25,000 to $34,999 | 0 (0.0%) | 0 (0.0%) |
| $35,000 to $49,999 | 0 (0.0%) | 0 (0.0%) |
| $50,000 to $74,999 | 40 (32.8%) | 0 (0.0%) |
| $75,000 to $99,999 | 22 (18.0%) | 0 (0.0%) |
| $100,000 to $149,999 | 1 (0.8%) | 0 (0.0%) |
| $150,000 or more | 14 (11.5%) | 0 (0.0%) |
| Total | 122 (100.0%) | 0 (0.0%) |
Monthly Housing Cost Tiers in Summit Station
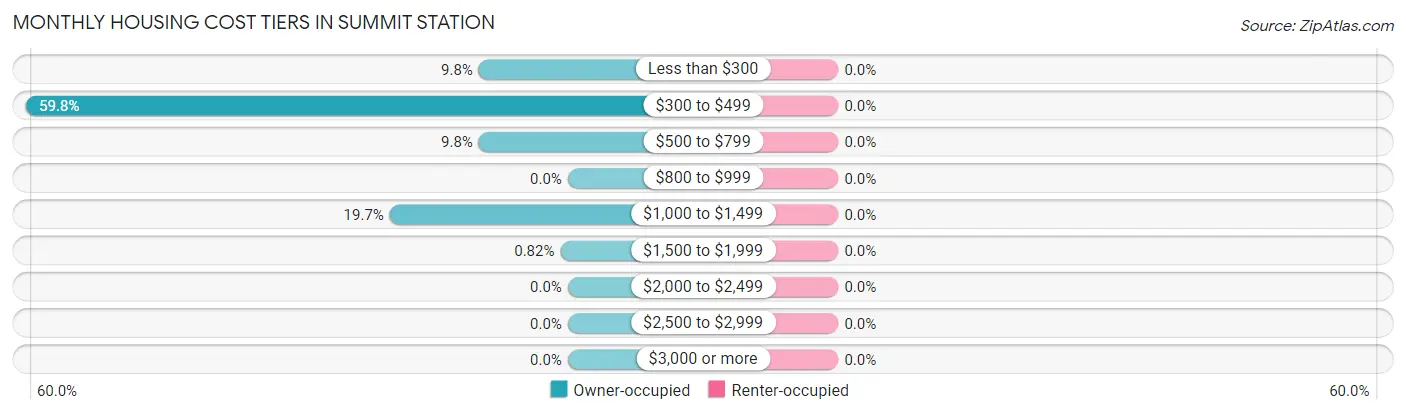
| Monthly Cost | Owner-occupied | Renter-occupied |
| Less than $300 | 12 (9.8%) | 0 (0.0%) |
| $300 to $499 | 73 (59.8%) | 0 (0.0%) |
| $500 to $799 | 12 (9.8%) | 0 (0.0%) |
| $800 to $999 | 0 (0.0%) | 0 (0.0%) |
| $1,000 to $1,499 | 24 (19.7%) | 0 (0.0%) |
| $1,500 to $1,999 | 1 (0.8%) | 0 (0.0%) |
| $2,000 to $2,499 | 0 (0.0%) | 0 (0.0%) |
| $2,500 to $2,999 | 0 (0.0%) | 0 (0.0%) |
| $3,000 or more | 0 (0.0%) | 0 (0.0%) |
| Total | 122 (100.0%) | 0 (0.0%) |
Physical Housing Characteristics in Summit Station
Housing Structures in Summit Station
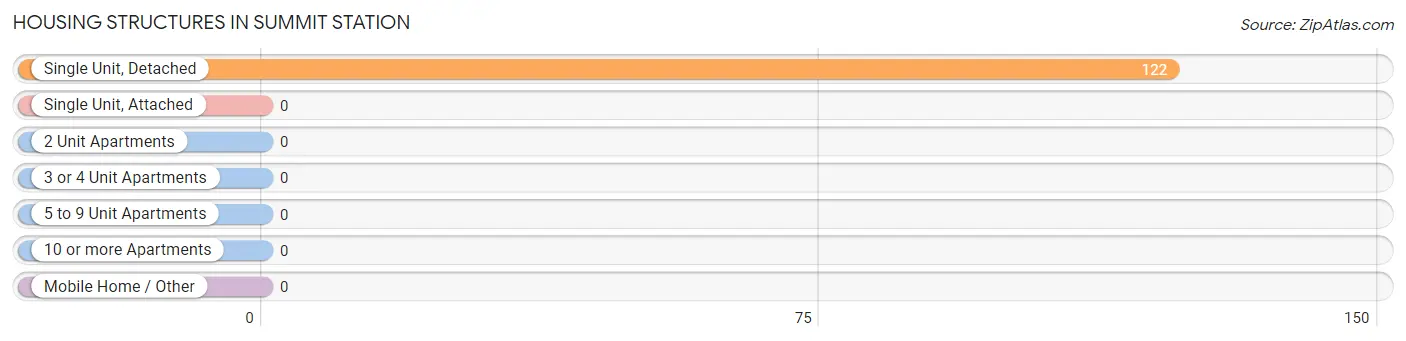
| Structure Type | # Housing Units | % Housing Units |
| Single Unit, Detached | 122 | 100.0% |
| Single Unit, Attached | 0 | 0.0% |
| 2 Unit Apartments | 0 | 0.0% |
| 3 or 4 Unit Apartments | 0 | 0.0% |
| 5 to 9 Unit Apartments | 0 | 0.0% |
| 10 or more Apartments | 0 | 0.0% |
| Mobile Home / Other | 0 | 0.0% |
| Total | 122 | 100.0% |
Housing Structures by Occupancy in Summit Station
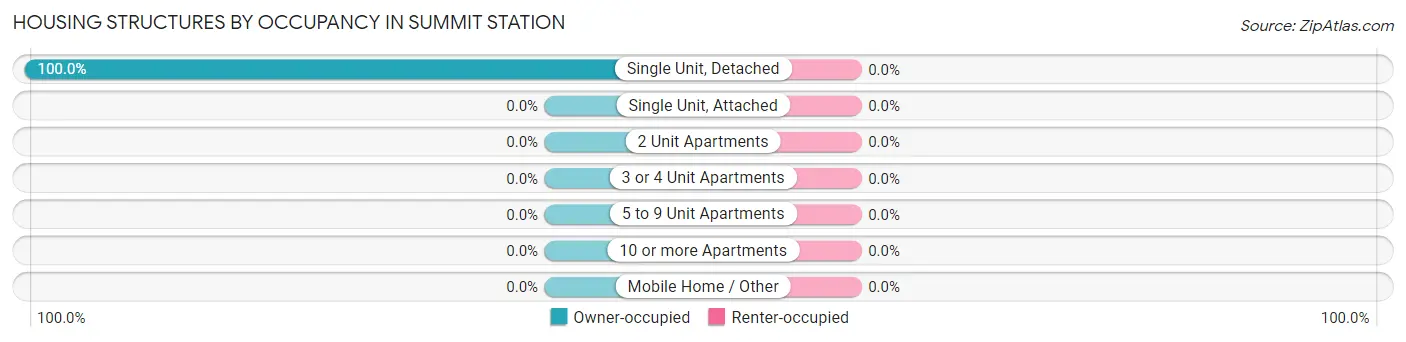
| Structure Type | Owner-occupied | Renter-occupied |
| Single Unit, Detached | 122 (100.0%) | 0 (0.0%) |
| Single Unit, Attached | 0 (0.0%) | 0 (0.0%) |
| 2 Unit Apartments | 0 (0.0%) | 0 (0.0%) |
| 3 or 4 Unit Apartments | 0 (0.0%) | 0 (0.0%) |
| 5 to 9 Unit Apartments | 0 (0.0%) | 0 (0.0%) |
| 10 or more Apartments | 0 (0.0%) | 0 (0.0%) |
| Mobile Home / Other | 0 (0.0%) | 0 (0.0%) |
| Total | 122 (100.0%) | 0 (0.0%) |
Housing Structures by Number of Rooms in Summit Station
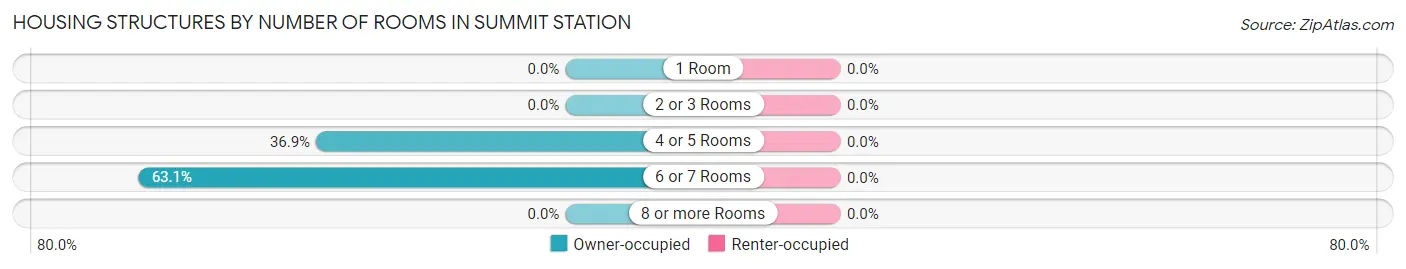
| Number of Rooms | Owner-occupied | Renter-occupied |
| 1 Room | 0 (0.0%) | 0 (0.0%) |
| 2 or 3 Rooms | 0 (0.0%) | 0 (0.0%) |
| 4 or 5 Rooms | 45 (36.9%) | 0 (0.0%) |
| 6 or 7 Rooms | 77 (63.1%) | 0 (0.0%) |
| 8 or more Rooms | 0 (0.0%) | 0 (0.0%) |
| Total | 122 (100.0%) | 0 (0.0%) |
Housing Structure by Heating Type in Summit Station
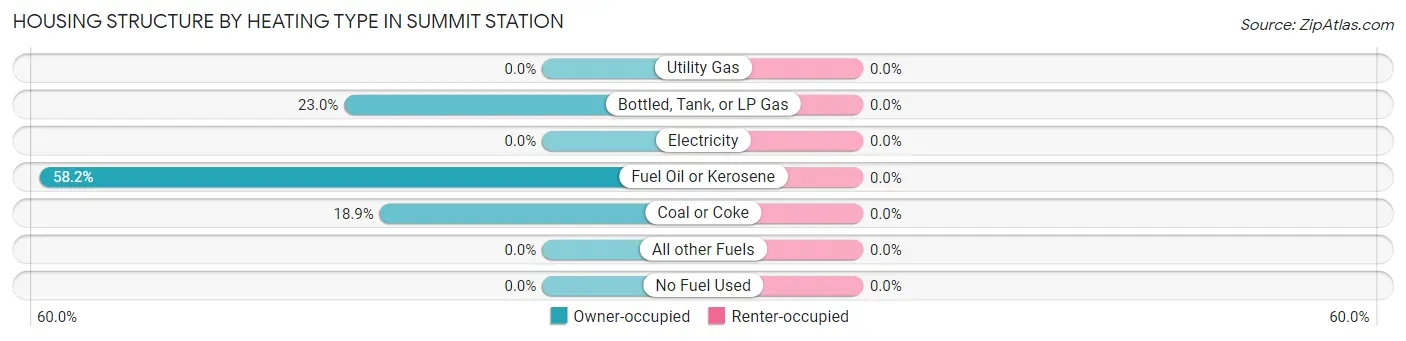
| Heating Type | Owner-occupied | Renter-occupied |
| Utility Gas | 0 (0.0%) | 0 (0.0%) |
| Bottled, Tank, or LP Gas | 28 (23.0%) | 0 (0.0%) |
| Electricity | 0 (0.0%) | 0 (0.0%) |
| Fuel Oil or Kerosene | 71 (58.2%) | 0 (0.0%) |
| Coal or Coke | 23 (18.9%) | 0 (0.0%) |
| All other Fuels | 0 (0.0%) | 0 (0.0%) |
| No Fuel Used | 0 (0.0%) | 0 (0.0%) |
| Total | 122 (100.0%) | 0 (0.0%) |
Household Vehicle Usage in Summit Station
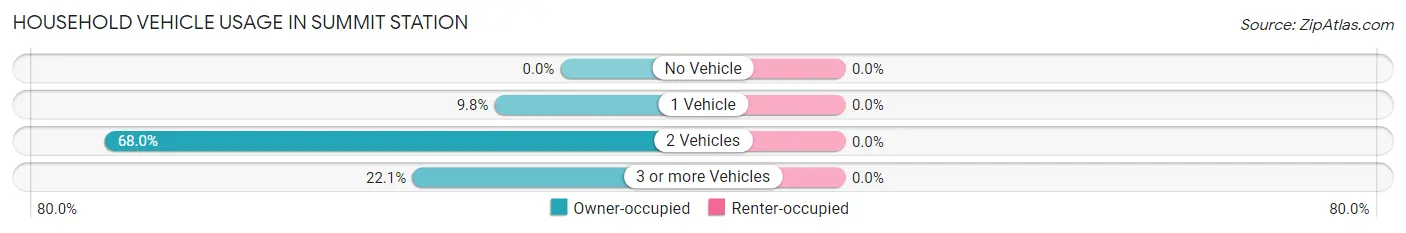
| Vehicles per Household | Owner-occupied | Renter-occupied |
| No Vehicle | 0 (0.0%) | 0 (0.0%) |
| 1 Vehicle | 12 (9.8%) | 0 (0.0%) |
| 2 Vehicles | 83 (68.0%) | 0 (0.0%) |
| 3 or more Vehicles | 27 (22.1%) | 0 (0.0%) |
| Total | 122 (100.0%) | 0 (0.0%) |
Real Estate & Mortgages in Summit Station
Real Estate and Mortgage Overview in Summit Station
| Characteristic | Without Mortgage | With Mortgage |
| Housing Units | 97 | 25 |
| Median Property Value | $111,400 | $258,300 |
| Median Household Income | - | - |
| Monthly Housing Costs | $391 | $0 |
| Real Estate Taxes | - | - |
Property Value by Mortgage Status in Summit Station
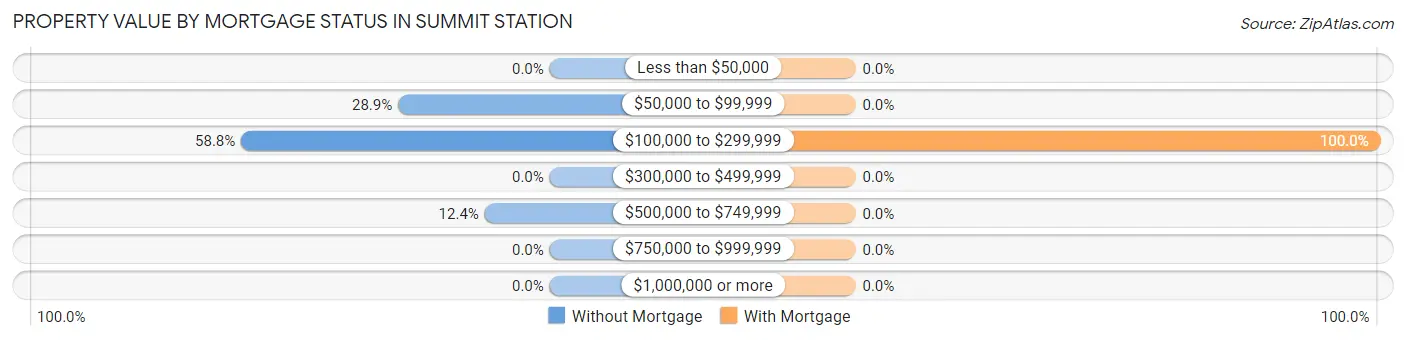
| Property Value | Without Mortgage | With Mortgage |
| Less than $50,000 | 0 (0.0%) | 0 (0.0%) |
| $50,000 to $99,999 | 28 (28.9%) | 0 (0.0%) |
| $100,000 to $299,999 | 57 (58.8%) | 25 (100.0%) |
| $300,000 to $499,999 | 0 (0.0%) | 0 (0.0%) |
| $500,000 to $749,999 | 12 (12.4%) | 0 (0.0%) |
| $750,000 to $999,999 | 0 (0.0%) | 0 (0.0%) |
| $1,000,000 or more | 0 (0.0%) | 0 (0.0%) |
| Total | 97 (100.0%) | 25 (100.0%) |
Household Income by Mortgage Status in Summit Station
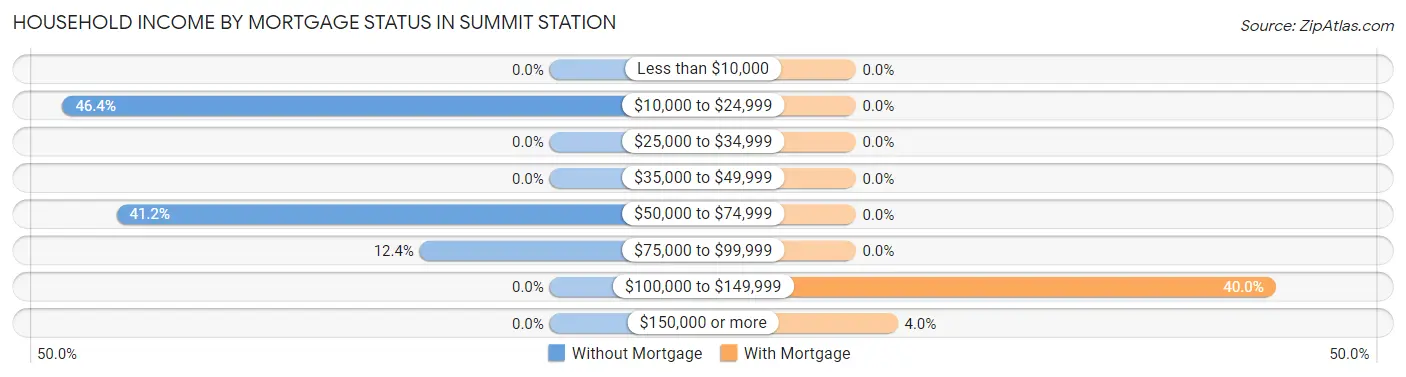
| Household Income | Without Mortgage | With Mortgage |
| Less than $10,000 | 0 (0.0%) | 0 (0.0%) |
| $10,000 to $24,999 | 45 (46.4%) | 0 (0.0%) |
| $25,000 to $34,999 | 0 (0.0%) | 0 (0.0%) |
| $35,000 to $49,999 | 0 (0.0%) | 0 (0.0%) |
| $50,000 to $74,999 | 40 (41.2%) | 0 (0.0%) |
| $75,000 to $99,999 | 12 (12.4%) | 0 (0.0%) |
| $100,000 to $149,999 | 0 (0.0%) | 10 (40.0%) |
| $150,000 or more | 0 (0.0%) | 1 (4.0%) |
| Total | 97 (100.0%) | 25 (100.0%) |
Property Value to Household Income Ratio in Summit Station
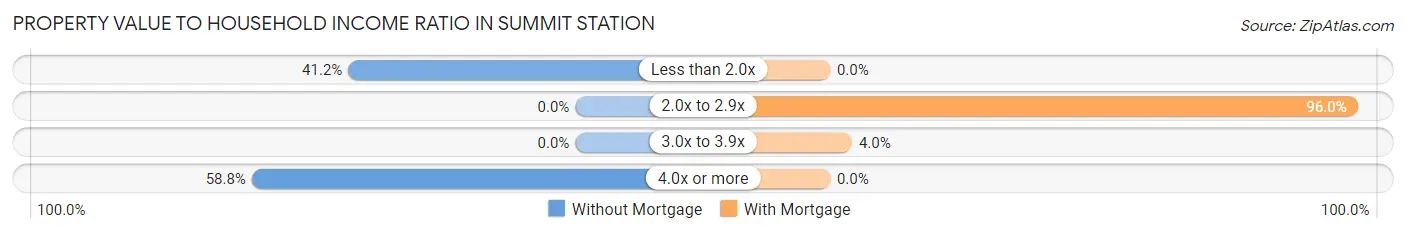
| Value-to-Income Ratio | Without Mortgage | With Mortgage |
| Less than 2.0x | 40 (41.2%) | 0 (0.0%) |
| 2.0x to 2.9x | 0 (0.0%) | 24 (96.0%) |
| 3.0x to 3.9x | 0 (0.0%) | 1 (4.0%) |
| 4.0x or more | 57 (58.8%) | 0 (0.0%) |
| Total | 97 (100.0%) | 25 (100.0%) |
Real Estate Taxes by Mortgage Status in Summit Station
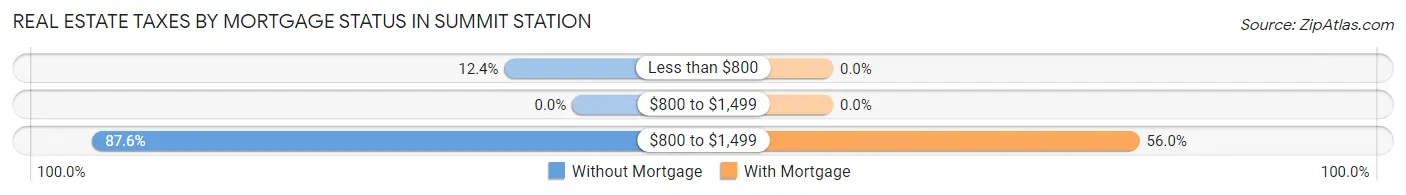
| Property Taxes | Without Mortgage | With Mortgage |
| Less than $800 | 12 (12.4%) | 0 (0.0%) |
| $800 to $1,499 | 0 (0.0%) | 0 (0.0%) |
| $800 to $1,499 | 85 (87.6%) | 14 (56.0%) |
| Total | 97 (100.0%) | 25 (100.0%) |
Health & Disability in Summit Station
Health Insurance Coverage by Age in Summit Station
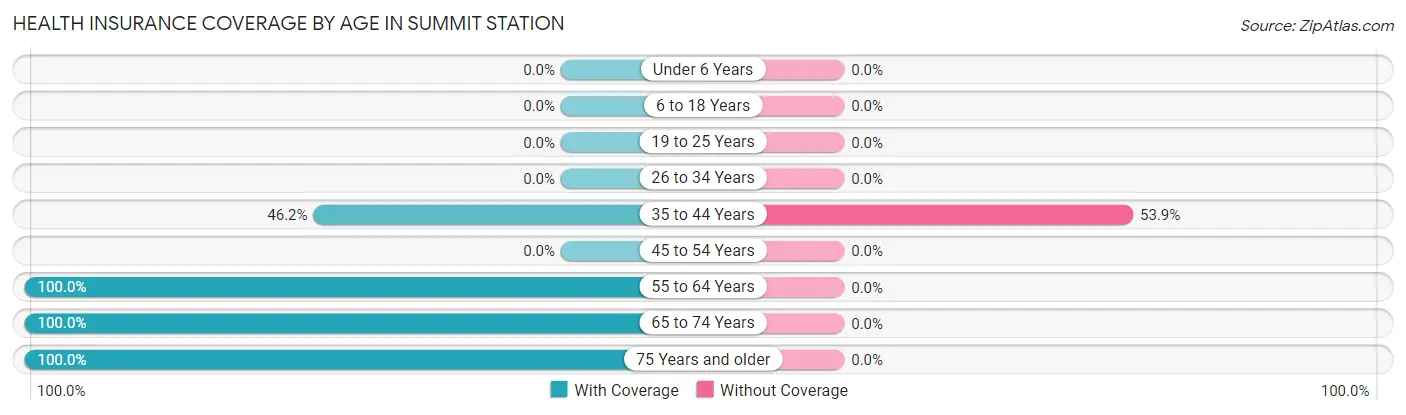
| Age Bracket | With Coverage | Without Coverage |
| Under 6 Years | 0 (0.0%) | 0 (0.0%) |
| 6 to 18 Years | 0 (0.0%) | 0 (0.0%) |
| 19 to 25 Years | 0 (0.0%) | 0 (0.0%) |
| 26 to 34 Years | 0 (0.0%) | 0 (0.0%) |
| 35 to 44 Years | 12 (46.2%) | 14 (53.8%) |
| 45 to 54 Years | 0 (0.0%) | 0 (0.0%) |
| 55 to 64 Years | 38 (100.0%) | 0 (0.0%) |
| 65 to 74 Years | 82 (100.0%) | 0 (0.0%) |
| 75 Years and older | 73 (100.0%) | 0 (0.0%) |
| Total | 205 (93.6%) | 14 (6.4%) |
Health Insurance Coverage by Citizenship Status in Summit Station
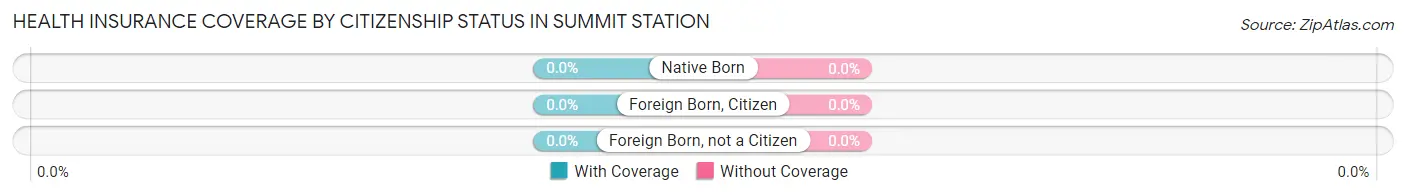
| Citizenship Status | With Coverage | Without Coverage |
| Native Born | 0 (0.0%) | 0 (0.0%) |
| Foreign Born, Citizen | 0 (0.0%) | 0 (0.0%) |
| Foreign Born, not a Citizen | 0 (0.0%) | 0 (0.0%) |
Health Insurance Coverage by Household Income in Summit Station
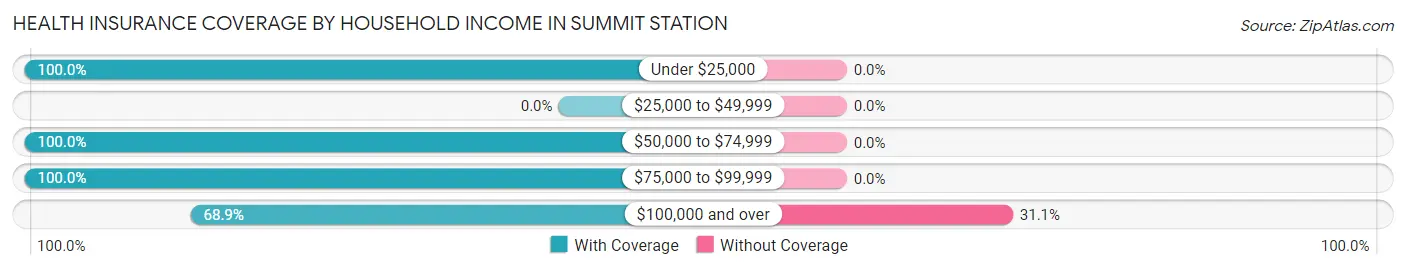
| Household Income | With Coverage | Without Coverage |
| Under $25,000 | 45 (100.0%) | 0 (0.0%) |
| $25,000 to $49,999 | 0 (0.0%) | 0 (0.0%) |
| $50,000 to $74,999 | 96 (100.0%) | 0 (0.0%) |
| $75,000 to $99,999 | 33 (100.0%) | 0 (0.0%) |
| $100,000 and over | 31 (68.9%) | 14 (31.1%) |
Public vs Private Health Insurance Coverage by Age in Summit Station
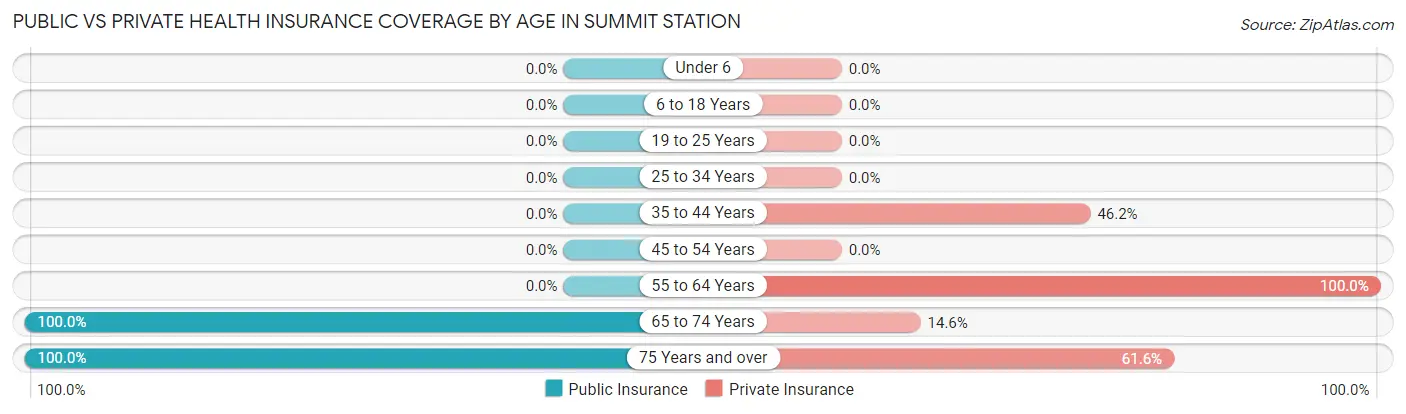
| Age Bracket | Public Insurance | Private Insurance |
| Under 6 | 0 (0.0%) | 0 (0.0%) |
| 6 to 18 Years | 0 (0.0%) | 0 (0.0%) |
| 19 to 25 Years | 0 (0.0%) | 0 (0.0%) |
| 25 to 34 Years | 0 (0.0%) | 0 (0.0%) |
| 35 to 44 Years | 0 (0.0%) | 12 (46.2%) |
| 45 to 54 Years | 0 (0.0%) | 0 (0.0%) |
| 55 to 64 Years | 0 (0.0%) | 38 (100.0%) |
| 65 to 74 Years | 82 (100.0%) | 12 (14.6%) |
| 75 Years and over | 73 (100.0%) | 45 (61.6%) |
| Total | 155 (70.8%) | 107 (48.9%) |
Disability Status by Sex by Age in Summit Station
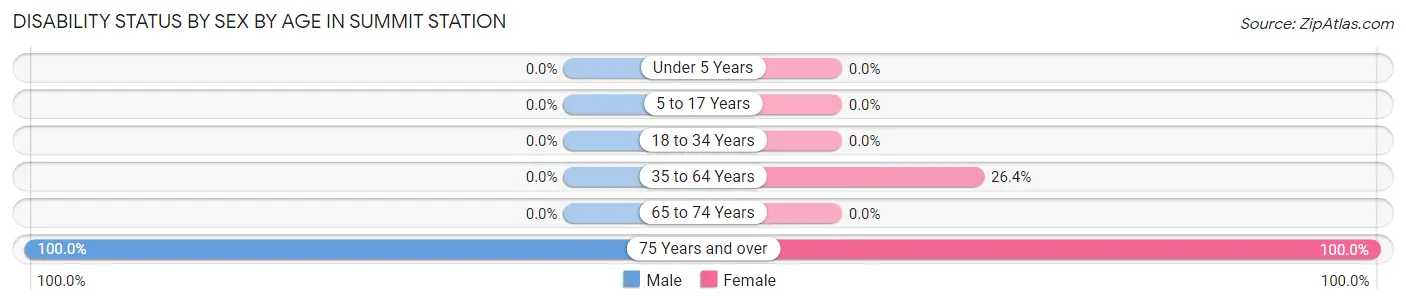
| Age Bracket | Male | Female |
| Under 5 Years | 0 (0.0%) | 0 (0.0%) |
| 5 to 17 Years | 0 (0.0%) | 0 (0.0%) |
| 18 to 34 Years | 0 (0.0%) | 0 (0.0%) |
| 35 to 64 Years | 0 (0.0%) | 14 (26.4%) |
| 65 to 74 Years | 0 (0.0%) | 0 (0.0%) |
| 75 Years and over | 45 (100.0%) | 28 (100.0%) |
Disability Class by Sex by Age in Summit Station
Disability Class: Hearing Difficulty
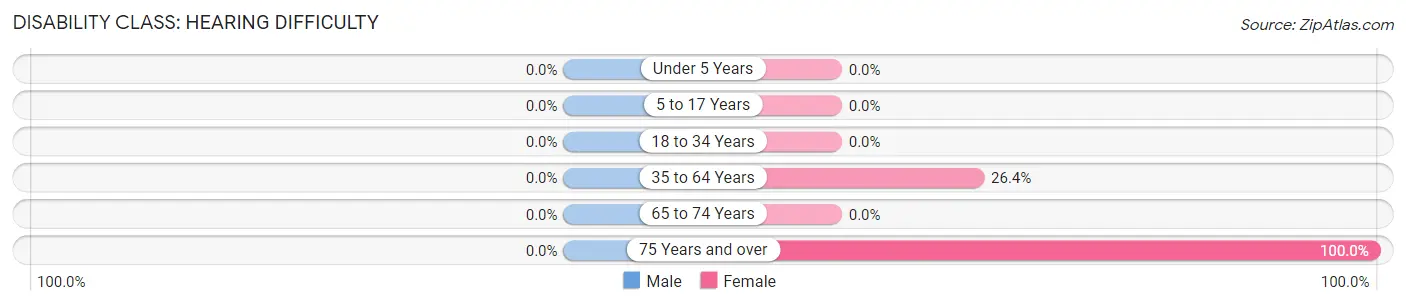
| Age Bracket | Male | Female |
| Under 5 Years | 0 (0.0%) | 0 (0.0%) |
| 5 to 17 Years | 0 (0.0%) | 0 (0.0%) |
| 18 to 34 Years | 0 (0.0%) | 0 (0.0%) |
| 35 to 64 Years | 0 (0.0%) | 14 (26.4%) |
| 65 to 74 Years | 0 (0.0%) | 0 (0.0%) |
| 75 Years and over | 0 (0.0%) | 28 (100.0%) |
Disability Class: Vision Difficulty
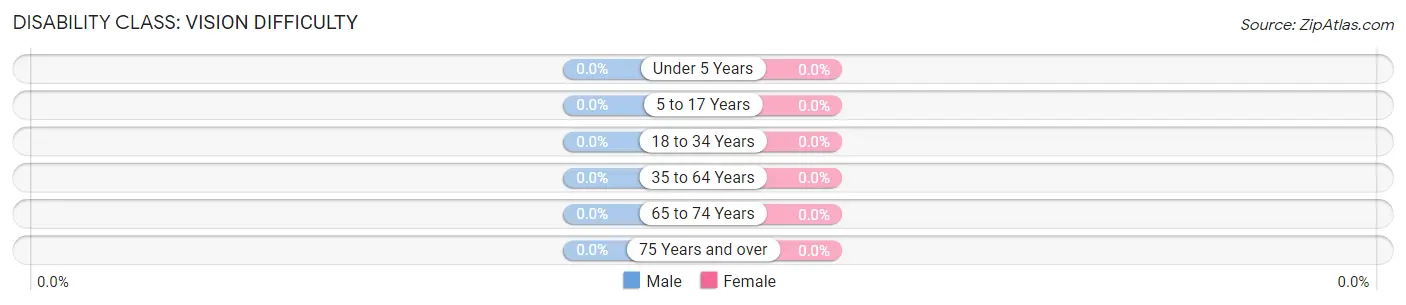
| Age Bracket | Male | Female |
| Under 5 Years | 0 (0.0%) | 0 (0.0%) |
| 5 to 17 Years | 0 (0.0%) | 0 (0.0%) |
| 18 to 34 Years | 0 (0.0%) | 0 (0.0%) |
| 35 to 64 Years | 0 (0.0%) | 0 (0.0%) |
| 65 to 74 Years | 0 (0.0%) | 0 (0.0%) |
| 75 Years and over | 0 (0.0%) | 0 (0.0%) |
Disability Class: Cognitive Difficulty
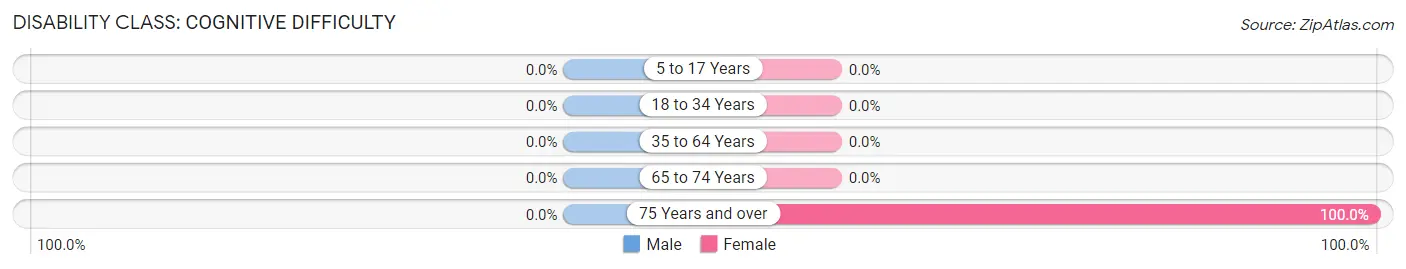
| Age Bracket | Male | Female |
| 5 to 17 Years | 0 (0.0%) | 0 (0.0%) |
| 18 to 34 Years | 0 (0.0%) | 0 (0.0%) |
| 35 to 64 Years | 0 (0.0%) | 0 (0.0%) |
| 65 to 74 Years | 0 (0.0%) | 0 (0.0%) |
| 75 Years and over | 0 (0.0%) | 28 (100.0%) |
Disability Class: Ambulatory Difficulty
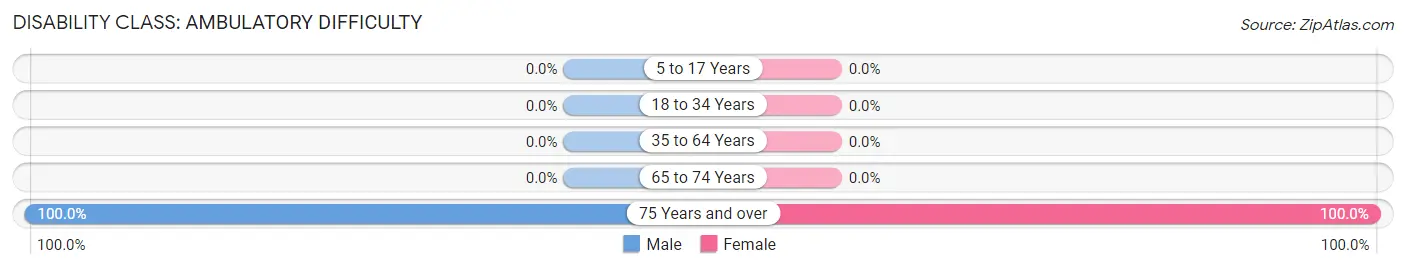
| Age Bracket | Male | Female |
| 5 to 17 Years | 0 (0.0%) | 0 (0.0%) |
| 18 to 34 Years | 0 (0.0%) | 0 (0.0%) |
| 35 to 64 Years | 0 (0.0%) | 0 (0.0%) |
| 65 to 74 Years | 0 (0.0%) | 0 (0.0%) |
| 75 Years and over | 45 (100.0%) | 28 (100.0%) |
Disability Class: Self-Care Difficulty
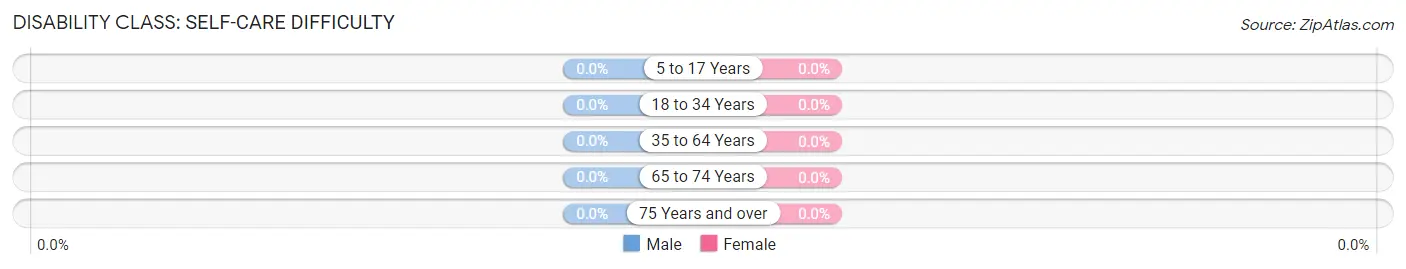
| Age Bracket | Male | Female |
| 5 to 17 Years | 0 (0.0%) | 0 (0.0%) |
| 18 to 34 Years | 0 (0.0%) | 0 (0.0%) |
| 35 to 64 Years | 0 (0.0%) | 0 (0.0%) |
| 65 to 74 Years | 0 (0.0%) | 0 (0.0%) |
| 75 Years and over | 0 (0.0%) | 0 (0.0%) |
Technology Access in Summit Station
Computing Device Access in Summit Station
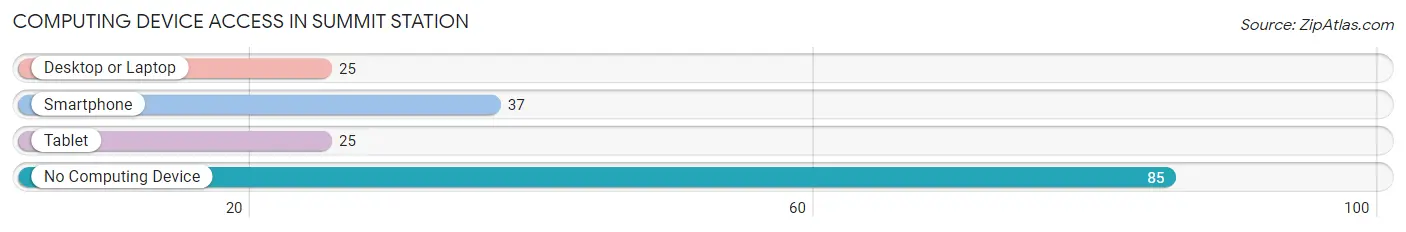
| Device Type | # Households | % Households |
| Desktop or Laptop | 25 | 20.5% |
| Smartphone | 37 | 30.3% |
| Tablet | 25 | 20.5% |
| No Computing Device | 85 | 69.7% |
| Total | 122 | 100.0% |
Internet Access in Summit Station
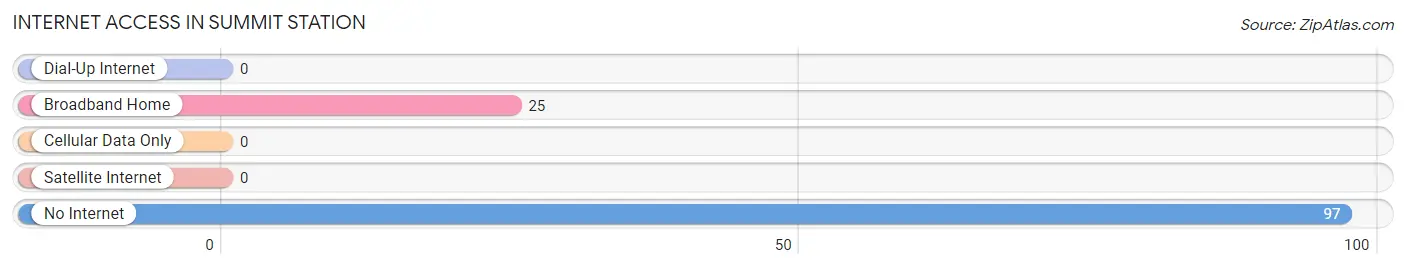
| Internet Type | # Households | % Households |
| Dial-Up Internet | 0 | 0.0% |
| Broadband Home | 25 | 20.5% |
| Cellular Data Only | 0 | 0.0% |
| Satellite Internet | 0 | 0.0% |
| No Internet | 97 | 79.5% |
| Total | 122 | 100.0% |
Summit Station Summary
Summit Station is a small unincorporated community located in Schuylkill County, Pennsylvania. It is situated in the western part of the county, near the border with Berks County. The community is located along the Schuylkill River, and is part of the Pottsville Metropolitan Statistical Area.
History
Summit Station was first settled in the early 19th century by German immigrants. The community was originally known as “Summit”, and was named for its location at the summit of the Schuylkill River. The name was later changed to Summit Station when the Reading Railroad built a station in the area in 1871. The station was used to transport coal from the nearby mines to the rest of the country.
The community grew rapidly in the late 19th and early 20th centuries, and by the 1920s it had become a bustling industrial center. The population peaked in the 1940s, when the population was estimated to be around 1,500. The population has since declined, and in the 2010 census the population was estimated to be around 500.
Geography
Summit Station is located in western Schuylkill County, near the border with Berks County. It is situated along the Schuylkill River, and is part of the Pottsville Metropolitan Statistical Area. The community is located at an elevation of 845 feet (258 m).
The climate in Summit Station is classified as humid continental, with cold winters and hot, humid summers. The average annual temperature is around 50°F (10°C), and the average annual precipitation is around 40 inches (102 cm).
Economy
Summit Station’s economy is largely based on the coal mining industry. The community is home to several coal mines, and the coal is transported to the rest of the country via the Reading Railroad. The community is also home to several small businesses, including a few restaurants and convenience stores.
Demographics
As of the 2010 census, the population of Summit Station was estimated to be around 500. The racial makeup of the community was 97.2% White, 0.8% African American, 0.4% Native American, 0.2% Asian, and 1.4% from other races. The median household income was estimated to be around $37,000, and the median home value was estimated to be around $90,000.
Conclusion
Summit Station is a small unincorporated community located in Schuylkill County, Pennsylvania. It was first settled in the early 19th century by German immigrants, and was named for its location at the summit of the Schuylkill River. The community grew rapidly in the late 19th and early 20th centuries, and by the 1920s it had become a bustling industrial center. The population has since declined, and in the 2010 census the population was estimated to be around 500. The economy of Summit Station is largely based on the coal mining industry, and the community is also home to several small businesses. The racial makeup of the community is predominantly White, with a small percentage of African American, Native American, and Asian residents. The median household income is estimated to be around $37,000, and the median home value is estimated to be around $90,000.
Common Questions
What is Per Capita Income in Summit Station?
Per Capita income in Summit Station is $36,596.
What is the Median Household income in Summit Station?
Median Household Income in Summit Station is $61,429.
What is Inequality or Gini Index in Summit Station?
Inequality or Gini Index in Summit Station is 0.36.
What is the Total Population of Summit Station?
Total Population of Summit Station is 219.
What is the Total Male Population of Summit Station?
Total Male Population of Summit Station is 110.
What is the Total Female Population of Summit Station?
Total Female Population of Summit Station is 109.
What is the Ratio of Males per 100 Females in Summit Station?
There are 100.92 Males per 100 Females in Summit Station.
What is the Ratio of Females per 100 Males in Summit Station?
There are 99.09 Females per 100 Males in Summit Station.
What is the Median Population Age in Summit Station?
Median Population Age in Summit Station is 70.3 Years.
What is the Average Family Size in Summit Station
Average Family Size in Summit Station is 2.9 People.
What is the Average Household Size in Summit Station
Average Household Size in Summit Station is 1.8 People.
How Large is the Labor Force in Summit Station?
There are 53 People in the Labor Forcein in Summit Station.
What is the Percentage of People in the Labor Force in Summit Station?
24.2% of People are in the Labor Force in Summit Station.