Palo Alto borough, PA Map & Demographics
Palo Alto borough Overview
$26,990
PER CAPITA INCOME
$54,861
AVG FAMILY INCOME
$52,176
AVG HOUSEHOLD INCOME
34.5%
WAGE / INCOME GAP [ % ]
65.5¢/ $1
WAGE / INCOME GAP [ $ ]
0.35
INEQUALITY / GINI INDEX
953
TOTAL POPULATION
468
MALE POPULATION
485
FEMALE POPULATION
96.49
MALES / 100 FEMALES
103.63
FEMALES / 100 MALES
42.0
MEDIAN AGE
2.8
AVG FAMILY SIZE
2.3
AVG HOUSEHOLD SIZE
490
LABOR FORCE [ PEOPLE ]
66.4%
PERCENT IN LABOR FORCE
4.1%
UNEMPLOYMENT RATE
Income in Palo Alto borough
Income Overview in Palo Alto borough
Per Capita Income in Palo Alto borough is $26,990, while median incomes of families and households are $54,861 and $52,176 respectively.
| Characteristic | Number | Measure |
| Per Capita Income | 953 | $26,990 |
| Median Family Income | 271 | $54,861 |
| Mean Family Income | 271 | $69,403 |
| Median Household Income | 407 | $52,176 |
| Mean Household Income | 407 | $63,038 |
| Income Deficit | 271 | $0 |
| Wage / Income Gap (%) | 953 | 34.55% |
| Wage / Income Gap ($) | 953 | 65.45¢ per $1 |
| Gini / Inequality Index | 953 | 0.35 |
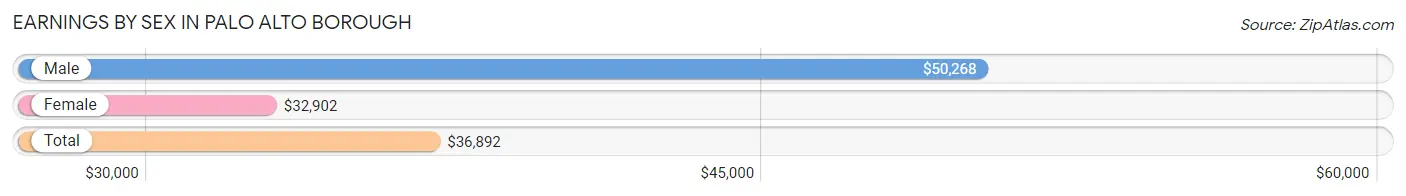
Earnings by Sex in Palo Alto borough
Average Earnings in Palo Alto borough are $36,892, $50,268 for men and $32,902 for women, a difference of 34.5%.
| Sex | Number | Average Earnings |
| Male | 253 (51.2%) | $50,268 |
| Female | 241 (48.8%) | $32,902 |
| Total | 494 (100.0%) | $36,892 |
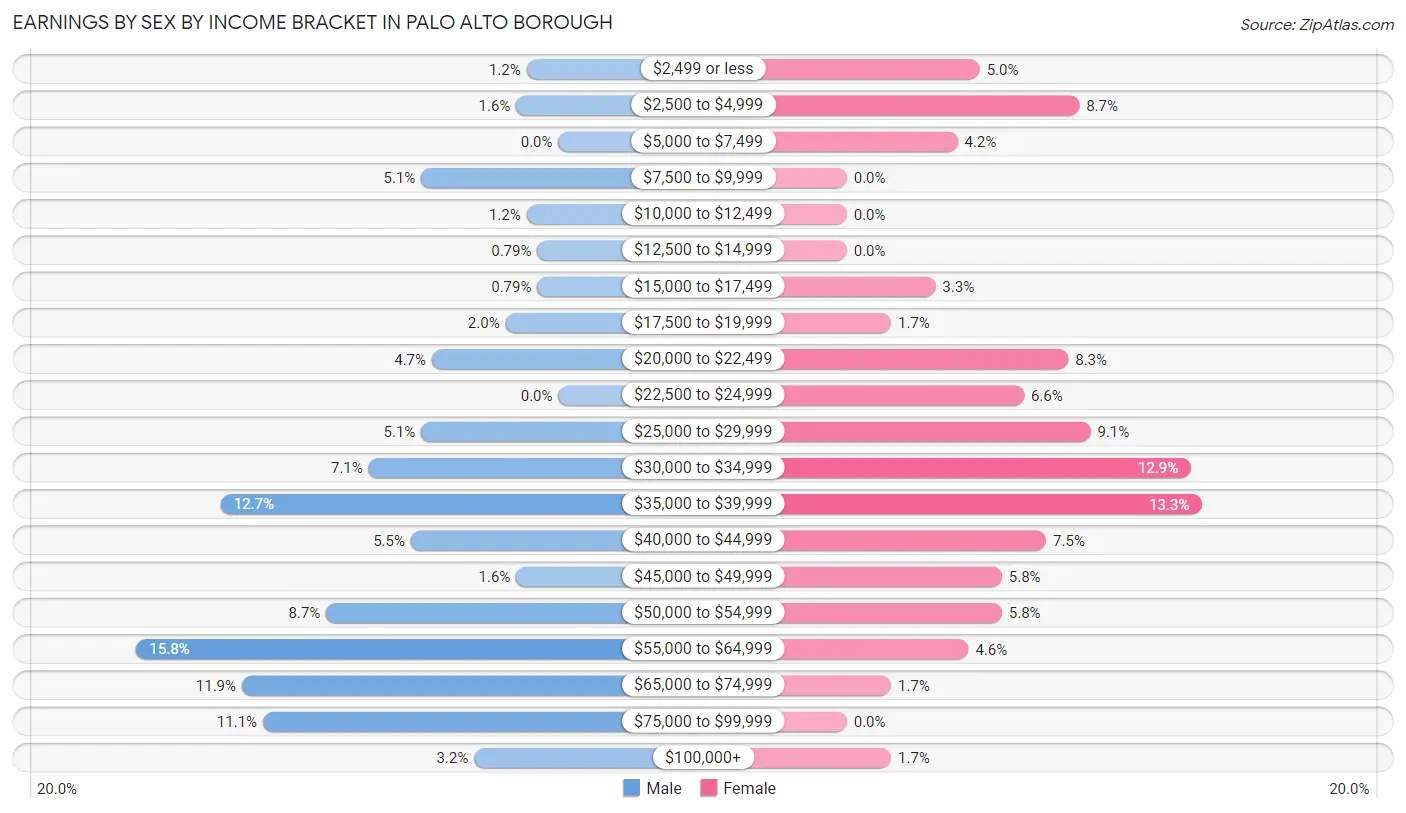
Earnings by Sex by Income Bracket in Palo Alto borough
The most common earnings brackets in Palo Alto borough are $55,000 to $64,999 for men (40 | 15.8%) and $35,000 to $39,999 for women (32 | 13.3%).
| Income | Male | Female |
| $2,499 or less | 3 (1.2%) | 12 (5.0%) |
| $2,500 to $4,999 | 4 (1.6%) | 21 (8.7%) |
| $5,000 to $7,499 | 0 (0.0%) | 10 (4.2%) |
| $7,500 to $9,999 | 13 (5.1%) | 0 (0.0%) |
| $10,000 to $12,499 | 3 (1.2%) | 0 (0.0%) |
| $12,500 to $14,999 | 2 (0.8%) | 0 (0.0%) |
| $15,000 to $17,499 | 2 (0.8%) | 8 (3.3%) |
| $17,500 to $19,999 | 5 (2.0%) | 4 (1.7%) |
| $20,000 to $22,499 | 12 (4.7%) | 20 (8.3%) |
| $22,500 to $24,999 | 0 (0.0%) | 16 (6.6%) |
| $25,000 to $29,999 | 13 (5.1%) | 22 (9.1%) |
| $30,000 to $34,999 | 18 (7.1%) | 31 (12.9%) |
| $35,000 to $39,999 | 32 (12.7%) | 32 (13.3%) |
| $40,000 to $44,999 | 14 (5.5%) | 18 (7.5%) |
| $45,000 to $49,999 | 4 (1.6%) | 14 (5.8%) |
| $50,000 to $54,999 | 22 (8.7%) | 14 (5.8%) |
| $55,000 to $64,999 | 40 (15.8%) | 11 (4.6%) |
| $65,000 to $74,999 | 30 (11.9%) | 4 (1.7%) |
| $75,000 to $99,999 | 28 (11.1%) | 0 (0.0%) |
| $100,000+ | 8 (3.2%) | 4 (1.7%) |
| Total | 253 (100.0%) | 241 (100.0%) |
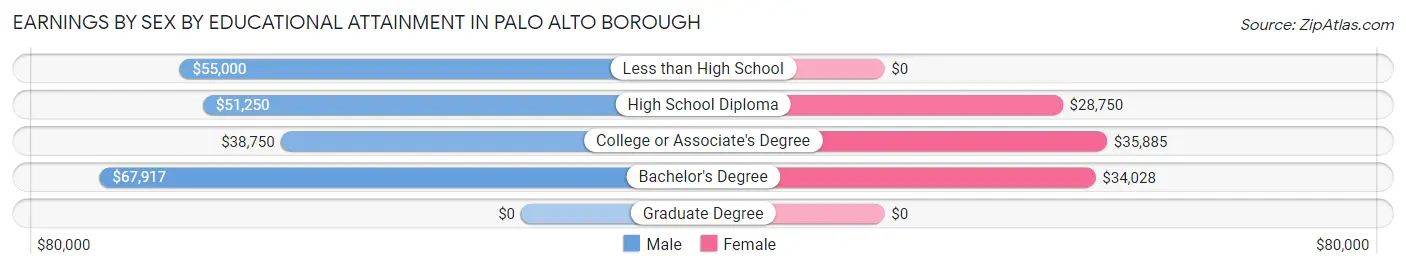
Earnings by Sex by Educational Attainment in Palo Alto borough
Average earnings in Palo Alto borough are $52,232 for men and $33,571 for women, a difference of 35.7%. Men with an educational attainment of bachelor's degree enjoy the highest average annual earnings of $67,917, while those with college or associate's degree education earn the least with $38,750. Women with an educational attainment of college or associate's degree earn the most with the average annual earnings of $35,885, while those with high school diploma education have the smallest earnings of $28,750.
| Educational Attainment | Male Income | Female Income |
| Less than High School | $55,000 | $0 |
| High School Diploma | $51,250 | $28,750 |
| College or Associate's Degree | $38,750 | $35,885 |
| Bachelor's Degree | $67,917 | $34,028 |
| Graduate Degree | - | - |
| Total | $52,232 | $33,571 |
Family Income in Palo Alto borough
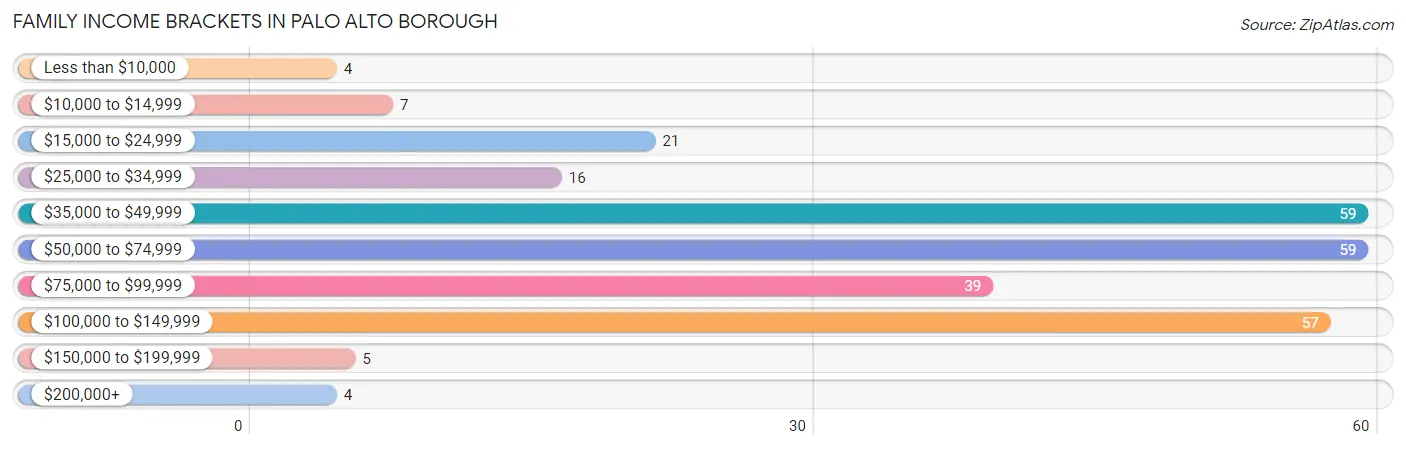
Family Income Brackets in Palo Alto borough
According to the Palo Alto borough family income data, there are 59 families falling into the $35,000 to $49,999 income range, which is the most common income bracket and makes up 21.8% of all families. Conversely, the less than $10,000 income bracket is the least frequent group with only 4 families (1.5%) belonging to this category.
| Income Bracket | # Families | % Families |
| Less than $10,000 | 4 | 1.5% |
| $10,000 to $14,999 | 7 | 2.6% |
| $15,000 to $24,999 | 21 | 7.7% |
| $25,000 to $34,999 | 16 | 5.9% |
| $35,000 to $49,999 | 59 | 21.8% |
| $50,000 to $74,999 | 59 | 21.8% |
| $75,000 to $99,999 | 39 | 14.4% |
| $100,000 to $149,999 | 57 | 21.0% |
| $150,000 to $199,999 | 5 | 1.8% |
| $200,000+ | 4 | 1.5% |
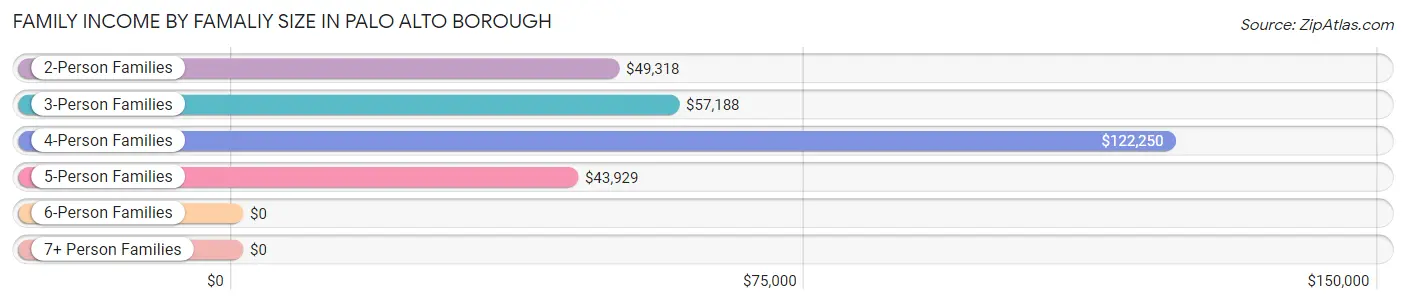
Family Income by Famaliy Size in Palo Alto borough
4-person families (18 | 6.6%) account for the highest median family income in Palo Alto borough with $122,250 per family, while 4-person families (18 | 6.6%) have the highest median income of $30,562 per family member.
| Income Bracket | # Families | Median Income |
| 2-Person Families | 168 (62.0%) | $49,318 |
| 3-Person Families | 62 (22.9%) | $57,188 |
| 4-Person Families | 18 (6.6%) | $122,250 |
| 5-Person Families | 14 (5.2%) | $43,929 |
| 6-Person Families | 9 (3.3%) | $0 |
| 7+ Person Families | 0 (0.0%) | $0 |
| Total | 271 (100.0%) | $54,861 |
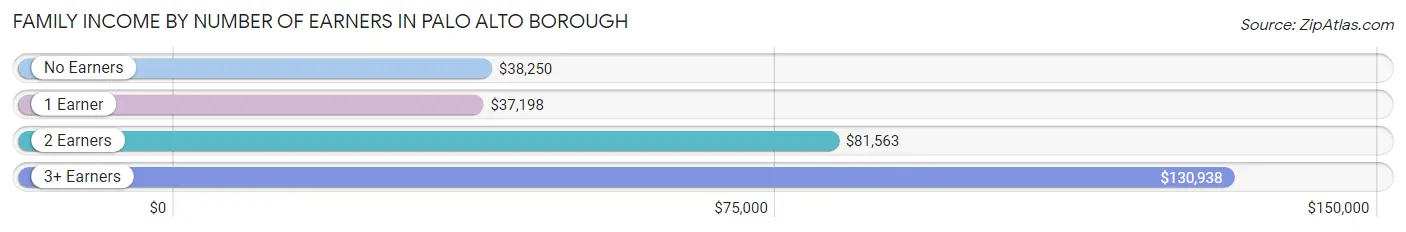
Family Income by Number of Earners in Palo Alto borough
The median family income in Palo Alto borough is $54,861, with families comprising 3+ earners (15) having the highest median family income of $130,938, while families with 1 earner (77) have the lowest median family income of $37,198, accounting for 5.5% and 28.4% of families, respectively.
| Number of Earners | # Families | Median Income |
| No Earners | 56 (20.7%) | $38,250 |
| 1 Earner | 77 (28.4%) | $37,198 |
| 2 Earners | 123 (45.4%) | $81,563 |
| 3+ Earners | 15 (5.5%) | $130,938 |
| Total | 271 (100.0%) | $54,861 |
Household Income in Palo Alto borough
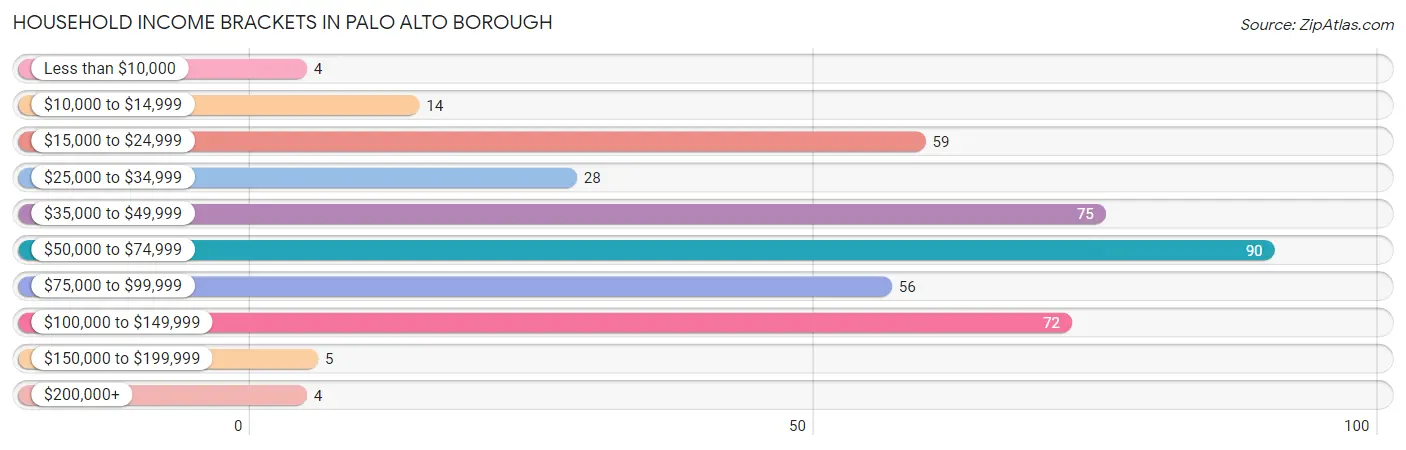
Household Income Brackets in Palo Alto borough
With 90 households falling in the category, the $50,000 to $74,999 income range is the most frequent in Palo Alto borough, accounting for 22.1% of all households. In contrast, only 4 households (1.0%) fall into the less than $10,000 income bracket, making it the least populous group.
| Income Bracket | # Households | % Households |
| Less than $10,000 | 4 | 1.0% |
| $10,000 to $14,999 | 14 | 3.4% |
| $15,000 to $24,999 | 59 | 14.5% |
| $25,000 to $34,999 | 28 | 6.9% |
| $35,000 to $49,999 | 75 | 18.4% |
| $50,000 to $74,999 | 90 | 22.1% |
| $75,000 to $99,999 | 56 | 13.8% |
| $100,000 to $149,999 | 72 | 17.7% |
| $150,000 to $199,999 | 5 | 1.2% |
| $200,000+ | 4 | 1.0% |
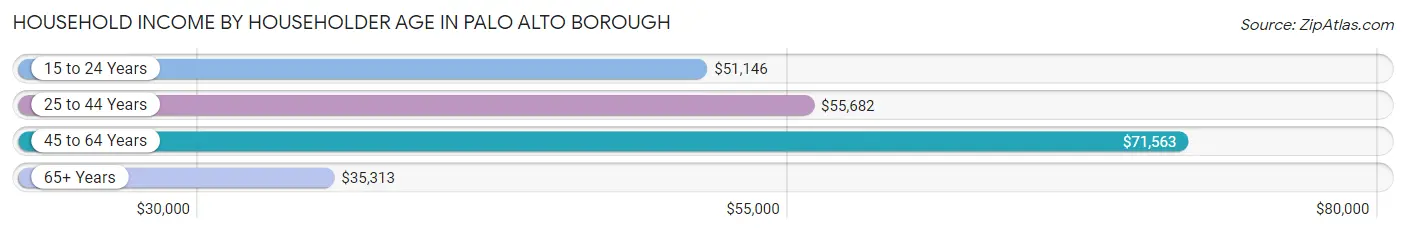
Household Income by Householder Age in Palo Alto borough
The median household income in Palo Alto borough is $52,176, with the highest median household income of $71,563 found in the 45 to 64 years age bracket for the primary householder. A total of 151 households (37.1%) fall into this category. Meanwhile, the 65+ years age bracket for the primary householder has the lowest median household income of $35,313, with 125 households (30.7%) in this group.
| Income Bracket | # Households | Median Income |
| 15 to 24 Years | 23 (5.7%) | $51,146 |
| 25 to 44 Years | 108 (26.5%) | $55,682 |
| 45 to 64 Years | 151 (37.1%) | $71,563 |
| 65+ Years | 125 (30.7%) | $35,313 |
| Total | 407 (100.0%) | $52,176 |
Poverty in Palo Alto borough
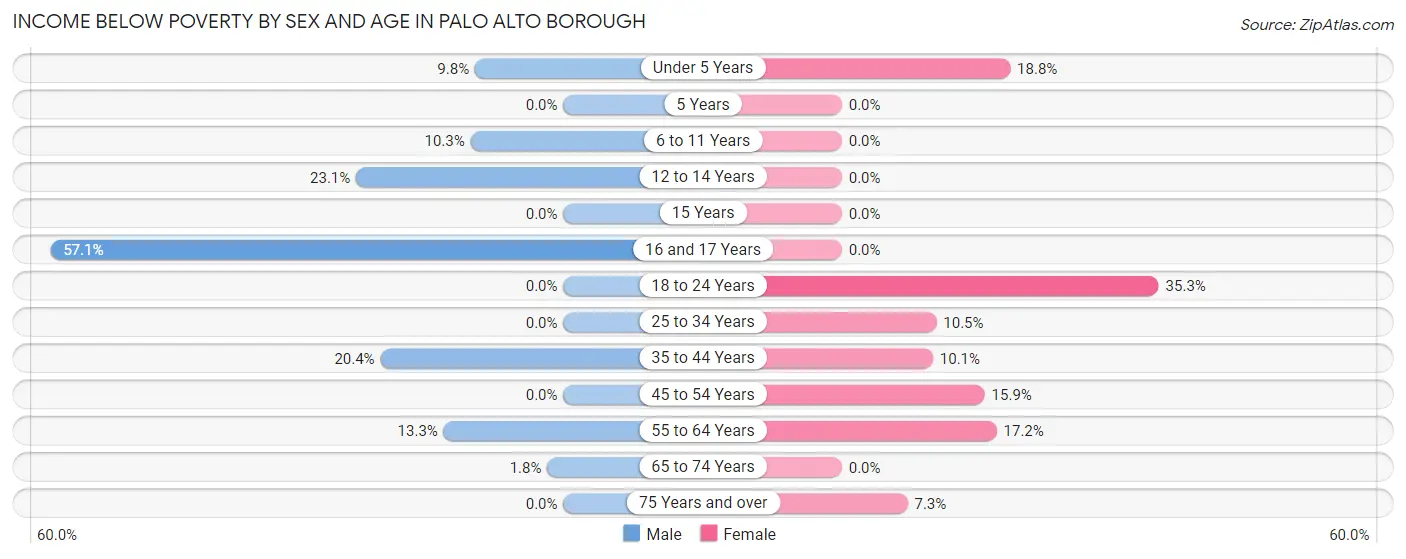
Income Below Poverty by Sex and Age in Palo Alto borough
With 7.8% poverty level for males and 9.8% for females among the residents of Palo Alto borough, 16 and 17 year old males and 18 to 24 year old females are the most vulnerable to poverty, with 4 males (57.1%) and 6 females (35.3%) in their respective age groups living below the poverty level.
| Age Bracket | Male | Female |
| Under 5 Years | 6 (9.8%) | 3 (18.8%) |
| 5 Years | 0 (0.0%) | 0 (0.0%) |
| 6 to 11 Years | 3 (10.3%) | 0 (0.0%) |
| 12 to 14 Years | 3 (23.1%) | 0 (0.0%) |
| 15 Years | 0 (0.0%) | 0 (0.0%) |
| 16 and 17 Years | 4 (57.1%) | 0 (0.0%) |
| 18 to 24 Years | 0 (0.0%) | 6 (35.3%) |
| 25 to 34 Years | 0 (0.0%) | 6 (10.5%) |
| 35 to 44 Years | 11 (20.4%) | 7 (10.1%) |
| 45 to 54 Years | 0 (0.0%) | 7 (15.9%) |
| 55 to 64 Years | 8 (13.3%) | 15 (17.2%) |
| 65 to 74 Years | 1 (1.8%) | 0 (0.0%) |
| 75 Years and over | 0 (0.0%) | 3 (7.3%) |
| Total | 36 (7.8%) | 47 (9.8%) |
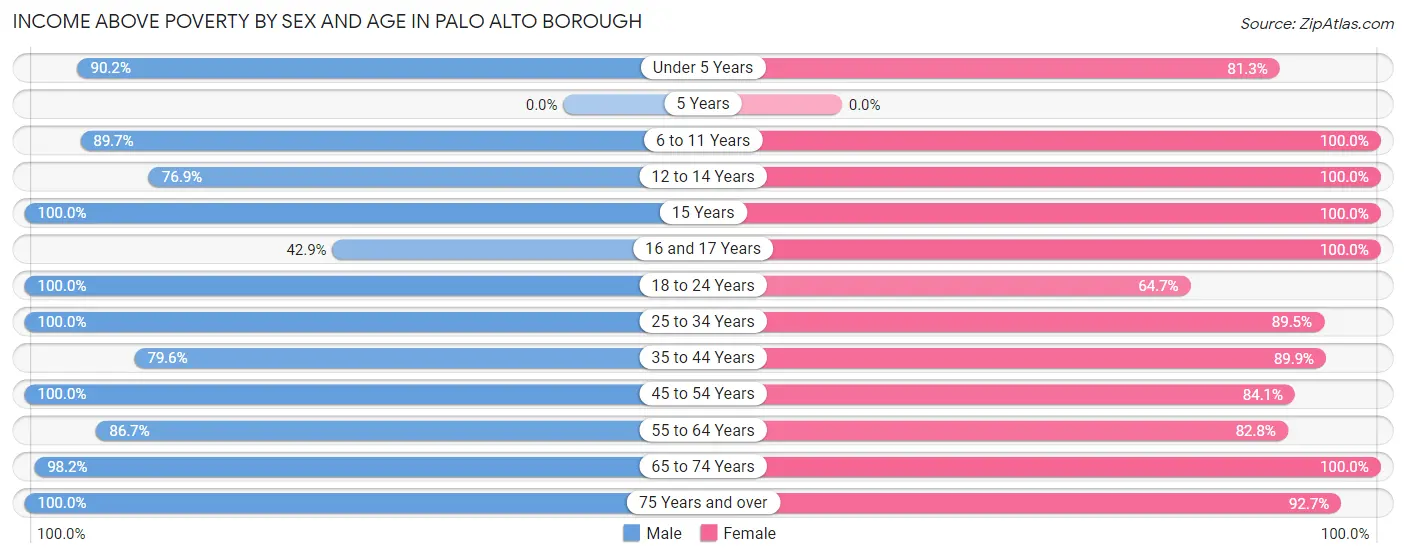
Income Above Poverty by Sex and Age in Palo Alto borough
According to the poverty statistics in Palo Alto borough, males aged 15 years and females aged 6 to 11 years are the age groups that are most secure financially, with 100.0% of males and 100.0% of females in these age groups living above the poverty line.
| Age Bracket | Male | Female |
| Under 5 Years | 55 (90.2%) | 13 (81.2%) |
| 5 Years | 0 (0.0%) | 0 (0.0%) |
| 6 to 11 Years | 26 (89.7%) | 35 (100.0%) |
| 12 to 14 Years | 10 (76.9%) | 37 (100.0%) |
| 15 Years | 3 (100.0%) | 14 (100.0%) |
| 16 and 17 Years | 3 (42.9%) | 4 (100.0%) |
| 18 to 24 Years | 25 (100.0%) | 11 (64.7%) |
| 25 to 34 Years | 53 (100.0%) | 51 (89.5%) |
| 35 to 44 Years | 43 (79.6%) | 62 (89.9%) |
| 45 to 54 Years | 68 (100.0%) | 37 (84.1%) |
| 55 to 64 Years | 52 (86.7%) | 72 (82.8%) |
| 65 to 74 Years | 55 (98.2%) | 61 (100.0%) |
| 75 Years and over | 35 (100.0%) | 38 (92.7%) |
| Total | 428 (92.2%) | 435 (90.2%) |
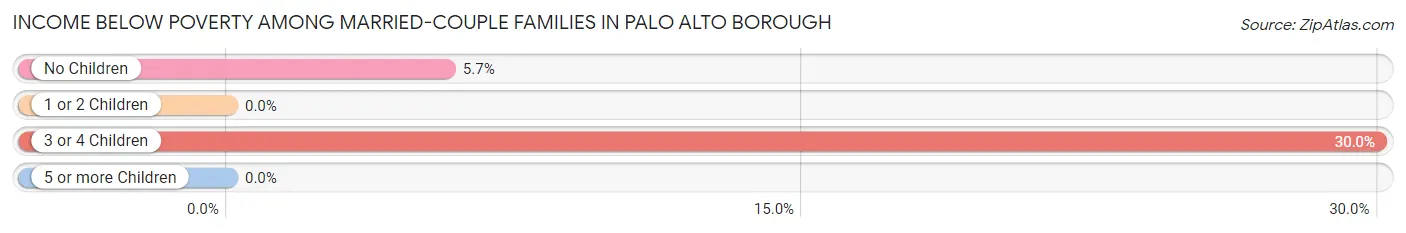
Income Below Poverty Among Married-Couple Families in Palo Alto borough
The poverty statistics for married-couple families in Palo Alto borough show that 5.6% or 10 of the total 179 families live below the poverty line. Families with 3 or 4 children have the highest poverty rate of 30.0%, comprising of 3 families. On the other hand, families with 1 or 2 children have the lowest poverty rate of 0.0%, which includes 0 families.
| Children | Above Poverty | Below Poverty |
| No Children | 116 (94.3%) | 7 (5.7%) |
| 1 or 2 Children | 46 (100.0%) | 0 (0.0%) |
| 3 or 4 Children | 7 (70.0%) | 3 (30.0%) |
| 5 or more Children | 0 (0.0%) | 0 (0.0%) |
| Total | 169 (94.4%) | 10 (5.6%) |
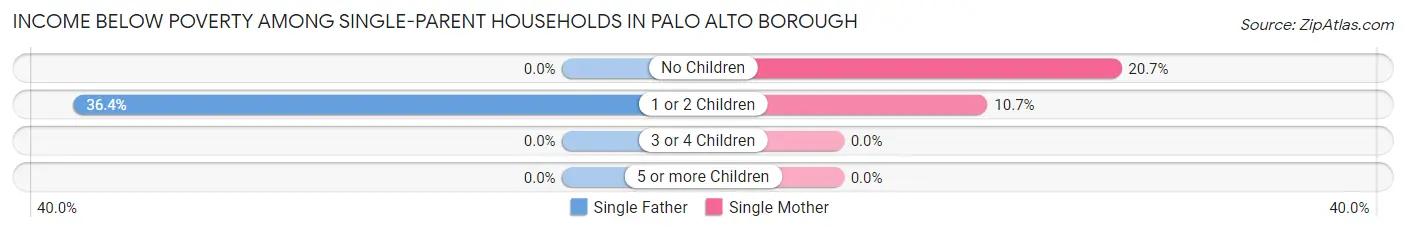
Income Below Poverty Among Single-Parent Households in Palo Alto borough
According to the poverty data in Palo Alto borough, 14.3% or 4 single-father households and 14.1% or 9 single-mother households are living below the poverty line. Among single-father households, those with 1 or 2 children have the highest poverty rate, with 4 households (36.4%) experiencing poverty. Likewise, among single-mother households, those with no children have the highest poverty rate, with 6 households (20.7%) falling below the poverty line.
| Children | Single Father | Single Mother |
| No Children | 0 (0.0%) | 6 (20.7%) |
| 1 or 2 Children | 4 (36.4%) | 3 (10.7%) |
| 3 or 4 Children | 0 (0.0%) | 0 (0.0%) |
| 5 or more Children | 0 (0.0%) | 0 (0.0%) |
| Total | 4 (14.3%) | 9 (14.1%) |
Income Below Poverty Among Married-Couple vs Single-Parent Households in Palo Alto borough
The poverty data for Palo Alto borough shows that 10 of the married-couple family households (5.6%) and 13 of the single-parent households (14.1%) are living below the poverty level. Within the married-couple family households, those with 3 or 4 children have the highest poverty rate, with 3 households (30.0%) falling below the poverty line. Among the single-parent households, those with 1 or 2 children have the highest poverty rate, with 7 household (17.9%) living below poverty.
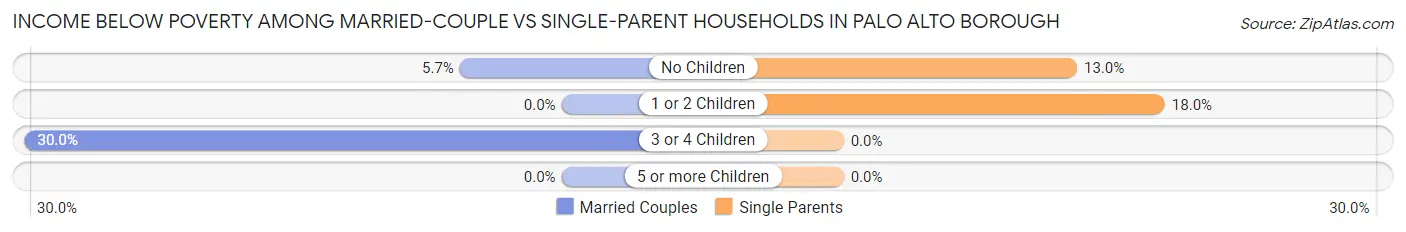
| Children | Married-Couple Families | Single-Parent Households |
| No Children | 7 (5.7%) | 6 (13.0%) |
| 1 or 2 Children | 0 (0.0%) | 7 (17.9%) |
| 3 or 4 Children | 3 (30.0%) | 0 (0.0%) |
| 5 or more Children | 0 (0.0%) | 0 (0.0%) |
| Total | 10 (5.6%) | 13 (14.1%) |
Race in Palo Alto borough
The most populous races in Palo Alto borough are White / Caucasian (923 | 96.9%), Black / African American (21 | 2.2%), and Hawaiian / Pacific (4 | 0.4%).
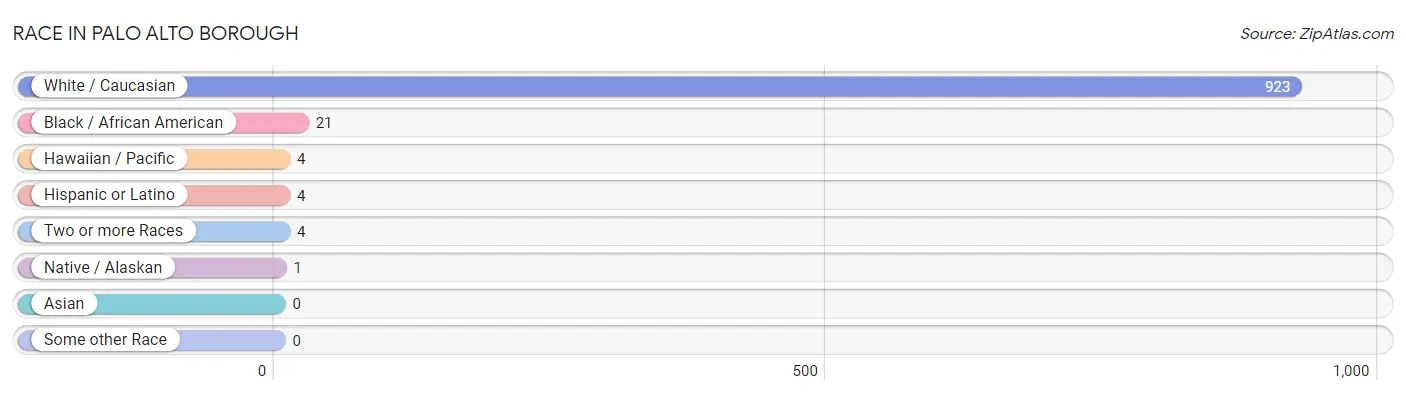
| Race | # Population | % Population |
| Asian | 0 | 0.0% |
| Black / African American | 21 | 2.2% |
| Hawaiian / Pacific | 4 | 0.4% |
| Hispanic or Latino | 4 | 0.4% |
| Native / Alaskan | 1 | 0.1% |
| White / Caucasian | 923 | 96.9% |
| Two or more Races | 4 | 0.4% |
| Some other Race | 0 | 0.0% |
| Total | 953 | 100.0% |
Ancestry in Palo Alto borough
The most populous ancestries reported in Palo Alto borough are German (331 | 34.7%), Irish (208 | 21.8%), Polish (148 | 15.5%), Italian (64 | 6.7%), and Dutch (52 | 5.5%), together accounting for 84.3% of all Palo Alto borough residents.
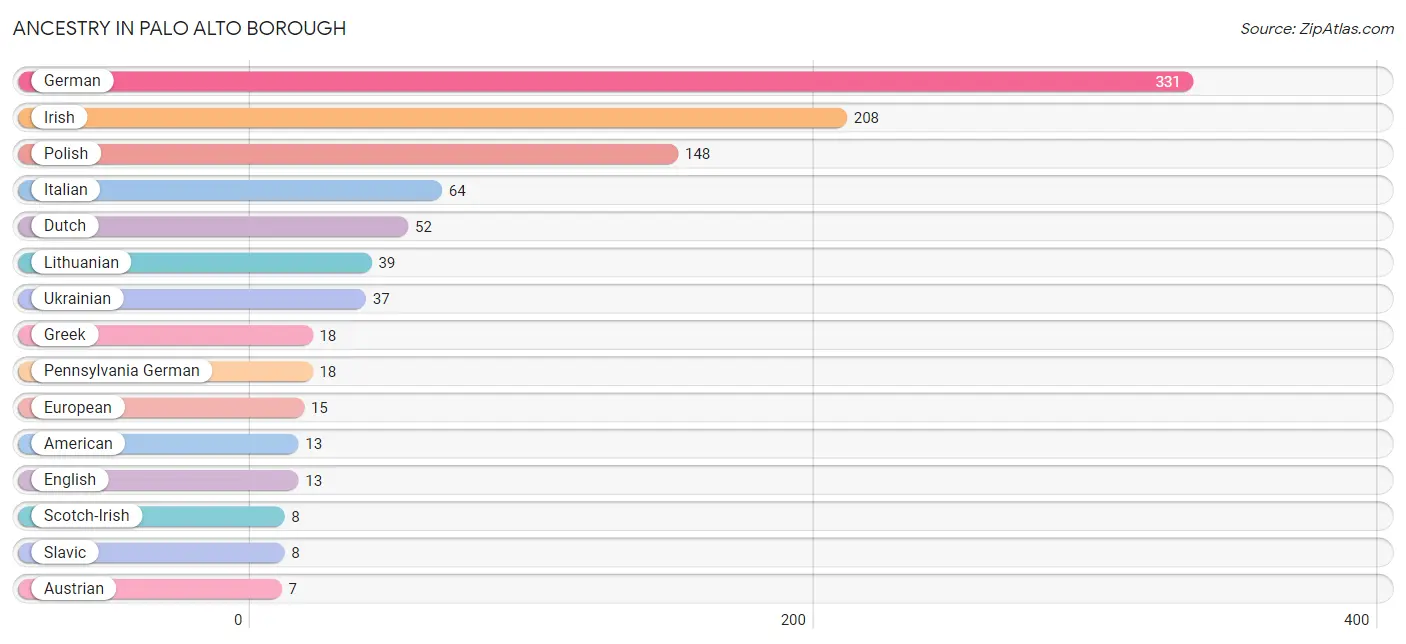
| Ancestry | # Population | % Population |
| American | 13 | 1.4% |
| Arab | 3 | 0.3% |
| Austrian | 7 | 0.7% |
| Croatian | 2 | 0.2% |
| Dutch | 52 | 5.5% |
| Eastern European | 5 | 0.5% |
| English | 13 | 1.4% |
| European | 15 | 1.6% |
| German | 331 | 34.7% |
| Greek | 18 | 1.9% |
| Irish | 208 | 21.8% |
| Italian | 64 | 6.7% |
| Lebanese | 3 | 0.3% |
| Lithuanian | 39 | 4.1% |
| Native Hawaiian | 4 | 0.4% |
| Pennsylvania German | 18 | 1.9% |
| Polish | 148 | 15.5% |
| Portuguese | 4 | 0.4% |
| Puerto Rican | 4 | 0.4% |
| Romanian | 2 | 0.2% |
| Scotch-Irish | 8 | 0.8% |
| Scottish | 2 | 0.2% |
| Slavic | 8 | 0.8% |
| Slovak | 5 | 0.5% |
| Swedish | 3 | 0.3% |
| Ukrainian | 37 | 3.9% |
| Welsh | 3 | 0.3% | View All 27 Rows |
Immigrants in Palo Alto borough
The most numerous immigrant groups reported in Palo Alto borough came from Caribbean (3 | 0.3%), Jamaica (3 | 0.3%), and Latin America (3 | 0.3%), together accounting for 0.9% of all Palo Alto borough residents.
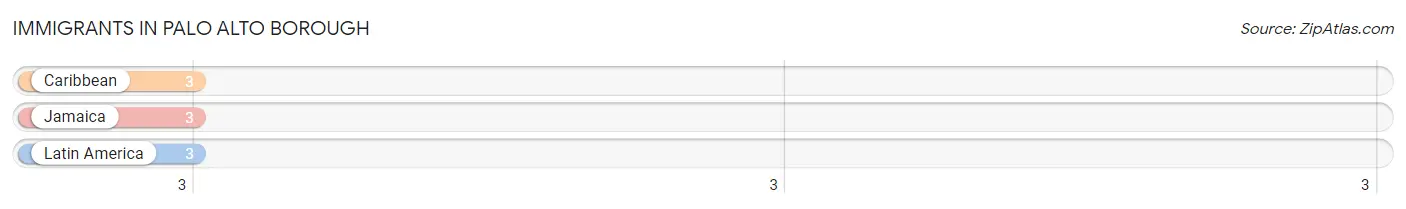
| Immigration Origin | # Population | % Population |
| Caribbean | 3 | 0.3% |
| Jamaica | 3 | 0.3% |
| Latin America | 3 | 0.3% | View All 3 Rows |
Sex and Age in Palo Alto borough
Sex and Age in Palo Alto borough
The most populous age groups in Palo Alto borough are Under 5 Years (61 | 13.0%) for men and 10 to 14 Years (54 | 11.1%) for women.
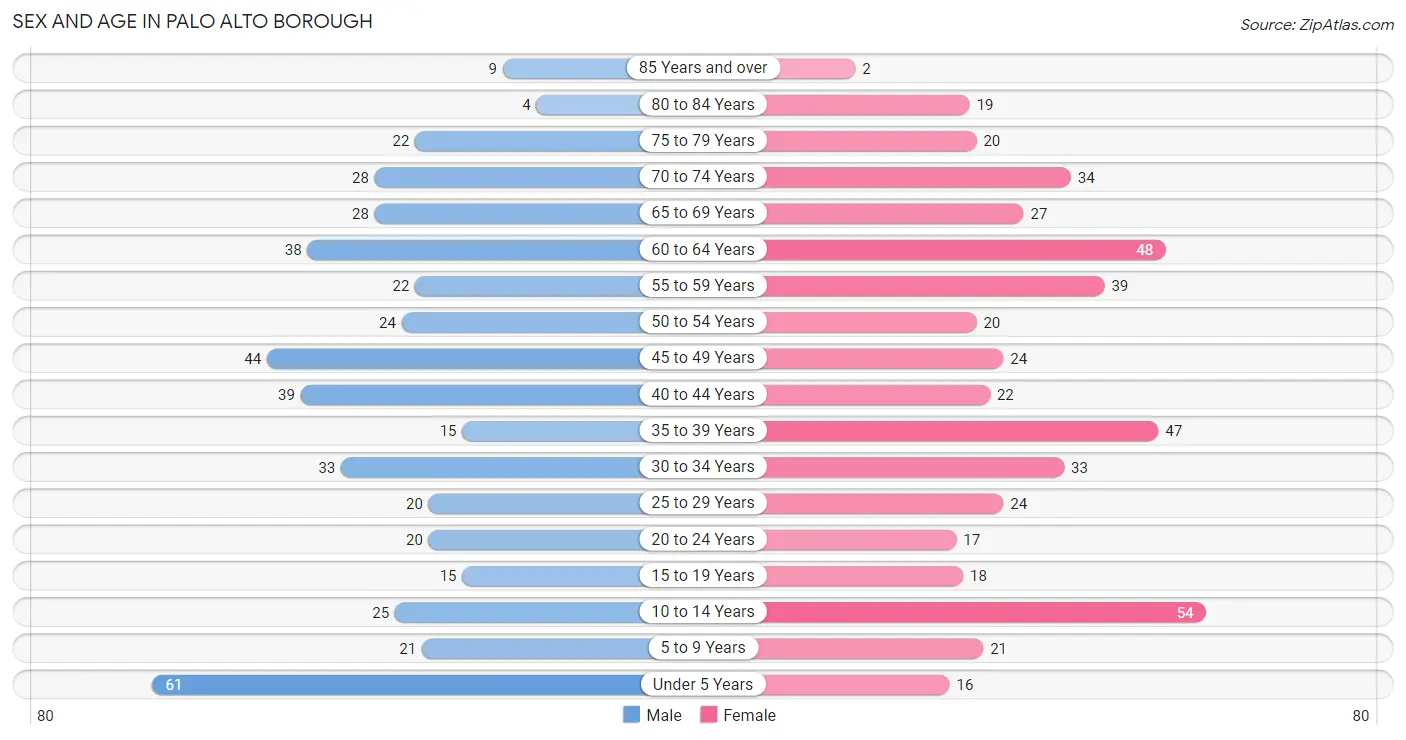
| Age Bracket | Male | Female |
| Under 5 Years | 61 (13.0%) | 16 (3.3%) |
| 5 to 9 Years | 21 (4.5%) | 21 (4.3%) |
| 10 to 14 Years | 25 (5.3%) | 54 (11.1%) |
| 15 to 19 Years | 15 (3.2%) | 18 (3.7%) |
| 20 to 24 Years | 20 (4.3%) | 17 (3.5%) |
| 25 to 29 Years | 20 (4.3%) | 24 (5.0%) |
| 30 to 34 Years | 33 (7.0%) | 33 (6.8%) |
| 35 to 39 Years | 15 (3.2%) | 47 (9.7%) |
| 40 to 44 Years | 39 (8.3%) | 22 (4.5%) |
| 45 to 49 Years | 44 (9.4%) | 24 (5.0%) |
| 50 to 54 Years | 24 (5.1%) | 20 (4.1%) |
| 55 to 59 Years | 22 (4.7%) | 39 (8.0%) |
| 60 to 64 Years | 38 (8.1%) | 48 (9.9%) |
| 65 to 69 Years | 28 (6.0%) | 27 (5.6%) |
| 70 to 74 Years | 28 (6.0%) | 34 (7.0%) |
| 75 to 79 Years | 22 (4.7%) | 20 (4.1%) |
| 80 to 84 Years | 4 (0.9%) | 19 (3.9%) |
| 85 Years and over | 9 (1.9%) | 2 (0.4%) |
| Total | 468 (100.0%) | 485 (100.0%) |
Families and Households in Palo Alto borough
Median Family Size in Palo Alto borough
The median family size in Palo Alto borough is 2.82 persons per family, with married-couple families (179 | 66.0%) accounting for the largest median family size of 3.09 persons per family. On the other hand, single male/father families (28 | 10.3%) represent the smallest median family size with 1.89 persons per family.
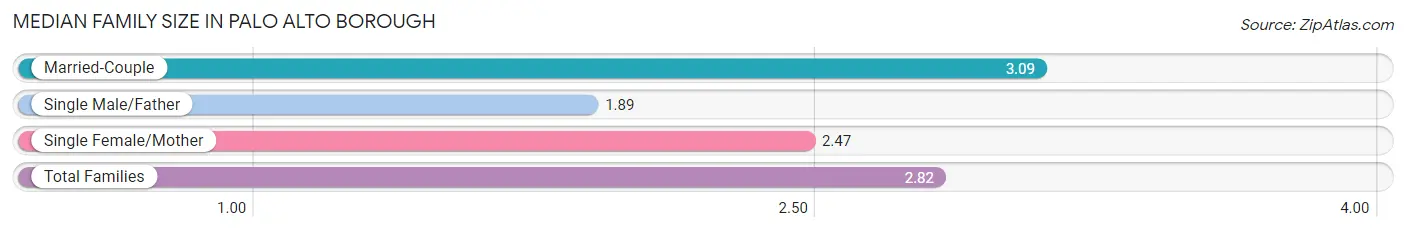
| Family Type | # Families | Family Size |
| Married-Couple | 179 (66.0%) | 3.09 |
| Single Male/Father | 28 (10.3%) | 1.89 |
| Single Female/Mother | 64 (23.6%) | 2.47 |
| Total Families | 271 (100.0%) | 2.82 |
Median Household Size in Palo Alto borough
The median household size in Palo Alto borough is 2.34 persons per household, with married-couple households (179 | 44.0%) accounting for the largest median household size of 3.13 persons per household. non-family households (136 | 33.4%) represent the smallest median household size with 1.19 persons per household.
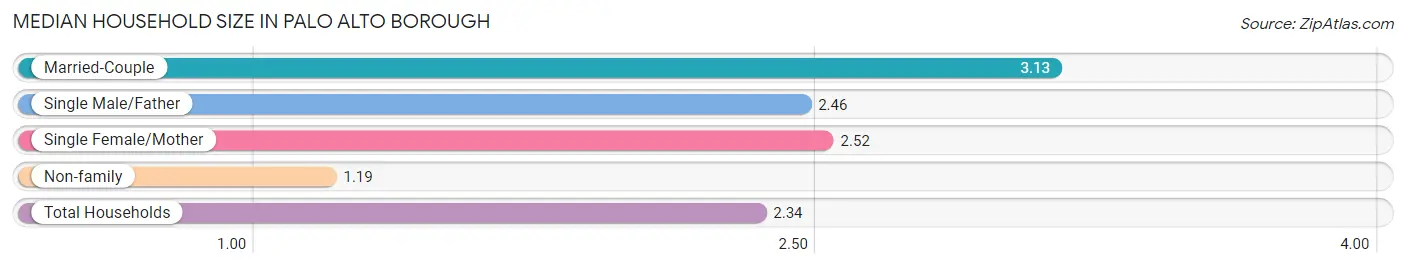
| Household Type | # Households | Household Size |
| Married-Couple | 179 (44.0%) | 3.13 |
| Single Male/Father | 28 (6.9%) | 2.46 |
| Single Female/Mother | 64 (15.7%) | 2.52 |
| Non-family | 136 (33.4%) | 1.19 |
| Total Households | 407 (100.0%) | 2.34 |
Household Size by Marriage Status in Palo Alto borough
Out of a total of 407 households in Palo Alto borough, 271 (66.6%) are family households, while 136 (33.4%) are nonfamily households. The most numerous type of family households are 2-person households, comprising 151, and the most common type of nonfamily households are 1-person households, comprising 111.
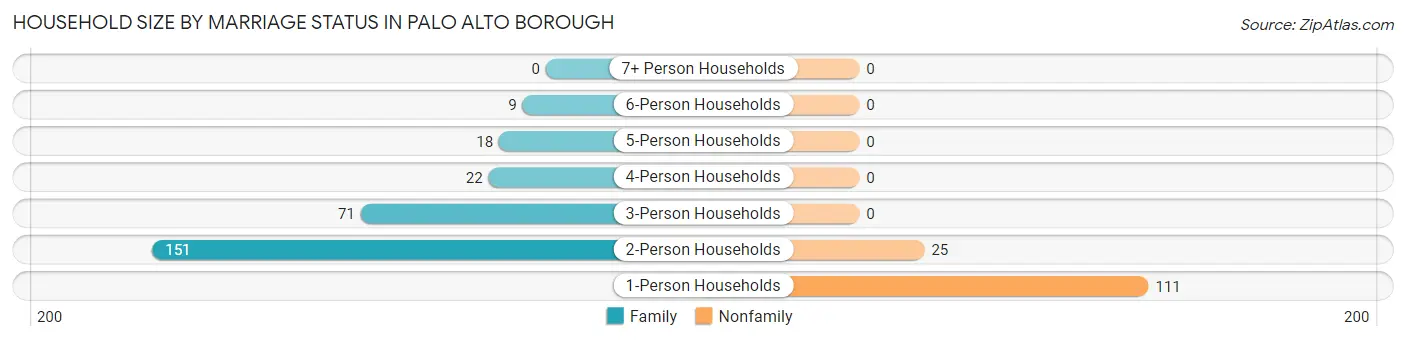
| Household Size | Family Households | Nonfamily Households |
| 1-Person Households | - | 111 (27.3%) |
| 2-Person Households | 151 (37.1%) | 25 (6.1%) |
| 3-Person Households | 71 (17.4%) | 0 (0.0%) |
| 4-Person Households | 22 (5.4%) | 0 (0.0%) |
| 5-Person Households | 18 (4.4%) | 0 (0.0%) |
| 6-Person Households | 9 (2.2%) | 0 (0.0%) |
| 7+ Person Households | 0 (0.0%) | 0 (0.0%) |
| Total | 271 (66.6%) | 136 (33.4%) |
Female Fertility in Palo Alto borough
Fertility by Age in Palo Alto borough
Average fertility rate in Palo Alto borough is 62.0 births per 1,000 women. Women in the age bracket of 20 to 34 years have the highest fertility rate with 162.0 births per 1,000 women. Women in the age bracket of 20 to 34 years acount for 100.0% of all women with births.
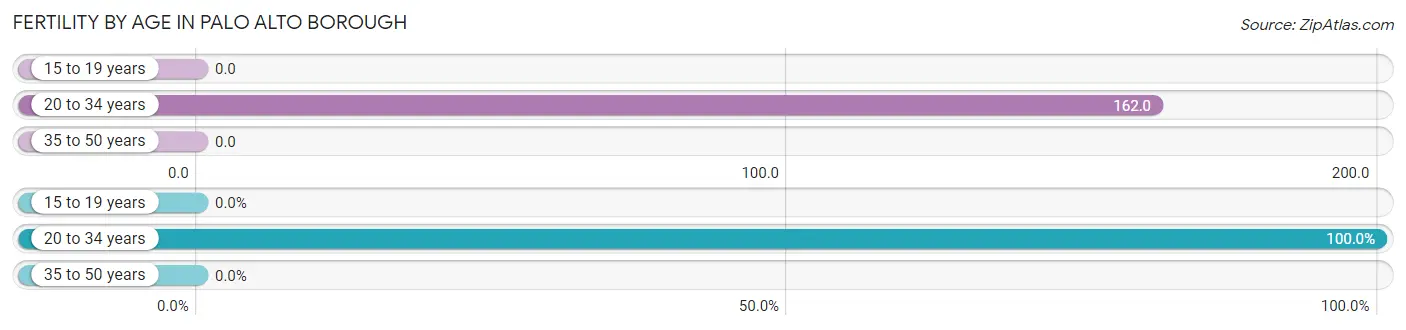
| Age Bracket | Women with Births | Births / 1,000 Women |
| 15 to 19 years | 0 (0.0%) | 0.0 |
| 20 to 34 years | 12 (100.0%) | 162.0 |
| 35 to 50 years | 0 (0.0%) | 0.0 |
| Total | 12 (100.0%) | 62.0 |
Fertility by Age by Marriage Status in Palo Alto borough
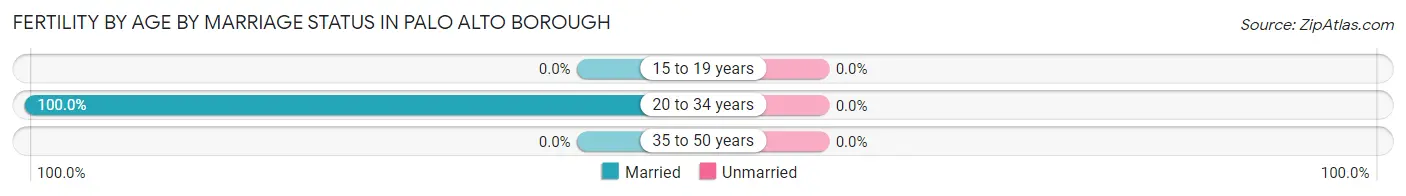
| Age Bracket | Married | Unmarried |
| 15 to 19 years | 0 (0.0%) | 0 (0.0%) |
| 20 to 34 years | 12 (100.0%) | 0 (0.0%) |
| 35 to 50 years | 0 (0.0%) | 0 (0.0%) |
| Total | 12 (100.0%) | 0 (0.0%) |
Fertility by Education in Palo Alto borough
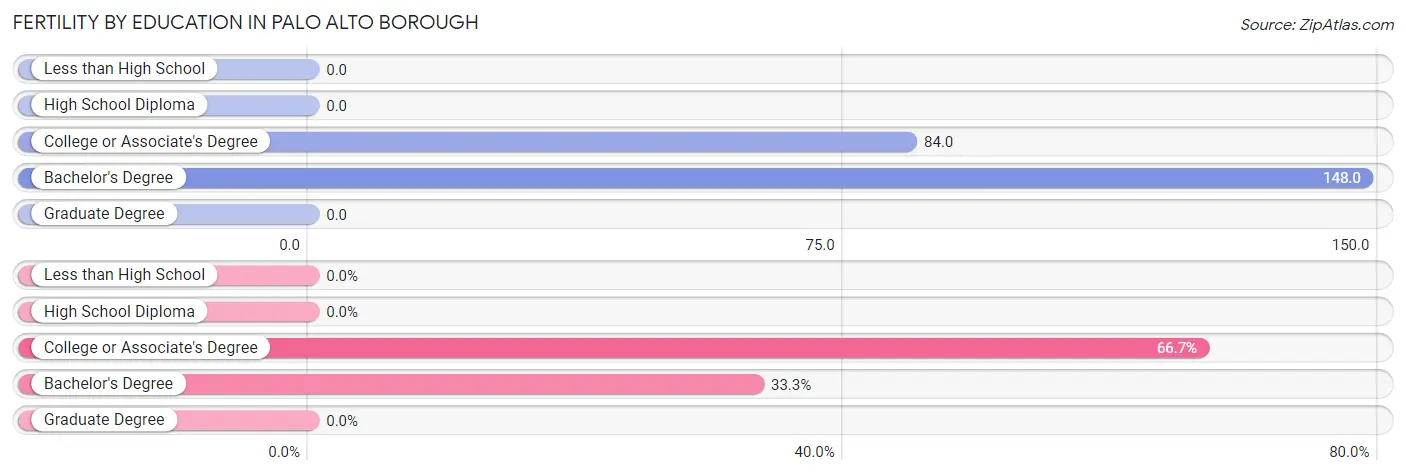
| Educational Attainment | Women with Births | Births / 1,000 Women |
| Less than High School | 0 (0.0%) | 0.0 |
| High School Diploma | 0 (0.0%) | 0.0 |
| College or Associate's Degree | 8 (66.7%) | 84.0 |
| Bachelor's Degree | 4 (33.3%) | 148.0 |
| Graduate Degree | 0 (0.0%) | 0.0 |
| Total | 12 (100.0%) | 62.0 |
Fertility by Education by Marriage Status in Palo Alto borough
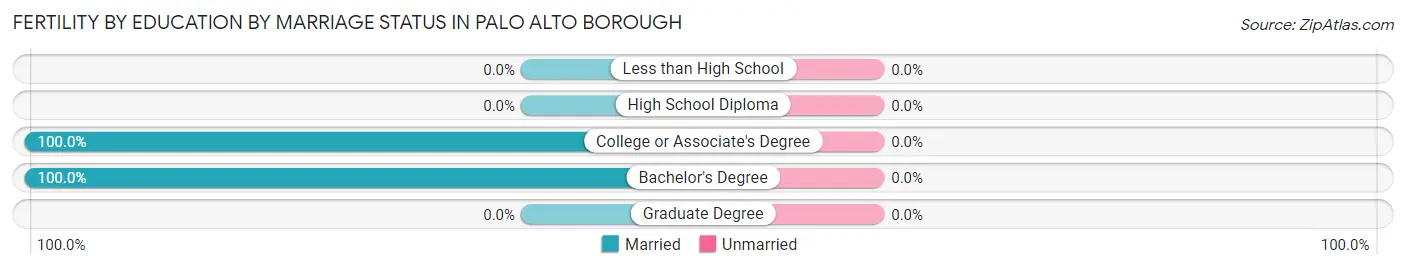
| Educational Attainment | Married | Unmarried |
| Less than High School | 0 (0.0%) | 0 (0.0%) |
| High School Diploma | 0 (0.0%) | 0 (0.0%) |
| College or Associate's Degree | 8 (100.0%) | 0 (0.0%) |
| Bachelor's Degree | 4 (100.0%) | 0 (0.0%) |
| Graduate Degree | 0 (0.0%) | 0 (0.0%) |
| Total | 12 (100.0%) | 0 (0.0%) |
Employment Characteristics in Palo Alto borough
Employment by Class of Employer in Palo Alto borough
Among the 470 employed individuals in Palo Alto borough, private company employees (333 | 70.9%), not-for-profit organizations (36 | 7.7%), and local government employees (31 | 6.6%) make up the most common classes of employment.
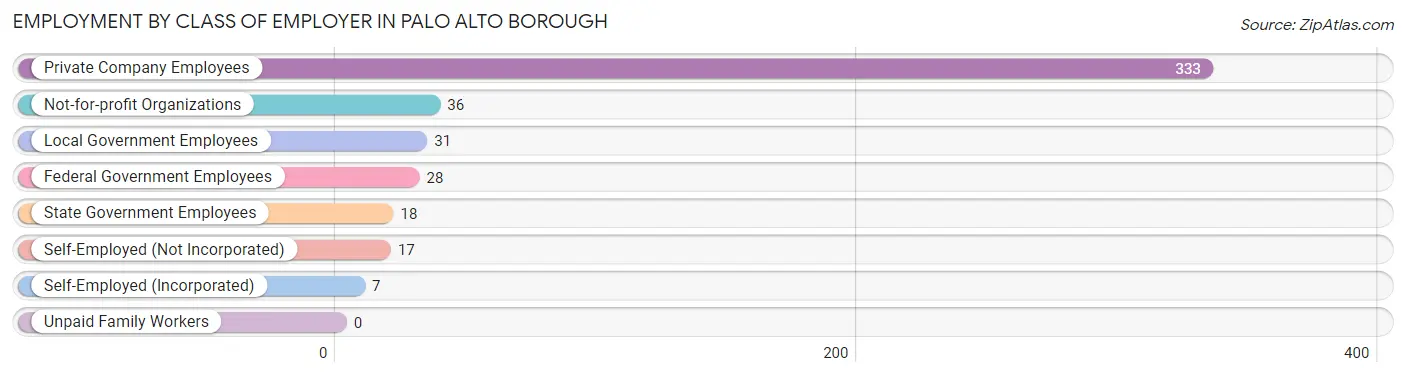
| Employer Class | # Employees | % Employees |
| Private Company Employees | 333 | 70.9% |
| Self-Employed (Incorporated) | 7 | 1.5% |
| Self-Employed (Not Incorporated) | 17 | 3.6% |
| Not-for-profit Organizations | 36 | 7.7% |
| Local Government Employees | 31 | 6.6% |
| State Government Employees | 18 | 3.8% |
| Federal Government Employees | 28 | 6.0% |
| Unpaid Family Workers | 0 | 0.0% |
| Total | 470 | 100.0% |
Employment Status by Age in Palo Alto borough
According to the labor force statistics for Palo Alto borough, out of the total population over 16 years of age (738), 66.4% or 490 individuals are in the labor force, with 4.1% or 20 of them unemployed. The age group with the highest labor force participation rate is 20 to 24 years, with 100.0% or 37 individuals in the labor force. Within the labor force, the 75 years and over age range has the highest percentage of unemployed individuals, with 100.0% or 2 of them being unemployed.
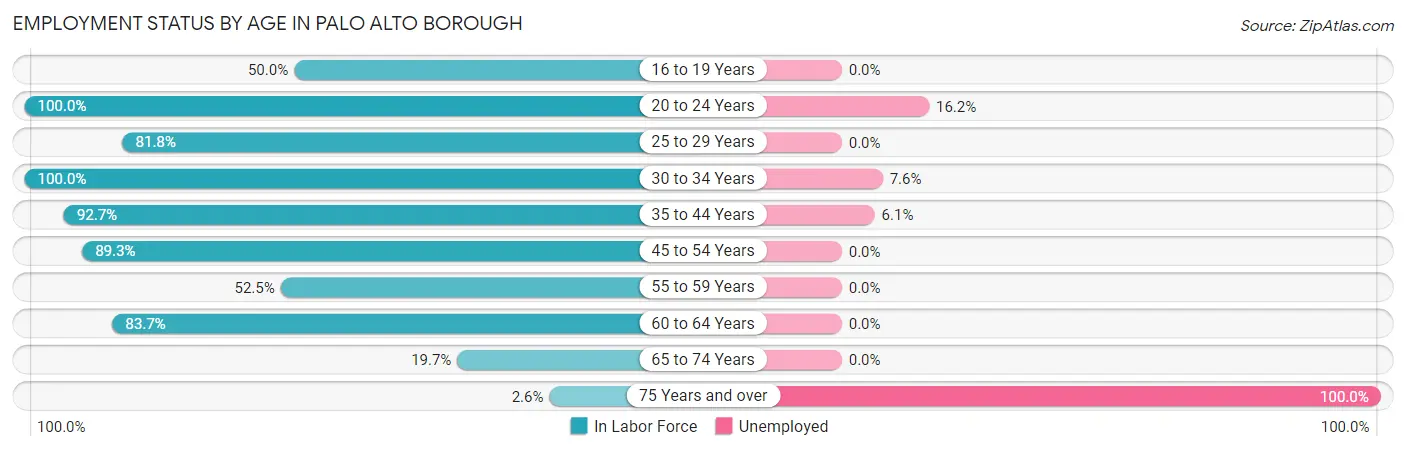
| Age Bracket | In Labor Force | Unemployed |
| 16 to 19 Years | 8 (50.0%) | 0 (0.0%) |
| 20 to 24 Years | 37 (100.0%) | 6 (16.2%) |
| 25 to 29 Years | 36 (81.8%) | 0 (0.0%) |
| 30 to 34 Years | 66 (100.0%) | 5 (7.6%) |
| 35 to 44 Years | 114 (92.7%) | 7 (6.1%) |
| 45 to 54 Years | 100 (89.3%) | 0 (0.0%) |
| 55 to 59 Years | 32 (52.5%) | 0 (0.0%) |
| 60 to 64 Years | 72 (83.7%) | 0 (0.0%) |
| 65 to 74 Years | 23 (19.7%) | 0 (0.0%) |
| 75 Years and over | 2 (2.6%) | 2 (100.0%) |
| Total | 490 (66.4%) | 20 (4.1%) |
Employment Status by Educational Attainment in Palo Alto borough
According to labor force statistics for Palo Alto borough, 85.4% of individuals (420) out of the total population between 25 and 64 years of age (492) are in the labor force, with 2.9% or 12 of them being unemployed. The group with the highest labor force participation rate are those with the educational attainment of bachelor's degree or higher, with 93.8% or 61 individuals in the labor force. Within the labor force, individuals with less than high school education have the highest percentage of unemployment, with 20.0% or 5 of them being unemployed.
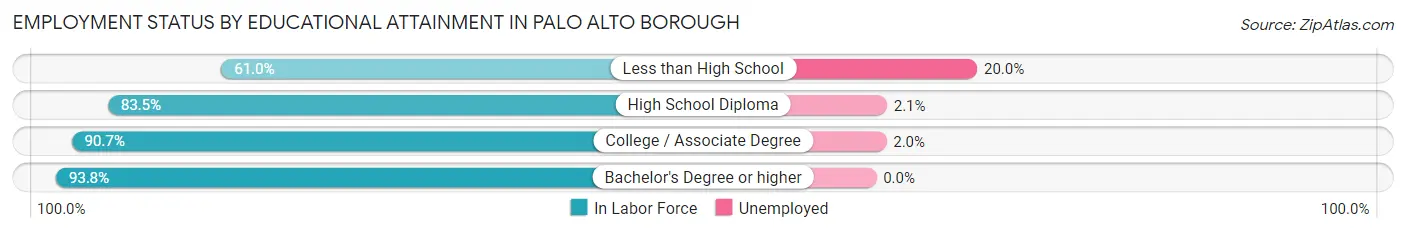
| Educational Attainment | In Labor Force | Unemployed |
| Less than High School | 25 (61.0%) | 8 (20.0%) |
| High School Diploma | 187 (83.5%) | 5 (2.1%) |
| College / Associate Degree | 147 (90.7%) | 3 (2.0%) |
| Bachelor's Degree or higher | 61 (93.8%) | 0 (0.0%) |
| Total | 420 (85.4%) | 14 (2.9%) |
Employment Occupations by Sex in Palo Alto borough
Management, Business, Science and Arts Occupations
The most common Management, Business, Science and Arts occupations in Palo Alto borough are Community & Social Service (41 | 8.7%), Education Instruction & Library (37 | 7.9%), Management (36 | 7.7%), Health Diagnosing & Treating (15 | 3.2%), and Business & Financial (9 | 1.9%).
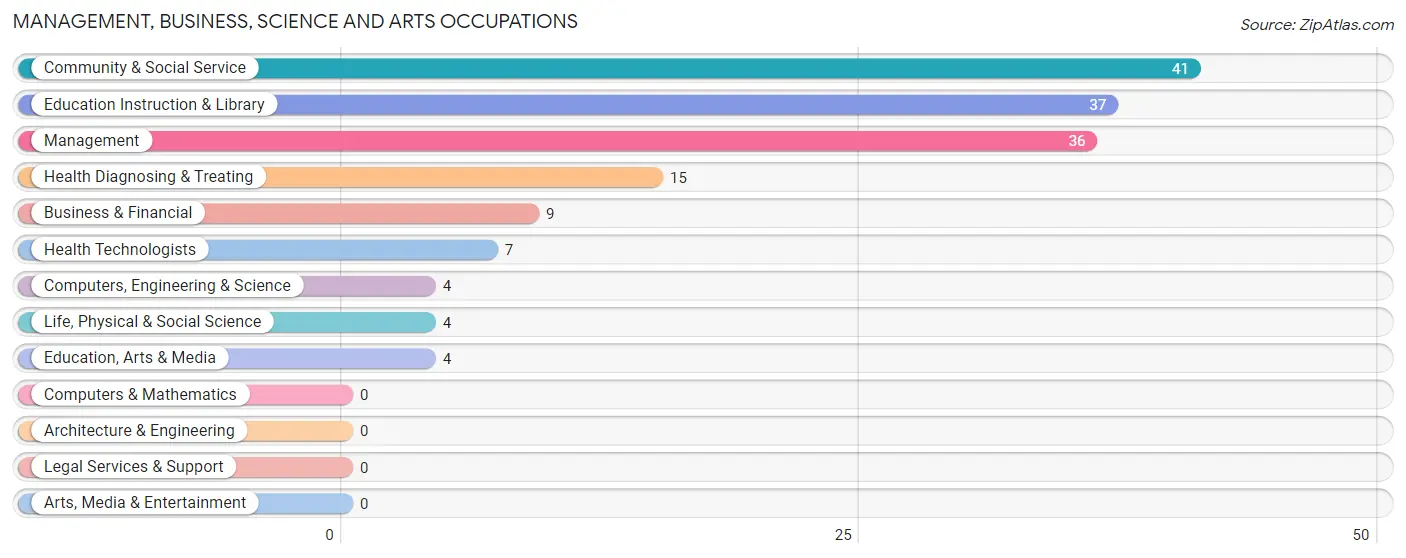
Management, Business, Science and Arts Occupations by Sex
Within the Management, Business, Science and Arts occupations in Palo Alto borough, the most male-oriented occupations are Management (88.9%), Education Instruction & Library (24.3%), and Community & Social Service (22.0%), while the most female-oriented occupations are Business & Financial (100.0%), Computers, Engineering & Science (100.0%), and Life, Physical & Social Science (100.0%).
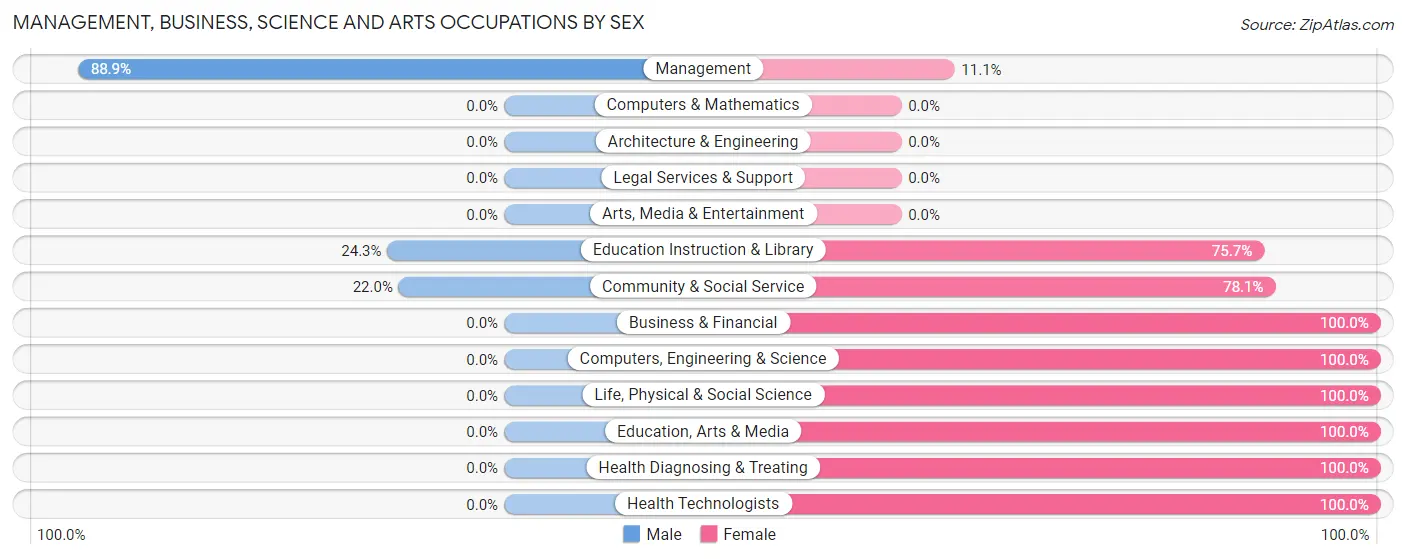
| Occupation | Male | Female |
| Management | 32 (88.9%) | 4 (11.1%) |
| Business & Financial | 0 (0.0%) | 9 (100.0%) |
| Computers, Engineering & Science | 0 (0.0%) | 4 (100.0%) |
| Computers & Mathematics | 0 (0.0%) | 0 (0.0%) |
| Architecture & Engineering | 0 (0.0%) | 0 (0.0%) |
| Life, Physical & Social Science | 0 (0.0%) | 4 (100.0%) |
| Community & Social Service | 9 (22.0%) | 32 (78.0%) |
| Education, Arts & Media | 0 (0.0%) | 4 (100.0%) |
| Legal Services & Support | 0 (0.0%) | 0 (0.0%) |
| Education Instruction & Library | 9 (24.3%) | 28 (75.7%) |
| Arts, Media & Entertainment | 0 (0.0%) | 0 (0.0%) |
| Health Diagnosing & Treating | 0 (0.0%) | 15 (100.0%) |
| Health Technologists | 0 (0.0%) | 7 (100.0%) |
| Total (Category) | 41 (39.1%) | 64 (61.0%) |
| Total (Overall) | 248 (52.8%) | 222 (47.2%) |
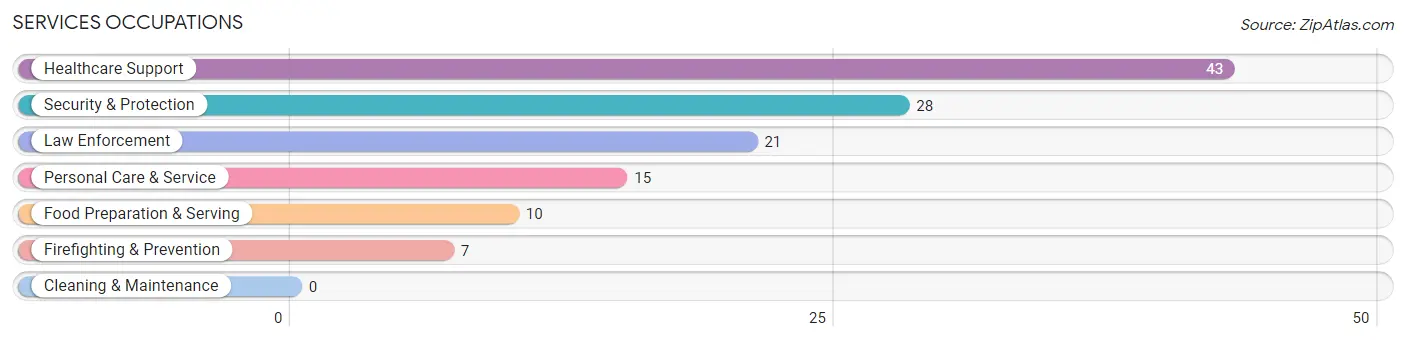
Services Occupations
The most common Services occupations in Palo Alto borough are Healthcare Support (43 | 9.1%), Security & Protection (28 | 6.0%), Law Enforcement (21 | 4.5%), Personal Care & Service (15 | 3.2%), and Food Preparation & Serving (10 | 2.1%).
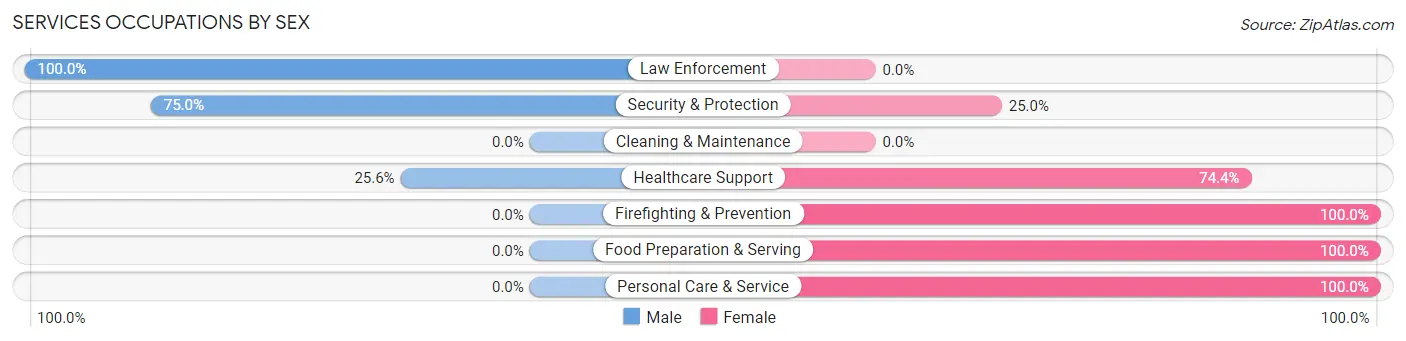
Services Occupations by Sex
Within the Services occupations in Palo Alto borough, the most male-oriented occupations are Law Enforcement (100.0%), Security & Protection (75.0%), and Healthcare Support (25.6%), while the most female-oriented occupations are Firefighting & Prevention (100.0%), Food Preparation & Serving (100.0%), and Personal Care & Service (100.0%).
| Occupation | Male | Female |
| Healthcare Support | 11 (25.6%) | 32 (74.4%) |
| Security & Protection | 21 (75.0%) | 7 (25.0%) |
| Firefighting & Prevention | 0 (0.0%) | 7 (100.0%) |
| Law Enforcement | 21 (100.0%) | 0 (0.0%) |
| Food Preparation & Serving | 0 (0.0%) | 10 (100.0%) |
| Cleaning & Maintenance | 0 (0.0%) | 0 (0.0%) |
| Personal Care & Service | 0 (0.0%) | 15 (100.0%) |
| Total (Category) | 32 (33.3%) | 64 (66.7%) |
| Total (Overall) | 248 (52.8%) | 222 (47.2%) |
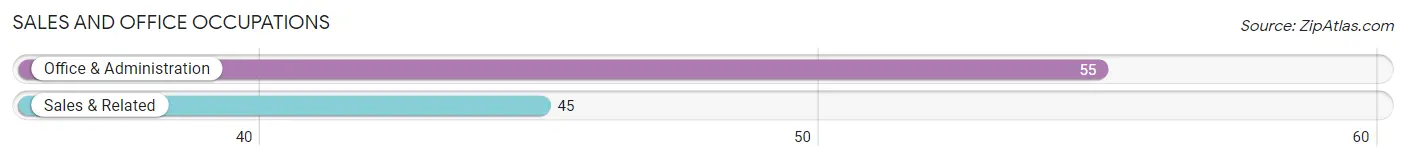
Sales and Office Occupations
The most common Sales and Office occupations in Palo Alto borough are Office & Administration (55 | 11.7%), and Sales & Related (45 | 9.6%).
Sales and Office Occupations by Sex
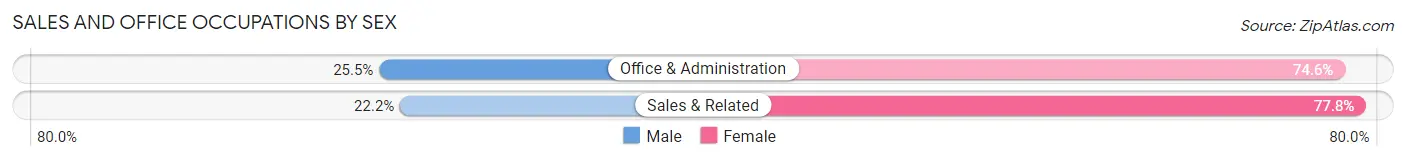
| Occupation | Male | Female |
| Sales & Related | 10 (22.2%) | 35 (77.8%) |
| Office & Administration | 14 (25.5%) | 41 (74.6%) |
| Total (Category) | 24 (24.0%) | 76 (76.0%) |
| Total (Overall) | 248 (52.8%) | 222 (47.2%) |
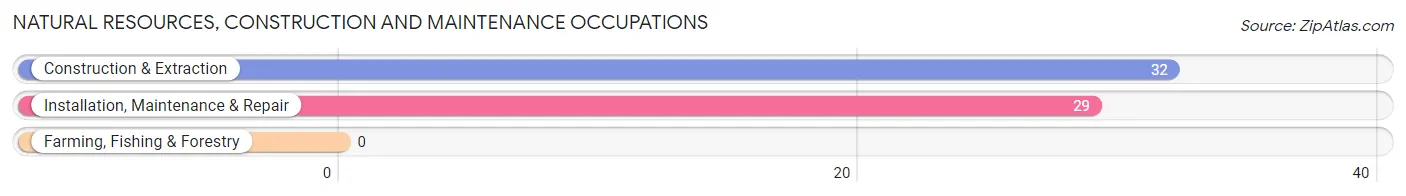
Natural Resources, Construction and Maintenance Occupations
The most common Natural Resources, Construction and Maintenance occupations in Palo Alto borough are Construction & Extraction (32 | 6.8%), and Installation, Maintenance & Repair (29 | 6.2%).
Natural Resources, Construction and Maintenance Occupations by Sex
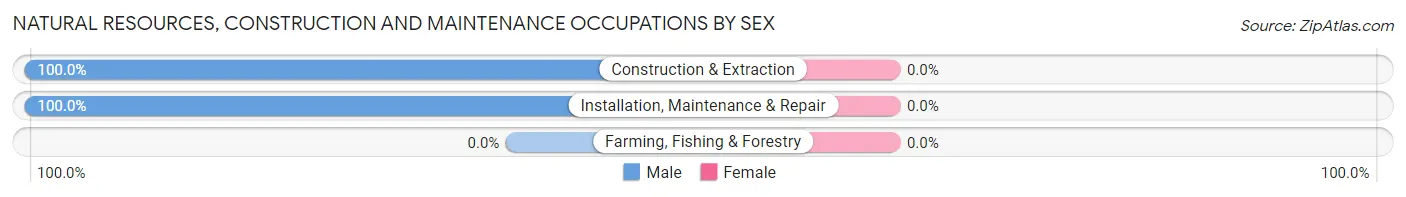
| Occupation | Male | Female |
| Farming, Fishing & Forestry | 0 (0.0%) | 0 (0.0%) |
| Construction & Extraction | 32 (100.0%) | 0 (0.0%) |
| Installation, Maintenance & Repair | 29 (100.0%) | 0 (0.0%) |
| Total (Category) | 61 (100.0%) | 0 (0.0%) |
| Total (Overall) | 248 (52.8%) | 222 (47.2%) |
Production, Transportation and Moving Occupations
The most common Production, Transportation and Moving occupations in Palo Alto borough are Production (42 | 8.9%), Material Moving (37 | 7.9%), and Transportation (29 | 6.2%).
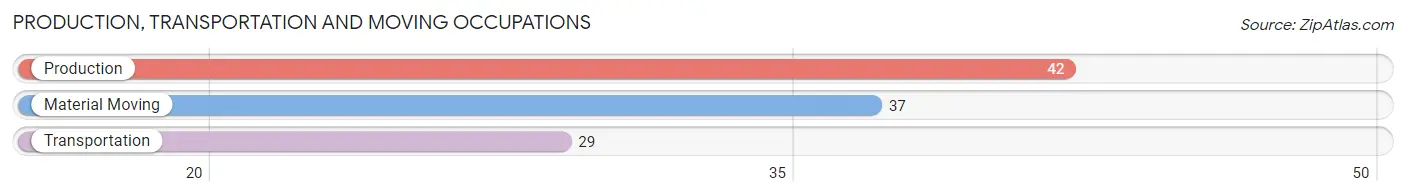
Production, Transportation and Moving Occupations by Sex
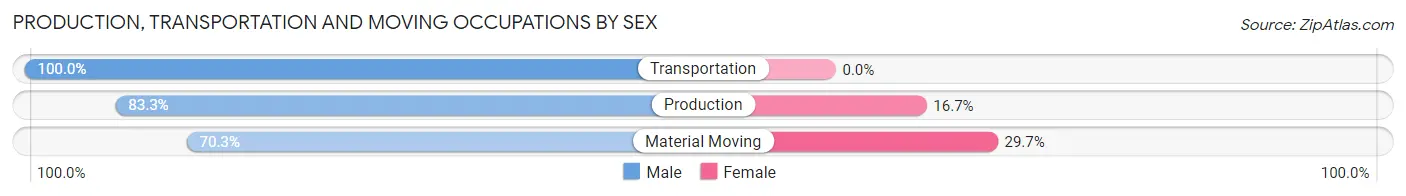
| Occupation | Male | Female |
| Production | 35 (83.3%) | 7 (16.7%) |
| Transportation | 29 (100.0%) | 0 (0.0%) |
| Material Moving | 26 (70.3%) | 11 (29.7%) |
| Total (Category) | 90 (83.3%) | 18 (16.7%) |
| Total (Overall) | 248 (52.8%) | 222 (47.2%) |
Employment Industries by Sex in Palo Alto borough
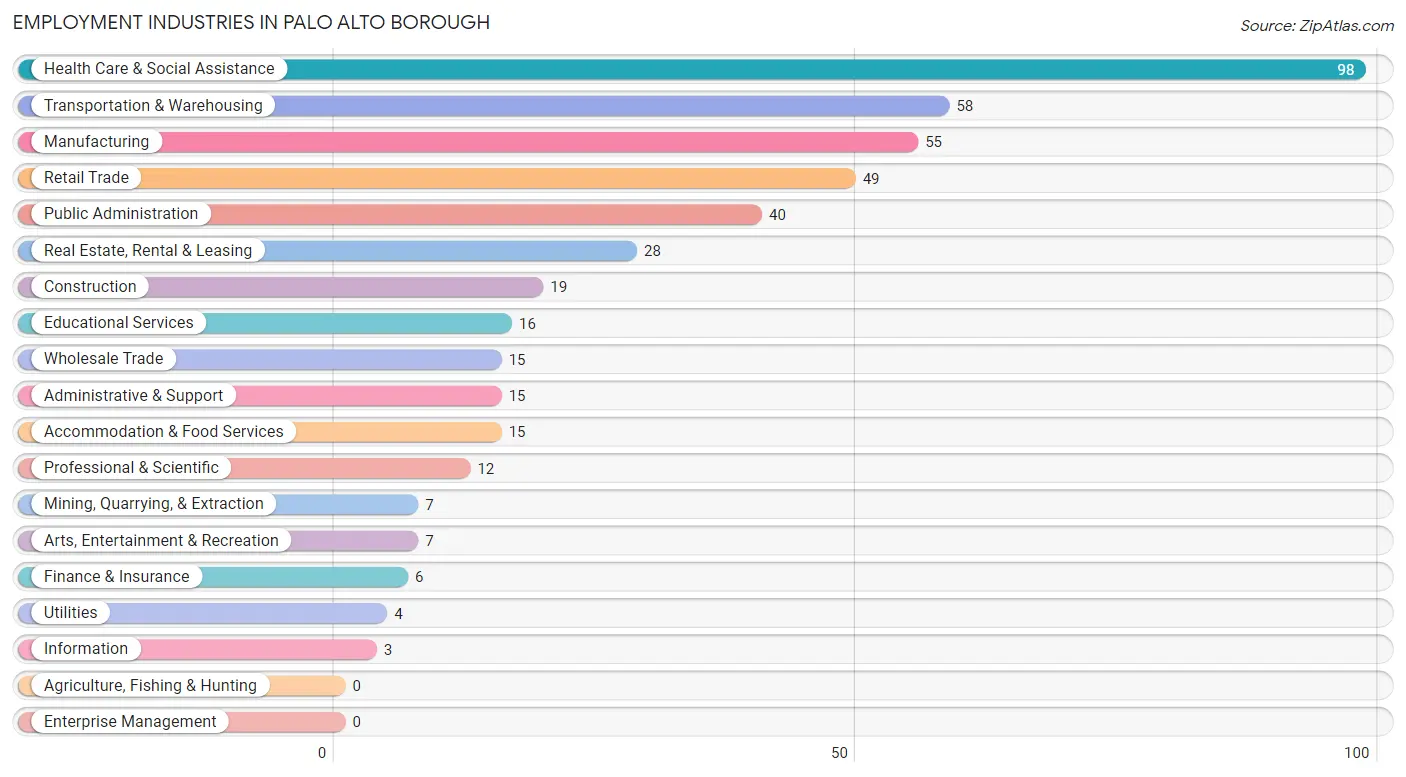
Employment Industries in Palo Alto borough
The major employment industries in Palo Alto borough include Health Care & Social Assistance (98 | 20.8%), Transportation & Warehousing (58 | 12.3%), Manufacturing (55 | 11.7%), Retail Trade (49 | 10.4%), and Public Administration (40 | 8.5%).
Employment Industries by Sex in Palo Alto borough
The Palo Alto borough industries that see more men than women are Mining, Quarrying, & Extraction (100.0%), Construction (100.0%), and Utilities (100.0%), whereas the industries that tend to have a higher number of women are Information (100.0%), Finance & Insurance (100.0%), and Arts, Entertainment & Recreation (100.0%).

| Industry | Male | Female |
| Agriculture, Fishing & Hunting | 0 (0.0%) | 0 (0.0%) |
| Mining, Quarrying, & Extraction | 7 (100.0%) | 0 (0.0%) |
| Construction | 19 (100.0%) | 0 (0.0%) |
| Manufacturing | 51 (92.7%) | 4 (7.3%) |
| Wholesale Trade | 8 (53.3%) | 7 (46.7%) |
| Retail Trade | 25 (51.0%) | 24 (49.0%) |
| Transportation & Warehousing | 38 (65.5%) | 20 (34.5%) |
| Utilities | 4 (100.0%) | 0 (0.0%) |
| Information | 0 (0.0%) | 3 (100.0%) |
| Finance & Insurance | 0 (0.0%) | 6 (100.0%) |
| Real Estate, Rental & Leasing | 7 (25.0%) | 21 (75.0%) |
| Professional & Scientific | 4 (33.3%) | 8 (66.7%) |
| Enterprise Management | 0 (0.0%) | 0 (0.0%) |
| Administrative & Support | 8 (53.3%) | 7 (46.7%) |
| Educational Services | 5 (31.2%) | 11 (68.8%) |
| Health Care & Social Assistance | 24 (24.5%) | 74 (75.5%) |
| Arts, Entertainment & Recreation | 0 (0.0%) | 7 (100.0%) |
| Accommodation & Food Services | 12 (80.0%) | 3 (20.0%) |
| Public Administration | 32 (80.0%) | 8 (20.0%) |
| Total | 248 (52.8%) | 222 (47.2%) |
Education in Palo Alto borough
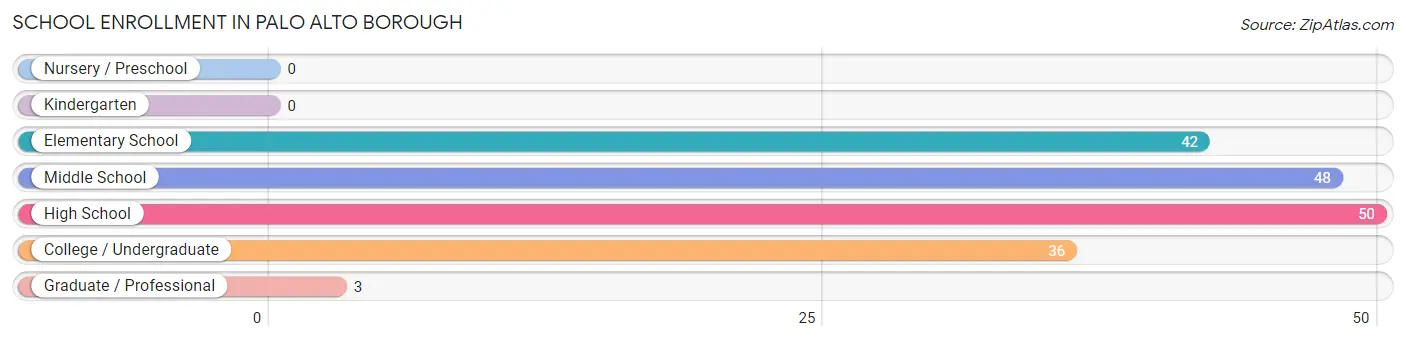
School Enrollment in Palo Alto borough
The most common levels of schooling among the 179 students in Palo Alto borough are high school (50 | 27.9%), middle school (48 | 26.8%), and elementary school (42 | 23.5%).
| School Level | # Students | % Students |
| Nursery / Preschool | 0 | 0.0% |
| Kindergarten | 0 | 0.0% |
| Elementary School | 42 | 23.5% |
| Middle School | 48 | 26.8% |
| High School | 50 | 27.9% |
| College / Undergraduate | 36 | 20.1% |
| Graduate / Professional | 3 | 1.7% |
| Total | 179 | 100.0% |
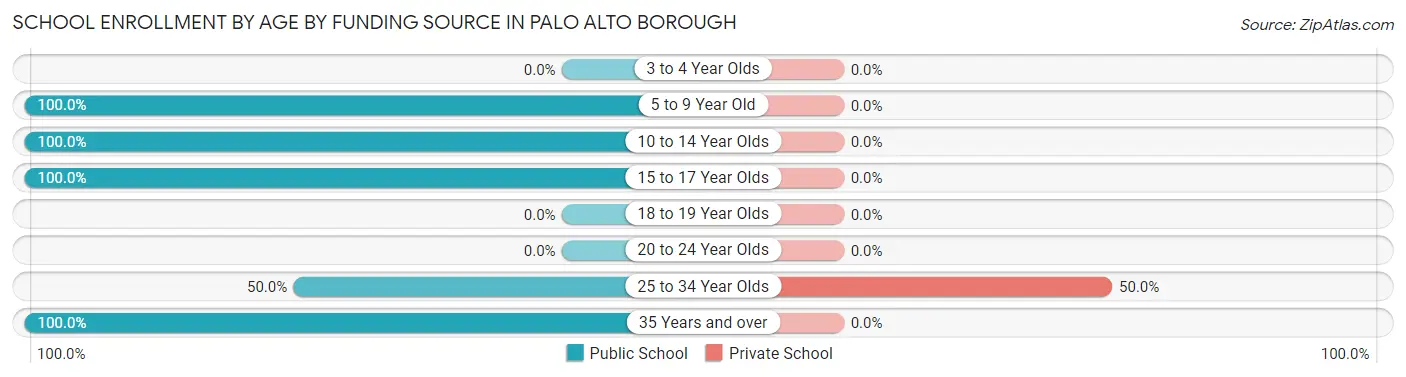
School Enrollment by Age by Funding Source in Palo Alto borough
Out of a total of 179 students who are enrolled in schools in Palo Alto borough, 11 (6.1%) attend a private institution, while the remaining 168 (93.9%) are enrolled in public schools. The age group of 25 to 34 year olds has the highest likelihood of being enrolled in private schools, with 11 (50.0% in the age bracket) enrolled. Conversely, the age group of 5 to 9 year old has the lowest likelihood of being enrolled in a private school, with 42 (100.0% in the age bracket) attending a public institution.
| Age Bracket | Public School | Private School |
| 3 to 4 Year Olds | 0 (0.0%) | 0 (0.0%) |
| 5 to 9 Year Old | 42 (100.0%) | 0 (0.0%) |
| 10 to 14 Year Olds | 74 (100.0%) | 0 (0.0%) |
| 15 to 17 Year Olds | 24 (100.0%) | 0 (0.0%) |
| 18 to 19 Year Olds | 0 (0.0%) | 0 (0.0%) |
| 20 to 24 Year Olds | 0 (0.0%) | 0 (0.0%) |
| 25 to 34 Year Olds | 11 (50.0%) | 11 (50.0%) |
| 35 Years and over | 17 (100.0%) | 0 (0.0%) |
| Total | 168 (93.9%) | 11 (6.1%) |
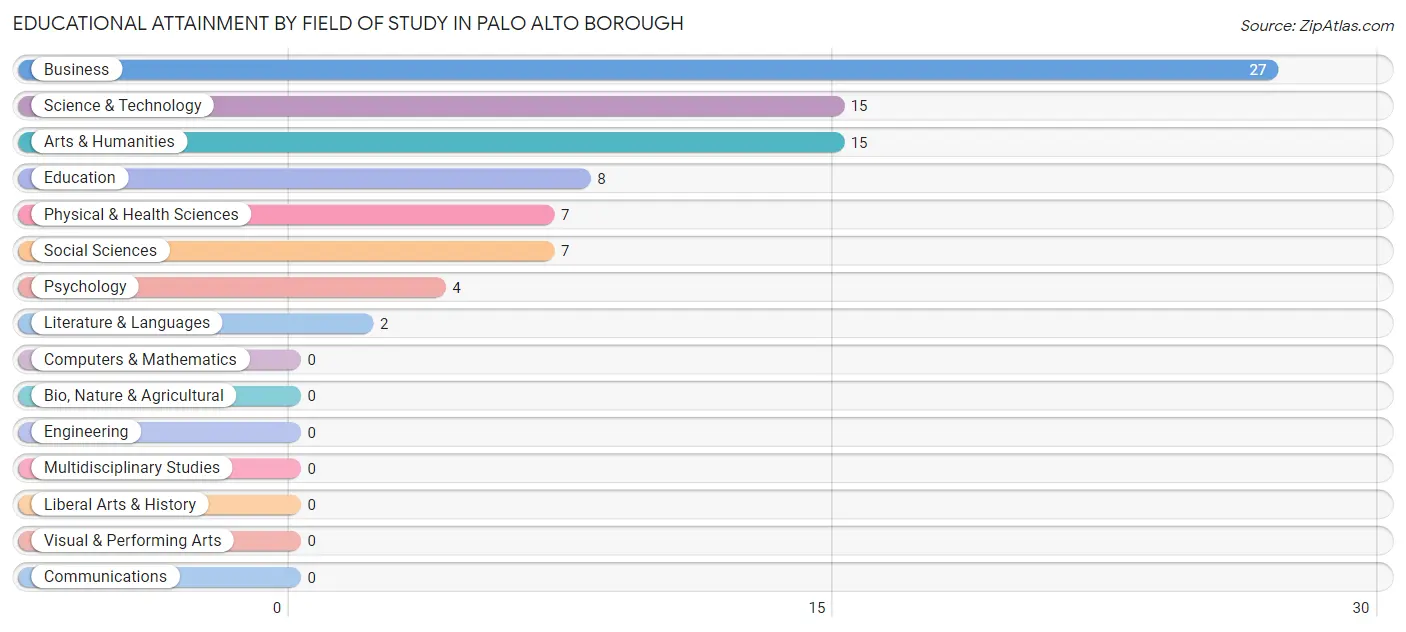
Educational Attainment by Field of Study in Palo Alto borough
Business (27 | 31.8%), science & technology (15 | 17.6%), arts & humanities (15 | 17.6%), education (8 | 9.4%), and physical & health sciences (7 | 8.2%) are the most common fields of study among 85 individuals in Palo Alto borough who have obtained a bachelor's degree or higher.
| Field of Study | # Graduates | % Graduates |
| Computers & Mathematics | 0 | 0.0% |
| Bio, Nature & Agricultural | 0 | 0.0% |
| Physical & Health Sciences | 7 | 8.2% |
| Psychology | 4 | 4.7% |
| Social Sciences | 7 | 8.2% |
| Engineering | 0 | 0.0% |
| Multidisciplinary Studies | 0 | 0.0% |
| Science & Technology | 15 | 17.6% |
| Business | 27 | 31.8% |
| Education | 8 | 9.4% |
| Literature & Languages | 2 | 2.4% |
| Liberal Arts & History | 0 | 0.0% |
| Visual & Performing Arts | 0 | 0.0% |
| Communications | 0 | 0.0% |
| Arts & Humanities | 15 | 17.6% |
| Total | 85 | 100.0% |
Transportation & Commute in Palo Alto borough
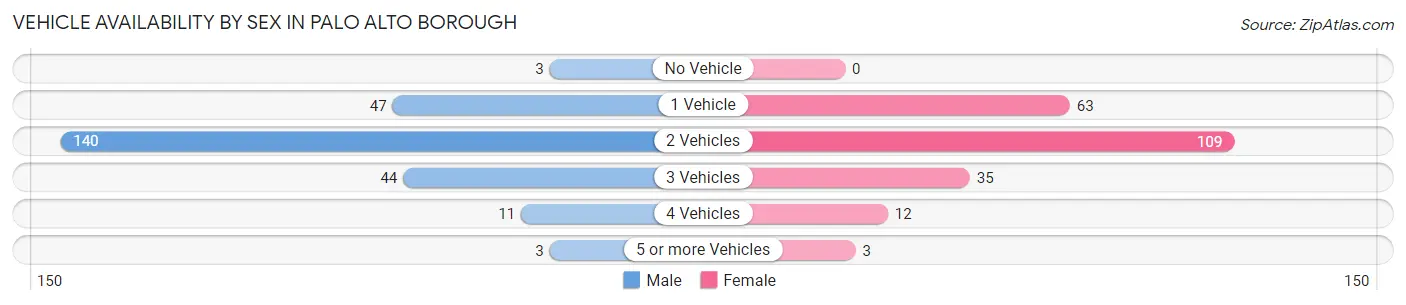
Vehicle Availability by Sex in Palo Alto borough
The most prevalent vehicle ownership categories in Palo Alto borough are males with 2 vehicles (140, accounting for 56.5%) and females with 2 vehicles (109, making up 63.1%).
| Vehicles Available | Male | Female |
| No Vehicle | 3 (1.2%) | 0 (0.0%) |
| 1 Vehicle | 47 (19.0%) | 63 (28.4%) |
| 2 Vehicles | 140 (56.5%) | 109 (49.1%) |
| 3 Vehicles | 44 (17.7%) | 35 (15.8%) |
| 4 Vehicles | 11 (4.4%) | 12 (5.4%) |
| 5 or more Vehicles | 3 (1.2%) | 3 (1.3%) |
| Total | 248 (100.0%) | 222 (100.0%) |
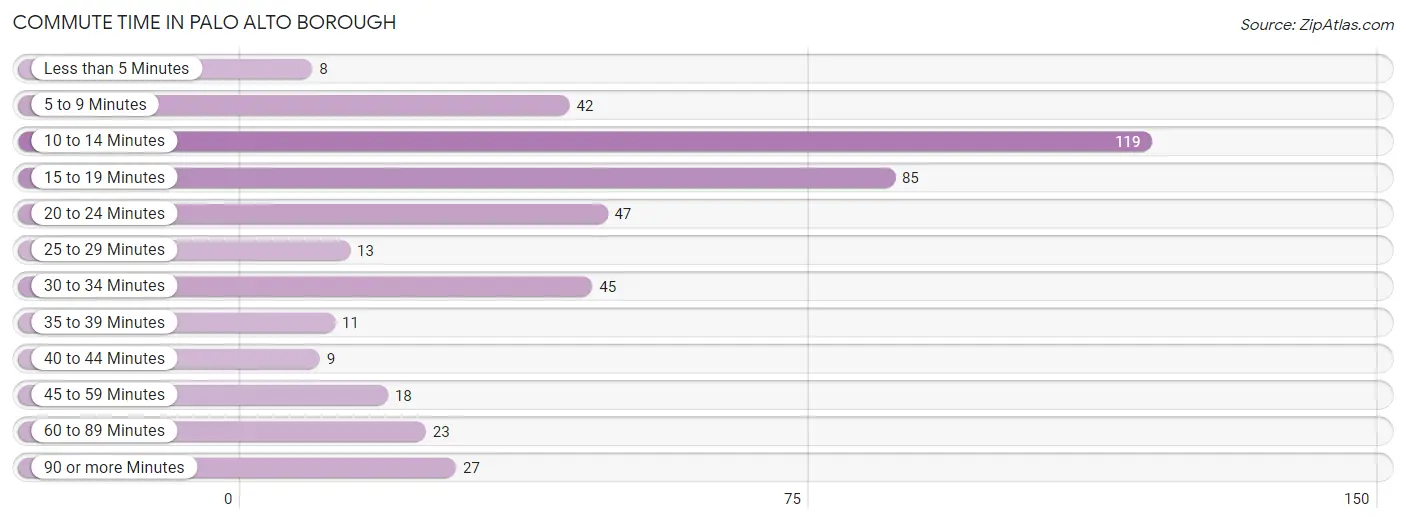
Commute Time in Palo Alto borough
The most frequently occuring commute durations in Palo Alto borough are 10 to 14 minutes (119 commuters, 26.6%), 15 to 19 minutes (85 commuters, 19.0%), and 20 to 24 minutes (47 commuters, 10.5%).
| Commute Time | # Commuters | % Commuters |
| Less than 5 Minutes | 8 | 1.8% |
| 5 to 9 Minutes | 42 | 9.4% |
| 10 to 14 Minutes | 119 | 26.6% |
| 15 to 19 Minutes | 85 | 19.0% |
| 20 to 24 Minutes | 47 | 10.5% |
| 25 to 29 Minutes | 13 | 2.9% |
| 30 to 34 Minutes | 45 | 10.1% |
| 35 to 39 Minutes | 11 | 2.5% |
| 40 to 44 Minutes | 9 | 2.0% |
| 45 to 59 Minutes | 18 | 4.0% |
| 60 to 89 Minutes | 23 | 5.1% |
| 90 or more Minutes | 27 | 6.0% |
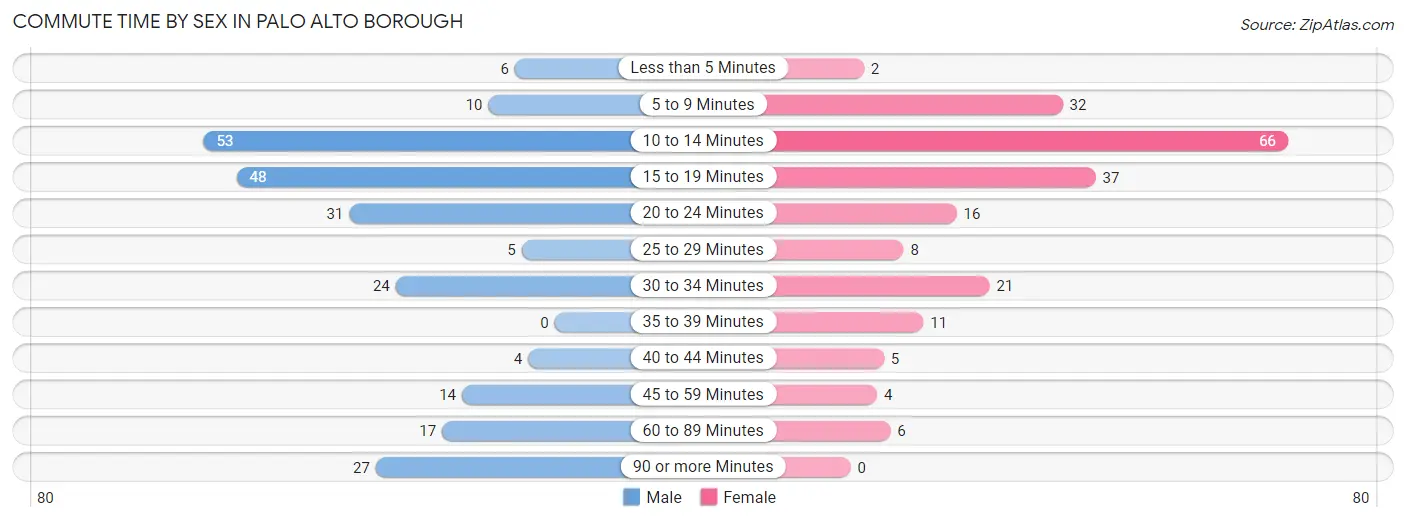
Commute Time by Sex in Palo Alto borough
The most common commute times in Palo Alto borough are 10 to 14 minutes (53 commuters, 22.2%) for males and 10 to 14 minutes (66 commuters, 31.7%) for females.
| Commute Time | Male | Female |
| Less than 5 Minutes | 6 (2.5%) | 2 (1.0%) |
| 5 to 9 Minutes | 10 (4.2%) | 32 (15.4%) |
| 10 to 14 Minutes | 53 (22.2%) | 66 (31.7%) |
| 15 to 19 Minutes | 48 (20.1%) | 37 (17.8%) |
| 20 to 24 Minutes | 31 (13.0%) | 16 (7.7%) |
| 25 to 29 Minutes | 5 (2.1%) | 8 (3.8%) |
| 30 to 34 Minutes | 24 (10.0%) | 21 (10.1%) |
| 35 to 39 Minutes | 0 (0.0%) | 11 (5.3%) |
| 40 to 44 Minutes | 4 (1.7%) | 5 (2.4%) |
| 45 to 59 Minutes | 14 (5.9%) | 4 (1.9%) |
| 60 to 89 Minutes | 17 (7.1%) | 6 (2.9%) |
| 90 or more Minutes | 27 (11.3%) | 0 (0.0%) |
Time of Departure to Work by Sex in Palo Alto borough
The most frequent times of departure to work in Palo Alto borough are 5:00 AM to 5:29 AM (60, 25.1%) for males and 7:30 AM to 7:59 AM (43, 20.7%) for females.
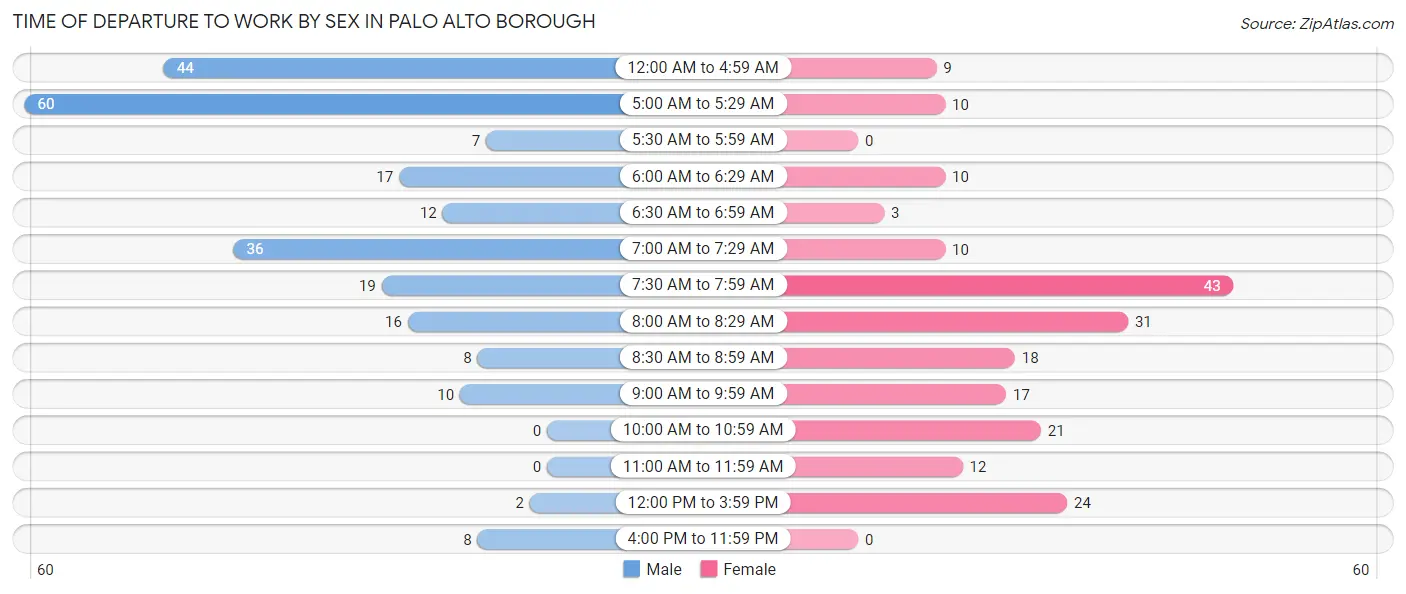
| Time of Departure | Male | Female |
| 12:00 AM to 4:59 AM | 44 (18.4%) | 9 (4.3%) |
| 5:00 AM to 5:29 AM | 60 (25.1%) | 10 (4.8%) |
| 5:30 AM to 5:59 AM | 7 (2.9%) | 0 (0.0%) |
| 6:00 AM to 6:29 AM | 17 (7.1%) | 10 (4.8%) |
| 6:30 AM to 6:59 AM | 12 (5.0%) | 3 (1.4%) |
| 7:00 AM to 7:29 AM | 36 (15.1%) | 10 (4.8%) |
| 7:30 AM to 7:59 AM | 19 (8.0%) | 43 (20.7%) |
| 8:00 AM to 8:29 AM | 16 (6.7%) | 31 (14.9%) |
| 8:30 AM to 8:59 AM | 8 (3.4%) | 18 (8.6%) |
| 9:00 AM to 9:59 AM | 10 (4.2%) | 17 (8.2%) |
| 10:00 AM to 10:59 AM | 0 (0.0%) | 21 (10.1%) |
| 11:00 AM to 11:59 AM | 0 (0.0%) | 12 (5.8%) |
| 12:00 PM to 3:59 PM | 2 (0.8%) | 24 (11.5%) |
| 4:00 PM to 11:59 PM | 8 (3.4%) | 0 (0.0%) |
| Total | 239 (100.0%) | 208 (100.0%) |
Housing Occupancy in Palo Alto borough
Occupancy by Ownership in Palo Alto borough
Of the total 407 dwellings in Palo Alto borough, owner-occupied units account for 341 (83.8%), while renter-occupied units make up 66 (16.2%).
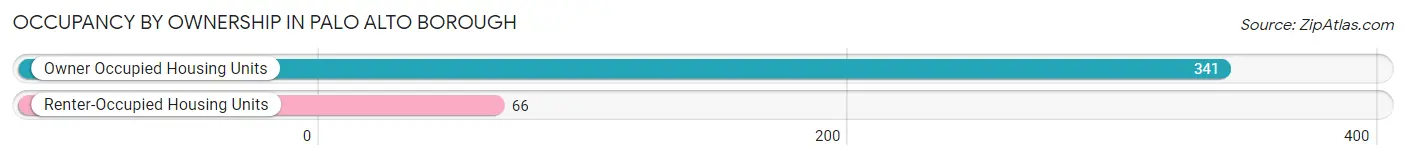
| Occupancy | # Housing Units | % Housing Units |
| Owner Occupied Housing Units | 341 | 83.8% |
| Renter-Occupied Housing Units | 66 | 16.2% |
| Total Occupied Housing Units | 407 | 100.0% |
Occupancy by Household Size in Palo Alto borough
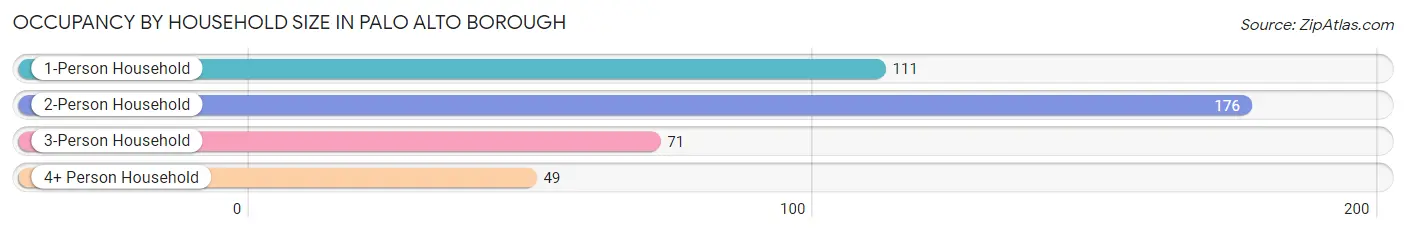
| Household Size | # Housing Units | % Housing Units |
| 1-Person Household | 111 | 27.3% |
| 2-Person Household | 176 | 43.2% |
| 3-Person Household | 71 | 17.4% |
| 4+ Person Household | 49 | 12.0% |
| Total Housing Units | 407 | 100.0% |
Occupancy by Ownership by Household Size in Palo Alto borough
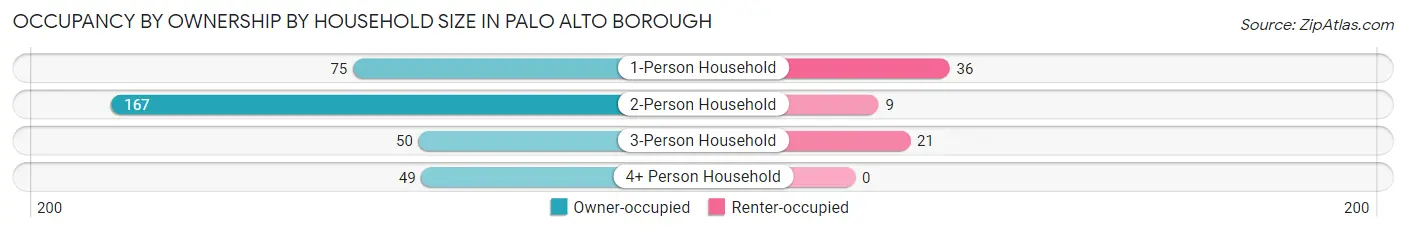
| Household Size | Owner-occupied | Renter-occupied |
| 1-Person Household | 75 (67.6%) | 36 (32.4%) |
| 2-Person Household | 167 (94.9%) | 9 (5.1%) |
| 3-Person Household | 50 (70.4%) | 21 (29.6%) |
| 4+ Person Household | 49 (100.0%) | 0 (0.0%) |
| Total Housing Units | 341 (83.8%) | 66 (16.2%) |
Occupancy by Educational Attainment in Palo Alto borough
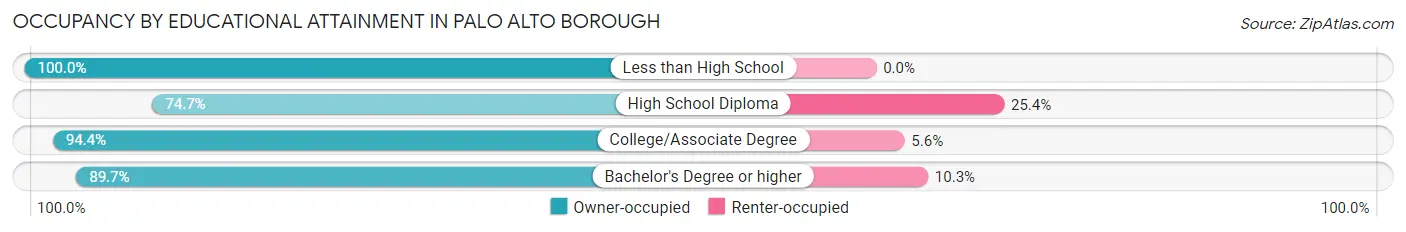
| Household Size | Owner-occupied | Renter-occupied |
| Less than High School | 26 (100.0%) | 0 (0.0%) |
| High School Diploma | 162 (74.7%) | 55 (25.4%) |
| College/Associate Degree | 118 (94.4%) | 7 (5.6%) |
| Bachelor's Degree or higher | 35 (89.7%) | 4 (10.3%) |
Occupancy by Age of Householder in Palo Alto borough
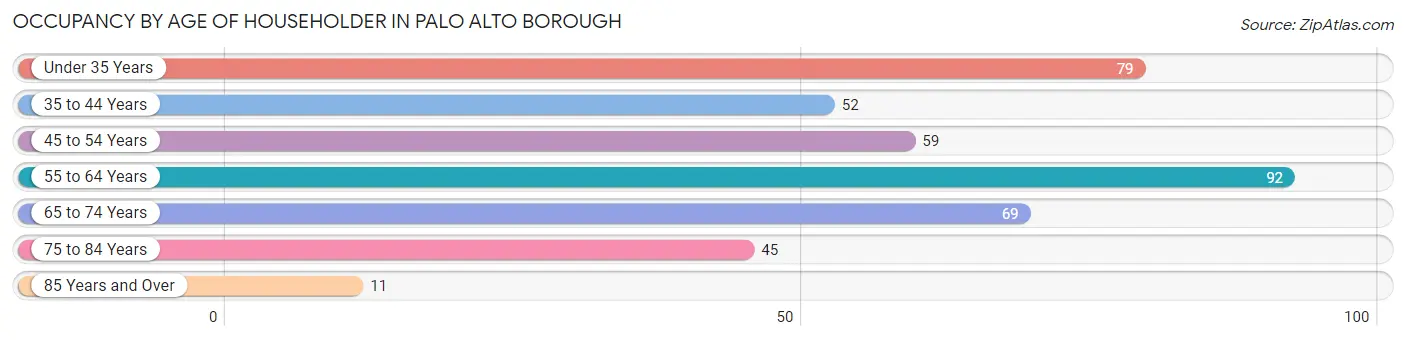
| Age Bracket | # Households | % Households |
| Under 35 Years | 79 | 19.4% |
| 35 to 44 Years | 52 | 12.8% |
| 45 to 54 Years | 59 | 14.5% |
| 55 to 64 Years | 92 | 22.6% |
| 65 to 74 Years | 69 | 17.0% |
| 75 to 84 Years | 45 | 11.1% |
| 85 Years and Over | 11 | 2.7% |
| Total | 407 | 100.0% |
Housing Finances in Palo Alto borough
Median Income by Occupancy in Palo Alto borough
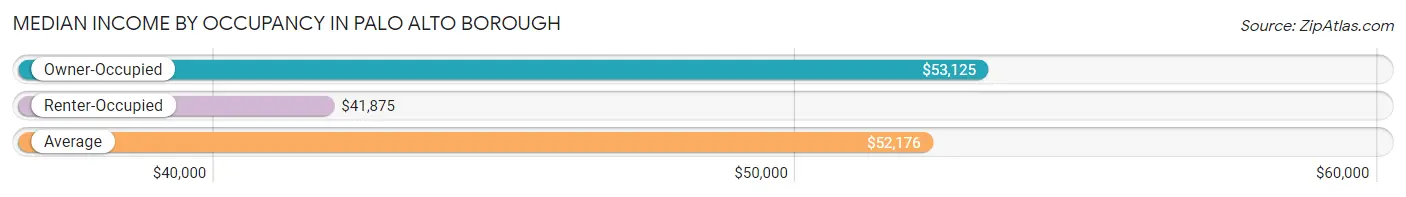
| Occupancy Type | # Households | Median Income |
| Owner-Occupied | 341 (83.8%) | $53,125 |
| Renter-Occupied | 66 (16.2%) | $41,875 |
| Average | 407 (100.0%) | $52,176 |
Occupancy by Householder Income Bracket in Palo Alto borough
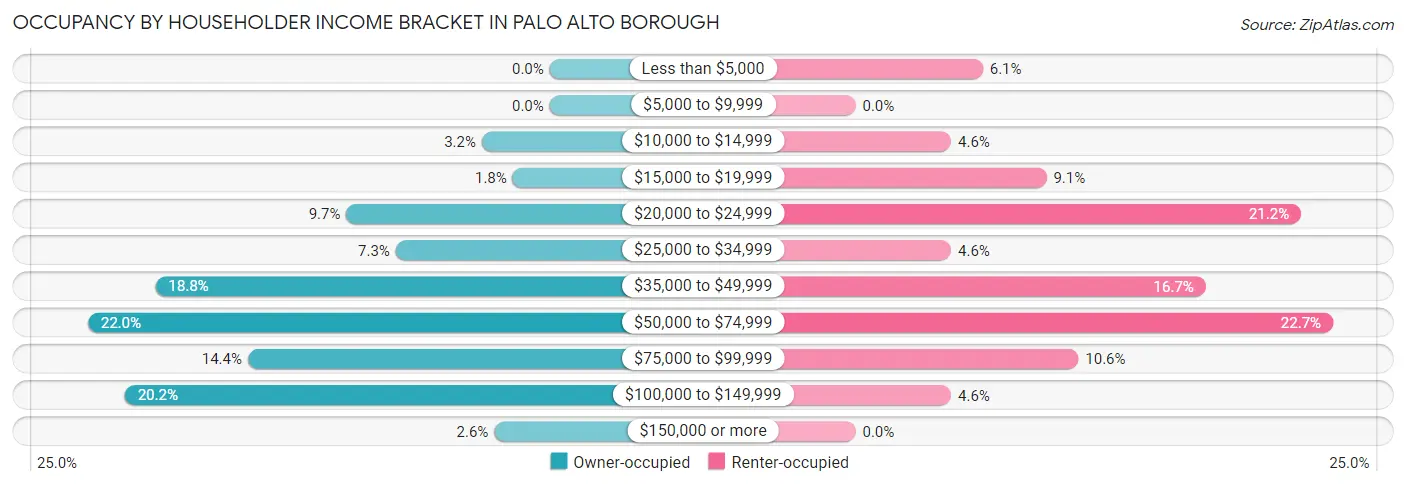
| Income Bracket | Owner-occupied | Renter-occupied |
| Less than $5,000 | 0 (0.0%) | 4 (6.1%) |
| $5,000 to $9,999 | 0 (0.0%) | 0 (0.0%) |
| $10,000 to $14,999 | 11 (3.2%) | 3 (4.5%) |
| $15,000 to $19,999 | 6 (1.8%) | 6 (9.1%) |
| $20,000 to $24,999 | 33 (9.7%) | 14 (21.2%) |
| $25,000 to $34,999 | 25 (7.3%) | 3 (4.5%) |
| $35,000 to $49,999 | 64 (18.8%) | 11 (16.7%) |
| $50,000 to $74,999 | 75 (22.0%) | 15 (22.7%) |
| $75,000 to $99,999 | 49 (14.4%) | 7 (10.6%) |
| $100,000 to $149,999 | 69 (20.2%) | 3 (4.5%) |
| $150,000 or more | 9 (2.6%) | 0 (0.0%) |
| Total | 341 (100.0%) | 66 (100.0%) |
Monthly Housing Cost Tiers in Palo Alto borough
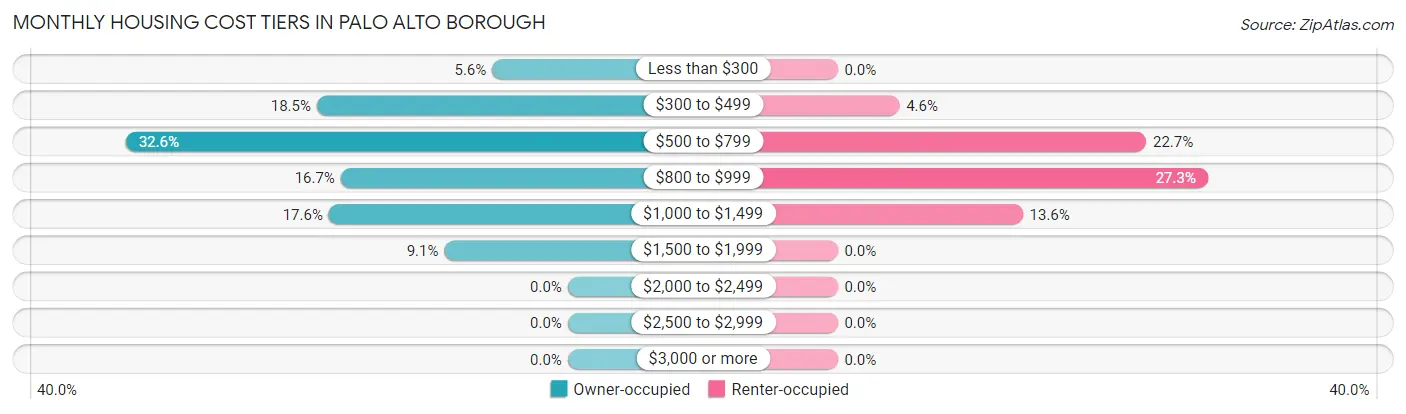
| Monthly Cost | Owner-occupied | Renter-occupied |
| Less than $300 | 19 (5.6%) | 0 (0.0%) |
| $300 to $499 | 63 (18.5%) | 3 (4.5%) |
| $500 to $799 | 111 (32.6%) | 15 (22.7%) |
| $800 to $999 | 57 (16.7%) | 18 (27.3%) |
| $1,000 to $1,499 | 60 (17.6%) | 9 (13.6%) |
| $1,500 to $1,999 | 31 (9.1%) | 0 (0.0%) |
| $2,000 to $2,499 | 0 (0.0%) | 0 (0.0%) |
| $2,500 to $2,999 | 0 (0.0%) | 0 (0.0%) |
| $3,000 or more | 0 (0.0%) | 0 (0.0%) |
| Total | 341 (100.0%) | 66 (100.0%) |
Physical Housing Characteristics in Palo Alto borough
Housing Structures in Palo Alto borough
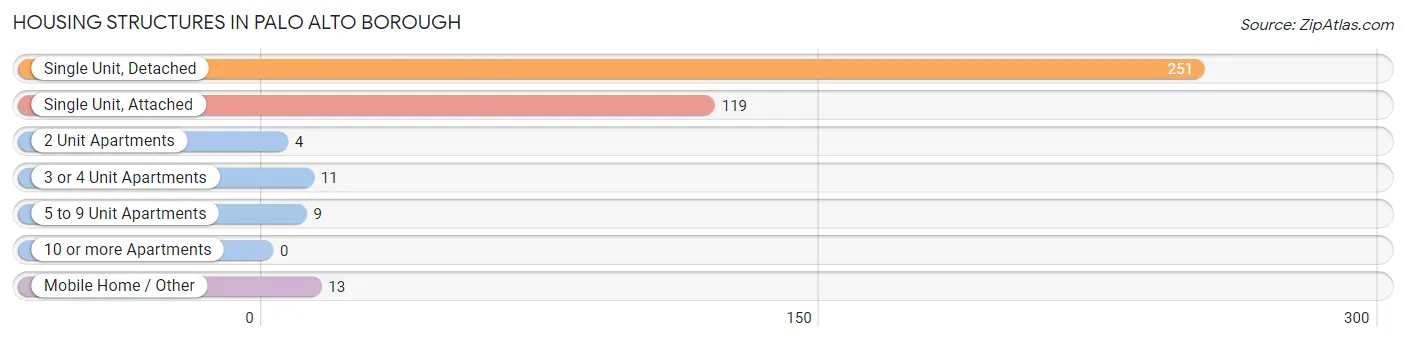
| Structure Type | # Housing Units | % Housing Units |
| Single Unit, Detached | 251 | 61.7% |
| Single Unit, Attached | 119 | 29.2% |
| 2 Unit Apartments | 4 | 1.0% |
| 3 or 4 Unit Apartments | 11 | 2.7% |
| 5 to 9 Unit Apartments | 9 | 2.2% |
| 10 or more Apartments | 0 | 0.0% |
| Mobile Home / Other | 13 | 3.2% |
| Total | 407 | 100.0% |
Housing Structures by Occupancy in Palo Alto borough
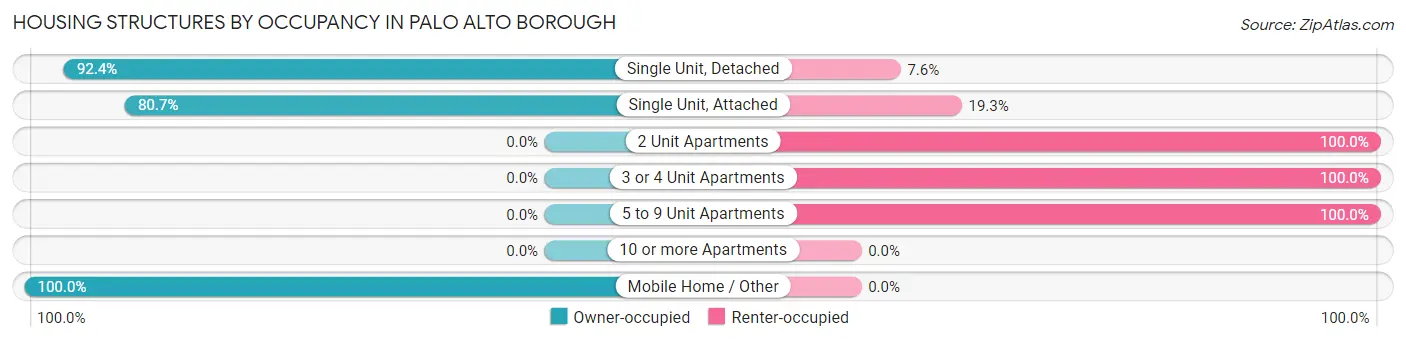
| Structure Type | Owner-occupied | Renter-occupied |
| Single Unit, Detached | 232 (92.4%) | 19 (7.6%) |
| Single Unit, Attached | 96 (80.7%) | 23 (19.3%) |
| 2 Unit Apartments | 0 (0.0%) | 4 (100.0%) |
| 3 or 4 Unit Apartments | 0 (0.0%) | 11 (100.0%) |
| 5 to 9 Unit Apartments | 0 (0.0%) | 9 (100.0%) |
| 10 or more Apartments | 0 (0.0%) | 0 (0.0%) |
| Mobile Home / Other | 13 (100.0%) | 0 (0.0%) |
| Total | 341 (83.8%) | 66 (16.2%) |
Housing Structures by Number of Rooms in Palo Alto borough
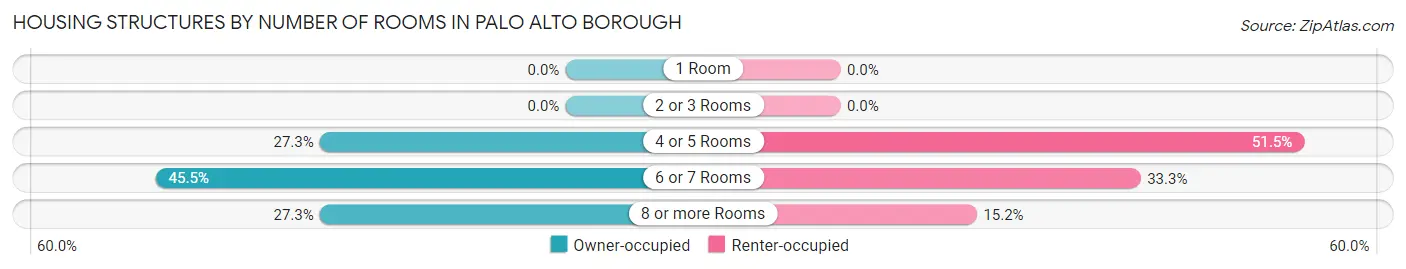
| Number of Rooms | Owner-occupied | Renter-occupied |
| 1 Room | 0 (0.0%) | 0 (0.0%) |
| 2 or 3 Rooms | 0 (0.0%) | 0 (0.0%) |
| 4 or 5 Rooms | 93 (27.3%) | 34 (51.5%) |
| 6 or 7 Rooms | 155 (45.5%) | 22 (33.3%) |
| 8 or more Rooms | 93 (27.3%) | 10 (15.1%) |
| Total | 341 (100.0%) | 66 (100.0%) |
Housing Structure by Heating Type in Palo Alto borough
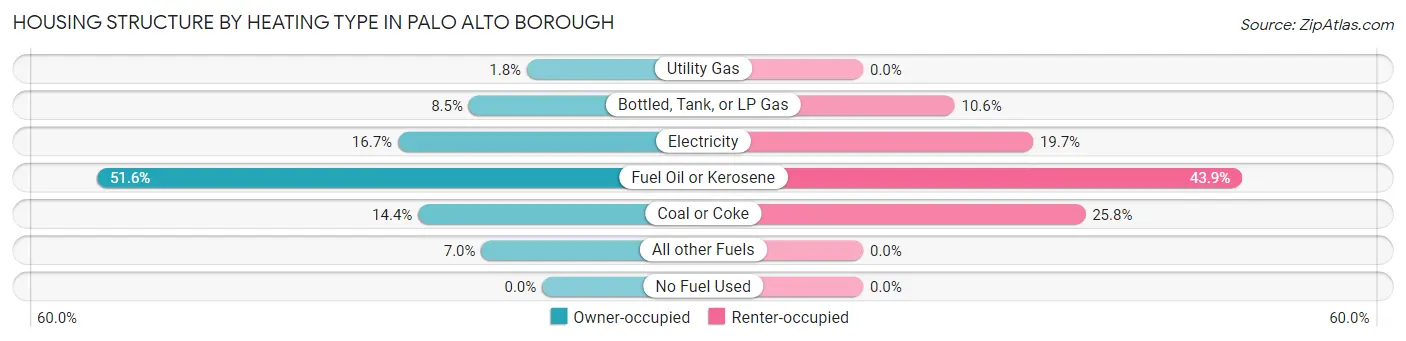
| Heating Type | Owner-occupied | Renter-occupied |
| Utility Gas | 6 (1.8%) | 0 (0.0%) |
| Bottled, Tank, or LP Gas | 29 (8.5%) | 7 (10.6%) |
| Electricity | 57 (16.7%) | 13 (19.7%) |
| Fuel Oil or Kerosene | 176 (51.6%) | 29 (43.9%) |
| Coal or Coke | 49 (14.4%) | 17 (25.8%) |
| All other Fuels | 24 (7.0%) | 0 (0.0%) |
| No Fuel Used | 0 (0.0%) | 0 (0.0%) |
| Total | 341 (100.0%) | 66 (100.0%) |
Household Vehicle Usage in Palo Alto borough
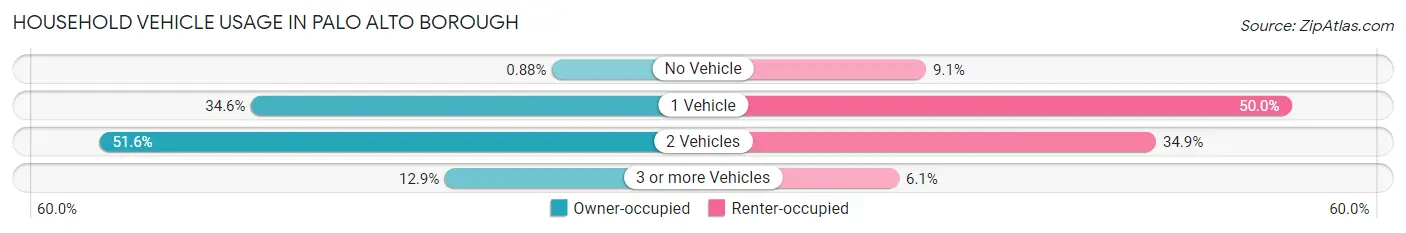
| Vehicles per Household | Owner-occupied | Renter-occupied |
| No Vehicle | 3 (0.9%) | 6 (9.1%) |
| 1 Vehicle | 118 (34.6%) | 33 (50.0%) |
| 2 Vehicles | 176 (51.6%) | 23 (34.8%) |
| 3 or more Vehicles | 44 (12.9%) | 4 (6.1%) |
| Total | 341 (100.0%) | 66 (100.0%) |
Real Estate & Mortgages in Palo Alto borough
Real Estate and Mortgage Overview in Palo Alto borough
| Characteristic | Without Mortgage | With Mortgage |
| Housing Units | 152 | 189 |
| Median Property Value | $62,000 | $93,000 |
| Median Household Income | $52,000 | $9 |
| Monthly Housing Costs | $485 | $0 |
| Real Estate Taxes | $1,243 | $0 |
Property Value by Mortgage Status in Palo Alto borough
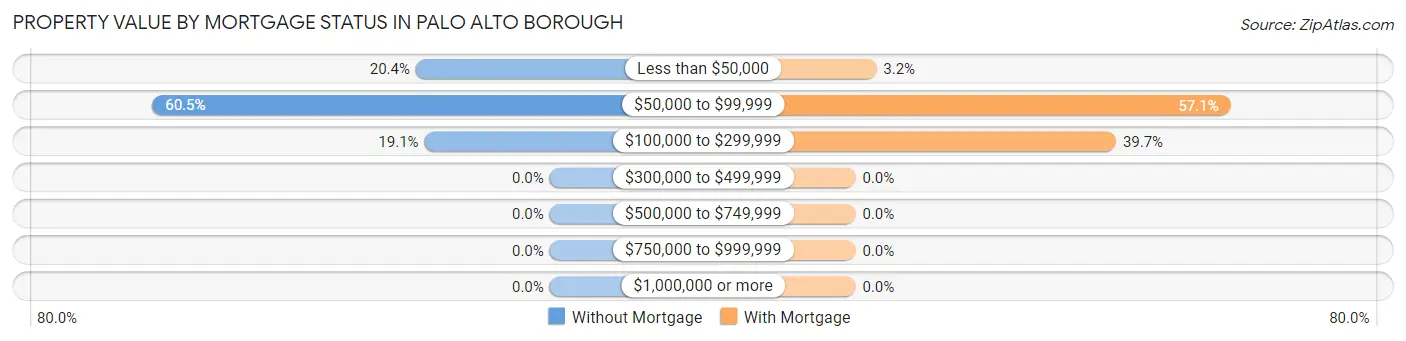
| Property Value | Without Mortgage | With Mortgage |
| Less than $50,000 | 31 (20.4%) | 6 (3.2%) |
| $50,000 to $99,999 | 92 (60.5%) | 108 (57.1%) |
| $100,000 to $299,999 | 29 (19.1%) | 75 (39.7%) |
| $300,000 to $499,999 | 0 (0.0%) | 0 (0.0%) |
| $500,000 to $749,999 | 0 (0.0%) | 0 (0.0%) |
| $750,000 to $999,999 | 0 (0.0%) | 0 (0.0%) |
| $1,000,000 or more | 0 (0.0%) | 0 (0.0%) |
| Total | 152 (100.0%) | 189 (100.0%) |
Household Income by Mortgage Status in Palo Alto borough
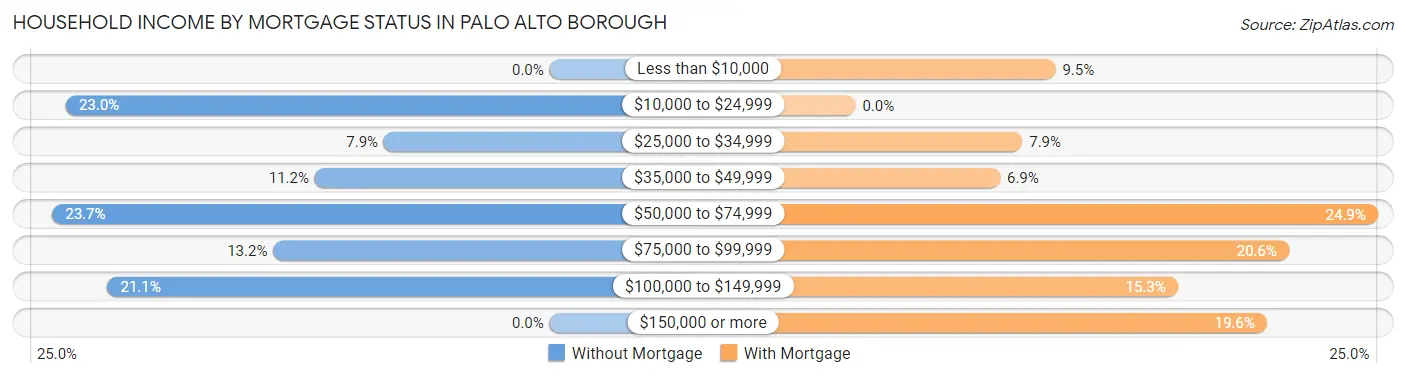
| Household Income | Without Mortgage | With Mortgage |
| Less than $10,000 | 0 (0.0%) | 18 (9.5%) |
| $10,000 to $24,999 | 35 (23.0%) | 0 (0.0%) |
| $25,000 to $34,999 | 12 (7.9%) | 15 (7.9%) |
| $35,000 to $49,999 | 17 (11.2%) | 13 (6.9%) |
| $50,000 to $74,999 | 36 (23.7%) | 47 (24.9%) |
| $75,000 to $99,999 | 20 (13.2%) | 39 (20.6%) |
| $100,000 to $149,999 | 32 (21.0%) | 29 (15.3%) |
| $150,000 or more | 0 (0.0%) | 37 (19.6%) |
| Total | 152 (100.0%) | 189 (100.0%) |
Property Value to Household Income Ratio in Palo Alto borough
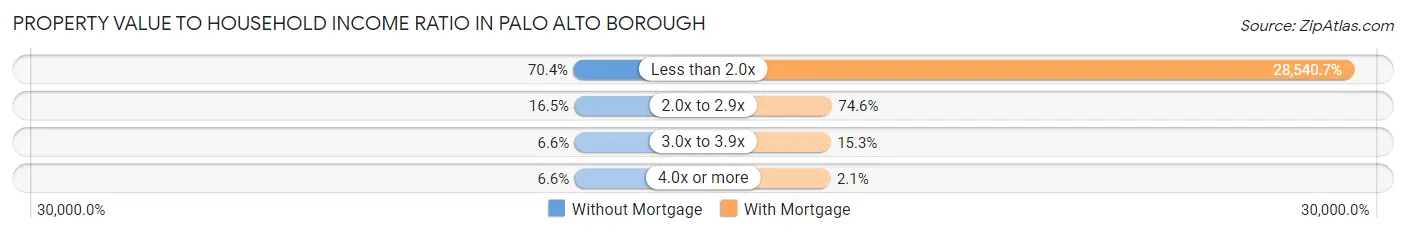
| Value-to-Income Ratio | Without Mortgage | With Mortgage |
| Less than 2.0x | 107 (70.4%) | 53,942 (28,540.7%) |
| 2.0x to 2.9x | 25 (16.5%) | 141 (74.6%) |
| 3.0x to 3.9x | 10 (6.6%) | 29 (15.3%) |
| 4.0x or more | 10 (6.6%) | 4 (2.1%) |
| Total | 152 (100.0%) | 189 (100.0%) |
Real Estate Taxes by Mortgage Status in Palo Alto borough
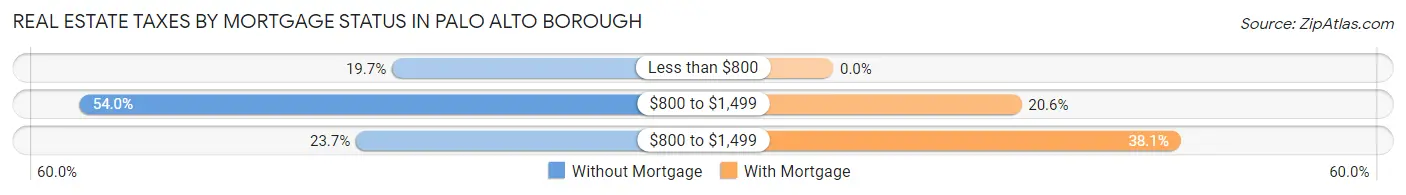
| Property Taxes | Without Mortgage | With Mortgage |
| Less than $800 | 30 (19.7%) | 0 (0.0%) |
| $800 to $1,499 | 82 (53.9%) | 39 (20.6%) |
| $800 to $1,499 | 36 (23.7%) | 72 (38.1%) |
| Total | 152 (100.0%) | 189 (100.0%) |
Health & Disability in Palo Alto borough
Health Insurance Coverage by Age in Palo Alto borough
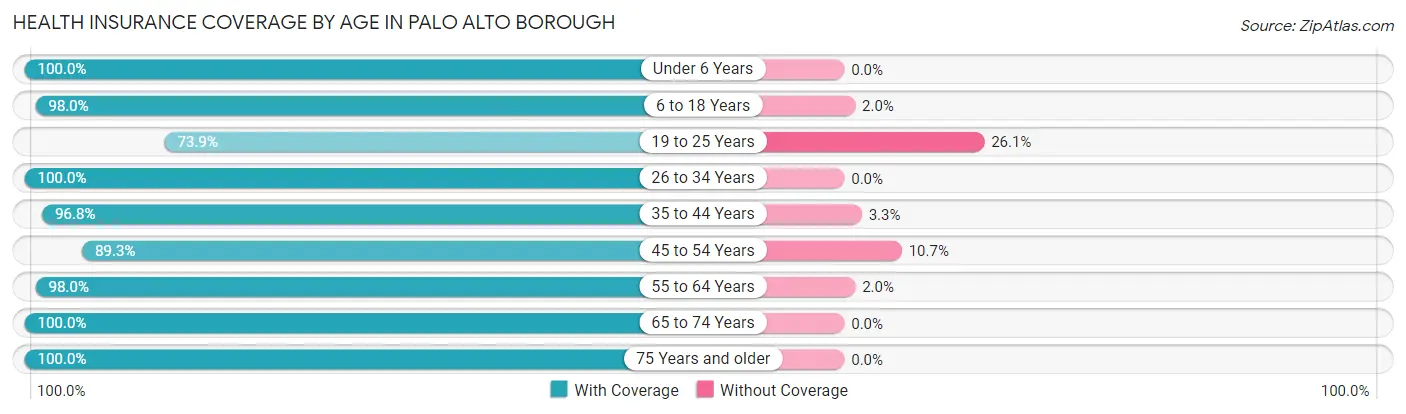
| Age Bracket | With Coverage | Without Coverage |
| Under 6 Years | 77 (100.0%) | 0 (0.0%) |
| 6 to 18 Years | 146 (98.0%) | 3 (2.0%) |
| 19 to 25 Years | 51 (73.9%) | 18 (26.1%) |
| 26 to 34 Years | 83 (100.0%) | 0 (0.0%) |
| 35 to 44 Years | 119 (96.8%) | 4 (3.3%) |
| 45 to 54 Years | 100 (89.3%) | 12 (10.7%) |
| 55 to 64 Years | 144 (98.0%) | 3 (2.0%) |
| 65 to 74 Years | 117 (100.0%) | 0 (0.0%) |
| 75 Years and older | 76 (100.0%) | 0 (0.0%) |
| Total | 913 (95.8%) | 40 (4.2%) |
Health Insurance Coverage by Citizenship Status in Palo Alto borough
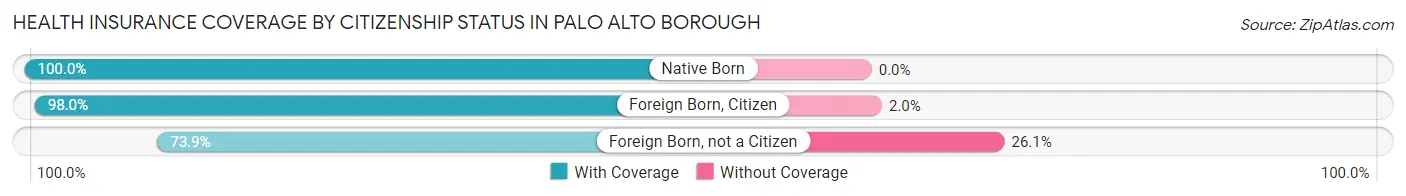
| Citizenship Status | With Coverage | Without Coverage |
| Native Born | 77 (100.0%) | 0 (0.0%) |
| Foreign Born, Citizen | 146 (98.0%) | 3 (2.0%) |
| Foreign Born, not a Citizen | 51 (73.9%) | 18 (26.1%) |
Health Insurance Coverage by Household Income in Palo Alto borough
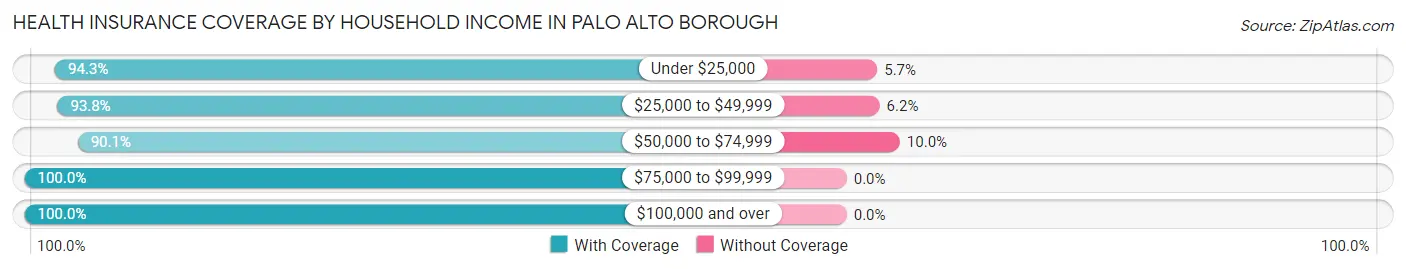
| Household Income | With Coverage | Without Coverage |
| Under $25,000 | 99 (94.3%) | 6 (5.7%) |
| $25,000 to $49,999 | 198 (93.8%) | 13 (6.2%) |
| $50,000 to $74,999 | 190 (90.0%) | 21 (10.0%) |
| $75,000 to $99,999 | 152 (100.0%) | 0 (0.0%) |
| $100,000 and over | 274 (100.0%) | 0 (0.0%) |
Public vs Private Health Insurance Coverage by Age in Palo Alto borough
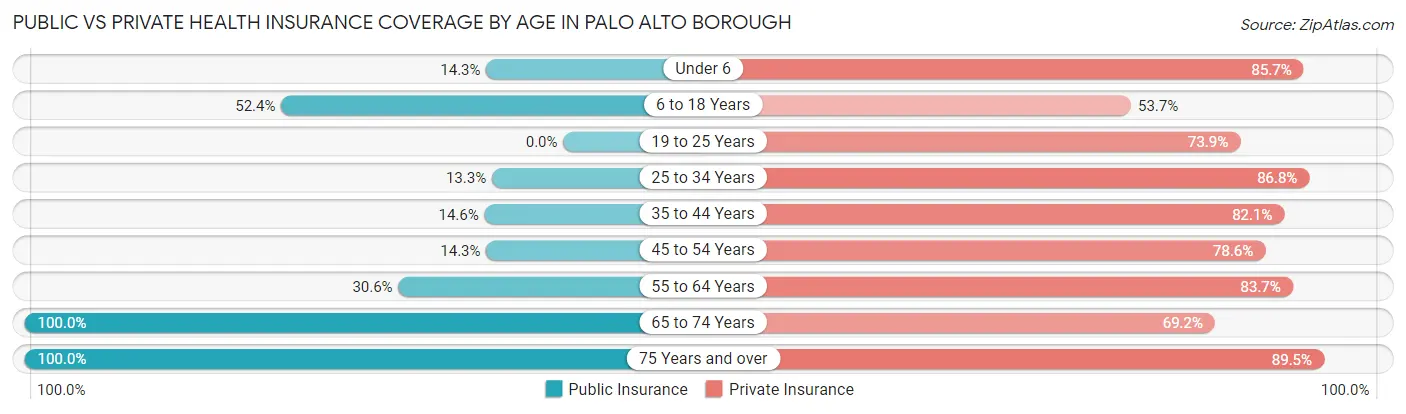
| Age Bracket | Public Insurance | Private Insurance |
| Under 6 | 11 (14.3%) | 66 (85.7%) |
| 6 to 18 Years | 78 (52.3%) | 80 (53.7%) |
| 19 to 25 Years | 0 (0.0%) | 51 (73.9%) |
| 25 to 34 Years | 11 (13.3%) | 72 (86.8%) |
| 35 to 44 Years | 18 (14.6%) | 101 (82.1%) |
| 45 to 54 Years | 16 (14.3%) | 88 (78.6%) |
| 55 to 64 Years | 45 (30.6%) | 123 (83.7%) |
| 65 to 74 Years | 117 (100.0%) | 81 (69.2%) |
| 75 Years and over | 76 (100.0%) | 68 (89.5%) |
| Total | 372 (39.0%) | 730 (76.6%) |
Disability Status by Sex by Age in Palo Alto borough
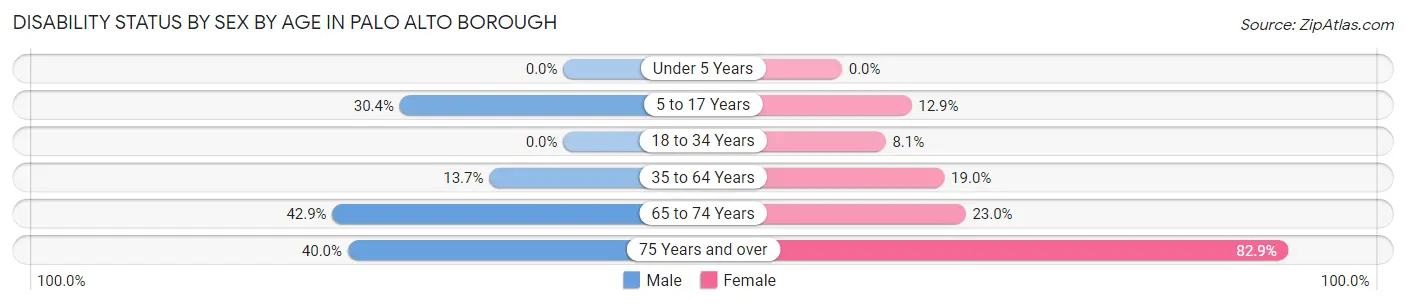
| Age Bracket | Male | Female |
| Under 5 Years | 0 (0.0%) | 0 (0.0%) |
| 5 to 17 Years | 17 (30.4%) | 12 (12.9%) |
| 18 to 34 Years | 0 (0.0%) | 6 (8.1%) |
| 35 to 64 Years | 25 (13.7%) | 38 (19.0%) |
| 65 to 74 Years | 24 (42.9%) | 14 (23.0%) |
| 75 Years and over | 14 (40.0%) | 34 (82.9%) |
Disability Class by Sex by Age in Palo Alto borough
Disability Class: Hearing Difficulty
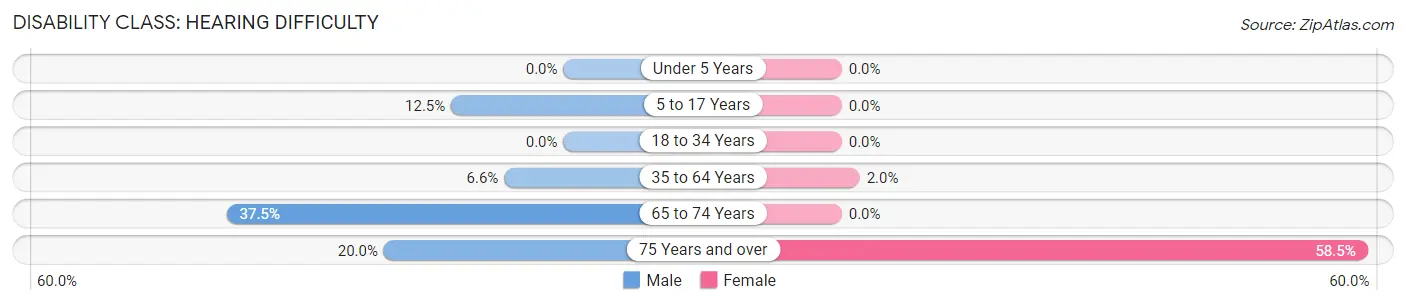
| Age Bracket | Male | Female |
| Under 5 Years | 0 (0.0%) | 0 (0.0%) |
| 5 to 17 Years | 7 (12.5%) | 0 (0.0%) |
| 18 to 34 Years | 0 (0.0%) | 0 (0.0%) |
| 35 to 64 Years | 12 (6.6%) | 4 (2.0%) |
| 65 to 74 Years | 21 (37.5%) | 0 (0.0%) |
| 75 Years and over | 7 (20.0%) | 24 (58.5%) |
Disability Class: Vision Difficulty
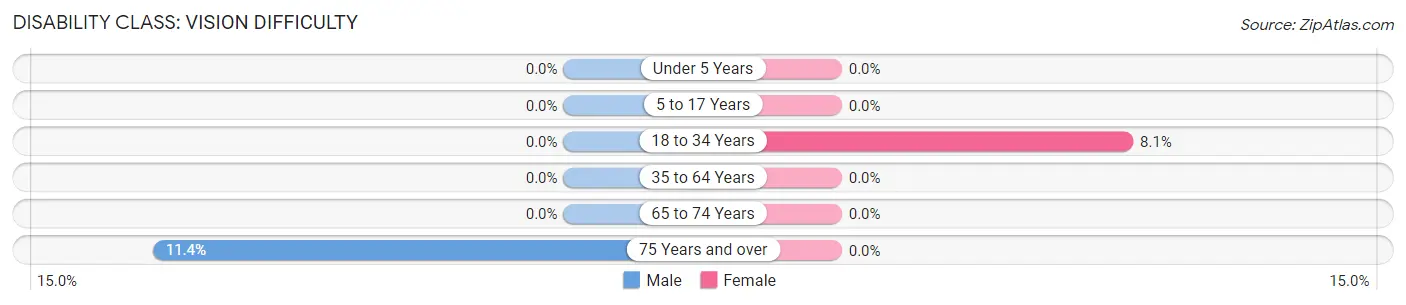
| Age Bracket | Male | Female |
| Under 5 Years | 0 (0.0%) | 0 (0.0%) |
| 5 to 17 Years | 0 (0.0%) | 0 (0.0%) |
| 18 to 34 Years | 0 (0.0%) | 6 (8.1%) |
| 35 to 64 Years | 0 (0.0%) | 0 (0.0%) |
| 65 to 74 Years | 0 (0.0%) | 0 (0.0%) |
| 75 Years and over | 4 (11.4%) | 0 (0.0%) |
Disability Class: Cognitive Difficulty
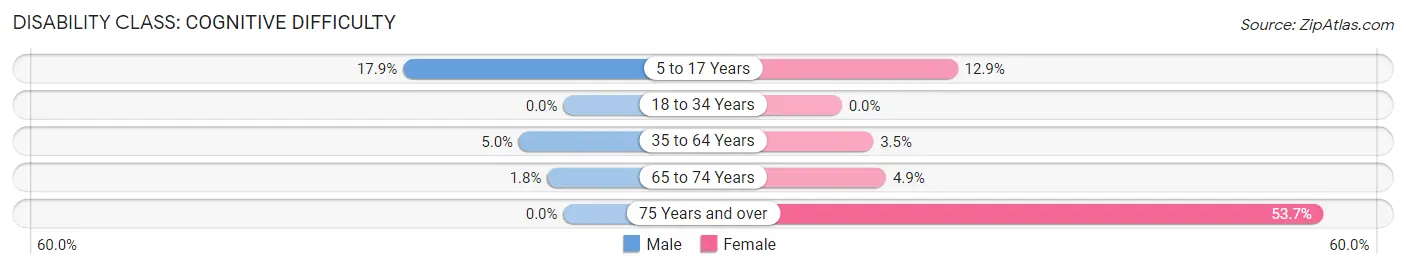
| Age Bracket | Male | Female |
| 5 to 17 Years | 10 (17.9%) | 12 (12.9%) |
| 18 to 34 Years | 0 (0.0%) | 0 (0.0%) |
| 35 to 64 Years | 9 (5.0%) | 7 (3.5%) |
| 65 to 74 Years | 1 (1.8%) | 3 (4.9%) |
| 75 Years and over | 0 (0.0%) | 22 (53.7%) |
Disability Class: Ambulatory Difficulty
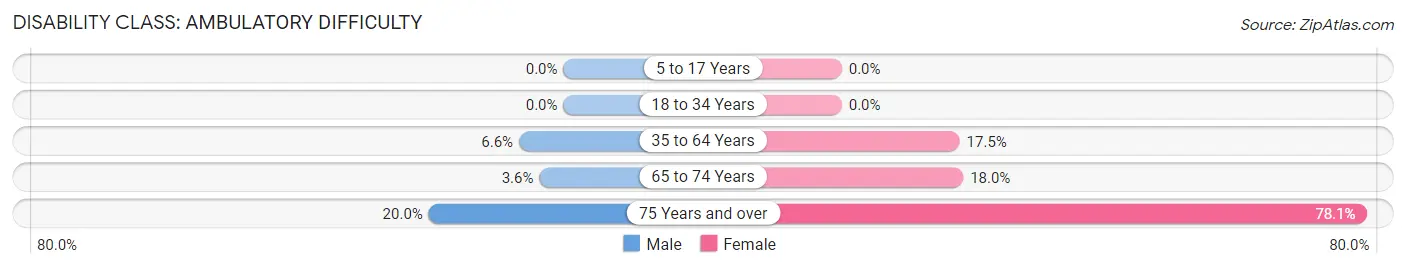
| Age Bracket | Male | Female |
| 5 to 17 Years | 0 (0.0%) | 0 (0.0%) |
| 18 to 34 Years | 0 (0.0%) | 0 (0.0%) |
| 35 to 64 Years | 12 (6.6%) | 35 (17.5%) |
| 65 to 74 Years | 2 (3.6%) | 11 (18.0%) |
| 75 Years and over | 7 (20.0%) | 32 (78.0%) |
Disability Class: Self-Care Difficulty
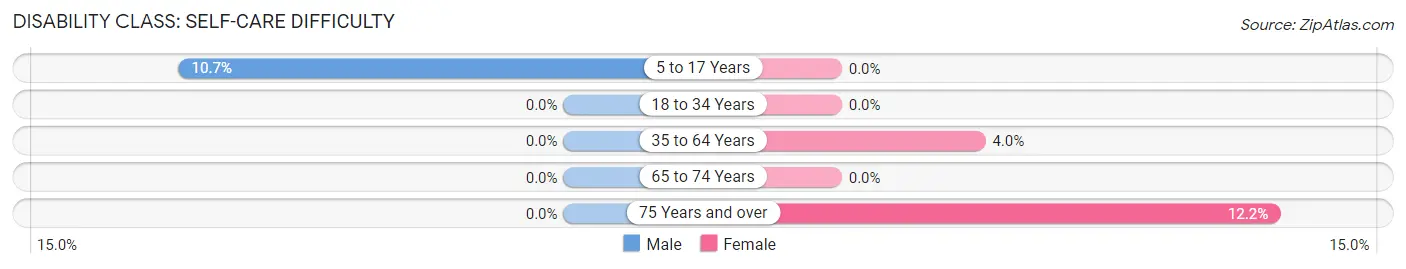
| Age Bracket | Male | Female |
| 5 to 17 Years | 6 (10.7%) | 0 (0.0%) |
| 18 to 34 Years | 0 (0.0%) | 0 (0.0%) |
| 35 to 64 Years | 0 (0.0%) | 8 (4.0%) |
| 65 to 74 Years | 0 (0.0%) | 0 (0.0%) |
| 75 Years and over | 0 (0.0%) | 5 (12.2%) |
Technology Access in Palo Alto borough
Computing Device Access in Palo Alto borough
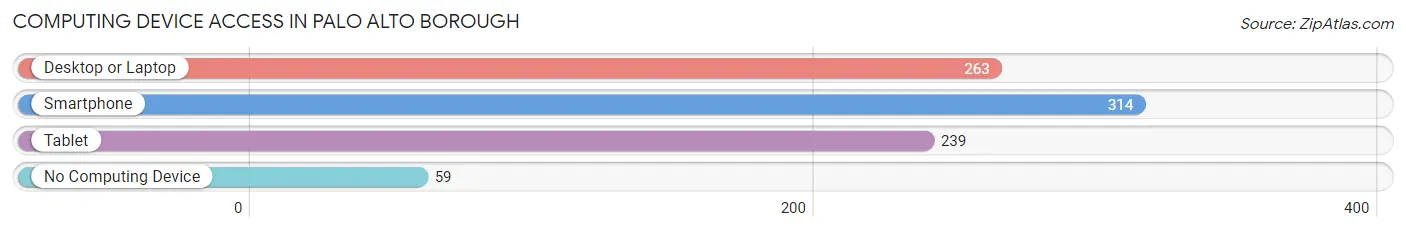
| Device Type | # Households | % Households |
| Desktop or Laptop | 263 | 64.6% |
| Smartphone | 314 | 77.1% |
| Tablet | 239 | 58.7% |
| No Computing Device | 59 | 14.5% |
| Total | 407 | 100.0% |
Internet Access in Palo Alto borough
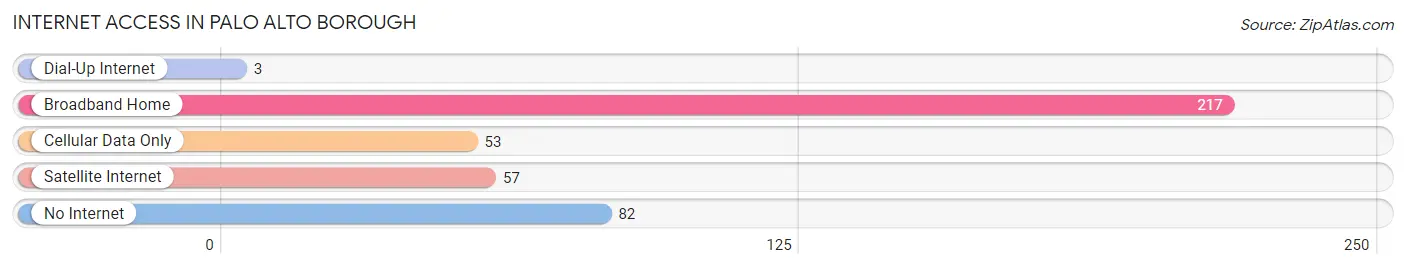
| Internet Type | # Households | % Households |
| Dial-Up Internet | 3 | 0.7% |
| Broadband Home | 217 | 53.3% |
| Cellular Data Only | 53 | 13.0% |
| Satellite Internet | 57 | 14.0% |
| No Internet | 82 | 20.2% |
| Total | 407 | 100.0% |
Palo Alto borough Summary
Palo Alto Borough is a small borough located in the state of Pennsylvania. It is situated in the northern part of the state, in the Lehigh Valley region. The borough is bordered by the cities of Allentown and Bethlehem, and is part of Northampton County. The population of Palo Alto Borough was 2,845 as of the 2010 census.
History
Palo Alto Borough was first settled in 1737 by a group of German immigrants. The area was originally known as “Palo Alto”, which is Spanish for “high tree”. The borough was officially incorporated in 1867.
The borough was originally a farming community, and the main crops grown were wheat, corn, and oats. In the late 19th century, the borough began to industrialize, and several factories were built in the area. The most notable of these was the Bethlehem Steel Corporation, which was founded in 1904 and was the largest steel producer in the United States at the time.
Geography
Palo Alto Borough is located in the northern part of Pennsylvania, in the Lehigh Valley region. The borough is bordered by the cities of Allentown and Bethlehem. The borough is situated on the Lehigh River, and is surrounded by rolling hills and farmland.
The borough has a total area of 1.2 square miles, all of which is land. The borough is located at an elevation of 441 feet above sea level.
Economy
The economy of Palo Alto Borough is largely based on manufacturing and services. The borough is home to several factories, including the Bethlehem Steel Corporation, which is the largest steel producer in the United States. Other industries in the borough include food processing, electronics, and plastics.
The borough also has a thriving retail sector, with several stores and restaurants located in the downtown area. The borough is also home to several small businesses, including auto repair shops, hair salons, and other services.
Demographics
As of the 2010 census, the population of Palo Alto Borough was 2,845. The racial makeup of the borough was 94.3% White, 2.2% African American, 0.3% Native American, 0.7% Asian, 0.1% Pacific Islander, and 2.4% from other races. Hispanic or Latino of any race were 4.2% of the population.
The median household income in the borough was $45,938, and the median family income was $54,938. The per capita income in the borough was $21,938. About 8.3% of the population was below the poverty line.
The borough is served by the East Penn School District, which includes three elementary schools, one middle school, and one high school. The borough is also home to several churches, including the First Presbyterian Church of Palo Alto, which was founded in 1867.
Common Questions
What is Per Capita Income in Palo Alto borough?
Per Capita income in Palo Alto borough is $26,990.
What is the Median Family Income in Palo Alto borough?
Median Family Income in Palo Alto borough is $54,861.
What is the Median Household income in Palo Alto borough?
Median Household Income in Palo Alto borough is $52,176.
What is Income or Wage Gap in Palo Alto borough?
Income or Wage Gap in Palo Alto borough is 34.5%.
Women in Palo Alto borough earn 65.5 cents for every dollar earned by a man.
What is Inequality or Gini Index in Palo Alto borough?
Inequality or Gini Index in Palo Alto borough is 0.35.
What is the Total Population of Palo Alto borough?
Total Population of Palo Alto borough is 953.
What is the Total Male Population of Palo Alto borough?
Total Male Population of Palo Alto borough is 468.
What is the Total Female Population of Palo Alto borough?
Total Female Population of Palo Alto borough is 485.
What is the Ratio of Males per 100 Females in Palo Alto borough?
There are 96.49 Males per 100 Females in Palo Alto borough.
What is the Ratio of Females per 100 Males in Palo Alto borough?
There are 103.63 Females per 100 Males in Palo Alto borough.
What is the Median Population Age in Palo Alto borough?
Median Population Age in Palo Alto borough is 42.0 Years.
What is the Average Family Size in Palo Alto borough
Average Family Size in Palo Alto borough is 2.8 People.
What is the Average Household Size in Palo Alto borough
Average Household Size in Palo Alto borough is 2.3 People.
How Large is the Labor Force in Palo Alto borough?
There are 490 People in the Labor Forcein in Palo Alto borough.
What is the Percentage of People in the Labor Force in Palo Alto borough?
66.4% of People are in the Labor Force in Palo Alto borough.
What is the Unemployment Rate in Palo Alto borough?
Unemployment Rate in Palo Alto borough is 4.1%.