Tuscarora, PA Map & Demographics
Tuscarora Map
Tuscarora Overview
$29,501
PER CAPITA INCOME
$66,625
AVG FAMILY INCOME
$55,357
AVG HOUSEHOLD INCOME
32.4%
WAGE / INCOME GAP [ % ]
67.6¢/ $1
WAGE / INCOME GAP [ $ ]
0.40
INEQUALITY / GINI INDEX
404
TOTAL POPULATION
200
MALE POPULATION
204
FEMALE POPULATION
98.04
MALES / 100 FEMALES
102.00
FEMALES / 100 MALES
61.5
MEDIAN AGE
2.5
AVG FAMILY SIZE
1.9
AVG HOUSEHOLD SIZE
171
LABOR FORCE [ PEOPLE ]
46.5%
PERCENT IN LABOR FORCE
Tuscarora Zip Codes
Tuscarora Area Codes
Income in Tuscarora
Income Overview in Tuscarora
Per Capita Income in Tuscarora is $29,501, while median incomes of families and households are $66,625 and $55,357 respectively.
| Characteristic | Number | Measure |
| Per Capita Income | 404 | $29,501 |
| Median Family Income | 117 | $66,625 |
| Mean Family Income | 117 | $62,672 |
| Median Household Income | 208 | $55,357 |
| Mean Household Income | 208 | $56,597 |
| Income Deficit | 117 | $0 |
| Wage / Income Gap (%) | 404 | 32.41% |
| Wage / Income Gap ($) | 404 | 67.59¢ per $1 |
| Gini / Inequality Index | 404 | 0.40 |
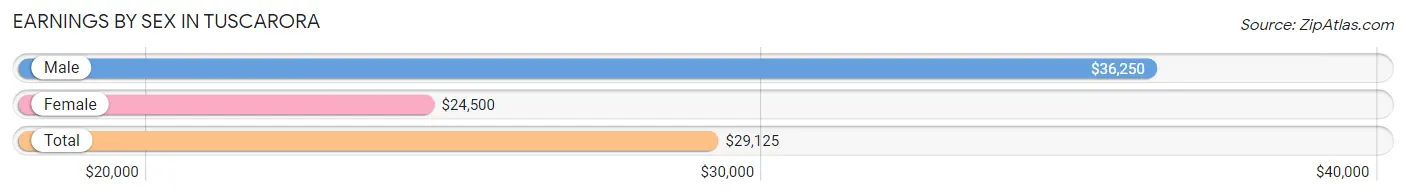
Earnings by Sex in Tuscarora
Average Earnings in Tuscarora are $29,125, $36,250 for men and $24,500 for women, a difference of 32.4%.
| Sex | Number | Average Earnings |
| Male | 95 (51.9%) | $36,250 |
| Female | 88 (48.1%) | $24,500 |
| Total | 183 (100.0%) | $29,125 |
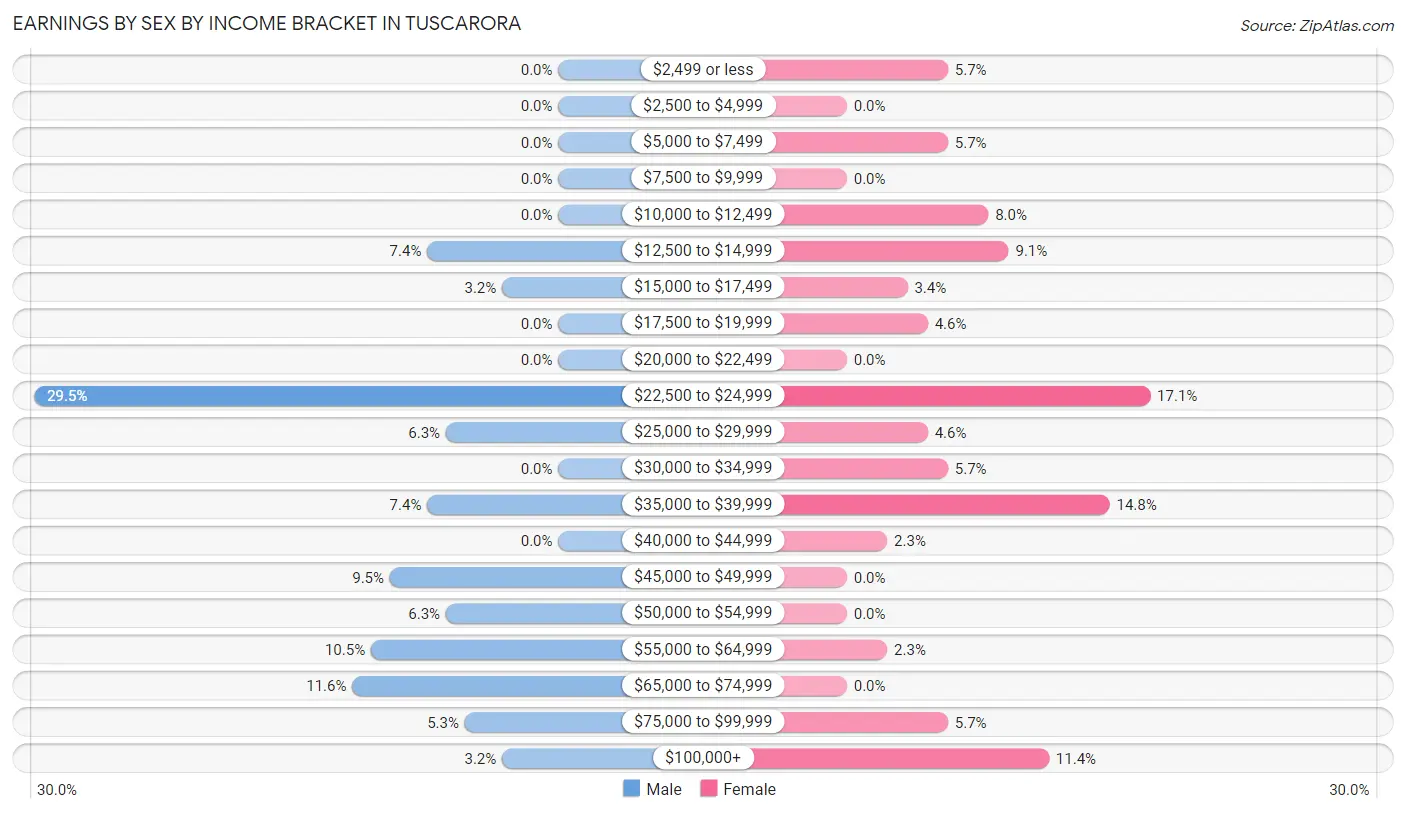
Earnings by Sex by Income Bracket in Tuscarora
The most common earnings brackets in Tuscarora are $22,500 to $24,999 for men (28 | 29.5%) and $22,500 to $24,999 for women (15 | 17.1%).
| Income | Male | Female |
| $2,499 or less | 0 (0.0%) | 5 (5.7%) |
| $2,500 to $4,999 | 0 (0.0%) | 0 (0.0%) |
| $5,000 to $7,499 | 0 (0.0%) | 5 (5.7%) |
| $7,500 to $9,999 | 0 (0.0%) | 0 (0.0%) |
| $10,000 to $12,499 | 0 (0.0%) | 7 (8.0%) |
| $12,500 to $14,999 | 7 (7.4%) | 8 (9.1%) |
| $15,000 to $17,499 | 3 (3.2%) | 3 (3.4%) |
| $17,500 to $19,999 | 0 (0.0%) | 4 (4.5%) |
| $20,000 to $22,499 | 0 (0.0%) | 0 (0.0%) |
| $22,500 to $24,999 | 28 (29.5%) | 15 (17.1%) |
| $25,000 to $29,999 | 6 (6.3%) | 4 (4.5%) |
| $30,000 to $34,999 | 0 (0.0%) | 5 (5.7%) |
| $35,000 to $39,999 | 7 (7.4%) | 13 (14.8%) |
| $40,000 to $44,999 | 0 (0.0%) | 2 (2.3%) |
| $45,000 to $49,999 | 9 (9.5%) | 0 (0.0%) |
| $50,000 to $54,999 | 6 (6.3%) | 0 (0.0%) |
| $55,000 to $64,999 | 10 (10.5%) | 2 (2.3%) |
| $65,000 to $74,999 | 11 (11.6%) | 0 (0.0%) |
| $75,000 to $99,999 | 5 (5.3%) | 5 (5.7%) |
| $100,000+ | 3 (3.2%) | 10 (11.4%) |
| Total | 95 (100.0%) | 88 (100.0%) |
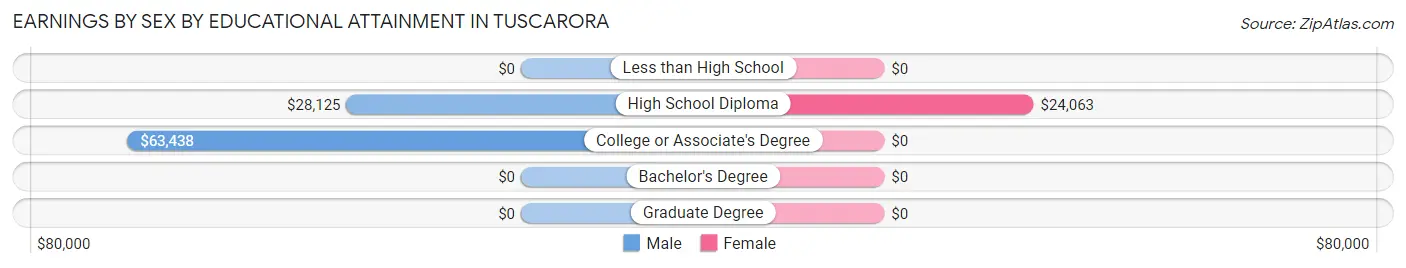
Earnings by Sex by Educational Attainment in Tuscarora
Average earnings in Tuscarora are $36,964 for men and $28,438 for women, a difference of 23.1%. Men with an educational attainment of college or associate's degree enjoy the highest average annual earnings of $63,438, while those with high school diploma education earn the least with $28,125. Women with an educational attainment of high school diploma earn the most with the average annual earnings of $24,063, while those with high school diploma education have the smallest earnings of $24,063.
| Educational Attainment | Male Income | Female Income |
| Less than High School | - | - |
| High School Diploma | $28,125 | $24,063 |
| College or Associate's Degree | $63,438 | $0 |
| Bachelor's Degree | - | - |
| Graduate Degree | - | - |
| Total | $36,964 | $28,438 |
Family Income in Tuscarora
Family Income Brackets in Tuscarora
According to the Tuscarora family income data, there are 50 families falling into the $50,000 to $74,999 income range, which is the most common income bracket and makes up 42.7% of all families.
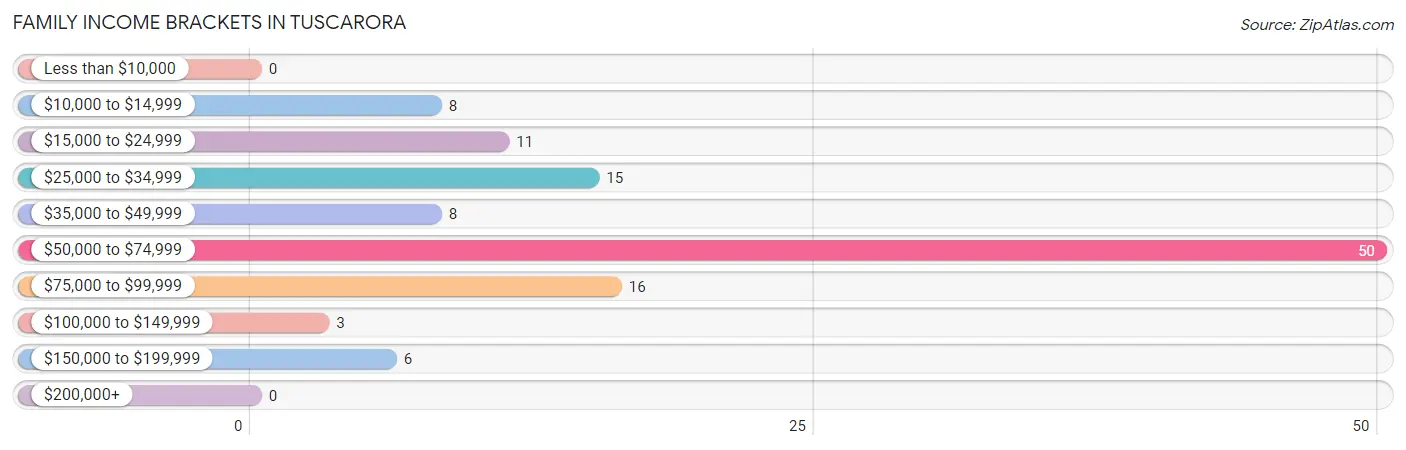
| Income Bracket | # Families | % Families |
| Less than $10,000 | 0 | 0.0% |
| $10,000 to $14,999 | 8 | 6.8% |
| $15,000 to $24,999 | 11 | 9.4% |
| $25,000 to $34,999 | 15 | 12.8% |
| $35,000 to $49,999 | 8 | 6.8% |
| $50,000 to $74,999 | 50 | 42.7% |
| $75,000 to $99,999 | 16 | 13.7% |
| $100,000 to $149,999 | 3 | 2.6% |
| $150,000 to $199,999 | 6 | 5.1% |
| $200,000+ | 0 | 0.0% |
Family Income by Famaliy Size in Tuscarora
3-person families (43 | 36.7%) account for the highest median family income in Tuscarora with $74,083 per family, while 2-person families (69 | 59.0%) have the highest median income of $28,304 per family member.
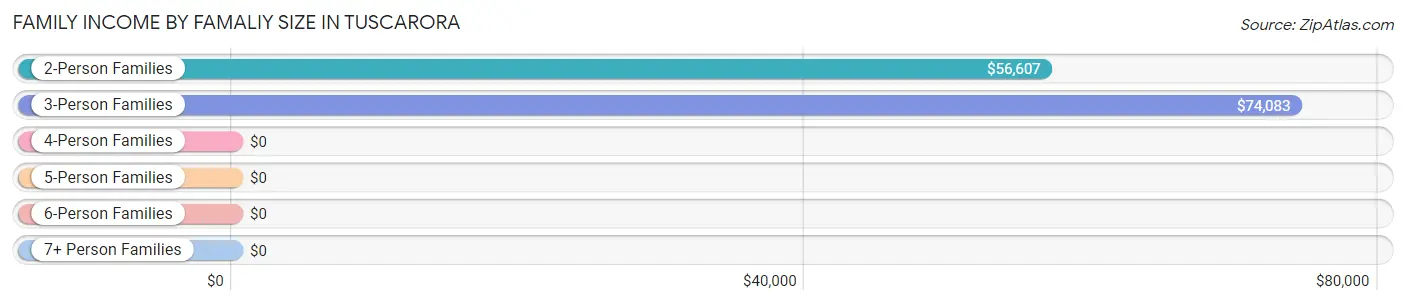
| Income Bracket | # Families | Median Income |
| 2-Person Families | 69 (59.0%) | $56,607 |
| 3-Person Families | 43 (36.7%) | $74,083 |
| 4-Person Families | 5 (4.3%) | $0 |
| 5-Person Families | 0 (0.0%) | $0 |
| 6-Person Families | 0 (0.0%) | $0 |
| 7+ Person Families | 0 (0.0%) | $0 |
| Total | 117 (100.0%) | $66,625 |
Family Income by Number of Earners in Tuscarora
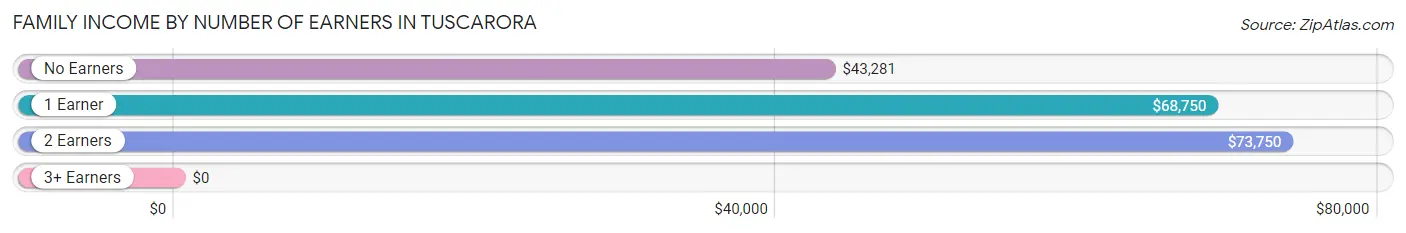
| Number of Earners | # Families | Median Income |
| No Earners | 41 (35.0%) | $43,281 |
| 1 Earner | 48 (41.0%) | $68,750 |
| 2 Earners | 25 (21.4%) | $73,750 |
| 3+ Earners | 3 (2.6%) | $0 |
| Total | 117 (100.0%) | $66,625 |
Household Income in Tuscarora
Household Income Brackets in Tuscarora
With 51 households falling in the category, the $50,000 to $74,999 income range is the most frequent in Tuscarora, accounting for 24.5% of all households.
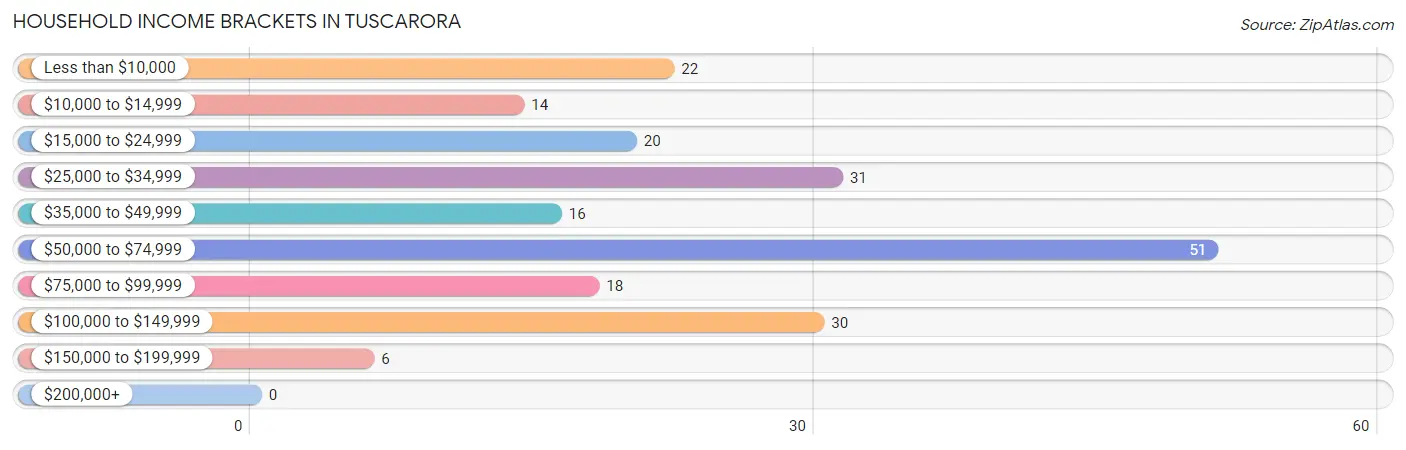
| Income Bracket | # Households | % Households |
| Less than $10,000 | 22 | 10.6% |
| $10,000 to $14,999 | 14 | 6.7% |
| $15,000 to $24,999 | 20 | 9.6% |
| $25,000 to $34,999 | 31 | 14.9% |
| $35,000 to $49,999 | 16 | 7.7% |
| $50,000 to $74,999 | 51 | 24.5% |
| $75,000 to $99,999 | 18 | 8.7% |
| $100,000 to $149,999 | 30 | 14.4% |
| $150,000 to $199,999 | 6 | 2.9% |
| $200,000+ | 0 | 0.0% |
Household Income by Householder Age in Tuscarora
The median household income in Tuscarora is $55,357, with the highest median household income of $108,304 found in the 45 to 64 years age bracket for the primary householder. A total of 51 households (24.5%) fall into this category.
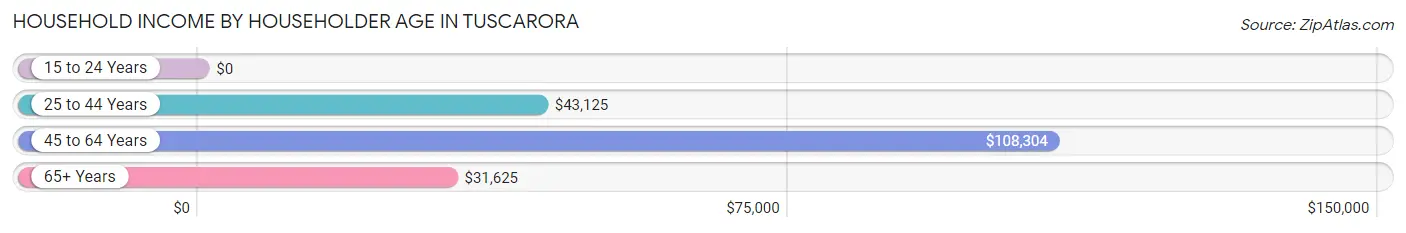
| Income Bracket | # Households | Median Income |
| 15 to 24 Years | 0 (0.0%) | $0 |
| 25 to 44 Years | 36 (17.3%) | $43,125 |
| 45 to 64 Years | 51 (24.5%) | $108,304 |
| 65+ Years | 121 (58.2%) | $31,625 |
| Total | 208 (100.0%) | $55,357 |
Poverty in Tuscarora
Income Below Poverty by Sex and Age in Tuscarora
With 11.5% poverty level for males and 13.7% for females among the residents of Tuscarora, 12 to 14 year old males and 35 to 44 year old females are the most vulnerable to poverty, with 7 males (58.3%) and 8 females (34.8%) in their respective age groups living below the poverty level.
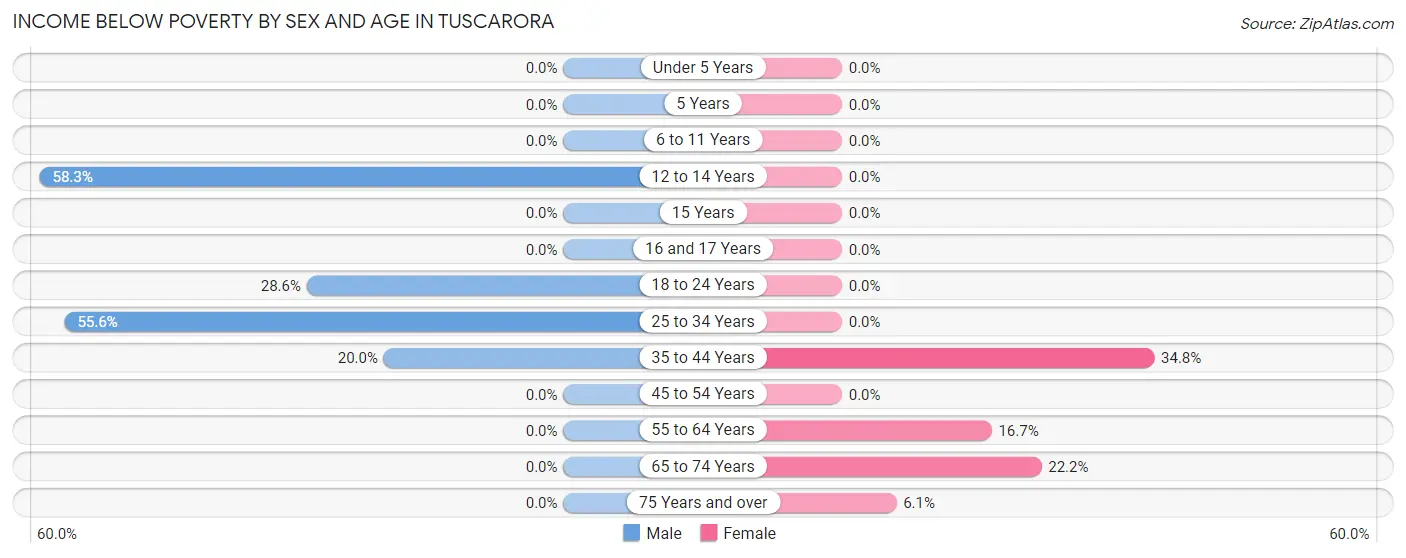
| Age Bracket | Male | Female |
| Under 5 Years | 0 (0.0%) | 0 (0.0%) |
| 5 Years | 0 (0.0%) | 0 (0.0%) |
| 6 to 11 Years | 0 (0.0%) | 0 (0.0%) |
| 12 to 14 Years | 7 (58.3%) | 0 (0.0%) |
| 15 Years | 0 (0.0%) | 0 (0.0%) |
| 16 and 17 Years | 0 (0.0%) | 0 (0.0%) |
| 18 to 24 Years | 4 (28.6%) | 0 (0.0%) |
| 25 to 34 Years | 5 (55.6%) | 0 (0.0%) |
| 35 to 44 Years | 7 (20.0%) | 8 (34.8%) |
| 45 to 54 Years | 0 (0.0%) | 0 (0.0%) |
| 55 to 64 Years | 0 (0.0%) | 4 (16.7%) |
| 65 to 74 Years | 0 (0.0%) | 12 (22.2%) |
| 75 Years and over | 0 (0.0%) | 4 (6.1%) |
| Total | 23 (11.5%) | 28 (13.7%) |
Income Above Poverty by Sex and Age in Tuscarora
According to the poverty statistics in Tuscarora, males aged under 5 years and females aged under 5 years are the age groups that are most secure financially, with 100.0% of males and 100.0% of females in these age groups living above the poverty line.
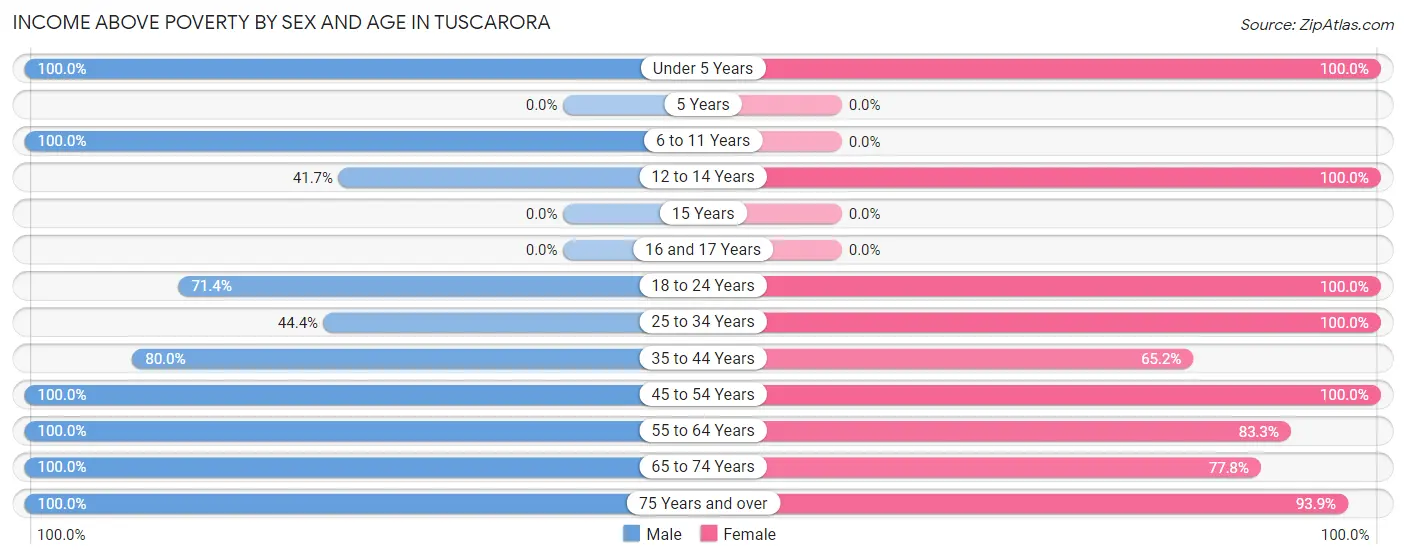
| Age Bracket | Male | Female |
| Under 5 Years | 4 (100.0%) | 4 (100.0%) |
| 5 Years | 0 (0.0%) | 0 (0.0%) |
| 6 to 11 Years | 12 (100.0%) | 0 (0.0%) |
| 12 to 14 Years | 5 (41.7%) | 4 (100.0%) |
| 15 Years | 0 (0.0%) | 0 (0.0%) |
| 16 and 17 Years | 0 (0.0%) | 0 (0.0%) |
| 18 to 24 Years | 10 (71.4%) | 9 (100.0%) |
| 25 to 34 Years | 4 (44.4%) | 8 (100.0%) |
| 35 to 44 Years | 28 (80.0%) | 15 (65.2%) |
| 45 to 54 Years | 23 (100.0%) | 12 (100.0%) |
| 55 to 64 Years | 38 (100.0%) | 20 (83.3%) |
| 65 to 74 Years | 18 (100.0%) | 42 (77.8%) |
| 75 Years and over | 35 (100.0%) | 62 (93.9%) |
| Total | 177 (88.5%) | 176 (86.3%) |
Income Below Poverty Among Married-Couple Families in Tuscarora
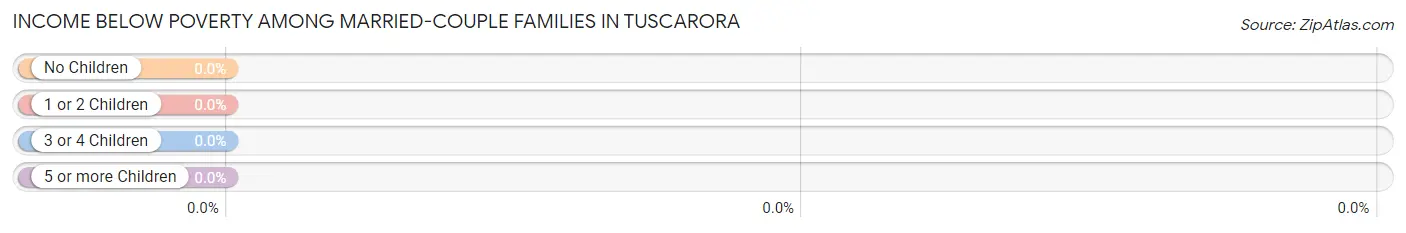
| Children | Above Poverty | Below Poverty |
| No Children | 72 (100.0%) | 0 (0.0%) |
| 1 or 2 Children | 8 (100.0%) | 0 (0.0%) |
| 3 or 4 Children | 0 (0.0%) | 0 (0.0%) |
| 5 or more Children | 0 (0.0%) | 0 (0.0%) |
| Total | 80 (100.0%) | 0 (0.0%) |
Income Below Poverty Among Single-Parent Households in Tuscarora
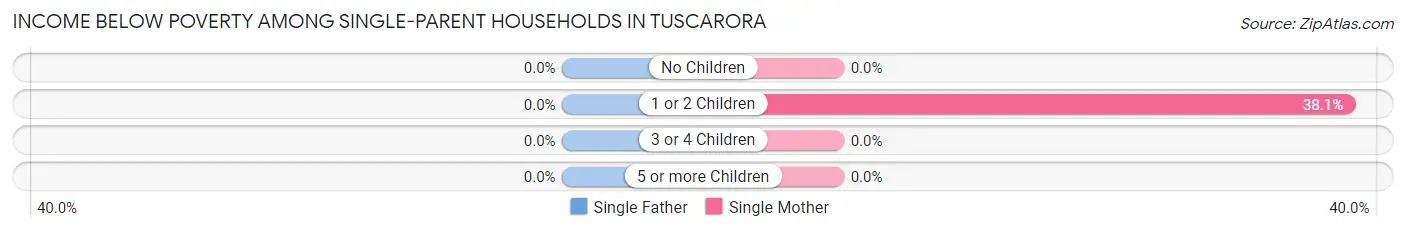
| Children | Single Father | Single Mother |
| No Children | 0 (0.0%) | 0 (0.0%) |
| 1 or 2 Children | 0 (0.0%) | 8 (38.1%) |
| 3 or 4 Children | 0 (0.0%) | 0 (0.0%) |
| 5 or more Children | 0 (0.0%) | 0 (0.0%) |
| Total | 0 (0.0%) | 8 (23.5%) |
Income Below Poverty Among Married-Couple vs Single-Parent Households in Tuscarora
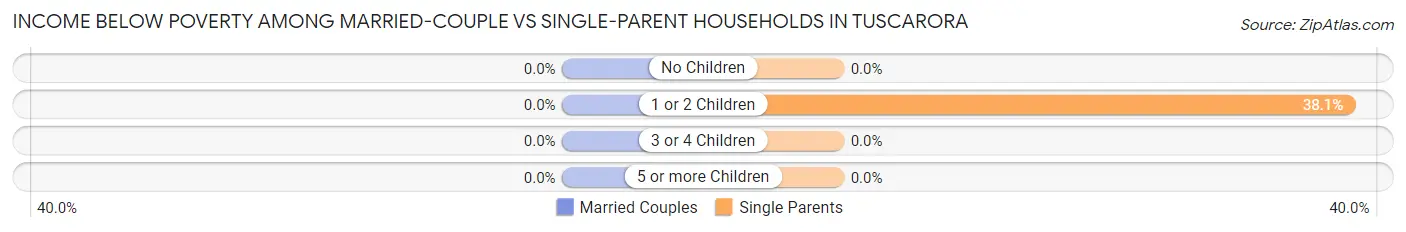
| Children | Married-Couple Families | Single-Parent Households |
| No Children | 0 (0.0%) | 0 (0.0%) |
| 1 or 2 Children | 0 (0.0%) | 8 (38.1%) |
| 3 or 4 Children | 0 (0.0%) | 0 (0.0%) |
| 5 or more Children | 0 (0.0%) | 0 (0.0%) |
| Total | 0 (0.0%) | 8 (21.6%) |
Race in Tuscarora
The most populous races in Tuscarora are White / Caucasian (400 | 99.0%), and Some other Race (4 | 1.0%).
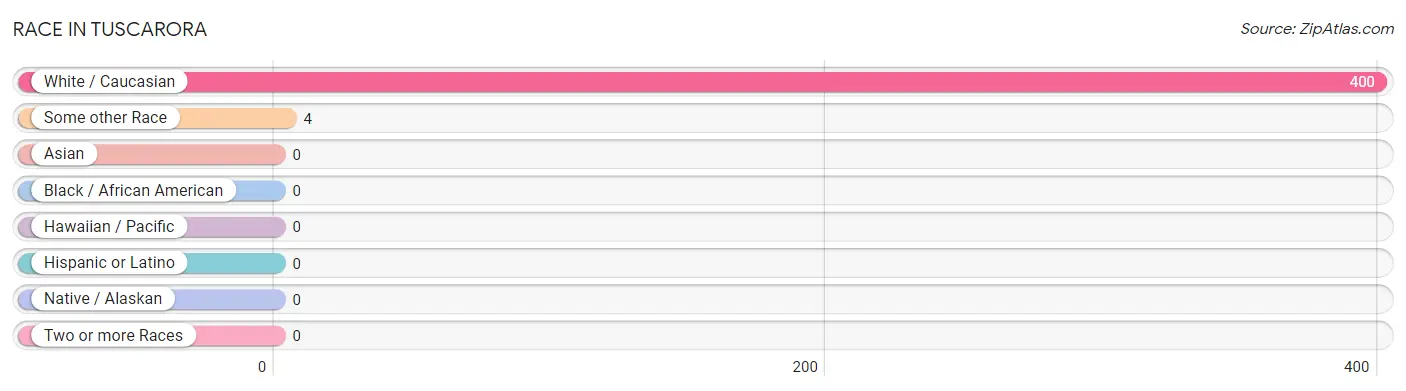
| Race | # Population | % Population |
| Asian | 0 | 0.0% |
| Black / African American | 0 | 0.0% |
| Hawaiian / Pacific | 0 | 0.0% |
| Hispanic or Latino | 0 | 0.0% |
| Native / Alaskan | 0 | 0.0% |
| White / Caucasian | 400 | 99.0% |
| Two or more Races | 0 | 0.0% |
| Some other Race | 4 | 1.0% |
| Total | 404 | 100.0% |
Ancestry in Tuscarora
The most populous ancestries reported in Tuscarora are German (166 | 41.1%), Irish (116 | 28.7%), Slovak (67 | 16.6%), Polish (30 | 7.4%), and Lithuanian (27 | 6.7%), together accounting for 100.5% of all Tuscarora residents.
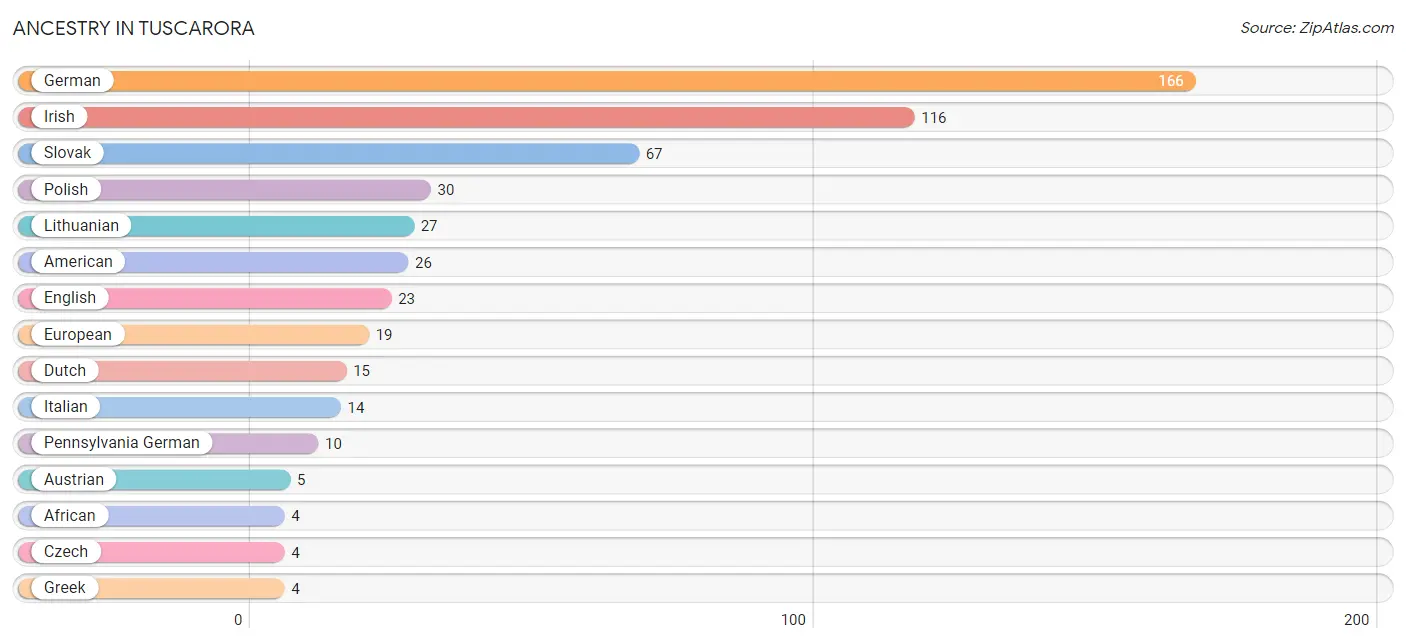
| Ancestry | # Population | % Population |
| African | 4 | 1.0% |
| American | 26 | 6.4% |
| Arab | 2 | 0.5% |
| Austrian | 5 | 1.2% |
| Czech | 4 | 1.0% |
| Czechoslovakian | 3 | 0.7% |
| Dutch | 15 | 3.7% |
| English | 23 | 5.7% |
| European | 19 | 4.7% |
| German | 166 | 41.1% |
| Greek | 4 | 1.0% |
| Irish | 116 | 28.7% |
| Italian | 14 | 3.5% |
| Lithuanian | 27 | 6.7% |
| Pennsylvania German | 10 | 2.5% |
| Polish | 30 | 7.4% |
| Slovak | 67 | 16.6% |
| Subsaharan African | 4 | 1.0% |
| Syrian | 2 | 0.5% |
| Welsh | 3 | 0.7% | View All 20 Rows |
Immigrants in Tuscarora
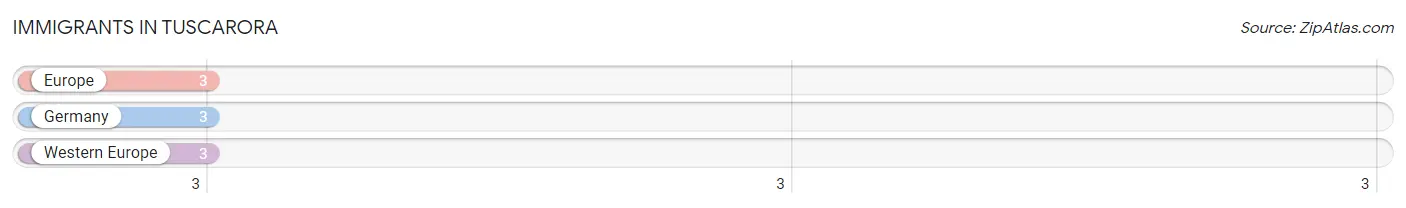
The most numerous immigrant groups reported in Tuscarora came from Europe (3 | 0.7%), Germany (3 | 0.7%), and Western Europe (3 | 0.7%), together accounting for 2.2% of all Tuscarora residents.
| Immigration Origin | # Population | % Population |
| Europe | 3 | 0.7% |
| Germany | 3 | 0.7% |
| Western Europe | 3 | 0.7% | View All 3 Rows |
Sex and Age in Tuscarora
Sex and Age in Tuscarora
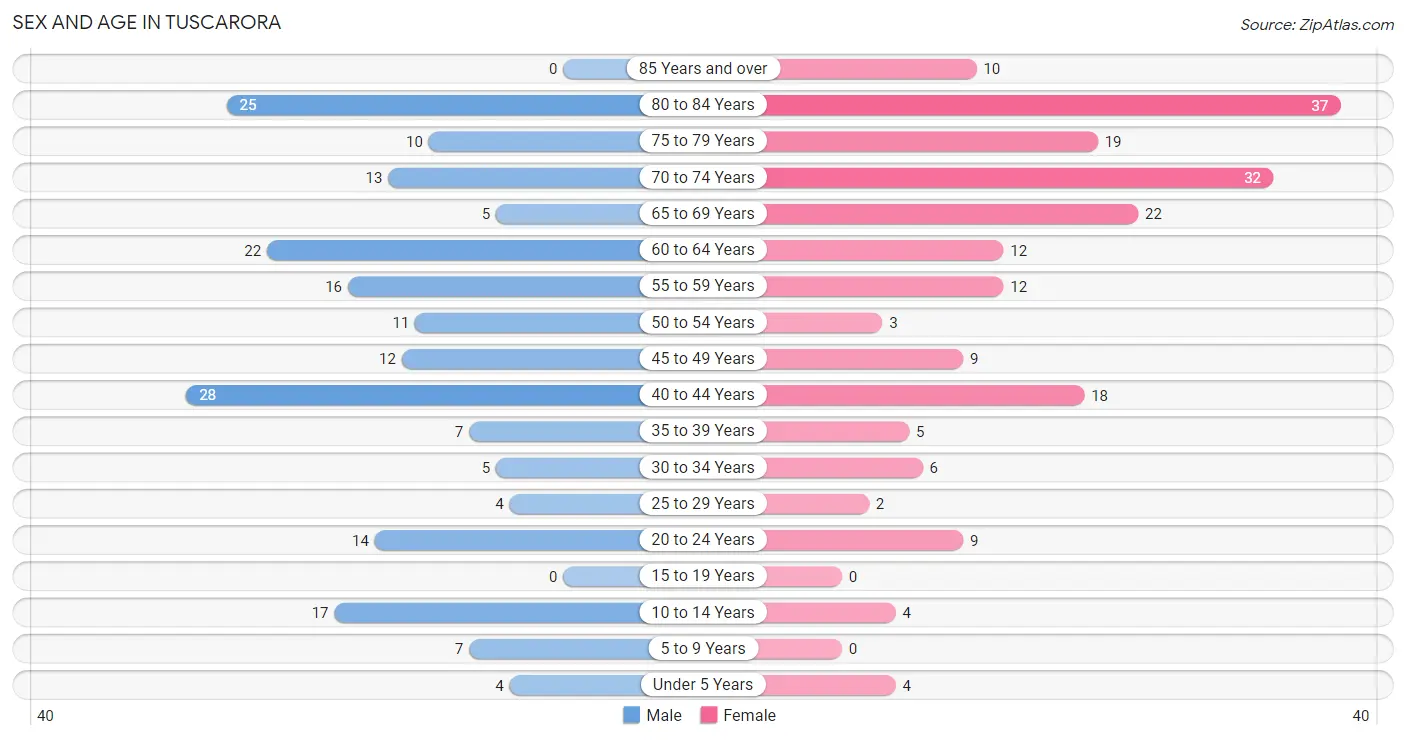
The most populous age groups in Tuscarora are 40 to 44 Years (28 | 14.0%) for men and 80 to 84 Years (37 | 18.1%) for women.
| Age Bracket | Male | Female |
| Under 5 Years | 4 (2.0%) | 4 (2.0%) |
| 5 to 9 Years | 7 (3.5%) | 0 (0.0%) |
| 10 to 14 Years | 17 (8.5%) | 4 (2.0%) |
| 15 to 19 Years | 0 (0.0%) | 0 (0.0%) |
| 20 to 24 Years | 14 (7.0%) | 9 (4.4%) |
| 25 to 29 Years | 4 (2.0%) | 2 (1.0%) |
| 30 to 34 Years | 5 (2.5%) | 6 (2.9%) |
| 35 to 39 Years | 7 (3.5%) | 5 (2.5%) |
| 40 to 44 Years | 28 (14.0%) | 18 (8.8%) |
| 45 to 49 Years | 12 (6.0%) | 9 (4.4%) |
| 50 to 54 Years | 11 (5.5%) | 3 (1.5%) |
| 55 to 59 Years | 16 (8.0%) | 12 (5.9%) |
| 60 to 64 Years | 22 (11.0%) | 12 (5.9%) |
| 65 to 69 Years | 5 (2.5%) | 22 (10.8%) |
| 70 to 74 Years | 13 (6.5%) | 32 (15.7%) |
| 75 to 79 Years | 10 (5.0%) | 19 (9.3%) |
| 80 to 84 Years | 25 (12.5%) | 37 (18.1%) |
| 85 Years and over | 0 (0.0%) | 10 (4.9%) |
| Total | 200 (100.0%) | 204 (100.0%) |
Families and Households in Tuscarora
Median Family Size in Tuscarora
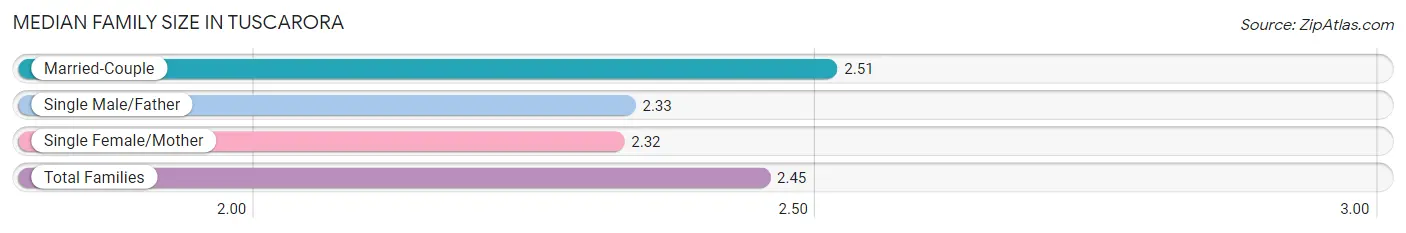
The median family size in Tuscarora is 2.45 persons per family, with married-couple families (80 | 68.4%) accounting for the largest median family size of 2.51 persons per family. On the other hand, single female/mother families (34 | 29.1%) represent the smallest median family size with 2.32 persons per family.
| Family Type | # Families | Family Size |
| Married-Couple | 80 (68.4%) | 2.51 |
| Single Male/Father | 3 (2.6%) | 2.33 |
| Single Female/Mother | 34 (29.1%) | 2.32 |
| Total Families | 117 (100.0%) | 2.45 |
Median Household Size in Tuscarora
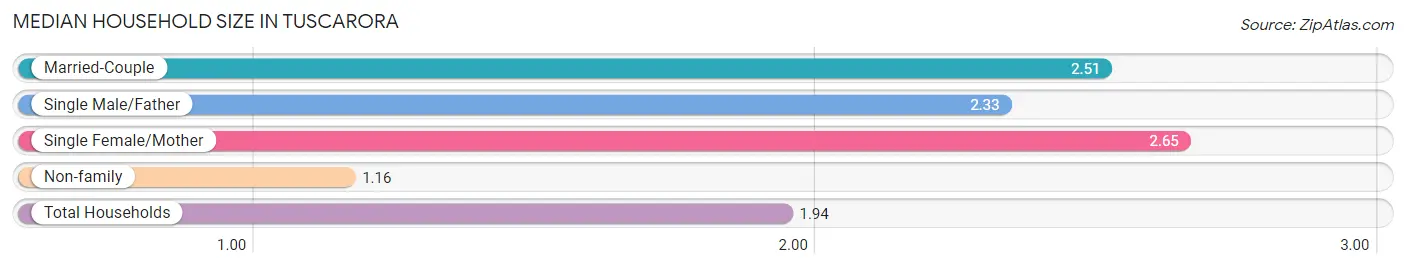
The median household size in Tuscarora is 1.94 persons per household, with single female/mother households (34 | 16.4%) accounting for the largest median household size of 2.65 persons per household. non-family households (91 | 43.8%) represent the smallest median household size with 1.16 persons per household.
| Household Type | # Households | Household Size |
| Married-Couple | 80 (38.5%) | 2.51 |
| Single Male/Father | 3 (1.4%) | 2.33 |
| Single Female/Mother | 34 (16.4%) | 2.65 |
| Non-family | 91 (43.8%) | 1.16 |
| Total Households | 208 (100.0%) | 1.94 |
Household Size by Marriage Status in Tuscarora
Out of a total of 208 households in Tuscarora, 117 (56.2%) are family households, while 91 (43.8%) are nonfamily households. The most numerous type of family households are 2-person households, comprising 66, and the most common type of nonfamily households are 1-person households, comprising 76.
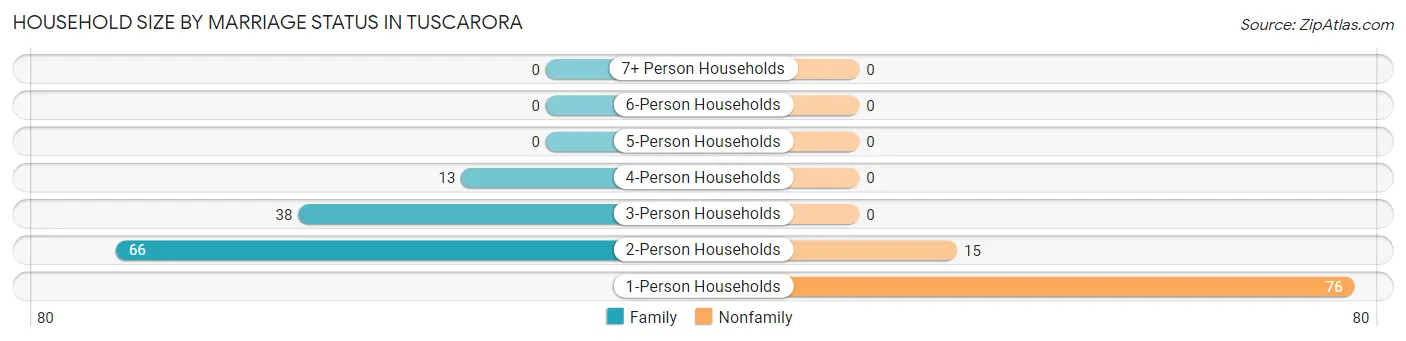
| Household Size | Family Households | Nonfamily Households |
| 1-Person Households | - | 76 (36.5%) |
| 2-Person Households | 66 (31.7%) | 15 (7.2%) |
| 3-Person Households | 38 (18.3%) | 0 (0.0%) |
| 4-Person Households | 13 (6.2%) | 0 (0.0%) |
| 5-Person Households | 0 (0.0%) | 0 (0.0%) |
| 6-Person Households | 0 (0.0%) | 0 (0.0%) |
| 7+ Person Households | 0 (0.0%) | 0 (0.0%) |
| Total | 117 (56.2%) | 91 (43.8%) |
Female Fertility in Tuscarora
Fertility by Age in Tuscarora
| Age Bracket | Women with Births | Births / 1,000 Women |
| 15 to 19 years | 0 (0.0%) | 0.0 |
| 20 to 34 years | 0 (0.0%) | 0.0 |
| 35 to 50 years | 0 (0.0%) | 0.0 |
| Total | 0 (0.0%) | 0.0 |
Fertility by Age by Marriage Status in Tuscarora
| Age Bracket | Married | Unmarried |
| 15 to 19 years | 0 (0.0%) | 0 (0.0%) |
| 20 to 34 years | 0 (0.0%) | 0 (0.0%) |
| 35 to 50 years | 0 (0.0%) | 0 (0.0%) |
| Total | 0 (0.0%) | 0 (0.0%) |
Fertility by Education in Tuscarora
| Educational Attainment | Women with Births | Births / 1,000 Women |
| Less than High School | 0 (0.0%) | 0.0 |
| High School Diploma | 0 (0.0%) | 0.0 |
| College or Associate's Degree | 0 (0.0%) | 0.0 |
| Bachelor's Degree | 0 (0.0%) | 0.0 |
| Graduate Degree | 0 (0.0%) | 0.0 |
| Total | 0 (0.0%) | 0.0 |
Fertility by Education by Marriage Status in Tuscarora
| Educational Attainment | Married | Unmarried |
| Less than High School | 0 (0.0%) | 0 (0.0%) |
| High School Diploma | 0 (0.0%) | 0 (0.0%) |
| College or Associate's Degree | 0 (0.0%) | 0 (0.0%) |
| Bachelor's Degree | 0 (0.0%) | 0 (0.0%) |
| Graduate Degree | 0 (0.0%) | 0 (0.0%) |
| Total | 0 (0.0%) | 0 (0.0%) |
Employment Characteristics in Tuscarora
Employment by Class of Employer in Tuscarora
Among the 171 employed individuals in Tuscarora, private company employees (126 | 73.7%), not-for-profit organizations (25 | 14.6%), and local government employees (7 | 4.1%) make up the most common classes of employment.
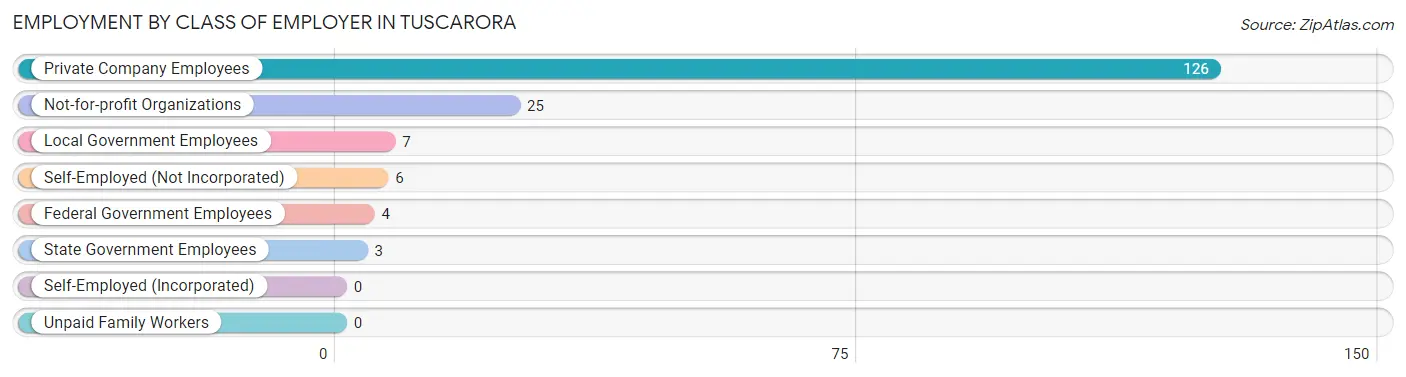
| Employer Class | # Employees | % Employees |
| Private Company Employees | 126 | 73.7% |
| Self-Employed (Incorporated) | 0 | 0.0% |
| Self-Employed (Not Incorporated) | 6 | 3.5% |
| Not-for-profit Organizations | 25 | 14.6% |
| Local Government Employees | 7 | 4.1% |
| State Government Employees | 3 | 1.8% |
| Federal Government Employees | 4 | 2.3% |
| Unpaid Family Workers | 0 | 0.0% |
| Total | 171 | 100.0% |
Employment Status by Age in Tuscarora
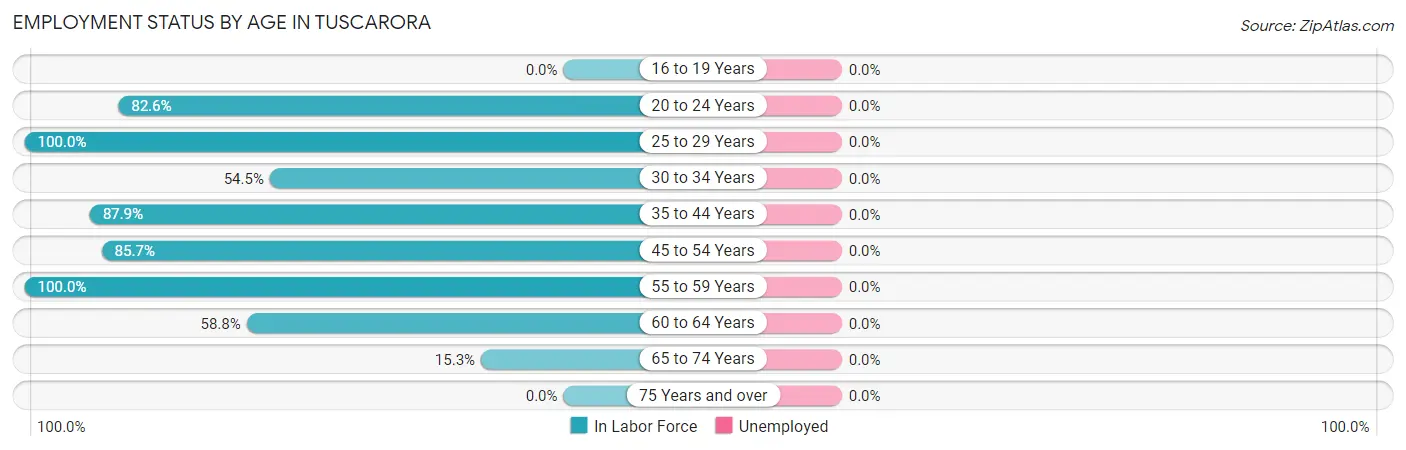
| Age Bracket | In Labor Force | Unemployed |
| 16 to 19 Years | 0 (0.0%) | 0 (0.0%) |
| 20 to 24 Years | 19 (82.6%) | 0 (0.0%) |
| 25 to 29 Years | 6 (100.0%) | 0 (0.0%) |
| 30 to 34 Years | 6 (54.5%) | 0 (0.0%) |
| 35 to 44 Years | 51 (87.9%) | 0 (0.0%) |
| 45 to 54 Years | 30 (85.7%) | 0 (0.0%) |
| 55 to 59 Years | 28 (100.0%) | 0 (0.0%) |
| 60 to 64 Years | 20 (58.8%) | 0 (0.0%) |
| 65 to 74 Years | 11 (15.3%) | 0 (0.0%) |
| 75 Years and over | 0 (0.0%) | 0 (0.0%) |
| Total | 171 (46.5%) | 0 (0.0%) |
Employment Status by Educational Attainment in Tuscarora
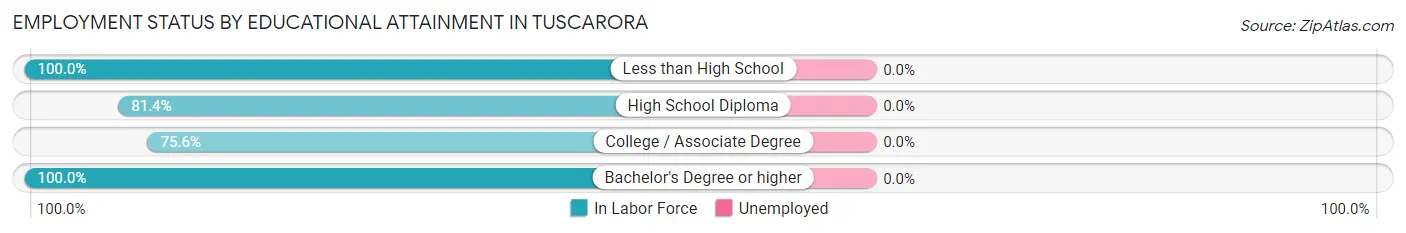
| Educational Attainment | In Labor Force | Unemployed |
| Less than High School | 3 (100.0%) | 0 (0.0%) |
| High School Diploma | 92 (81.4%) | 0 (0.0%) |
| College / Associate Degree | 31 (75.6%) | 0 (0.0%) |
| Bachelor's Degree or higher | 15 (100.0%) | 0 (0.0%) |
| Total | 141 (82.0%) | 0 (0.0%) |
Employment Occupations by Sex in Tuscarora
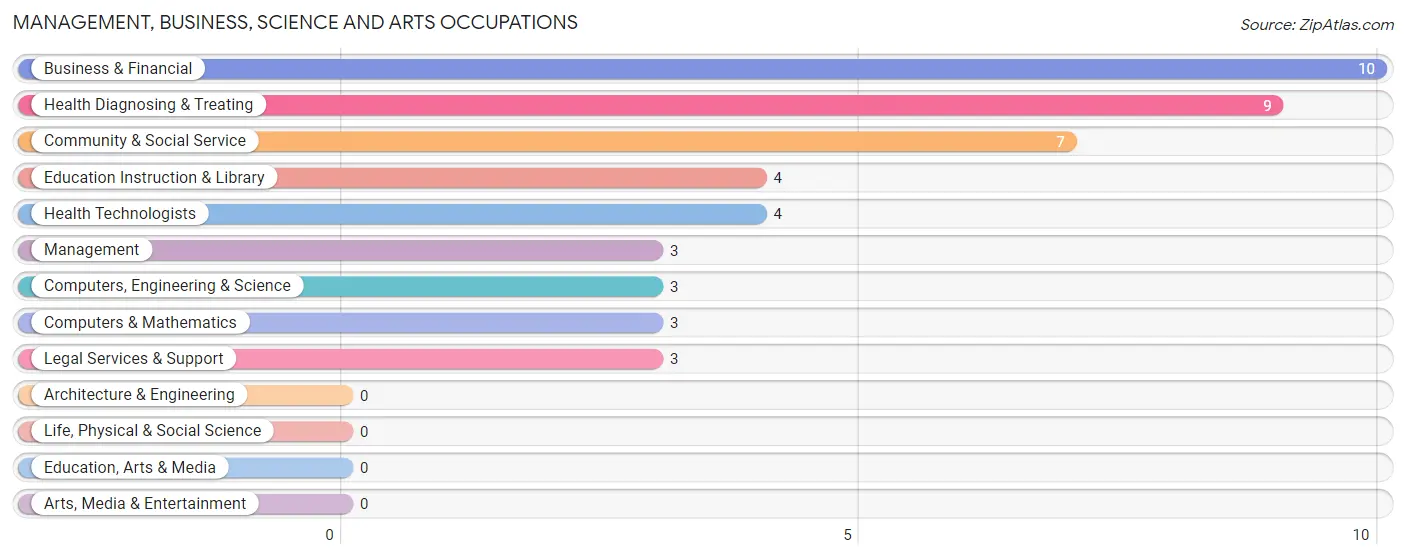
Management, Business, Science and Arts Occupations
The most common Management, Business, Science and Arts occupations in Tuscarora are Business & Financial (10 | 5.9%), Health Diagnosing & Treating (9 | 5.3%), Community & Social Service (7 | 4.1%), Education Instruction & Library (4 | 2.3%), and Health Technologists (4 | 2.3%).
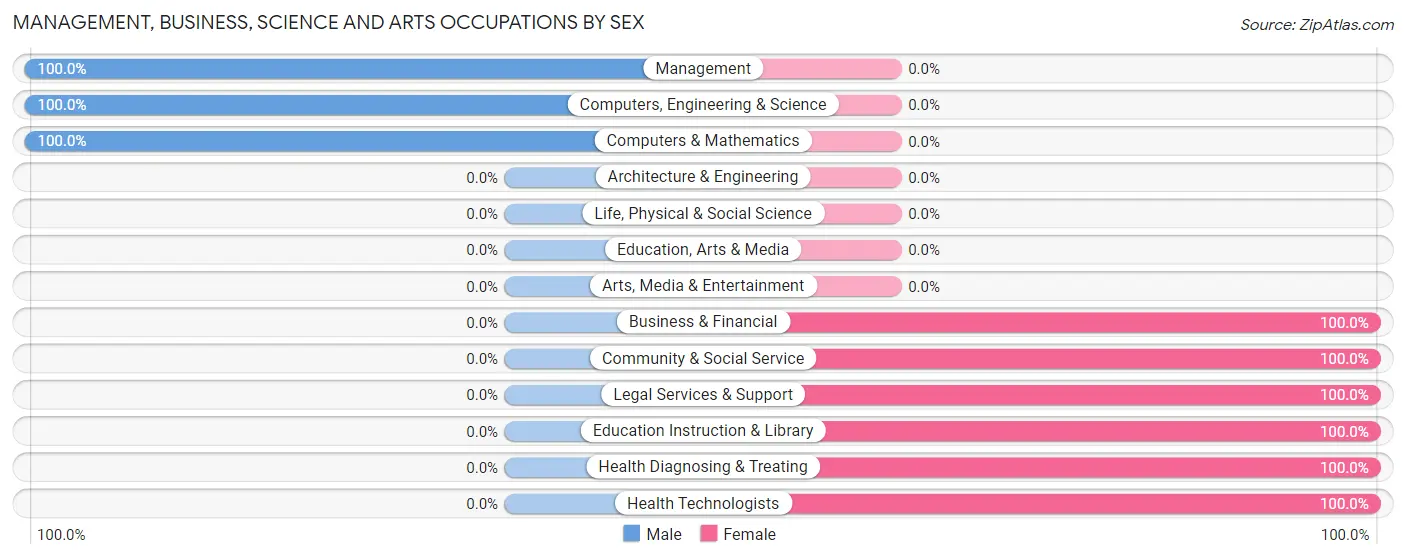
Management, Business, Science and Arts Occupations by Sex
Within the Management, Business, Science and Arts occupations in Tuscarora, the most male-oriented occupations are Management (100.0%), Computers, Engineering & Science (100.0%), and Computers & Mathematics (100.0%), while the most female-oriented occupations are Business & Financial (100.0%), Community & Social Service (100.0%), and Legal Services & Support (100.0%).
| Occupation | Male | Female |
| Management | 3 (100.0%) | 0 (0.0%) |
| Business & Financial | 0 (0.0%) | 10 (100.0%) |
| Computers, Engineering & Science | 3 (100.0%) | 0 (0.0%) |
| Computers & Mathematics | 3 (100.0%) | 0 (0.0%) |
| Architecture & Engineering | 0 (0.0%) | 0 (0.0%) |
| Life, Physical & Social Science | 0 (0.0%) | 0 (0.0%) |
| Community & Social Service | 0 (0.0%) | 7 (100.0%) |
| Education, Arts & Media | 0 (0.0%) | 0 (0.0%) |
| Legal Services & Support | 0 (0.0%) | 3 (100.0%) |
| Education Instruction & Library | 0 (0.0%) | 4 (100.0%) |
| Arts, Media & Entertainment | 0 (0.0%) | 0 (0.0%) |
| Health Diagnosing & Treating | 0 (0.0%) | 9 (100.0%) |
| Health Technologists | 0 (0.0%) | 4 (100.0%) |
| Total (Category) | 6 (18.8%) | 26 (81.2%) |
| Total (Overall) | 95 (55.6%) | 76 (44.4%) |
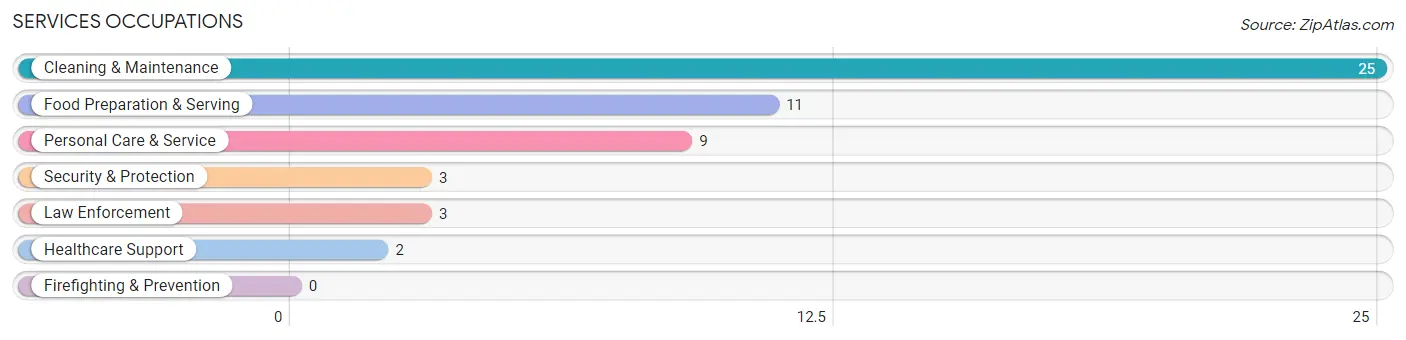
Services Occupations
The most common Services occupations in Tuscarora are Cleaning & Maintenance (25 | 14.6%), Food Preparation & Serving (11 | 6.4%), Personal Care & Service (9 | 5.3%), Security & Protection (3 | 1.8%), and Law Enforcement (3 | 1.8%).
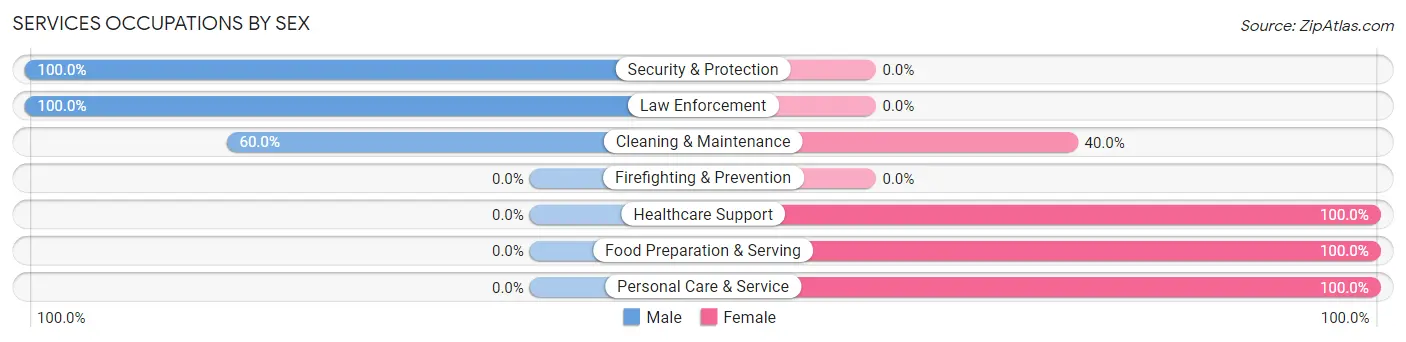
Services Occupations by Sex
Within the Services occupations in Tuscarora, the most male-oriented occupations are Security & Protection (100.0%), Law Enforcement (100.0%), and Cleaning & Maintenance (60.0%), while the most female-oriented occupations are Healthcare Support (100.0%), Food Preparation & Serving (100.0%), and Personal Care & Service (100.0%).
| Occupation | Male | Female |
| Healthcare Support | 0 (0.0%) | 2 (100.0%) |
| Security & Protection | 3 (100.0%) | 0 (0.0%) |
| Firefighting & Prevention | 0 (0.0%) | 0 (0.0%) |
| Law Enforcement | 3 (100.0%) | 0 (0.0%) |
| Food Preparation & Serving | 0 (0.0%) | 11 (100.0%) |
| Cleaning & Maintenance | 15 (60.0%) | 10 (40.0%) |
| Personal Care & Service | 0 (0.0%) | 9 (100.0%) |
| Total (Category) | 18 (36.0%) | 32 (64.0%) |
| Total (Overall) | 95 (55.6%) | 76 (44.4%) |
Sales and Office Occupations
The most common Sales and Office occupations in Tuscarora are Office & Administration (6 | 3.5%), and Sales & Related (4 | 2.3%).

Sales and Office Occupations by Sex

| Occupation | Male | Female |
| Sales & Related | 0 (0.0%) | 4 (100.0%) |
| Office & Administration | 0 (0.0%) | 6 (100.0%) |
| Total (Category) | 0 (0.0%) | 10 (100.0%) |
| Total (Overall) | 95 (55.6%) | 76 (44.4%) |
Natural Resources, Construction and Maintenance Occupations
The most common Natural Resources, Construction and Maintenance occupations in Tuscarora are Installation, Maintenance & Repair (18 | 10.5%), and Construction & Extraction (6 | 3.5%).
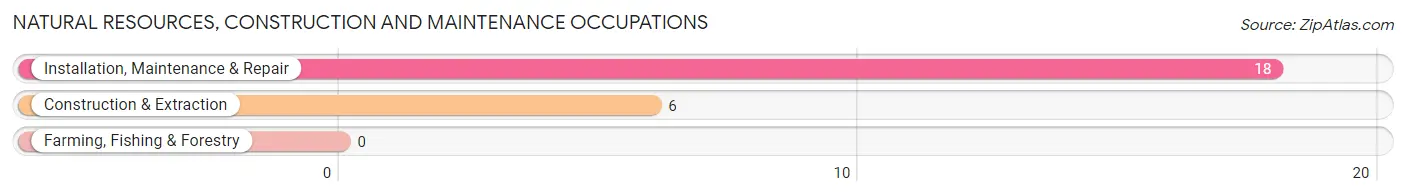
Natural Resources, Construction and Maintenance Occupations by Sex

| Occupation | Male | Female |
| Farming, Fishing & Forestry | 0 (0.0%) | 0 (0.0%) |
| Construction & Extraction | 6 (100.0%) | 0 (0.0%) |
| Installation, Maintenance & Repair | 18 (100.0%) | 0 (0.0%) |
| Total (Category) | 24 (100.0%) | 0 (0.0%) |
| Total (Overall) | 95 (55.6%) | 76 (44.4%) |
Production, Transportation and Moving Occupations
The most common Production, Transportation and Moving occupations in Tuscarora are Production (31 | 18.1%), Material Moving (18 | 10.5%), and Transportation (6 | 3.5%).
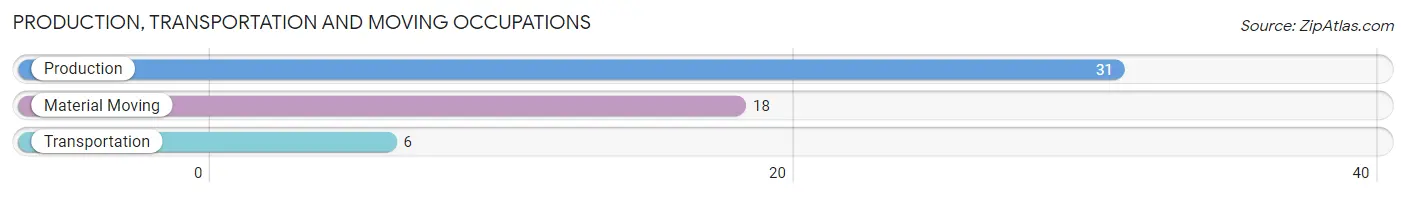
Production, Transportation and Moving Occupations by Sex
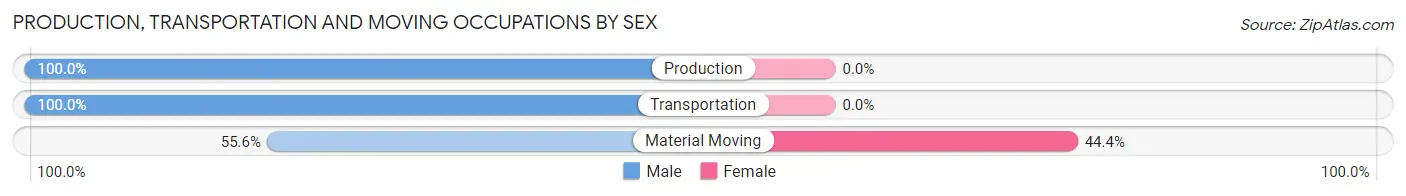
| Occupation | Male | Female |
| Production | 31 (100.0%) | 0 (0.0%) |
| Transportation | 6 (100.0%) | 0 (0.0%) |
| Material Moving | 10 (55.6%) | 8 (44.4%) |
| Total (Category) | 47 (85.5%) | 8 (14.5%) |
| Total (Overall) | 95 (55.6%) | 76 (44.4%) |
Employment Industries by Sex in Tuscarora
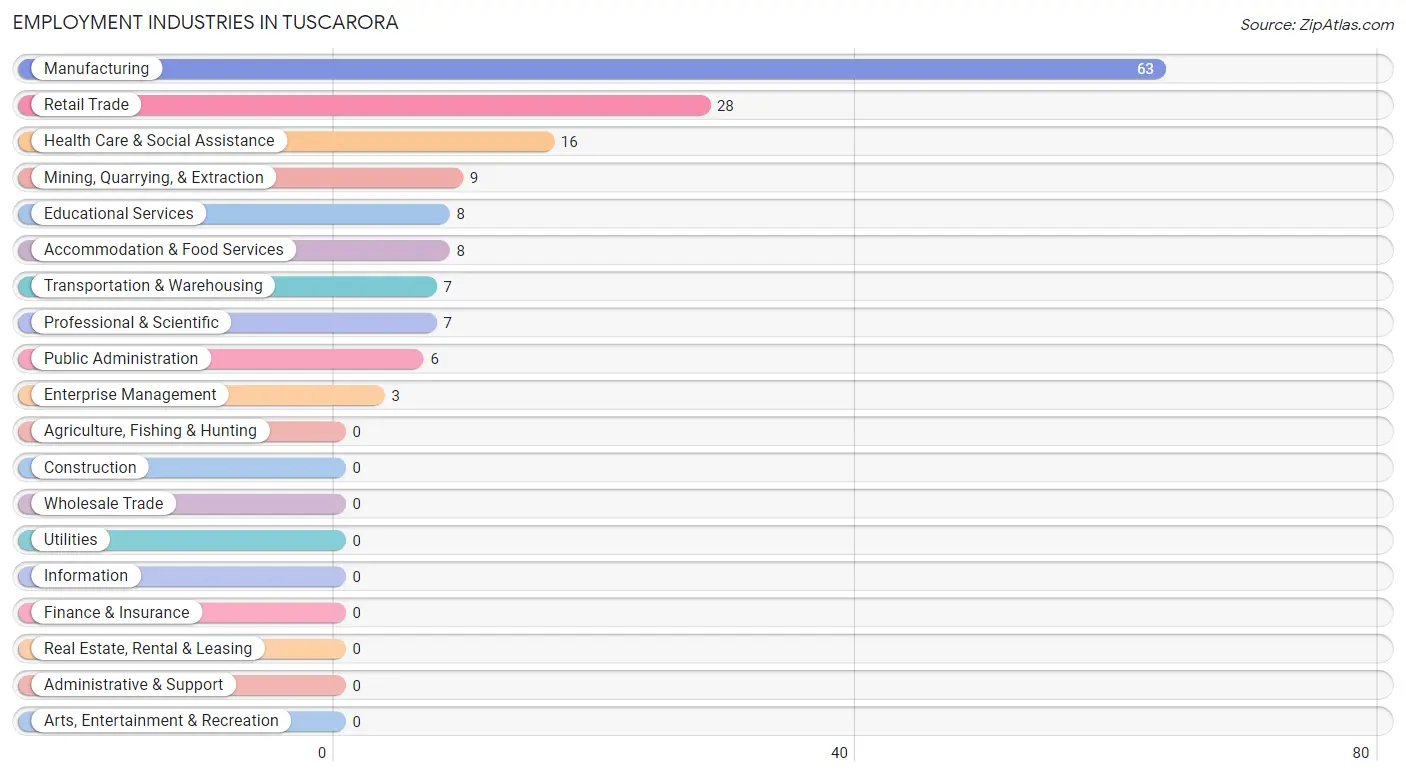
Employment Industries in Tuscarora
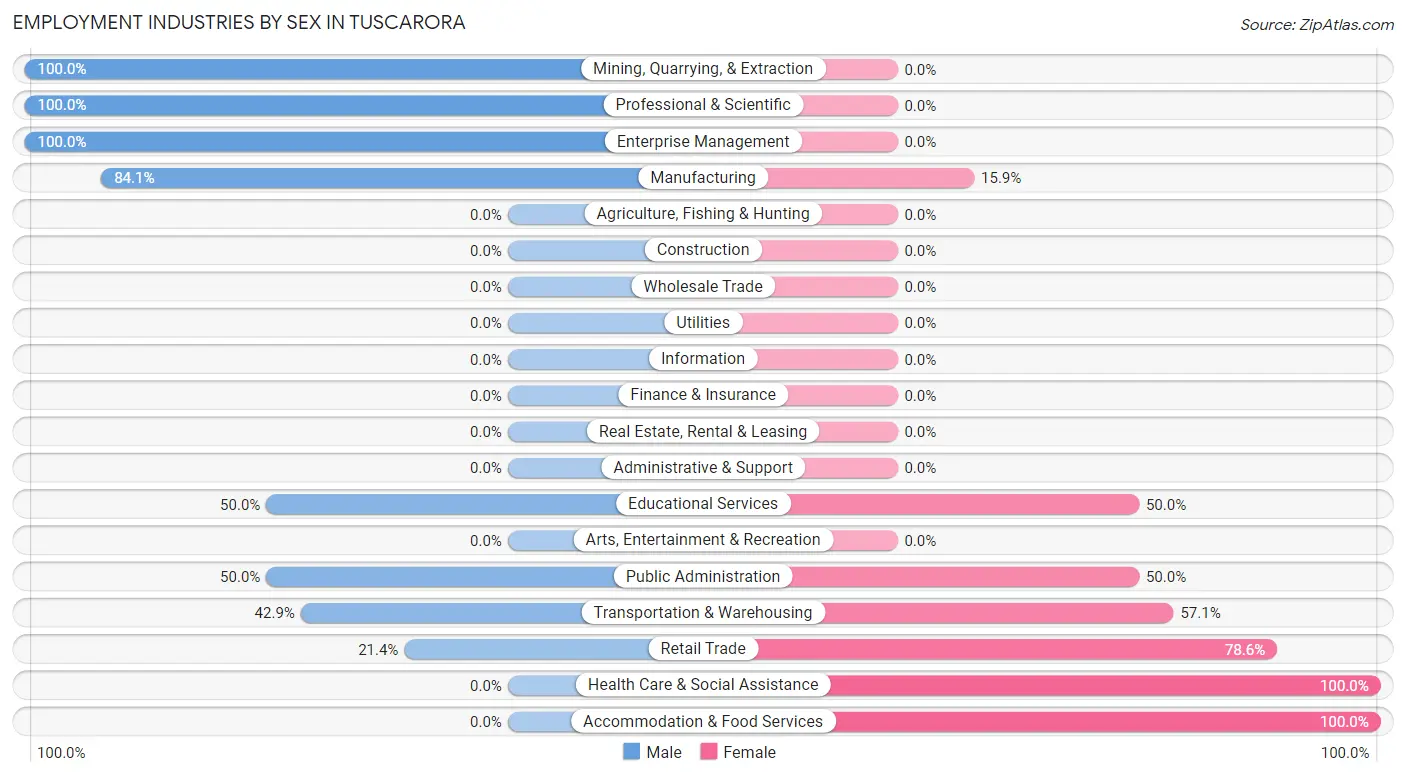
The major employment industries in Tuscarora include Manufacturing (63 | 36.8%), Retail Trade (28 | 16.4%), Health Care & Social Assistance (16 | 9.4%), Mining, Quarrying, & Extraction (9 | 5.3%), and Educational Services (8 | 4.7%).
Employment Industries by Sex in Tuscarora
The Tuscarora industries that see more men than women are Mining, Quarrying, & Extraction (100.0%), Professional & Scientific (100.0%), and Enterprise Management (100.0%), whereas the industries that tend to have a higher number of women are Health Care & Social Assistance (100.0%), Accommodation & Food Services (100.0%), and Retail Trade (78.6%).
| Industry | Male | Female |
| Agriculture, Fishing & Hunting | 0 (0.0%) | 0 (0.0%) |
| Mining, Quarrying, & Extraction | 9 (100.0%) | 0 (0.0%) |
| Construction | 0 (0.0%) | 0 (0.0%) |
| Manufacturing | 53 (84.1%) | 10 (15.9%) |
| Wholesale Trade | 0 (0.0%) | 0 (0.0%) |
| Retail Trade | 6 (21.4%) | 22 (78.6%) |
| Transportation & Warehousing | 3 (42.9%) | 4 (57.1%) |
| Utilities | 0 (0.0%) | 0 (0.0%) |
| Information | 0 (0.0%) | 0 (0.0%) |
| Finance & Insurance | 0 (0.0%) | 0 (0.0%) |
| Real Estate, Rental & Leasing | 0 (0.0%) | 0 (0.0%) |
| Professional & Scientific | 7 (100.0%) | 0 (0.0%) |
| Enterprise Management | 3 (100.0%) | 0 (0.0%) |
| Administrative & Support | 0 (0.0%) | 0 (0.0%) |
| Educational Services | 4 (50.0%) | 4 (50.0%) |
| Health Care & Social Assistance | 0 (0.0%) | 16 (100.0%) |
| Arts, Entertainment & Recreation | 0 (0.0%) | 0 (0.0%) |
| Accommodation & Food Services | 0 (0.0%) | 8 (100.0%) |
| Public Administration | 3 (50.0%) | 3 (50.0%) |
| Total | 95 (55.6%) | 76 (44.4%) |
Education in Tuscarora
School Enrollment in Tuscarora
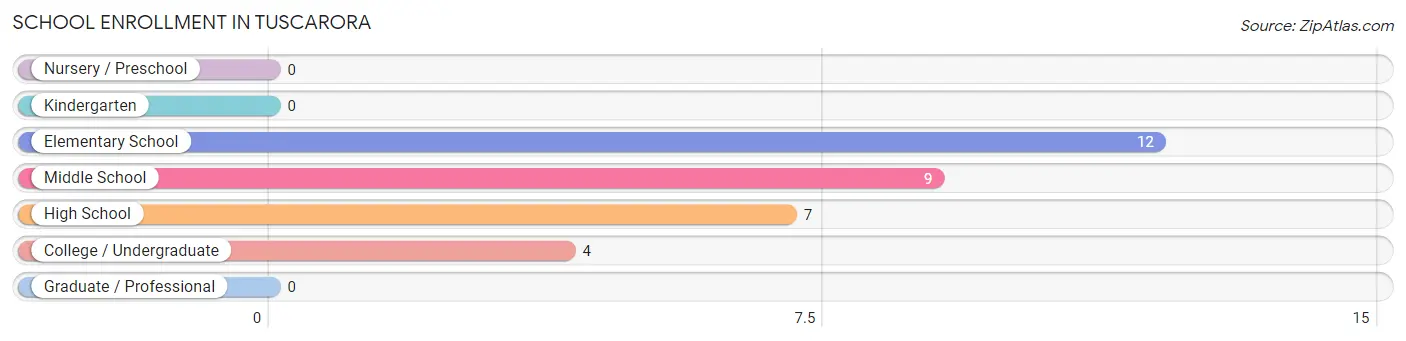
The most common levels of schooling among the 32 students in Tuscarora are elementary school (12 | 37.5%), middle school (9 | 28.1%), and high school (7 | 21.9%).
| School Level | # Students | % Students |
| Nursery / Preschool | 0 | 0.0% |
| Kindergarten | 0 | 0.0% |
| Elementary School | 12 | 37.5% |
| Middle School | 9 | 28.1% |
| High School | 7 | 21.9% |
| College / Undergraduate | 4 | 12.5% |
| Graduate / Professional | 0 | 0.0% |
| Total | 32 | 100.0% |
School Enrollment by Age by Funding Source in Tuscarora
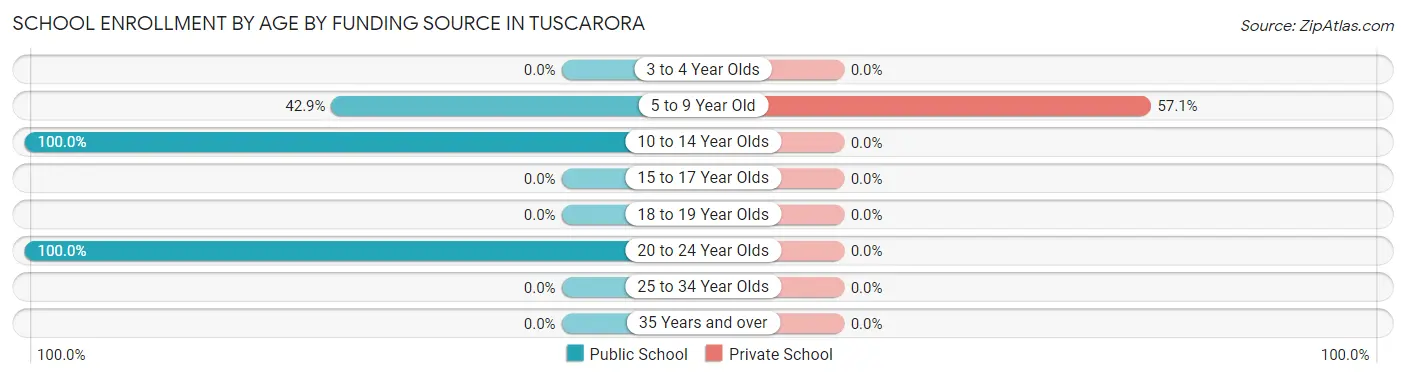
Out of a total of 32 students who are enrolled in schools in Tuscarora, 4 (12.5%) attend a private institution, while the remaining 28 (87.5%) are enrolled in public schools. The age group of 5 to 9 year old has the highest likelihood of being enrolled in private schools, with 4 (57.1% in the age bracket) enrolled. Conversely, the age group of 10 to 14 year olds has the lowest likelihood of being enrolled in a private school, with 21 (100.0% in the age bracket) attending a public institution.
| Age Bracket | Public School | Private School |
| 3 to 4 Year Olds | 0 (0.0%) | 0 (0.0%) |
| 5 to 9 Year Old | 3 (42.9%) | 4 (57.1%) |
| 10 to 14 Year Olds | 21 (100.0%) | 0 (0.0%) |
| 15 to 17 Year Olds | 0 (0.0%) | 0 (0.0%) |
| 18 to 19 Year Olds | 0 (0.0%) | 0 (0.0%) |
| 20 to 24 Year Olds | 4 (100.0%) | 0 (0.0%) |
| 25 to 34 Year Olds | 0 (0.0%) | 0 (0.0%) |
| 35 Years and over | 0 (0.0%) | 0 (0.0%) |
| Total | 28 (87.5%) | 4 (12.5%) |
Educational Attainment by Field of Study in Tuscarora
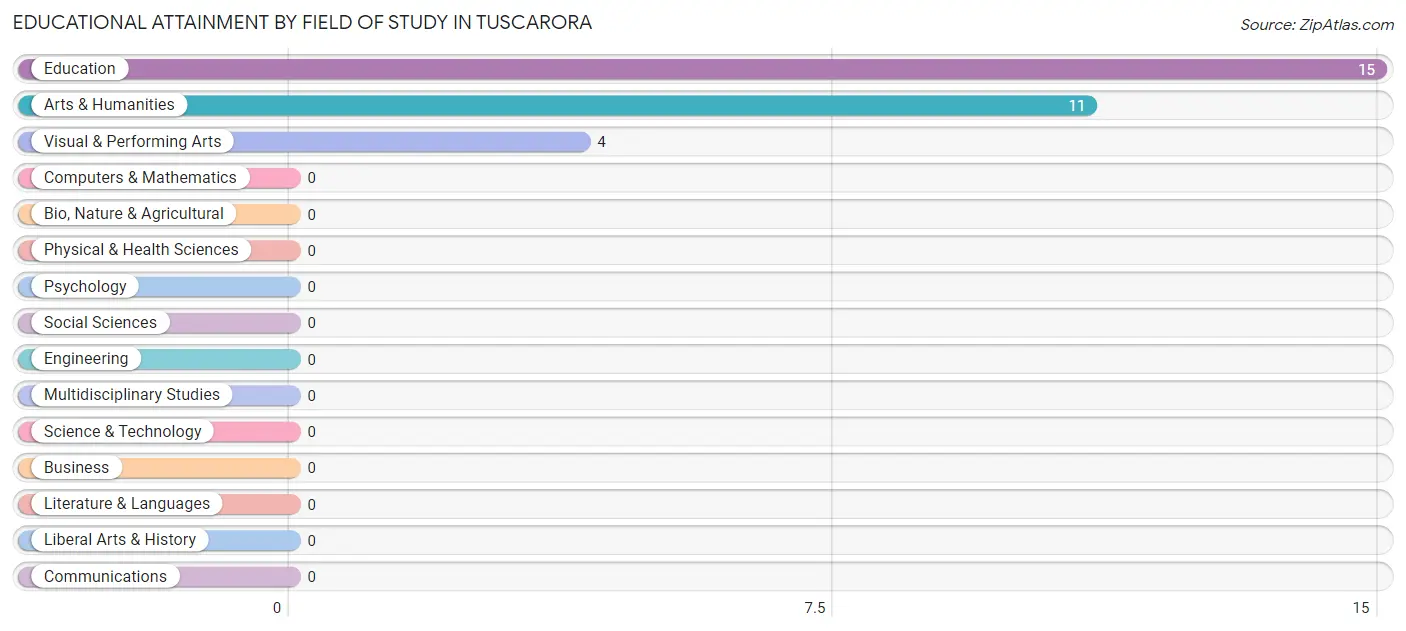
Education (15 | 50.0%), arts & humanities (11 | 36.7%), and visual & performing arts (4 | 13.3%) are the most common fields of study among 30 individuals in Tuscarora who have obtained a bachelor's degree or higher.
| Field of Study | # Graduates | % Graduates |
| Computers & Mathematics | 0 | 0.0% |
| Bio, Nature & Agricultural | 0 | 0.0% |
| Physical & Health Sciences | 0 | 0.0% |
| Psychology | 0 | 0.0% |
| Social Sciences | 0 | 0.0% |
| Engineering | 0 | 0.0% |
| Multidisciplinary Studies | 0 | 0.0% |
| Science & Technology | 0 | 0.0% |
| Business | 0 | 0.0% |
| Education | 15 | 50.0% |
| Literature & Languages | 0 | 0.0% |
| Liberal Arts & History | 0 | 0.0% |
| Visual & Performing Arts | 4 | 13.3% |
| Communications | 0 | 0.0% |
| Arts & Humanities | 11 | 36.7% |
| Total | 30 | 100.0% |
Transportation & Commute in Tuscarora
Vehicle Availability by Sex in Tuscarora
The most prevalent vehicle ownership categories in Tuscarora are males with 3 vehicles (50, accounting for 52.6%) and females with 3 vehicles (15, making up 65.8%).
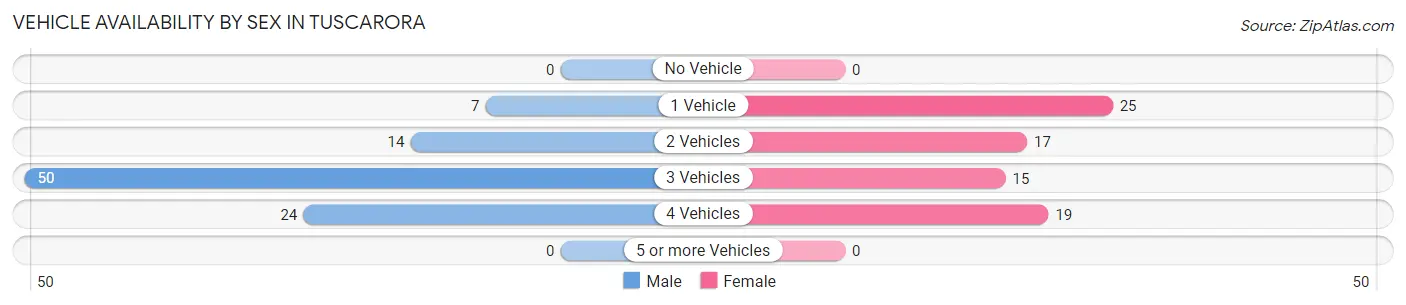
| Vehicles Available | Male | Female |
| No Vehicle | 0 (0.0%) | 0 (0.0%) |
| 1 Vehicle | 7 (7.4%) | 25 (32.9%) |
| 2 Vehicles | 14 (14.7%) | 17 (22.4%) |
| 3 Vehicles | 50 (52.6%) | 15 (19.7%) |
| 4 Vehicles | 24 (25.3%) | 19 (25.0%) |
| 5 or more Vehicles | 0 (0.0%) | 0 (0.0%) |
| Total | 95 (100.0%) | 76 (100.0%) |
Commute Time in Tuscarora
The most frequently occuring commute durations in Tuscarora are 30 to 34 minutes (59 commuters, 35.1%), 40 to 44 minutes (25 commuters, 14.9%), and 20 to 24 minutes (21 commuters, 12.5%).
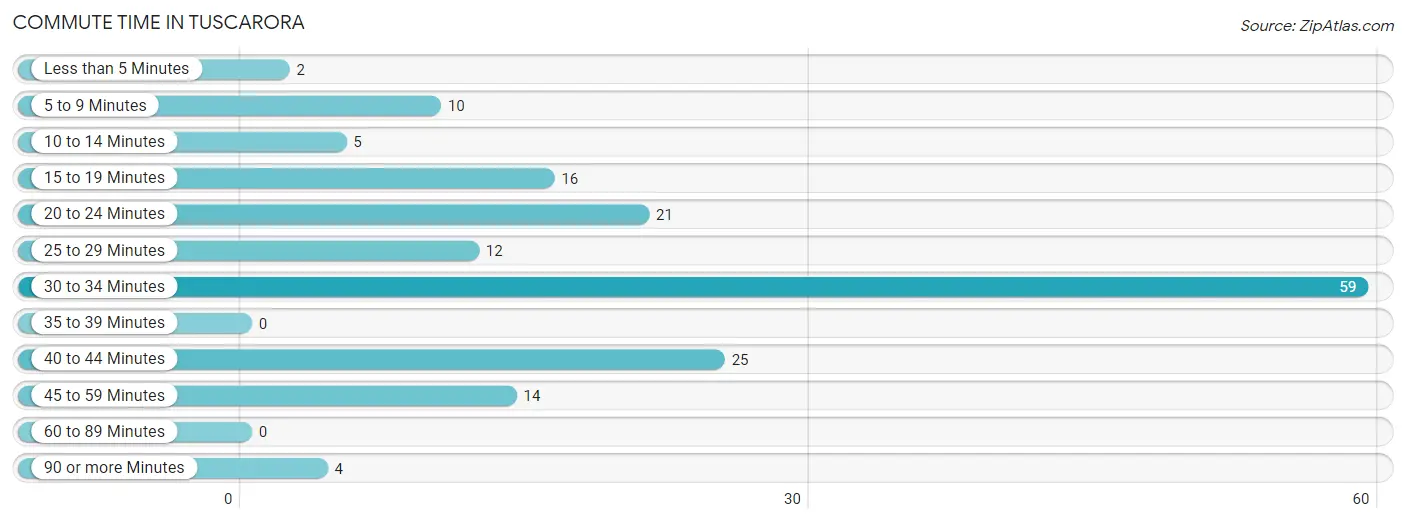
| Commute Time | # Commuters | % Commuters |
| Less than 5 Minutes | 2 | 1.2% |
| 5 to 9 Minutes | 10 | 5.9% |
| 10 to 14 Minutes | 5 | 3.0% |
| 15 to 19 Minutes | 16 | 9.5% |
| 20 to 24 Minutes | 21 | 12.5% |
| 25 to 29 Minutes | 12 | 7.1% |
| 30 to 34 Minutes | 59 | 35.1% |
| 35 to 39 Minutes | 0 | 0.0% |
| 40 to 44 Minutes | 25 | 14.9% |
| 45 to 59 Minutes | 14 | 8.3% |
| 60 to 89 Minutes | 0 | 0.0% |
| 90 or more Minutes | 4 | 2.4% |
Commute Time by Sex in Tuscarora
The most common commute times in Tuscarora are 30 to 34 minutes (36 commuters, 37.9%) for males and 30 to 34 minutes (23 commuters, 31.5%) for females.
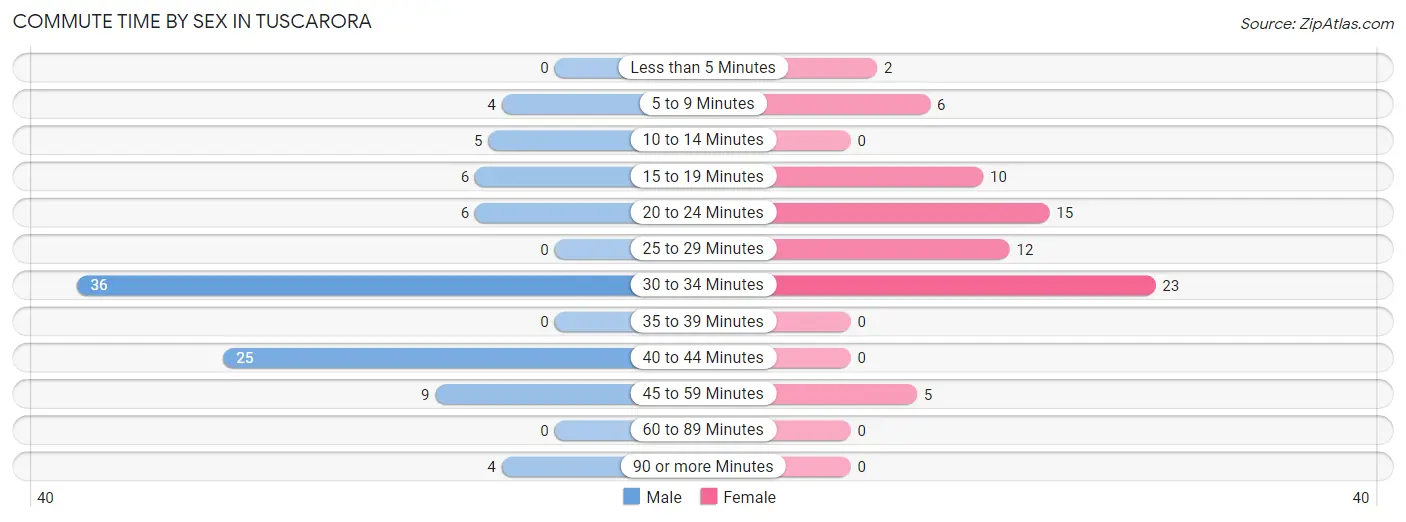
| Commute Time | Male | Female |
| Less than 5 Minutes | 0 (0.0%) | 2 (2.7%) |
| 5 to 9 Minutes | 4 (4.2%) | 6 (8.2%) |
| 10 to 14 Minutes | 5 (5.3%) | 0 (0.0%) |
| 15 to 19 Minutes | 6 (6.3%) | 10 (13.7%) |
| 20 to 24 Minutes | 6 (6.3%) | 15 (20.5%) |
| 25 to 29 Minutes | 0 (0.0%) | 12 (16.4%) |
| 30 to 34 Minutes | 36 (37.9%) | 23 (31.5%) |
| 35 to 39 Minutes | 0 (0.0%) | 0 (0.0%) |
| 40 to 44 Minutes | 25 (26.3%) | 0 (0.0%) |
| 45 to 59 Minutes | 9 (9.5%) | 5 (6.9%) |
| 60 to 89 Minutes | 0 (0.0%) | 0 (0.0%) |
| 90 or more Minutes | 4 (4.2%) | 0 (0.0%) |
Time of Departure to Work by Sex in Tuscarora
The most frequent times of departure to work in Tuscarora are 12:00 PM to 3:59 PM (32, 33.7%) for males and 12:00 PM to 3:59 PM (17, 23.3%) for females.
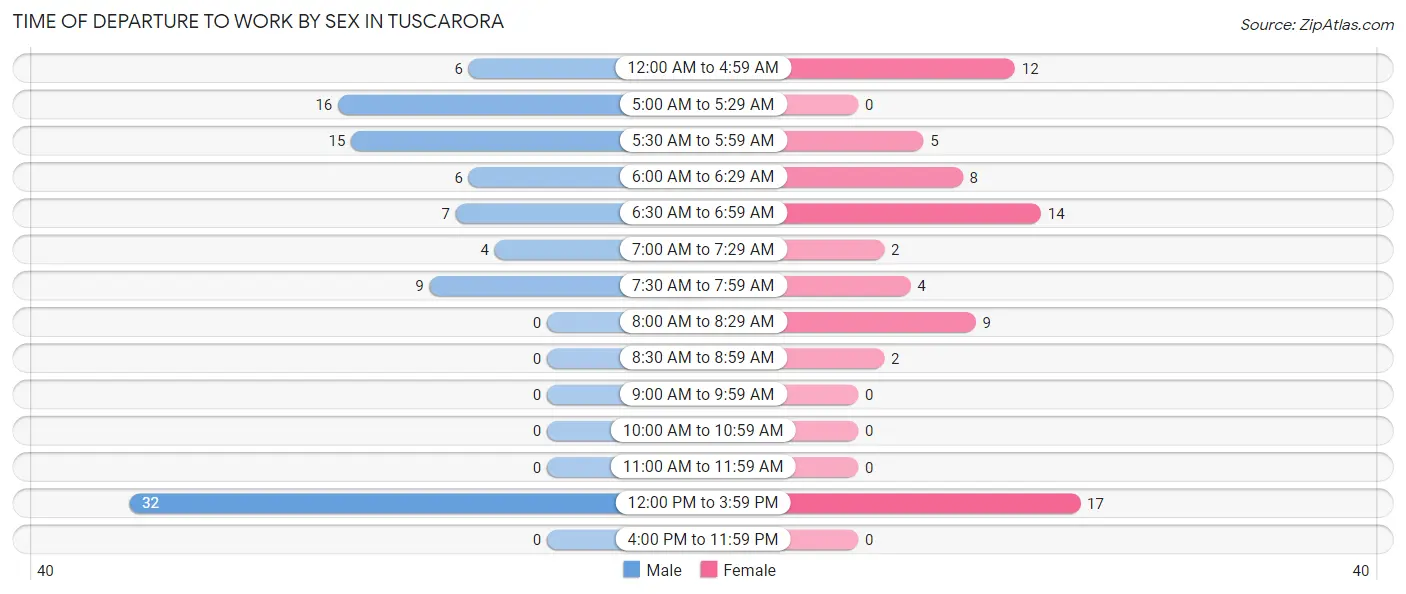
| Time of Departure | Male | Female |
| 12:00 AM to 4:59 AM | 6 (6.3%) | 12 (16.4%) |
| 5:00 AM to 5:29 AM | 16 (16.8%) | 0 (0.0%) |
| 5:30 AM to 5:59 AM | 15 (15.8%) | 5 (6.9%) |
| 6:00 AM to 6:29 AM | 6 (6.3%) | 8 (11.0%) |
| 6:30 AM to 6:59 AM | 7 (7.4%) | 14 (19.2%) |
| 7:00 AM to 7:29 AM | 4 (4.2%) | 2 (2.7%) |
| 7:30 AM to 7:59 AM | 9 (9.5%) | 4 (5.5%) |
| 8:00 AM to 8:29 AM | 0 (0.0%) | 9 (12.3%) |
| 8:30 AM to 8:59 AM | 0 (0.0%) | 2 (2.7%) |
| 9:00 AM to 9:59 AM | 0 (0.0%) | 0 (0.0%) |
| 10:00 AM to 10:59 AM | 0 (0.0%) | 0 (0.0%) |
| 11:00 AM to 11:59 AM | 0 (0.0%) | 0 (0.0%) |
| 12:00 PM to 3:59 PM | 32 (33.7%) | 17 (23.3%) |
| 4:00 PM to 11:59 PM | 0 (0.0%) | 0 (0.0%) |
| Total | 95 (100.0%) | 73 (100.0%) |
Housing Occupancy in Tuscarora
Occupancy by Ownership in Tuscarora
Of the total 208 dwellings in Tuscarora, owner-occupied units account for 190 (91.3%), while renter-occupied units make up 18 (8.6%).
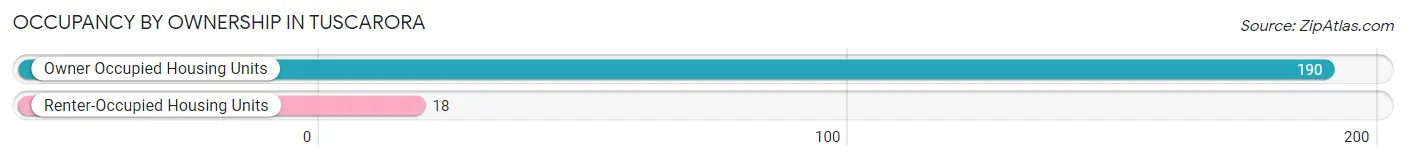
| Occupancy | # Housing Units | % Housing Units |
| Owner Occupied Housing Units | 190 | 91.3% |
| Renter-Occupied Housing Units | 18 | 8.6% |
| Total Occupied Housing Units | 208 | 100.0% |
Occupancy by Household Size in Tuscarora
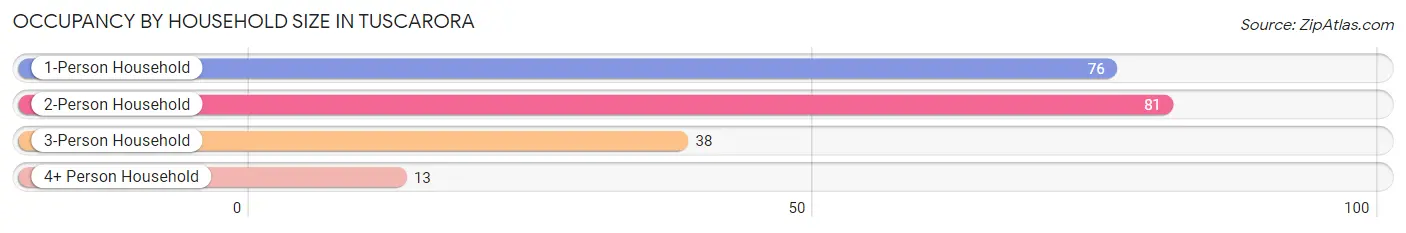
| Household Size | # Housing Units | % Housing Units |
| 1-Person Household | 76 | 36.5% |
| 2-Person Household | 81 | 38.9% |
| 3-Person Household | 38 | 18.3% |
| 4+ Person Household | 13 | 6.2% |
| Total Housing Units | 208 | 100.0% |
Occupancy by Ownership by Household Size in Tuscarora
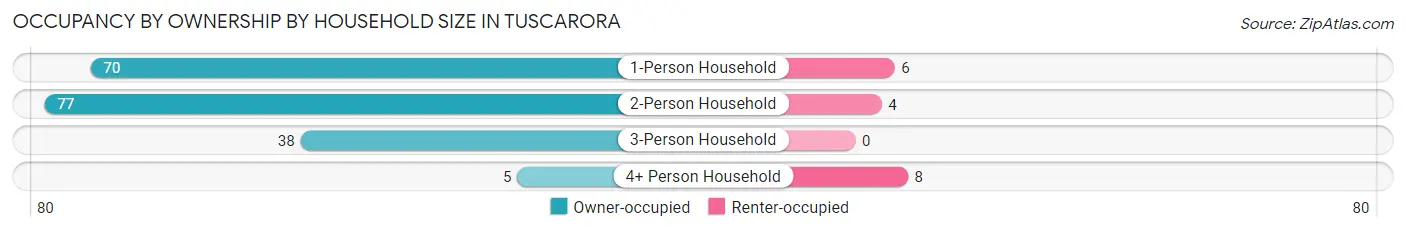
| Household Size | Owner-occupied | Renter-occupied |
| 1-Person Household | 70 (92.1%) | 6 (7.9%) |
| 2-Person Household | 77 (95.1%) | 4 (4.9%) |
| 3-Person Household | 38 (100.0%) | 0 (0.0%) |
| 4+ Person Household | 5 (38.5%) | 8 (61.5%) |
| Total Housing Units | 190 (91.3%) | 18 (8.6%) |
Occupancy by Educational Attainment in Tuscarora
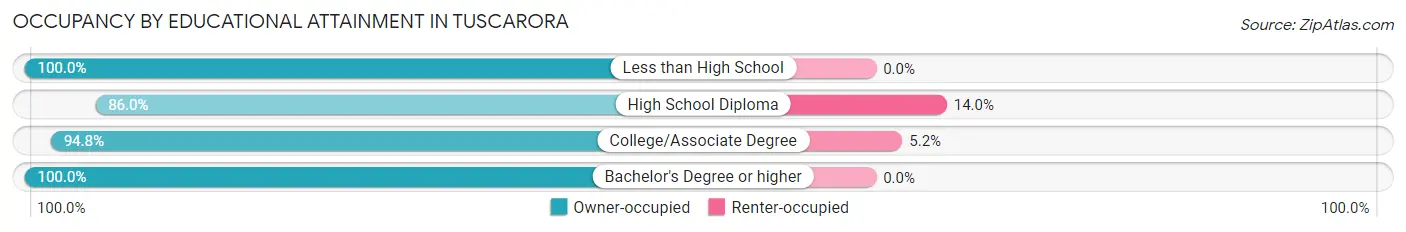
| Household Size | Owner-occupied | Renter-occupied |
| Less than High School | 9 (100.0%) | 0 (0.0%) |
| High School Diploma | 86 (86.0%) | 14 (14.0%) |
| College/Associate Degree | 73 (94.8%) | 4 (5.2%) |
| Bachelor's Degree or higher | 22 (100.0%) | 0 (0.0%) |
Occupancy by Age of Householder in Tuscarora
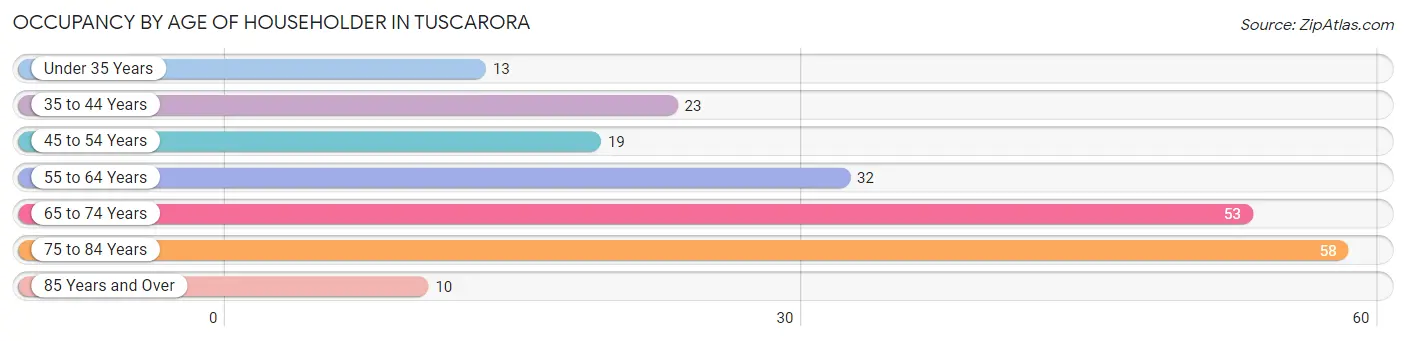
| Age Bracket | # Households | % Households |
| Under 35 Years | 13 | 6.2% |
| 35 to 44 Years | 23 | 11.1% |
| 45 to 54 Years | 19 | 9.1% |
| 55 to 64 Years | 32 | 15.4% |
| 65 to 74 Years | 53 | 25.5% |
| 75 to 84 Years | 58 | 27.9% |
| 85 Years and Over | 10 | 4.8% |
| Total | 208 | 100.0% |
Housing Finances in Tuscarora
Median Income by Occupancy in Tuscarora
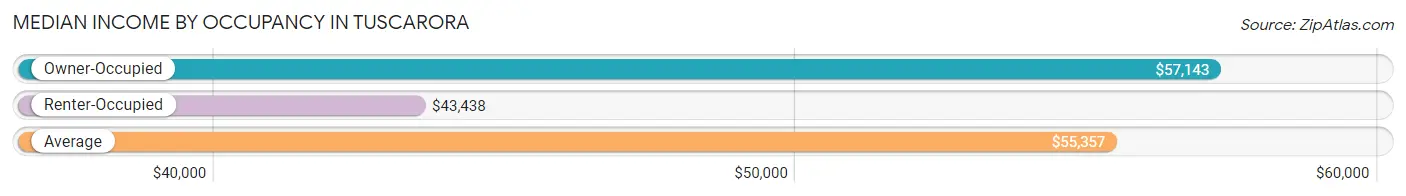
| Occupancy Type | # Households | Median Income |
| Owner-Occupied | 190 (91.3%) | $57,143 |
| Renter-Occupied | 18 (8.6%) | $43,438 |
| Average | 208 (100.0%) | $55,357 |
Occupancy by Householder Income Bracket in Tuscarora
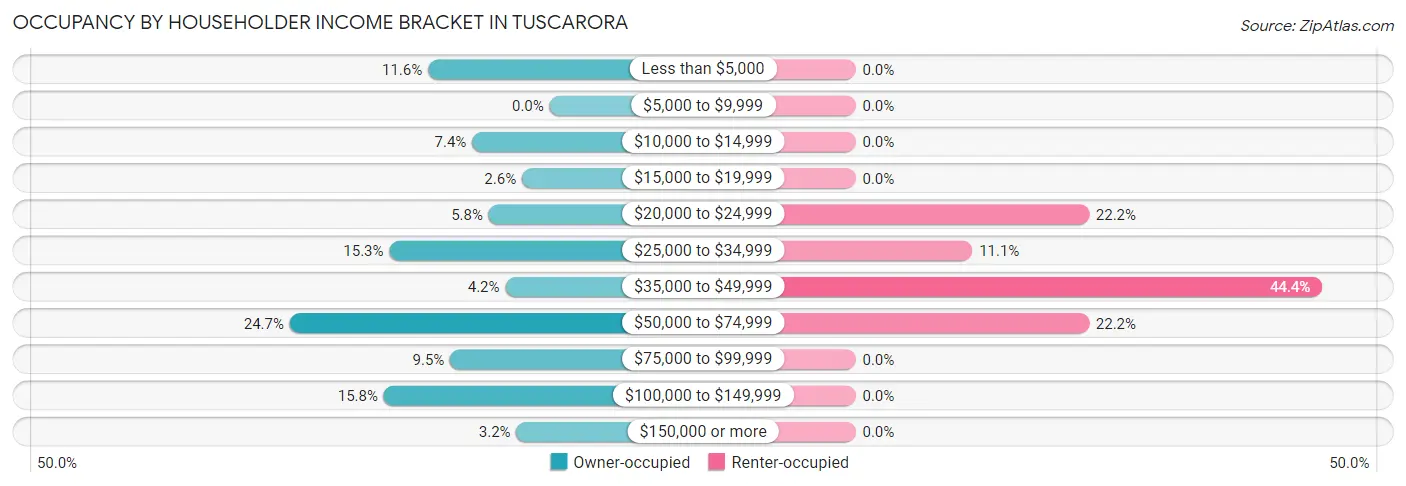
| Income Bracket | Owner-occupied | Renter-occupied |
| Less than $5,000 | 22 (11.6%) | 0 (0.0%) |
| $5,000 to $9,999 | 0 (0.0%) | 0 (0.0%) |
| $10,000 to $14,999 | 14 (7.4%) | 0 (0.0%) |
| $15,000 to $19,999 | 5 (2.6%) | 0 (0.0%) |
| $20,000 to $24,999 | 11 (5.8%) | 4 (22.2%) |
| $25,000 to $34,999 | 29 (15.3%) | 2 (11.1%) |
| $35,000 to $49,999 | 8 (4.2%) | 8 (44.4%) |
| $50,000 to $74,999 | 47 (24.7%) | 4 (22.2%) |
| $75,000 to $99,999 | 18 (9.5%) | 0 (0.0%) |
| $100,000 to $149,999 | 30 (15.8%) | 0 (0.0%) |
| $150,000 or more | 6 (3.2%) | 0 (0.0%) |
| Total | 190 (100.0%) | 18 (100.0%) |
Monthly Housing Cost Tiers in Tuscarora
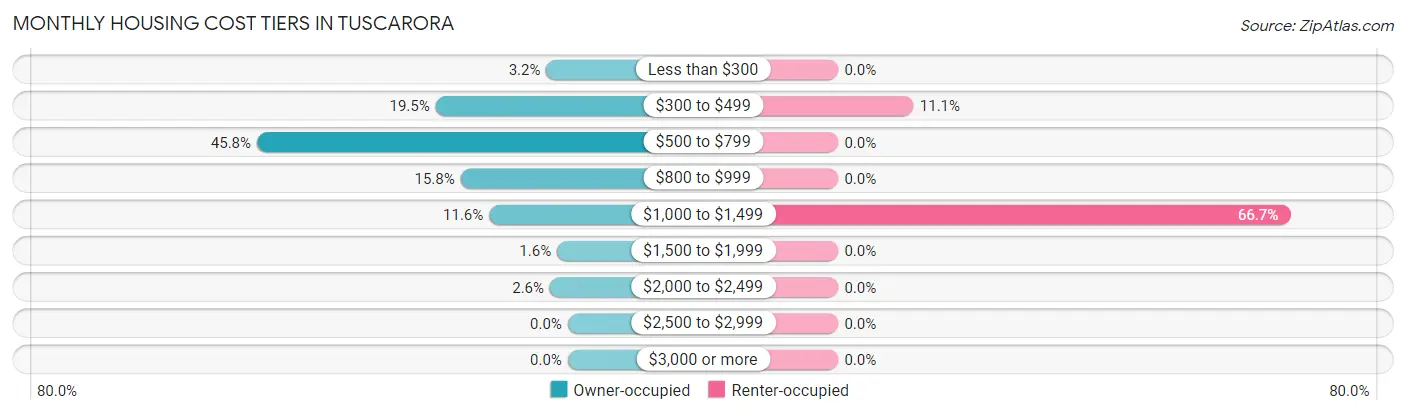
| Monthly Cost | Owner-occupied | Renter-occupied |
| Less than $300 | 6 (3.2%) | 0 (0.0%) |
| $300 to $499 | 37 (19.5%) | 2 (11.1%) |
| $500 to $799 | 87 (45.8%) | 0 (0.0%) |
| $800 to $999 | 30 (15.8%) | 0 (0.0%) |
| $1,000 to $1,499 | 22 (11.6%) | 12 (66.7%) |
| $1,500 to $1,999 | 3 (1.6%) | 0 (0.0%) |
| $2,000 to $2,499 | 5 (2.6%) | 0 (0.0%) |
| $2,500 to $2,999 | 0 (0.0%) | 0 (0.0%) |
| $3,000 or more | 0 (0.0%) | 0 (0.0%) |
| Total | 190 (100.0%) | 18 (100.0%) |
Physical Housing Characteristics in Tuscarora
Housing Structures in Tuscarora
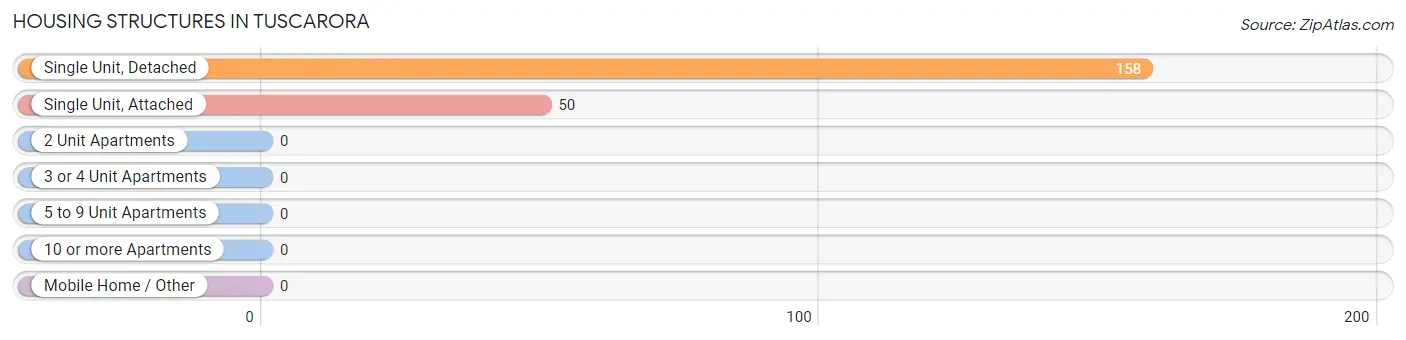
| Structure Type | # Housing Units | % Housing Units |
| Single Unit, Detached | 158 | 76.0% |
| Single Unit, Attached | 50 | 24.0% |
| 2 Unit Apartments | 0 | 0.0% |
| 3 or 4 Unit Apartments | 0 | 0.0% |
| 5 to 9 Unit Apartments | 0 | 0.0% |
| 10 or more Apartments | 0 | 0.0% |
| Mobile Home / Other | 0 | 0.0% |
| Total | 208 | 100.0% |
Housing Structures by Occupancy in Tuscarora
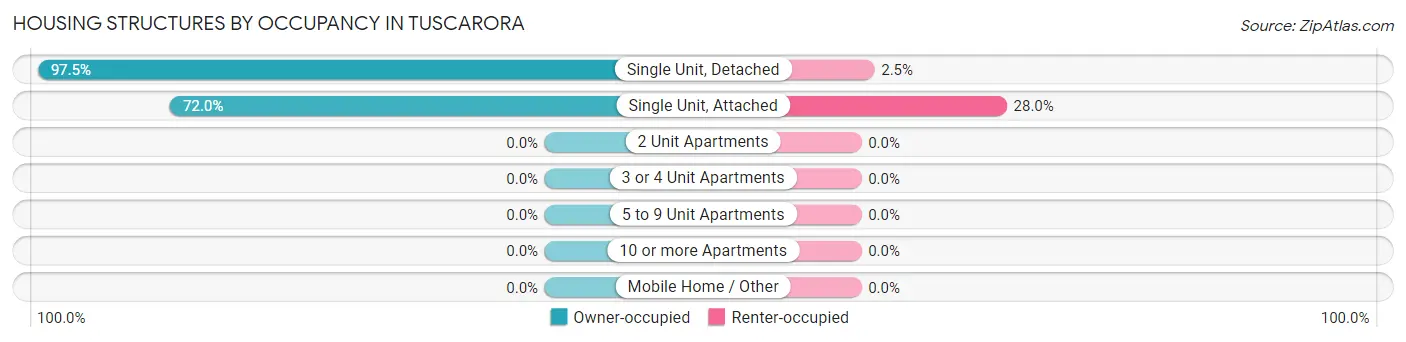
| Structure Type | Owner-occupied | Renter-occupied |
| Single Unit, Detached | 154 (97.5%) | 4 (2.5%) |
| Single Unit, Attached | 36 (72.0%) | 14 (28.0%) |
| 2 Unit Apartments | 0 (0.0%) | 0 (0.0%) |
| 3 or 4 Unit Apartments | 0 (0.0%) | 0 (0.0%) |
| 5 to 9 Unit Apartments | 0 (0.0%) | 0 (0.0%) |
| 10 or more Apartments | 0 (0.0%) | 0 (0.0%) |
| Mobile Home / Other | 0 (0.0%) | 0 (0.0%) |
| Total | 190 (91.3%) | 18 (8.6%) |
Housing Structures by Number of Rooms in Tuscarora
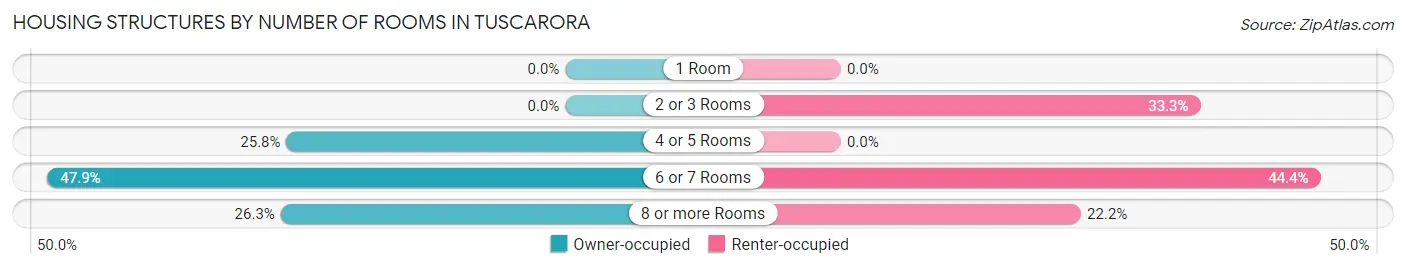
| Number of Rooms | Owner-occupied | Renter-occupied |
| 1 Room | 0 (0.0%) | 0 (0.0%) |
| 2 or 3 Rooms | 0 (0.0%) | 6 (33.3%) |
| 4 or 5 Rooms | 49 (25.8%) | 0 (0.0%) |
| 6 or 7 Rooms | 91 (47.9%) | 8 (44.4%) |
| 8 or more Rooms | 50 (26.3%) | 4 (22.2%) |
| Total | 190 (100.0%) | 18 (100.0%) |
Housing Structure by Heating Type in Tuscarora
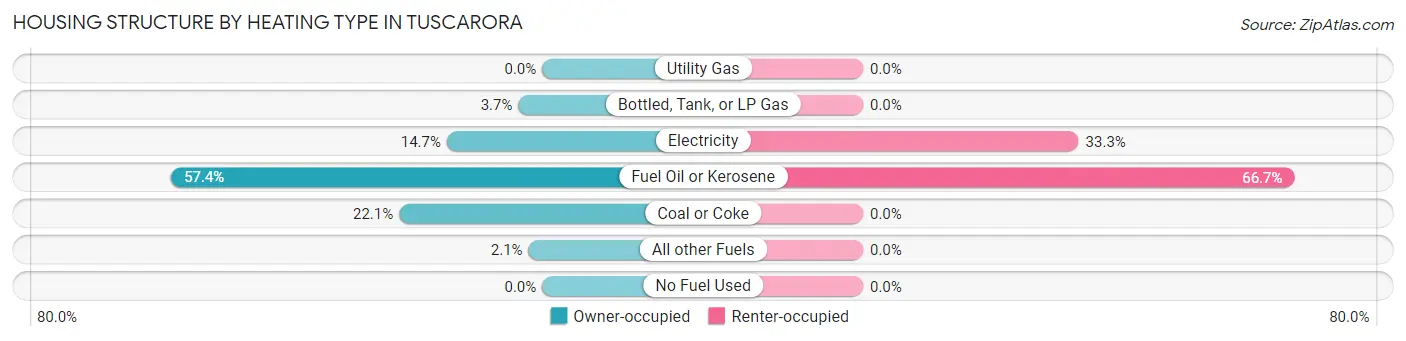
| Heating Type | Owner-occupied | Renter-occupied |
| Utility Gas | 0 (0.0%) | 0 (0.0%) |
| Bottled, Tank, or LP Gas | 7 (3.7%) | 0 (0.0%) |
| Electricity | 28 (14.7%) | 6 (33.3%) |
| Fuel Oil or Kerosene | 109 (57.4%) | 12 (66.7%) |
| Coal or Coke | 42 (22.1%) | 0 (0.0%) |
| All other Fuels | 4 (2.1%) | 0 (0.0%) |
| No Fuel Used | 0 (0.0%) | 0 (0.0%) |
| Total | 190 (100.0%) | 18 (100.0%) |
Household Vehicle Usage in Tuscarora
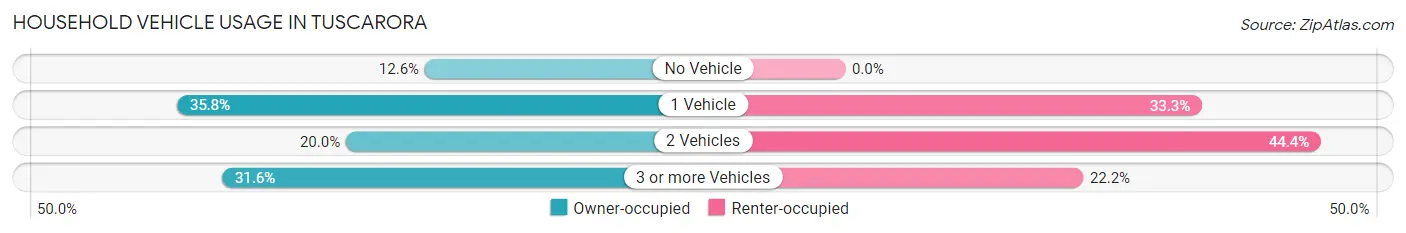
| Vehicles per Household | Owner-occupied | Renter-occupied |
| No Vehicle | 24 (12.6%) | 0 (0.0%) |
| 1 Vehicle | 68 (35.8%) | 6 (33.3%) |
| 2 Vehicles | 38 (20.0%) | 8 (44.4%) |
| 3 or more Vehicles | 60 (31.6%) | 4 (22.2%) |
| Total | 190 (100.0%) | 18 (100.0%) |
Real Estate & Mortgages in Tuscarora
Real Estate and Mortgage Overview in Tuscarora
| Characteristic | Without Mortgage | With Mortgage |
| Housing Units | 154 | 36 |
| Median Property Value | $95,600 | $130,800 |
| Median Household Income | $43,438 | $3 |
| Monthly Housing Costs | $569 | $0 |
| Real Estate Taxes | $1,167 | $0 |
Property Value by Mortgage Status in Tuscarora
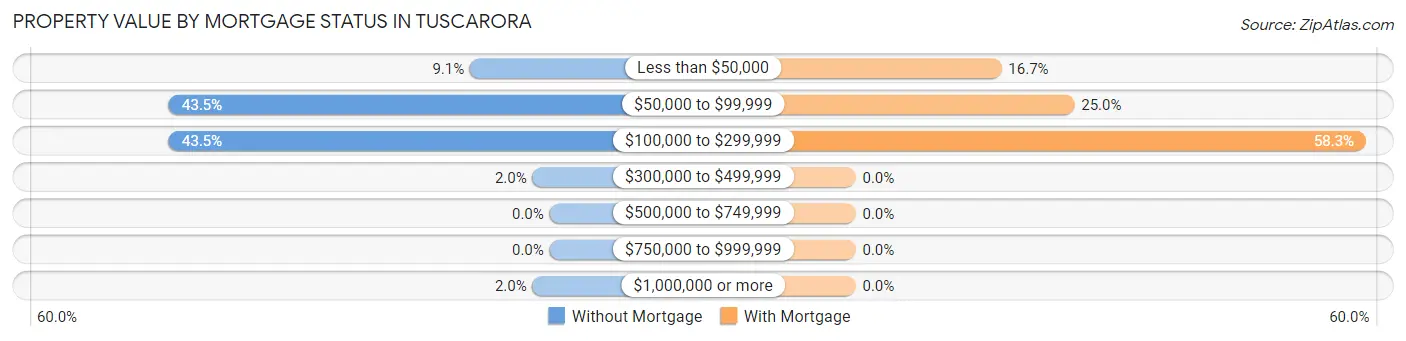
| Property Value | Without Mortgage | With Mortgage |
| Less than $50,000 | 14 (9.1%) | 6 (16.7%) |
| $50,000 to $99,999 | 67 (43.5%) | 9 (25.0%) |
| $100,000 to $299,999 | 67 (43.5%) | 21 (58.3%) |
| $300,000 to $499,999 | 3 (1.9%) | 0 (0.0%) |
| $500,000 to $749,999 | 0 (0.0%) | 0 (0.0%) |
| $750,000 to $999,999 | 0 (0.0%) | 0 (0.0%) |
| $1,000,000 or more | 3 (1.9%) | 0 (0.0%) |
| Total | 154 (100.0%) | 36 (100.0%) |
Household Income by Mortgage Status in Tuscarora
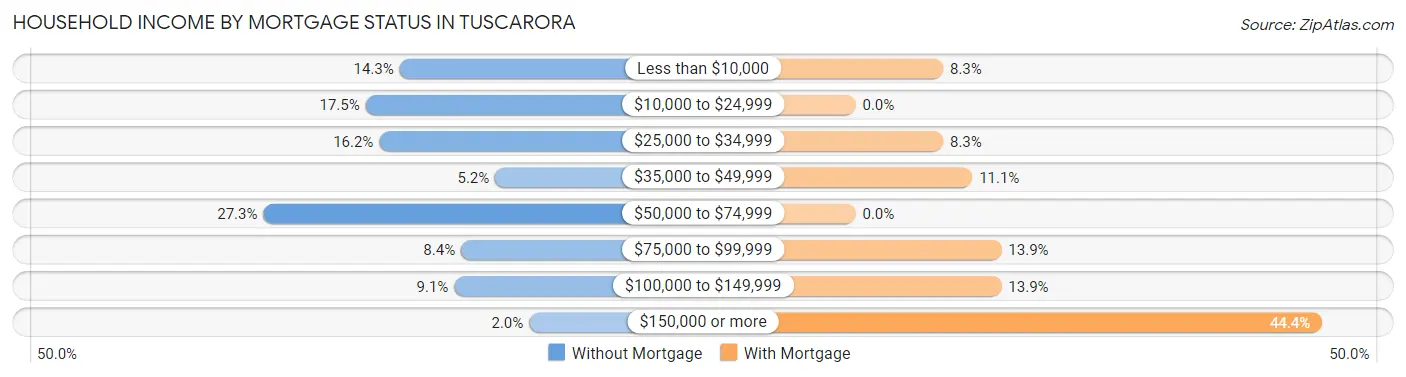
| Household Income | Without Mortgage | With Mortgage |
| Less than $10,000 | 22 (14.3%) | 3 (8.3%) |
| $10,000 to $24,999 | 27 (17.5%) | 0 (0.0%) |
| $25,000 to $34,999 | 25 (16.2%) | 3 (8.3%) |
| $35,000 to $49,999 | 8 (5.2%) | 4 (11.1%) |
| $50,000 to $74,999 | 42 (27.3%) | 0 (0.0%) |
| $75,000 to $99,999 | 13 (8.4%) | 5 (13.9%) |
| $100,000 to $149,999 | 14 (9.1%) | 5 (13.9%) |
| $150,000 or more | 3 (1.9%) | 16 (44.4%) |
| Total | 154 (100.0%) | 36 (100.0%) |
Property Value to Household Income Ratio in Tuscarora
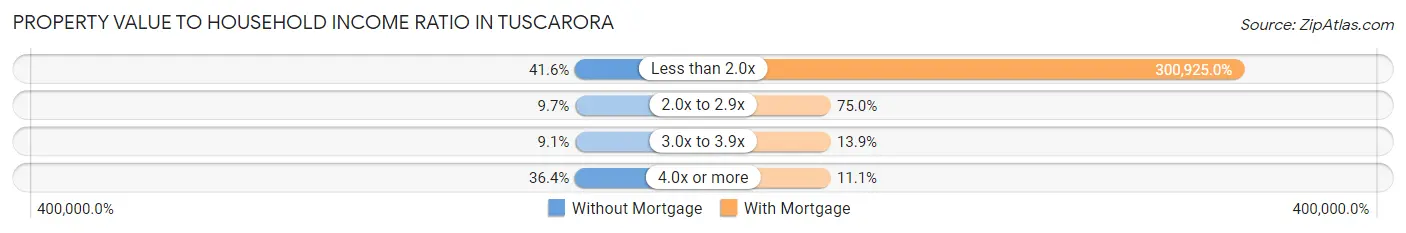
| Value-to-Income Ratio | Without Mortgage | With Mortgage |
| Less than 2.0x | 64 (41.6%) | 108,333 (300,925.0%) |
| 2.0x to 2.9x | 15 (9.7%) | 27 (75.0%) |
| 3.0x to 3.9x | 14 (9.1%) | 5 (13.9%) |
| 4.0x or more | 56 (36.4%) | 4 (11.1%) |
| Total | 154 (100.0%) | 36 (100.0%) |
Real Estate Taxes by Mortgage Status in Tuscarora
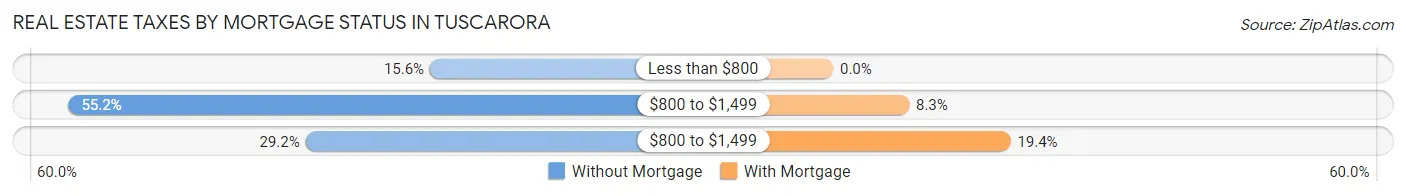
| Property Taxes | Without Mortgage | With Mortgage |
| Less than $800 | 24 (15.6%) | 0 (0.0%) |
| $800 to $1,499 | 85 (55.2%) | 3 (8.3%) |
| $800 to $1,499 | 45 (29.2%) | 7 (19.4%) |
| Total | 154 (100.0%) | 36 (100.0%) |
Health & Disability in Tuscarora
Health Insurance Coverage by Age in Tuscarora
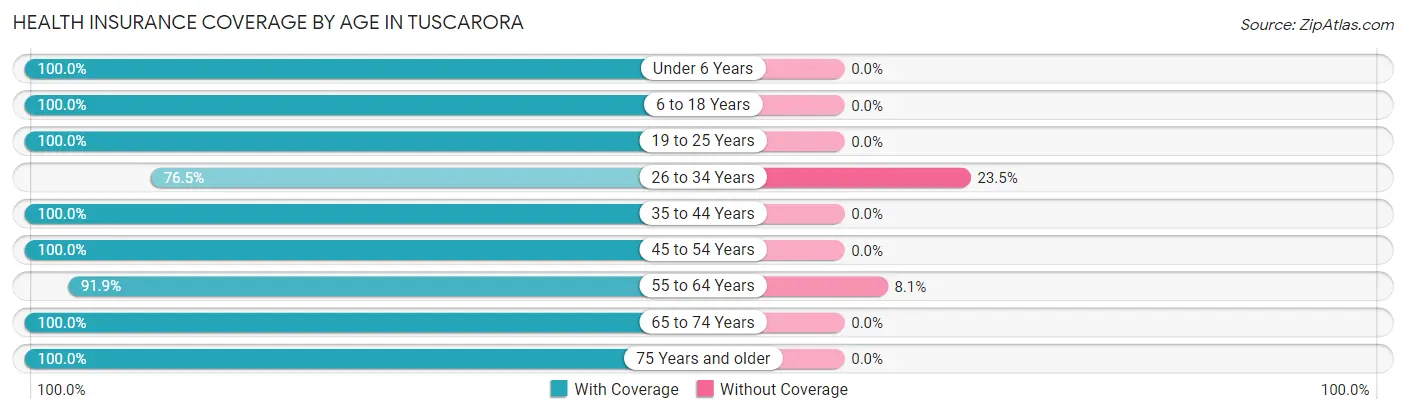
| Age Bracket | With Coverage | Without Coverage |
| Under 6 Years | 8 (100.0%) | 0 (0.0%) |
| 6 to 18 Years | 28 (100.0%) | 0 (0.0%) |
| 19 to 25 Years | 23 (100.0%) | 0 (0.0%) |
| 26 to 34 Years | 13 (76.5%) | 4 (23.5%) |
| 35 to 44 Years | 58 (100.0%) | 0 (0.0%) |
| 45 to 54 Years | 35 (100.0%) | 0 (0.0%) |
| 55 to 64 Years | 57 (91.9%) | 5 (8.1%) |
| 65 to 74 Years | 72 (100.0%) | 0 (0.0%) |
| 75 Years and older | 101 (100.0%) | 0 (0.0%) |
| Total | 395 (97.8%) | 9 (2.2%) |
Health Insurance Coverage by Citizenship Status in Tuscarora

| Citizenship Status | With Coverage | Without Coverage |
| Native Born | 8 (100.0%) | 0 (0.0%) |
| Foreign Born, Citizen | 28 (100.0%) | 0 (0.0%) |
| Foreign Born, not a Citizen | 23 (100.0%) | 0 (0.0%) |
Health Insurance Coverage by Household Income in Tuscarora
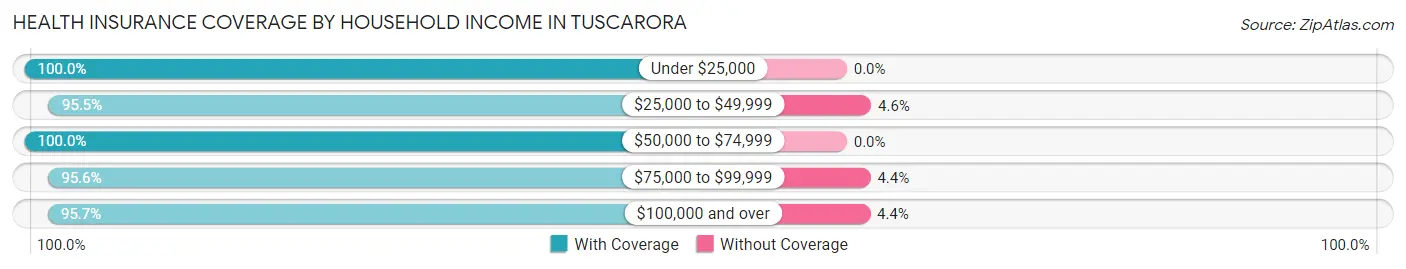
| Household Income | With Coverage | Without Coverage |
| Under $25,000 | 65 (100.0%) | 0 (0.0%) |
| $25,000 to $49,999 | 84 (95.5%) | 4 (4.5%) |
| $50,000 to $74,999 | 137 (100.0%) | 0 (0.0%) |
| $75,000 to $99,999 | 43 (95.6%) | 2 (4.4%) |
| $100,000 and over | 66 (95.7%) | 3 (4.3%) |
Public vs Private Health Insurance Coverage by Age in Tuscarora
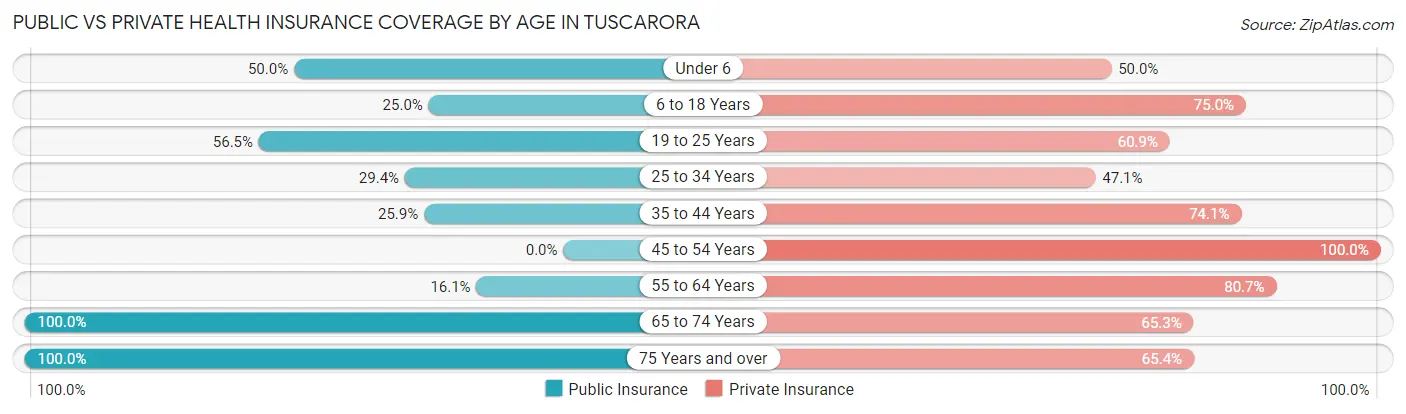
| Age Bracket | Public Insurance | Private Insurance |
| Under 6 | 4 (50.0%) | 4 (50.0%) |
| 6 to 18 Years | 7 (25.0%) | 21 (75.0%) |
| 19 to 25 Years | 13 (56.5%) | 14 (60.9%) |
| 25 to 34 Years | 5 (29.4%) | 8 (47.1%) |
| 35 to 44 Years | 15 (25.9%) | 43 (74.1%) |
| 45 to 54 Years | 0 (0.0%) | 35 (100.0%) |
| 55 to 64 Years | 10 (16.1%) | 50 (80.6%) |
| 65 to 74 Years | 72 (100.0%) | 47 (65.3%) |
| 75 Years and over | 101 (100.0%) | 66 (65.3%) |
| Total | 227 (56.2%) | 288 (71.3%) |
Disability Status by Sex by Age in Tuscarora
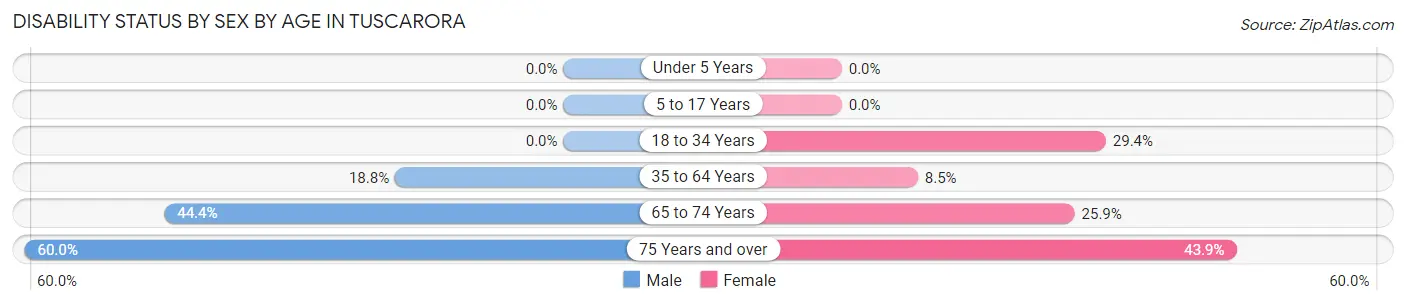
| Age Bracket | Male | Female |
| Under 5 Years | 0 (0.0%) | 0 (0.0%) |
| 5 to 17 Years | 0 (0.0%) | 0 (0.0%) |
| 18 to 34 Years | 0 (0.0%) | 5 (29.4%) |
| 35 to 64 Years | 18 (18.8%) | 5 (8.5%) |
| 65 to 74 Years | 8 (44.4%) | 14 (25.9%) |
| 75 Years and over | 21 (60.0%) | 29 (43.9%) |
Disability Class by Sex by Age in Tuscarora
Disability Class: Hearing Difficulty
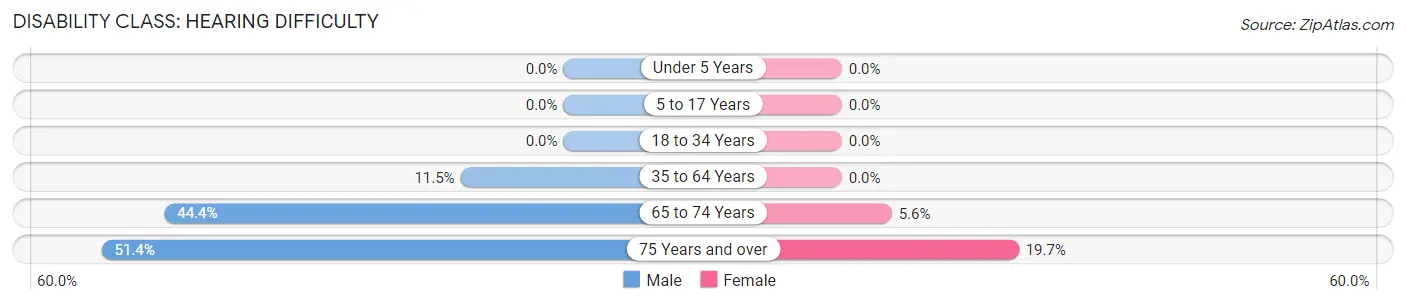
| Age Bracket | Male | Female |
| Under 5 Years | 0 (0.0%) | 0 (0.0%) |
| 5 to 17 Years | 0 (0.0%) | 0 (0.0%) |
| 18 to 34 Years | 0 (0.0%) | 0 (0.0%) |
| 35 to 64 Years | 11 (11.5%) | 0 (0.0%) |
| 65 to 74 Years | 8 (44.4%) | 3 (5.6%) |
| 75 Years and over | 18 (51.4%) | 13 (19.7%) |
Disability Class: Vision Difficulty
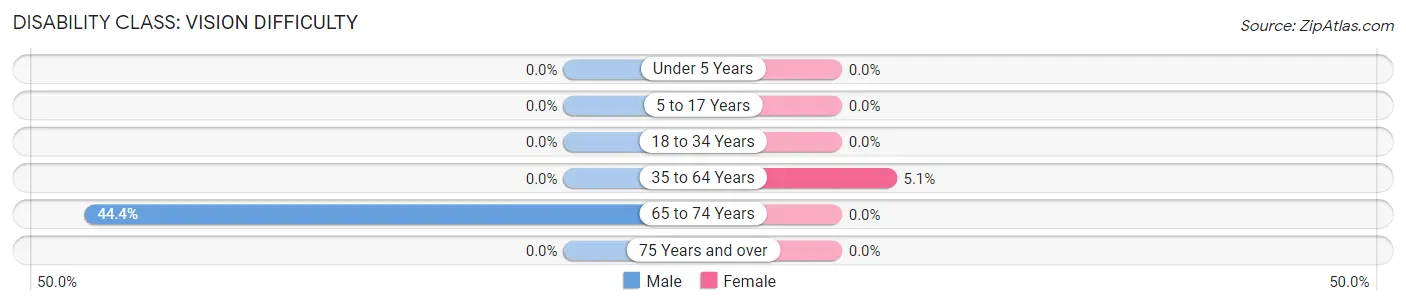
| Age Bracket | Male | Female |
| Under 5 Years | 0 (0.0%) | 0 (0.0%) |
| 5 to 17 Years | 0 (0.0%) | 0 (0.0%) |
| 18 to 34 Years | 0 (0.0%) | 0 (0.0%) |
| 35 to 64 Years | 0 (0.0%) | 3 (5.1%) |
| 65 to 74 Years | 8 (44.4%) | 0 (0.0%) |
| 75 Years and over | 0 (0.0%) | 0 (0.0%) |
Disability Class: Cognitive Difficulty
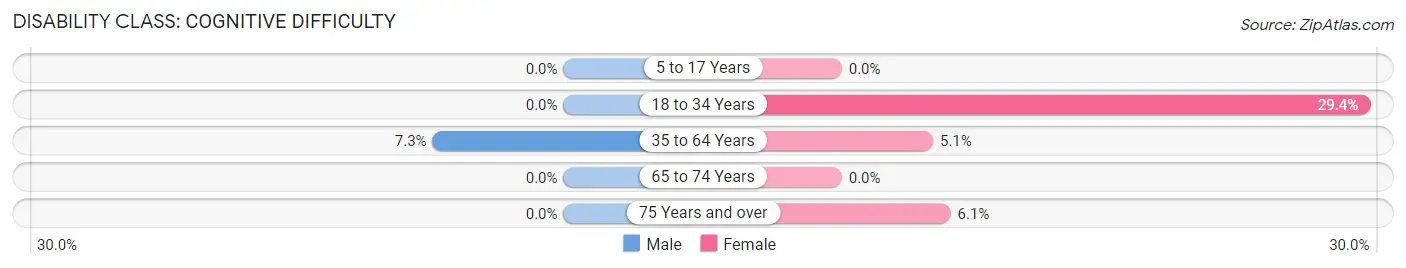
| Age Bracket | Male | Female |
| 5 to 17 Years | 0 (0.0%) | 0 (0.0%) |
| 18 to 34 Years | 0 (0.0%) | 5 (29.4%) |
| 35 to 64 Years | 7 (7.3%) | 3 (5.1%) |
| 65 to 74 Years | 0 (0.0%) | 0 (0.0%) |
| 75 Years and over | 0 (0.0%) | 4 (6.1%) |
Disability Class: Ambulatory Difficulty
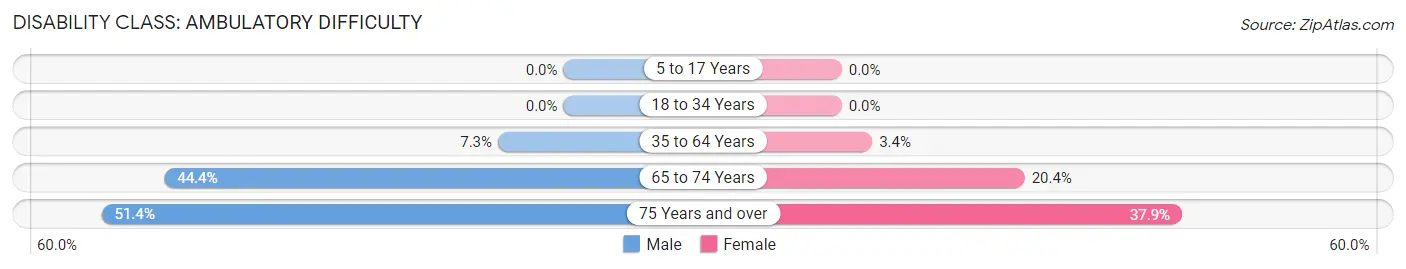
| Age Bracket | Male | Female |
| 5 to 17 Years | 0 (0.0%) | 0 (0.0%) |
| 18 to 34 Years | 0 (0.0%) | 0 (0.0%) |
| 35 to 64 Years | 7 (7.3%) | 2 (3.4%) |
| 65 to 74 Years | 8 (44.4%) | 11 (20.4%) |
| 75 Years and over | 18 (51.4%) | 25 (37.9%) |
Disability Class: Self-Care Difficulty
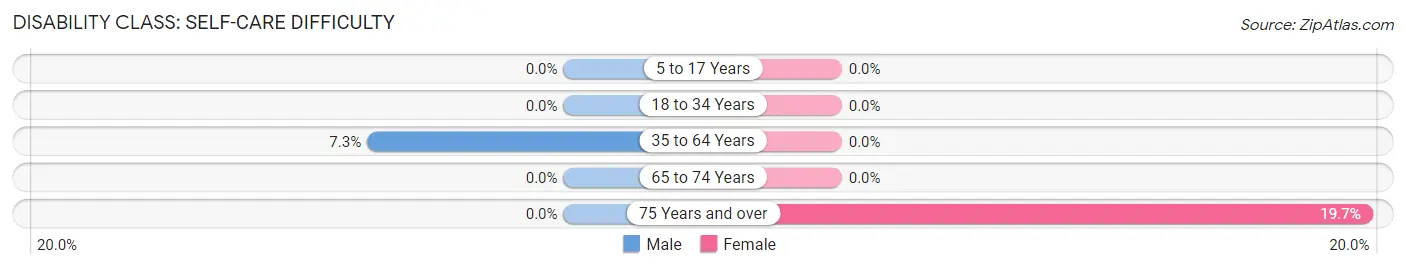
| Age Bracket | Male | Female |
| 5 to 17 Years | 0 (0.0%) | 0 (0.0%) |
| 18 to 34 Years | 0 (0.0%) | 0 (0.0%) |
| 35 to 64 Years | 7 (7.3%) | 0 (0.0%) |
| 65 to 74 Years | 0 (0.0%) | 0 (0.0%) |
| 75 Years and over | 0 (0.0%) | 13 (19.7%) |
Technology Access in Tuscarora
Computing Device Access in Tuscarora
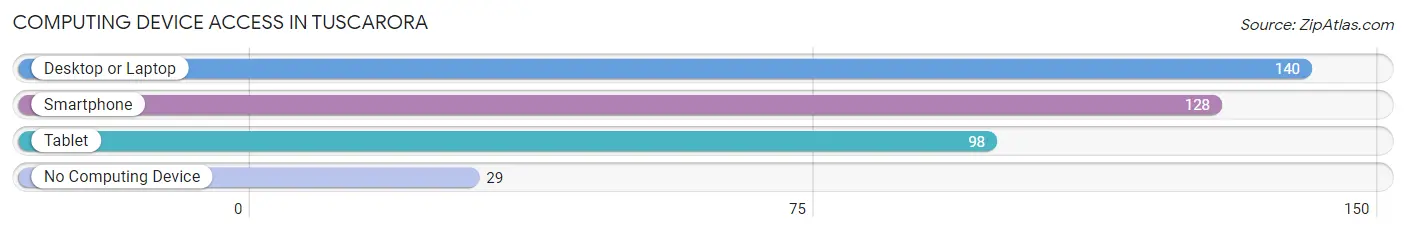
| Device Type | # Households | % Households |
| Desktop or Laptop | 140 | 67.3% |
| Smartphone | 128 | 61.5% |
| Tablet | 98 | 47.1% |
| No Computing Device | 29 | 13.9% |
| Total | 208 | 100.0% |
Internet Access in Tuscarora
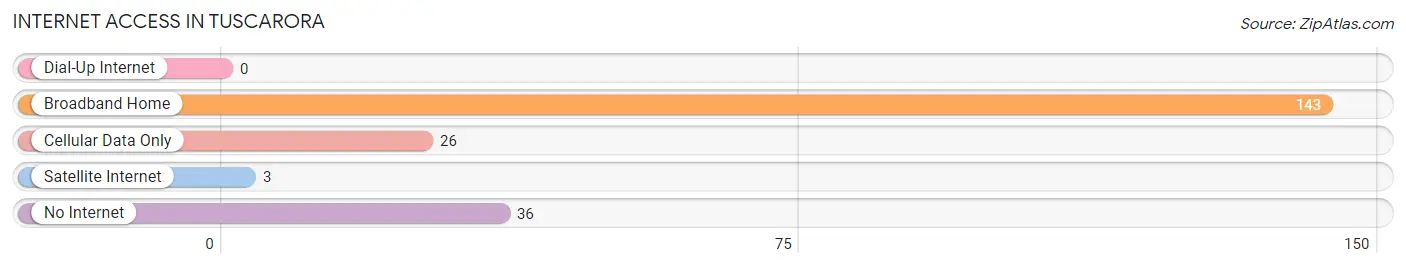
| Internet Type | # Households | % Households |
| Dial-Up Internet | 0 | 0.0% |
| Broadband Home | 143 | 68.8% |
| Cellular Data Only | 26 | 12.5% |
| Satellite Internet | 3 | 1.4% |
| No Internet | 36 | 17.3% |
| Total | 208 | 100.0% |
Tuscarora Summary
Tuscarora, Pennsylvania is a small borough located in Juniata County, Pennsylvania. It is situated in the Appalachian Mountains, and is part of the Altoona-Johnstown Metropolitan Statistical Area. The population of Tuscarora was 1,093 at the 2010 census.
History
Tuscarora was founded in 1820 by a group of settlers from the Tuscarora Indian tribe. The town was named after the tribe, which had been living in the area since the late 1700s. The town was originally a farming community, but in the late 1800s, the town began to develop into a small industrial center. The first industry in the town was a sawmill, which was built in 1875. This was followed by a grist mill, a tannery, and a brickyard.
In the early 1900s, the town began to experience a period of growth. The population increased from just over 500 in 1900 to over 1,000 by 1910. This growth was due in part to the development of the Pennsylvania Railroad, which ran through the town. The railroad provided a convenient way for people to travel to and from the town, and it also allowed for the transportation of goods and services.
The town continued to grow throughout the 20th century, and by the 2000 census, the population had reached 1,093.
Geography
Tuscarora is located in Juniata County, Pennsylvania. It is situated in the Appalachian Mountains, and is part of the Altoona-Johnstown Metropolitan Statistical Area. The town is located at an elevation of 1,068 feet (326 m).
The town is situated on the Juniata River, which flows through the town. The river is a popular destination for fishing, canoeing, and kayaking. The town is also home to several parks, including Tuscarora State Park, which offers camping, hiking, and other outdoor activities.
Economy
The economy of Tuscarora is largely based on agriculture and tourism. The town is home to several farms, which produce a variety of crops, including corn, soybeans, and hay. The town is also home to several small businesses, including restaurants, shops, and other services.
The town is also a popular tourist destination. The town is home to several historic sites, including the Tuscarora Indian Village, which was once home to the Tuscarora tribe. The town is also home to several parks, including Tuscarora State Park, which offers camping, hiking, and other outdoor activities.
Demographics
As of the 2010 census, the population of Tuscarora was 1,093. The racial makeup of the town was 97.3% White, 0.7% African American, 0.2% Native American, 0.2% Asian, 0.1% from other races, and 1.5% from two or more races. Hispanic or Latino of any race were 0.7% of the population.
The median income for a household in the town was $37,500, and the median income for a family was $45,000. The per capita income for the town was $18,945. About 11.2% of families and 14.2% of the population were below the poverty line, including 18.2% of those under age 18 and 8.3% of those age 65 or over.
Common Questions
What is Per Capita Income in Tuscarora?
Per Capita income in Tuscarora is $29,501.
What is the Median Family Income in Tuscarora?
Median Family Income in Tuscarora is $66,625.
What is the Median Household income in Tuscarora?
Median Household Income in Tuscarora is $55,357.
What is Income or Wage Gap in Tuscarora?
Income or Wage Gap in Tuscarora is 32.4%.
Women in Tuscarora earn 67.6 cents for every dollar earned by a man.
What is Inequality or Gini Index in Tuscarora?
Inequality or Gini Index in Tuscarora is 0.40.
What is the Total Population of Tuscarora?
Total Population of Tuscarora is 404.
What is the Total Male Population of Tuscarora?
Total Male Population of Tuscarora is 200.
What is the Total Female Population of Tuscarora?
Total Female Population of Tuscarora is 204.
What is the Ratio of Males per 100 Females in Tuscarora?
There are 98.04 Males per 100 Females in Tuscarora.
What is the Ratio of Females per 100 Males in Tuscarora?
There are 102.00 Females per 100 Males in Tuscarora.
What is the Median Population Age in Tuscarora?
Median Population Age in Tuscarora is 61.5 Years.
What is the Average Family Size in Tuscarora
Average Family Size in Tuscarora is 2.5 People.
What is the Average Household Size in Tuscarora
Average Household Size in Tuscarora is 1.9 People.
How Large is the Labor Force in Tuscarora?
There are 171 People in the Labor Forcein in Tuscarora.
What is the Percentage of People in the Labor Force in Tuscarora?
46.5% of People are in the Labor Force in Tuscarora.