Sweetwater, ID Map & Demographics
Sweetwater Map
Sweetwater Overview
$41,379
PER CAPITA INCOME
$123,750
AVG FAMILY INCOME
$81,458
AVG HOUSEHOLD INCOME
50.3%
WAGE / INCOME GAP [ % ]
49.7¢/ $1
WAGE / INCOME GAP [ $ ]
0.28
INEQUALITY / GINI INDEX
172
TOTAL POPULATION
110
MALE POPULATION
62
FEMALE POPULATION
177.42
MALES / 100 FEMALES
56.36
FEMALES / 100 MALES
53.2
MEDIAN AGE
3.3
AVG FAMILY SIZE
2.7
AVG HOUSEHOLD SIZE
87
LABOR FORCE [ PEOPLE ]
53.4%
PERCENT IN LABOR FORCE
Income in Sweetwater
Income Overview in Sweetwater
Per Capita Income in Sweetwater is $41,379, while median incomes of families and households are $123,750 and $81,458 respectively.
| Characteristic | Number | Measure |
| Per Capita Income | 172 | $41,379 |
| Median Family Income | 48 | $123,750 |
| Mean Family Income | 48 | $104,369 |
| Median Household Income | 63 | $81,458 |
| Mean Household Income | 63 | $89,441 |
| Income Deficit | 48 | $0 |
| Wage / Income Gap (%) | 172 | 50.33% |
| Wage / Income Gap ($) | 172 | 49.67¢ per $1 |
| Gini / Inequality Index | 172 | 0.28 |
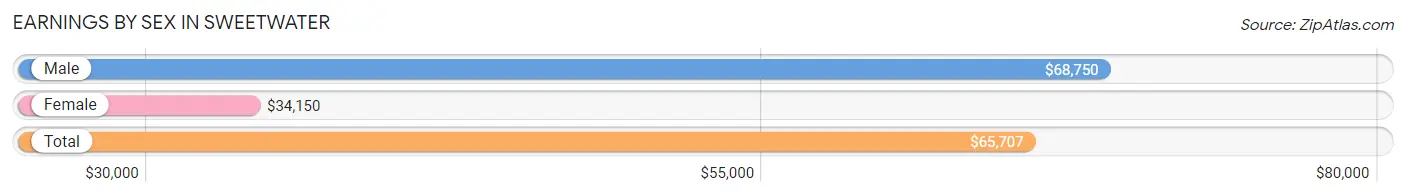
Earnings by Sex in Sweetwater
Average Earnings in Sweetwater are $65,707, $68,750 for men and $34,150 for women, a difference of 50.3%.
| Sex | Number | Average Earnings |
| Male | 54 (62.1%) | $68,750 |
| Female | 33 (37.9%) | $34,150 |
| Total | 87 (100.0%) | $65,707 |
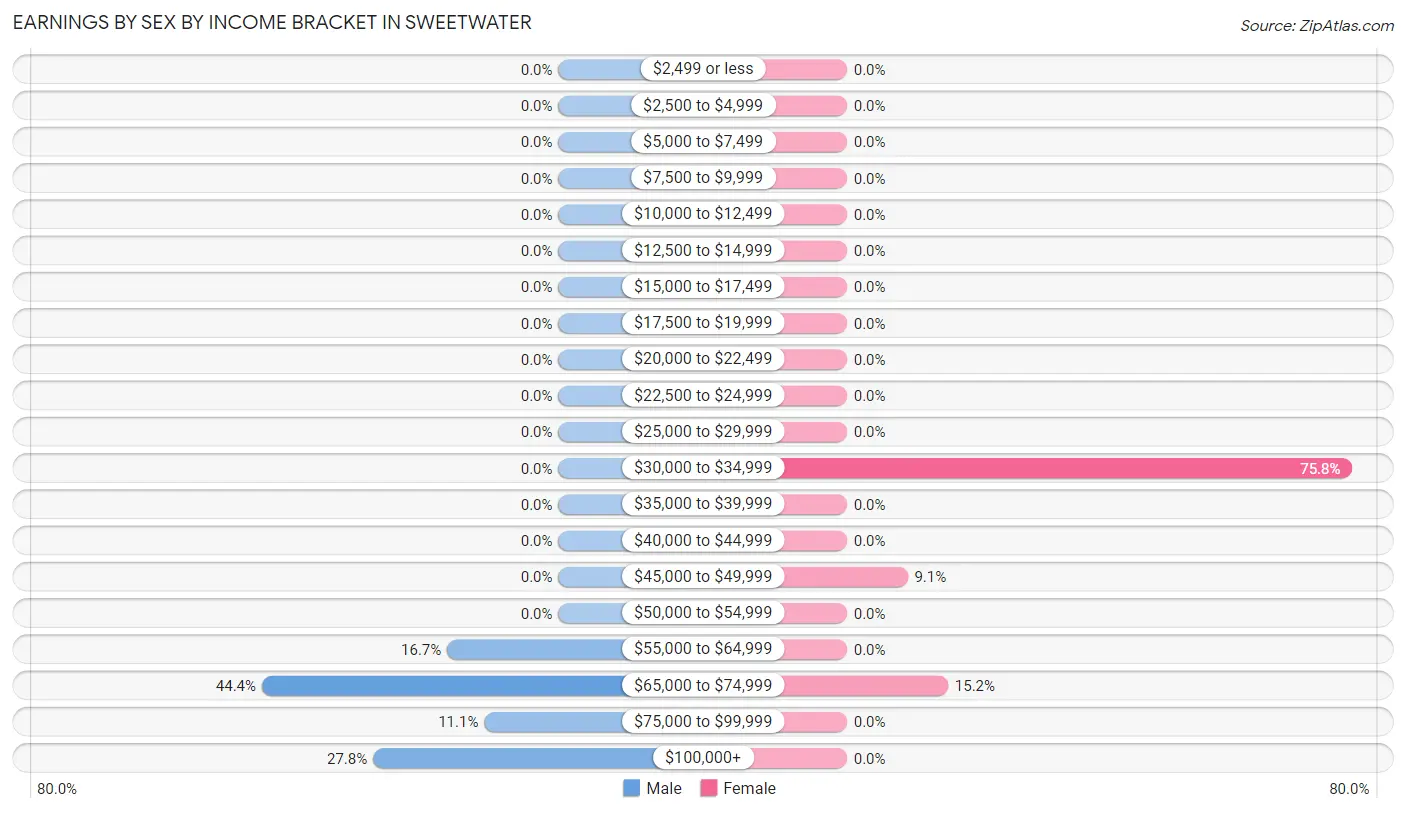
Earnings by Sex by Income Bracket in Sweetwater
The most common earnings brackets in Sweetwater are $65,000 to $74,999 for men (24 | 44.4%) and $30,000 to $34,999 for women (25 | 75.8%).
| Income | Male | Female |
| $2,499 or less | 0 (0.0%) | 0 (0.0%) |
| $2,500 to $4,999 | 0 (0.0%) | 0 (0.0%) |
| $5,000 to $7,499 | 0 (0.0%) | 0 (0.0%) |
| $7,500 to $9,999 | 0 (0.0%) | 0 (0.0%) |
| $10,000 to $12,499 | 0 (0.0%) | 0 (0.0%) |
| $12,500 to $14,999 | 0 (0.0%) | 0 (0.0%) |
| $15,000 to $17,499 | 0 (0.0%) | 0 (0.0%) |
| $17,500 to $19,999 | 0 (0.0%) | 0 (0.0%) |
| $20,000 to $22,499 | 0 (0.0%) | 0 (0.0%) |
| $22,500 to $24,999 | 0 (0.0%) | 0 (0.0%) |
| $25,000 to $29,999 | 0 (0.0%) | 0 (0.0%) |
| $30,000 to $34,999 | 0 (0.0%) | 25 (75.8%) |
| $35,000 to $39,999 | 0 (0.0%) | 0 (0.0%) |
| $40,000 to $44,999 | 0 (0.0%) | 0 (0.0%) |
| $45,000 to $49,999 | 0 (0.0%) | 3 (9.1%) |
| $50,000 to $54,999 | 0 (0.0%) | 0 (0.0%) |
| $55,000 to $64,999 | 9 (16.7%) | 0 (0.0%) |
| $65,000 to $74,999 | 24 (44.4%) | 5 (15.1%) |
| $75,000 to $99,999 | 6 (11.1%) | 0 (0.0%) |
| $100,000+ | 15 (27.8%) | 0 (0.0%) |
| Total | 54 (100.0%) | 33 (100.0%) |
Earnings by Sex by Educational Attainment in Sweetwater
| Educational Attainment | Male Income | Female Income |
| Less than High School | - | - |
| High School Diploma | - | - |
| College or Associate's Degree | - | - |
| Bachelor's Degree | - | - |
| Graduate Degree | - | - |
| Total | $68,750 | $34,150 |
Family Income in Sweetwater
Family Income Brackets in Sweetwater
According to the Sweetwater family income data, there are 29 families falling into the $100,000 to $149,999 income range, which is the most common income bracket and makes up 60.4% of all families.
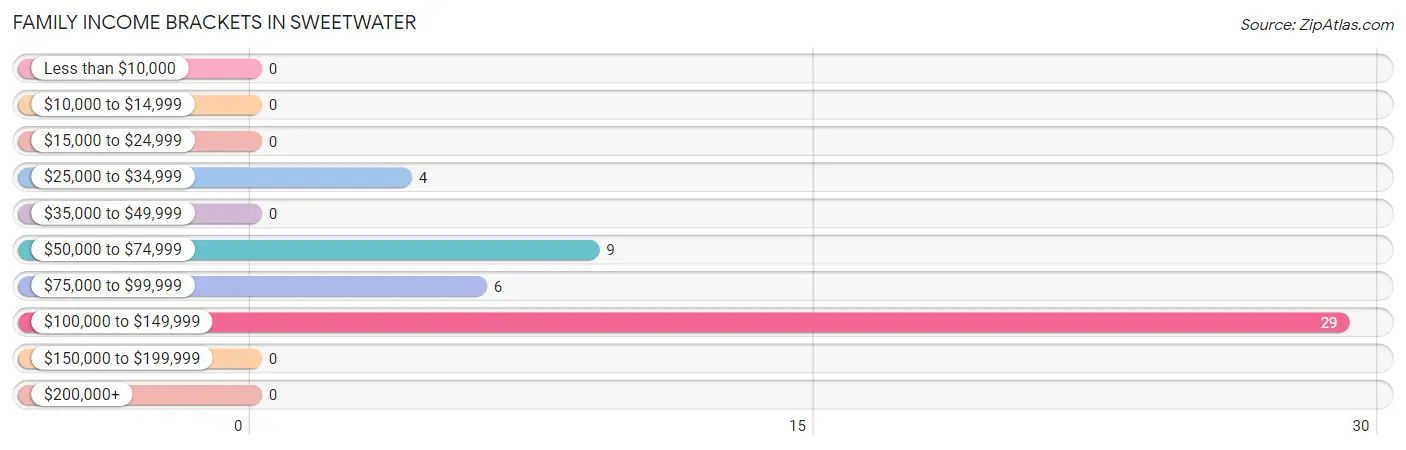
| Income Bracket | # Families | % Families |
| Less than $10,000 | 0 | 0.0% |
| $10,000 to $14,999 | 0 | 0.0% |
| $15,000 to $24,999 | 0 | 0.0% |
| $25,000 to $34,999 | 4 | 8.3% |
| $35,000 to $49,999 | 0 | 0.0% |
| $50,000 to $74,999 | 9 | 18.8% |
| $75,000 to $99,999 | 6 | 12.5% |
| $100,000 to $149,999 | 29 | 60.4% |
| $150,000 to $199,999 | 0 | 0.0% |
| $200,000+ | 0 | 0.0% |
Family Income by Famaliy Size in Sweetwater
2-person families (19 | 39.6%) account for the highest median family income in Sweetwater with $61,528 per family, while 2-person families (19 | 39.6%) have the highest median income of $30,764 per family member.
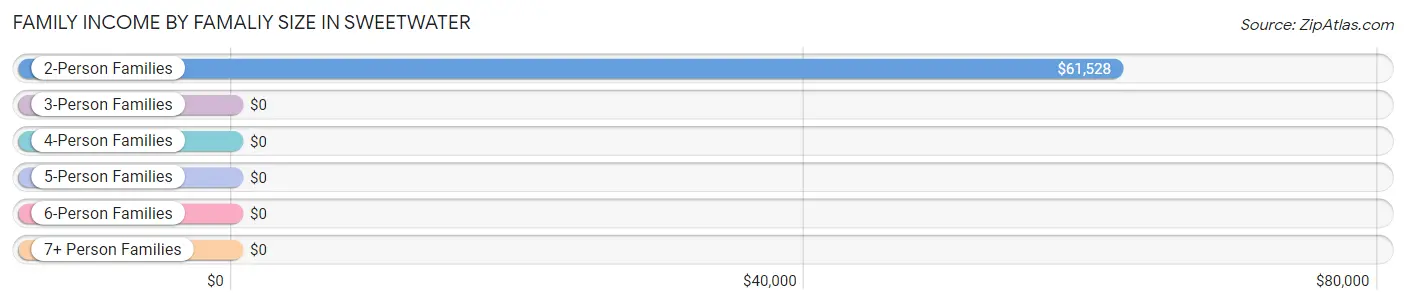
| Income Bracket | # Families | Median Income |
| 2-Person Families | 19 (39.6%) | $61,528 |
| 3-Person Families | 14 (29.2%) | $0 |
| 4-Person Families | 15 (31.2%) | $0 |
| 5-Person Families | 0 (0.0%) | $0 |
| 6-Person Families | 0 (0.0%) | $0 |
| 7+ Person Families | 0 (0.0%) | $0 |
| Total | 48 (100.0%) | $123,750 |
Family Income by Number of Earners in Sweetwater
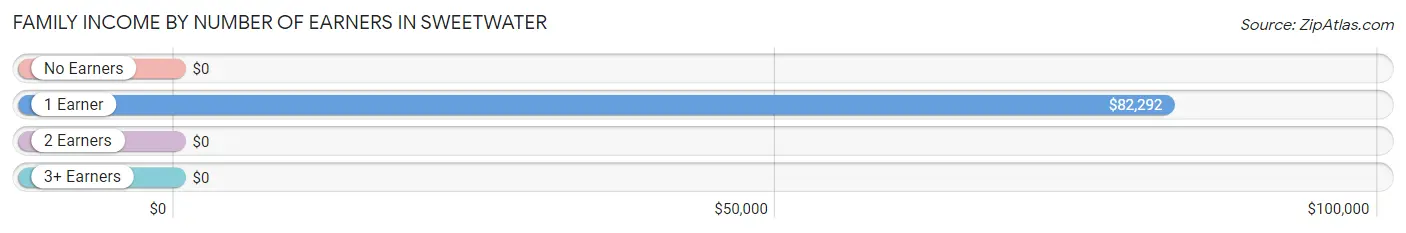
| Number of Earners | # Families | Median Income |
| No Earners | 4 (8.3%) | $0 |
| 1 Earner | 29 (60.4%) | $82,292 |
| 2 Earners | 15 (31.2%) | $0 |
| 3+ Earners | 0 (0.0%) | $0 |
| Total | 48 (100.0%) | $123,750 |
Household Income in Sweetwater
Household Income Brackets in Sweetwater
With 29 households falling in the category, the $100,000 to $149,999 income range is the most frequent in Sweetwater, accounting for 46.0% of all households.
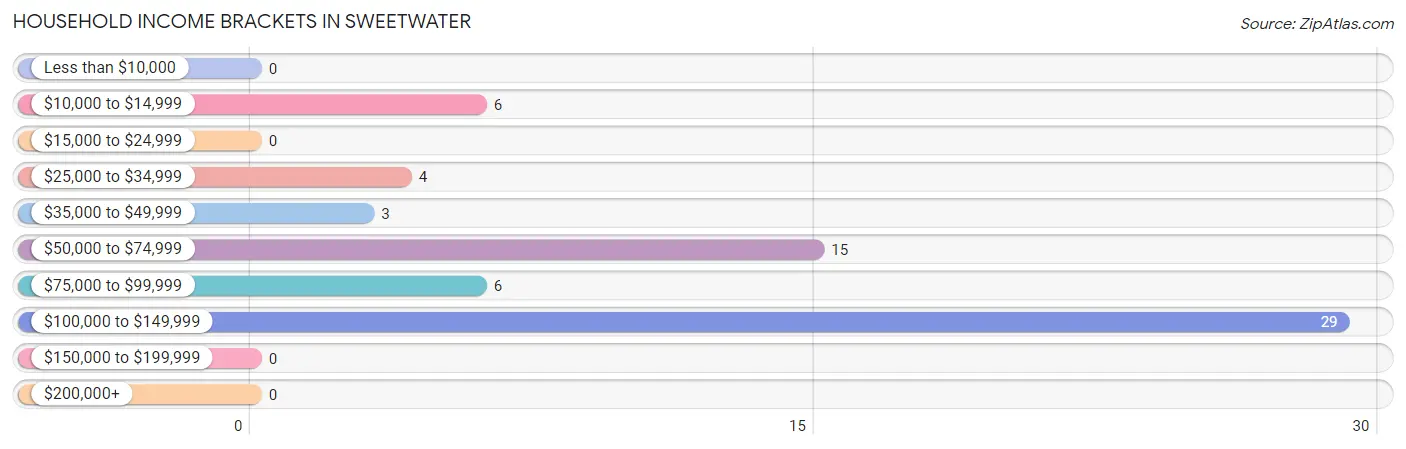
| Income Bracket | # Households | % Households |
| Less than $10,000 | 0 | 0.0% |
| $10,000 to $14,999 | 6 | 9.5% |
| $15,000 to $24,999 | 0 | 0.0% |
| $25,000 to $34,999 | 4 | 6.3% |
| $35,000 to $49,999 | 3 | 4.8% |
| $50,000 to $74,999 | 15 | 23.8% |
| $75,000 to $99,999 | 6 | 9.5% |
| $100,000 to $149,999 | 29 | 46.0% |
| $150,000 to $199,999 | 0 | 0.0% |
| $200,000+ | 0 | 0.0% |
Household Income by Householder Age in Sweetwater
| Income Bracket | # Households | Median Income |
| 15 to 24 Years | 0 (0.0%) | $0 |
| 25 to 44 Years | 3 (4.8%) | $0 |
| 45 to 64 Years | 49 (77.8%) | $0 |
| 65+ Years | 11 (17.5%) | $0 |
| Total | 63 (100.0%) | $81,458 |
Poverty in Sweetwater
Income Below Poverty by Sex and Age in Sweetwater
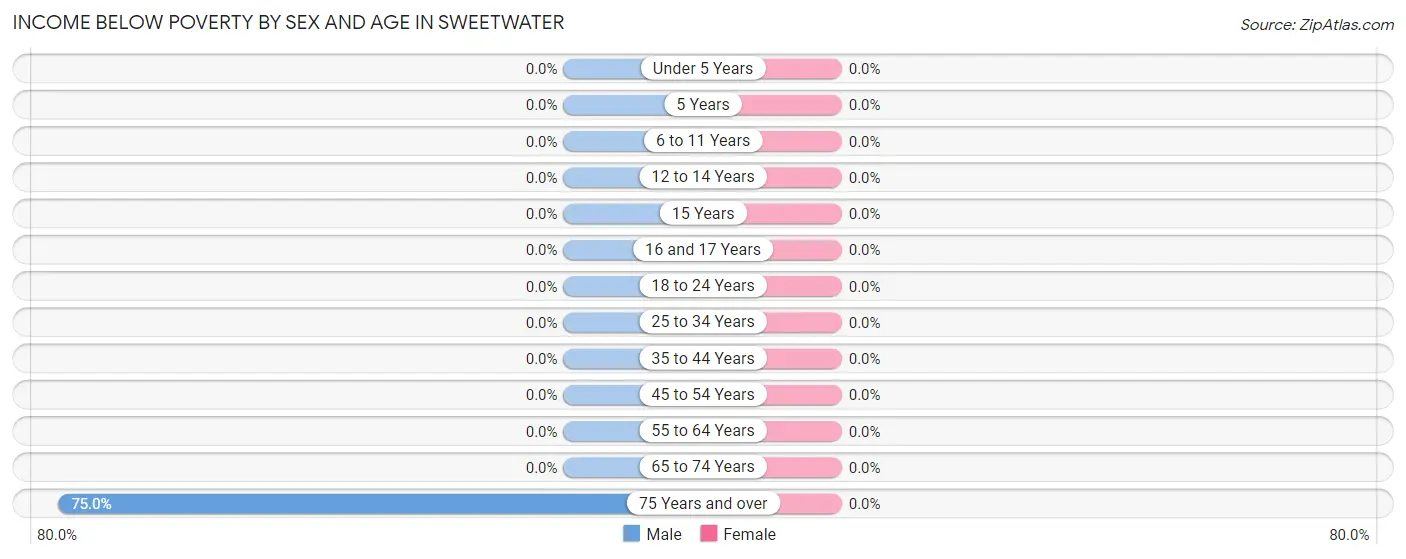
| Age Bracket | Male | Female |
| Under 5 Years | 0 (0.0%) | 0 (0.0%) |
| 5 Years | 0 (0.0%) | 0 (0.0%) |
| 6 to 11 Years | 0 (0.0%) | 0 (0.0%) |
| 12 to 14 Years | 0 (0.0%) | 0 (0.0%) |
| 15 Years | 0 (0.0%) | 0 (0.0%) |
| 16 and 17 Years | 0 (0.0%) | 0 (0.0%) |
| 18 to 24 Years | 0 (0.0%) | 0 (0.0%) |
| 25 to 34 Years | 0 (0.0%) | 0 (0.0%) |
| 35 to 44 Years | 0 (0.0%) | 0 (0.0%) |
| 45 to 54 Years | 0 (0.0%) | 0 (0.0%) |
| 55 to 64 Years | 0 (0.0%) | 0 (0.0%) |
| 65 to 74 Years | 0 (0.0%) | 0 (0.0%) |
| 75 Years and over | 6 (75.0%) | 0 (0.0%) |
| Total | 6 (5.4%) | 0 (0.0%) |
Income Above Poverty by Sex and Age in Sweetwater
According to the poverty statistics in Sweetwater, males aged 16 and 17 years and females aged 5 years are the age groups that are most secure financially, with 100.0% of males and 100.0% of females in these age groups living above the poverty line.
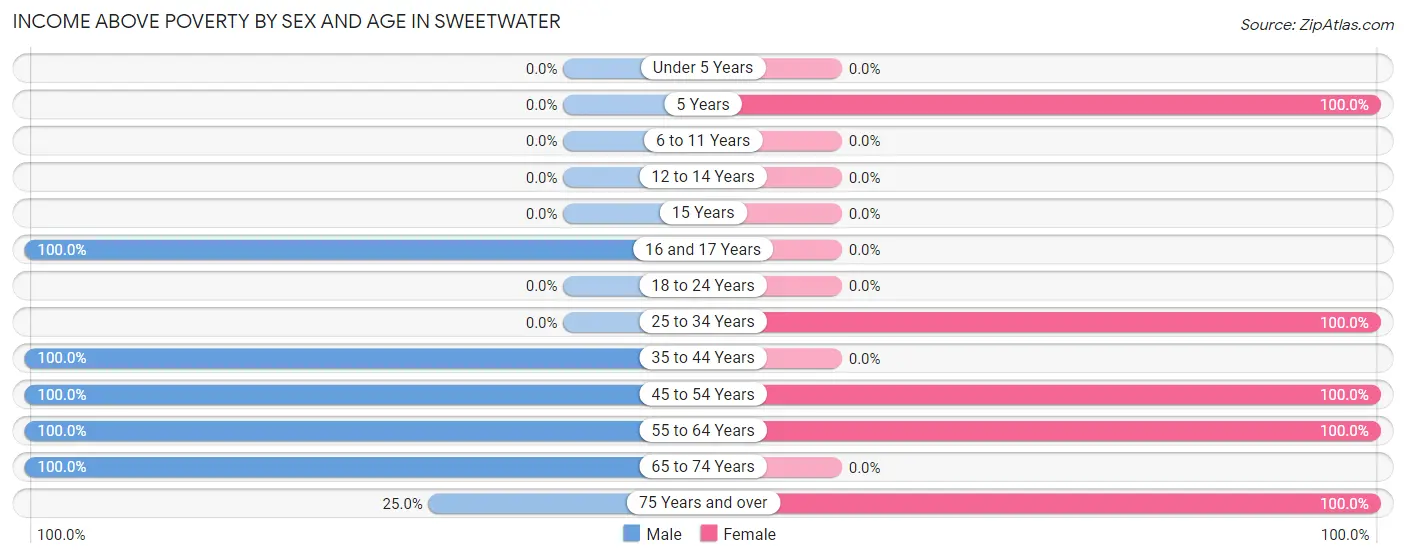
| Age Bracket | Male | Female |
| Under 5 Years | 0 (0.0%) | 0 (0.0%) |
| 5 Years | 0 (0.0%) | 9 (100.0%) |
| 6 to 11 Years | 0 (0.0%) | 0 (0.0%) |
| 12 to 14 Years | 0 (0.0%) | 0 (0.0%) |
| 15 Years | 0 (0.0%) | 0 (0.0%) |
| 16 and 17 Years | 13 (100.0%) | 0 (0.0%) |
| 18 to 24 Years | 0 (0.0%) | 0 (0.0%) |
| 25 to 34 Years | 0 (0.0%) | 3 (100.0%) |
| 35 to 44 Years | 18 (100.0%) | 0 (0.0%) |
| 45 to 54 Years | 24 (100.0%) | 30 (100.0%) |
| 55 to 64 Years | 40 (100.0%) | 15 (100.0%) |
| 65 to 74 Years | 7 (100.0%) | 0 (0.0%) |
| 75 Years and over | 2 (25.0%) | 5 (100.0%) |
| Total | 104 (94.6%) | 62 (100.0%) |
Income Below Poverty Among Married-Couple Families in Sweetwater
| Children | Above Poverty | Below Poverty |
| No Children | 20 (100.0%) | 0 (0.0%) |
| 1 or 2 Children | 15 (100.0%) | 0 (0.0%) |
| 3 or 4 Children | 0 (0.0%) | 0 (0.0%) |
| 5 or more Children | 0 (0.0%) | 0 (0.0%) |
| Total | 35 (100.0%) | 0 (0.0%) |
Income Below Poverty Among Single-Parent Households in Sweetwater
| Children | Single Father | Single Mother |
| No Children | 0 (0.0%) | 0 (0.0%) |
| 1 or 2 Children | 0 (0.0%) | 0 (0.0%) |
| 3 or 4 Children | 0 (0.0%) | 0 (0.0%) |
| 5 or more Children | 0 (0.0%) | 0 (0.0%) |
| Total | 0 (0.0%) | 0 (0.0%) |
Income Below Poverty Among Married-Couple vs Single-Parent Households in Sweetwater
| Children | Married-Couple Families | Single-Parent Households |
| No Children | 0 (0.0%) | 0 (0.0%) |
| 1 or 2 Children | 0 (0.0%) | 0 (0.0%) |
| 3 or 4 Children | 0 (0.0%) | 0 (0.0%) |
| 5 or more Children | 0 (0.0%) | 0 (0.0%) |
| Total | 0 (0.0%) | 0 (0.0%) |
Race in Sweetwater
The most populous races in Sweetwater are Native / Alaskan (94 | 54.6%), and White / Caucasian (78 | 45.4%).
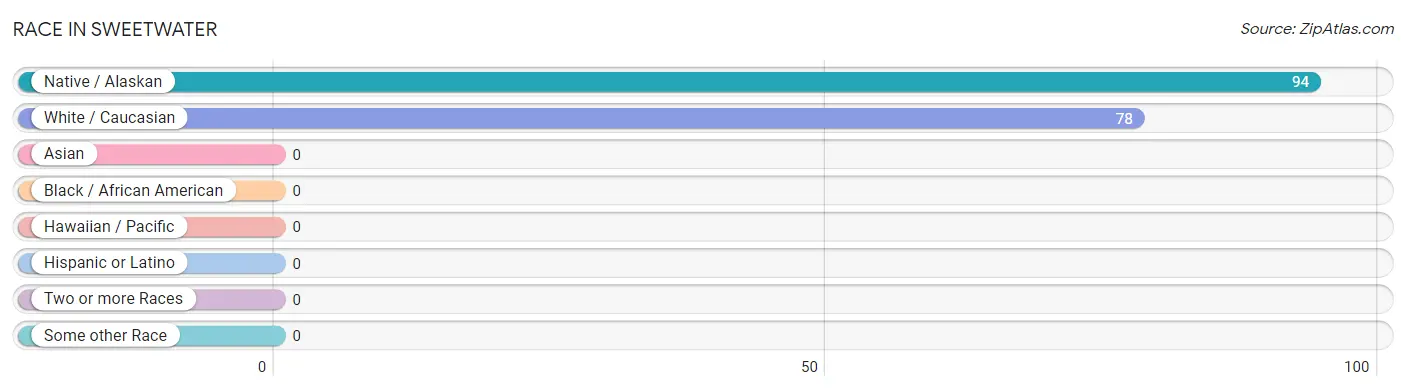
| Race | # Population | % Population |
| Asian | 0 | 0.0% |
| Black / African American | 0 | 0.0% |
| Hawaiian / Pacific | 0 | 0.0% |
| Hispanic or Latino | 0 | 0.0% |
| Native / Alaskan | 94 | 54.6% |
| White / Caucasian | 78 | 45.4% |
| Two or more Races | 0 | 0.0% |
| Some other Race | 0 | 0.0% |
| Total | 172 | 100.0% |
Ancestry in Sweetwater
The most populous ancestries reported in Sweetwater are Yakama (39 | 22.7%), German (12 | 7.0%), Irish (12 | 7.0%), and American (7 | 4.1%), together accounting for 40.7% of all Sweetwater residents.
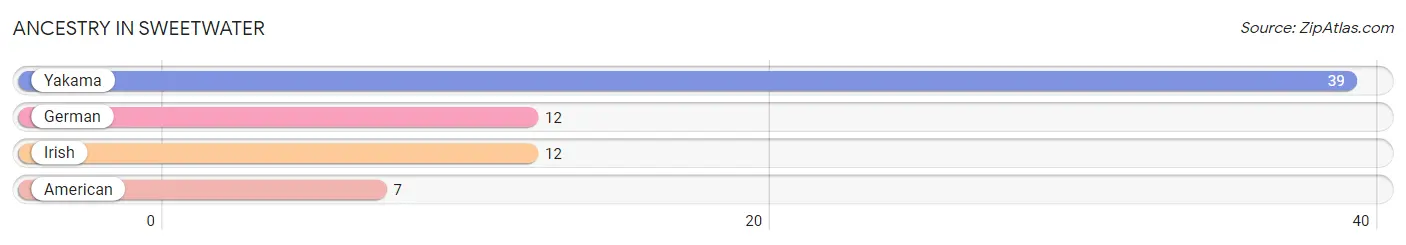
| Ancestry | # Population | % Population |
| American | 7 | 4.1% |
| German | 12 | 7.0% |
| Irish | 12 | 7.0% |
| Yakama | 39 | 22.7% | View All 4 Rows |
Immigrants in Sweetwater

| Immigration Origin | # Population | % Population | View All 0 Rows |
Sex and Age in Sweetwater
Sex and Age in Sweetwater
The most populous age groups in Sweetwater are 60 to 64 Years (24 | 21.8%) for men and 45 to 49 Years (25 | 40.3%) for women.
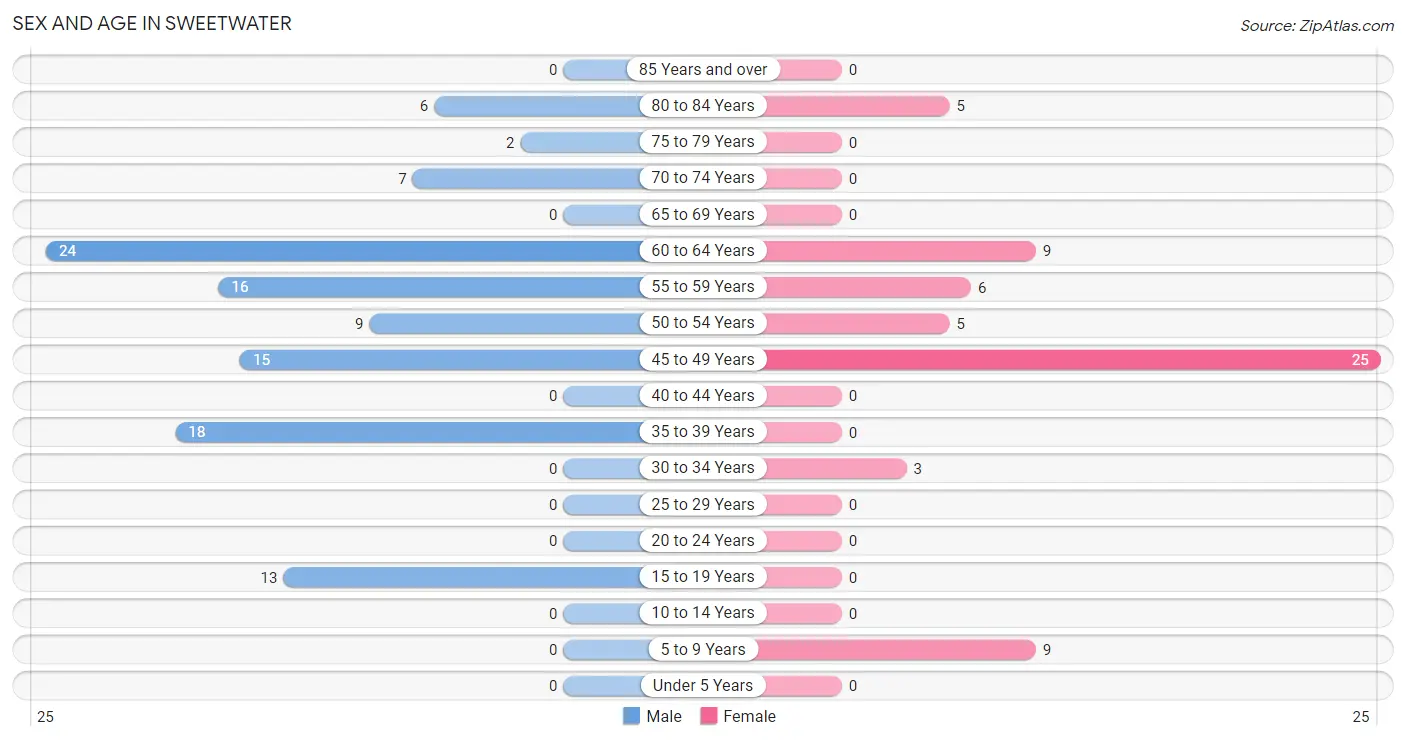
| Age Bracket | Male | Female |
| Under 5 Years | 0 (0.0%) | 0 (0.0%) |
| 5 to 9 Years | 0 (0.0%) | 9 (14.5%) |
| 10 to 14 Years | 0 (0.0%) | 0 (0.0%) |
| 15 to 19 Years | 13 (11.8%) | 0 (0.0%) |
| 20 to 24 Years | 0 (0.0%) | 0 (0.0%) |
| 25 to 29 Years | 0 (0.0%) | 0 (0.0%) |
| 30 to 34 Years | 0 (0.0%) | 3 (4.8%) |
| 35 to 39 Years | 18 (16.4%) | 0 (0.0%) |
| 40 to 44 Years | 0 (0.0%) | 0 (0.0%) |
| 45 to 49 Years | 15 (13.6%) | 25 (40.3%) |
| 50 to 54 Years | 9 (8.2%) | 5 (8.1%) |
| 55 to 59 Years | 16 (14.5%) | 6 (9.7%) |
| 60 to 64 Years | 24 (21.8%) | 9 (14.5%) |
| 65 to 69 Years | 0 (0.0%) | 0 (0.0%) |
| 70 to 74 Years | 7 (6.4%) | 0 (0.0%) |
| 75 to 79 Years | 2 (1.8%) | 0 (0.0%) |
| 80 to 84 Years | 6 (5.4%) | 5 (8.1%) |
| 85 Years and over | 0 (0.0%) | 0 (0.0%) |
| Total | 110 (100.0%) | 62 (100.0%) |
Families and Households in Sweetwater
Median Family Size in Sweetwater
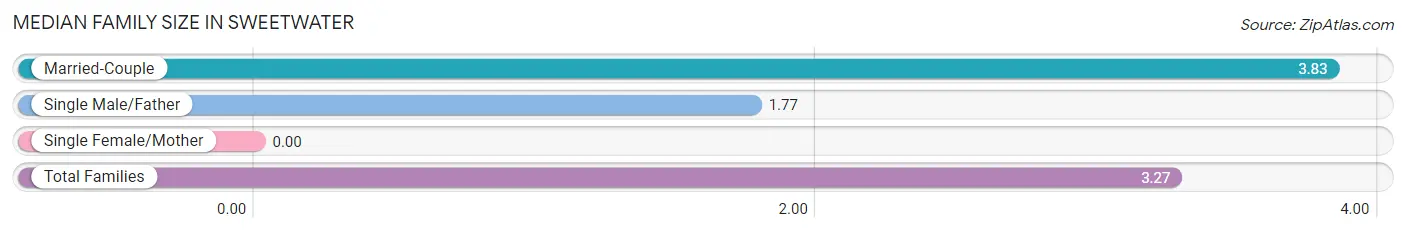
| Family Type | # Families | Family Size |
| Married-Couple | 35 (72.9%) | 3.83 |
| Single Male/Father | 13 (27.1%) | 1.77 |
| Single Female/Mother | 0 (0.0%) | - |
| Total Families | 48 (100.0%) | 3.27 |
Median Household Size in Sweetwater
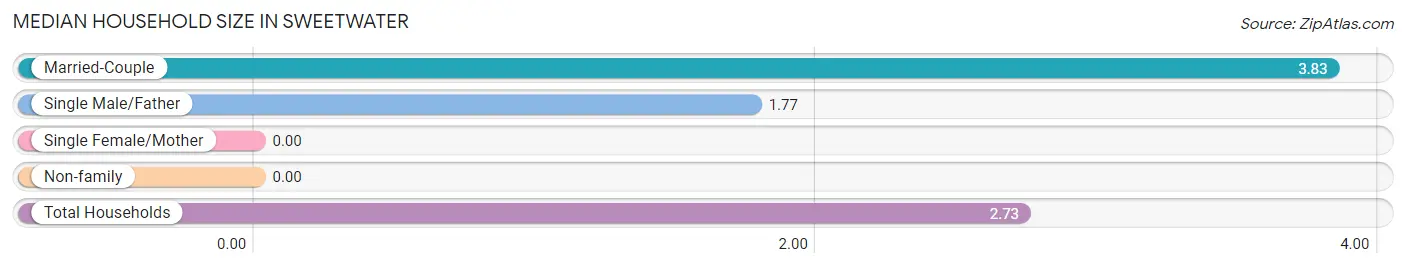
| Household Type | # Households | Household Size |
| Married-Couple | 35 (55.6%) | 3.83 |
| Single Male/Father | 13 (20.6%) | 1.77 |
| Single Female/Mother | 0 (0.0%) | - |
| Non-family | 15 (23.8%) | - |
| Total Households | 63 (100.0%) | 2.73 |
Household Size by Marriage Status in Sweetwater
Out of a total of 63 households in Sweetwater, 48 (76.2%) are family households, while 15 (23.8%) are nonfamily households. The most numerous type of family households are 2-person households, comprising 19, and the most common type of nonfamily households are 1-person households, comprising 15.
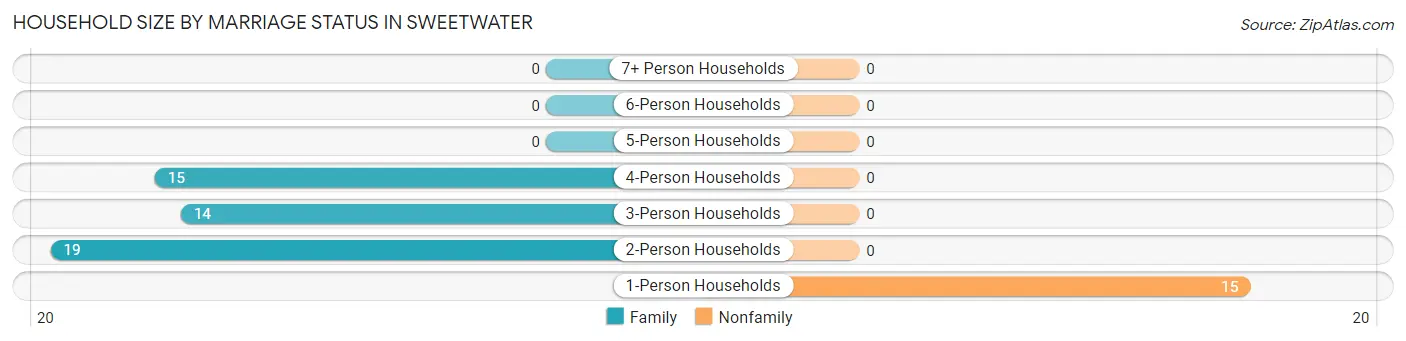
| Household Size | Family Households | Nonfamily Households |
| 1-Person Households | - | 15 (23.8%) |
| 2-Person Households | 19 (30.2%) | 0 (0.0%) |
| 3-Person Households | 14 (22.2%) | 0 (0.0%) |
| 4-Person Households | 15 (23.8%) | 0 (0.0%) |
| 5-Person Households | 0 (0.0%) | 0 (0.0%) |
| 6-Person Households | 0 (0.0%) | 0 (0.0%) |
| 7+ Person Households | 0 (0.0%) | 0 (0.0%) |
| Total | 48 (76.2%) | 15 (23.8%) |
Female Fertility in Sweetwater
Fertility by Age in Sweetwater
| Age Bracket | Women with Births | Births / 1,000 Women |
| 15 to 19 years | 0 (0.0%) | 0.0 |
| 20 to 34 years | 0 (0.0%) | 0.0 |
| 35 to 50 years | 0 (0.0%) | 0.0 |
| Total | 0 (0.0%) | 0.0 |
Fertility by Age by Marriage Status in Sweetwater
| Age Bracket | Married | Unmarried |
| 15 to 19 years | 0 (0.0%) | 0 (0.0%) |
| 20 to 34 years | 0 (0.0%) | 0 (0.0%) |
| 35 to 50 years | 0 (0.0%) | 0 (0.0%) |
| Total | 0 (0.0%) | 0 (0.0%) |
Fertility by Education in Sweetwater
| Educational Attainment | Women with Births | Births / 1,000 Women |
| Less than High School | 0 (0.0%) | 0.0 |
| High School Diploma | 0 (0.0%) | 0.0 |
| College or Associate's Degree | 0 (0.0%) | 0.0 |
| Bachelor's Degree | 0 (0.0%) | 0.0 |
| Graduate Degree | 0 (0.0%) | 0.0 |
| Total | 0 (0.0%) | 0.0 |
Fertility by Education by Marriage Status in Sweetwater
| Educational Attainment | Married | Unmarried |
| Less than High School | 0 (0.0%) | 0 (0.0%) |
| High School Diploma | 0 (0.0%) | 0 (0.0%) |
| College or Associate's Degree | 0 (0.0%) | 0 (0.0%) |
| Bachelor's Degree | 0 (0.0%) | 0 (0.0%) |
| Graduate Degree | 0 (0.0%) | 0 (0.0%) |
| Total | 0 (0.0%) | 0 (0.0%) |
Employment Characteristics in Sweetwater
Employment by Class of Employer in Sweetwater
Among the 87 employed individuals in Sweetwater, local government employees (45 | 51.7%), private company employees (27 | 31.0%), and federal government employees (15 | 17.2%) make up the most common classes of employment.
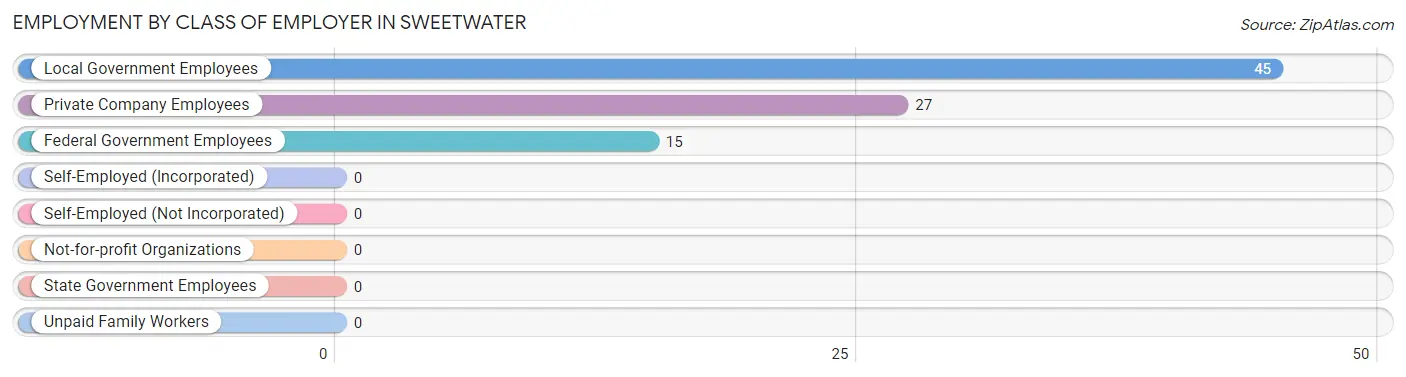
| Employer Class | # Employees | % Employees |
| Private Company Employees | 27 | 31.0% |
| Self-Employed (Incorporated) | 0 | 0.0% |
| Self-Employed (Not Incorporated) | 0 | 0.0% |
| Not-for-profit Organizations | 0 | 0.0% |
| Local Government Employees | 45 | 51.7% |
| State Government Employees | 0 | 0.0% |
| Federal Government Employees | 15 | 17.2% |
| Unpaid Family Workers | 0 | 0.0% |
| Total | 87 | 100.0% |
Employment Status by Age in Sweetwater
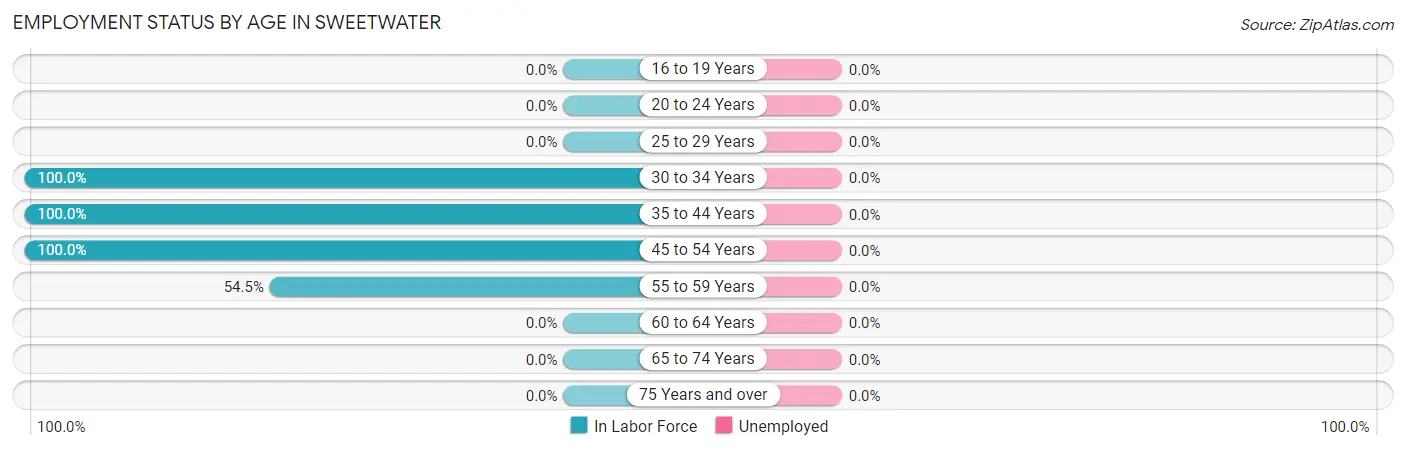
| Age Bracket | In Labor Force | Unemployed |
| 16 to 19 Years | 0 (0.0%) | 0 (0.0%) |
| 20 to 24 Years | 0 (0.0%) | 0 (0.0%) |
| 25 to 29 Years | 0 (0.0%) | 0 (0.0%) |
| 30 to 34 Years | 3 (100.0%) | 0 (0.0%) |
| 35 to 44 Years | 18 (100.0%) | 0 (0.0%) |
| 45 to 54 Years | 54 (100.0%) | 0 (0.0%) |
| 55 to 59 Years | 12 (54.5%) | 0 (0.0%) |
| 60 to 64 Years | 0 (0.0%) | 0 (0.0%) |
| 65 to 74 Years | 0 (0.0%) | 0 (0.0%) |
| 75 Years and over | 0 (0.0%) | 0 (0.0%) |
| Total | 87 (53.4%) | 0 (0.0%) |
Employment Status by Educational Attainment in Sweetwater
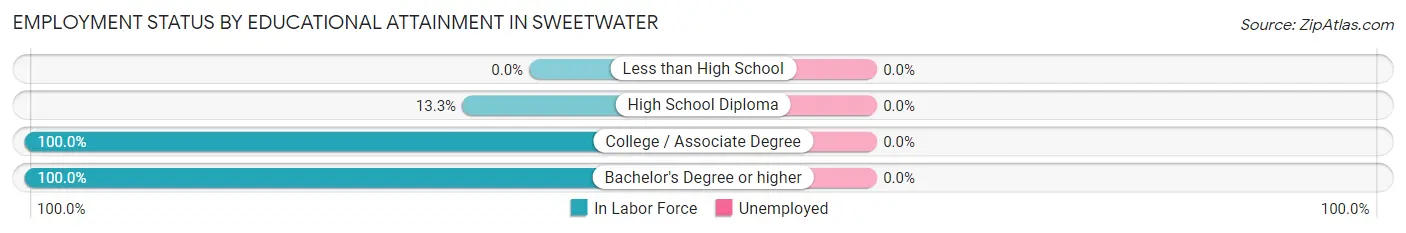
| Educational Attainment | In Labor Force | Unemployed |
| Less than High School | 0 (0.0%) | 0 (0.0%) |
| High School Diploma | 6 (13.3%) | 0 (0.0%) |
| College / Associate Degree | 35 (100.0%) | 0 (0.0%) |
| Bachelor's Degree or higher | 46 (100.0%) | 0 (0.0%) |
| Total | 87 (66.9%) | 0 (0.0%) |
Employment Occupations by Sex in Sweetwater
Management, Business, Science and Arts Occupations
The most common Management, Business, Science and Arts occupations in Sweetwater are Management (21 | 24.1%), Community & Social Service (5 | 5.8%), and Education Instruction & Library (5 | 5.8%).
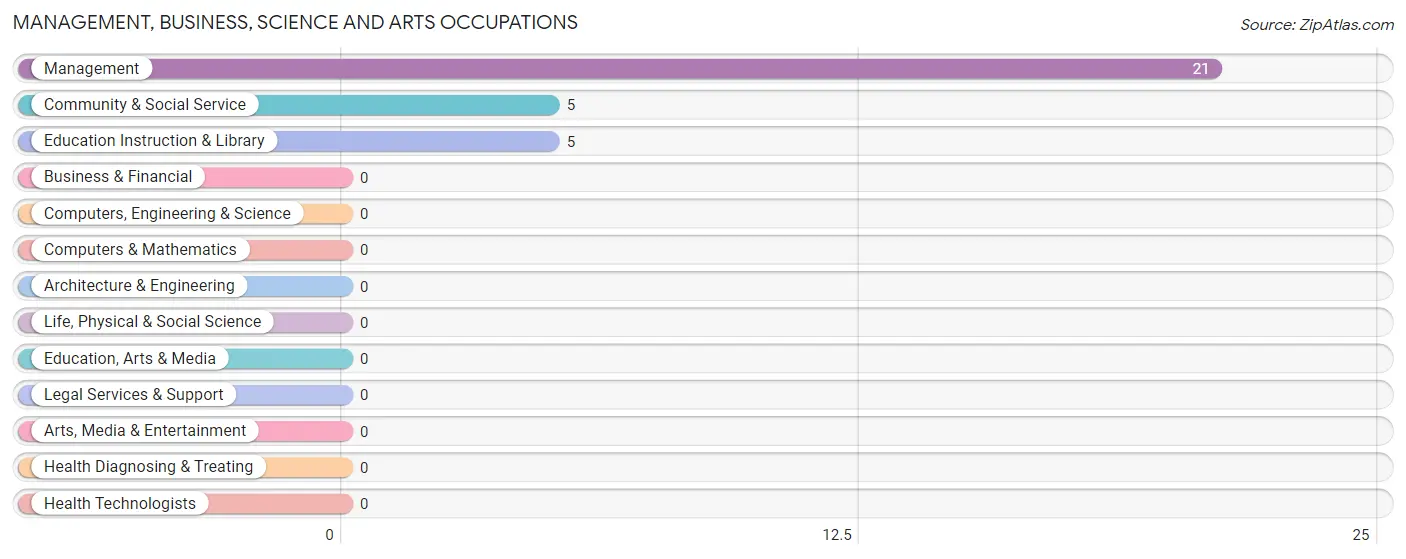
Management, Business, Science and Arts Occupations by Sex
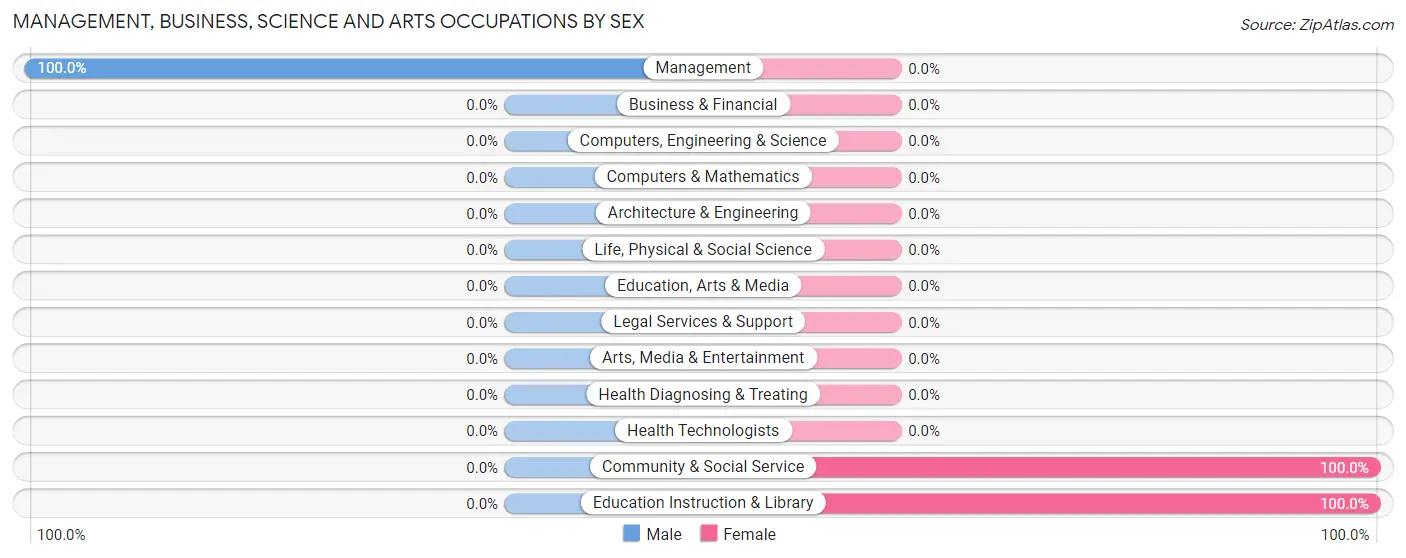
| Occupation | Male | Female |
| Management | 21 (100.0%) | 0 (0.0%) |
| Business & Financial | 0 (0.0%) | 0 (0.0%) |
| Computers, Engineering & Science | 0 (0.0%) | 0 (0.0%) |
| Computers & Mathematics | 0 (0.0%) | 0 (0.0%) |
| Architecture & Engineering | 0 (0.0%) | 0 (0.0%) |
| Life, Physical & Social Science | 0 (0.0%) | 0 (0.0%) |
| Community & Social Service | 0 (0.0%) | 5 (100.0%) |
| Education, Arts & Media | 0 (0.0%) | 0 (0.0%) |
| Legal Services & Support | 0 (0.0%) | 0 (0.0%) |
| Education Instruction & Library | 0 (0.0%) | 5 (100.0%) |
| Arts, Media & Entertainment | 0 (0.0%) | 0 (0.0%) |
| Health Diagnosing & Treating | 0 (0.0%) | 0 (0.0%) |
| Health Technologists | 0 (0.0%) | 0 (0.0%) |
| Total (Category) | 21 (80.8%) | 5 (19.2%) |
| Total (Overall) | 54 (62.1%) | 33 (37.9%) |
Services Occupations
Services Occupations by Sex
| Occupation | Male | Female |
| Healthcare Support | 0 (0.0%) | 0 (0.0%) |
| Security & Protection | 0 (0.0%) | 0 (0.0%) |
| Firefighting & Prevention | 0 (0.0%) | 0 (0.0%) |
| Law Enforcement | 0 (0.0%) | 0 (0.0%) |
| Food Preparation & Serving | 0 (0.0%) | 0 (0.0%) |
| Cleaning & Maintenance | 0 (0.0%) | 0 (0.0%) |
| Personal Care & Service | 0 (0.0%) | 0 (0.0%) |
| Total (Category) | 0 (0.0%) | 0 (0.0%) |
| Total (Overall) | 54 (62.1%) | 33 (37.9%) |
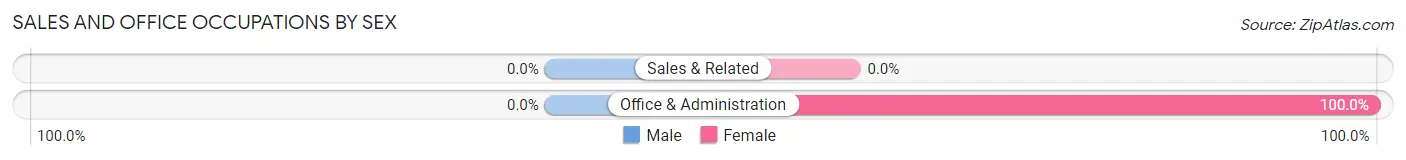
Sales and Office Occupations
The most common Sales and Office occupations in Sweetwater are , and Office & Administration (28 | 32.2%).
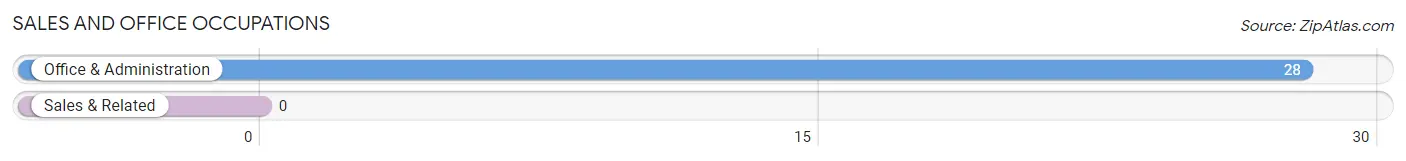
Sales and Office Occupations by Sex
| Occupation | Male | Female |
| Sales & Related | 0 (0.0%) | 0 (0.0%) |
| Office & Administration | 0 (0.0%) | 28 (100.0%) |
| Total (Category) | 0 (0.0%) | 28 (100.0%) |
| Total (Overall) | 54 (62.1%) | 33 (37.9%) |
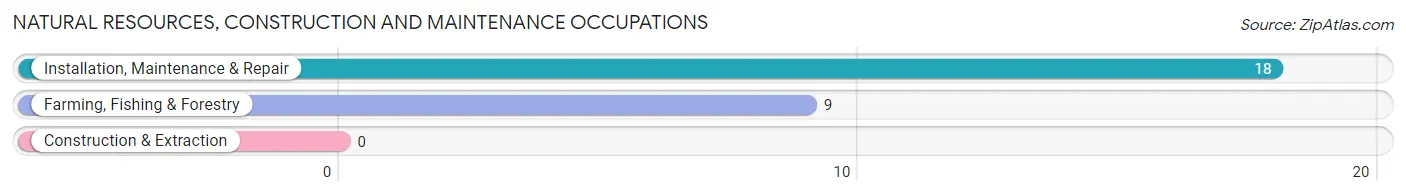
Natural Resources, Construction and Maintenance Occupations
The most common Natural Resources, Construction and Maintenance occupations in Sweetwater are Installation, Maintenance & Repair (18 | 20.7%), and Farming, Fishing & Forestry (9 | 10.3%).
Natural Resources, Construction and Maintenance Occupations by Sex
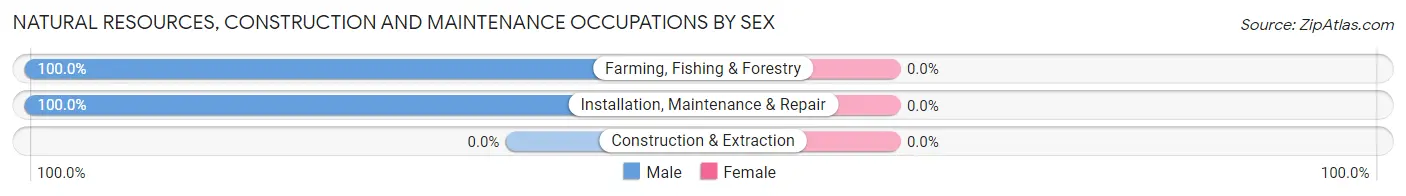
| Occupation | Male | Female |
| Farming, Fishing & Forestry | 9 (100.0%) | 0 (0.0%) |
| Construction & Extraction | 0 (0.0%) | 0 (0.0%) |
| Installation, Maintenance & Repair | 18 (100.0%) | 0 (0.0%) |
| Total (Category) | 27 (100.0%) | 0 (0.0%) |
| Total (Overall) | 54 (62.1%) | 33 (37.9%) |
Production, Transportation and Moving Occupations
The most common Production, Transportation and Moving occupations in Sweetwater are , and Transportation (6 | 6.9%).
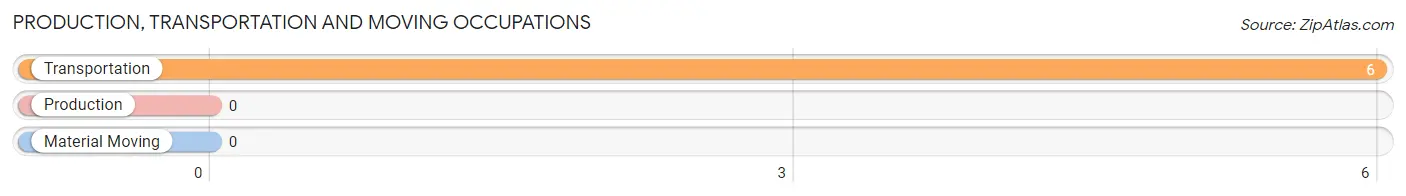
Production, Transportation and Moving Occupations by Sex
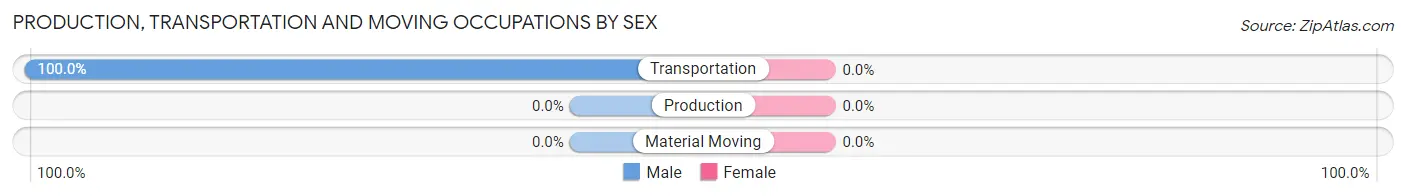
| Occupation | Male | Female |
| Production | 0 (0.0%) | 0 (0.0%) |
| Transportation | 6 (100.0%) | 0 (0.0%) |
| Material Moving | 0 (0.0%) | 0 (0.0%) |
| Total (Category) | 6 (100.0%) | 0 (0.0%) |
| Total (Overall) | 54 (62.1%) | 33 (37.9%) |
Employment Industries by Sex in Sweetwater
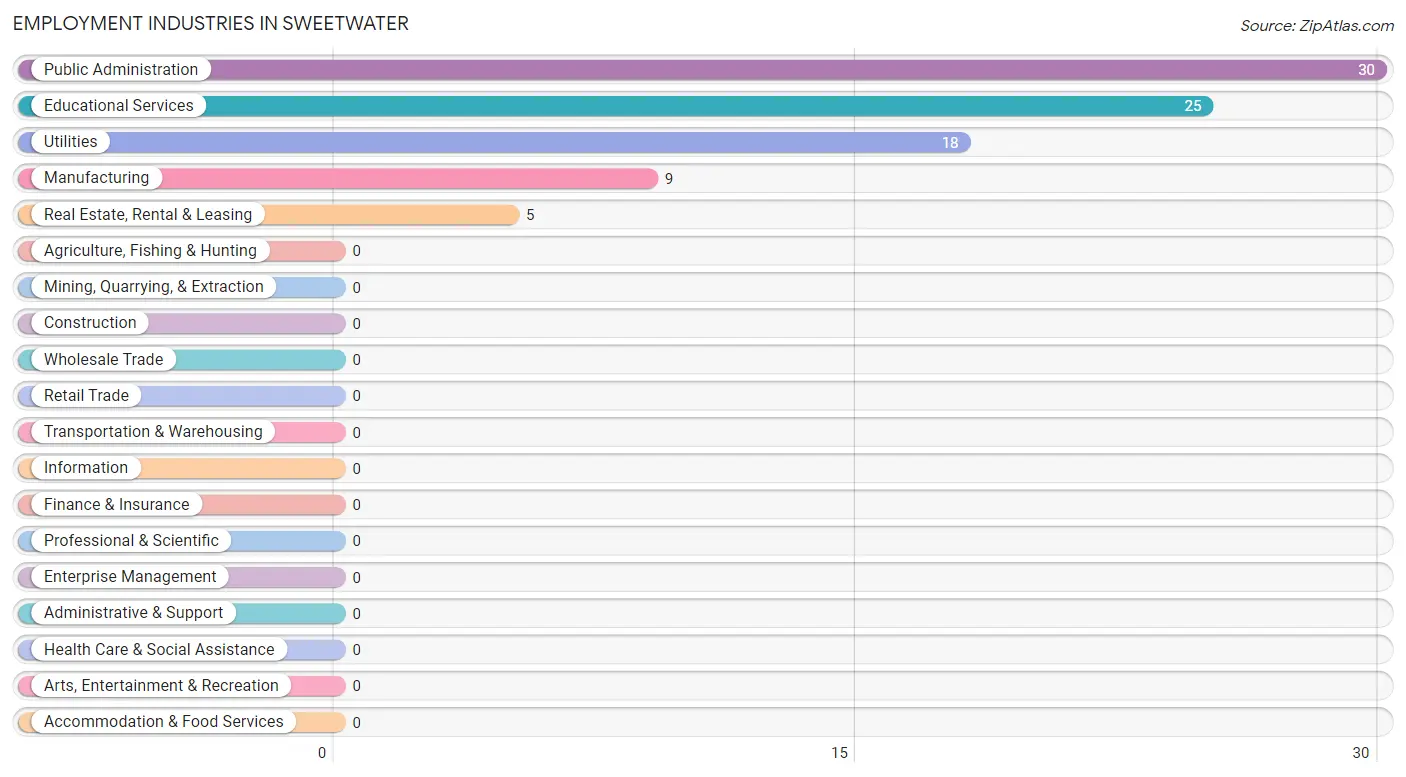
Employment Industries in Sweetwater
The major employment industries in Sweetwater include Public Administration (30 | 34.5%), Educational Services (25 | 28.7%), Utilities (18 | 20.7%), Manufacturing (9 | 10.3%), and Real Estate, Rental & Leasing (5 | 5.8%).
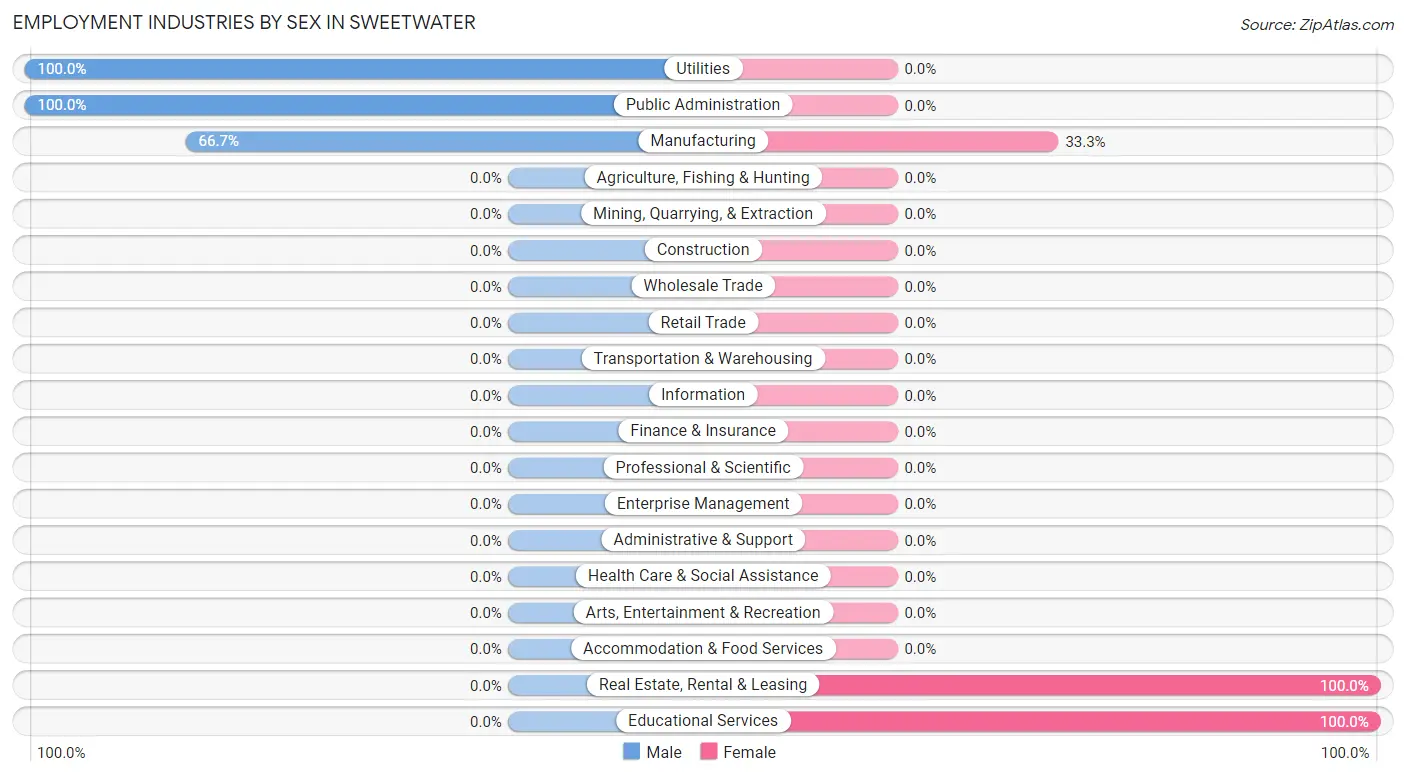
Employment Industries by Sex in Sweetwater
The Sweetwater industries that see more men than women are Utilities (100.0%), Public Administration (100.0%), and Manufacturing (66.7%), whereas the industries that tend to have a higher number of women are Real Estate, Rental & Leasing (100.0%), Educational Services (100.0%), and Manufacturing (33.3%).
| Industry | Male | Female |
| Agriculture, Fishing & Hunting | 0 (0.0%) | 0 (0.0%) |
| Mining, Quarrying, & Extraction | 0 (0.0%) | 0 (0.0%) |
| Construction | 0 (0.0%) | 0 (0.0%) |
| Manufacturing | 6 (66.7%) | 3 (33.3%) |
| Wholesale Trade | 0 (0.0%) | 0 (0.0%) |
| Retail Trade | 0 (0.0%) | 0 (0.0%) |
| Transportation & Warehousing | 0 (0.0%) | 0 (0.0%) |
| Utilities | 18 (100.0%) | 0 (0.0%) |
| Information | 0 (0.0%) | 0 (0.0%) |
| Finance & Insurance | 0 (0.0%) | 0 (0.0%) |
| Real Estate, Rental & Leasing | 0 (0.0%) | 5 (100.0%) |
| Professional & Scientific | 0 (0.0%) | 0 (0.0%) |
| Enterprise Management | 0 (0.0%) | 0 (0.0%) |
| Administrative & Support | 0 (0.0%) | 0 (0.0%) |
| Educational Services | 0 (0.0%) | 25 (100.0%) |
| Health Care & Social Assistance | 0 (0.0%) | 0 (0.0%) |
| Arts, Entertainment & Recreation | 0 (0.0%) | 0 (0.0%) |
| Accommodation & Food Services | 0 (0.0%) | 0 (0.0%) |
| Public Administration | 30 (100.0%) | 0 (0.0%) |
| Total | 54 (62.1%) | 33 (37.9%) |
Education in Sweetwater
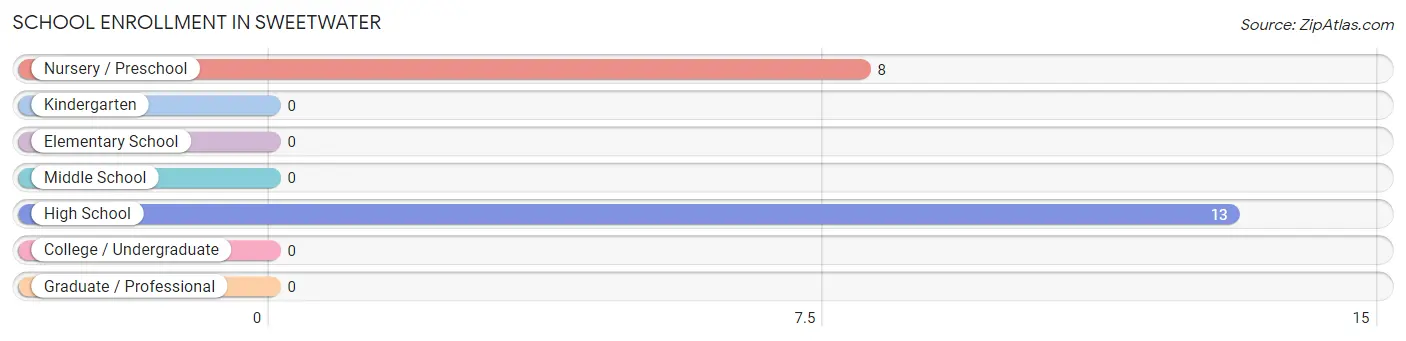
School Enrollment in Sweetwater
The most common levels of schooling among the 21 students in Sweetwater are high school (13 | 61.9%), and nursery / preschool (8 | 38.1%).
| School Level | # Students | % Students |
| Nursery / Preschool | 8 | 38.1% |
| Kindergarten | 0 | 0.0% |
| Elementary School | 0 | 0.0% |
| Middle School | 0 | 0.0% |
| High School | 13 | 61.9% |
| College / Undergraduate | 0 | 0.0% |
| Graduate / Professional | 0 | 0.0% |
| Total | 21 | 100.0% |
School Enrollment by Age by Funding Source in Sweetwater
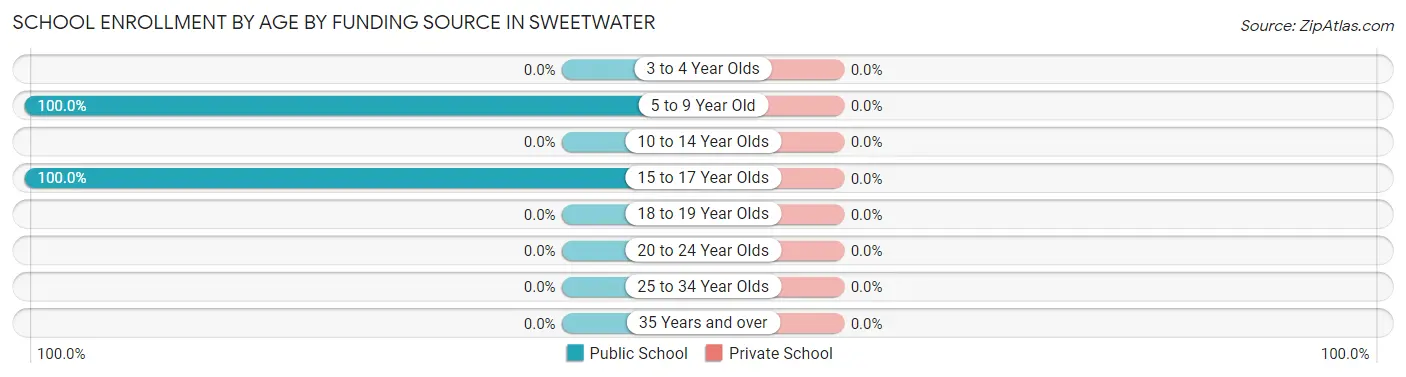
| Age Bracket | Public School | Private School |
| 3 to 4 Year Olds | 0 (0.0%) | 0 (0.0%) |
| 5 to 9 Year Old | 8 (100.0%) | 0 (0.0%) |
| 10 to 14 Year Olds | 0 (0.0%) | 0 (0.0%) |
| 15 to 17 Year Olds | 13 (100.0%) | 0 (0.0%) |
| 18 to 19 Year Olds | 0 (0.0%) | 0 (0.0%) |
| 20 to 24 Year Olds | 0 (0.0%) | 0 (0.0%) |
| 25 to 34 Year Olds | 0 (0.0%) | 0 (0.0%) |
| 35 Years and over | 0 (0.0%) | 0 (0.0%) |
| Total | 21 (100.0%) | 0 (0.0%) |
Educational Attainment by Field of Study in Sweetwater
Education (25 | 54.3%), bio, nature & agricultural (15 | 32.6%), and business (6 | 13.0%) are the most common fields of study among 46 individuals in Sweetwater who have obtained a bachelor's degree or higher.
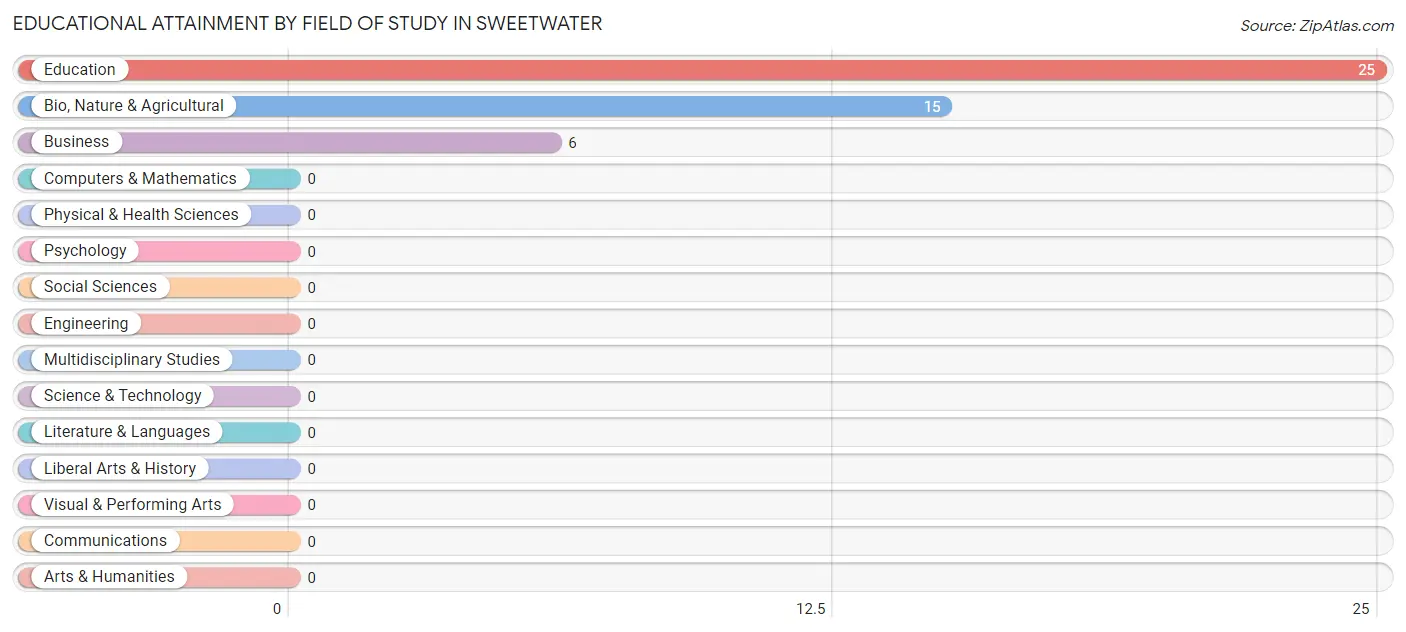
| Field of Study | # Graduates | % Graduates |
| Computers & Mathematics | 0 | 0.0% |
| Bio, Nature & Agricultural | 15 | 32.6% |
| Physical & Health Sciences | 0 | 0.0% |
| Psychology | 0 | 0.0% |
| Social Sciences | 0 | 0.0% |
| Engineering | 0 | 0.0% |
| Multidisciplinary Studies | 0 | 0.0% |
| Science & Technology | 0 | 0.0% |
| Business | 6 | 13.0% |
| Education | 25 | 54.3% |
| Literature & Languages | 0 | 0.0% |
| Liberal Arts & History | 0 | 0.0% |
| Visual & Performing Arts | 0 | 0.0% |
| Communications | 0 | 0.0% |
| Arts & Humanities | 0 | 0.0% |
| Total | 46 | 100.0% |
Transportation & Commute in Sweetwater
Vehicle Availability by Sex in Sweetwater
The most prevalent vehicle ownership categories in Sweetwater are males with 3 vehicles (21, accounting for 38.9%) and females with 3 vehicles (25, making up 63.6%).
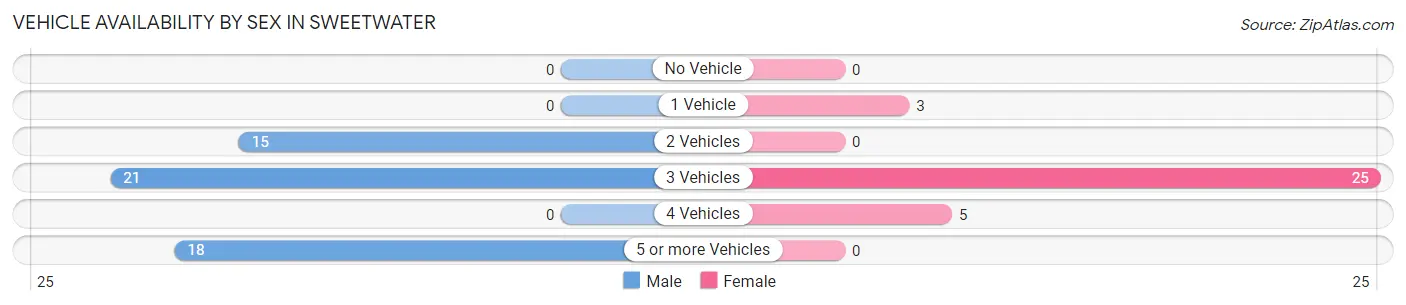
| Vehicles Available | Male | Female |
| No Vehicle | 0 (0.0%) | 0 (0.0%) |
| 1 Vehicle | 0 (0.0%) | 3 (9.1%) |
| 2 Vehicles | 15 (27.8%) | 0 (0.0%) |
| 3 Vehicles | 21 (38.9%) | 25 (75.8%) |
| 4 Vehicles | 0 (0.0%) | 5 (15.1%) |
| 5 or more Vehicles | 18 (33.3%) | 0 (0.0%) |
| Total | 54 (100.0%) | 33 (100.0%) |
Commute Time in Sweetwater
The most frequently occuring commute durations in Sweetwater are less than 5 minutes (33 commuters, 37.9%), 10 to 14 minutes (30 commuters, 34.5%), and 20 to 24 minutes (9 commuters, 10.3%).
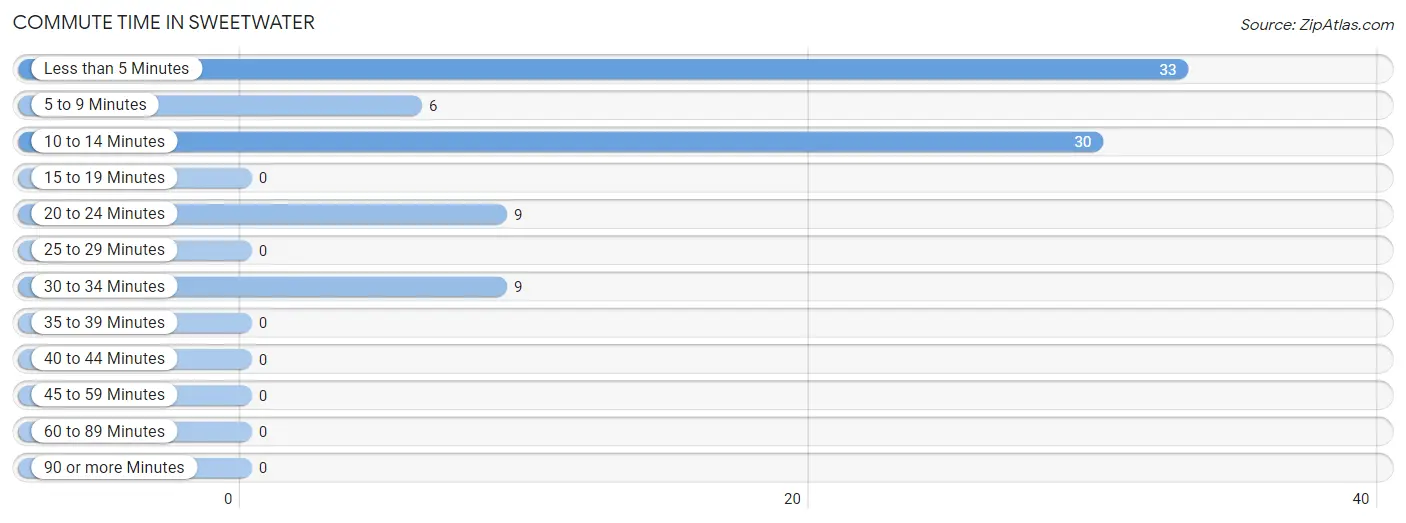
| Commute Time | # Commuters | % Commuters |
| Less than 5 Minutes | 33 | 37.9% |
| 5 to 9 Minutes | 6 | 6.9% |
| 10 to 14 Minutes | 30 | 34.5% |
| 15 to 19 Minutes | 0 | 0.0% |
| 20 to 24 Minutes | 9 | 10.3% |
| 25 to 29 Minutes | 0 | 0.0% |
| 30 to 34 Minutes | 9 | 10.3% |
| 35 to 39 Minutes | 0 | 0.0% |
| 40 to 44 Minutes | 0 | 0.0% |
| 45 to 59 Minutes | 0 | 0.0% |
| 60 to 89 Minutes | 0 | 0.0% |
| 90 or more Minutes | 0 | 0.0% |
Commute Time by Sex in Sweetwater
The most common commute times in Sweetwater are less than 5 minutes (33 commuters, 61.1%) for males and 10 to 14 minutes (30 commuters, 90.9%) for females.
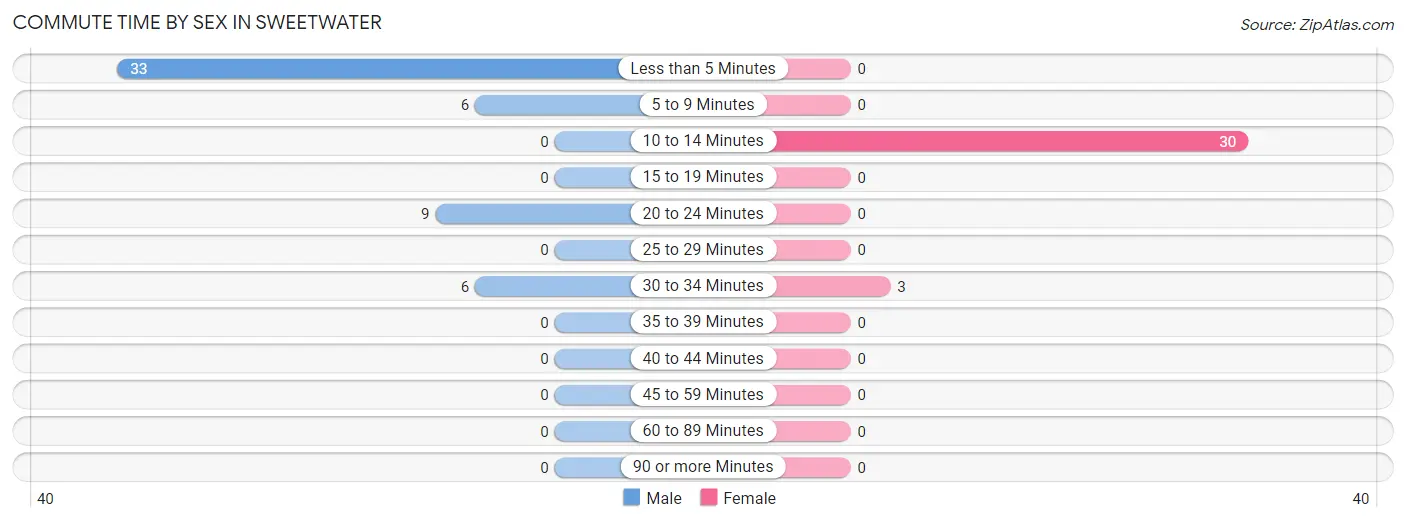
| Commute Time | Male | Female |
| Less than 5 Minutes | 33 (61.1%) | 0 (0.0%) |
| 5 to 9 Minutes | 6 (11.1%) | 0 (0.0%) |
| 10 to 14 Minutes | 0 (0.0%) | 30 (90.9%) |
| 15 to 19 Minutes | 0 (0.0%) | 0 (0.0%) |
| 20 to 24 Minutes | 9 (16.7%) | 0 (0.0%) |
| 25 to 29 Minutes | 0 (0.0%) | 0 (0.0%) |
| 30 to 34 Minutes | 6 (11.1%) | 3 (9.1%) |
| 35 to 39 Minutes | 0 (0.0%) | 0 (0.0%) |
| 40 to 44 Minutes | 0 (0.0%) | 0 (0.0%) |
| 45 to 59 Minutes | 0 (0.0%) | 0 (0.0%) |
| 60 to 89 Minutes | 0 (0.0%) | 0 (0.0%) |
| 90 or more Minutes | 0 (0.0%) | 0 (0.0%) |
Time of Departure to Work by Sex in Sweetwater
The most frequent times of departure to work in Sweetwater are 7:00 AM to 7:29 AM (33, 61.1%) for males and 8:00 AM to 8:29 AM (25, 75.8%) for females.
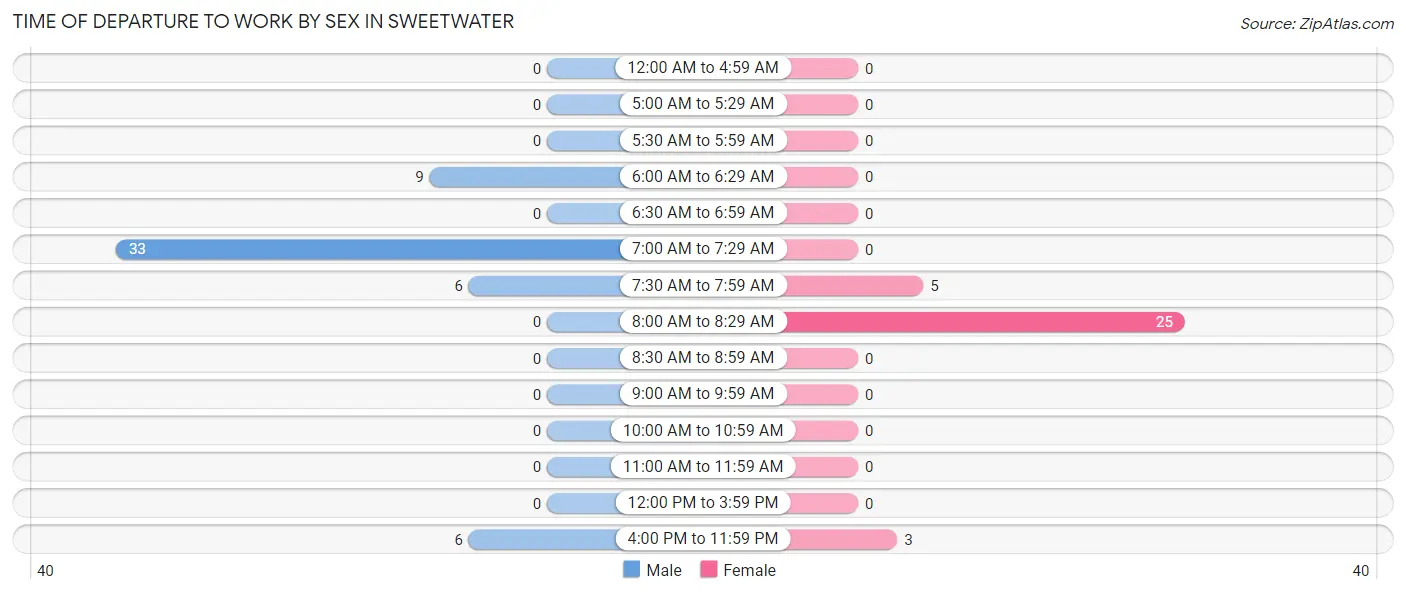
| Time of Departure | Male | Female |
| 12:00 AM to 4:59 AM | 0 (0.0%) | 0 (0.0%) |
| 5:00 AM to 5:29 AM | 0 (0.0%) | 0 (0.0%) |
| 5:30 AM to 5:59 AM | 0 (0.0%) | 0 (0.0%) |
| 6:00 AM to 6:29 AM | 9 (16.7%) | 0 (0.0%) |
| 6:30 AM to 6:59 AM | 0 (0.0%) | 0 (0.0%) |
| 7:00 AM to 7:29 AM | 33 (61.1%) | 0 (0.0%) |
| 7:30 AM to 7:59 AM | 6 (11.1%) | 5 (15.1%) |
| 8:00 AM to 8:29 AM | 0 (0.0%) | 25 (75.8%) |
| 8:30 AM to 8:59 AM | 0 (0.0%) | 0 (0.0%) |
| 9:00 AM to 9:59 AM | 0 (0.0%) | 0 (0.0%) |
| 10:00 AM to 10:59 AM | 0 (0.0%) | 0 (0.0%) |
| 11:00 AM to 11:59 AM | 0 (0.0%) | 0 (0.0%) |
| 12:00 PM to 3:59 PM | 0 (0.0%) | 0 (0.0%) |
| 4:00 PM to 11:59 PM | 6 (11.1%) | 3 (9.1%) |
| Total | 54 (100.0%) | 33 (100.0%) |
Housing Occupancy in Sweetwater
Occupancy by Ownership in Sweetwater
Of the total 63 dwellings in Sweetwater, owner-occupied units account for 59 (93.6%), while renter-occupied units make up 4 (6.4%).
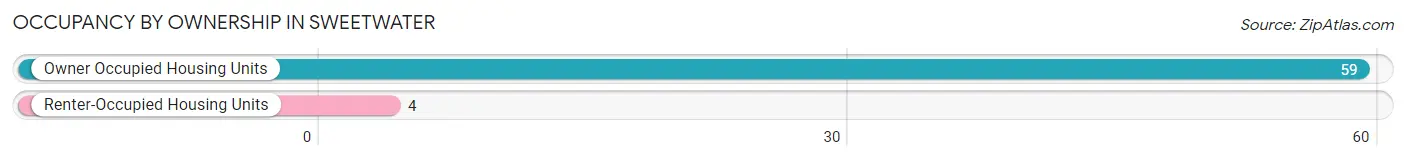
| Occupancy | # Housing Units | % Housing Units |
| Owner Occupied Housing Units | 59 | 93.6% |
| Renter-Occupied Housing Units | 4 | 6.4% |
| Total Occupied Housing Units | 63 | 100.0% |
Occupancy by Household Size in Sweetwater
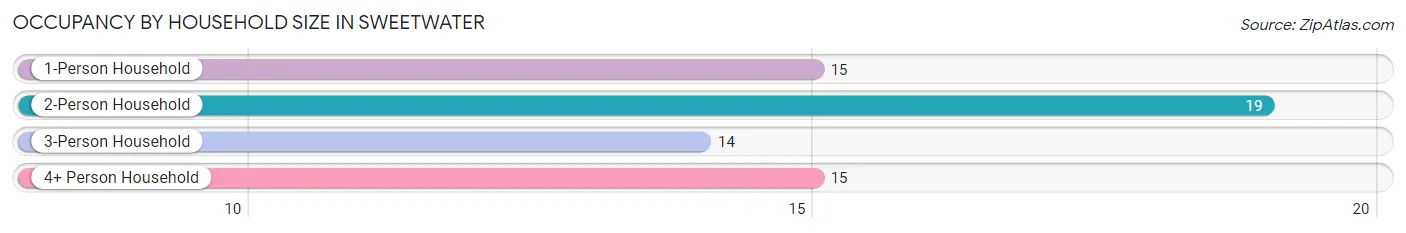
| Household Size | # Housing Units | % Housing Units |
| 1-Person Household | 15 | 23.8% |
| 2-Person Household | 19 | 30.2% |
| 3-Person Household | 14 | 22.2% |
| 4+ Person Household | 15 | 23.8% |
| Total Housing Units | 63 | 100.0% |
Occupancy by Ownership by Household Size in Sweetwater
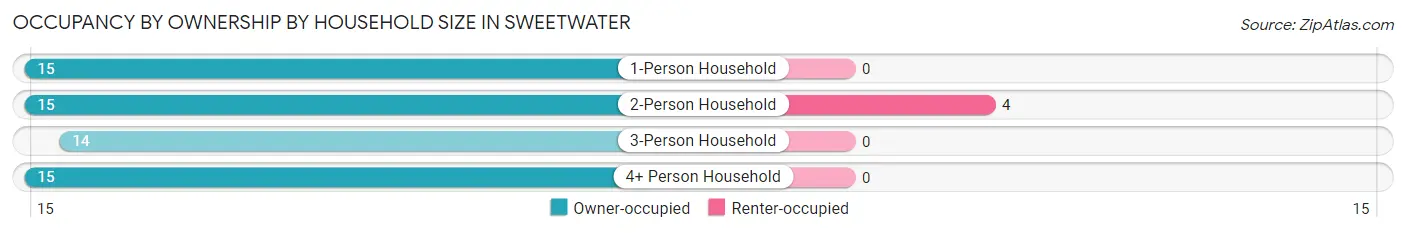
| Household Size | Owner-occupied | Renter-occupied |
| 1-Person Household | 15 (100.0%) | 0 (0.0%) |
| 2-Person Household | 15 (78.9%) | 4 (21.0%) |
| 3-Person Household | 14 (100.0%) | 0 (0.0%) |
| 4+ Person Household | 15 (100.0%) | 0 (0.0%) |
| Total Housing Units | 59 (93.6%) | 4 (6.4%) |
Occupancy by Educational Attainment in Sweetwater
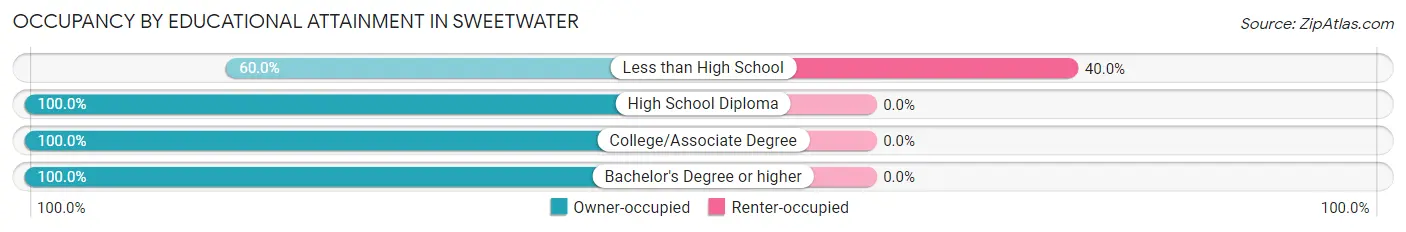
| Household Size | Owner-occupied | Renter-occupied |
| Less than High School | 6 (60.0%) | 4 (40.0%) |
| High School Diploma | 15 (100.0%) | 0 (0.0%) |
| College/Associate Degree | 17 (100.0%) | 0 (0.0%) |
| Bachelor's Degree or higher | 21 (100.0%) | 0 (0.0%) |
Occupancy by Age of Householder in Sweetwater
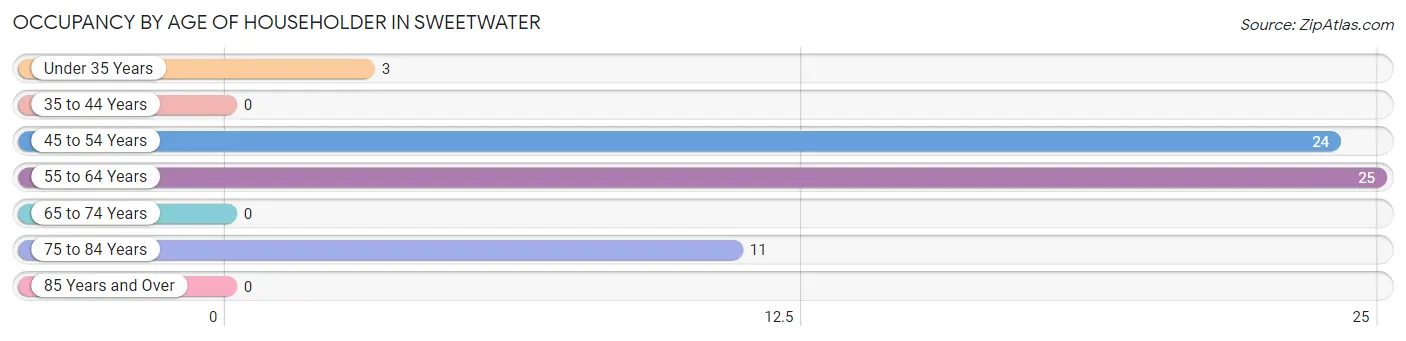
| Age Bracket | # Households | % Households |
| Under 35 Years | 3 | 4.8% |
| 35 to 44 Years | 0 | 0.0% |
| 45 to 54 Years | 24 | 38.1% |
| 55 to 64 Years | 25 | 39.7% |
| 65 to 74 Years | 0 | 0.0% |
| 75 to 84 Years | 11 | 17.5% |
| 85 Years and Over | 0 | 0.0% |
| Total | 63 | 100.0% |
Housing Finances in Sweetwater
Median Income by Occupancy in Sweetwater
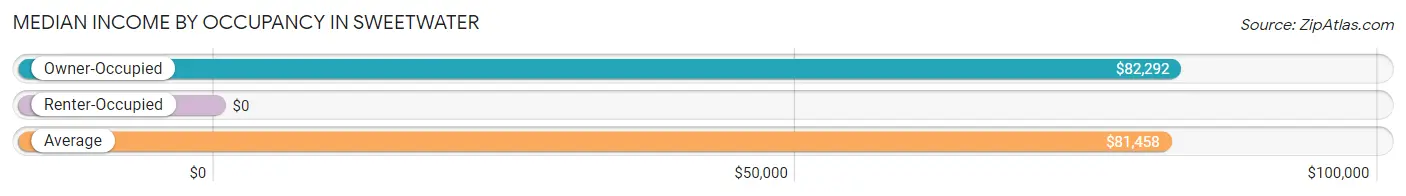
| Occupancy Type | # Households | Median Income |
| Owner-Occupied | 59 (93.6%) | $82,292 |
| Renter-Occupied | 4 (6.4%) | $0 |
| Average | 63 (100.0%) | $81,458 |
Occupancy by Householder Income Bracket in Sweetwater
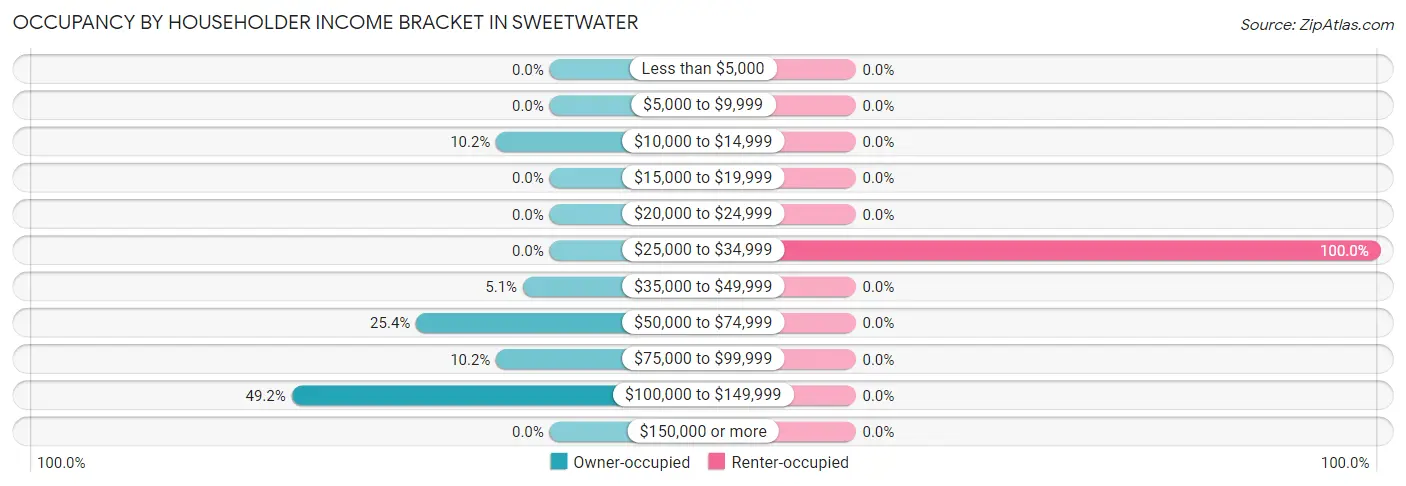
| Income Bracket | Owner-occupied | Renter-occupied |
| Less than $5,000 | 0 (0.0%) | 0 (0.0%) |
| $5,000 to $9,999 | 0 (0.0%) | 0 (0.0%) |
| $10,000 to $14,999 | 6 (10.2%) | 0 (0.0%) |
| $15,000 to $19,999 | 0 (0.0%) | 0 (0.0%) |
| $20,000 to $24,999 | 0 (0.0%) | 0 (0.0%) |
| $25,000 to $34,999 | 0 (0.0%) | 4 (100.0%) |
| $35,000 to $49,999 | 3 (5.1%) | 0 (0.0%) |
| $50,000 to $74,999 | 15 (25.4%) | 0 (0.0%) |
| $75,000 to $99,999 | 6 (10.2%) | 0 (0.0%) |
| $100,000 to $149,999 | 29 (49.1%) | 0 (0.0%) |
| $150,000 or more | 0 (0.0%) | 0 (0.0%) |
| Total | 59 (100.0%) | 4 (100.0%) |
Monthly Housing Cost Tiers in Sweetwater
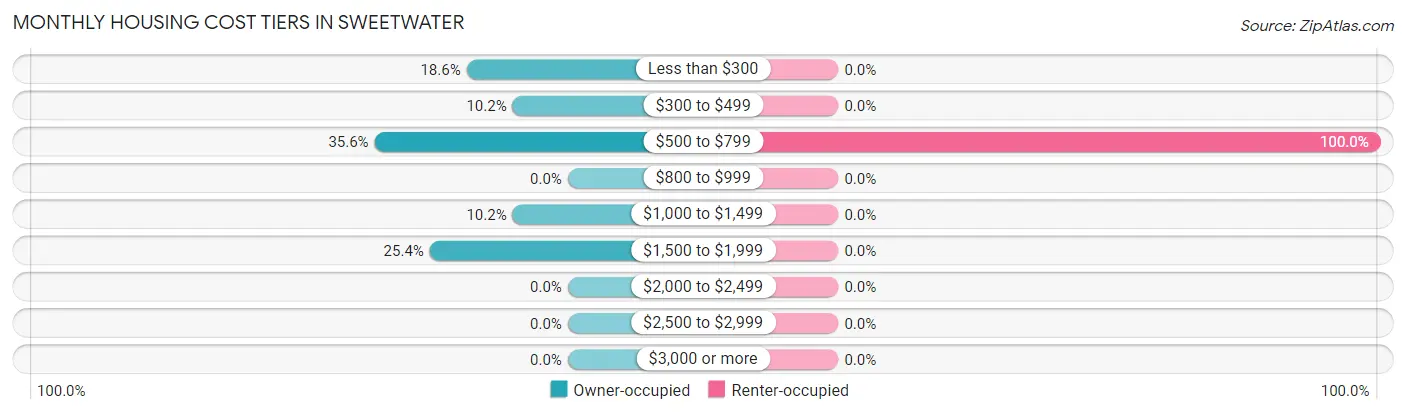
| Monthly Cost | Owner-occupied | Renter-occupied |
| Less than $300 | 11 (18.6%) | 0 (0.0%) |
| $300 to $499 | 6 (10.2%) | 0 (0.0%) |
| $500 to $799 | 21 (35.6%) | 4 (100.0%) |
| $800 to $999 | 0 (0.0%) | 0 (0.0%) |
| $1,000 to $1,499 | 6 (10.2%) | 0 (0.0%) |
| $1,500 to $1,999 | 15 (25.4%) | 0 (0.0%) |
| $2,000 to $2,499 | 0 (0.0%) | 0 (0.0%) |
| $2,500 to $2,999 | 0 (0.0%) | 0 (0.0%) |
| $3,000 or more | 0 (0.0%) | 0 (0.0%) |
| Total | 59 (100.0%) | 4 (100.0%) |
Physical Housing Characteristics in Sweetwater
Housing Structures in Sweetwater
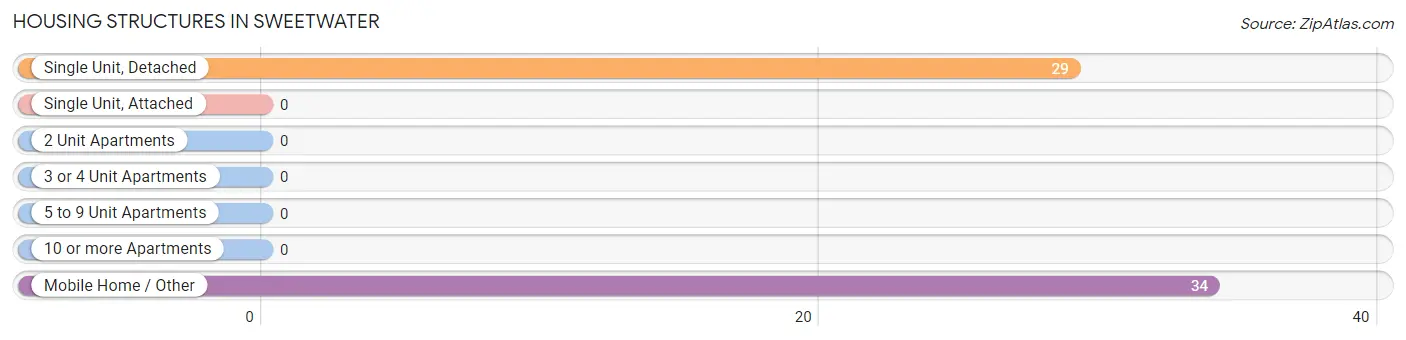
| Structure Type | # Housing Units | % Housing Units |
| Single Unit, Detached | 29 | 46.0% |
| Single Unit, Attached | 0 | 0.0% |
| 2 Unit Apartments | 0 | 0.0% |
| 3 or 4 Unit Apartments | 0 | 0.0% |
| 5 to 9 Unit Apartments | 0 | 0.0% |
| 10 or more Apartments | 0 | 0.0% |
| Mobile Home / Other | 34 | 54.0% |
| Total | 63 | 100.0% |
Housing Structures by Occupancy in Sweetwater
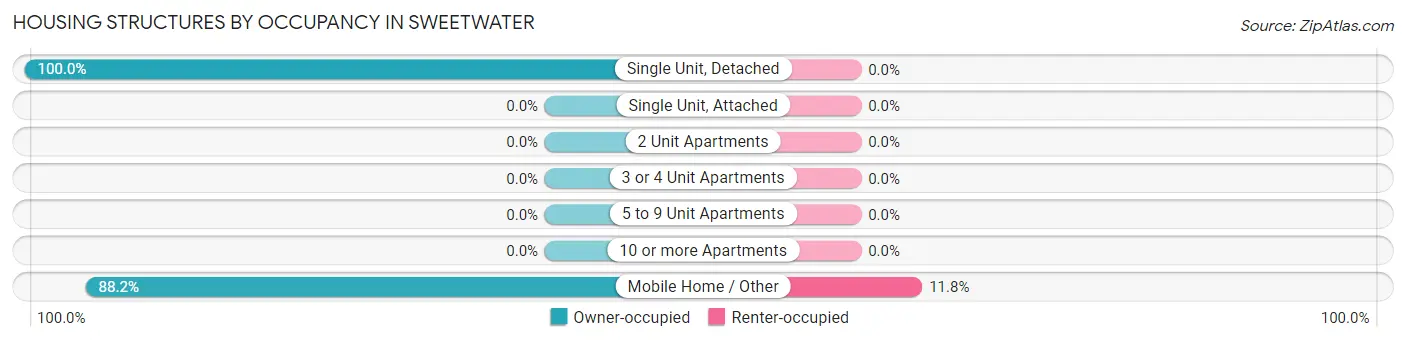
| Structure Type | Owner-occupied | Renter-occupied |
| Single Unit, Detached | 29 (100.0%) | 0 (0.0%) |
| Single Unit, Attached | 0 (0.0%) | 0 (0.0%) |
| 2 Unit Apartments | 0 (0.0%) | 0 (0.0%) |
| 3 or 4 Unit Apartments | 0 (0.0%) | 0 (0.0%) |
| 5 to 9 Unit Apartments | 0 (0.0%) | 0 (0.0%) |
| 10 or more Apartments | 0 (0.0%) | 0 (0.0%) |
| Mobile Home / Other | 30 (88.2%) | 4 (11.8%) |
| Total | 59 (93.6%) | 4 (6.4%) |
Housing Structures by Number of Rooms in Sweetwater
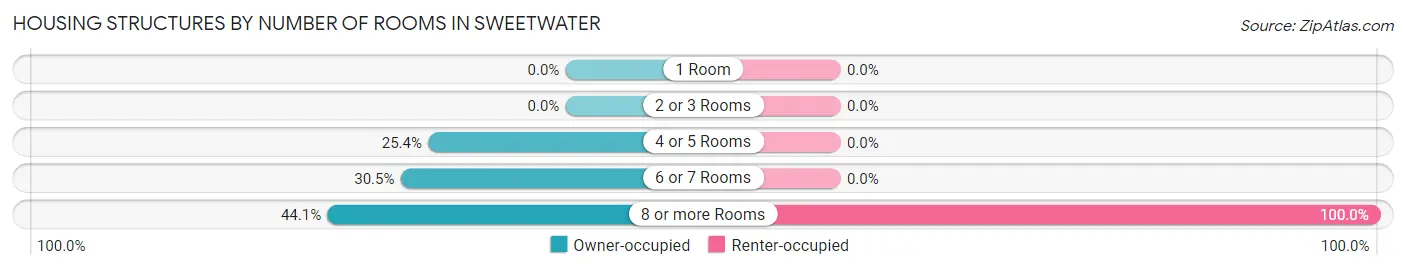
| Number of Rooms | Owner-occupied | Renter-occupied |
| 1 Room | 0 (0.0%) | 0 (0.0%) |
| 2 or 3 Rooms | 0 (0.0%) | 0 (0.0%) |
| 4 or 5 Rooms | 15 (25.4%) | 0 (0.0%) |
| 6 or 7 Rooms | 18 (30.5%) | 0 (0.0%) |
| 8 or more Rooms | 26 (44.1%) | 4 (100.0%) |
| Total | 59 (100.0%) | 4 (100.0%) |
Housing Structure by Heating Type in Sweetwater
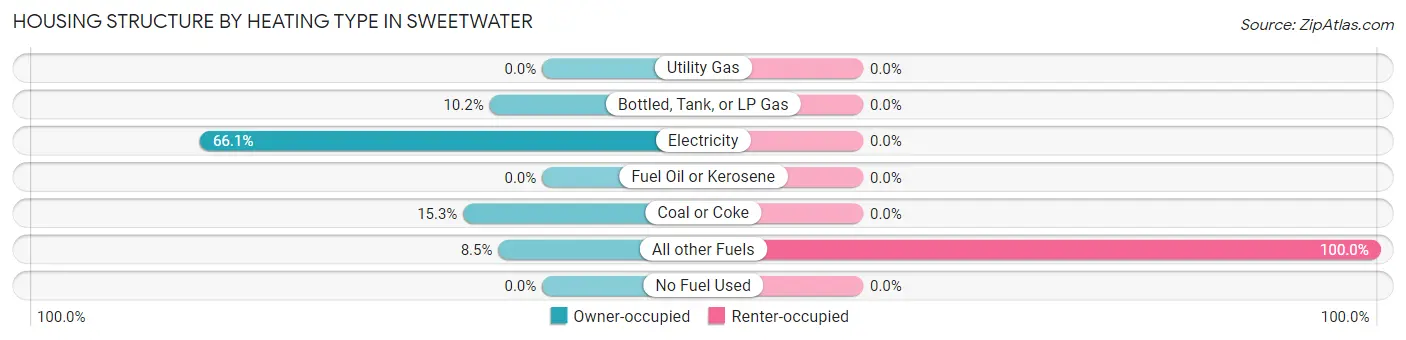
| Heating Type | Owner-occupied | Renter-occupied |
| Utility Gas | 0 (0.0%) | 0 (0.0%) |
| Bottled, Tank, or LP Gas | 6 (10.2%) | 0 (0.0%) |
| Electricity | 39 (66.1%) | 0 (0.0%) |
| Fuel Oil or Kerosene | 0 (0.0%) | 0 (0.0%) |
| Coal or Coke | 9 (15.2%) | 0 (0.0%) |
| All other Fuels | 5 (8.5%) | 4 (100.0%) |
| No Fuel Used | 0 (0.0%) | 0 (0.0%) |
| Total | 59 (100.0%) | 4 (100.0%) |
Household Vehicle Usage in Sweetwater
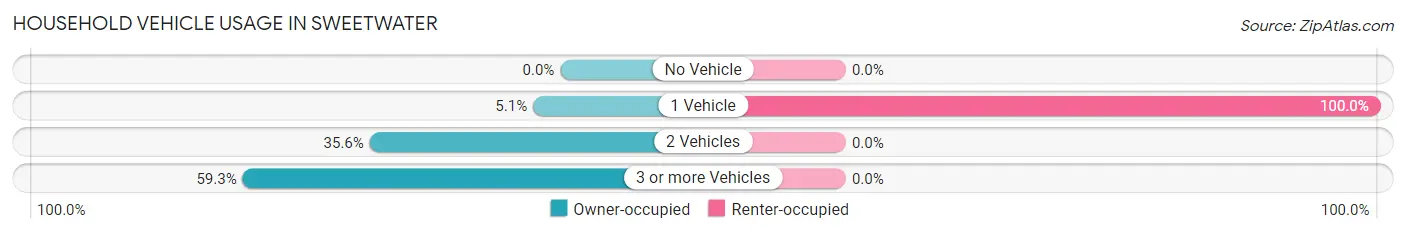
| Vehicles per Household | Owner-occupied | Renter-occupied |
| No Vehicle | 0 (0.0%) | 0 (0.0%) |
| 1 Vehicle | 3 (5.1%) | 4 (100.0%) |
| 2 Vehicles | 21 (35.6%) | 0 (0.0%) |
| 3 or more Vehicles | 35 (59.3%) | 0 (0.0%) |
| Total | 59 (100.0%) | 4 (100.0%) |
Real Estate & Mortgages in Sweetwater
Real Estate and Mortgage Overview in Sweetwater
| Characteristic | Without Mortgage | With Mortgage |
| Housing Units | 26 | 33 |
| Median Property Value | $211,100 | $172,500 |
| Median Household Income | $115,500 | $0 |
| Monthly Housing Costs | $367 | $0 |
| Real Estate Taxes | $1,150 | $30 |
Property Value by Mortgage Status in Sweetwater
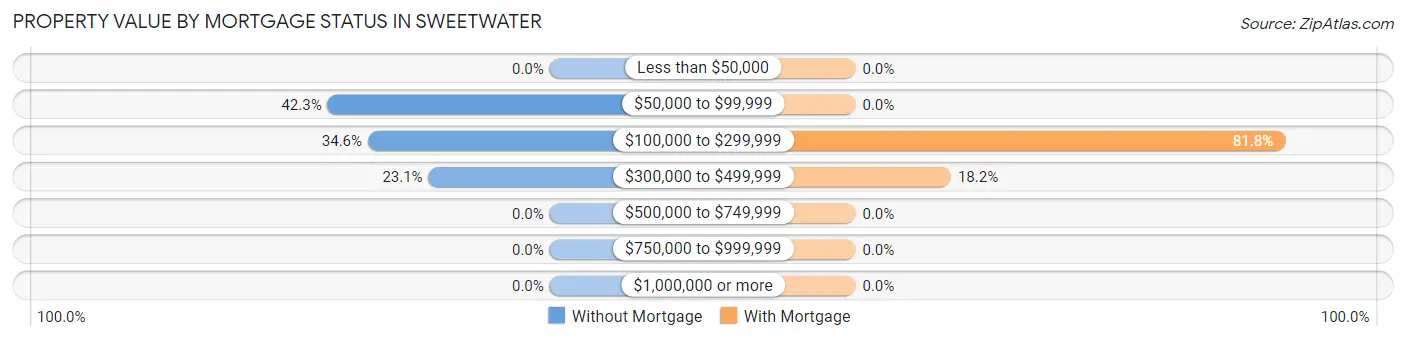
| Property Value | Without Mortgage | With Mortgage |
| Less than $50,000 | 0 (0.0%) | 0 (0.0%) |
| $50,000 to $99,999 | 11 (42.3%) | 0 (0.0%) |
| $100,000 to $299,999 | 9 (34.6%) | 27 (81.8%) |
| $300,000 to $499,999 | 6 (23.1%) | 6 (18.2%) |
| $500,000 to $749,999 | 0 (0.0%) | 0 (0.0%) |
| $750,000 to $999,999 | 0 (0.0%) | 0 (0.0%) |
| $1,000,000 or more | 0 (0.0%) | 0 (0.0%) |
| Total | 26 (100.0%) | 33 (100.0%) |
Household Income by Mortgage Status in Sweetwater
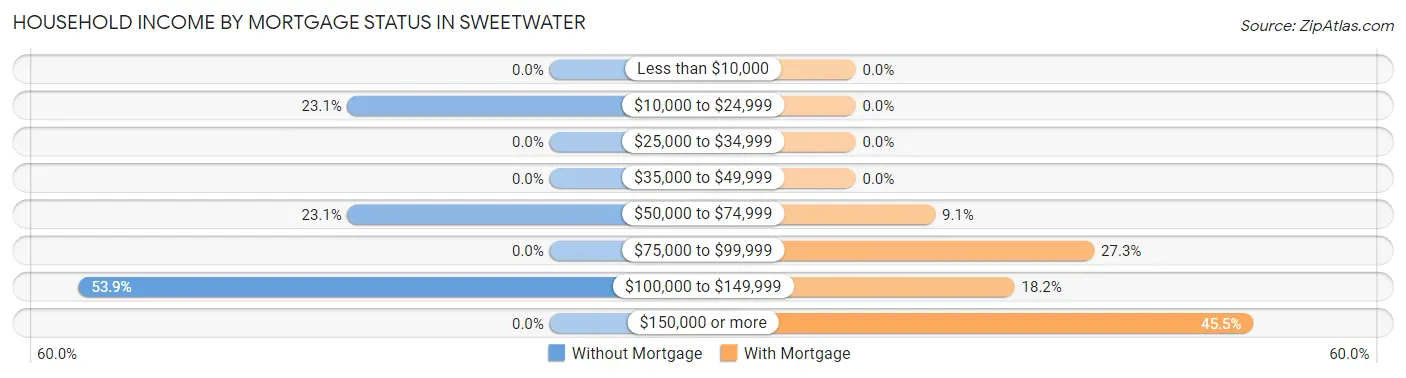
| Household Income | Without Mortgage | With Mortgage |
| Less than $10,000 | 0 (0.0%) | 0 (0.0%) |
| $10,000 to $24,999 | 6 (23.1%) | 0 (0.0%) |
| $25,000 to $34,999 | 0 (0.0%) | 0 (0.0%) |
| $35,000 to $49,999 | 0 (0.0%) | 0 (0.0%) |
| $50,000 to $74,999 | 6 (23.1%) | 3 (9.1%) |
| $75,000 to $99,999 | 0 (0.0%) | 9 (27.3%) |
| $100,000 to $149,999 | 14 (53.8%) | 6 (18.2%) |
| $150,000 or more | 0 (0.0%) | 15 (45.5%) |
| Total | 26 (100.0%) | 33 (100.0%) |
Property Value to Household Income Ratio in Sweetwater
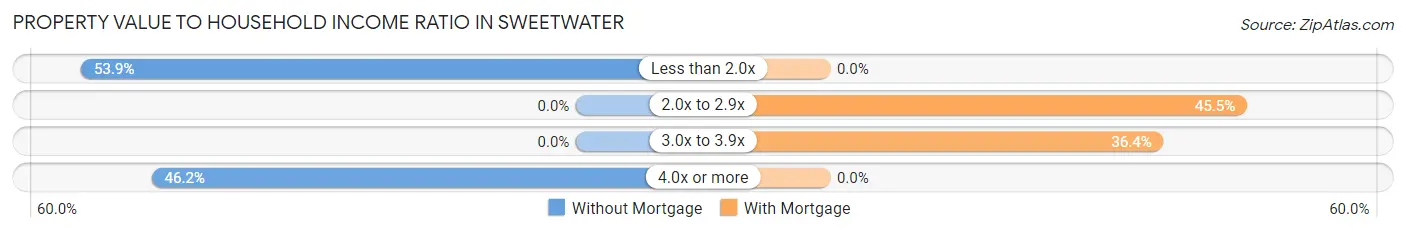
| Value-to-Income Ratio | Without Mortgage | With Mortgage |
| Less than 2.0x | 14 (53.8%) | 0 (0.0%) |
| 2.0x to 2.9x | 0 (0.0%) | 15 (45.5%) |
| 3.0x to 3.9x | 0 (0.0%) | 12 (36.4%) |
| 4.0x or more | 12 (46.2%) | 0 (0.0%) |
| Total | 26 (100.0%) | 33 (100.0%) |
Real Estate Taxes by Mortgage Status in Sweetwater
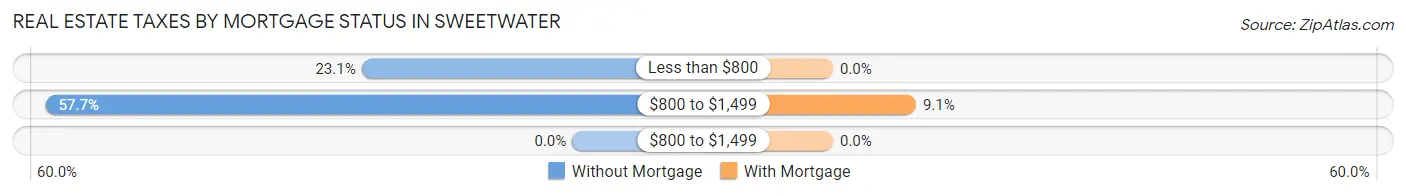
| Property Taxes | Without Mortgage | With Mortgage |
| Less than $800 | 6 (23.1%) | 0 (0.0%) |
| $800 to $1,499 | 15 (57.7%) | 3 (9.1%) |
| $800 to $1,499 | 0 (0.0%) | 0 (0.0%) |
| Total | 26 (100.0%) | 33 (100.0%) |
Health & Disability in Sweetwater
Health Insurance Coverage by Age in Sweetwater
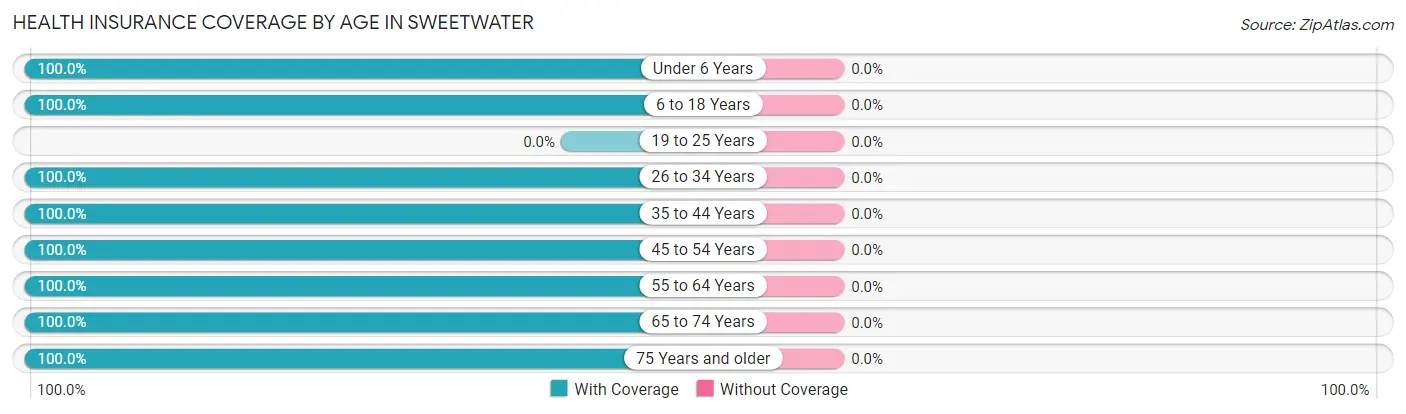
| Age Bracket | With Coverage | Without Coverage |
| Under 6 Years | 9 (100.0%) | 0 (0.0%) |
| 6 to 18 Years | 13 (100.0%) | 0 (0.0%) |
| 19 to 25 Years | 0 (0.0%) | 0 (0.0%) |
| 26 to 34 Years | 3 (100.0%) | 0 (0.0%) |
| 35 to 44 Years | 18 (100.0%) | 0 (0.0%) |
| 45 to 54 Years | 54 (100.0%) | 0 (0.0%) |
| 55 to 64 Years | 55 (100.0%) | 0 (0.0%) |
| 65 to 74 Years | 7 (100.0%) | 0 (0.0%) |
| 75 Years and older | 13 (100.0%) | 0 (0.0%) |
| Total | 172 (100.0%) | 0 (0.0%) |
Health Insurance Coverage by Citizenship Status in Sweetwater
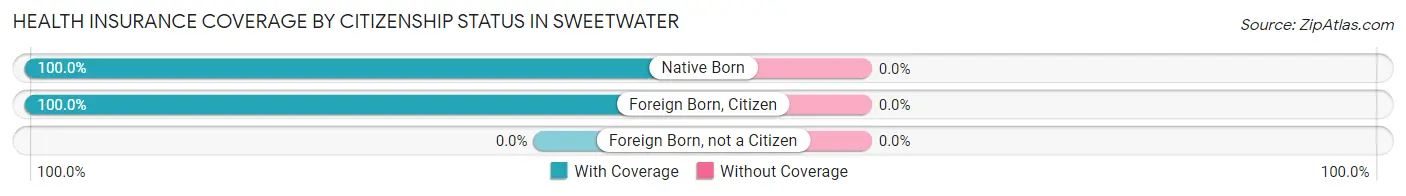
| Citizenship Status | With Coverage | Without Coverage |
| Native Born | 9 (100.0%) | 0 (0.0%) |
| Foreign Born, Citizen | 13 (100.0%) | 0 (0.0%) |
| Foreign Born, not a Citizen | 0 (0.0%) | 0 (0.0%) |
Health Insurance Coverage by Household Income in Sweetwater
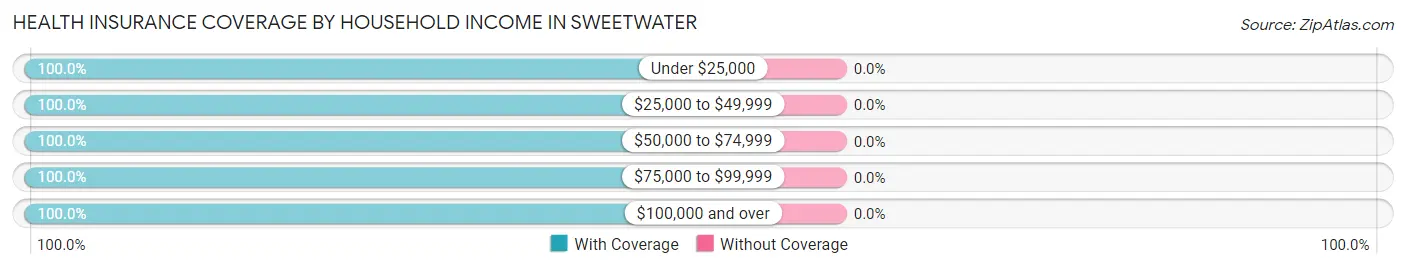
| Household Income | With Coverage | Without Coverage |
| Under $25,000 | 6 (100.0%) | 0 (0.0%) |
| $25,000 to $49,999 | 9 (100.0%) | 0 (0.0%) |
| $50,000 to $74,999 | 23 (100.0%) | 0 (0.0%) |
| $75,000 to $99,999 | 12 (100.0%) | 0 (0.0%) |
| $100,000 and over | 122 (100.0%) | 0 (0.0%) |
Public vs Private Health Insurance Coverage by Age in Sweetwater
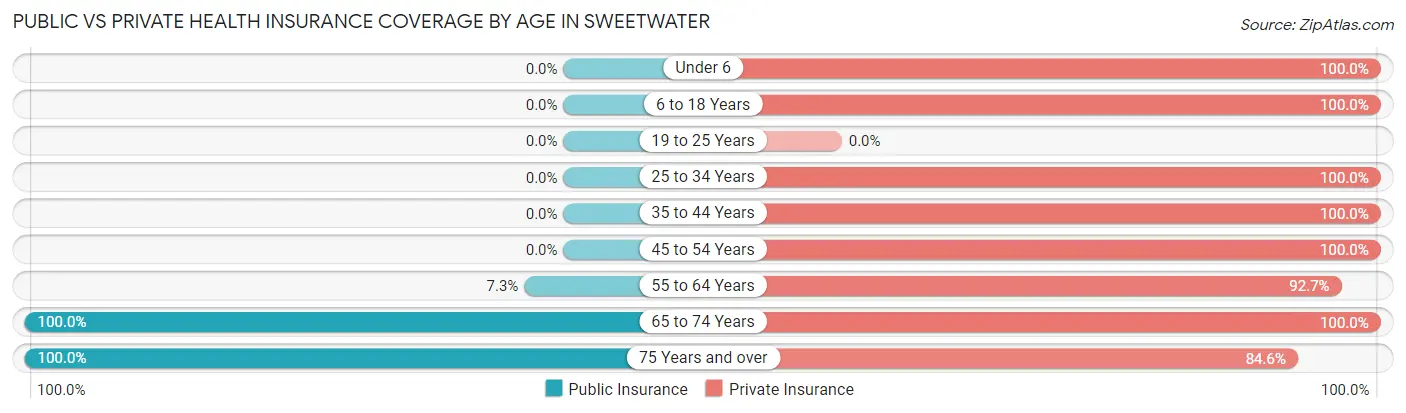
| Age Bracket | Public Insurance | Private Insurance |
| Under 6 | 0 (0.0%) | 9 (100.0%) |
| 6 to 18 Years | 0 (0.0%) | 13 (100.0%) |
| 19 to 25 Years | 0 (0.0%) | 0 (0.0%) |
| 25 to 34 Years | 0 (0.0%) | 3 (100.0%) |
| 35 to 44 Years | 0 (0.0%) | 18 (100.0%) |
| 45 to 54 Years | 0 (0.0%) | 54 (100.0%) |
| 55 to 64 Years | 4 (7.3%) | 51 (92.7%) |
| 65 to 74 Years | 7 (100.0%) | 7 (100.0%) |
| 75 Years and over | 13 (100.0%) | 11 (84.6%) |
| Total | 24 (14.0%) | 166 (96.5%) |
Disability Status by Sex by Age in Sweetwater
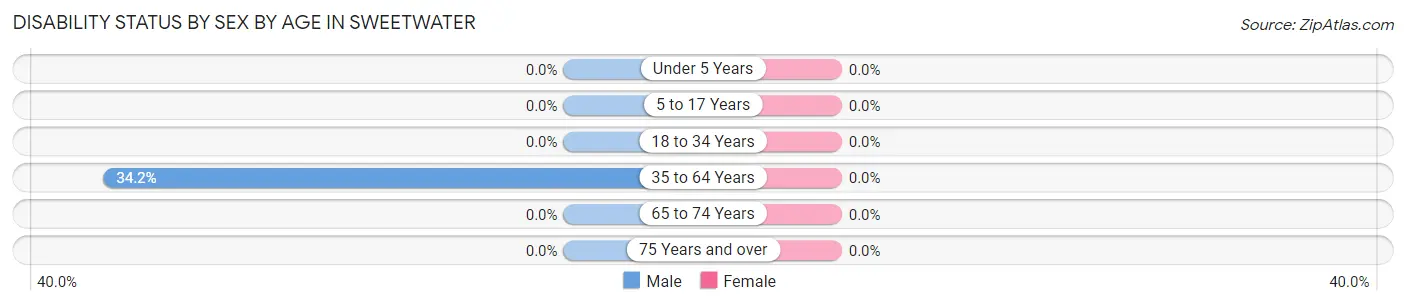
| Age Bracket | Male | Female |
| Under 5 Years | 0 (0.0%) | 0 (0.0%) |
| 5 to 17 Years | 0 (0.0%) | 0 (0.0%) |
| 18 to 34 Years | 0 (0.0%) | 0 (0.0%) |
| 35 to 64 Years | 28 (34.2%) | 0 (0.0%) |
| 65 to 74 Years | 0 (0.0%) | 0 (0.0%) |
| 75 Years and over | 0 (0.0%) | 0 (0.0%) |
Disability Class by Sex by Age in Sweetwater
Disability Class: Hearing Difficulty

| Age Bracket | Male | Female |
| Under 5 Years | 0 (0.0%) | 0 (0.0%) |
| 5 to 17 Years | 0 (0.0%) | 0 (0.0%) |
| 18 to 34 Years | 0 (0.0%) | 0 (0.0%) |
| 35 to 64 Years | 24 (29.3%) | 0 (0.0%) |
| 65 to 74 Years | 0 (0.0%) | 0 (0.0%) |
| 75 Years and over | 0 (0.0%) | 0 (0.0%) |
Disability Class: Vision Difficulty
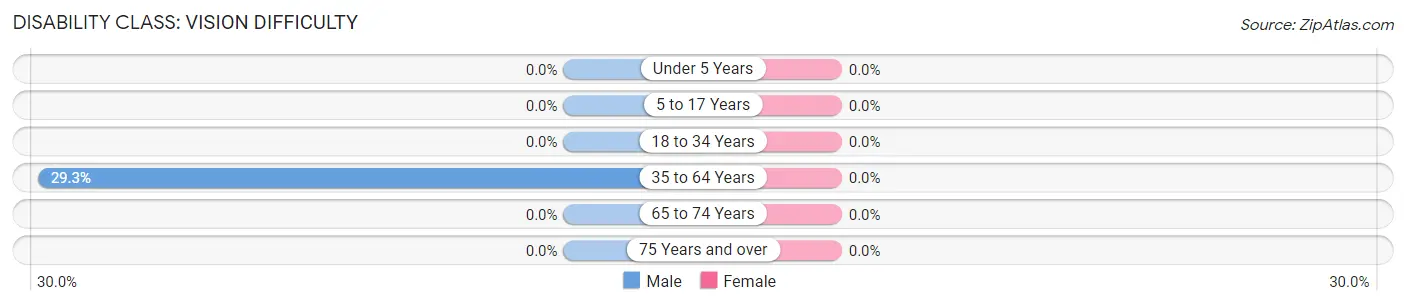
| Age Bracket | Male | Female |
| Under 5 Years | 0 (0.0%) | 0 (0.0%) |
| 5 to 17 Years | 0 (0.0%) | 0 (0.0%) |
| 18 to 34 Years | 0 (0.0%) | 0 (0.0%) |
| 35 to 64 Years | 24 (29.3%) | 0 (0.0%) |
| 65 to 74 Years | 0 (0.0%) | 0 (0.0%) |
| 75 Years and over | 0 (0.0%) | 0 (0.0%) |
Disability Class: Cognitive Difficulty
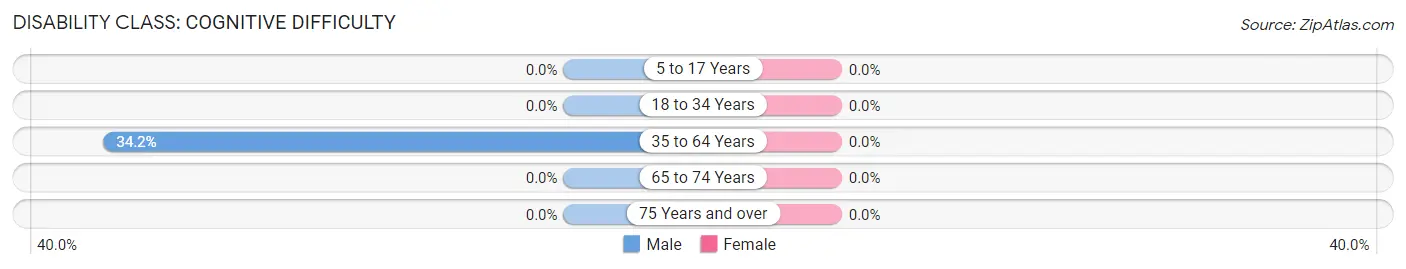
| Age Bracket | Male | Female |
| 5 to 17 Years | 0 (0.0%) | 0 (0.0%) |
| 18 to 34 Years | 0 (0.0%) | 0 (0.0%) |
| 35 to 64 Years | 28 (34.2%) | 0 (0.0%) |
| 65 to 74 Years | 0 (0.0%) | 0 (0.0%) |
| 75 Years and over | 0 (0.0%) | 0 (0.0%) |
Disability Class: Ambulatory Difficulty
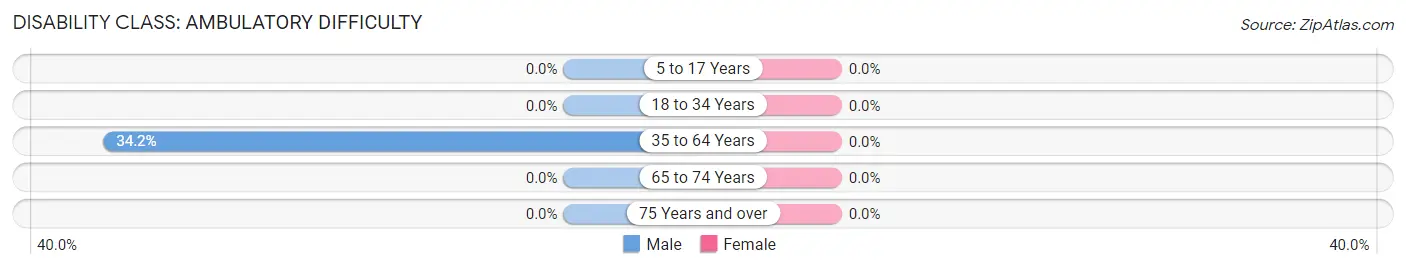
| Age Bracket | Male | Female |
| 5 to 17 Years | 0 (0.0%) | 0 (0.0%) |
| 18 to 34 Years | 0 (0.0%) | 0 (0.0%) |
| 35 to 64 Years | 28 (34.2%) | 0 (0.0%) |
| 65 to 74 Years | 0 (0.0%) | 0 (0.0%) |
| 75 Years and over | 0 (0.0%) | 0 (0.0%) |
Disability Class: Self-Care Difficulty
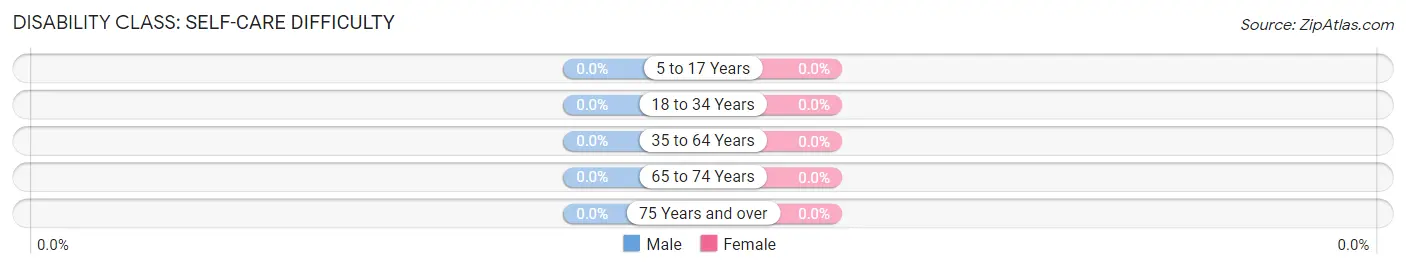
| Age Bracket | Male | Female |
| 5 to 17 Years | 0 (0.0%) | 0 (0.0%) |
| 18 to 34 Years | 0 (0.0%) | 0 (0.0%) |
| 35 to 64 Years | 0 (0.0%) | 0 (0.0%) |
| 65 to 74 Years | 0 (0.0%) | 0 (0.0%) |
| 75 Years and over | 0 (0.0%) | 0 (0.0%) |
Technology Access in Sweetwater
Computing Device Access in Sweetwater
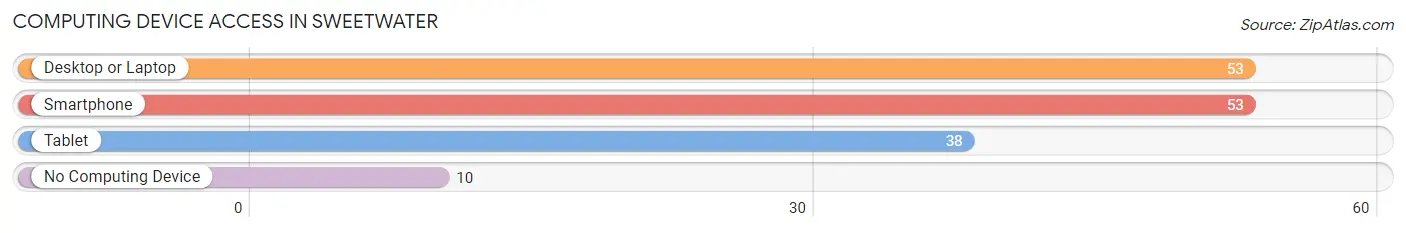
| Device Type | # Households | % Households |
| Desktop or Laptop | 53 | 84.1% |
| Smartphone | 53 | 84.1% |
| Tablet | 38 | 60.3% |
| No Computing Device | 10 | 15.9% |
| Total | 63 | 100.0% |
Internet Access in Sweetwater
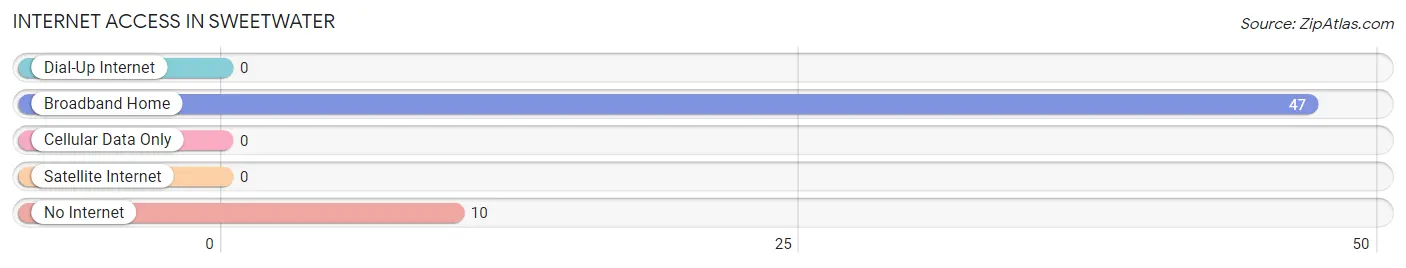
| Internet Type | # Households | % Households |
| Dial-Up Internet | 0 | 0.0% |
| Broadband Home | 47 | 74.6% |
| Cellular Data Only | 0 | 0.0% |
| Satellite Internet | 0 | 0.0% |
| No Internet | 10 | 15.9% |
| Total | 63 | 100.0% |
Sweetwater Summary
Watertown, Idaho is a small town located in the southeastern corner of the state, near the Utah border. It is situated in the Snake River Valley, and is surrounded by the Owyhee Mountains to the east and the Snake River to the west. The town was founded in 1883 by settlers from the nearby town of Star Valley, Wyoming. The town was named after the nearby Sweetwater Creek, which flows through the area.
The town of Sweetwater is located in the Snake River Valley, which is a major agricultural region in Idaho. The area is known for its production of potatoes, wheat, barley, and hay. The town is also home to a number of small businesses, including a grocery store, a hardware store, and a few restaurants.
The population of Sweetwater was estimated to be around 1,000 people in 2000. The majority of the population is white, with a small percentage of Native American, Hispanic, and African American residents. The median household income in 2000 was $30,000, and the median home value was $90,000.
The town of Sweetwater is served by the Sweetwater County School District, which includes two elementary schools, a middle school, and a high school. The town is also home to a branch of the College of Southern Idaho, which offers a variety of degree programs.
The economy of Sweetwater is largely based on agriculture and tourism. The town is home to a number of small businesses, including a grocery store, a hardware store, and a few restaurants. The town is also home to a number of tourist attractions, including the Snake River Canyon, the Owyhee Mountains, and the nearby hot springs.
The town of Sweetwater is located in a rural area, and is surrounded by natural beauty. The town is home to a number of parks and recreational areas, including the Sweetwater National Wildlife Refuge, which is home to a variety of wildlife species. The town is also home to a number of historic sites, including the Sweetwater County Courthouse, which was built in 1883.
The town of Sweetwater is a great place to live and work, and offers a variety of activities and attractions for residents and visitors alike. The town is home to a number of small businesses, and is surrounded by natural beauty. The town is also home to a number of historic sites, and is served by the Sweetwater County School District. The town is a great place to live and work, and offers a variety of activities and attractions for residents and visitors alike.
Common Questions
What is Per Capita Income in Sweetwater?
Per Capita income in Sweetwater is $41,379.
What is the Median Family Income in Sweetwater?
Median Family Income in Sweetwater is $123,750.
What is the Median Household income in Sweetwater?
Median Household Income in Sweetwater is $81,458.
What is Income or Wage Gap in Sweetwater?
Income or Wage Gap in Sweetwater is 50.3%.
Women in Sweetwater earn 49.7 cents for every dollar earned by a man.
What is Inequality or Gini Index in Sweetwater?
Inequality or Gini Index in Sweetwater is 0.28.
What is the Total Population of Sweetwater?
Total Population of Sweetwater is 172.
What is the Total Male Population of Sweetwater?
Total Male Population of Sweetwater is 110.
What is the Total Female Population of Sweetwater?
Total Female Population of Sweetwater is 62.
What is the Ratio of Males per 100 Females in Sweetwater?
There are 177.42 Males per 100 Females in Sweetwater.
What is the Ratio of Females per 100 Males in Sweetwater?
There are 56.36 Females per 100 Males in Sweetwater.
What is the Median Population Age in Sweetwater?
Median Population Age in Sweetwater is 53.2 Years.
What is the Average Family Size in Sweetwater
Average Family Size in Sweetwater is 3.3 People.
What is the Average Household Size in Sweetwater
Average Household Size in Sweetwater is 2.7 People.
How Large is the Labor Force in Sweetwater?
There are 87 People in the Labor Forcein in Sweetwater.
What is the Percentage of People in the Labor Force in Sweetwater?
53.4% of People are in the Labor Force in Sweetwater.