Forest Hill, TX Map & Demographics
Forest Hill Map
Forest Hill Overview
$21,420
PER CAPITA INCOME
$56,541
AVG FAMILY INCOME
$58,713
AVG HOUSEHOLD INCOME
36.4%
WAGE / INCOME GAP [ % ]
63.6¢/ $1
WAGE / INCOME GAP [ $ ]
0.36
INEQUALITY / GINI INDEX
13,810
TOTAL POPULATION
5,890
MALE POPULATION
7,920
FEMALE POPULATION
74.37
MALES / 100 FEMALES
134.47
FEMALES / 100 MALES
31.7
MEDIAN AGE
3.9
AVG FAMILY SIZE
3.4
AVG HOUSEHOLD SIZE
6,676
LABOR FORCE [ PEOPLE ]
63.9%
PERCENT IN LABOR FORCE
7.6%
UNEMPLOYMENT RATE
Income in Forest Hill
Income Overview in Forest Hill
Per Capita Income in Forest Hill is $21,420, while median incomes of families and households are $56,541 and $58,713 respectively.
| Characteristic | Number | Measure |
| Per Capita Income | 13,810 | $21,420 |
| Median Family Income | 3,225 | $56,541 |
| Mean Family Income | 3,225 | $66,334 |
| Median Household Income | 4,123 | $58,713 |
| Mean Household Income | 4,123 | $67,288 |
| Income Deficit | 3,225 | $0 |
| Wage / Income Gap (%) | 13,810 | 36.38% |
| Wage / Income Gap ($) | 13,810 | 63.62¢ per $1 |
| Gini / Inequality Index | 13,810 | 0.36 |
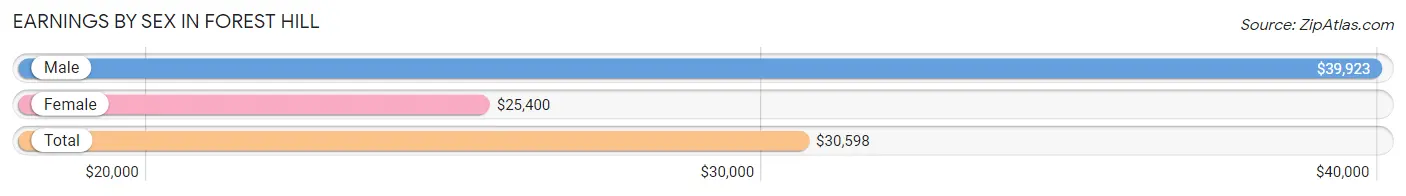
Earnings by Sex in Forest Hill
Average Earnings in Forest Hill are $30,598, $39,923 for men and $25,400 for women, a difference of 36.4%.
| Sex | Number | Average Earnings |
| Male | 3,405 (48.4%) | $39,923 |
| Female | 3,624 (51.6%) | $25,400 |
| Total | 7,029 (100.0%) | $30,598 |
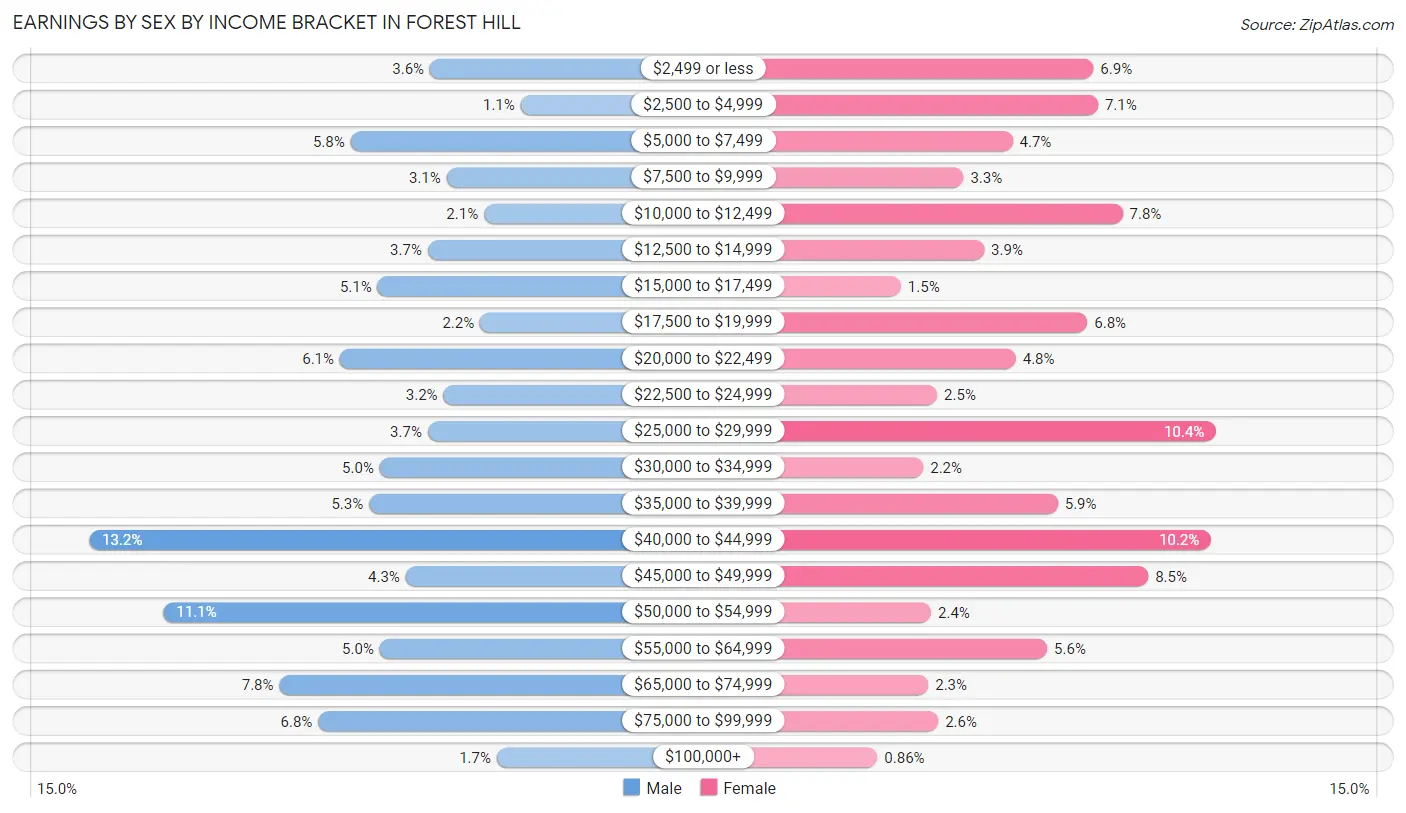
Earnings by Sex by Income Bracket in Forest Hill
The most common earnings brackets in Forest Hill are $40,000 to $44,999 for men (449 | 13.2%) and $25,000 to $29,999 for women (376 | 10.4%).
| Income | Male | Female |
| $2,499 or less | 123 (3.6%) | 251 (6.9%) |
| $2,500 to $4,999 | 36 (1.1%) | 256 (7.1%) |
| $5,000 to $7,499 | 199 (5.8%) | 169 (4.7%) |
| $7,500 to $9,999 | 107 (3.1%) | 119 (3.3%) |
| $10,000 to $12,499 | 71 (2.1%) | 281 (7.7%) |
| $12,500 to $14,999 | 125 (3.7%) | 140 (3.9%) |
| $15,000 to $17,499 | 173 (5.1%) | 55 (1.5%) |
| $17,500 to $19,999 | 75 (2.2%) | 245 (6.8%) |
| $20,000 to $22,499 | 209 (6.1%) | 172 (4.8%) |
| $22,500 to $24,999 | 110 (3.2%) | 92 (2.5%) |
| $25,000 to $29,999 | 125 (3.7%) | 376 (10.4%) |
| $30,000 to $34,999 | 171 (5.0%) | 78 (2.1%) |
| $35,000 to $39,999 | 181 (5.3%) | 215 (5.9%) |
| $40,000 to $44,999 | 449 (13.2%) | 371 (10.2%) |
| $45,000 to $49,999 | 146 (4.3%) | 307 (8.5%) |
| $50,000 to $54,999 | 378 (11.1%) | 86 (2.4%) |
| $55,000 to $64,999 | 171 (5.0%) | 204 (5.6%) |
| $65,000 to $74,999 | 267 (7.8%) | 83 (2.3%) |
| $75,000 to $99,999 | 230 (6.8%) | 93 (2.6%) |
| $100,000+ | 59 (1.7%) | 31 (0.9%) |
| Total | 3,405 (100.0%) | 3,624 (100.0%) |
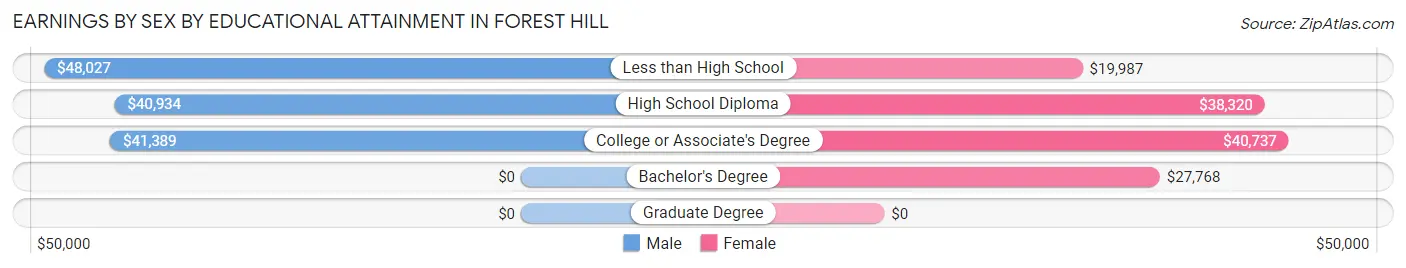
Earnings by Sex by Educational Attainment in Forest Hill
Average earnings in Forest Hill are $42,742 for men and $28,485 for women, a difference of 33.4%. Men with an educational attainment of less than high school enjoy the highest average annual earnings of $48,027, while those with high school diploma education earn the least with $40,934. Women with an educational attainment of college or associate's degree earn the most with the average annual earnings of $40,737, while those with less than high school education have the smallest earnings of $19,987.
| Educational Attainment | Male Income | Female Income |
| Less than High School | $48,027 | $19,987 |
| High School Diploma | $40,934 | $38,320 |
| College or Associate's Degree | $41,389 | $40,737 |
| Bachelor's Degree | - | - |
| Graduate Degree | - | - |
| Total | $42,742 | $28,485 |
Family Income in Forest Hill
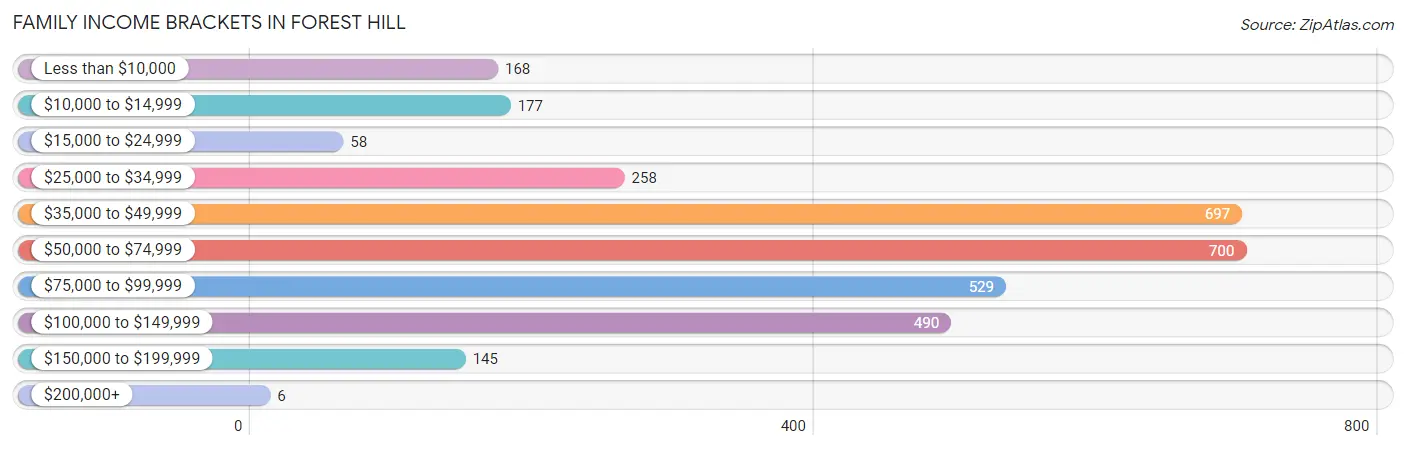
Family Income Brackets in Forest Hill
According to the Forest Hill family income data, there are 700 families falling into the $50,000 to $74,999 income range, which is the most common income bracket and makes up 21.7% of all families. Conversely, the $200,000+ income bracket is the least frequent group with only 6 families (0.2%) belonging to this category.
| Income Bracket | # Families | % Families |
| Less than $10,000 | 168 | 5.2% |
| $10,000 to $14,999 | 177 | 5.5% |
| $15,000 to $24,999 | 58 | 1.8% |
| $25,000 to $34,999 | 258 | 8.0% |
| $35,000 to $49,999 | 697 | 21.6% |
| $50,000 to $74,999 | 700 | 21.7% |
| $75,000 to $99,999 | 529 | 16.4% |
| $100,000 to $149,999 | 490 | 15.2% |
| $150,000 to $199,999 | 145 | 4.5% |
| $200,000+ | 6 | 0.2% |
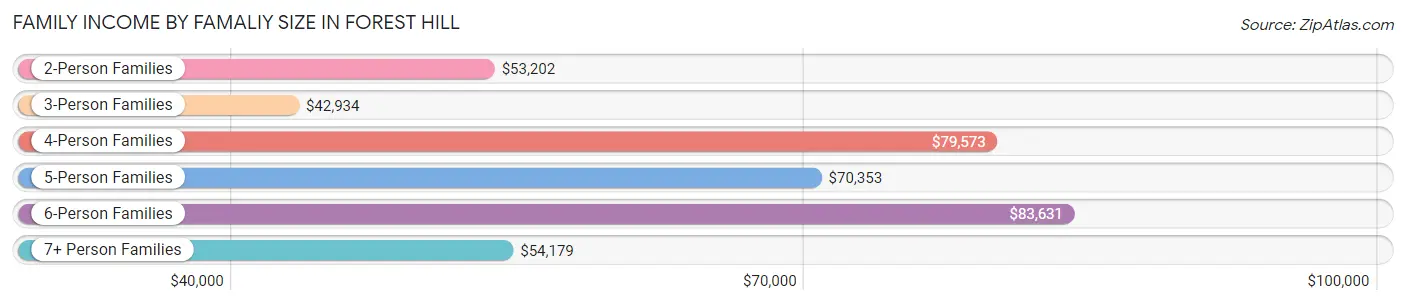
Family Income by Famaliy Size in Forest Hill
6-person families (291 | 9.0%) account for the highest median family income in Forest Hill with $83,631 per family, while 2-person families (937 | 29.0%) have the highest median income of $26,601 per family member.
| Income Bracket | # Families | Median Income |
| 2-Person Families | 937 (29.0%) | $53,202 |
| 3-Person Families | 890 (27.6%) | $42,934 |
| 4-Person Families | 476 (14.8%) | $79,573 |
| 5-Person Families | 572 (17.7%) | $70,353 |
| 6-Person Families | 291 (9.0%) | $83,631 |
| 7+ Person Families | 59 (1.8%) | $54,179 |
| Total | 3,225 (100.0%) | $56,541 |
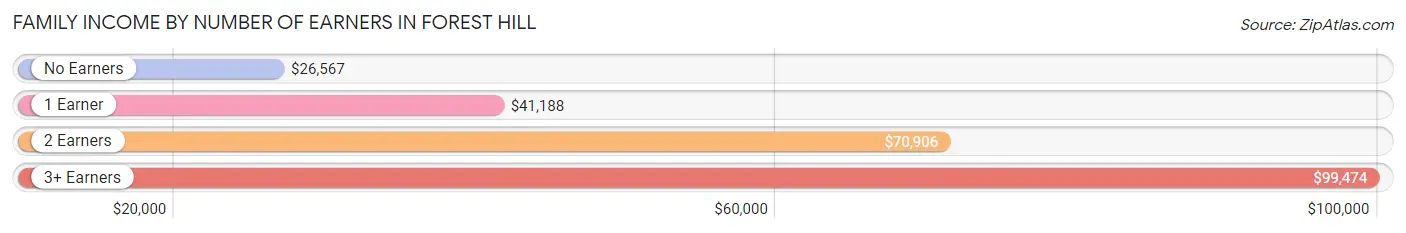
Family Income by Number of Earners in Forest Hill
The median family income in Forest Hill is $56,541, with families comprising 3+ earners (614) having the highest median family income of $99,474, while families with no earners (350) have the lowest median family income of $26,567, accounting for 19.0% and 10.8% of families, respectively.
| Number of Earners | # Families | Median Income |
| No Earners | 350 (10.8%) | $26,567 |
| 1 Earner | 979 (30.4%) | $41,188 |
| 2 Earners | 1,282 (39.8%) | $70,906 |
| 3+ Earners | 614 (19.0%) | $99,474 |
| Total | 3,225 (100.0%) | $56,541 |
Household Income in Forest Hill
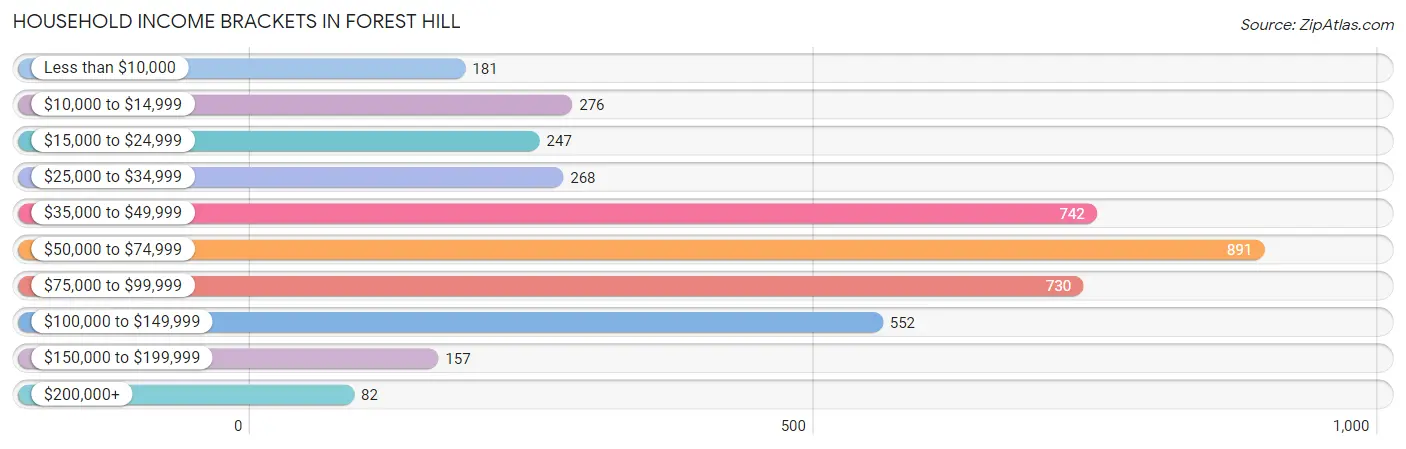
Household Income Brackets in Forest Hill
With 891 households falling in the category, the $50,000 to $74,999 income range is the most frequent in Forest Hill, accounting for 21.6% of all households. In contrast, only 82 households (2.0%) fall into the $200,000+ income bracket, making it the least populous group.
| Income Bracket | # Households | % Households |
| Less than $10,000 | 181 | 4.4% |
| $10,000 to $14,999 | 276 | 6.7% |
| $15,000 to $24,999 | 247 | 6.0% |
| $25,000 to $34,999 | 268 | 6.5% |
| $35,000 to $49,999 | 742 | 18.0% |
| $50,000 to $74,999 | 891 | 21.6% |
| $75,000 to $99,999 | 730 | 17.7% |
| $100,000 to $149,999 | 552 | 13.4% |
| $150,000 to $199,999 | 157 | 3.8% |
| $200,000+ | 82 | 2.0% |
Household Income by Householder Age in Forest Hill
The median household income in Forest Hill is $58,713, with the highest median household income of $70,517 found in the 45 to 64 years age bracket for the primary householder. A total of 1,609 households (39.0%) fall into this category. Meanwhile, the 65+ years age bracket for the primary householder has the lowest median household income of $40,485, with 877 households (21.3%) in this group.
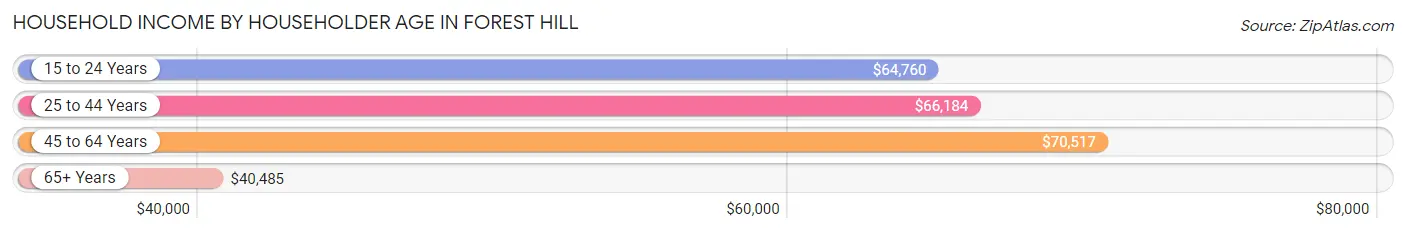
| Income Bracket | # Households | Median Income |
| 15 to 24 Years | 149 (3.6%) | $64,760 |
| 25 to 44 Years | 1,488 (36.1%) | $66,184 |
| 45 to 64 Years | 1,609 (39.0%) | $70,517 |
| 65+ Years | 877 (21.3%) | $40,485 |
| Total | 4,123 (100.0%) | $58,713 |
Poverty in Forest Hill
Income Below Poverty by Sex and Age in Forest Hill
With 8.1% poverty level for males and 14.3% for females among the residents of Forest Hill, under 5 year old males and 5 year old females are the most vulnerable to poverty, with 161 males (39.1%) and 73 females (51.8%) in their respective age groups living below the poverty level.
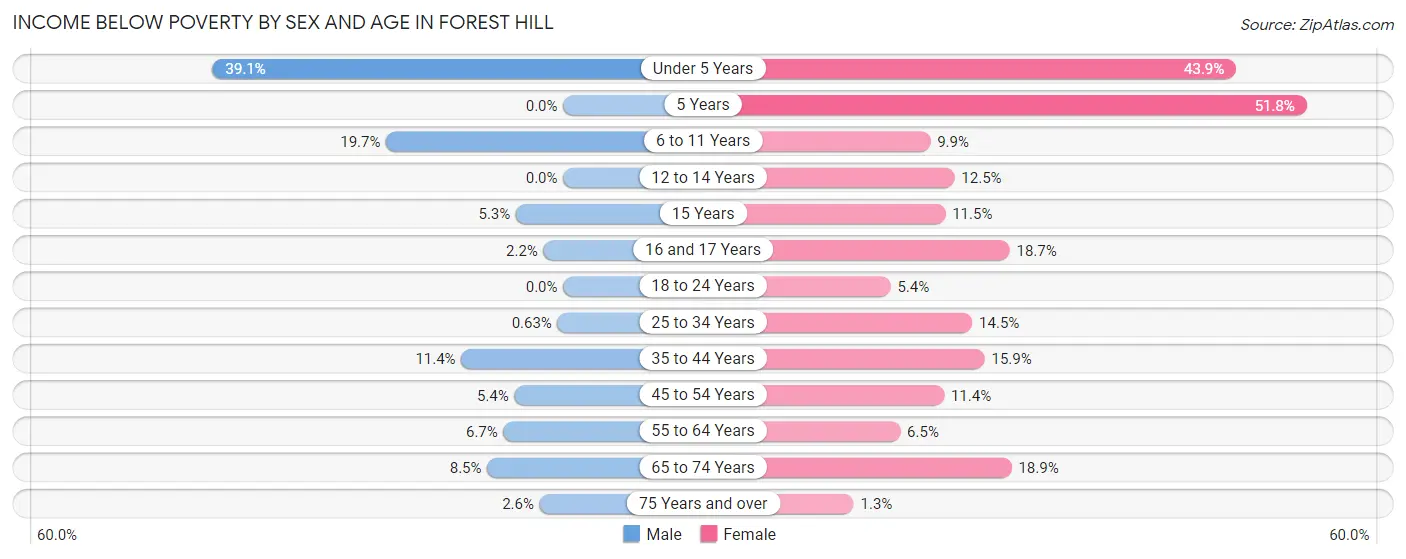
| Age Bracket | Male | Female |
| Under 5 Years | 161 (39.1%) | 202 (43.9%) |
| 5 Years | 0 (0.0%) | 73 (51.8%) |
| 6 to 11 Years | 85 (19.7%) | 89 (9.9%) |
| 12 to 14 Years | 0 (0.0%) | 37 (12.5%) |
| 15 Years | 5 (5.3%) | 31 (11.5%) |
| 16 and 17 Years | 8 (2.2%) | 68 (18.7%) |
| 18 to 24 Years | 0 (0.0%) | 43 (5.4%) |
| 25 to 34 Years | 5 (0.6%) | 177 (14.5%) |
| 35 to 44 Years | 97 (11.4%) | 159 (15.9%) |
| 45 to 54 Years | 47 (5.4%) | 105 (11.4%) |
| 55 to 64 Years | 29 (6.7%) | 53 (6.5%) |
| 65 to 74 Years | 27 (8.5%) | 96 (18.9%) |
| 75 Years and over | 8 (2.6%) | 3 (1.3%) |
| Total | 472 (8.1%) | 1,136 (14.3%) |
Income Above Poverty by Sex and Age in Forest Hill
According to the poverty statistics in Forest Hill, males aged 5 years and females aged 75 years and over are the age groups that are most secure financially, with 100.0% of males and 98.7% of females in these age groups living above the poverty line.
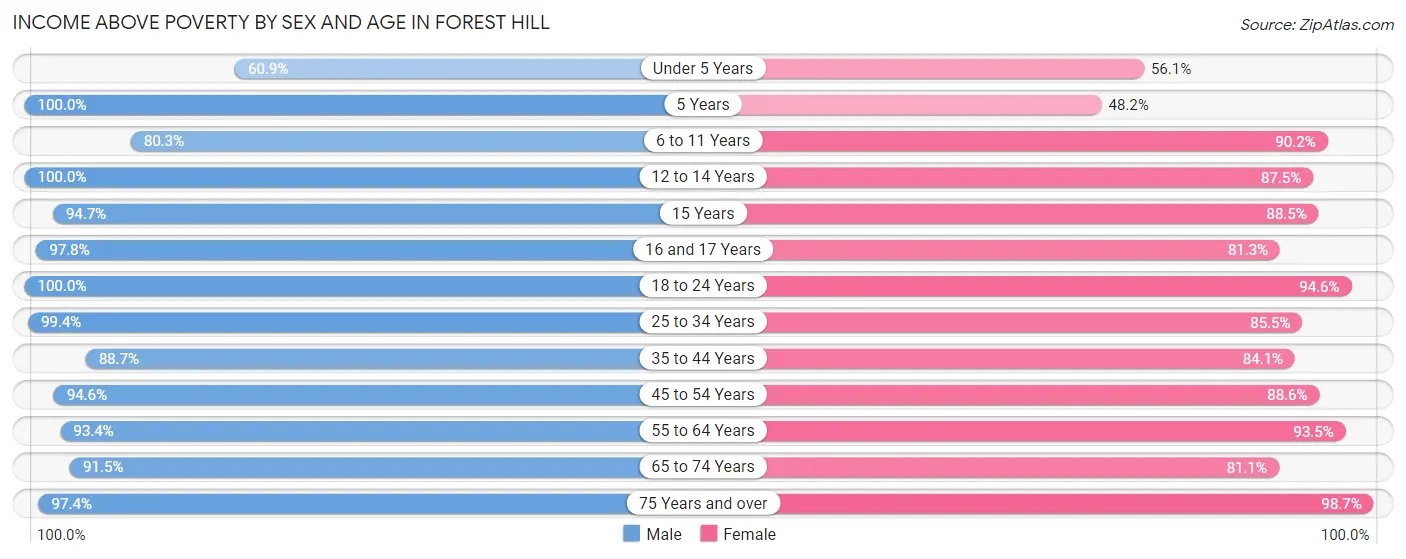
| Age Bracket | Male | Female |
| Under 5 Years | 251 (60.9%) | 258 (56.1%) |
| 5 Years | 162 (100.0%) | 68 (48.2%) |
| 6 to 11 Years | 346 (80.3%) | 815 (90.1%) |
| 12 to 14 Years | 152 (100.0%) | 258 (87.5%) |
| 15 Years | 90 (94.7%) | 238 (88.5%) |
| 16 and 17 Years | 358 (97.8%) | 296 (81.3%) |
| 18 to 24 Years | 651 (100.0%) | 750 (94.6%) |
| 25 to 34 Years | 794 (99.4%) | 1,042 (85.5%) |
| 35 to 44 Years | 758 (88.6%) | 841 (84.1%) |
| 45 to 54 Years | 818 (94.6%) | 818 (88.6%) |
| 55 to 64 Years | 407 (93.3%) | 762 (93.5%) |
| 65 to 74 Years | 292 (91.5%) | 412 (81.1%) |
| 75 Years and over | 297 (97.4%) | 226 (98.7%) |
| Total | 5,376 (91.9%) | 6,784 (85.7%) |
Income Below Poverty Among Married-Couple Families in Forest Hill
The poverty statistics for married-couple families in Forest Hill show that 8.0% or 156 of the total 1,953 families live below the poverty line. Families with 3 or 4 children have the highest poverty rate of 24.3%, comprising of 70 families. On the other hand, families with 1 or 2 children have the lowest poverty rate of 5.1%, which includes 43 families.
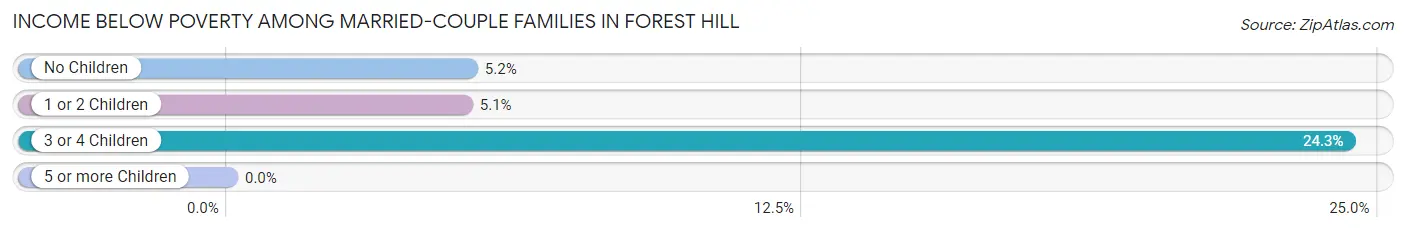
| Children | Above Poverty | Below Poverty |
| No Children | 781 (94.8%) | 43 (5.2%) |
| 1 or 2 Children | 798 (94.9%) | 43 (5.1%) |
| 3 or 4 Children | 218 (75.7%) | 70 (24.3%) |
| 5 or more Children | 0 (0.0%) | 0 (0.0%) |
| Total | 1,797 (92.0%) | 156 (8.0%) |
Income Below Poverty Among Single-Parent Households in Forest Hill
According to the poverty data in Forest Hill, 3.0% or 10 single-father households and 23.1% or 218 single-mother households are living below the poverty line. Among single-father households, those with 1 or 2 children have the highest poverty rate, with 10 households (3.4%) experiencing poverty. Likewise, among single-mother households, those with 1 or 2 children have the highest poverty rate, with 218 households (59.1%) falling below the poverty line.
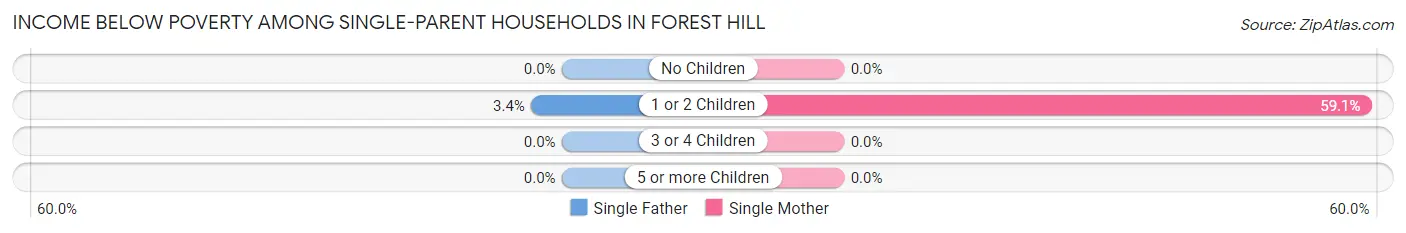
| Children | Single Father | Single Mother |
| No Children | 0 (0.0%) | 0 (0.0%) |
| 1 or 2 Children | 10 (3.4%) | 218 (59.1%) |
| 3 or 4 Children | 0 (0.0%) | 0 (0.0%) |
| 5 or more Children | 0 (0.0%) | 0 (0.0%) |
| Total | 10 (3.0%) | 218 (23.1%) |
Income Below Poverty Among Married-Couple vs Single-Parent Households in Forest Hill
The poverty data for Forest Hill shows that 156 of the married-couple family households (8.0%) and 228 of the single-parent households (17.9%) are living below the poverty level. Within the married-couple family households, those with 3 or 4 children have the highest poverty rate, with 70 households (24.3%) falling below the poverty line. Among the single-parent households, those with 1 or 2 children have the highest poverty rate, with 228 household (34.5%) living below poverty.
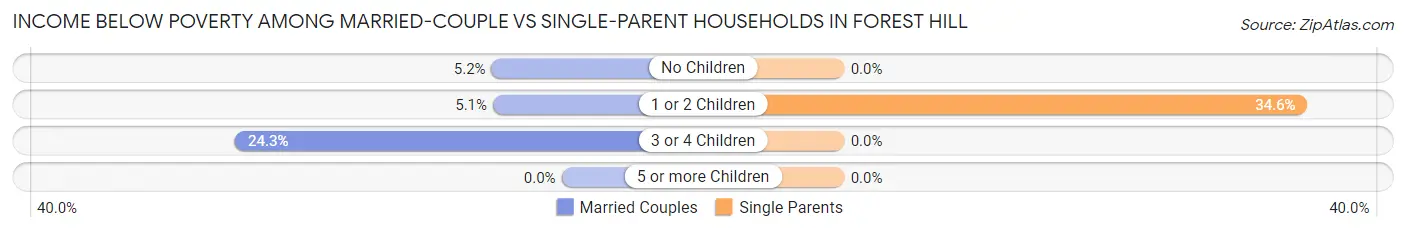
| Children | Married-Couple Families | Single-Parent Households |
| No Children | 43 (5.2%) | 0 (0.0%) |
| 1 or 2 Children | 43 (5.1%) | 228 (34.5%) |
| 3 or 4 Children | 70 (24.3%) | 0 (0.0%) |
| 5 or more Children | 0 (0.0%) | 0 (0.0%) |
| Total | 156 (8.0%) | 228 (17.9%) |
Race in Forest Hill
The most populous races in Forest Hill are Hispanic or Latino (6,663 | 48.2%), Black / African American (5,896 | 42.7%), and White / Caucasian (3,181 | 23.0%).
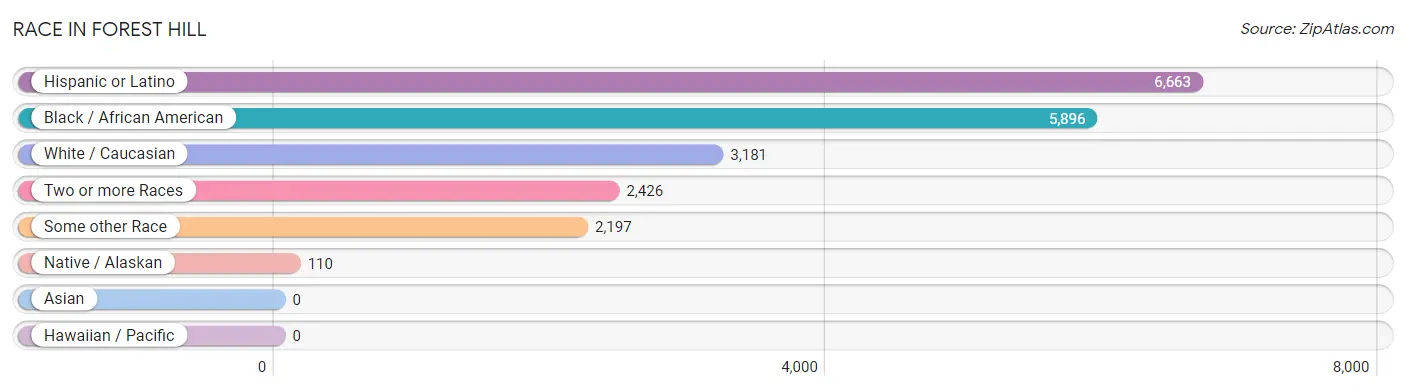
| Race | # Population | % Population |
| Asian | 0 | 0.0% |
| Black / African American | 5,896 | 42.7% |
| Hawaiian / Pacific | 0 | 0.0% |
| Hispanic or Latino | 6,663 | 48.2% |
| Native / Alaskan | 110 | 0.8% |
| White / Caucasian | 3,181 | 23.0% |
| Two or more Races | 2,426 | 17.6% |
| Some other Race | 2,197 | 15.9% |
| Total | 13,810 | 100.0% |
Ancestry in Forest Hill
The most populous ancestries reported in Forest Hill are Mexican (6,024 | 43.6%), American (617 | 4.5%), German (284 | 2.1%), Puerto Rican (266 | 1.9%), and Central American (259 | 1.9%), together accounting for 54.0% of all Forest Hill residents.
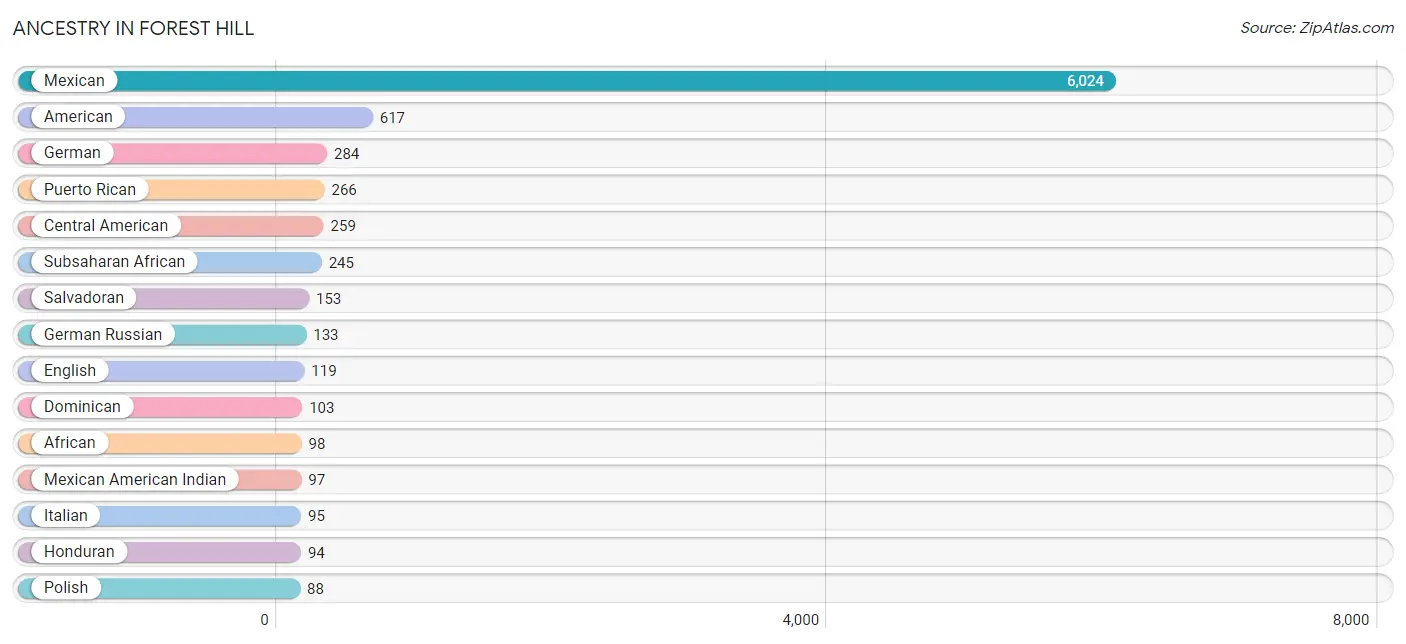
| Ancestry | # Population | % Population |
| African | 98 | 0.7% |
| American | 617 | 4.5% |
| Arab | 7 | 0.1% |
| Bhutanese | 80 | 0.6% |
| Blackfeet | 8 | 0.1% |
| Central American | 259 | 1.9% |
| Central American Indian | 39 | 0.3% |
| Cherokee | 9 | 0.1% |
| Czech | 7 | 0.1% |
| Danish | 29 | 0.2% |
| Dominican | 103 | 0.7% |
| Ecuadorian | 11 | 0.1% |
| English | 119 | 0.9% |
| European | 20 | 0.1% |
| French | 14 | 0.1% |
| German | 284 | 2.1% |
| German Russian | 133 | 1.0% |
| Haitian | 34 | 0.3% |
| Honduran | 94 | 0.7% |
| Irish | 75 | 0.5% |
| Italian | 95 | 0.7% |
| Jamaican | 66 | 0.5% |
| Mexican | 6,024 | 43.6% |
| Mexican American Indian | 97 | 0.7% |
| Nigerian | 62 | 0.4% |
| Norwegian | 37 | 0.3% |
| Panamanian | 12 | 0.1% |
| Polish | 88 | 0.6% |
| Puerto Rican | 266 | 1.9% |
| Salvadoran | 153 | 1.1% |
| Scotch-Irish | 30 | 0.2% |
| Scottish | 4 | 0.0% |
| South American | 11 | 0.1% |
| Subsaharan African | 245 | 1.8% |
| Trinidadian and Tobagonian | 7 | 0.1% | View All 35 Rows |
Immigrants in Forest Hill
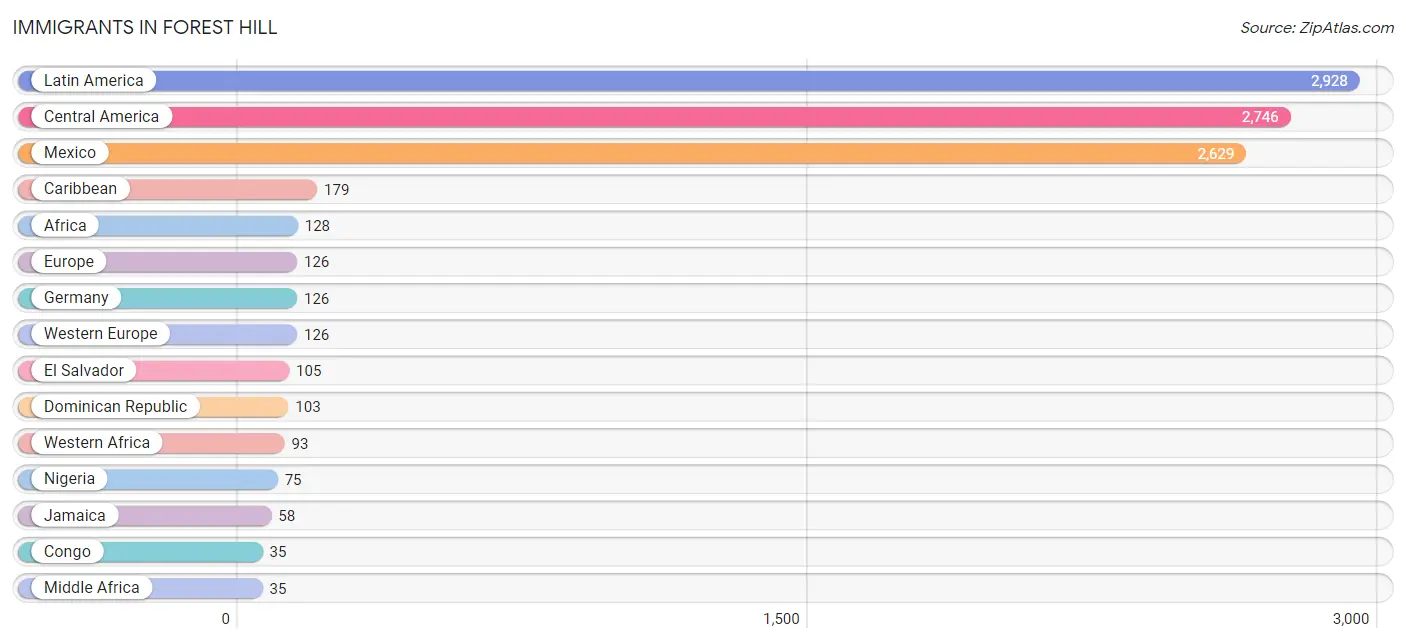
The most numerous immigrant groups reported in Forest Hill came from Latin America (2,928 | 21.2%), Central America (2,746 | 19.9%), Mexico (2,629 | 19.0%), Caribbean (179 | 1.3%), and Africa (128 | 0.9%), together accounting for 62.3% of all Forest Hill residents.
| Immigration Origin | # Population | % Population |
| Africa | 128 | 0.9% |
| Caribbean | 179 | 1.3% |
| Central America | 2,746 | 19.9% |
| Congo | 35 | 0.3% |
| Dominican Republic | 103 | 0.7% |
| El Salvador | 105 | 0.8% |
| Europe | 126 | 0.9% |
| Germany | 126 | 0.9% |
| Ghana | 18 | 0.1% |
| Haiti | 11 | 0.1% |
| Honduras | 12 | 0.1% |
| Jamaica | 58 | 0.4% |
| Latin America | 2,928 | 21.2% |
| Mexico | 2,629 | 19.0% |
| Middle Africa | 35 | 0.3% |
| Nigeria | 75 | 0.5% |
| Peru | 3 | 0.0% |
| South America | 3 | 0.0% |
| Trinidad and Tobago | 7 | 0.1% |
| Western Africa | 93 | 0.7% |
| Western Europe | 126 | 0.9% | View All 21 Rows |
Sex and Age in Forest Hill
Sex and Age in Forest Hill
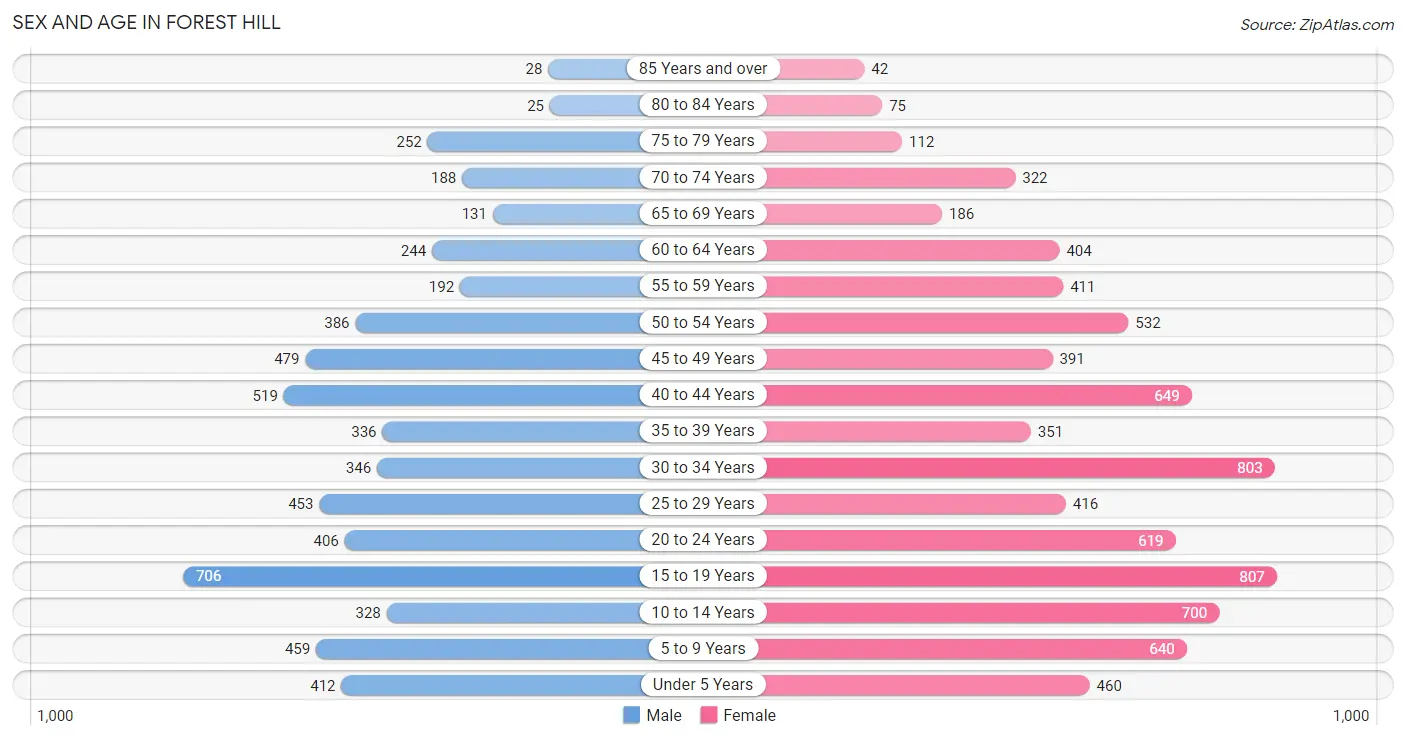
The most populous age groups in Forest Hill are 15 to 19 Years (706 | 12.0%) for men and 15 to 19 Years (807 | 10.2%) for women.
| Age Bracket | Male | Female |
| Under 5 Years | 412 (7.0%) | 460 (5.8%) |
| 5 to 9 Years | 459 (7.8%) | 640 (8.1%) |
| 10 to 14 Years | 328 (5.6%) | 700 (8.8%) |
| 15 to 19 Years | 706 (12.0%) | 807 (10.2%) |
| 20 to 24 Years | 406 (6.9%) | 619 (7.8%) |
| 25 to 29 Years | 453 (7.7%) | 416 (5.2%) |
| 30 to 34 Years | 346 (5.9%) | 803 (10.1%) |
| 35 to 39 Years | 336 (5.7%) | 351 (4.4%) |
| 40 to 44 Years | 519 (8.8%) | 649 (8.2%) |
| 45 to 49 Years | 479 (8.1%) | 391 (4.9%) |
| 50 to 54 Years | 386 (6.6%) | 532 (6.7%) |
| 55 to 59 Years | 192 (3.3%) | 411 (5.2%) |
| 60 to 64 Years | 244 (4.1%) | 404 (5.1%) |
| 65 to 69 Years | 131 (2.2%) | 186 (2.4%) |
| 70 to 74 Years | 188 (3.2%) | 322 (4.1%) |
| 75 to 79 Years | 252 (4.3%) | 112 (1.4%) |
| 80 to 84 Years | 25 (0.4%) | 75 (0.9%) |
| 85 Years and over | 28 (0.5%) | 42 (0.5%) |
| Total | 5,890 (100.0%) | 7,920 (100.0%) |
Families and Households in Forest Hill
Median Family Size in Forest Hill
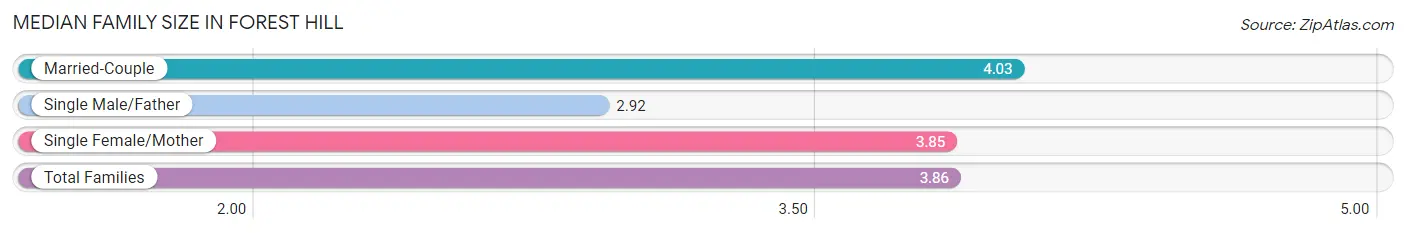
The median family size in Forest Hill is 3.86 persons per family, with married-couple families (1,953 | 60.6%) accounting for the largest median family size of 4.03 persons per family. On the other hand, single male/father families (329 | 10.2%) represent the smallest median family size with 2.92 persons per family.
| Family Type | # Families | Family Size |
| Married-Couple | 1,953 (60.6%) | 4.03 |
| Single Male/Father | 329 (10.2%) | 2.92 |
| Single Female/Mother | 943 (29.2%) | 3.85 |
| Total Families | 3,225 (100.0%) | 3.86 |
Median Household Size in Forest Hill
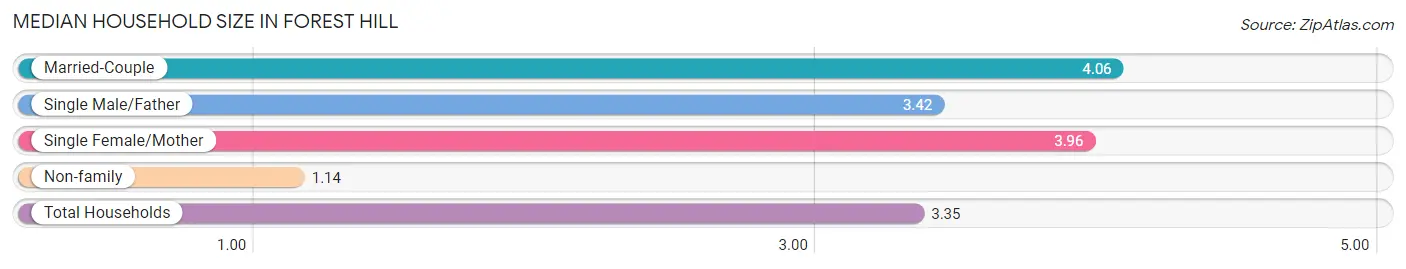
The median household size in Forest Hill is 3.35 persons per household, with married-couple households (1,953 | 47.4%) accounting for the largest median household size of 4.06 persons per household. non-family households (898 | 21.8%) represent the smallest median household size with 1.14 persons per household.
| Household Type | # Households | Household Size |
| Married-Couple | 1,953 (47.4%) | 4.06 |
| Single Male/Father | 329 (8.0%) | 3.42 |
| Single Female/Mother | 943 (22.9%) | 3.96 |
| Non-family | 898 (21.8%) | 1.14 |
| Total Households | 4,123 (100.0%) | 3.35 |
Household Size by Marriage Status in Forest Hill
Out of a total of 4,123 households in Forest Hill, 3,225 (78.2%) are family households, while 898 (21.8%) are nonfamily households. The most numerous type of family households are 2-person households, comprising 912, and the most common type of nonfamily households are 1-person households, comprising 799.
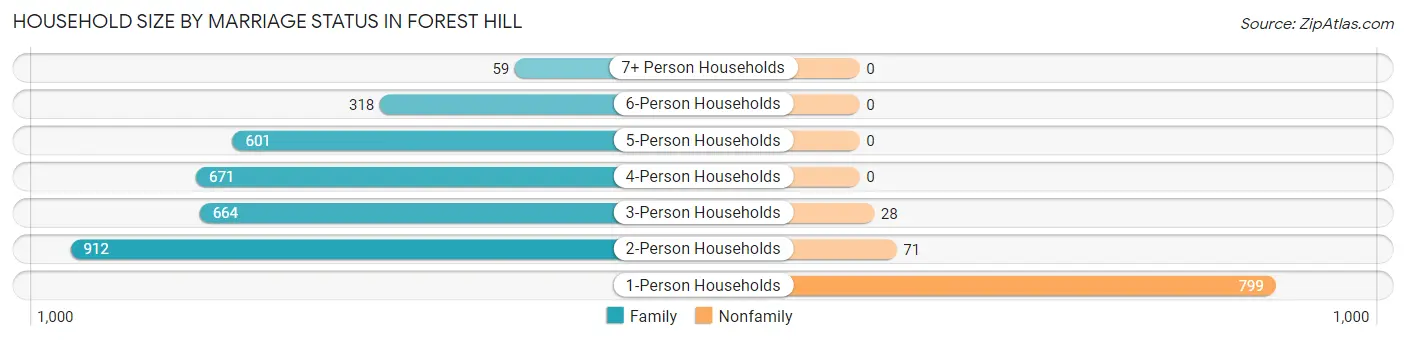
| Household Size | Family Households | Nonfamily Households |
| 1-Person Households | - | 799 (19.4%) |
| 2-Person Households | 912 (22.1%) | 71 (1.7%) |
| 3-Person Households | 664 (16.1%) | 28 (0.7%) |
| 4-Person Households | 671 (16.3%) | 0 (0.0%) |
| 5-Person Households | 601 (14.6%) | 0 (0.0%) |
| 6-Person Households | 318 (7.7%) | 0 (0.0%) |
| 7+ Person Households | 59 (1.4%) | 0 (0.0%) |
| Total | 3,225 (78.2%) | 898 (21.8%) |
Female Fertility in Forest Hill
Fertility by Age in Forest Hill
Average fertility rate in Forest Hill is 52.0 births per 1,000 women. Women in the age bracket of 20 to 34 years have the highest fertility rate with 111.0 births per 1,000 women. Women in the age bracket of 20 to 34 years acount for 94.9% of all women with births.
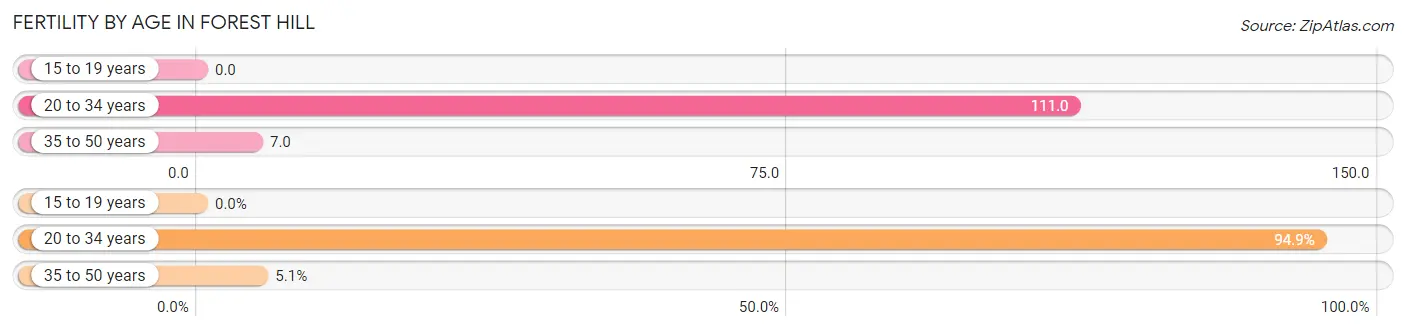
| Age Bracket | Women with Births | Births / 1,000 Women |
| 15 to 19 years | 0 (0.0%) | 0.0 |
| 20 to 34 years | 204 (94.9%) | 111.0 |
| 35 to 50 years | 11 (5.1%) | 7.0 |
| Total | 215 (100.0%) | 52.0 |
Fertility by Age by Marriage Status in Forest Hill
7.9% of women with births (215) in Forest Hill are married. The highest percentage of unmarried women with births falls into 20 to 34 years age bracket with 97.1% of them unmarried at the time of birth, while the lowest percentage of unmarried women with births belong to 35 to 50 years age bracket with 0.0% of them unmarried.
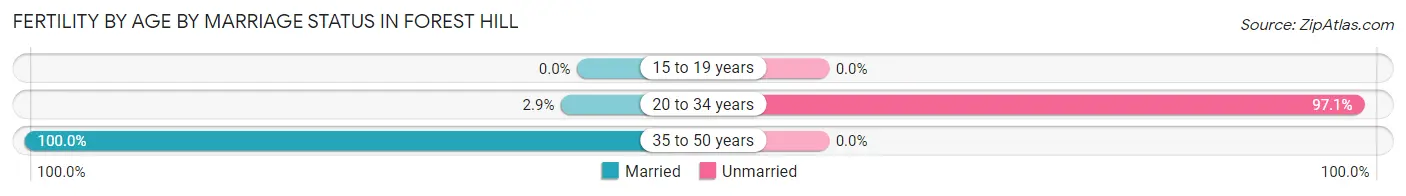
| Age Bracket | Married | Unmarried |
| 15 to 19 years | 0 (0.0%) | 0 (0.0%) |
| 20 to 34 years | 6 (2.9%) | 198 (97.1%) |
| 35 to 50 years | 11 (100.0%) | 0 (0.0%) |
| Total | 17 (7.9%) | 198 (92.1%) |
Fertility by Education in Forest Hill
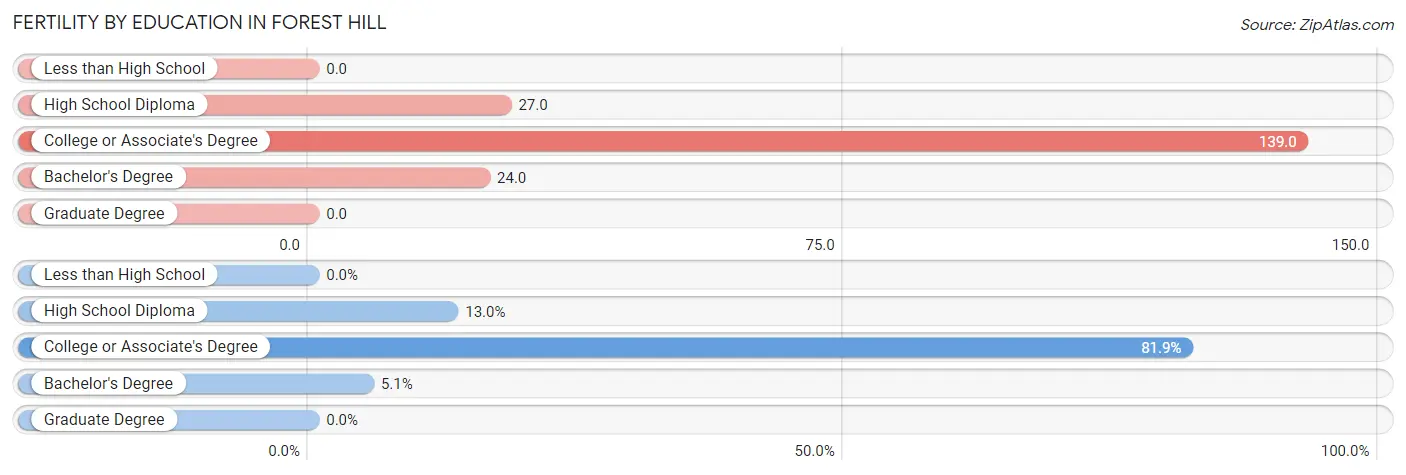
| Educational Attainment | Women with Births | Births / 1,000 Women |
| Less than High School | 0 (0.0%) | 0.0 |
| High School Diploma | 28 (13.0%) | 27.0 |
| College or Associate's Degree | 176 (81.9%) | 139.0 |
| Bachelor's Degree | 11 (5.1%) | 24.0 |
| Graduate Degree | 0 (0.0%) | 0.0 |
| Total | 215 (100.0%) | 52.0 |
Fertility by Education by Marriage Status in Forest Hill
92.1% of women with births in Forest Hill are unmarried. Women with the educational attainment of bachelor's degree are most likely to be married with 100.0% of them married at childbirth, while women with the educational attainment of college or associate's degree are least likely to be married with 100.0% of them unmarried at childbirth.
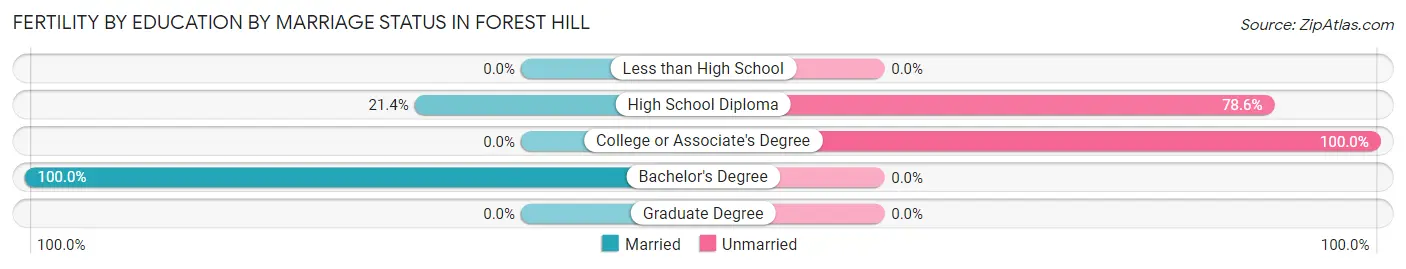
| Educational Attainment | Married | Unmarried |
| Less than High School | 0 (0.0%) | 0 (0.0%) |
| High School Diploma | 6 (21.4%) | 22 (78.6%) |
| College or Associate's Degree | 0 (0.0%) | 176 (100.0%) |
| Bachelor's Degree | 11 (100.0%) | 0 (0.0%) |
| Graduate Degree | 0 (0.0%) | 0 (0.0%) |
| Total | 17 (7.9%) | 198 (92.1%) |
Employment Characteristics in Forest Hill
Employment by Class of Employer in Forest Hill
Among the 6,029 employed individuals in Forest Hill, private company employees (4,606 | 76.4%), self-employed (not incorporated) (532 | 8.8%), and local government employees (420 | 7.0%) make up the most common classes of employment.
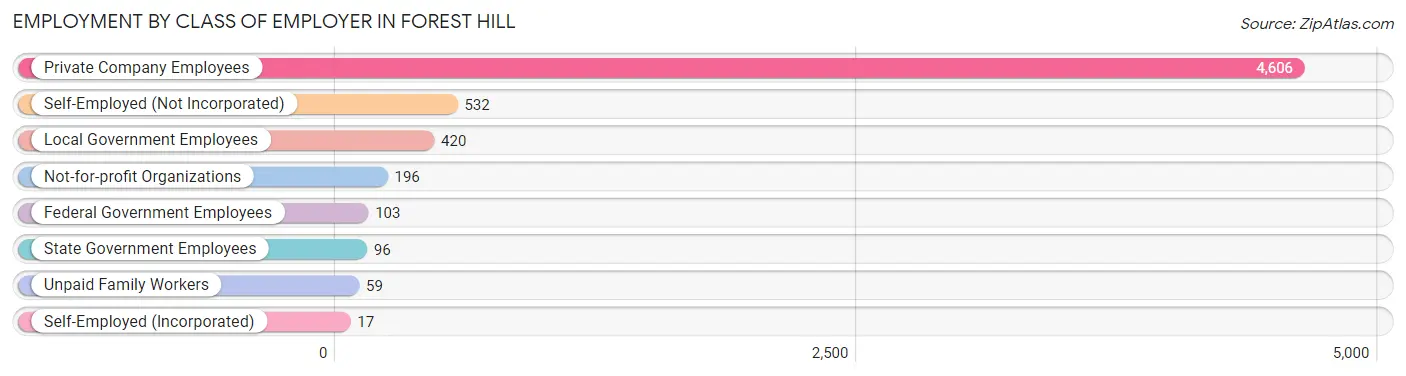
| Employer Class | # Employees | % Employees |
| Private Company Employees | 4,606 | 76.4% |
| Self-Employed (Incorporated) | 17 | 0.3% |
| Self-Employed (Not Incorporated) | 532 | 8.8% |
| Not-for-profit Organizations | 196 | 3.3% |
| Local Government Employees | 420 | 7.0% |
| State Government Employees | 96 | 1.6% |
| Federal Government Employees | 103 | 1.7% |
| Unpaid Family Workers | 59 | 1.0% |
| Total | 6,029 | 100.0% |
Employment Status by Age in Forest Hill
According to the labor force statistics for Forest Hill, out of the total population over 16 years of age (10,447), 63.9% or 6,676 individuals are in the labor force, with 7.6% or 507 of them unemployed. The age group with the highest labor force participation rate is 20 to 24 years, with 89.2% or 914 individuals in the labor force. Within the labor force, the 16 to 19 years age range has the highest percentage of unemployed individuals, with 22.1% or 93 of them being unemployed.
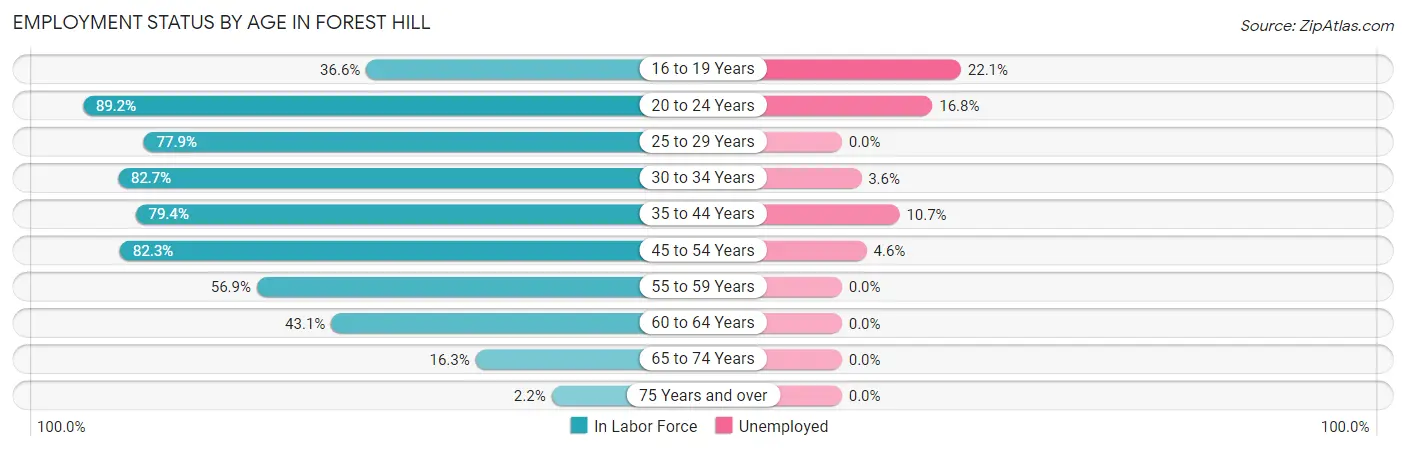
| Age Bracket | In Labor Force | Unemployed |
| 16 to 19 Years | 421 (36.6%) | 93 (22.1%) |
| 20 to 24 Years | 914 (89.2%) | 154 (16.8%) |
| 25 to 29 Years | 677 (77.9%) | 0 (0.0%) |
| 30 to 34 Years | 950 (82.7%) | 34 (3.6%) |
| 35 to 44 Years | 1,473 (79.4%) | 158 (10.7%) |
| 45 to 54 Years | 1,472 (82.3%) | 68 (4.6%) |
| 55 to 59 Years | 343 (56.9%) | 0 (0.0%) |
| 60 to 64 Years | 279 (43.1%) | 0 (0.0%) |
| 65 to 74 Years | 135 (16.3%) | 0 (0.0%) |
| 75 Years and over | 12 (2.2%) | 0 (0.0%) |
| Total | 6,676 (63.9%) | 507 (7.6%) |
Employment Status by Educational Attainment in Forest Hill
According to labor force statistics for Forest Hill, 75.1% of individuals (5,191) out of the total population between 25 and 64 years of age (6,912) are in the labor force, with 5.0% or 260 of them being unemployed. The group with the highest labor force participation rate are those with the educational attainment of college / associate degree, with 80.7% or 1,665 individuals in the labor force. Within the labor force, individuals with bachelor's degree or higher education have the highest percentage of unemployment, with 7.2% or 43 of them being unemployed.
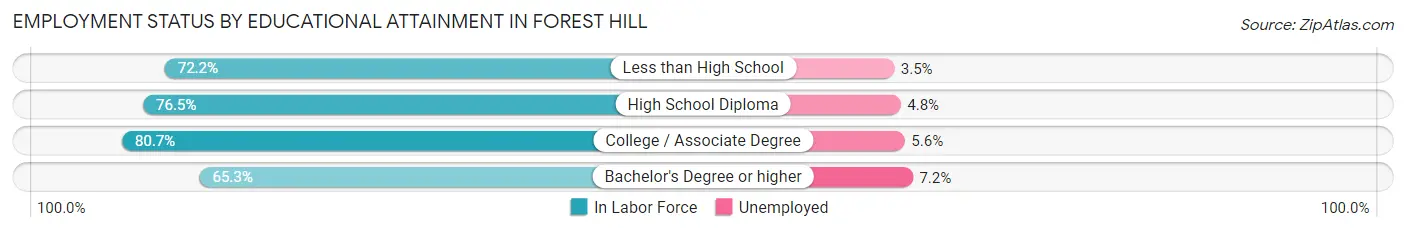
| Educational Attainment | In Labor Force | Unemployed |
| Less than High School | 1,335 (72.2%) | 65 (3.5%) |
| High School Diploma | 1,598 (76.5%) | 100 (4.8%) |
| College / Associate Degree | 1,665 (80.7%) | 116 (5.6%) |
| Bachelor's Degree or higher | 595 (65.3%) | 66 (7.2%) |
| Total | 5,191 (75.1%) | 346 (5.0%) |
Employment Occupations by Sex in Forest Hill
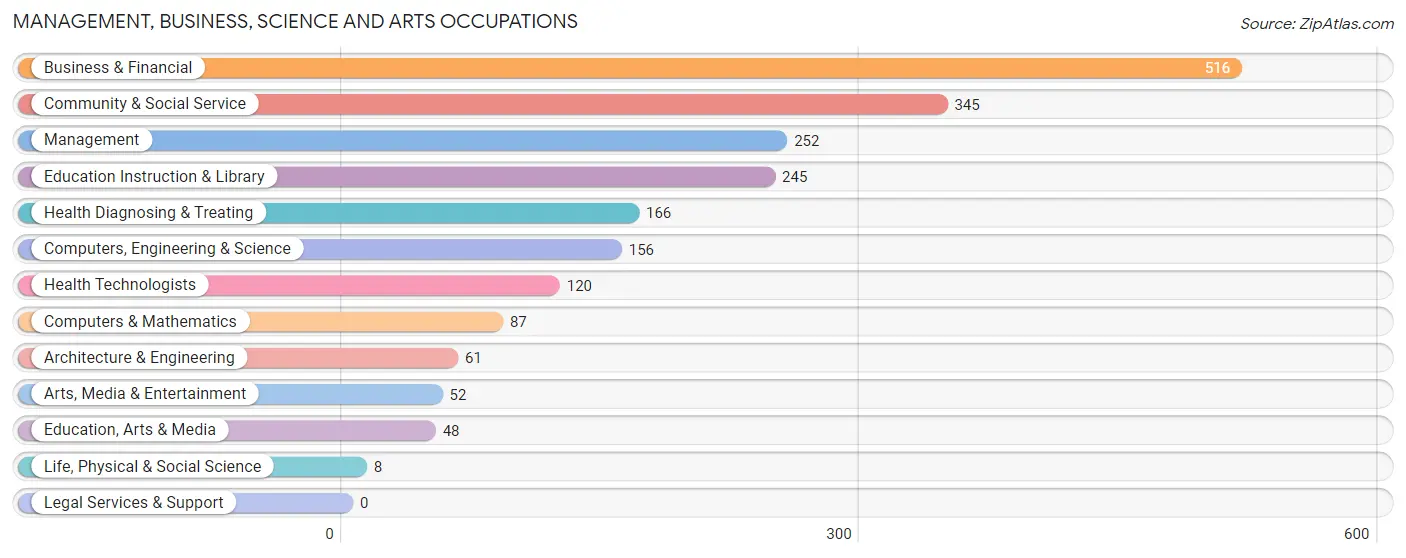
Management, Business, Science and Arts Occupations
The most common Management, Business, Science and Arts occupations in Forest Hill are Business & Financial (516 | 8.4%), Community & Social Service (345 | 5.6%), Management (252 | 4.1%), Education Instruction & Library (245 | 4.0%), and Health Diagnosing & Treating (166 | 2.7%).
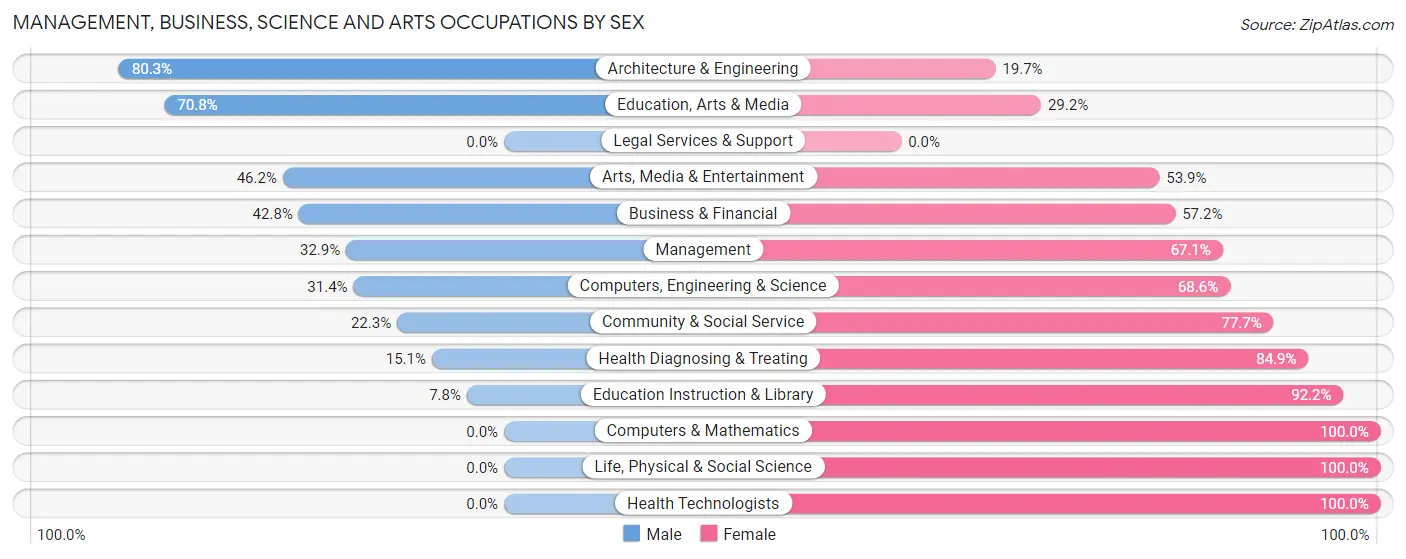
Management, Business, Science and Arts Occupations by Sex
Within the Management, Business, Science and Arts occupations in Forest Hill, the most male-oriented occupations are Architecture & Engineering (80.3%), Education, Arts & Media (70.8%), and Arts, Media & Entertainment (46.2%), while the most female-oriented occupations are Computers & Mathematics (100.0%), Life, Physical & Social Science (100.0%), and Health Technologists (100.0%).
| Occupation | Male | Female |
| Management | 83 (32.9%) | 169 (67.1%) |
| Business & Financial | 221 (42.8%) | 295 (57.2%) |
| Computers, Engineering & Science | 49 (31.4%) | 107 (68.6%) |
| Computers & Mathematics | 0 (0.0%) | 87 (100.0%) |
| Architecture & Engineering | 49 (80.3%) | 12 (19.7%) |
| Life, Physical & Social Science | 0 (0.0%) | 8 (100.0%) |
| Community & Social Service | 77 (22.3%) | 268 (77.7%) |
| Education, Arts & Media | 34 (70.8%) | 14 (29.2%) |
| Legal Services & Support | 0 (0.0%) | 0 (0.0%) |
| Education Instruction & Library | 19 (7.8%) | 226 (92.2%) |
| Arts, Media & Entertainment | 24 (46.2%) | 28 (53.8%) |
| Health Diagnosing & Treating | 25 (15.1%) | 141 (84.9%) |
| Health Technologists | 0 (0.0%) | 120 (100.0%) |
| Total (Category) | 455 (31.7%) | 980 (68.3%) |
| Total (Overall) | 3,102 (50.3%) | 3,067 (49.7%) |
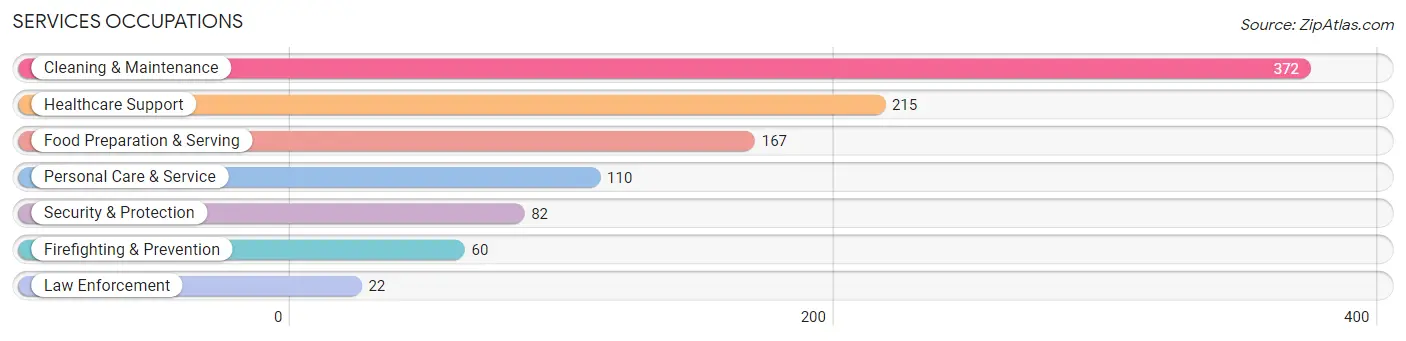
Services Occupations
The most common Services occupations in Forest Hill are Cleaning & Maintenance (372 | 6.0%), Healthcare Support (215 | 3.5%), Food Preparation & Serving (167 | 2.7%), Personal Care & Service (110 | 1.8%), and Security & Protection (82 | 1.3%).
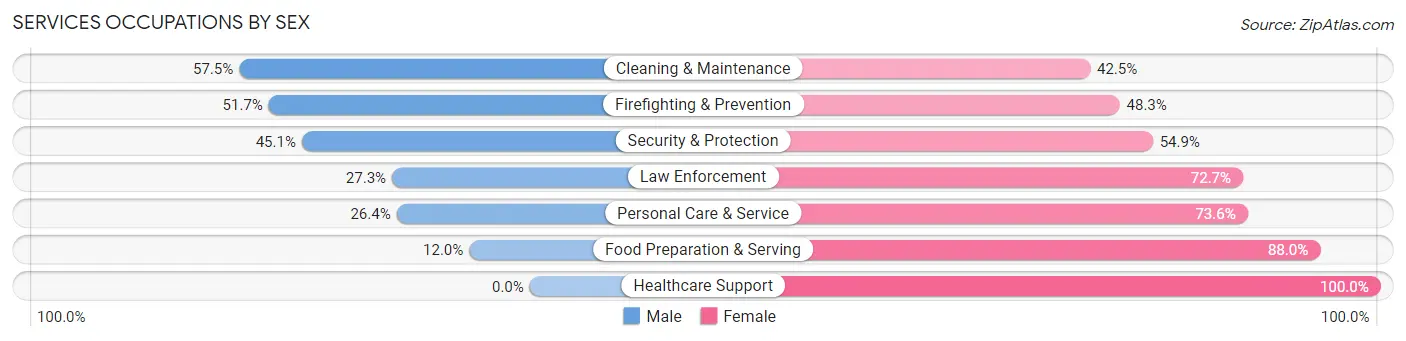
Services Occupations by Sex
Within the Services occupations in Forest Hill, the most male-oriented occupations are Cleaning & Maintenance (57.5%), Firefighting & Prevention (51.7%), and Security & Protection (45.1%), while the most female-oriented occupations are Healthcare Support (100.0%), Food Preparation & Serving (88.0%), and Personal Care & Service (73.6%).
| Occupation | Male | Female |
| Healthcare Support | 0 (0.0%) | 215 (100.0%) |
| Security & Protection | 37 (45.1%) | 45 (54.9%) |
| Firefighting & Prevention | 31 (51.7%) | 29 (48.3%) |
| Law Enforcement | 6 (27.3%) | 16 (72.7%) |
| Food Preparation & Serving | 20 (12.0%) | 147 (88.0%) |
| Cleaning & Maintenance | 214 (57.5%) | 158 (42.5%) |
| Personal Care & Service | 29 (26.4%) | 81 (73.6%) |
| Total (Category) | 300 (31.7%) | 646 (68.3%) |
| Total (Overall) | 3,102 (50.3%) | 3,067 (49.7%) |
Sales and Office Occupations
The most common Sales and Office occupations in Forest Hill are Office & Administration (892 | 14.5%), and Sales & Related (570 | 9.2%).
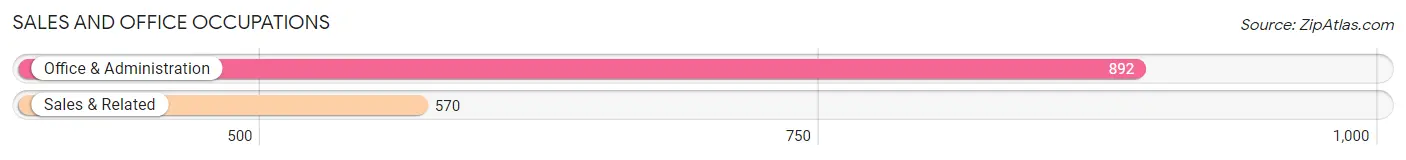
Sales and Office Occupations by Sex
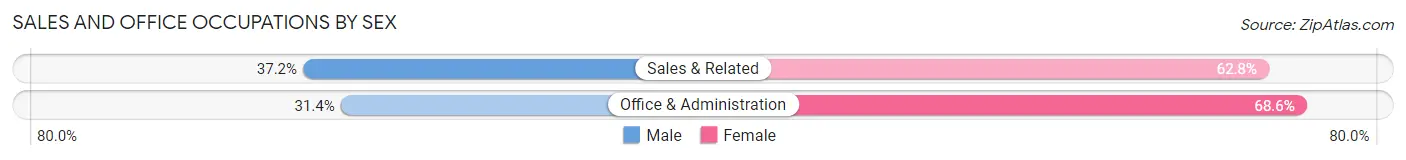
| Occupation | Male | Female |
| Sales & Related | 212 (37.2%) | 358 (62.8%) |
| Office & Administration | 280 (31.4%) | 612 (68.6%) |
| Total (Category) | 492 (33.7%) | 970 (66.3%) |
| Total (Overall) | 3,102 (50.3%) | 3,067 (49.7%) |
Natural Resources, Construction and Maintenance Occupations
The most common Natural Resources, Construction and Maintenance occupations in Forest Hill are Construction & Extraction (617 | 10.0%), and Installation, Maintenance & Repair (85 | 1.4%).
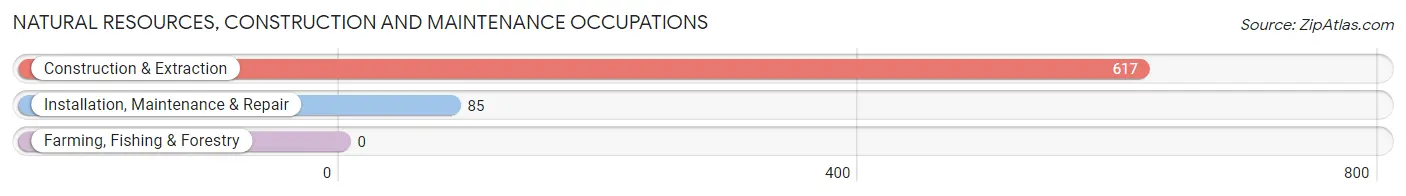
Natural Resources, Construction and Maintenance Occupations by Sex
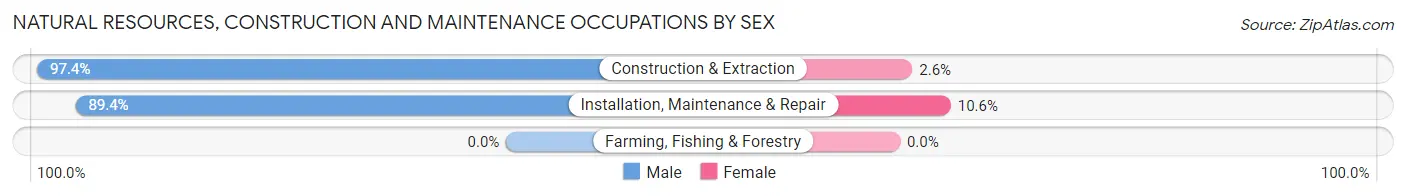
| Occupation | Male | Female |
| Farming, Fishing & Forestry | 0 (0.0%) | 0 (0.0%) |
| Construction & Extraction | 601 (97.4%) | 16 (2.6%) |
| Installation, Maintenance & Repair | 76 (89.4%) | 9 (10.6%) |
| Total (Category) | 677 (96.4%) | 25 (3.6%) |
| Total (Overall) | 3,102 (50.3%) | 3,067 (49.7%) |
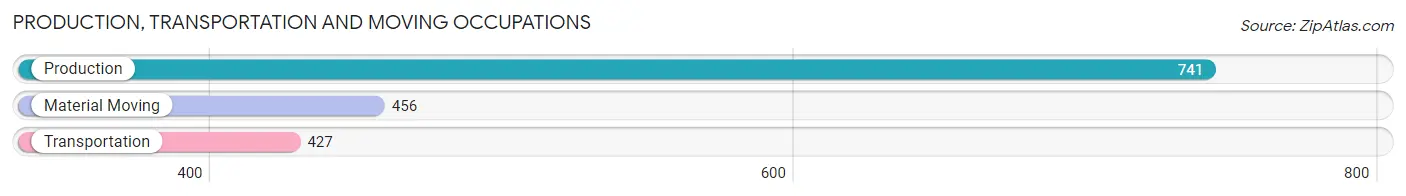
Production, Transportation and Moving Occupations
The most common Production, Transportation and Moving occupations in Forest Hill are Production (741 | 12.0%), Material Moving (456 | 7.4%), and Transportation (427 | 6.9%).
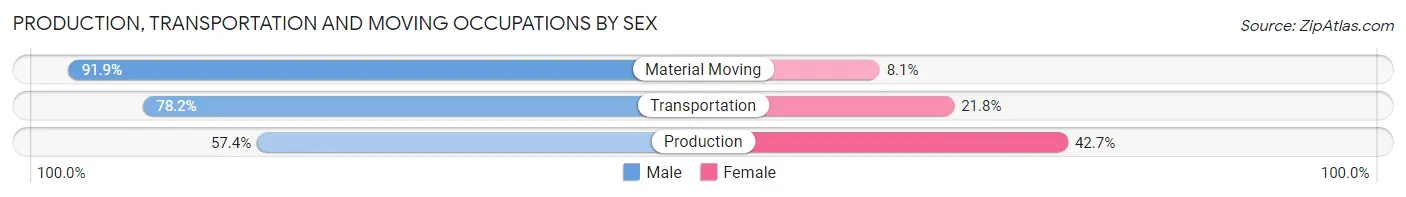
Production, Transportation and Moving Occupations by Sex
| Occupation | Male | Female |
| Production | 425 (57.4%) | 316 (42.6%) |
| Transportation | 334 (78.2%) | 93 (21.8%) |
| Material Moving | 419 (91.9%) | 37 (8.1%) |
| Total (Category) | 1,178 (72.5%) | 446 (27.5%) |
| Total (Overall) | 3,102 (50.3%) | 3,067 (49.7%) |
Employment Industries by Sex in Forest Hill
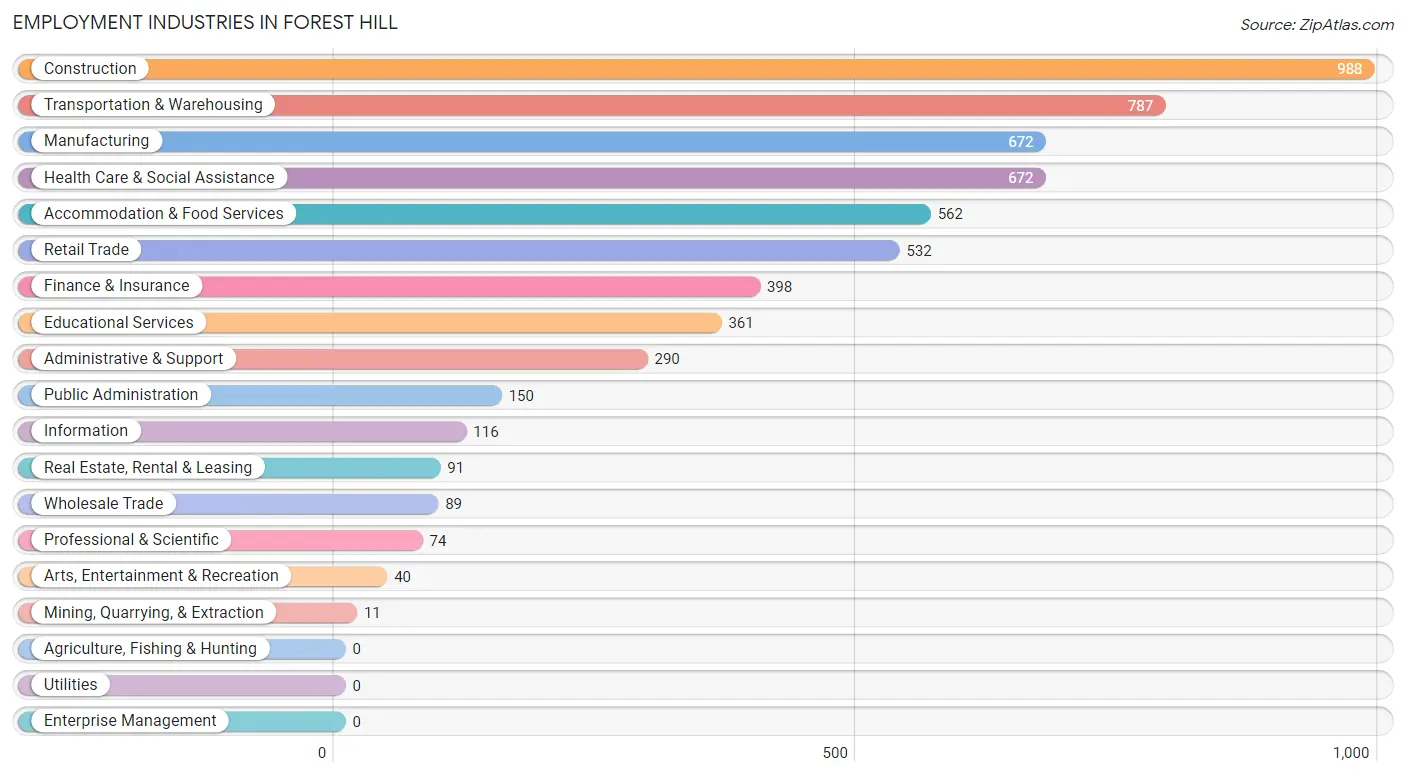
Employment Industries in Forest Hill
The major employment industries in Forest Hill include Construction (988 | 16.0%), Transportation & Warehousing (787 | 12.8%), Manufacturing (672 | 10.9%), Health Care & Social Assistance (672 | 10.9%), and Accommodation & Food Services (562 | 9.1%).
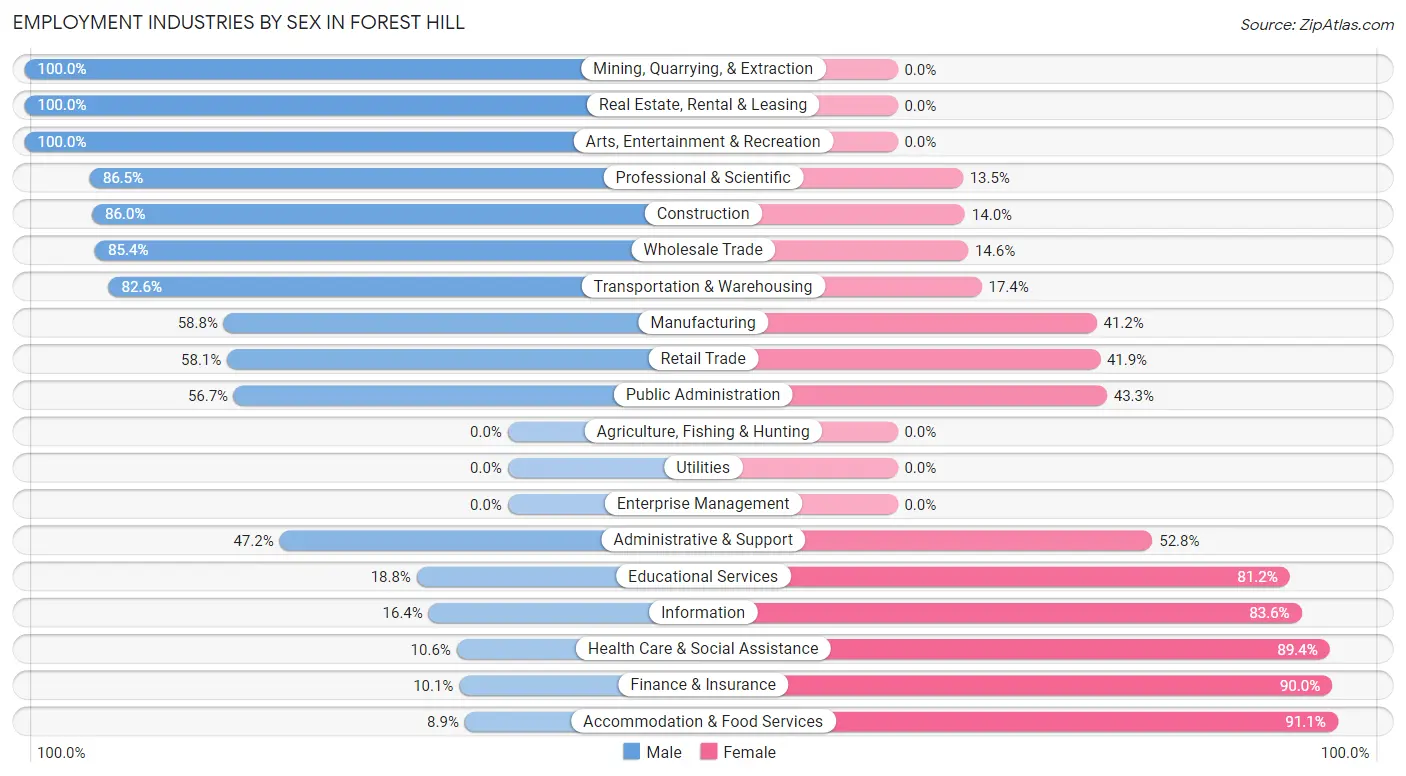
Employment Industries by Sex in Forest Hill
The Forest Hill industries that see more men than women are Mining, Quarrying, & Extraction (100.0%), Real Estate, Rental & Leasing (100.0%), and Arts, Entertainment & Recreation (100.0%), whereas the industries that tend to have a higher number of women are Accommodation & Food Services (91.1%), Finance & Insurance (89.9%), and Health Care & Social Assistance (89.4%).
| Industry | Male | Female |
| Agriculture, Fishing & Hunting | 0 (0.0%) | 0 (0.0%) |
| Mining, Quarrying, & Extraction | 11 (100.0%) | 0 (0.0%) |
| Construction | 850 (86.0%) | 138 (14.0%) |
| Manufacturing | 395 (58.8%) | 277 (41.2%) |
| Wholesale Trade | 76 (85.4%) | 13 (14.6%) |
| Retail Trade | 309 (58.1%) | 223 (41.9%) |
| Transportation & Warehousing | 650 (82.6%) | 137 (17.4%) |
| Utilities | 0 (0.0%) | 0 (0.0%) |
| Information | 19 (16.4%) | 97 (83.6%) |
| Finance & Insurance | 40 (10.1%) | 358 (89.9%) |
| Real Estate, Rental & Leasing | 91 (100.0%) | 0 (0.0%) |
| Professional & Scientific | 64 (86.5%) | 10 (13.5%) |
| Enterprise Management | 0 (0.0%) | 0 (0.0%) |
| Administrative & Support | 137 (47.2%) | 153 (52.8%) |
| Educational Services | 68 (18.8%) | 293 (81.2%) |
| Health Care & Social Assistance | 71 (10.6%) | 601 (89.4%) |
| Arts, Entertainment & Recreation | 40 (100.0%) | 0 (0.0%) |
| Accommodation & Food Services | 50 (8.9%) | 512 (91.1%) |
| Public Administration | 85 (56.7%) | 65 (43.3%) |
| Total | 3,102 (50.3%) | 3,067 (49.7%) |
Education in Forest Hill
School Enrollment in Forest Hill
The most common levels of schooling among the 4,046 students in Forest Hill are high school (1,363 | 33.7%), elementary school (886 | 21.9%), and college / undergraduate (702 | 17.3%).
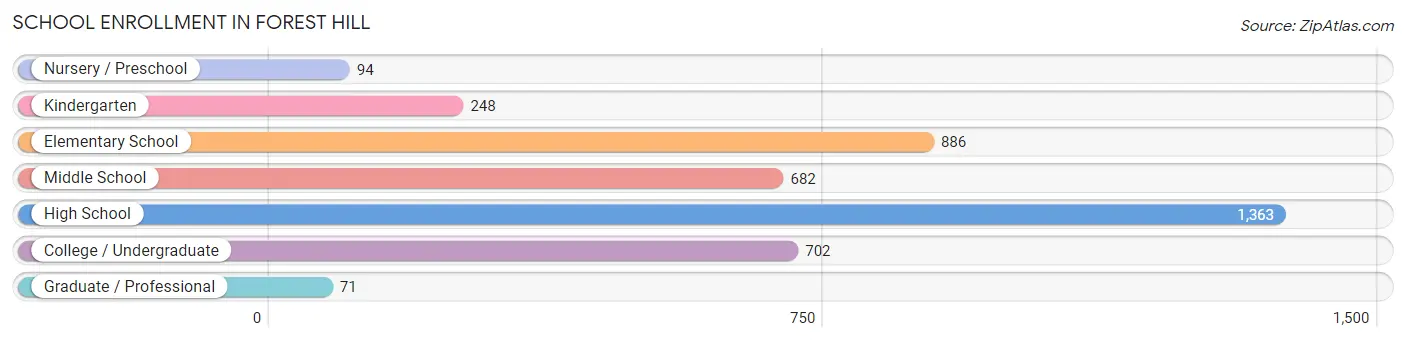
| School Level | # Students | % Students |
| Nursery / Preschool | 94 | 2.3% |
| Kindergarten | 248 | 6.1% |
| Elementary School | 886 | 21.9% |
| Middle School | 682 | 16.9% |
| High School | 1,363 | 33.7% |
| College / Undergraduate | 702 | 17.3% |
| Graduate / Professional | 71 | 1.8% |
| Total | 4,046 | 100.0% |
School Enrollment by Age by Funding Source in Forest Hill
Out of a total of 4,046 students who are enrolled in schools in Forest Hill, 218 (5.4%) attend a private institution, while the remaining 3,828 (94.6%) are enrolled in public schools. The age group of 3 to 4 year olds has the highest likelihood of being enrolled in private schools, with 66 (70.2% in the age bracket) enrolled. Conversely, the age group of 5 to 9 year old has the lowest likelihood of being enrolled in a private school, with 1,019 (100.0% in the age bracket) attending a public institution.
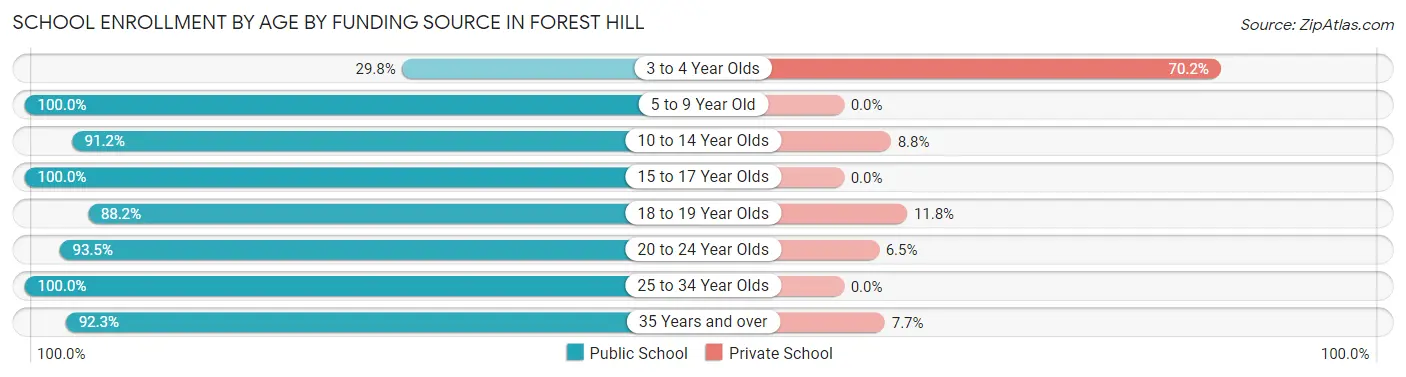
| Age Bracket | Public School | Private School |
| 3 to 4 Year Olds | 28 (29.8%) | 66 (70.2%) |
| 5 to 9 Year Old | 1,019 (100.0%) | 0 (0.0%) |
| 10 to 14 Year Olds | 875 (91.2%) | 84 (8.8%) |
| 15 to 17 Year Olds | 1,026 (100.0%) | 0 (0.0%) |
| 18 to 19 Year Olds | 247 (88.2%) | 33 (11.8%) |
| 20 to 24 Year Olds | 301 (93.5%) | 21 (6.5%) |
| 25 to 34 Year Olds | 137 (100.0%) | 0 (0.0%) |
| 35 Years and over | 193 (92.3%) | 16 (7.7%) |
| Total | 3,828 (94.6%) | 218 (5.4%) |
Educational Attainment by Field of Study in Forest Hill
Business (297 | 28.5%), science & technology (216 | 20.7%), social sciences (133 | 12.8%), education (77 | 7.4%), and communications (75 | 7.2%) are the most common fields of study among 1,041 individuals in Forest Hill who have obtained a bachelor's degree or higher.
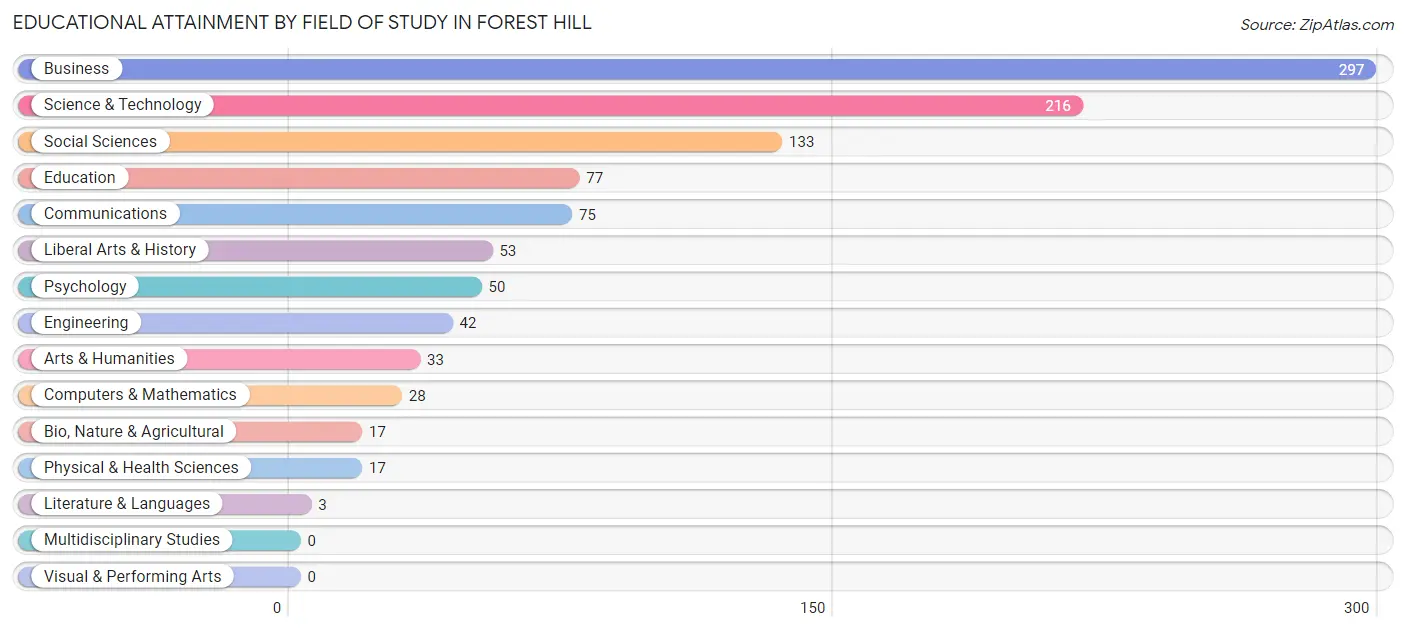
| Field of Study | # Graduates | % Graduates |
| Computers & Mathematics | 28 | 2.7% |
| Bio, Nature & Agricultural | 17 | 1.6% |
| Physical & Health Sciences | 17 | 1.6% |
| Psychology | 50 | 4.8% |
| Social Sciences | 133 | 12.8% |
| Engineering | 42 | 4.0% |
| Multidisciplinary Studies | 0 | 0.0% |
| Science & Technology | 216 | 20.7% |
| Business | 297 | 28.5% |
| Education | 77 | 7.4% |
| Literature & Languages | 3 | 0.3% |
| Liberal Arts & History | 53 | 5.1% |
| Visual & Performing Arts | 0 | 0.0% |
| Communications | 75 | 7.2% |
| Arts & Humanities | 33 | 3.2% |
| Total | 1,041 | 100.0% |
Transportation & Commute in Forest Hill
Vehicle Availability by Sex in Forest Hill
The most prevalent vehicle ownership categories in Forest Hill are males with 3 vehicles (1,143, accounting for 38.0%) and females with 3 vehicles (814, making up 37.9%).
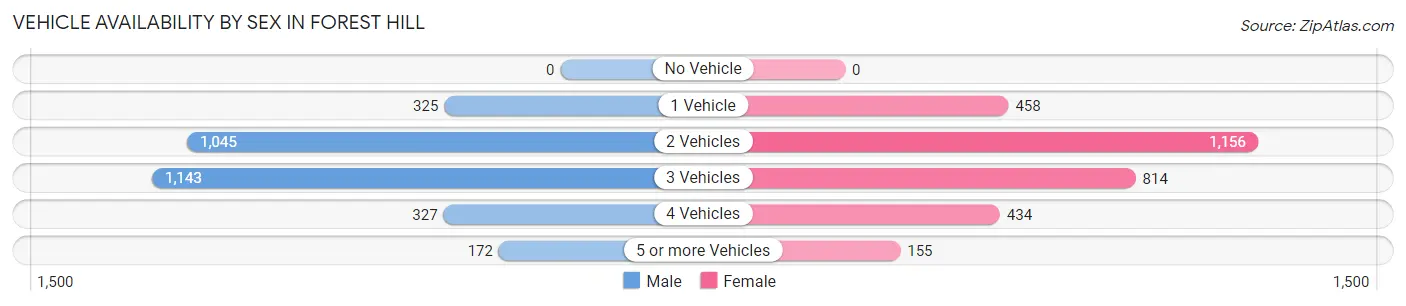
| Vehicles Available | Male | Female |
| No Vehicle | 0 (0.0%) | 0 (0.0%) |
| 1 Vehicle | 325 (10.8%) | 458 (15.2%) |
| 2 Vehicles | 1,045 (34.7%) | 1,156 (38.3%) |
| 3 Vehicles | 1,143 (38.0%) | 814 (27.0%) |
| 4 Vehicles | 327 (10.9%) | 434 (14.4%) |
| 5 or more Vehicles | 172 (5.7%) | 155 (5.1%) |
| Total | 3,012 (100.0%) | 3,017 (100.0%) |
Commute Time in Forest Hill
The most frequently occuring commute durations in Forest Hill are 20 to 24 minutes (988 commuters, 17.8%), 30 to 34 minutes (785 commuters, 14.1%), and 45 to 59 minutes (766 commuters, 13.8%).
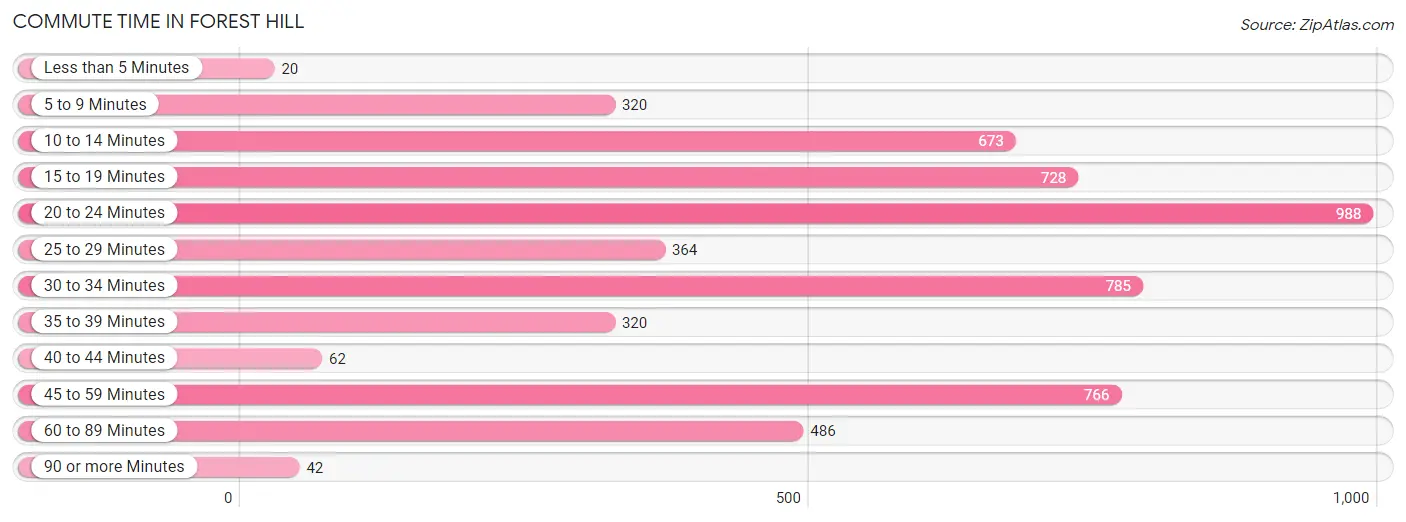
| Commute Time | # Commuters | % Commuters |
| Less than 5 Minutes | 20 | 0.4% |
| 5 to 9 Minutes | 320 | 5.8% |
| 10 to 14 Minutes | 673 | 12.1% |
| 15 to 19 Minutes | 728 | 13.1% |
| 20 to 24 Minutes | 988 | 17.8% |
| 25 to 29 Minutes | 364 | 6.6% |
| 30 to 34 Minutes | 785 | 14.1% |
| 35 to 39 Minutes | 320 | 5.8% |
| 40 to 44 Minutes | 62 | 1.1% |
| 45 to 59 Minutes | 766 | 13.8% |
| 60 to 89 Minutes | 486 | 8.7% |
| 90 or more Minutes | 42 | 0.8% |
Commute Time by Sex in Forest Hill
The most common commute times in Forest Hill are 45 to 59 minutes (568 commuters, 19.3%) for males and 20 to 24 minutes (662 commuters, 25.4%) for females.
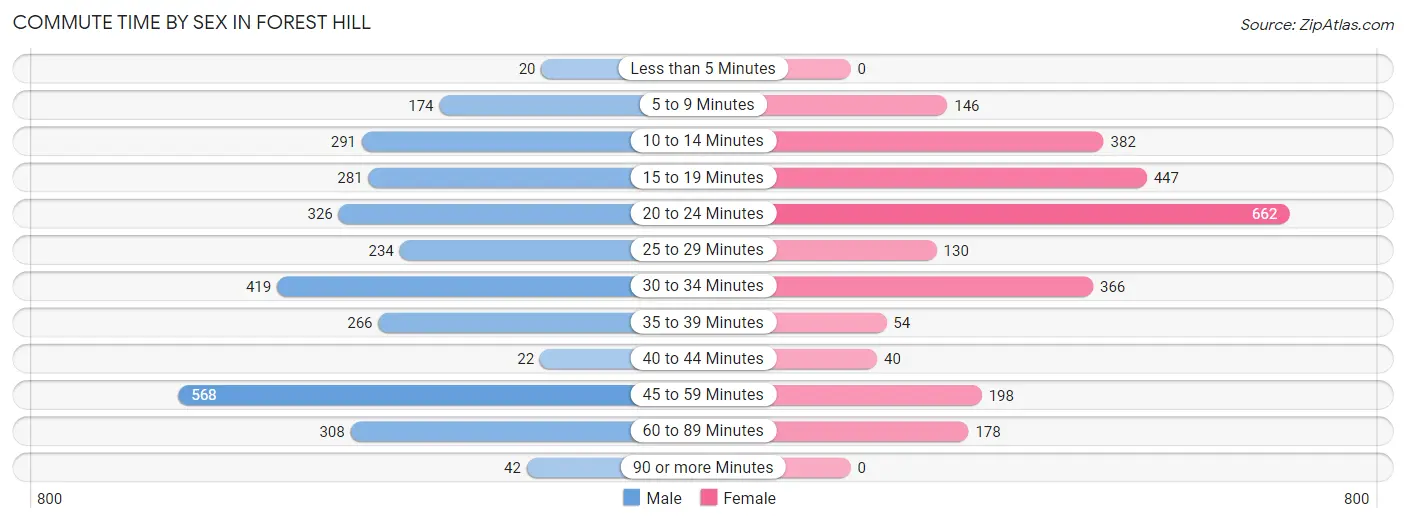
| Commute Time | Male | Female |
| Less than 5 Minutes | 20 (0.7%) | 0 (0.0%) |
| 5 to 9 Minutes | 174 (5.9%) | 146 (5.6%) |
| 10 to 14 Minutes | 291 (9.9%) | 382 (14.7%) |
| 15 to 19 Minutes | 281 (9.5%) | 447 (17.2%) |
| 20 to 24 Minutes | 326 (11.1%) | 662 (25.4%) |
| 25 to 29 Minutes | 234 (7.9%) | 130 (5.0%) |
| 30 to 34 Minutes | 419 (14.2%) | 366 (14.1%) |
| 35 to 39 Minutes | 266 (9.0%) | 54 (2.1%) |
| 40 to 44 Minutes | 22 (0.7%) | 40 (1.5%) |
| 45 to 59 Minutes | 568 (19.3%) | 198 (7.6%) |
| 60 to 89 Minutes | 308 (10.4%) | 178 (6.8%) |
| 90 or more Minutes | 42 (1.4%) | 0 (0.0%) |
Time of Departure to Work by Sex in Forest Hill
The most frequent times of departure to work in Forest Hill are 4:00 PM to 11:59 PM (482, 16.3%) for males and 7:00 AM to 7:29 AM (430, 16.5%) for females.
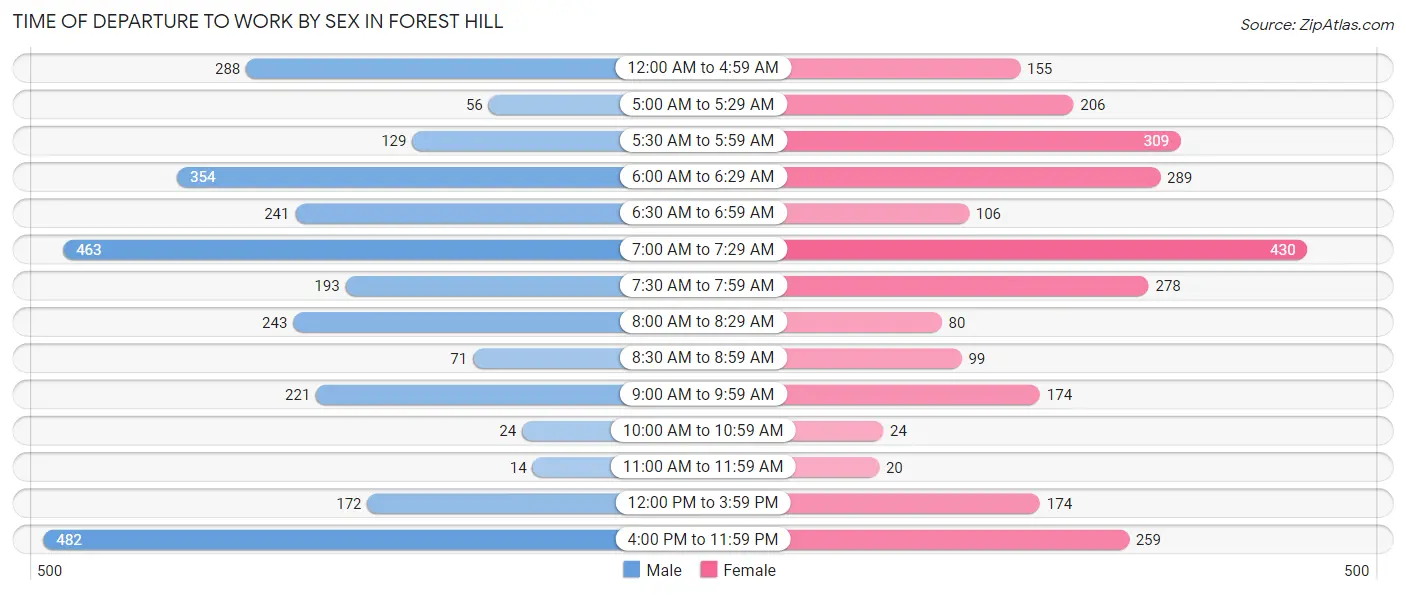
| Time of Departure | Male | Female |
| 12:00 AM to 4:59 AM | 288 (9.8%) | 155 (5.9%) |
| 5:00 AM to 5:29 AM | 56 (1.9%) | 206 (7.9%) |
| 5:30 AM to 5:59 AM | 129 (4.4%) | 309 (11.9%) |
| 6:00 AM to 6:29 AM | 354 (12.0%) | 289 (11.1%) |
| 6:30 AM to 6:59 AM | 241 (8.2%) | 106 (4.1%) |
| 7:00 AM to 7:29 AM | 463 (15.7%) | 430 (16.5%) |
| 7:30 AM to 7:59 AM | 193 (6.5%) | 278 (10.7%) |
| 8:00 AM to 8:29 AM | 243 (8.2%) | 80 (3.1%) |
| 8:30 AM to 8:59 AM | 71 (2.4%) | 99 (3.8%) |
| 9:00 AM to 9:59 AM | 221 (7.5%) | 174 (6.7%) |
| 10:00 AM to 10:59 AM | 24 (0.8%) | 24 (0.9%) |
| 11:00 AM to 11:59 AM | 14 (0.5%) | 20 (0.8%) |
| 12:00 PM to 3:59 PM | 172 (5.8%) | 174 (6.7%) |
| 4:00 PM to 11:59 PM | 482 (16.3%) | 259 (10.0%) |
| Total | 2,951 (100.0%) | 2,603 (100.0%) |
Housing Occupancy in Forest Hill
Occupancy by Ownership in Forest Hill
Of the total 4,123 dwellings in Forest Hill, owner-occupied units account for 2,890 (70.1%), while renter-occupied units make up 1,233 (29.9%).
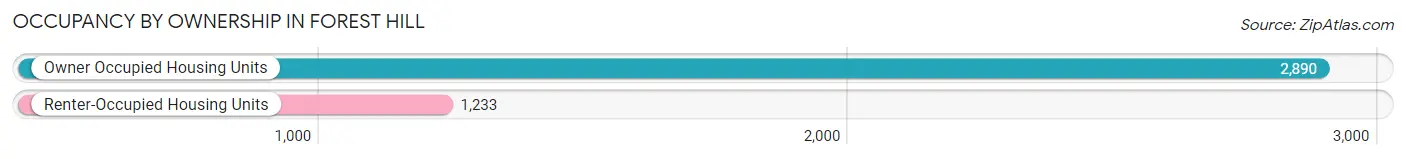
| Occupancy | # Housing Units | % Housing Units |
| Owner Occupied Housing Units | 2,890 | 70.1% |
| Renter-Occupied Housing Units | 1,233 | 29.9% |
| Total Occupied Housing Units | 4,123 | 100.0% |
Occupancy by Household Size in Forest Hill
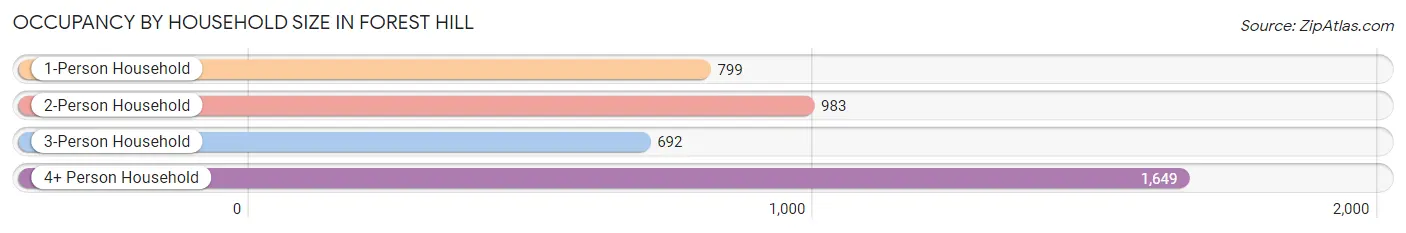
| Household Size | # Housing Units | % Housing Units |
| 1-Person Household | 799 | 19.4% |
| 2-Person Household | 983 | 23.8% |
| 3-Person Household | 692 | 16.8% |
| 4+ Person Household | 1,649 | 40.0% |
| Total Housing Units | 4,123 | 100.0% |
Occupancy by Ownership by Household Size in Forest Hill
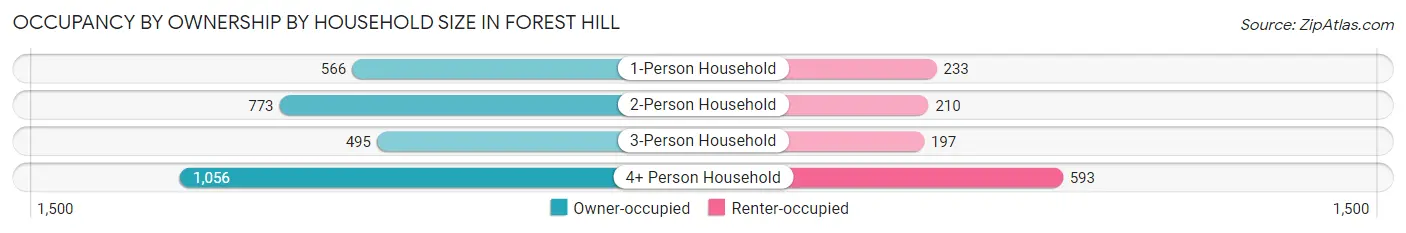
| Household Size | Owner-occupied | Renter-occupied |
| 1-Person Household | 566 (70.8%) | 233 (29.2%) |
| 2-Person Household | 773 (78.6%) | 210 (21.4%) |
| 3-Person Household | 495 (71.5%) | 197 (28.5%) |
| 4+ Person Household | 1,056 (64.0%) | 593 (36.0%) |
| Total Housing Units | 2,890 (70.1%) | 1,233 (29.9%) |
Occupancy by Educational Attainment in Forest Hill
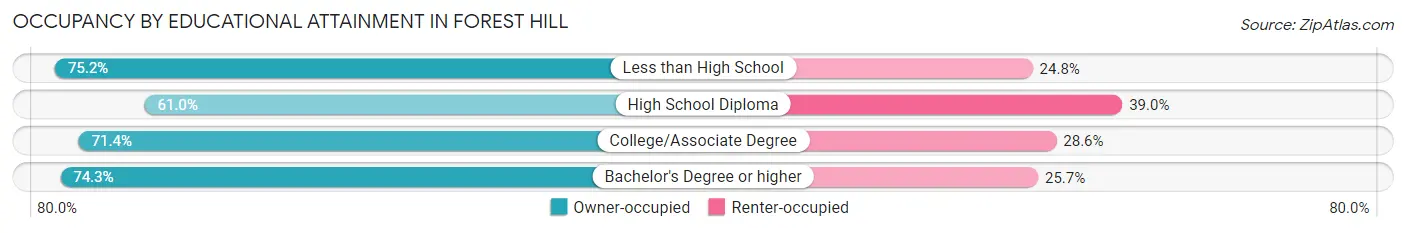
| Household Size | Owner-occupied | Renter-occupied |
| Less than High School | 960 (75.2%) | 317 (24.8%) |
| High School Diploma | 681 (61.0%) | 436 (39.0%) |
| College/Associate Degree | 887 (71.4%) | 355 (28.6%) |
| Bachelor's Degree or higher | 362 (74.3%) | 125 (25.7%) |
Occupancy by Age of Householder in Forest Hill
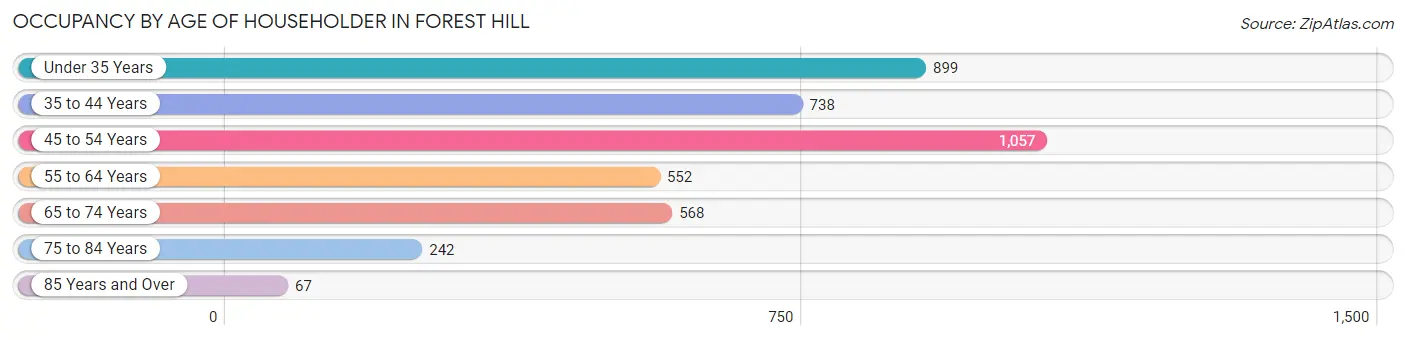
| Age Bracket | # Households | % Households |
| Under 35 Years | 899 | 21.8% |
| 35 to 44 Years | 738 | 17.9% |
| 45 to 54 Years | 1,057 | 25.6% |
| 55 to 64 Years | 552 | 13.4% |
| 65 to 74 Years | 568 | 13.8% |
| 75 to 84 Years | 242 | 5.9% |
| 85 Years and Over | 67 | 1.6% |
| Total | 4,123 | 100.0% |
Housing Finances in Forest Hill
Median Income by Occupancy in Forest Hill
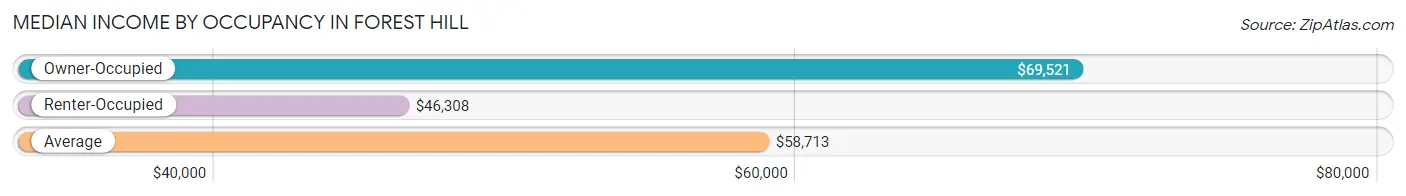
| Occupancy Type | # Households | Median Income |
| Owner-Occupied | 2,890 (70.1%) | $69,521 |
| Renter-Occupied | 1,233 (29.9%) | $46,308 |
| Average | 4,123 (100.0%) | $58,713 |
Occupancy by Householder Income Bracket in Forest Hill
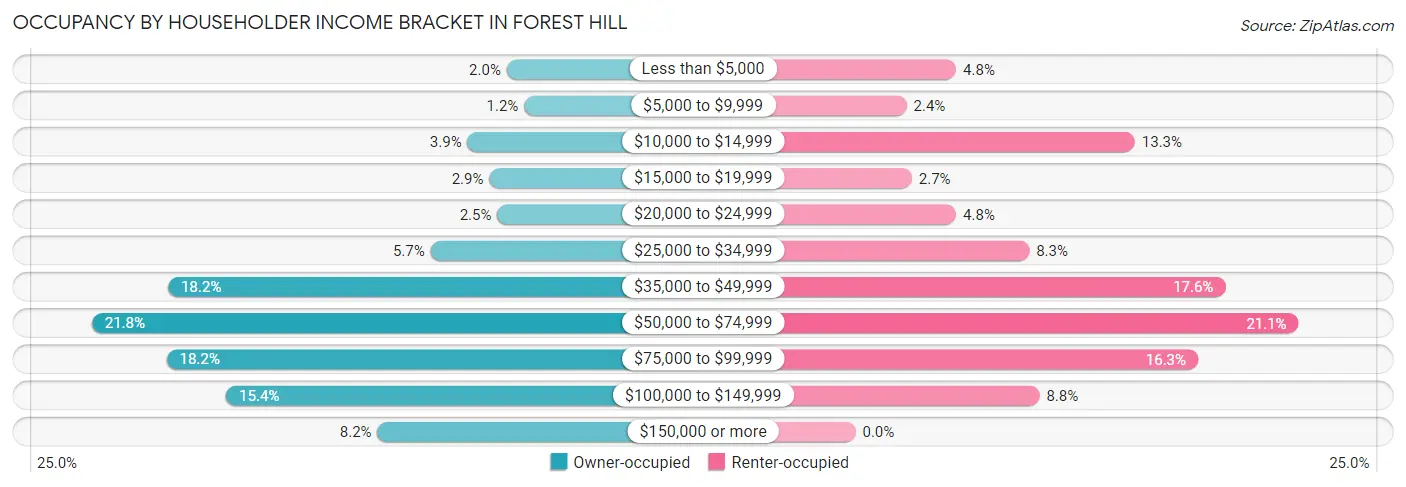
| Income Bracket | Owner-occupied | Renter-occupied |
| Less than $5,000 | 59 (2.0%) | 59 (4.8%) |
| $5,000 to $9,999 | 35 (1.2%) | 30 (2.4%) |
| $10,000 to $14,999 | 113 (3.9%) | 164 (13.3%) |
| $15,000 to $19,999 | 83 (2.9%) | 33 (2.7%) |
| $20,000 to $24,999 | 72 (2.5%) | 59 (4.8%) |
| $25,000 to $34,999 | 164 (5.7%) | 102 (8.3%) |
| $35,000 to $49,999 | 525 (18.2%) | 217 (17.6%) |
| $50,000 to $74,999 | 630 (21.8%) | 260 (21.1%) |
| $75,000 to $99,999 | 527 (18.2%) | 201 (16.3%) |
| $100,000 to $149,999 | 445 (15.4%) | 108 (8.8%) |
| $150,000 or more | 237 (8.2%) | 0 (0.0%) |
| Total | 2,890 (100.0%) | 1,233 (100.0%) |
Monthly Housing Cost Tiers in Forest Hill
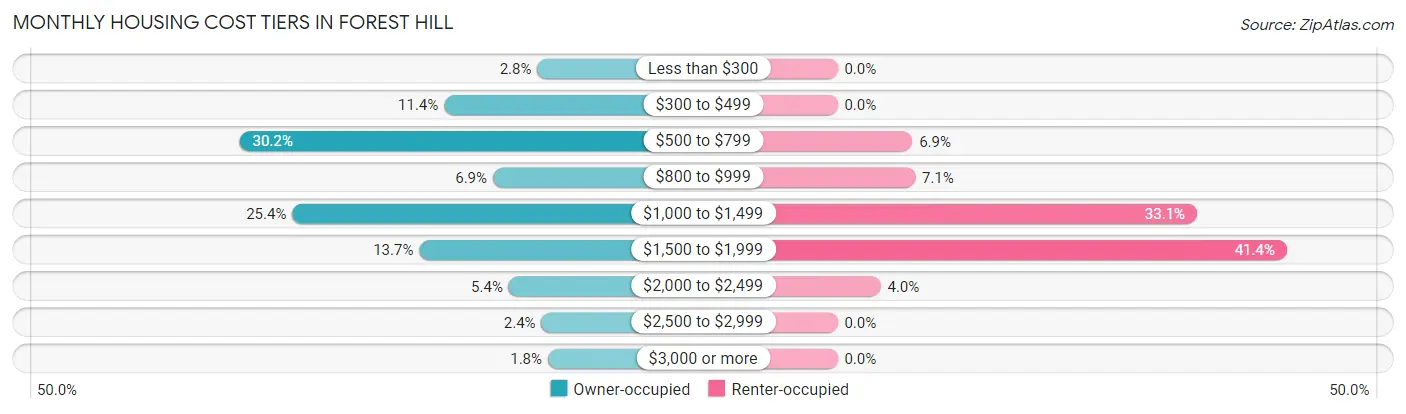
| Monthly Cost | Owner-occupied | Renter-occupied |
| Less than $300 | 81 (2.8%) | 0 (0.0%) |
| $300 to $499 | 329 (11.4%) | 0 (0.0%) |
| $500 to $799 | 873 (30.2%) | 85 (6.9%) |
| $800 to $999 | 199 (6.9%) | 88 (7.1%) |
| $1,000 to $1,499 | 733 (25.4%) | 408 (33.1%) |
| $1,500 to $1,999 | 395 (13.7%) | 510 (41.4%) |
| $2,000 to $2,499 | 157 (5.4%) | 49 (4.0%) |
| $2,500 to $2,999 | 70 (2.4%) | 0 (0.0%) |
| $3,000 or more | 53 (1.8%) | 0 (0.0%) |
| Total | 2,890 (100.0%) | 1,233 (100.0%) |
Physical Housing Characteristics in Forest Hill
Housing Structures in Forest Hill
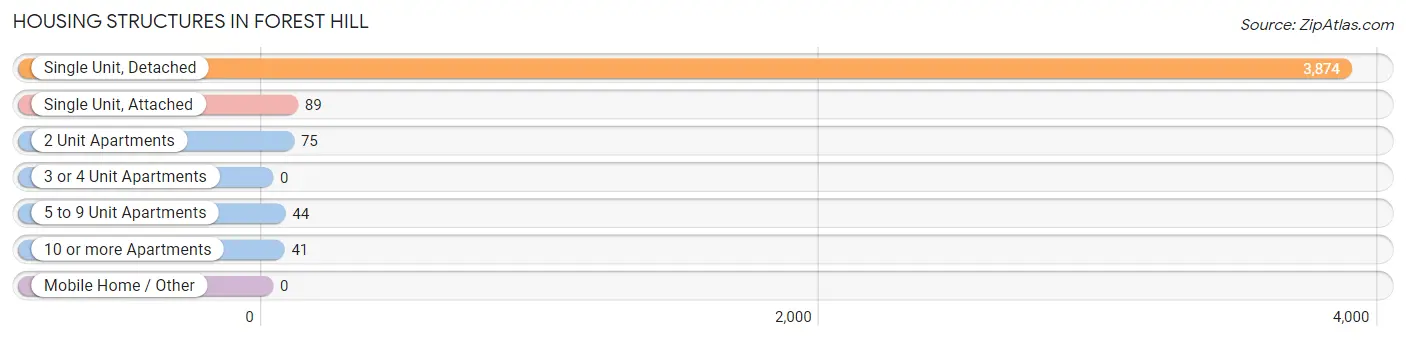
| Structure Type | # Housing Units | % Housing Units |
| Single Unit, Detached | 3,874 | 94.0% |
| Single Unit, Attached | 89 | 2.2% |
| 2 Unit Apartments | 75 | 1.8% |
| 3 or 4 Unit Apartments | 0 | 0.0% |
| 5 to 9 Unit Apartments | 44 | 1.1% |
| 10 or more Apartments | 41 | 1.0% |
| Mobile Home / Other | 0 | 0.0% |
| Total | 4,123 | 100.0% |
Housing Structures by Occupancy in Forest Hill
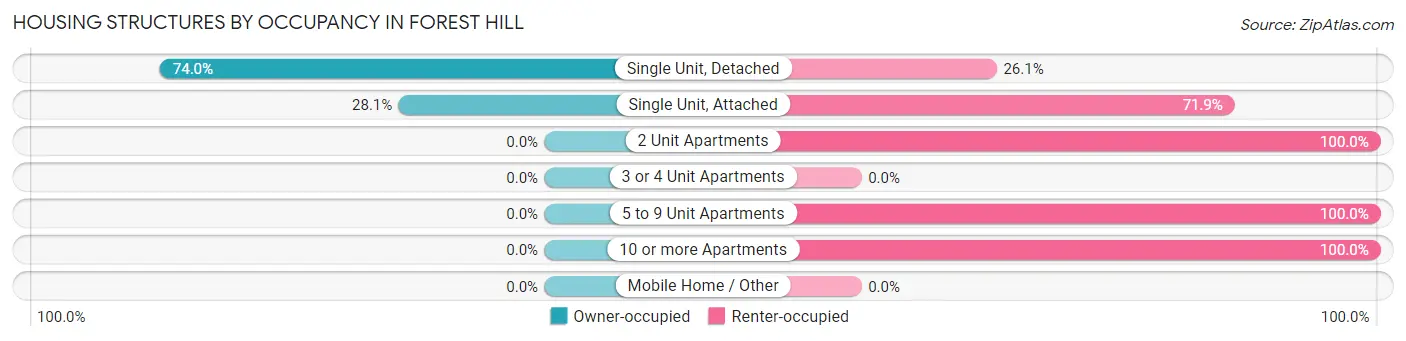
| Structure Type | Owner-occupied | Renter-occupied |
| Single Unit, Detached | 2,865 (74.0%) | 1,009 (26.1%) |
| Single Unit, Attached | 25 (28.1%) | 64 (71.9%) |
| 2 Unit Apartments | 0 (0.0%) | 75 (100.0%) |
| 3 or 4 Unit Apartments | 0 (0.0%) | 0 (0.0%) |
| 5 to 9 Unit Apartments | 0 (0.0%) | 44 (100.0%) |
| 10 or more Apartments | 0 (0.0%) | 41 (100.0%) |
| Mobile Home / Other | 0 (0.0%) | 0 (0.0%) |
| Total | 2,890 (70.1%) | 1,233 (29.9%) |
Housing Structures by Number of Rooms in Forest Hill
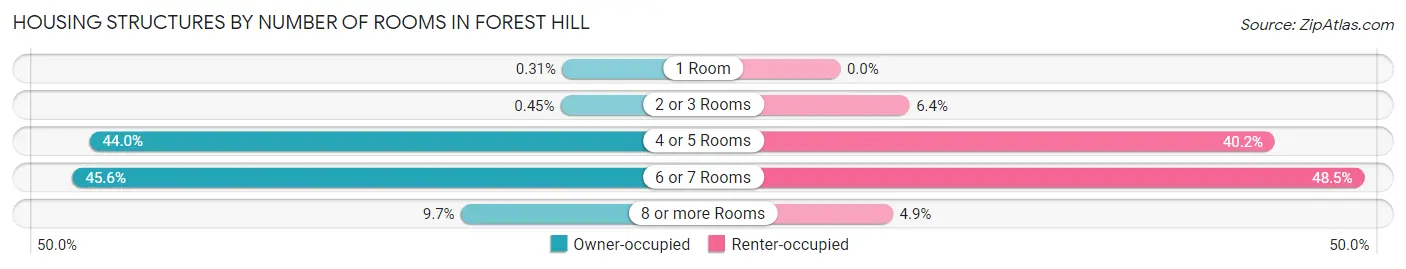
| Number of Rooms | Owner-occupied | Renter-occupied |
| 1 Room | 9 (0.3%) | 0 (0.0%) |
| 2 or 3 Rooms | 13 (0.4%) | 79 (6.4%) |
| 4 or 5 Rooms | 1,271 (44.0%) | 496 (40.2%) |
| 6 or 7 Rooms | 1,317 (45.6%) | 598 (48.5%) |
| 8 or more Rooms | 280 (9.7%) | 60 (4.9%) |
| Total | 2,890 (100.0%) | 1,233 (100.0%) |
Housing Structure by Heating Type in Forest Hill
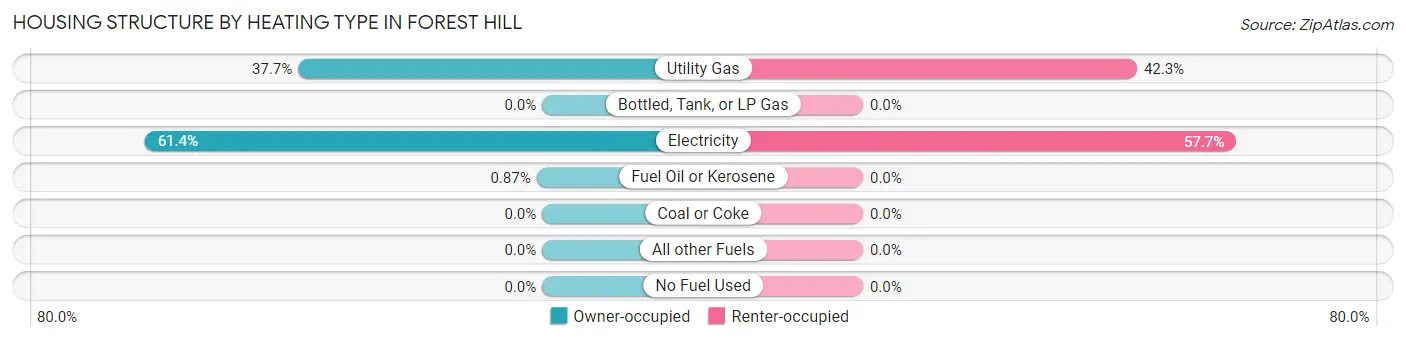
| Heating Type | Owner-occupied | Renter-occupied |
| Utility Gas | 1,090 (37.7%) | 522 (42.3%) |
| Bottled, Tank, or LP Gas | 0 (0.0%) | 0 (0.0%) |
| Electricity | 1,775 (61.4%) | 711 (57.7%) |
| Fuel Oil or Kerosene | 25 (0.9%) | 0 (0.0%) |
| Coal or Coke | 0 (0.0%) | 0 (0.0%) |
| All other Fuels | 0 (0.0%) | 0 (0.0%) |
| No Fuel Used | 0 (0.0%) | 0 (0.0%) |
| Total | 2,890 (100.0%) | 1,233 (100.0%) |
Household Vehicle Usage in Forest Hill
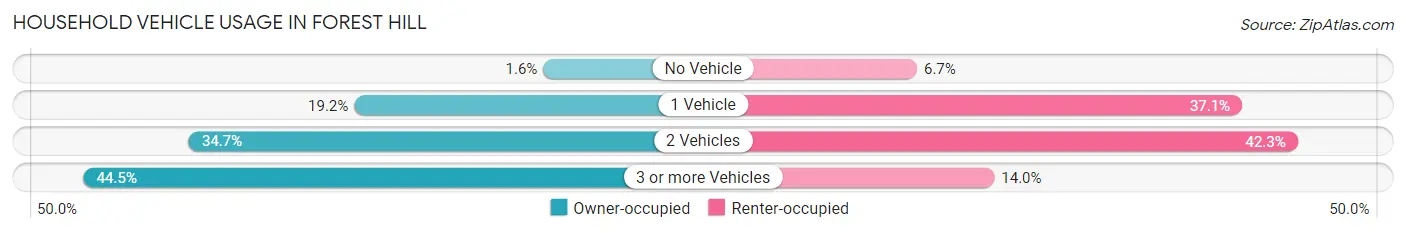
| Vehicles per Household | Owner-occupied | Renter-occupied |
| No Vehicle | 46 (1.6%) | 83 (6.7%) |
| 1 Vehicle | 556 (19.2%) | 457 (37.1%) |
| 2 Vehicles | 1,002 (34.7%) | 521 (42.2%) |
| 3 or more Vehicles | 1,286 (44.5%) | 172 (14.0%) |
| Total | 2,890 (100.0%) | 1,233 (100.0%) |
Real Estate & Mortgages in Forest Hill
Real Estate and Mortgage Overview in Forest Hill
| Characteristic | Without Mortgage | With Mortgage |
| Housing Units | 1,446 | 1,444 |
| Median Property Value | $141,300 | $188,300 |
| Median Household Income | $54,831 | $47 |
| Monthly Housing Costs | $602 | $53 |
| Real Estate Taxes | $1,941 | $66 |
Property Value by Mortgage Status in Forest Hill
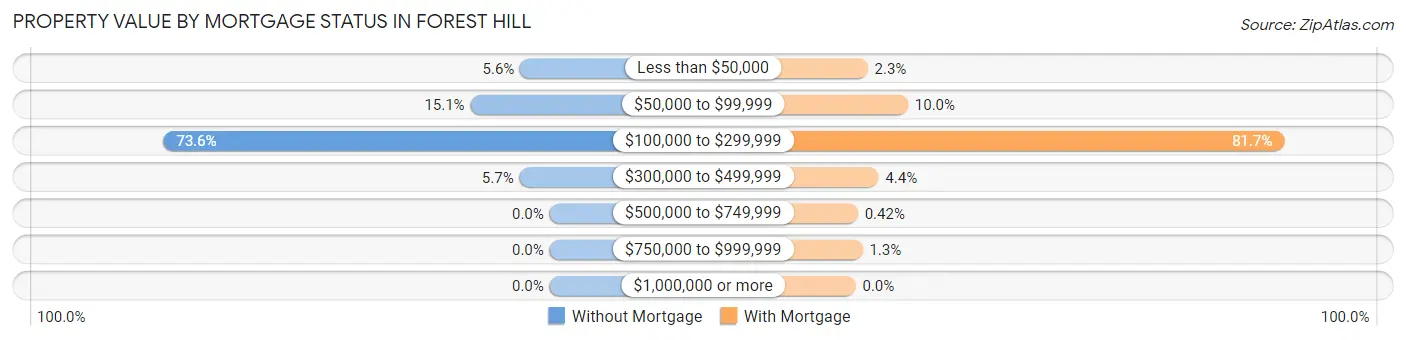
| Property Value | Without Mortgage | With Mortgage |
| Less than $50,000 | 81 (5.6%) | 33 (2.3%) |
| $50,000 to $99,999 | 218 (15.1%) | 144 (10.0%) |
| $100,000 to $299,999 | 1,064 (73.6%) | 1,179 (81.7%) |
| $300,000 to $499,999 | 83 (5.7%) | 63 (4.4%) |
| $500,000 to $749,999 | 0 (0.0%) | 6 (0.4%) |
| $750,000 to $999,999 | 0 (0.0%) | 19 (1.3%) |
| $1,000,000 or more | 0 (0.0%) | 0 (0.0%) |
| Total | 1,446 (100.0%) | 1,444 (100.0%) |
Household Income by Mortgage Status in Forest Hill
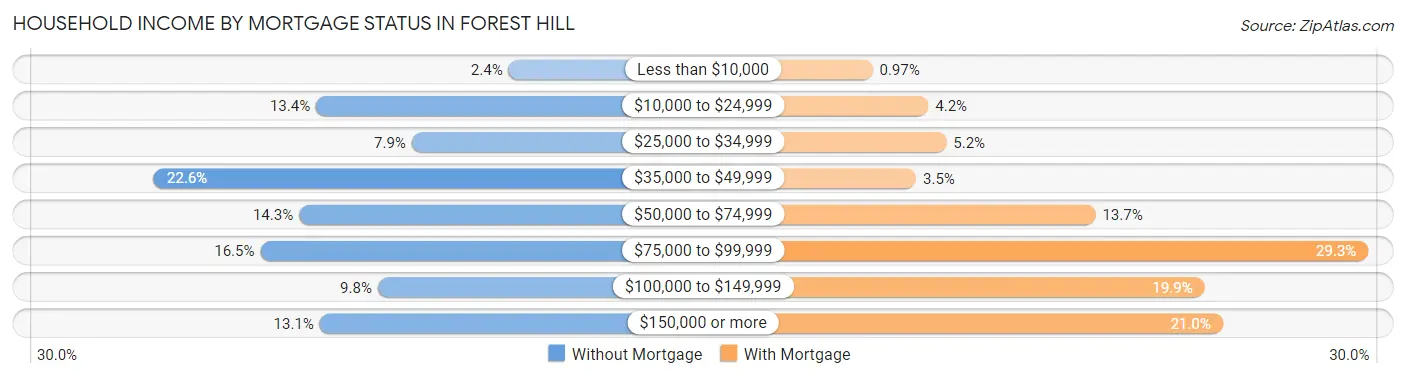
| Household Income | Without Mortgage | With Mortgage |
| Less than $10,000 | 34 (2.4%) | 14 (1.0%) |
| $10,000 to $24,999 | 193 (13.4%) | 60 (4.2%) |
| $25,000 to $34,999 | 114 (7.9%) | 75 (5.2%) |
| $35,000 to $49,999 | 327 (22.6%) | 50 (3.5%) |
| $50,000 to $74,999 | 207 (14.3%) | 198 (13.7%) |
| $75,000 to $99,999 | 239 (16.5%) | 423 (29.3%) |
| $100,000 to $149,999 | 142 (9.8%) | 288 (19.9%) |
| $150,000 or more | 190 (13.1%) | 303 (21.0%) |
| Total | 1,446 (100.0%) | 1,444 (100.0%) |
Property Value to Household Income Ratio in Forest Hill
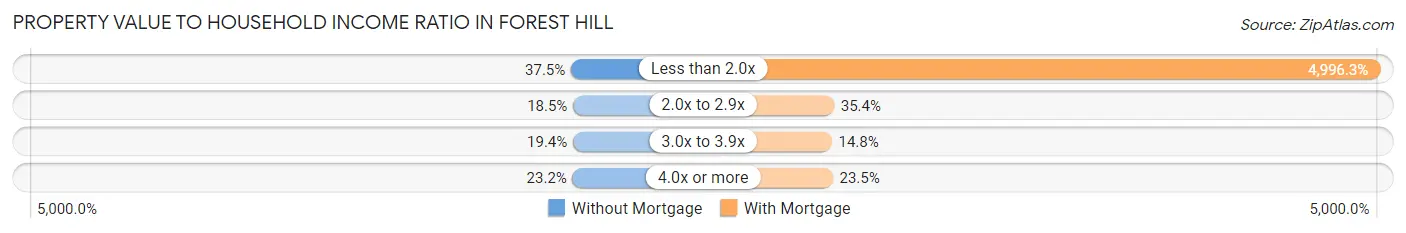
| Value-to-Income Ratio | Without Mortgage | With Mortgage |
| Less than 2.0x | 542 (37.5%) | 72,147 (4,996.3%) |
| 2.0x to 2.9x | 268 (18.5%) | 511 (35.4%) |
| 3.0x to 3.9x | 281 (19.4%) | 214 (14.8%) |
| 4.0x or more | 335 (23.2%) | 339 (23.5%) |
| Total | 1,446 (100.0%) | 1,444 (100.0%) |
Real Estate Taxes by Mortgage Status in Forest Hill
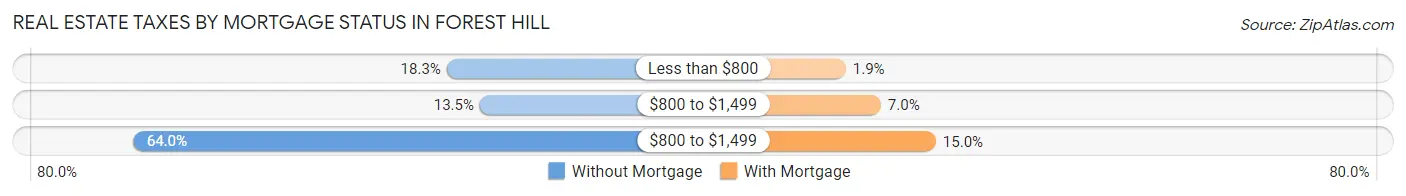
| Property Taxes | Without Mortgage | With Mortgage |
| Less than $800 | 265 (18.3%) | 27 (1.9%) |
| $800 to $1,499 | 195 (13.5%) | 101 (7.0%) |
| $800 to $1,499 | 926 (64.0%) | 217 (15.0%) |
| Total | 1,446 (100.0%) | 1,444 (100.0%) |
Health & Disability in Forest Hill
Health Insurance Coverage by Age in Forest Hill
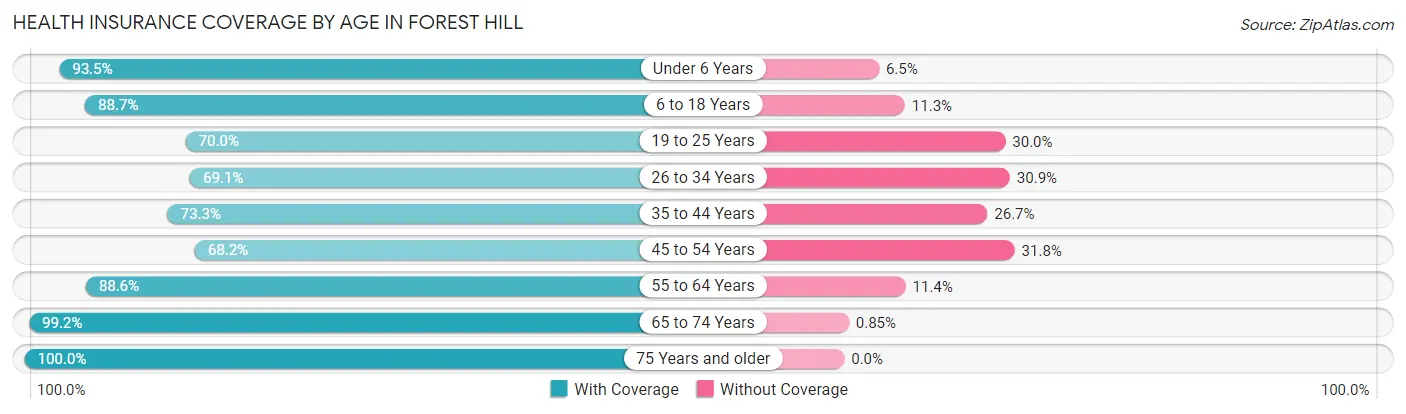
| Age Bracket | With Coverage | Without Coverage |
| Under 6 Years | 1,099 (93.5%) | 76 (6.5%) |
| 6 to 18 Years | 2,834 (88.7%) | 361 (11.3%) |
| 19 to 25 Years | 946 (70.0%) | 406 (30.0%) |
| 26 to 34 Years | 1,267 (69.1%) | 566 (30.9%) |
| 35 to 44 Years | 1,360 (73.3%) | 495 (26.7%) |
| 45 to 54 Years | 1,220 (68.2%) | 568 (31.8%) |
| 55 to 64 Years | 1,108 (88.6%) | 143 (11.4%) |
| 65 to 74 Years | 820 (99.2%) | 7 (0.9%) |
| 75 Years and older | 534 (100.0%) | 0 (0.0%) |
| Total | 11,188 (81.0%) | 2,622 (19.0%) |
Health Insurance Coverage by Citizenship Status in Forest Hill
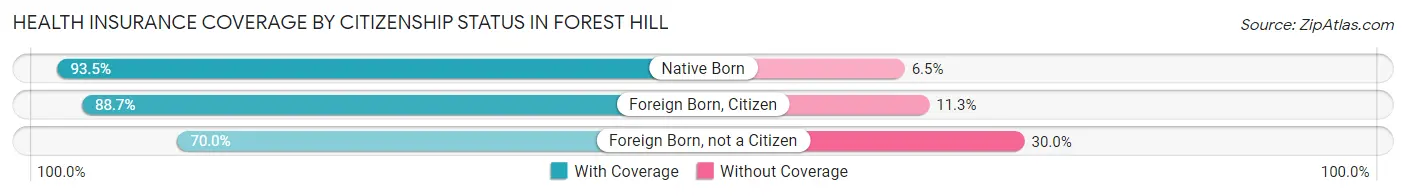
| Citizenship Status | With Coverage | Without Coverage |
| Native Born | 1,099 (93.5%) | 76 (6.5%) |
| Foreign Born, Citizen | 2,834 (88.7%) | 361 (11.3%) |
| Foreign Born, not a Citizen | 946 (70.0%) | 406 (30.0%) |
Health Insurance Coverage by Household Income in Forest Hill
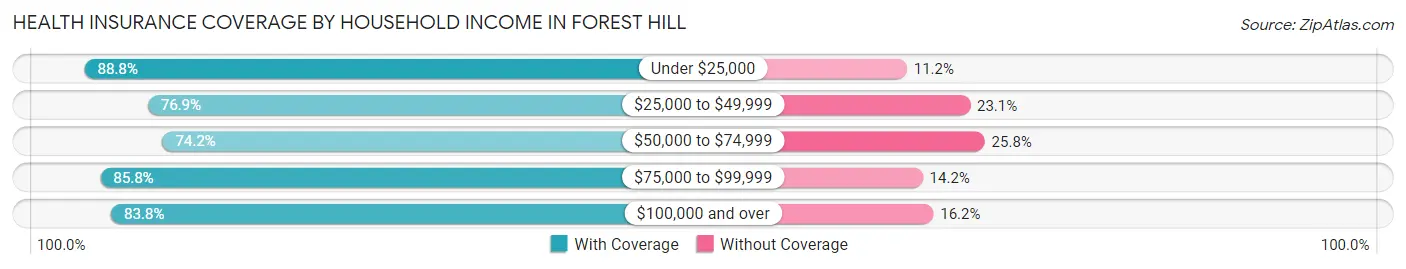
| Household Income | With Coverage | Without Coverage |
| Under $25,000 | 1,429 (88.8%) | 181 (11.2%) |
| $25,000 to $49,999 | 2,448 (76.9%) | 735 (23.1%) |
| $50,000 to $74,999 | 2,288 (74.2%) | 797 (25.8%) |
| $75,000 to $99,999 | 2,234 (85.8%) | 370 (14.2%) |
| $100,000 and over | 2,789 (83.8%) | 539 (16.2%) |
Public vs Private Health Insurance Coverage by Age in Forest Hill
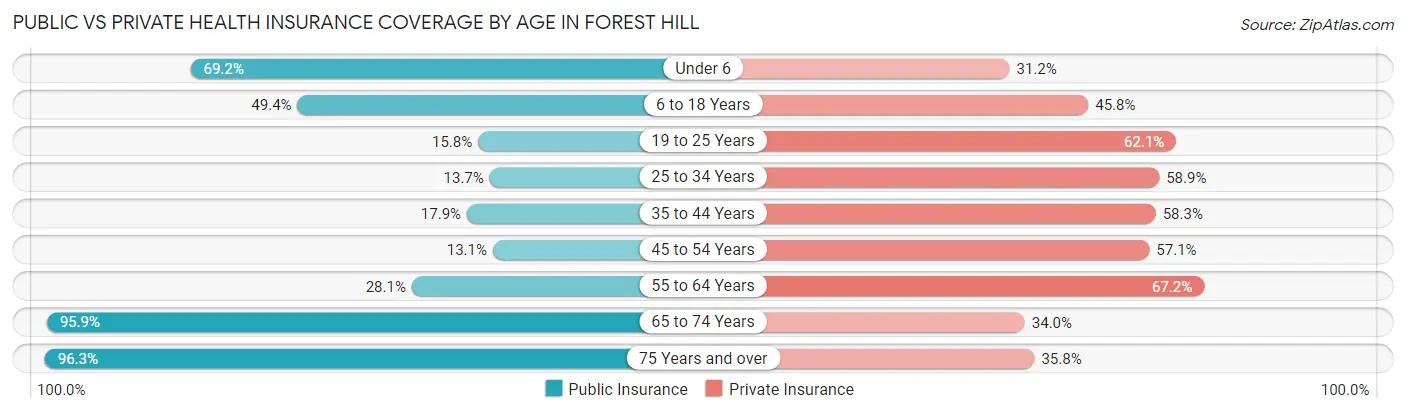
| Age Bracket | Public Insurance | Private Insurance |
| Under 6 | 813 (69.2%) | 366 (31.1%) |
| 6 to 18 Years | 1,577 (49.4%) | 1,462 (45.8%) |
| 19 to 25 Years | 214 (15.8%) | 839 (62.1%) |
| 25 to 34 Years | 251 (13.7%) | 1,080 (58.9%) |
| 35 to 44 Years | 332 (17.9%) | 1,081 (58.3%) |
| 45 to 54 Years | 234 (13.1%) | 1,021 (57.1%) |
| 55 to 64 Years | 352 (28.1%) | 841 (67.2%) |
| 65 to 74 Years | 793 (95.9%) | 281 (34.0%) |
| 75 Years and over | 514 (96.3%) | 191 (35.8%) |
| Total | 5,080 (36.8%) | 7,162 (51.9%) |
Disability Status by Sex by Age in Forest Hill
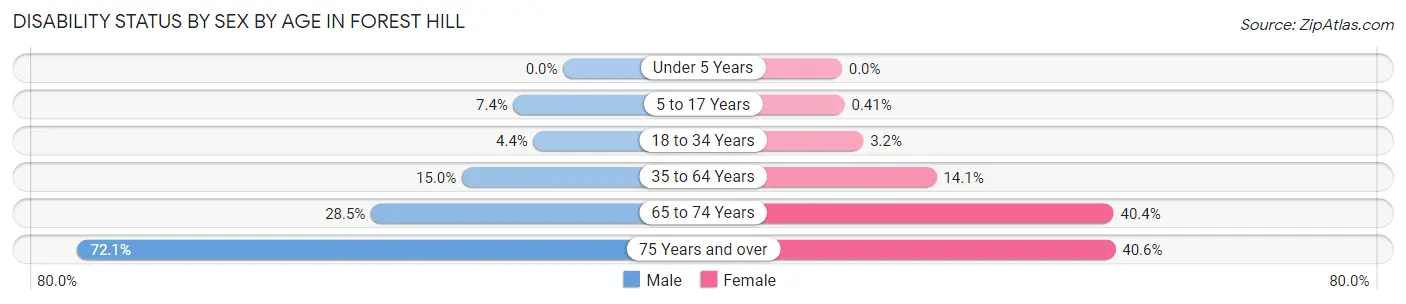
| Age Bracket | Male | Female |
| Under 5 Years | 0 (0.0%) | 0 (0.0%) |
| 5 to 17 Years | 92 (7.4%) | 8 (0.4%) |
| 18 to 34 Years | 64 (4.4%) | 64 (3.2%) |
| 35 to 64 Years | 324 (15.0%) | 385 (14.1%) |
| 65 to 74 Years | 91 (28.5%) | 205 (40.4%) |
| 75 Years and over | 220 (72.1%) | 93 (40.6%) |
Disability Class by Sex by Age in Forest Hill
Disability Class: Hearing Difficulty
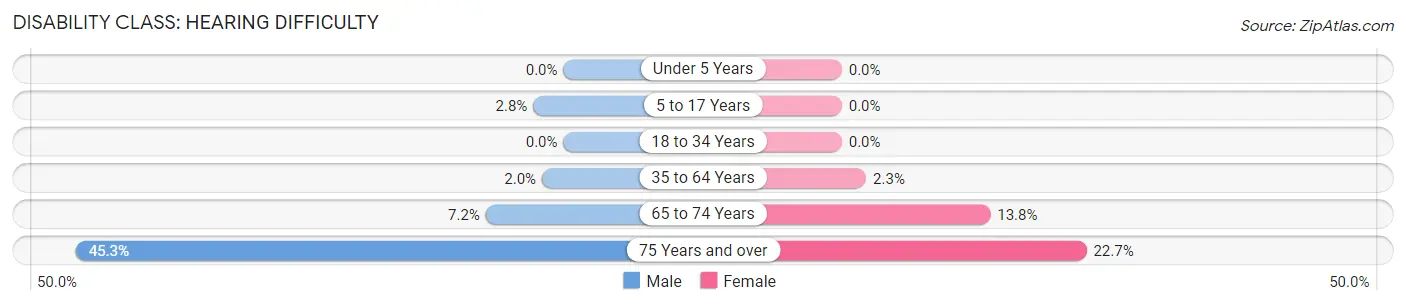
| Age Bracket | Male | Female |
| Under 5 Years | 0 (0.0%) | 0 (0.0%) |
| 5 to 17 Years | 35 (2.8%) | 0 (0.0%) |
| 18 to 34 Years | 0 (0.0%) | 0 (0.0%) |
| 35 to 64 Years | 43 (2.0%) | 62 (2.3%) |
| 65 to 74 Years | 23 (7.2%) | 70 (13.8%) |
| 75 Years and over | 138 (45.3%) | 52 (22.7%) |
Disability Class: Vision Difficulty
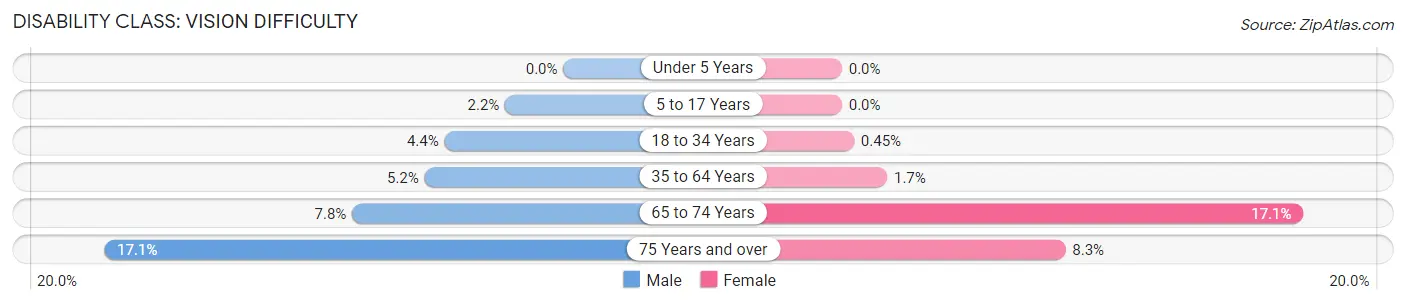
| Age Bracket | Male | Female |
| Under 5 Years | 0 (0.0%) | 0 (0.0%) |
| 5 to 17 Years | 27 (2.2%) | 0 (0.0%) |
| 18 to 34 Years | 64 (4.4%) | 9 (0.4%) |
| 35 to 64 Years | 111 (5.1%) | 46 (1.7%) |
| 65 to 74 Years | 25 (7.8%) | 87 (17.1%) |
| 75 Years and over | 52 (17.1%) | 19 (8.3%) |
Disability Class: Cognitive Difficulty
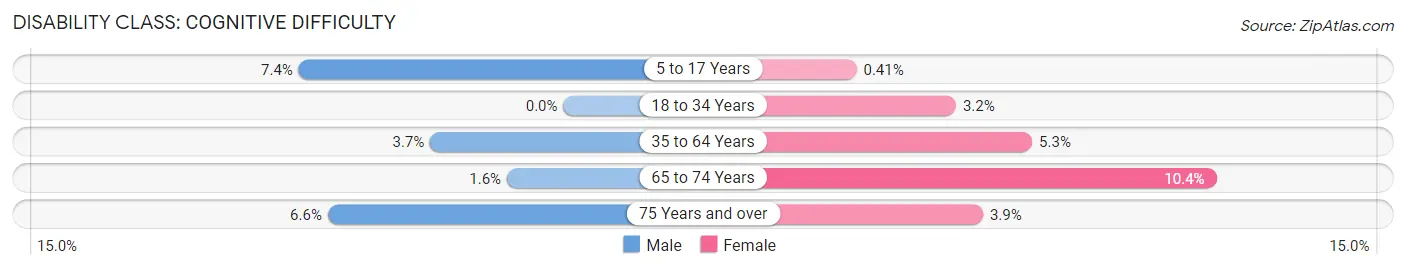
| Age Bracket | Male | Female |
| 5 to 17 Years | 92 (7.4%) | 8 (0.4%) |
| 18 to 34 Years | 0 (0.0%) | 64 (3.2%) |
| 35 to 64 Years | 80 (3.7%) | 145 (5.3%) |
| 65 to 74 Years | 5 (1.6%) | 53 (10.4%) |
| 75 Years and over | 20 (6.6%) | 9 (3.9%) |
Disability Class: Ambulatory Difficulty
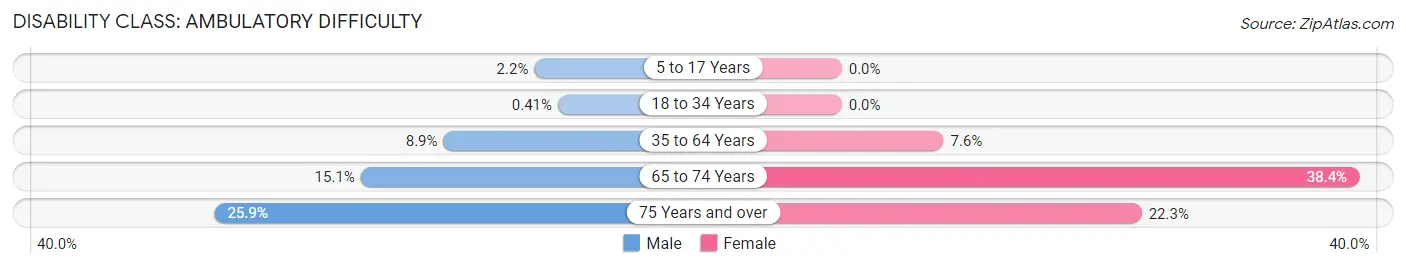
| Age Bracket | Male | Female |
| 5 to 17 Years | 27 (2.2%) | 0 (0.0%) |
| 18 to 34 Years | 6 (0.4%) | 0 (0.0%) |
| 35 to 64 Years | 192 (8.9%) | 207 (7.6%) |
| 65 to 74 Years | 48 (15.0%) | 195 (38.4%) |
| 75 Years and over | 79 (25.9%) | 51 (22.3%) |
Disability Class: Self-Care Difficulty
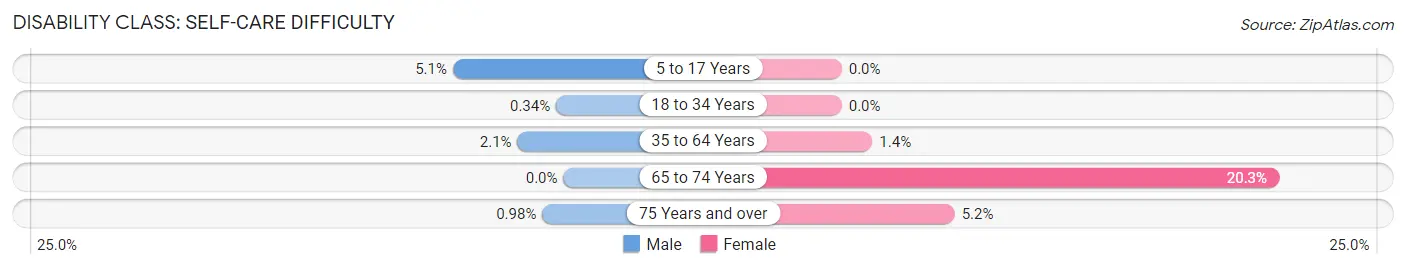
| Age Bracket | Male | Female |
| 5 to 17 Years | 64 (5.1%) | 0 (0.0%) |
| 18 to 34 Years | 5 (0.3%) | 0 (0.0%) |
| 35 to 64 Years | 46 (2.1%) | 39 (1.4%) |
| 65 to 74 Years | 0 (0.0%) | 103 (20.3%) |
| 75 Years and over | 3 (1.0%) | 12 (5.2%) |
Technology Access in Forest Hill
Computing Device Access in Forest Hill
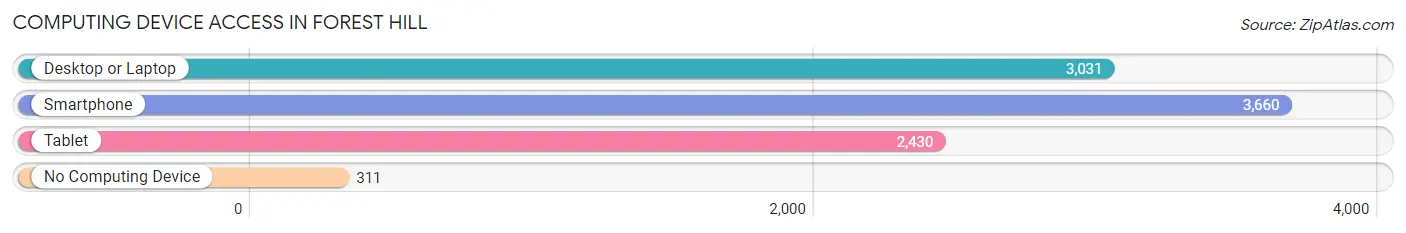
| Device Type | # Households | % Households |
| Desktop or Laptop | 3,031 | 73.5% |
| Smartphone | 3,660 | 88.8% |
| Tablet | 2,430 | 58.9% |
| No Computing Device | 311 | 7.5% |
| Total | 4,123 | 100.0% |
Internet Access in Forest Hill
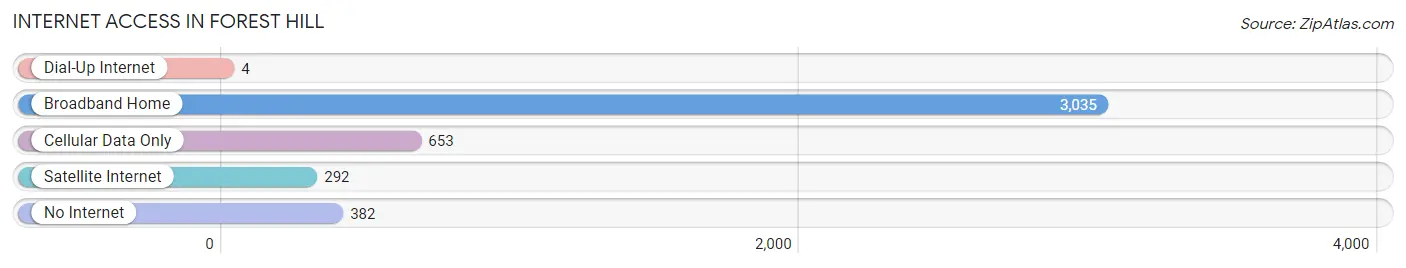
| Internet Type | # Households | % Households |
| Dial-Up Internet | 4 | 0.1% |
| Broadband Home | 3,035 | 73.6% |
| Cellular Data Only | 653 | 15.8% |
| Satellite Internet | 292 | 7.1% |
| No Internet | 382 | 9.3% |
| Total | 4,123 | 100.0% |
Forest Hill Summary
History
The small town of Forest Hill, Texas is located in Tarrant County, just west of Fort Worth. The area was first settled in the late 1800s by a group of German immigrants who were looking for a place to call home. The town was officially established in 1891 and was named after the nearby forest. The town quickly grew and by the early 1900s, it had become a thriving community with a population of over 1,000 people.
The town was known for its agricultural production, with cotton, corn, and wheat being the main crops. The town also had a number of businesses, including a general store, a blacksmith, and a hotel. The town was also home to a number of churches, including the First Baptist Church, which was established in 1891.
In the early 1900s, the town began to experience a period of growth and development. The population increased to over 2,000 people by the 1920s and the town had become a popular destination for tourists. The town was also home to a number of businesses, including a movie theater, a bank, and a number of restaurants.
The town experienced a period of decline in the mid-1900s, as many of the businesses closed and the population decreased. However, in the late 1990s, the town began to experience a period of revitalization. The population has grown to over 4,000 people and the town has become a popular destination for tourists and residents alike.
Geography
Forest Hill is located in Tarrant County, Texas, just west of Fort Worth. The town is situated on the western edge of the Fort Worth metropolitan area and is bordered by the cities of Arlington, Grand Prairie, and Mansfield. The town is located in the rolling hills of the Cross Timbers region of North Texas and is part of the larger Dallas-Fort Worth-Arlington metropolitan area.
The town covers an area of 4.2 square miles and has an elevation of 690 feet. The town is located in a humid subtropical climate zone and experiences hot, humid summers and mild winters. The average annual temperature is 68 degrees Fahrenheit and the average annual precipitation is 37 inches.
Economy
The economy of Forest Hill is largely based on the service industry. The town is home to a number of restaurants, retail stores, and other businesses. The town is also home to a number of manufacturing companies, including a plastics manufacturer and a metal fabrication company.
The town is also home to a number of educational institutions, including a community college and a number of public and private schools. The town is also home to a number of parks and recreational facilities, including a golf course and a number of public parks.
Demographics
As of the 2010 census, the population of Forest Hill was 4,092. The population is largely white (83.3%) and Hispanic (14.2%). The median household income is $50,945 and the median home value is $133,400. The town has a poverty rate of 11.3%.
Conclusion
Forest Hill, Texas is a small town located in Tarrant County, just west of Fort Worth. The town was established in 1891 and has a population of over 4,000 people. The town is known for its agricultural production and is home to a number of businesses, educational institutions, and recreational facilities. The town has a largely white and Hispanic population and a median household income of $50,945.
Common Questions
What is Per Capita Income in Forest Hill?
Per Capita income in Forest Hill is $21,420.
What is the Median Family Income in Forest Hill?
Median Family Income in Forest Hill is $56,541.
What is the Median Household income in Forest Hill?
Median Household Income in Forest Hill is $58,713.
What is Income or Wage Gap in Forest Hill?
Income or Wage Gap in Forest Hill is 36.4%.
Women in Forest Hill earn 63.6 cents for every dollar earned by a man.
What is Inequality or Gini Index in Forest Hill?
Inequality or Gini Index in Forest Hill is 0.36.
What is the Total Population of Forest Hill?
Total Population of Forest Hill is 13,810.
What is the Total Male Population of Forest Hill?
Total Male Population of Forest Hill is 5,890.
What is the Total Female Population of Forest Hill?
Total Female Population of Forest Hill is 7,920.
What is the Ratio of Males per 100 Females in Forest Hill?
There are 74.37 Males per 100 Females in Forest Hill.
What is the Ratio of Females per 100 Males in Forest Hill?
There are 134.47 Females per 100 Males in Forest Hill.
What is the Median Population Age in Forest Hill?
Median Population Age in Forest Hill is 31.7 Years.
What is the Average Family Size in Forest Hill
Average Family Size in Forest Hill is 3.9 People.
What is the Average Household Size in Forest Hill
Average Household Size in Forest Hill is 3.4 People.
How Large is the Labor Force in Forest Hill?
There are 6,676 People in the Labor Forcein in Forest Hill.
What is the Percentage of People in the Labor Force in Forest Hill?
63.9% of People are in the Labor Force in Forest Hill.
What is the Unemployment Rate in Forest Hill?
Unemployment Rate in Forest Hill is 7.6%.