Taylor Landing, TX Map & Demographics
Taylor Landing Map
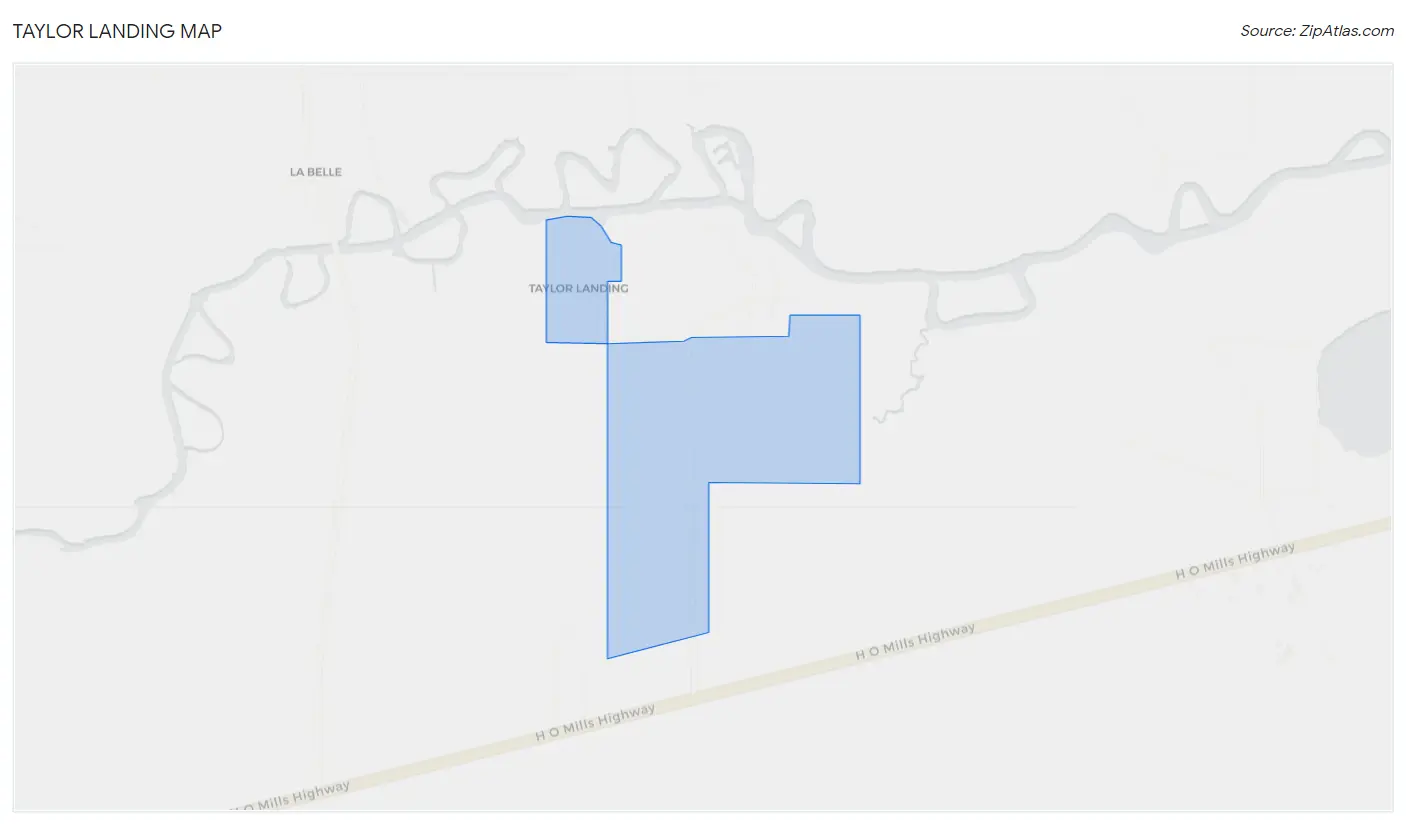
Taylor Landing Overview
$49,532
PER CAPITA INCOME
$123,750
AVG FAMILY INCOME
$125,000
AVG HOUSEHOLD INCOME
33.9%
WAGE / INCOME GAP [ % ]
66.1¢/ $1
WAGE / INCOME GAP [ $ ]
0.27
INEQUALITY / GINI INDEX
281
TOTAL POPULATION
124
MALE POPULATION
157
FEMALE POPULATION
78.98
MALES / 100 FEMALES
126.61
FEMALES / 100 MALES
45.5
MEDIAN AGE
2.9
AVG FAMILY SIZE
2.9
AVG HOUSEHOLD SIZE
120
LABOR FORCE [ PEOPLE ]
56.3%
PERCENT IN LABOR FORCE
1.7%
UNEMPLOYMENT RATE
Taylor Landing Area Codes
Income in Taylor Landing
Income Overview in Taylor Landing
Per Capita Income in Taylor Landing is $49,532, while median incomes of families and households are $123,750 and $125,000 respectively.
| Characteristic | Number | Measure |
| Per Capita Income | 281 | $49,532 |
| Median Family Income | 90 | $123,750 |
| Mean Family Income | 90 | $134,447 |
| Median Household Income | 98 | $125,000 |
| Mean Household Income | 98 | $142,568 |
| Income Deficit | 90 | $0 |
| Wage / Income Gap (%) | 281 | 33.90% |
| Wage / Income Gap ($) | 281 | 66.10¢ per $1 |
| Gini / Inequality Index | 281 | 0.27 |
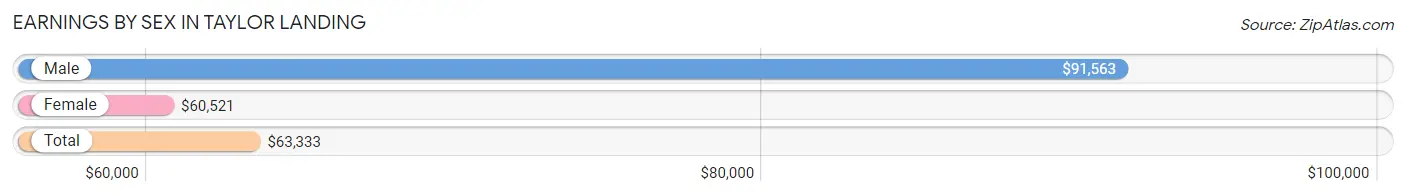
Earnings by Sex in Taylor Landing
Average Earnings in Taylor Landing are $63,333, $91,563 for men and $60,521 for women, a difference of 33.9%.
| Sex | Number | Average Earnings |
| Male | 75 (56.8%) | $91,563 |
| Female | 57 (43.2%) | $60,521 |
| Total | 132 (100.0%) | $63,333 |
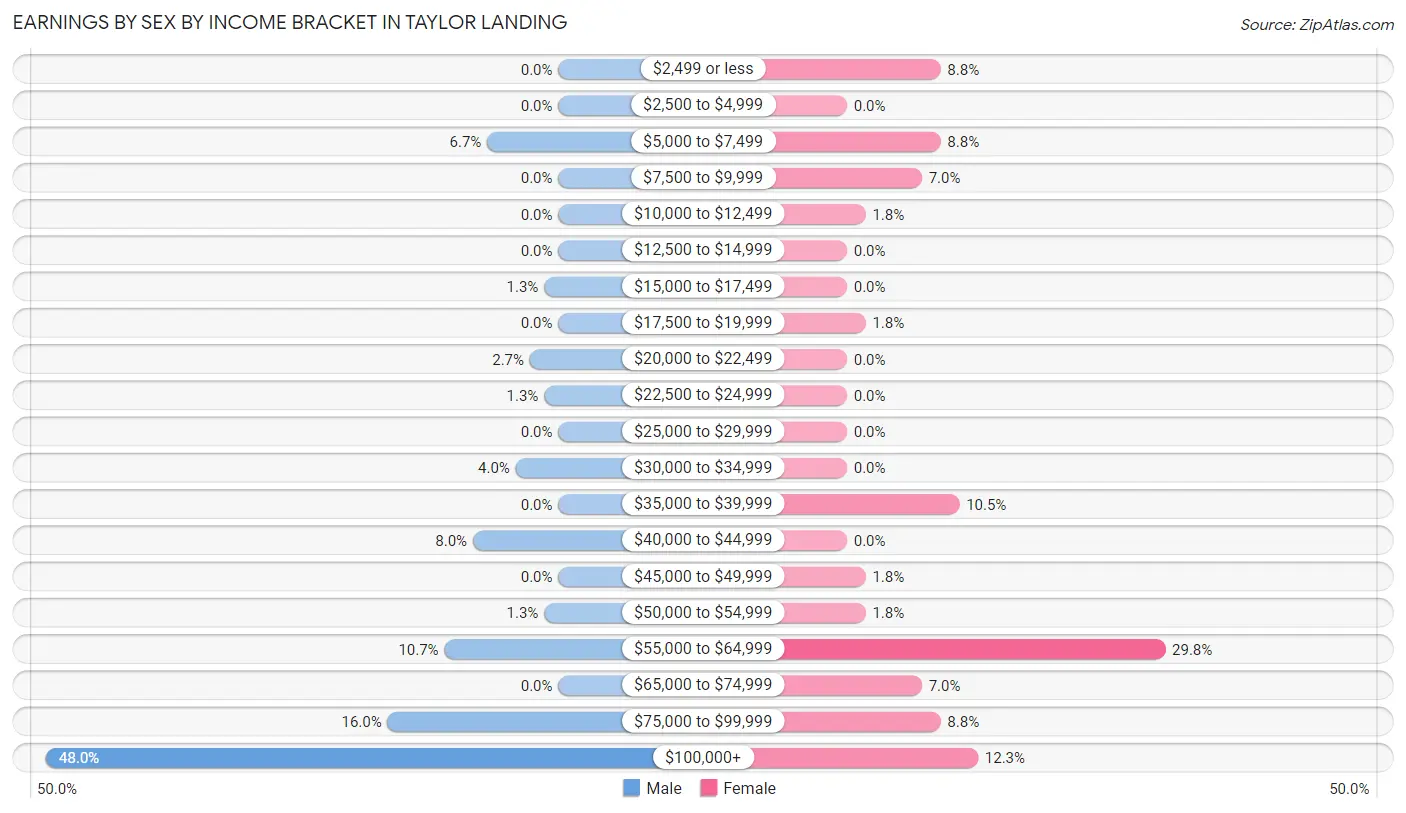
Earnings by Sex by Income Bracket in Taylor Landing
The most common earnings brackets in Taylor Landing are $100,000+ for men (36 | 48.0%) and $55,000 to $64,999 for women (17 | 29.8%).
| Income | Male | Female |
| $2,499 or less | 0 (0.0%) | 5 (8.8%) |
| $2,500 to $4,999 | 0 (0.0%) | 0 (0.0%) |
| $5,000 to $7,499 | 5 (6.7%) | 5 (8.8%) |
| $7,500 to $9,999 | 0 (0.0%) | 4 (7.0%) |
| $10,000 to $12,499 | 0 (0.0%) | 1 (1.8%) |
| $12,500 to $14,999 | 0 (0.0%) | 0 (0.0%) |
| $15,000 to $17,499 | 1 (1.3%) | 0 (0.0%) |
| $17,500 to $19,999 | 0 (0.0%) | 1 (1.8%) |
| $20,000 to $22,499 | 2 (2.7%) | 0 (0.0%) |
| $22,500 to $24,999 | 1 (1.3%) | 0 (0.0%) |
| $25,000 to $29,999 | 0 (0.0%) | 0 (0.0%) |
| $30,000 to $34,999 | 3 (4.0%) | 0 (0.0%) |
| $35,000 to $39,999 | 0 (0.0%) | 6 (10.5%) |
| $40,000 to $44,999 | 6 (8.0%) | 0 (0.0%) |
| $45,000 to $49,999 | 0 (0.0%) | 1 (1.8%) |
| $50,000 to $54,999 | 1 (1.3%) | 1 (1.8%) |
| $55,000 to $64,999 | 8 (10.7%) | 17 (29.8%) |
| $65,000 to $74,999 | 0 (0.0%) | 4 (7.0%) |
| $75,000 to $99,999 | 12 (16.0%) | 5 (8.8%) |
| $100,000+ | 36 (48.0%) | 7 (12.3%) |
| Total | 75 (100.0%) | 57 (100.0%) |
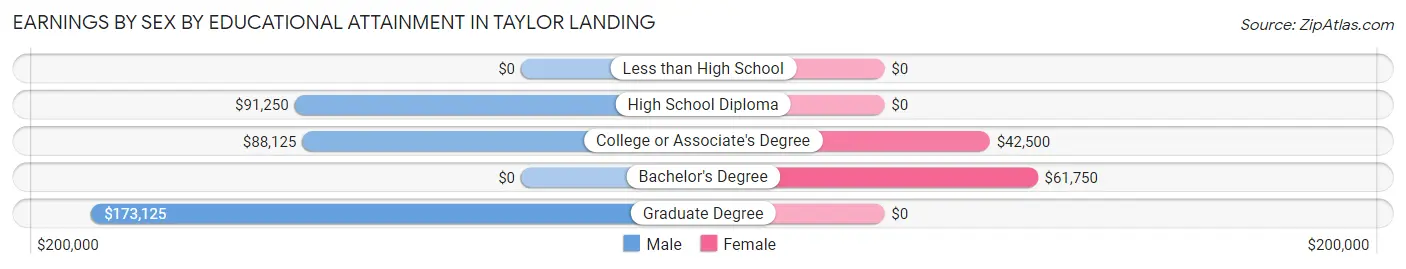
Earnings by Sex by Educational Attainment in Taylor Landing
Average earnings in Taylor Landing are $91,563 for men and $60,750 for women, a difference of 33.7%. Men with an educational attainment of graduate degree enjoy the highest average annual earnings of $173,125, while those with college or associate's degree education earn the least with $88,125. Women with an educational attainment of bachelor's degree earn the most with the average annual earnings of $61,750, while those with college or associate's degree education have the smallest earnings of $42,500.
| Educational Attainment | Male Income | Female Income |
| Less than High School | - | - |
| High School Diploma | $91,250 | $0 |
| College or Associate's Degree | $88,125 | $42,500 |
| Bachelor's Degree | - | - |
| Graduate Degree | $173,125 | $0 |
| Total | $91,563 | $60,750 |
Family Income in Taylor Landing
Family Income Brackets in Taylor Landing
According to the Taylor Landing family income data, there are 44 families falling into the $100,000 to $149,999 income range, which is the most common income bracket and makes up 48.9% of all families.
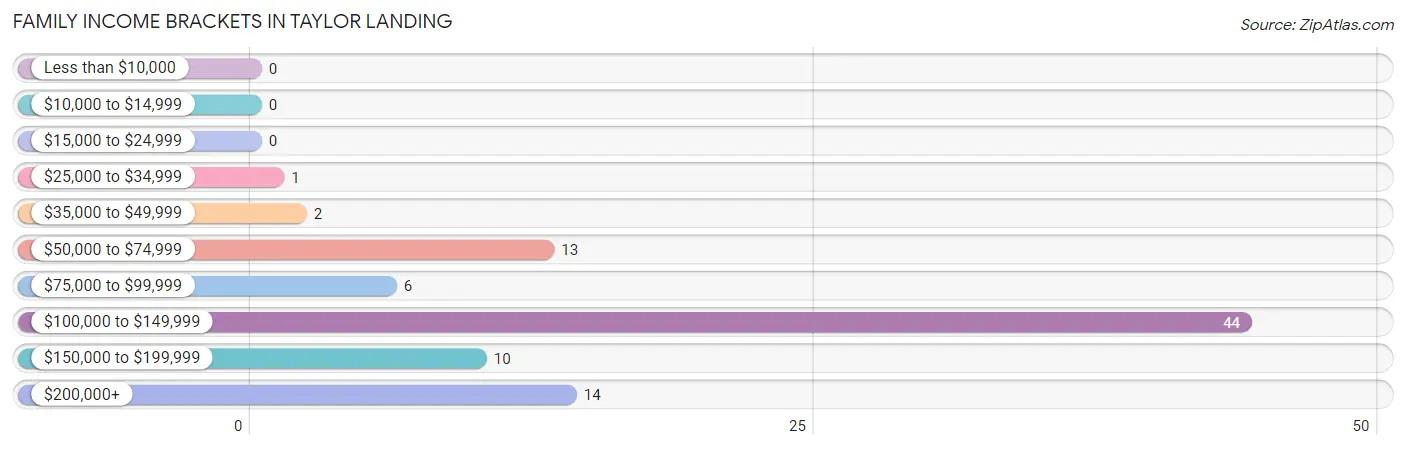
| Income Bracket | # Families | % Families |
| Less than $10,000 | 0 | 0.0% |
| $10,000 to $14,999 | 0 | 0.0% |
| $15,000 to $24,999 | 0 | 0.0% |
| $25,000 to $34,999 | 1 | 1.1% |
| $35,000 to $49,999 | 2 | 2.2% |
| $50,000 to $74,999 | 13 | 14.4% |
| $75,000 to $99,999 | 6 | 6.7% |
| $100,000 to $149,999 | 44 | 48.9% |
| $150,000 to $199,999 | 10 | 11.1% |
| $200,000+ | 14 | 15.6% |
Family Income by Famaliy Size in Taylor Landing
4-person families (8 | 8.9%) account for the highest median family income in Taylor Landing with $177,500 per family, while 2-person families (55 | 61.1%) have the highest median income of $60,625 per family member.
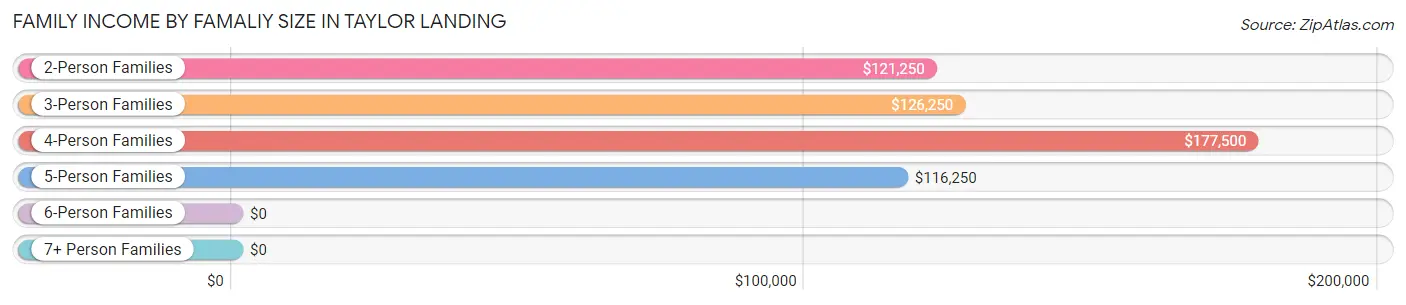
| Income Bracket | # Families | Median Income |
| 2-Person Families | 55 (61.1%) | $121,250 |
| 3-Person Families | 11 (12.2%) | $126,250 |
| 4-Person Families | 8 (8.9%) | $177,500 |
| 5-Person Families | 11 (12.2%) | $116,250 |
| 6-Person Families | 0 (0.0%) | $0 |
| 7+ Person Families | 5 (5.6%) | $0 |
| Total | 90 (100.0%) | $123,750 |
Family Income by Number of Earners in Taylor Landing
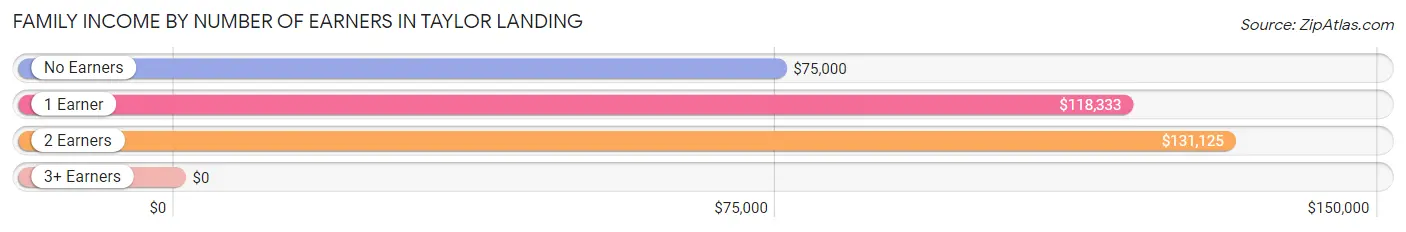
| Number of Earners | # Families | Median Income |
| No Earners | 12 (13.3%) | $75,000 |
| 1 Earner | 38 (42.2%) | $118,333 |
| 2 Earners | 37 (41.1%) | $131,125 |
| 3+ Earners | 3 (3.3%) | $0 |
| Total | 90 (100.0%) | $123,750 |
Household Income in Taylor Landing
Household Income Brackets in Taylor Landing
With 44 households falling in the category, the $100,000 to $149,999 income range is the most frequent in Taylor Landing, accounting for 44.9% of all households.
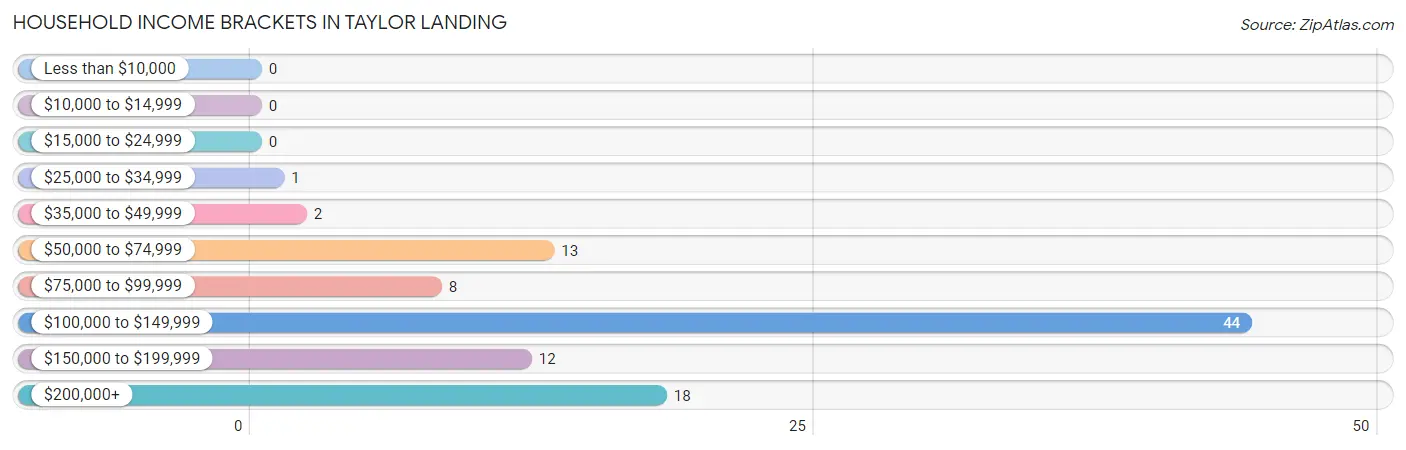
| Income Bracket | # Households | % Households |
| Less than $10,000 | 0 | 0.0% |
| $10,000 to $14,999 | 0 | 0.0% |
| $15,000 to $24,999 | 0 | 0.0% |
| $25,000 to $34,999 | 1 | 1.0% |
| $35,000 to $49,999 | 2 | 2.0% |
| $50,000 to $74,999 | 13 | 13.3% |
| $75,000 to $99,999 | 8 | 8.2% |
| $100,000 to $149,999 | 44 | 44.9% |
| $150,000 to $199,999 | 12 | 12.2% |
| $200,000+ | 18 | 18.4% |
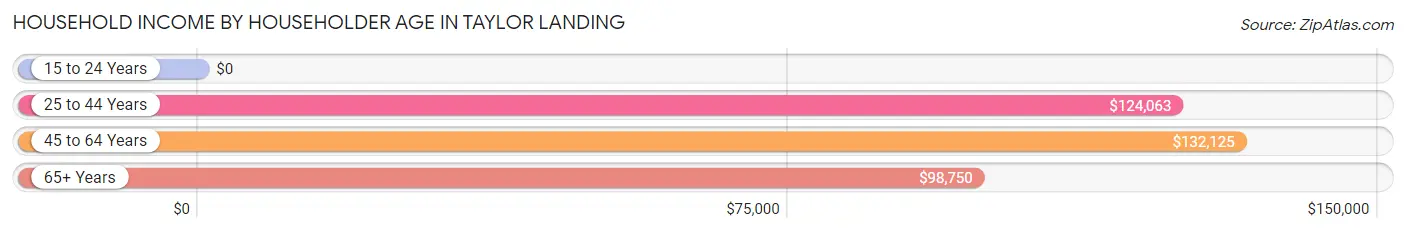
Household Income by Householder Age in Taylor Landing
The median household income in Taylor Landing is $125,000, with the highest median household income of $132,125 found in the 45 to 64 years age bracket for the primary householder. A total of 33 households (33.7%) fall into this category.
| Income Bracket | # Households | Median Income |
| 15 to 24 Years | 0 (0.0%) | $0 |
| 25 to 44 Years | 31 (31.6%) | $124,063 |
| 45 to 64 Years | 33 (33.7%) | $132,125 |
| 65+ Years | 34 (34.7%) | $98,750 |
| Total | 98 (100.0%) | $125,000 |
Poverty in Taylor Landing
Income Below Poverty by Sex and Age in Taylor Landing
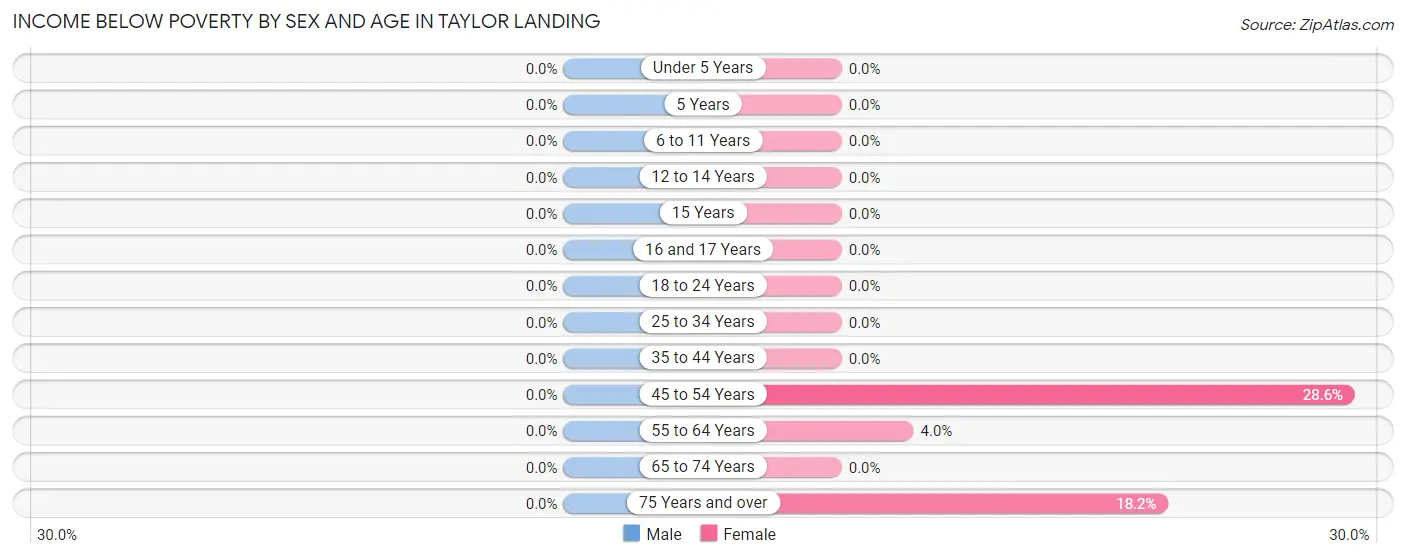
| Age Bracket | Male | Female |
| Under 5 Years | 0 (0.0%) | 0 (0.0%) |
| 5 Years | 0 (0.0%) | 0 (0.0%) |
| 6 to 11 Years | 0 (0.0%) | 0 (0.0%) |
| 12 to 14 Years | 0 (0.0%) | 0 (0.0%) |
| 15 Years | 0 (0.0%) | 0 (0.0%) |
| 16 and 17 Years | 0 (0.0%) | 0 (0.0%) |
| 18 to 24 Years | 0 (0.0%) | 0 (0.0%) |
| 25 to 34 Years | 0 (0.0%) | 0 (0.0%) |
| 35 to 44 Years | 0 (0.0%) | 0 (0.0%) |
| 45 to 54 Years | 0 (0.0%) | 2 (28.6%) |
| 55 to 64 Years | 0 (0.0%) | 1 (4.0%) |
| 65 to 74 Years | 0 (0.0%) | 0 (0.0%) |
| 75 Years and over | 0 (0.0%) | 2 (18.2%) |
| Total | 0 (0.0%) | 5 (3.2%) |
Income Above Poverty by Sex and Age in Taylor Landing
According to the poverty statistics in Taylor Landing, males aged under 5 years and females aged under 5 years are the age groups that are most secure financially, with 100.0% of males and 100.0% of females in these age groups living above the poverty line.
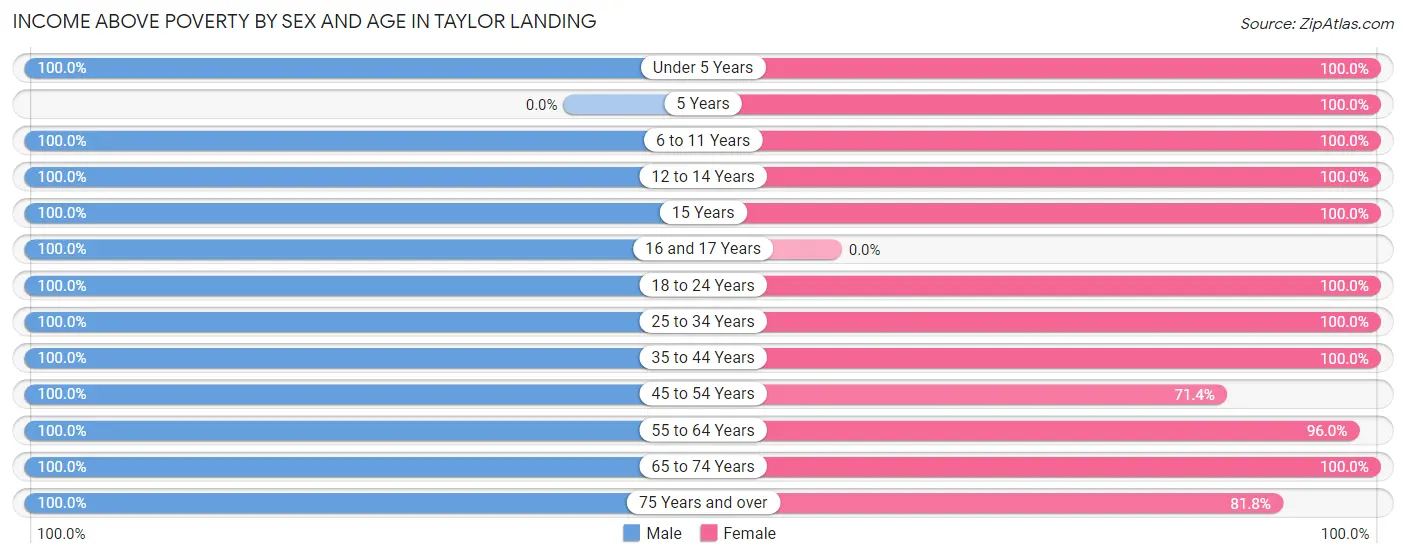
| Age Bracket | Male | Female |
| Under 5 Years | 4 (100.0%) | 12 (100.0%) |
| 5 Years | 0 (0.0%) | 3 (100.0%) |
| 6 to 11 Years | 5 (100.0%) | 17 (100.0%) |
| 12 to 14 Years | 8 (100.0%) | 11 (100.0%) |
| 15 Years | 2 (100.0%) | 6 (100.0%) |
| 16 and 17 Years | 3 (100.0%) | 0 (0.0%) |
| 18 to 24 Years | 1 (100.0%) | 5 (100.0%) |
| 25 to 34 Years | 10 (100.0%) | 9 (100.0%) |
| 35 to 44 Years | 19 (100.0%) | 24 (100.0%) |
| 45 to 54 Years | 17 (100.0%) | 5 (71.4%) |
| 55 to 64 Years | 22 (100.0%) | 24 (96.0%) |
| 65 to 74 Years | 22 (100.0%) | 27 (100.0%) |
| 75 Years and over | 11 (100.0%) | 9 (81.8%) |
| Total | 124 (100.0%) | 152 (96.8%) |
Income Below Poverty Among Married-Couple Families in Taylor Landing
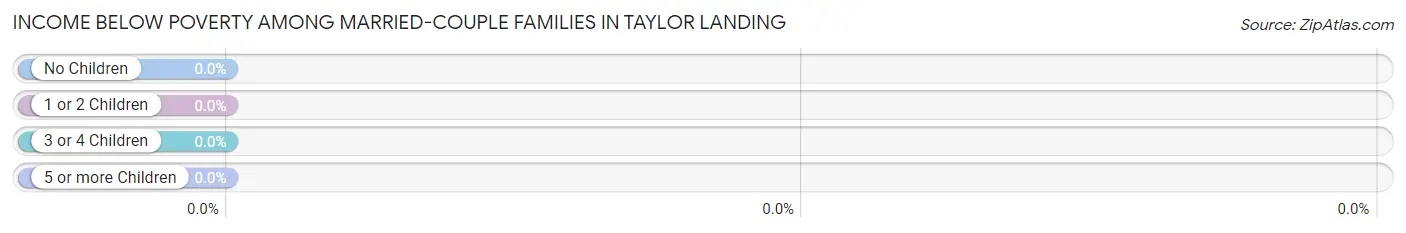
| Children | Above Poverty | Below Poverty |
| No Children | 58 (100.0%) | 0 (0.0%) |
| 1 or 2 Children | 9 (100.0%) | 0 (0.0%) |
| 3 or 4 Children | 13 (100.0%) | 0 (0.0%) |
| 5 or more Children | 3 (100.0%) | 0 (0.0%) |
| Total | 83 (100.0%) | 0 (0.0%) |
Income Below Poverty Among Single-Parent Households in Taylor Landing
| Children | Single Father | Single Mother |
| No Children | 0 (0.0%) | 0 (0.0%) |
| 1 or 2 Children | 0 (0.0%) | 0 (0.0%) |
| 3 or 4 Children | 0 (0.0%) | 0 (0.0%) |
| 5 or more Children | 0 (0.0%) | 0 (0.0%) |
| Total | 0 (0.0%) | 0 (0.0%) |
Income Below Poverty Among Married-Couple vs Single-Parent Households in Taylor Landing
| Children | Married-Couple Families | Single-Parent Households |
| No Children | 0 (0.0%) | 0 (0.0%) |
| 1 or 2 Children | 0 (0.0%) | 0 (0.0%) |
| 3 or 4 Children | 0 (0.0%) | 0 (0.0%) |
| 5 or more Children | 0 (0.0%) | 0 (0.0%) |
| Total | 0 (0.0%) | 0 (0.0%) |
Race in Taylor Landing
The most populous races in Taylor Landing are White / Caucasian (269 | 95.7%), Hispanic or Latino (48 | 17.1%), and Two or more Races (8 | 2.9%).
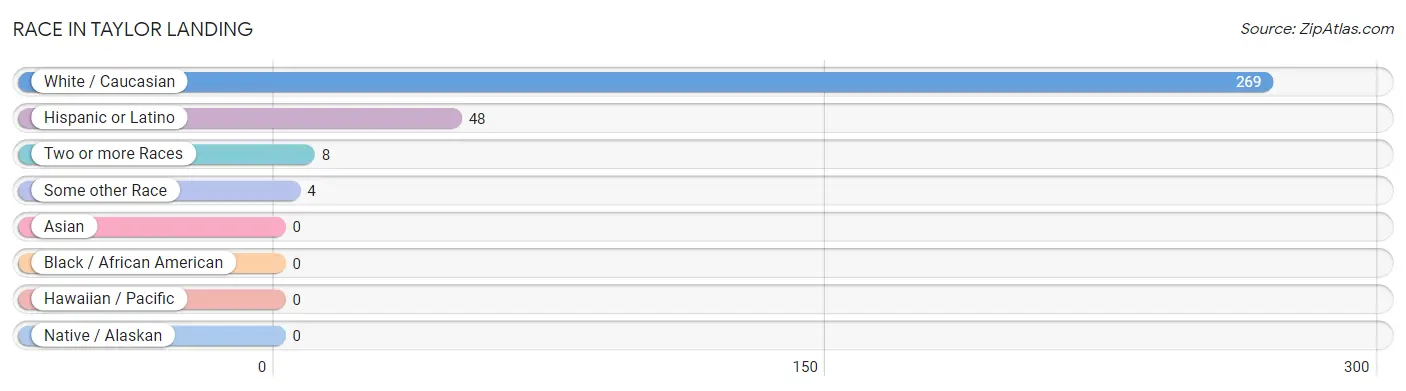
| Race | # Population | % Population |
| Asian | 0 | 0.0% |
| Black / African American | 0 | 0.0% |
| Hawaiian / Pacific | 0 | 0.0% |
| Hispanic or Latino | 48 | 17.1% |
| Native / Alaskan | 0 | 0.0% |
| White / Caucasian | 269 | 95.7% |
| Two or more Races | 8 | 2.9% |
| Some other Race | 4 | 1.4% |
| Total | 281 | 100.0% |
Ancestry in Taylor Landing
The most populous ancestries reported in Taylor Landing are English (45 | 16.0%), French (38 | 13.5%), Mexican (35 | 12.5%), German (24 | 8.5%), and Irish (21 | 7.5%), together accounting for 58.0% of all Taylor Landing residents.
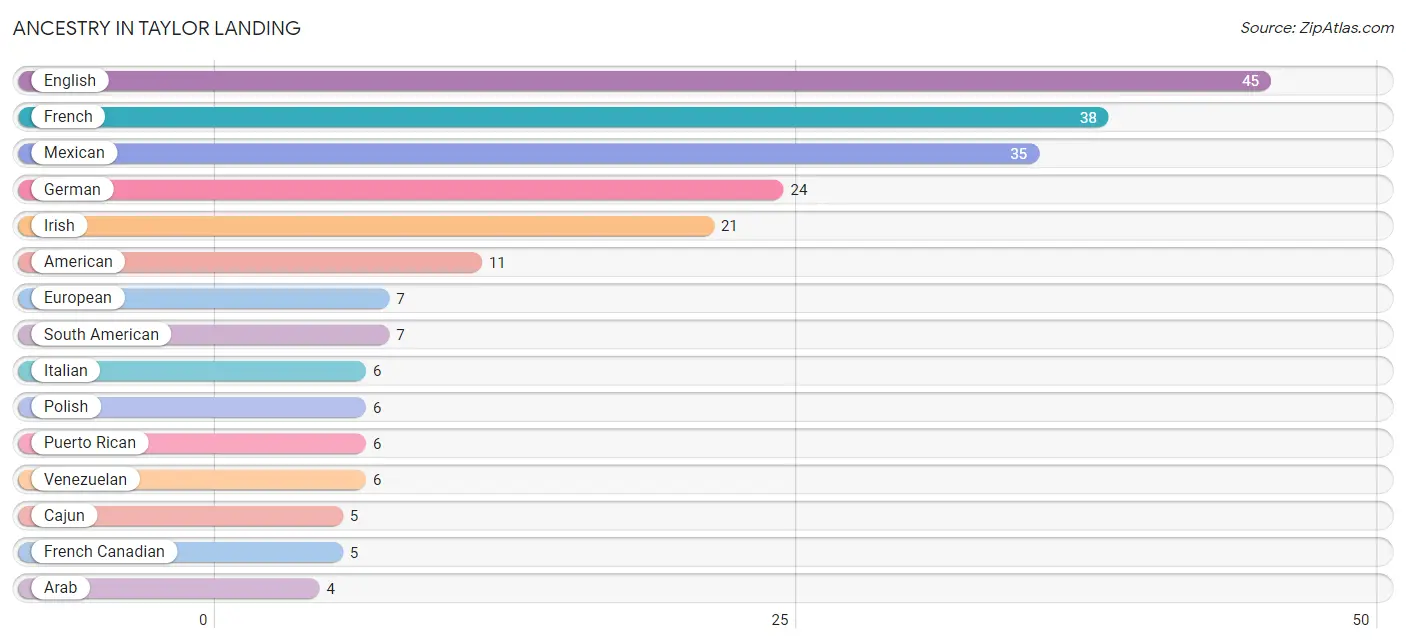
| Ancestry | # Population | % Population |
| American | 11 | 3.9% |
| Arab | 4 | 1.4% |
| British | 2 | 0.7% |
| Cajun | 5 | 1.8% |
| Chilean | 1 | 0.4% |
| Croatian | 1 | 0.4% |
| Czech | 1 | 0.4% |
| Danish | 1 | 0.4% |
| English | 45 | 16.0% |
| European | 7 | 2.5% |
| French | 38 | 13.5% |
| French American Indian | 2 | 0.7% |
| French Canadian | 5 | 1.8% |
| German | 24 | 8.5% |
| Irish | 21 | 7.5% |
| Italian | 6 | 2.1% |
| Lebanese | 1 | 0.4% |
| Mexican | 35 | 12.5% |
| Palestinian | 3 | 1.1% |
| Polish | 6 | 2.1% |
| Portuguese | 1 | 0.4% |
| Puerto Rican | 6 | 2.1% |
| Russian | 1 | 0.4% |
| Scotch-Irish | 4 | 1.4% |
| Scottish | 4 | 1.4% |
| Slovak | 2 | 0.7% |
| South American | 7 | 2.5% |
| Swedish | 3 | 1.1% |
| Venezuelan | 6 | 2.1% | View All 29 Rows |
Immigrants in Taylor Landing
The most numerous immigrant groups reported in Taylor Landing came from Latin America (10 | 3.6%), Central America (9 | 3.2%), Honduras (7 | 2.5%), Mexico (2 | 0.7%), and Chile (1 | 0.4%), together accounting for 10.3% of all Taylor Landing residents.
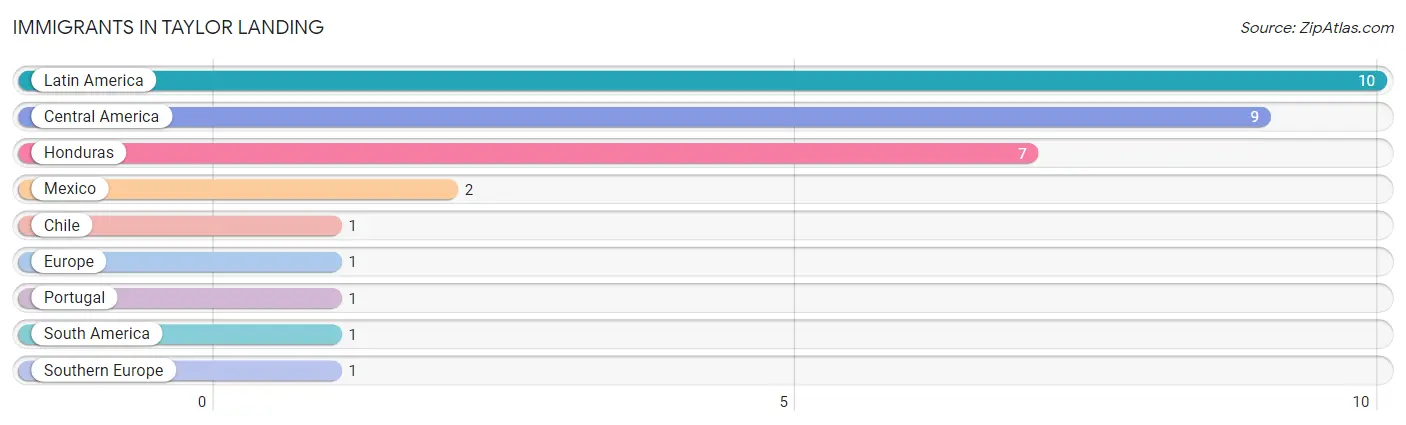
| Immigration Origin | # Population | % Population |
| Central America | 9 | 3.2% |
| Chile | 1 | 0.4% |
| Europe | 1 | 0.4% |
| Honduras | 7 | 2.5% |
| Latin America | 10 | 3.6% |
| Mexico | 2 | 0.7% |
| Portugal | 1 | 0.4% |
| South America | 1 | 0.4% |
| Southern Europe | 1 | 0.4% | View All 9 Rows |
Sex and Age in Taylor Landing
Sex and Age in Taylor Landing
The most populous age groups in Taylor Landing are 65 to 69 Years (18 | 14.5%) for men and 40 to 44 Years (20 | 12.7%) for women.
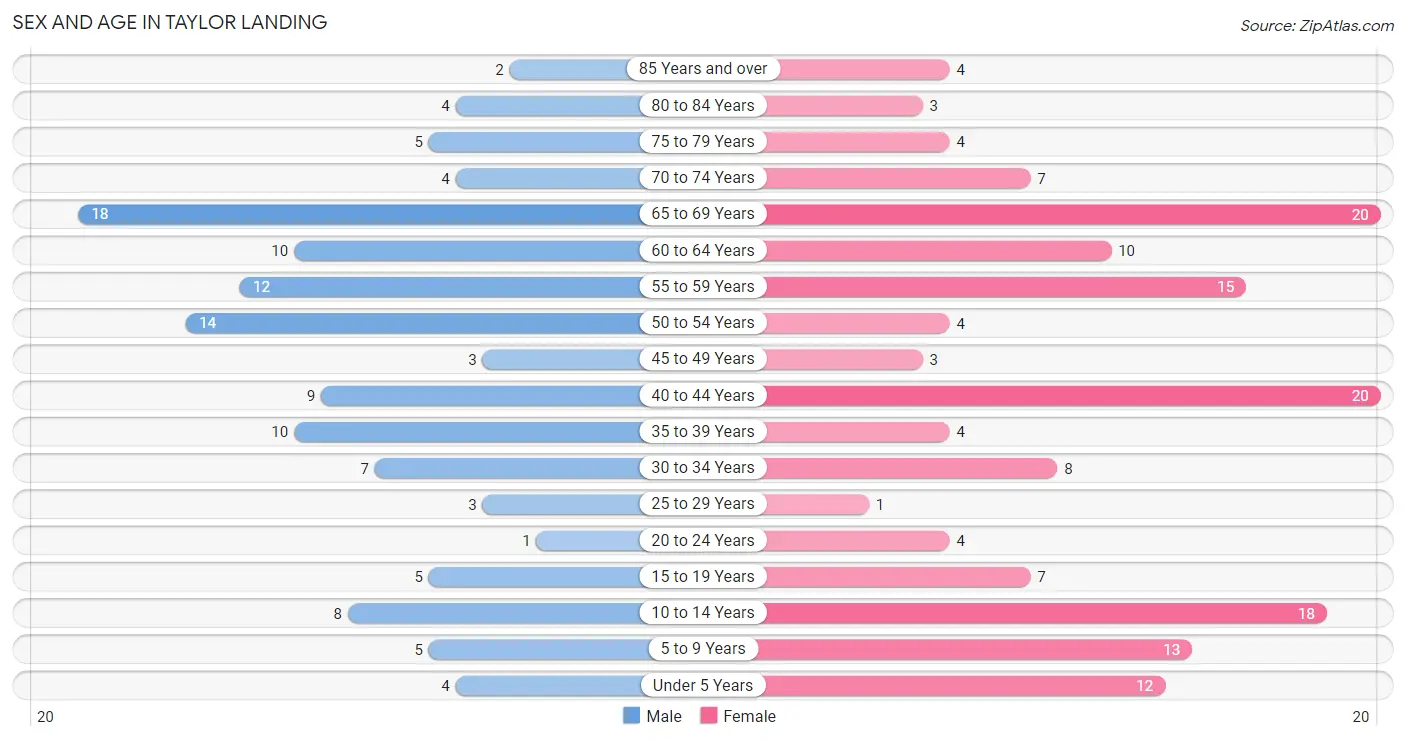
| Age Bracket | Male | Female |
| Under 5 Years | 4 (3.2%) | 12 (7.6%) |
| 5 to 9 Years | 5 (4.0%) | 13 (8.3%) |
| 10 to 14 Years | 8 (6.5%) | 18 (11.5%) |
| 15 to 19 Years | 5 (4.0%) | 7 (4.5%) |
| 20 to 24 Years | 1 (0.8%) | 4 (2.5%) |
| 25 to 29 Years | 3 (2.4%) | 1 (0.6%) |
| 30 to 34 Years | 7 (5.7%) | 8 (5.1%) |
| 35 to 39 Years | 10 (8.1%) | 4 (2.5%) |
| 40 to 44 Years | 9 (7.3%) | 20 (12.7%) |
| 45 to 49 Years | 3 (2.4%) | 3 (1.9%) |
| 50 to 54 Years | 14 (11.3%) | 4 (2.5%) |
| 55 to 59 Years | 12 (9.7%) | 15 (9.6%) |
| 60 to 64 Years | 10 (8.1%) | 10 (6.4%) |
| 65 to 69 Years | 18 (14.5%) | 20 (12.7%) |
| 70 to 74 Years | 4 (3.2%) | 7 (4.5%) |
| 75 to 79 Years | 5 (4.0%) | 4 (2.5%) |
| 80 to 84 Years | 4 (3.2%) | 3 (1.9%) |
| 85 Years and over | 2 (1.6%) | 4 (2.5%) |
| Total | 124 (100.0%) | 157 (100.0%) |
Families and Households in Taylor Landing
Median Family Size in Taylor Landing
The median family size in Taylor Landing is 2.94 persons per family, with single female/mother families (4 | 4.4%) accounting for the largest median family size of 3.25 persons per family. On the other hand, single male/father families (3 | 3.3%) represent the smallest median family size with 2.00 persons per family.
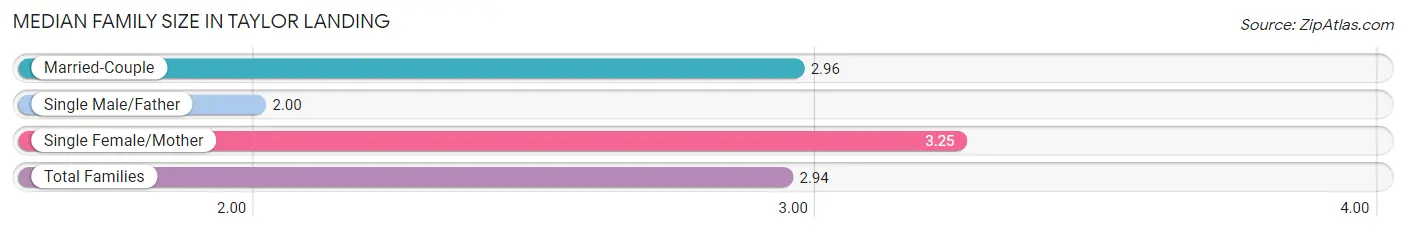
| Family Type | # Families | Family Size |
| Married-Couple | 83 (92.2%) | 2.96 |
| Single Male/Father | 3 (3.3%) | 2.00 |
| Single Female/Mother | 4 (4.4%) | 3.25 |
| Total Families | 90 (100.0%) | 2.94 |
Median Household Size in Taylor Landing
The median household size in Taylor Landing is 2.87 persons per household, with single female/mother households (4 | 4.1%) accounting for the largest median household size of 3.25 persons per household. non-family households (8 | 8.2%) represent the smallest median household size with 1.88 persons per household.
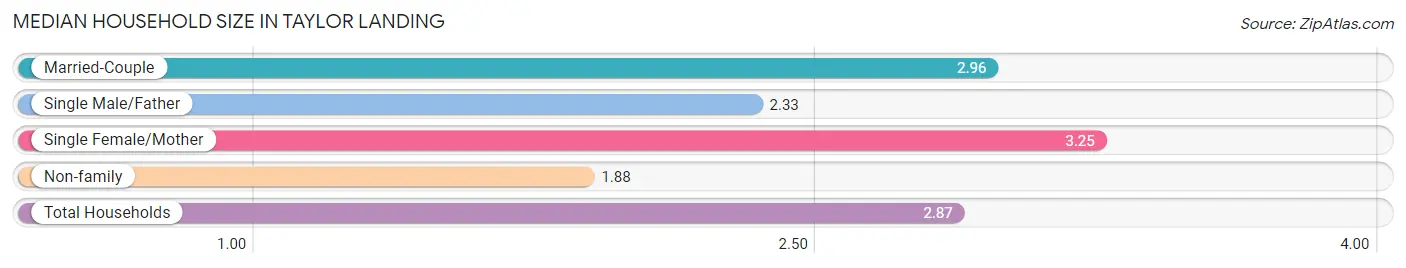
| Household Type | # Households | Household Size |
| Married-Couple | 83 (84.7%) | 2.96 |
| Single Male/Father | 3 (3.1%) | 2.33 |
| Single Female/Mother | 4 (4.1%) | 3.25 |
| Non-family | 8 (8.2%) | 1.88 |
| Total Households | 98 (100.0%) | 2.87 |
Household Size by Marriage Status in Taylor Landing
Out of a total of 98 households in Taylor Landing, 90 (91.8%) are family households, while 8 (8.2%) are nonfamily households. The most numerous type of family households are 2-person households, comprising 54, and the most common type of nonfamily households are 1-person households, comprising 4.
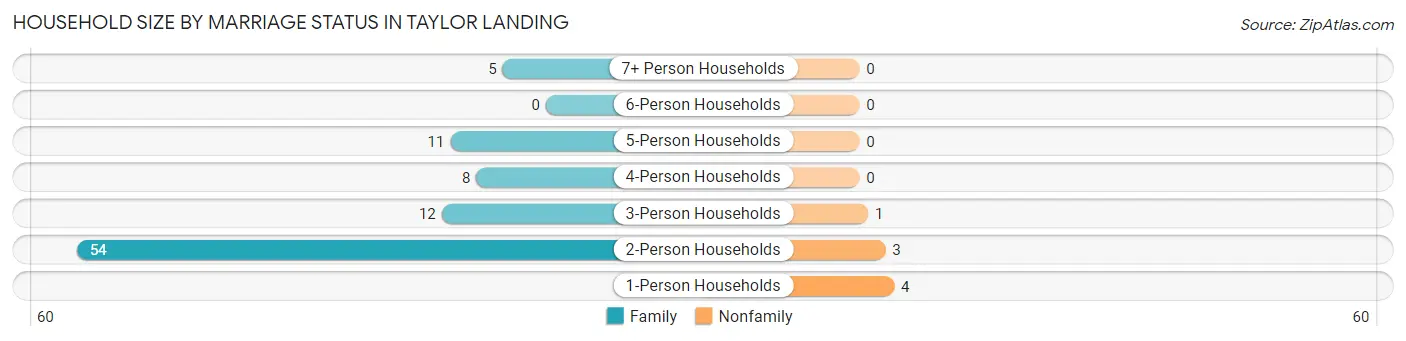
| Household Size | Family Households | Nonfamily Households |
| 1-Person Households | - | 4 (4.1%) |
| 2-Person Households | 54 (55.1%) | 3 (3.1%) |
| 3-Person Households | 12 (12.2%) | 1 (1.0%) |
| 4-Person Households | 8 (8.2%) | 0 (0.0%) |
| 5-Person Households | 11 (11.2%) | 0 (0.0%) |
| 6-Person Households | 0 (0.0%) | 0 (0.0%) |
| 7+ Person Households | 5 (5.1%) | 0 (0.0%) |
| Total | 90 (91.8%) | 8 (8.2%) |
Female Fertility in Taylor Landing
Fertility by Age in Taylor Landing
Average fertility rate in Taylor Landing is 64.0 births per 1,000 women. Women in the age bracket of 20 to 34 years have the highest fertility rate with 154.0 births per 1,000 women. Women in the age bracket of 20 to 34 years acount for 66.7% of all women with births.
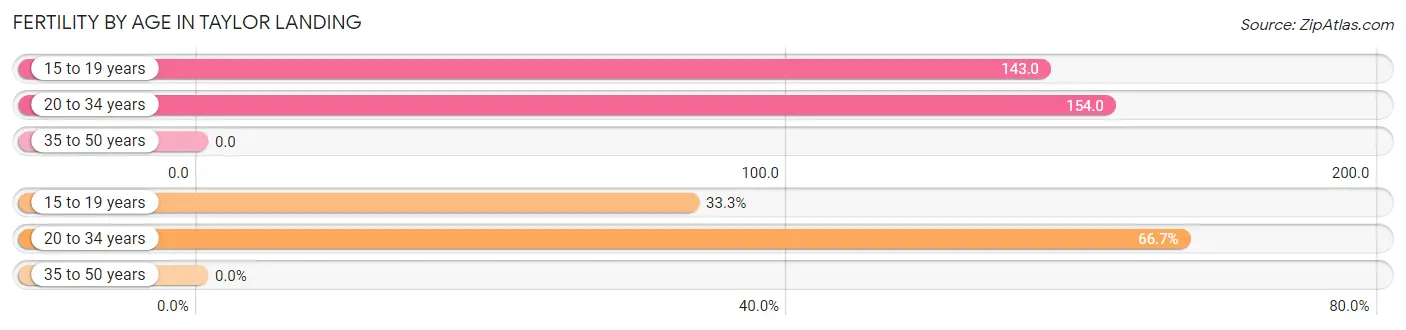
| Age Bracket | Women with Births | Births / 1,000 Women |
| 15 to 19 years | 1 (33.3%) | 143.0 |
| 20 to 34 years | 2 (66.7%) | 154.0 |
| 35 to 50 years | 0 (0.0%) | 0.0 |
| Total | 3 (100.0%) | 64.0 |
Fertility by Age by Marriage Status in Taylor Landing
66.7% of women with births (3) in Taylor Landing are married. The highest percentage of unmarried women with births falls into 15 to 19 years age bracket with 100.0% of them unmarried at the time of birth, while the lowest percentage of unmarried women with births belong to 20 to 34 years age bracket with 0.0% of them unmarried.
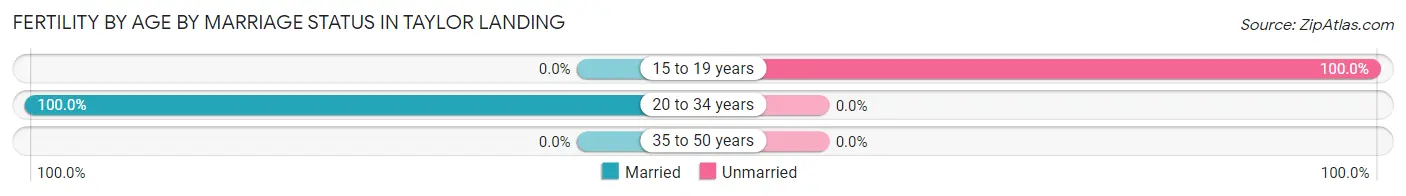
| Age Bracket | Married | Unmarried |
| 15 to 19 years | 0 (0.0%) | 1 (100.0%) |
| 20 to 34 years | 2 (100.0%) | 0 (0.0%) |
| 35 to 50 years | 0 (0.0%) | 0 (0.0%) |
| Total | 2 (66.7%) | 1 (33.3%) |
Fertility by Education in Taylor Landing
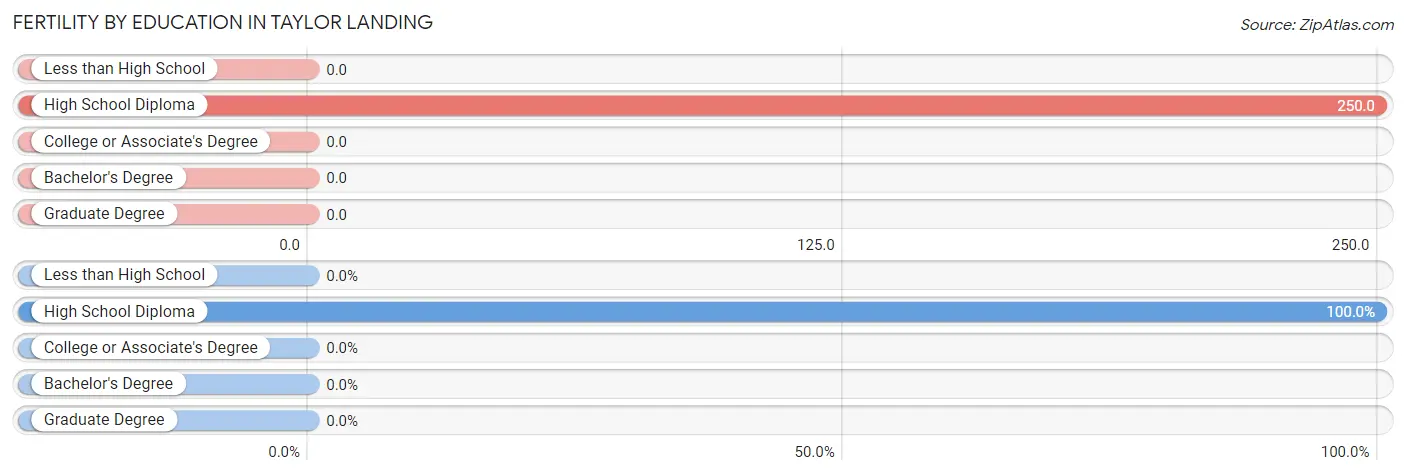
| Educational Attainment | Women with Births | Births / 1,000 Women |
| Less than High School | 0 (0.0%) | 0.0 |
| High School Diploma | 3 (100.0%) | 250.0 |
| College or Associate's Degree | 0 (0.0%) | 0.0 |
| Bachelor's Degree | 0 (0.0%) | 0.0 |
| Graduate Degree | 0 (0.0%) | 0.0 |
| Total | 3 (100.0%) | 64.0 |
Fertility by Education by Marriage Status in Taylor Landing
33.3% of women with births in Taylor Landing are unmarried. Women with the educational attainment of high school diploma are most likely to be married with 66.7% of them married at childbirth, while women with the educational attainment of high school diploma are least likely to be married with 33.3% of them unmarried at childbirth.
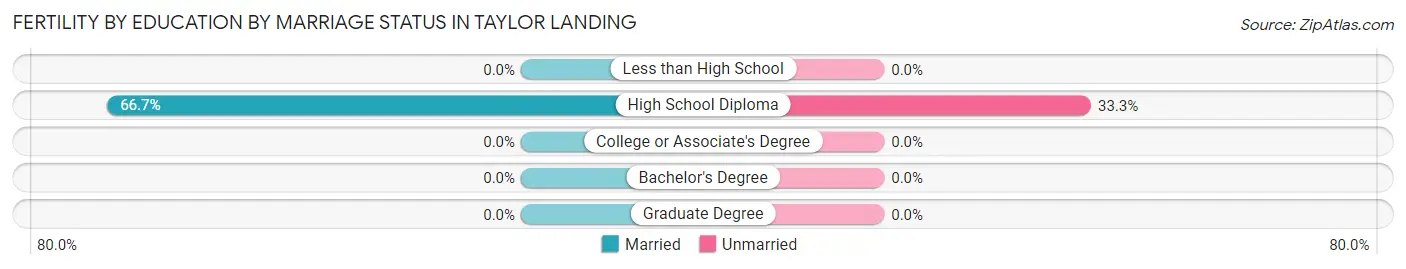
| Educational Attainment | Married | Unmarried |
| Less than High School | 0 (0.0%) | 0 (0.0%) |
| High School Diploma | 2 (66.7%) | 1 (33.3%) |
| College or Associate's Degree | 0 (0.0%) | 0 (0.0%) |
| Bachelor's Degree | 0 (0.0%) | 0 (0.0%) |
| Graduate Degree | 0 (0.0%) | 0 (0.0%) |
| Total | 2 (66.7%) | 1 (33.3%) |
Employment Characteristics in Taylor Landing
Employment by Class of Employer in Taylor Landing
Among the 118 employed individuals in Taylor Landing, private company employees (88 | 74.6%), not-for-profit organizations (15 | 12.7%), and local government employees (7 | 5.9%) make up the most common classes of employment.
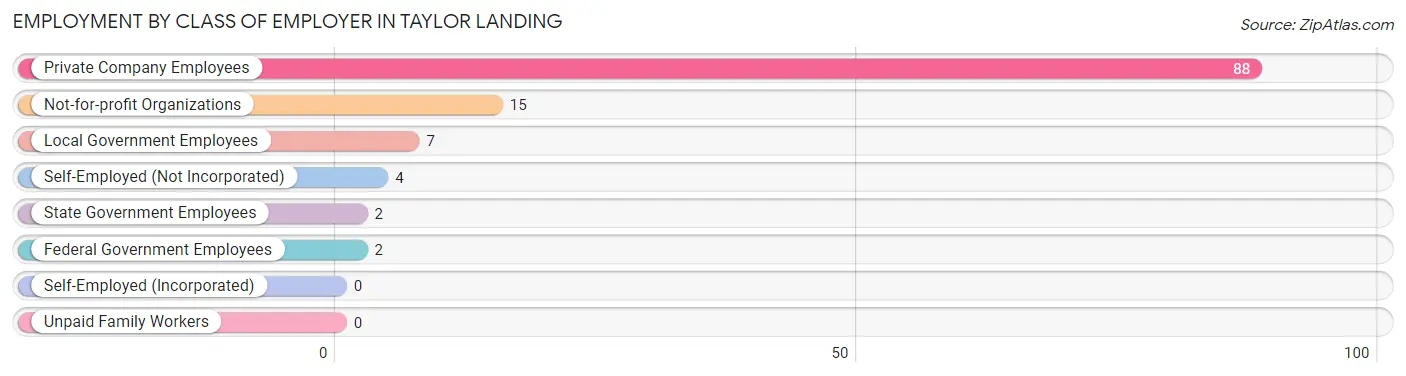
| Employer Class | # Employees | % Employees |
| Private Company Employees | 88 | 74.6% |
| Self-Employed (Incorporated) | 0 | 0.0% |
| Self-Employed (Not Incorporated) | 4 | 3.4% |
| Not-for-profit Organizations | 15 | 12.7% |
| Local Government Employees | 7 | 5.9% |
| State Government Employees | 2 | 1.7% |
| Federal Government Employees | 2 | 1.7% |
| Unpaid Family Workers | 0 | 0.0% |
| Total | 118 | 100.0% |
Employment Status by Age in Taylor Landing
According to the labor force statistics for Taylor Landing, out of the total population over 16 years of age (213), 56.3% or 120 individuals are in the labor force, with 1.7% or 2 of them unemployed. The age group with the highest labor force participation rate is 30 to 34 years, with 100.0% or 15 individuals in the labor force. Within the labor force, the 35 to 44 years age range has the highest percentage of unemployed individuals, with 6.9% or 2 of them being unemployed.
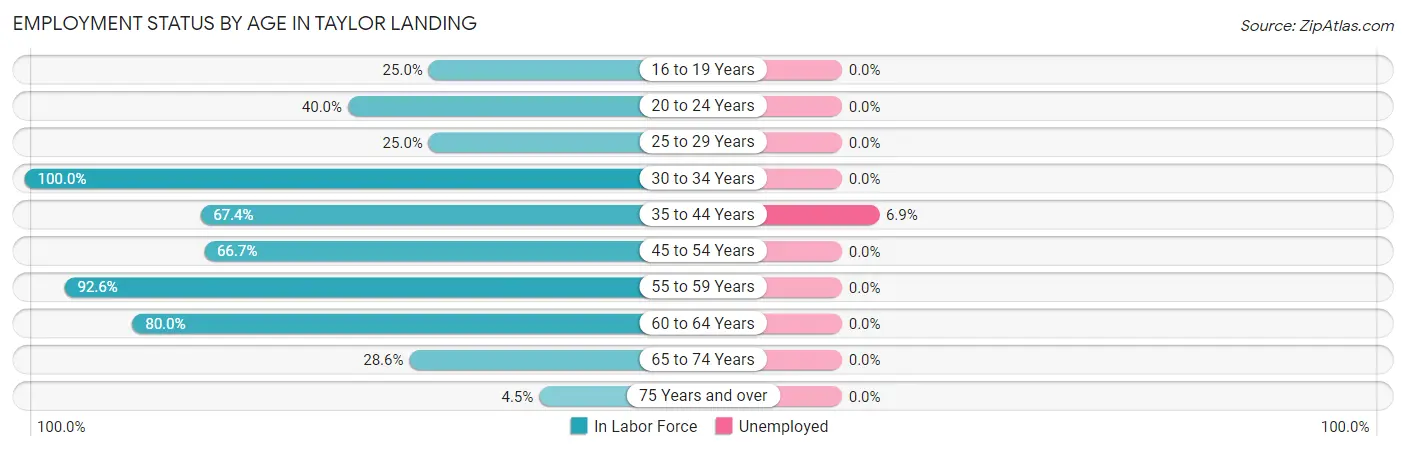
| Age Bracket | In Labor Force | Unemployed |
| 16 to 19 Years | 1 (25.0%) | 0 (0.0%) |
| 20 to 24 Years | 2 (40.0%) | 0 (0.0%) |
| 25 to 29 Years | 1 (25.0%) | 0 (0.0%) |
| 30 to 34 Years | 15 (100.0%) | 0 (0.0%) |
| 35 to 44 Years | 29 (67.4%) | 2 (6.9%) |
| 45 to 54 Years | 16 (66.7%) | 0 (0.0%) |
| 55 to 59 Years | 25 (92.6%) | 0 (0.0%) |
| 60 to 64 Years | 16 (80.0%) | 0 (0.0%) |
| 65 to 74 Years | 14 (28.6%) | 0 (0.0%) |
| 75 Years and over | 1 (4.5%) | 0 (0.0%) |
| Total | 120 (56.3%) | 2 (1.7%) |
Employment Status by Educational Attainment in Taylor Landing
According to labor force statistics for Taylor Landing, 76.7% of individuals (102) out of the total population between 25 and 64 years of age (133) are in the labor force, with 2.0% or 2 of them being unemployed. The group with the highest labor force participation rate are those with the educational attainment of bachelor's degree or higher, with 85.7% or 36 individuals in the labor force. Within the labor force, individuals with high school diploma education have the highest percentage of unemployment, with 6.9% or 2 of them being unemployed.
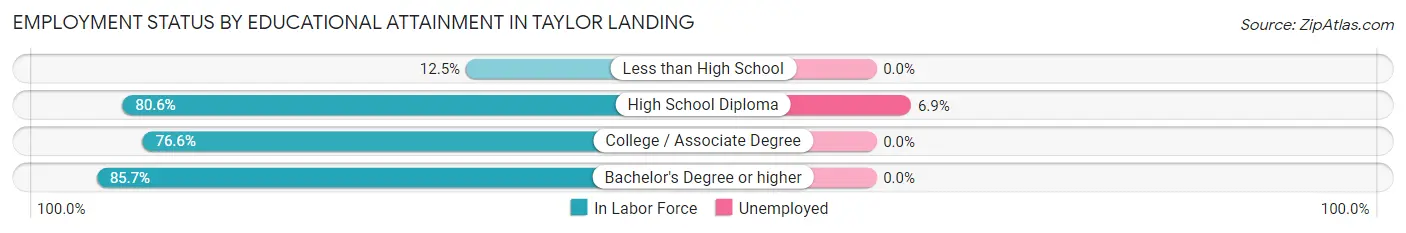
| Educational Attainment | In Labor Force | Unemployed |
| Less than High School | 1 (12.5%) | 0 (0.0%) |
| High School Diploma | 29 (80.6%) | 2 (6.9%) |
| College / Associate Degree | 36 (76.6%) | 0 (0.0%) |
| Bachelor's Degree or higher | 36 (85.7%) | 0 (0.0%) |
| Total | 102 (76.7%) | 3 (2.0%) |
Employment Occupations by Sex in Taylor Landing
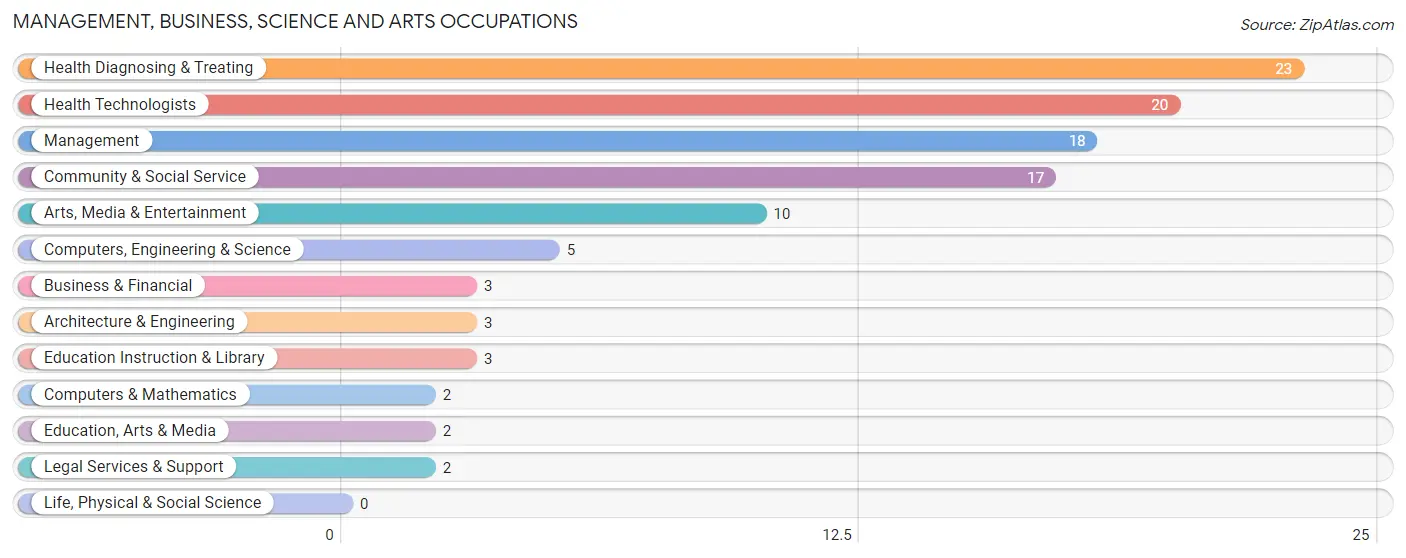
Management, Business, Science and Arts Occupations
The most common Management, Business, Science and Arts occupations in Taylor Landing are Health Diagnosing & Treating (23 | 19.8%), Health Technologists (20 | 17.2%), Management (18 | 15.5%), Community & Social Service (17 | 14.7%), and Arts, Media & Entertainment (10 | 8.6%).
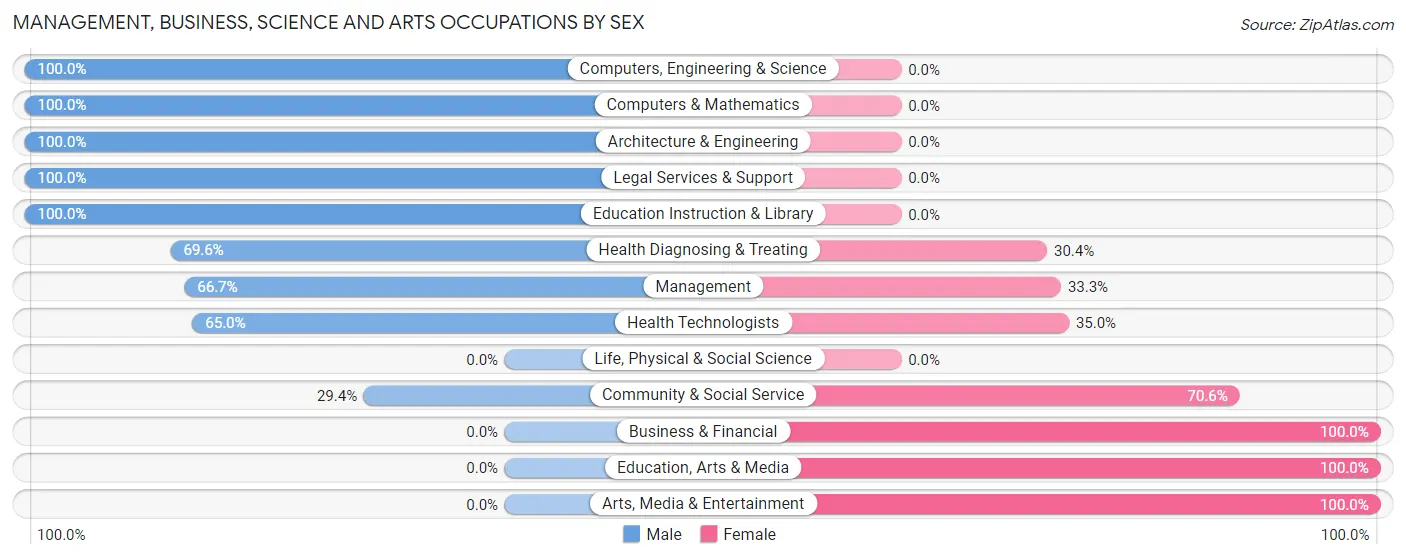
Management, Business, Science and Arts Occupations by Sex
Within the Management, Business, Science and Arts occupations in Taylor Landing, the most male-oriented occupations are Computers, Engineering & Science (100.0%), Computers & Mathematics (100.0%), and Architecture & Engineering (100.0%), while the most female-oriented occupations are Business & Financial (100.0%), Education, Arts & Media (100.0%), and Arts, Media & Entertainment (100.0%).
| Occupation | Male | Female |
| Management | 12 (66.7%) | 6 (33.3%) |
| Business & Financial | 0 (0.0%) | 3 (100.0%) |
| Computers, Engineering & Science | 5 (100.0%) | 0 (0.0%) |
| Computers & Mathematics | 2 (100.0%) | 0 (0.0%) |
| Architecture & Engineering | 3 (100.0%) | 0 (0.0%) |
| Life, Physical & Social Science | 0 (0.0%) | 0 (0.0%) |
| Community & Social Service | 5 (29.4%) | 12 (70.6%) |
| Education, Arts & Media | 0 (0.0%) | 2 (100.0%) |
| Legal Services & Support | 2 (100.0%) | 0 (0.0%) |
| Education Instruction & Library | 3 (100.0%) | 0 (0.0%) |
| Arts, Media & Entertainment | 0 (0.0%) | 10 (100.0%) |
| Health Diagnosing & Treating | 16 (69.6%) | 7 (30.4%) |
| Health Technologists | 13 (65.0%) | 7 (35.0%) |
| Total (Category) | 38 (57.6%) | 28 (42.4%) |
| Total (Overall) | 69 (59.5%) | 47 (40.5%) |
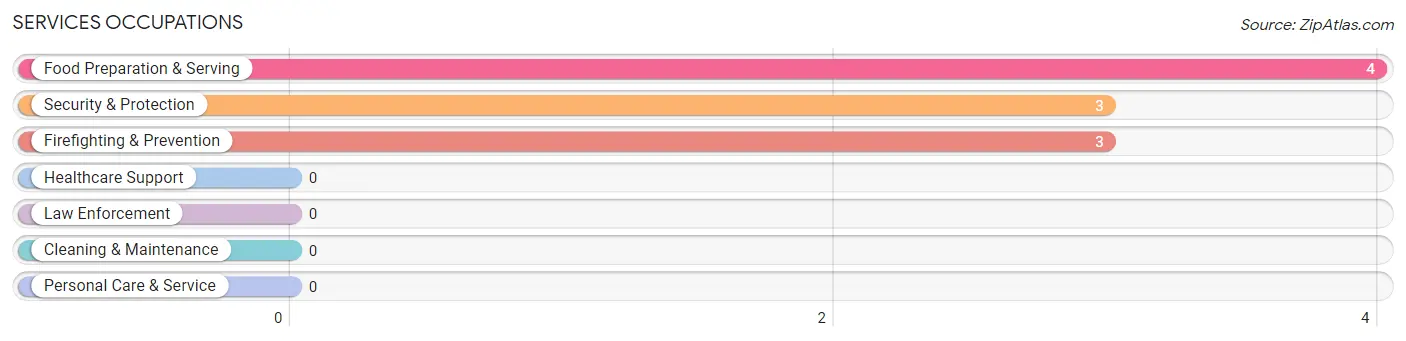
Services Occupations
The most common Services occupations in Taylor Landing are Food Preparation & Serving (4 | 3.5%), Security & Protection (3 | 2.6%), and Firefighting & Prevention (3 | 2.6%).
Services Occupations by Sex
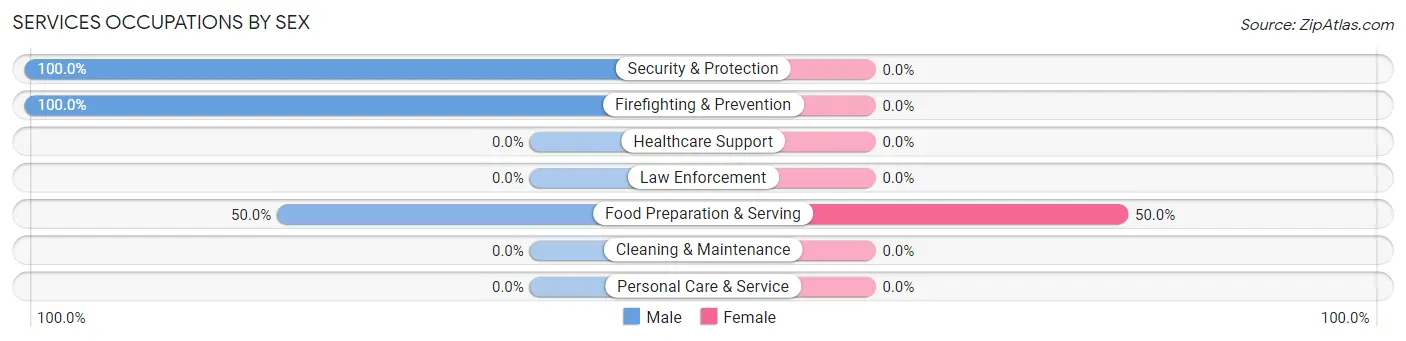
| Occupation | Male | Female |
| Healthcare Support | 0 (0.0%) | 0 (0.0%) |
| Security & Protection | 3 (100.0%) | 0 (0.0%) |
| Firefighting & Prevention | 3 (100.0%) | 0 (0.0%) |
| Law Enforcement | 0 (0.0%) | 0 (0.0%) |
| Food Preparation & Serving | 2 (50.0%) | 2 (50.0%) |
| Cleaning & Maintenance | 0 (0.0%) | 0 (0.0%) |
| Personal Care & Service | 0 (0.0%) | 0 (0.0%) |
| Total (Category) | 5 (71.4%) | 2 (28.6%) |
| Total (Overall) | 69 (59.5%) | 47 (40.5%) |
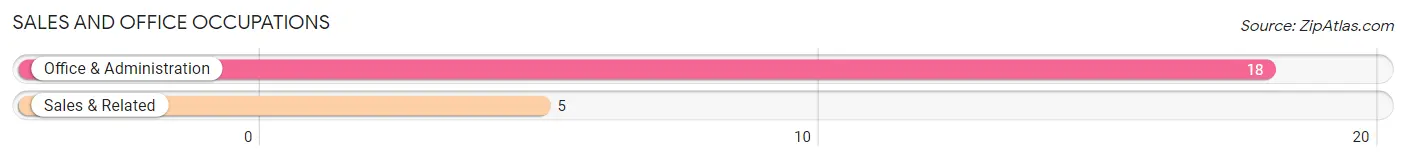
Sales and Office Occupations
The most common Sales and Office occupations in Taylor Landing are Office & Administration (18 | 15.5%), and Sales & Related (5 | 4.3%).
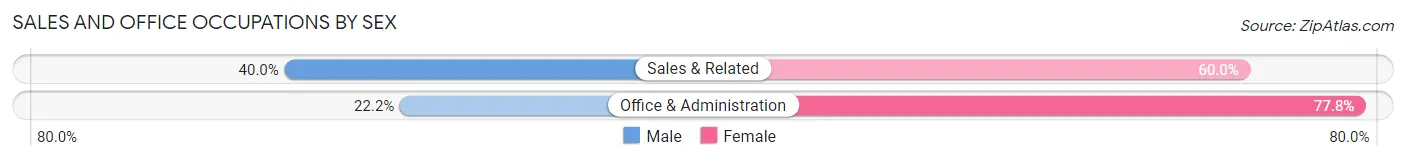
Sales and Office Occupations by Sex
| Occupation | Male | Female |
| Sales & Related | 2 (40.0%) | 3 (60.0%) |
| Office & Administration | 4 (22.2%) | 14 (77.8%) |
| Total (Category) | 6 (26.1%) | 17 (73.9%) |
| Total (Overall) | 69 (59.5%) | 47 (40.5%) |
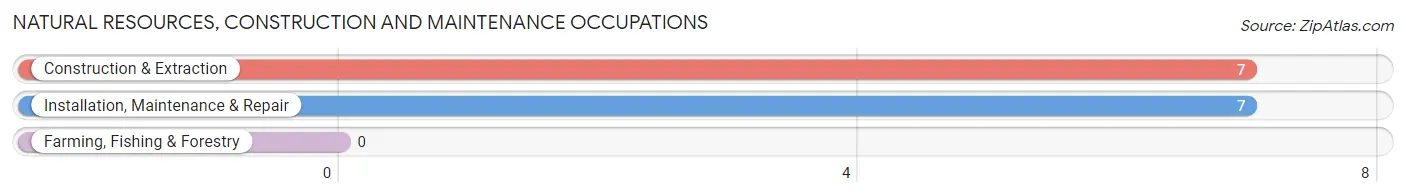
Natural Resources, Construction and Maintenance Occupations
The most common Natural Resources, Construction and Maintenance occupations in Taylor Landing are Construction & Extraction (7 | 6.0%), and Installation, Maintenance & Repair (7 | 6.0%).
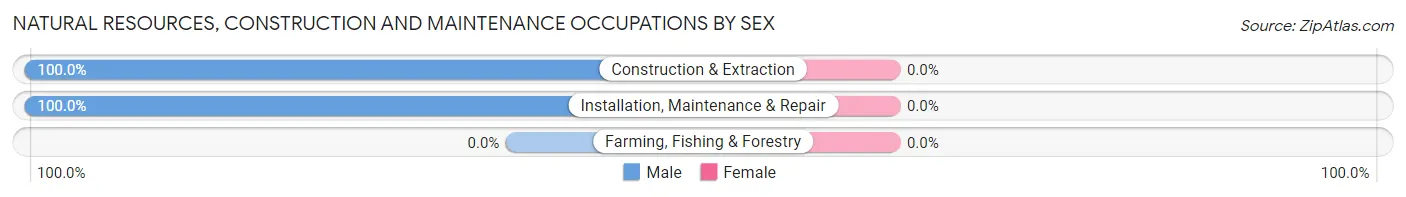
Natural Resources, Construction and Maintenance Occupations by Sex
| Occupation | Male | Female |
| Farming, Fishing & Forestry | 0 (0.0%) | 0 (0.0%) |
| Construction & Extraction | 7 (100.0%) | 0 (0.0%) |
| Installation, Maintenance & Repair | 7 (100.0%) | 0 (0.0%) |
| Total (Category) | 14 (100.0%) | 0 (0.0%) |
| Total (Overall) | 69 (59.5%) | 47 (40.5%) |
Production, Transportation and Moving Occupations
The most common Production, Transportation and Moving occupations in Taylor Landing are Production (4 | 3.5%), and Transportation (2 | 1.7%).
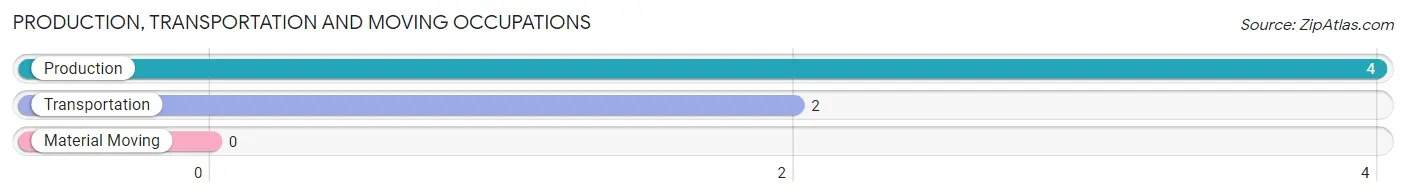
Production, Transportation and Moving Occupations by Sex
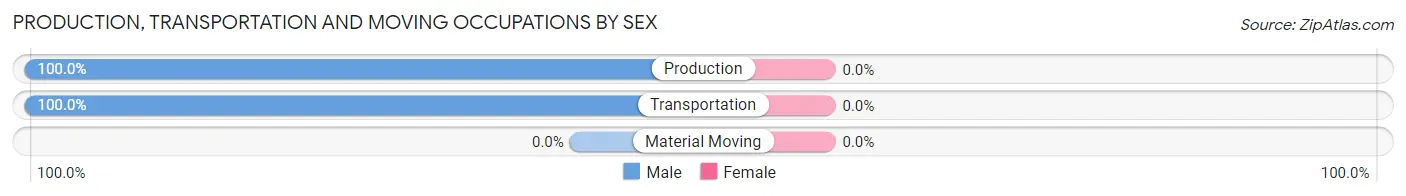
| Occupation | Male | Female |
| Production | 4 (100.0%) | 0 (0.0%) |
| Transportation | 2 (100.0%) | 0 (0.0%) |
| Material Moving | 0 (0.0%) | 0 (0.0%) |
| Total (Category) | 6 (100.0%) | 0 (0.0%) |
| Total (Overall) | 69 (59.5%) | 47 (40.5%) |
Employment Industries by Sex in Taylor Landing
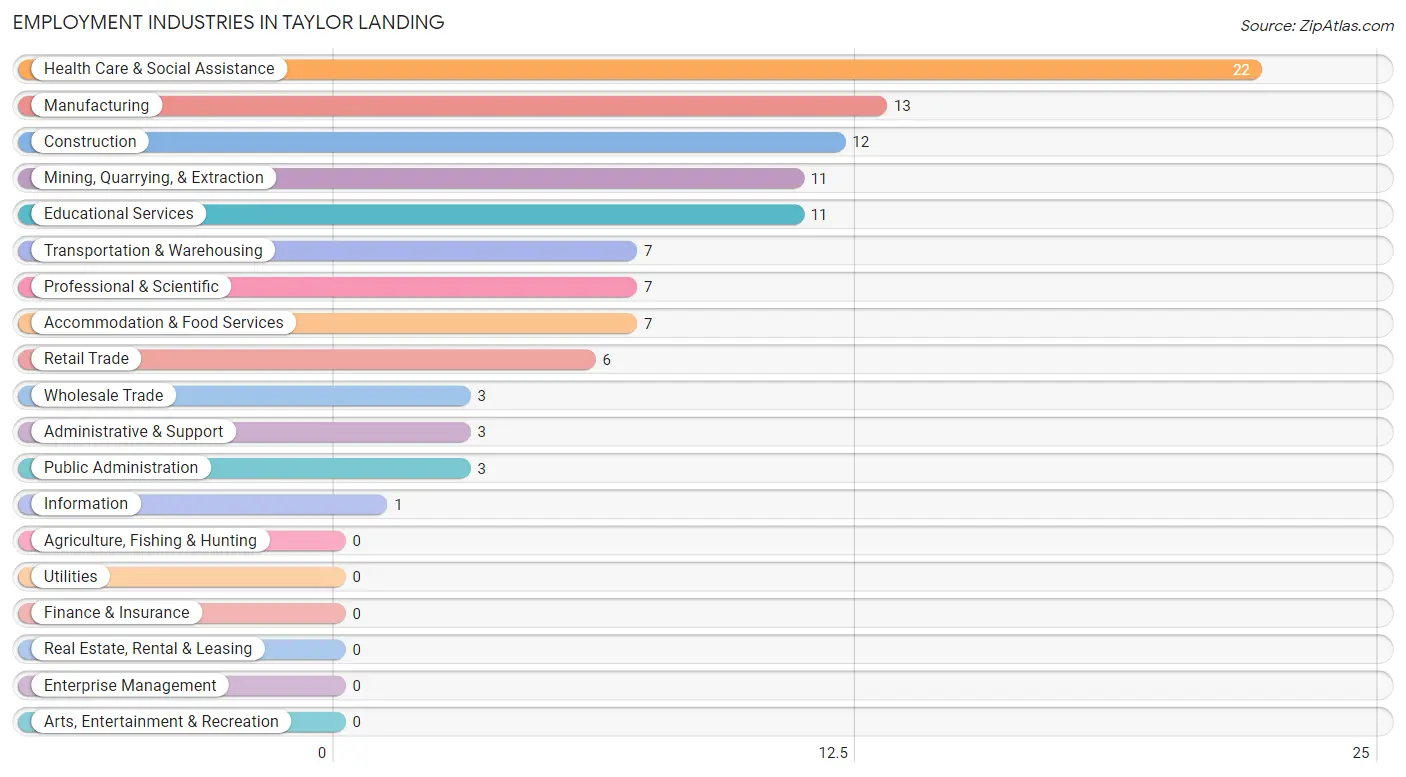
Employment Industries in Taylor Landing
The major employment industries in Taylor Landing include Health Care & Social Assistance (22 | 19.0%), Manufacturing (13 | 11.2%), Construction (12 | 10.3%), Mining, Quarrying, & Extraction (11 | 9.5%), and Educational Services (11 | 9.5%).
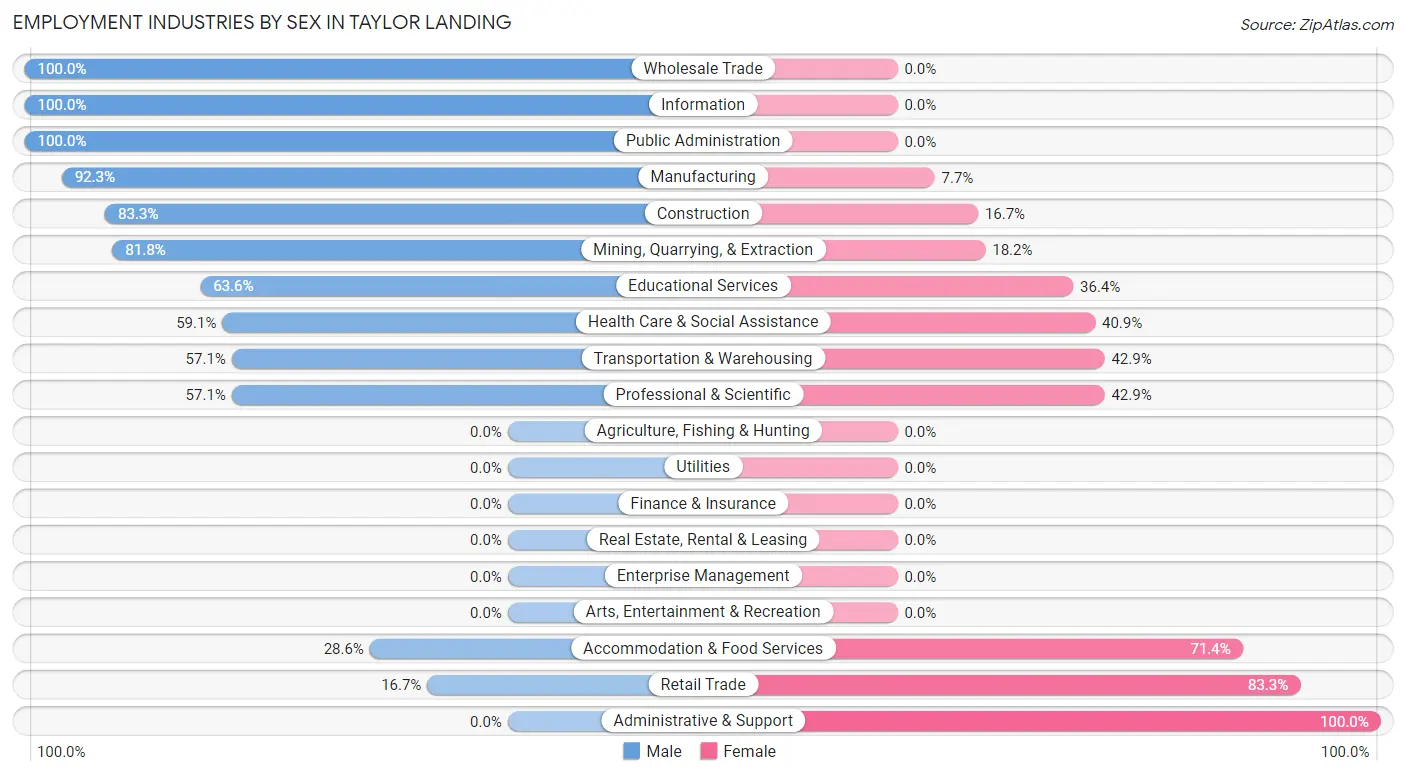
Employment Industries by Sex in Taylor Landing
The Taylor Landing industries that see more men than women are Wholesale Trade (100.0%), Information (100.0%), and Public Administration (100.0%), whereas the industries that tend to have a higher number of women are Administrative & Support (100.0%), Retail Trade (83.3%), and Accommodation & Food Services (71.4%).
| Industry | Male | Female |
| Agriculture, Fishing & Hunting | 0 (0.0%) | 0 (0.0%) |
| Mining, Quarrying, & Extraction | 9 (81.8%) | 2 (18.2%) |
| Construction | 10 (83.3%) | 2 (16.7%) |
| Manufacturing | 12 (92.3%) | 1 (7.7%) |
| Wholesale Trade | 3 (100.0%) | 0 (0.0%) |
| Retail Trade | 1 (16.7%) | 5 (83.3%) |
| Transportation & Warehousing | 4 (57.1%) | 3 (42.9%) |
| Utilities | 0 (0.0%) | 0 (0.0%) |
| Information | 1 (100.0%) | 0 (0.0%) |
| Finance & Insurance | 0 (0.0%) | 0 (0.0%) |
| Real Estate, Rental & Leasing | 0 (0.0%) | 0 (0.0%) |
| Professional & Scientific | 4 (57.1%) | 3 (42.9%) |
| Enterprise Management | 0 (0.0%) | 0 (0.0%) |
| Administrative & Support | 0 (0.0%) | 3 (100.0%) |
| Educational Services | 7 (63.6%) | 4 (36.4%) |
| Health Care & Social Assistance | 13 (59.1%) | 9 (40.9%) |
| Arts, Entertainment & Recreation | 0 (0.0%) | 0 (0.0%) |
| Accommodation & Food Services | 2 (28.6%) | 5 (71.4%) |
| Public Administration | 3 (100.0%) | 0 (0.0%) |
| Total | 69 (59.5%) | 47 (40.5%) |
Education in Taylor Landing
School Enrollment in Taylor Landing
The most common levels of schooling among the 58 students in Taylor Landing are middle school (24 | 41.4%), elementary school (15 | 25.9%), and high school (13 | 22.4%).
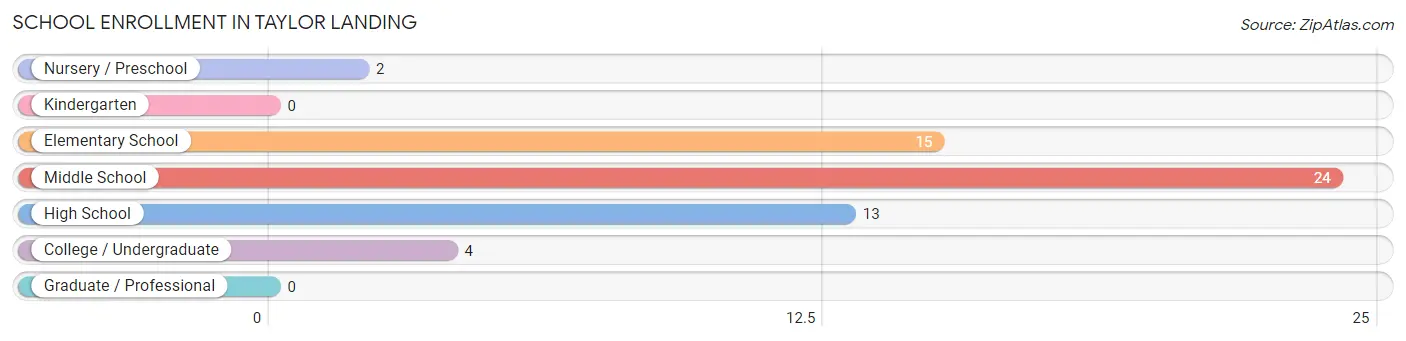
| School Level | # Students | % Students |
| Nursery / Preschool | 2 | 3.5% |
| Kindergarten | 0 | 0.0% |
| Elementary School | 15 | 25.9% |
| Middle School | 24 | 41.4% |
| High School | 13 | 22.4% |
| College / Undergraduate | 4 | 6.9% |
| Graduate / Professional | 0 | 0.0% |
| Total | 58 | 100.0% |
School Enrollment by Age by Funding Source in Taylor Landing
Out of a total of 58 students who are enrolled in schools in Taylor Landing, 8 (13.8%) attend a private institution, while the remaining 50 (86.2%) are enrolled in public schools. The age group of 3 to 4 year olds has the highest likelihood of being enrolled in private schools, with 1 (100.0% in the age bracket) enrolled. Conversely, the age group of 15 to 17 year olds has the lowest likelihood of being enrolled in a private school, with 11 (100.0% in the age bracket) attending a public institution.
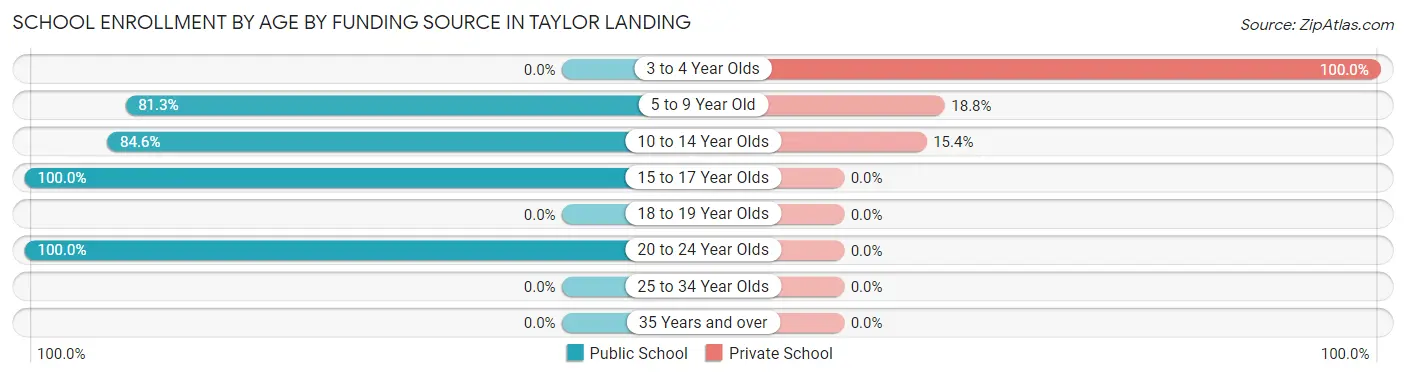
| Age Bracket | Public School | Private School |
| 3 to 4 Year Olds | 0 (0.0%) | 1 (100.0%) |
| 5 to 9 Year Old | 13 (81.2%) | 3 (18.8%) |
| 10 to 14 Year Olds | 22 (84.6%) | 4 (15.4%) |
| 15 to 17 Year Olds | 11 (100.0%) | 0 (0.0%) |
| 18 to 19 Year Olds | 0 (0.0%) | 0 (0.0%) |
| 20 to 24 Year Olds | 4 (100.0%) | 0 (0.0%) |
| 25 to 34 Year Olds | 0 (0.0%) | 0 (0.0%) |
| 35 Years and over | 0 (0.0%) | 0 (0.0%) |
| Total | 50 (86.2%) | 8 (13.8%) |
Educational Attainment by Field of Study in Taylor Landing
Science & technology (23 | 29.9%), education (20 | 26.0%), bio, nature & agricultural (12 | 15.6%), engineering (6 | 7.8%), and business (5 | 6.5%) are the most common fields of study among 77 individuals in Taylor Landing who have obtained a bachelor's degree or higher.
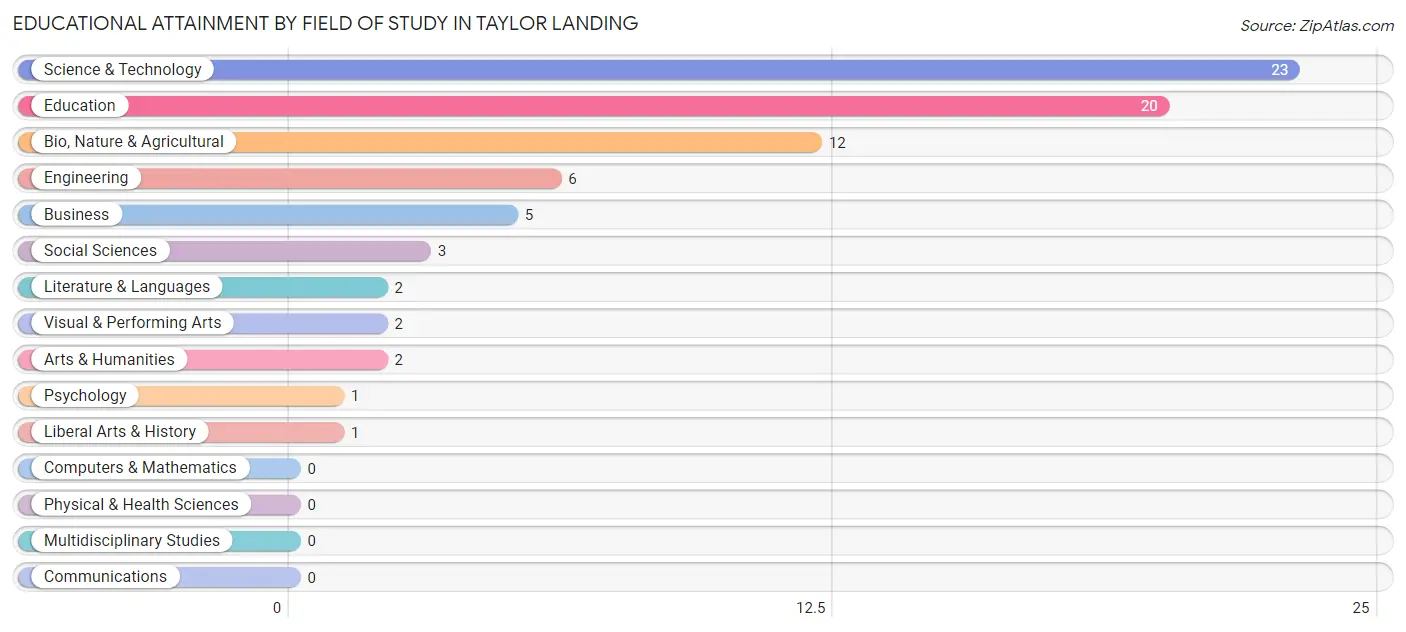
| Field of Study | # Graduates | % Graduates |
| Computers & Mathematics | 0 | 0.0% |
| Bio, Nature & Agricultural | 12 | 15.6% |
| Physical & Health Sciences | 0 | 0.0% |
| Psychology | 1 | 1.3% |
| Social Sciences | 3 | 3.9% |
| Engineering | 6 | 7.8% |
| Multidisciplinary Studies | 0 | 0.0% |
| Science & Technology | 23 | 29.9% |
| Business | 5 | 6.5% |
| Education | 20 | 26.0% |
| Literature & Languages | 2 | 2.6% |
| Liberal Arts & History | 1 | 1.3% |
| Visual & Performing Arts | 2 | 2.6% |
| Communications | 0 | 0.0% |
| Arts & Humanities | 2 | 2.6% |
| Total | 77 | 100.0% |
Transportation & Commute in Taylor Landing
Vehicle Availability by Sex in Taylor Landing
The most prevalent vehicle ownership categories in Taylor Landing are males with 2 vehicles (40, accounting for 58.0%) and females with 2 vehicles (27, making up 81.6%).
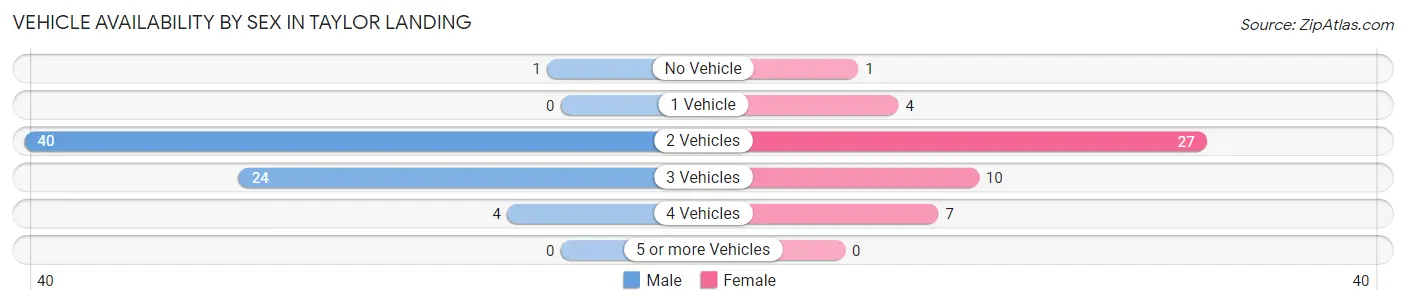
| Vehicles Available | Male | Female |
| No Vehicle | 1 (1.5%) | 1 (2.0%) |
| 1 Vehicle | 0 (0.0%) | 4 (8.2%) |
| 2 Vehicles | 40 (58.0%) | 27 (55.1%) |
| 3 Vehicles | 24 (34.8%) | 10 (20.4%) |
| 4 Vehicles | 4 (5.8%) | 7 (14.3%) |
| 5 or more Vehicles | 0 (0.0%) | 0 (0.0%) |
| Total | 69 (100.0%) | 49 (100.0%) |
Commute Time in Taylor Landing
The most frequently occuring commute durations in Taylor Landing are 20 to 24 minutes (27 commuters, 23.1%), 30 to 34 minutes (27 commuters, 23.1%), and 60 to 89 minutes (12 commuters, 10.3%).
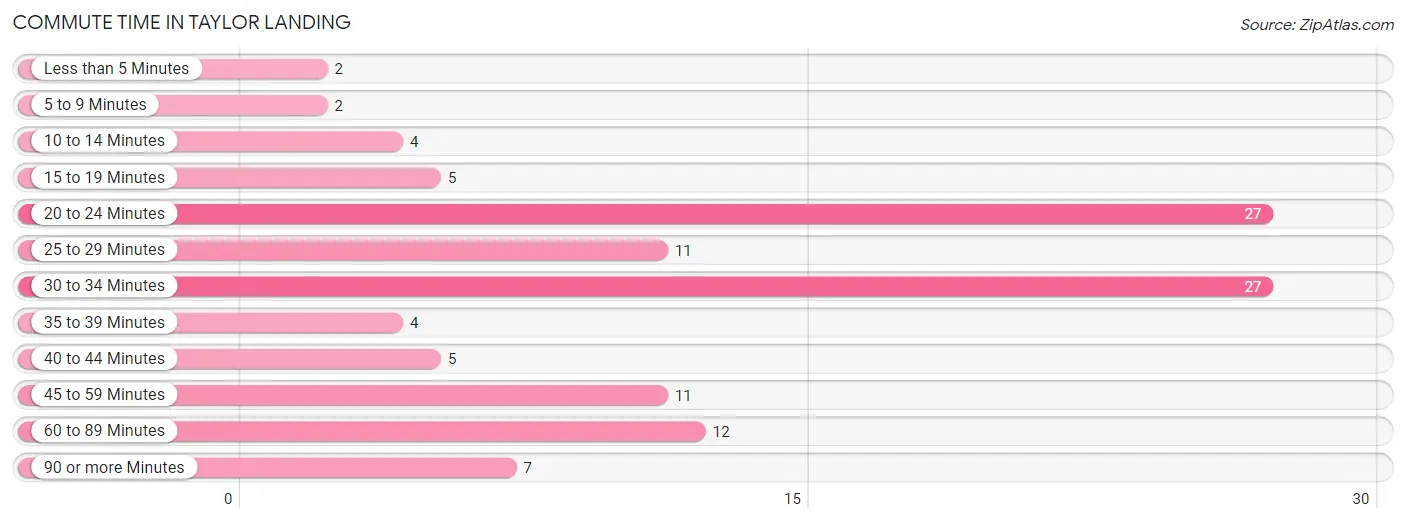
| Commute Time | # Commuters | % Commuters |
| Less than 5 Minutes | 2 | 1.7% |
| 5 to 9 Minutes | 2 | 1.7% |
| 10 to 14 Minutes | 4 | 3.4% |
| 15 to 19 Minutes | 5 | 4.3% |
| 20 to 24 Minutes | 27 | 23.1% |
| 25 to 29 Minutes | 11 | 9.4% |
| 30 to 34 Minutes | 27 | 23.1% |
| 35 to 39 Minutes | 4 | 3.4% |
| 40 to 44 Minutes | 5 | 4.3% |
| 45 to 59 Minutes | 11 | 9.4% |
| 60 to 89 Minutes | 12 | 10.3% |
| 90 or more Minutes | 7 | 6.0% |
Commute Time by Sex in Taylor Landing
The most common commute times in Taylor Landing are 30 to 34 minutes (17 commuters, 25.0%) for males and 20 to 24 minutes (19 commuters, 38.8%) for females.
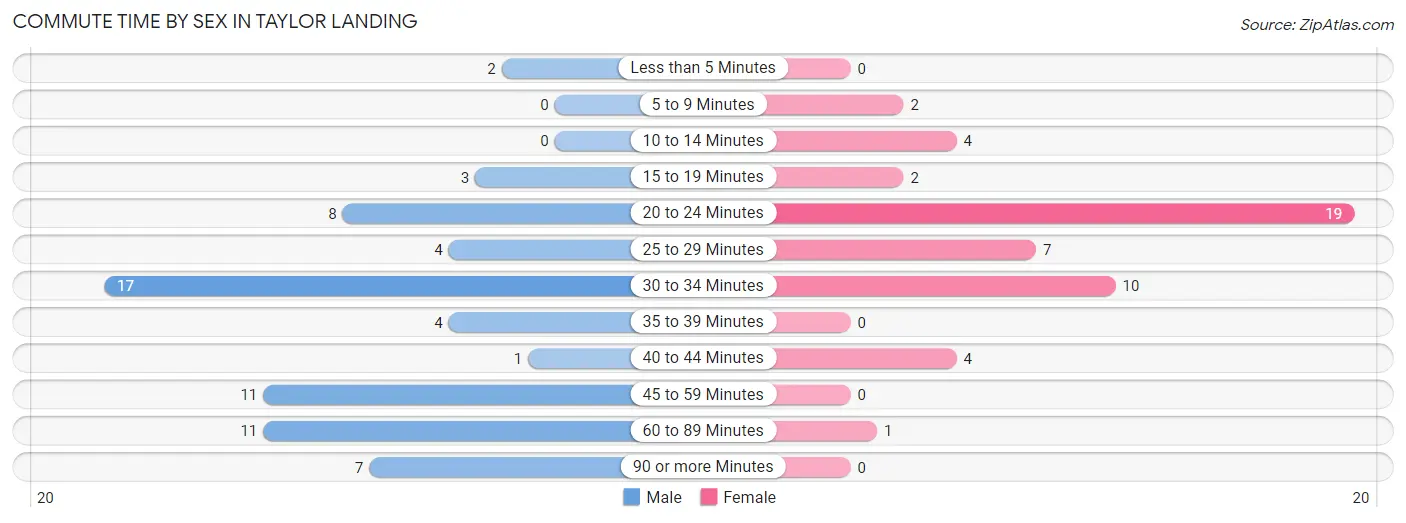
| Commute Time | Male | Female |
| Less than 5 Minutes | 2 (2.9%) | 0 (0.0%) |
| 5 to 9 Minutes | 0 (0.0%) | 2 (4.1%) |
| 10 to 14 Minutes | 0 (0.0%) | 4 (8.2%) |
| 15 to 19 Minutes | 3 (4.4%) | 2 (4.1%) |
| 20 to 24 Minutes | 8 (11.8%) | 19 (38.8%) |
| 25 to 29 Minutes | 4 (5.9%) | 7 (14.3%) |
| 30 to 34 Minutes | 17 (25.0%) | 10 (20.4%) |
| 35 to 39 Minutes | 4 (5.9%) | 0 (0.0%) |
| 40 to 44 Minutes | 1 (1.5%) | 4 (8.2%) |
| 45 to 59 Minutes | 11 (16.2%) | 0 (0.0%) |
| 60 to 89 Minutes | 11 (16.2%) | 1 (2.0%) |
| 90 or more Minutes | 7 (10.3%) | 0 (0.0%) |
Time of Departure to Work by Sex in Taylor Landing
The most frequent times of departure to work in Taylor Landing are 12:00 AM to 4:59 AM (23, 33.8%) for males and 7:00 AM to 7:29 AM (17, 34.7%) for females.
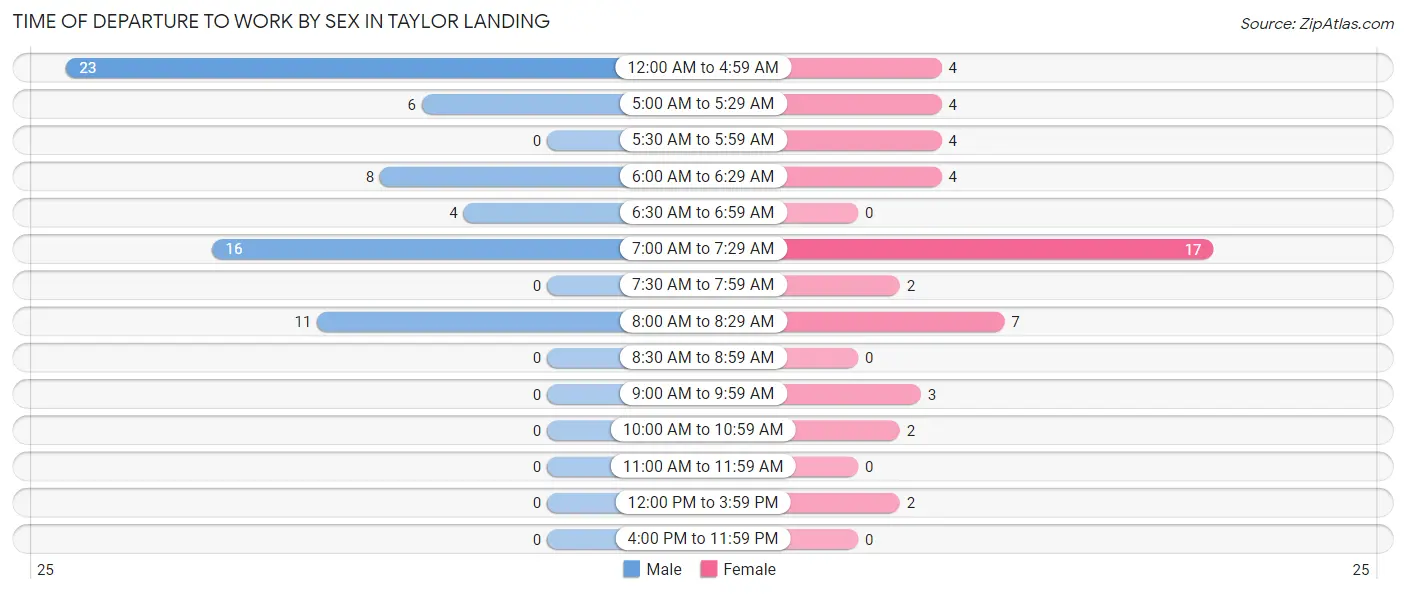
| Time of Departure | Male | Female |
| 12:00 AM to 4:59 AM | 23 (33.8%) | 4 (8.2%) |
| 5:00 AM to 5:29 AM | 6 (8.8%) | 4 (8.2%) |
| 5:30 AM to 5:59 AM | 0 (0.0%) | 4 (8.2%) |
| 6:00 AM to 6:29 AM | 8 (11.8%) | 4 (8.2%) |
| 6:30 AM to 6:59 AM | 4 (5.9%) | 0 (0.0%) |
| 7:00 AM to 7:29 AM | 16 (23.5%) | 17 (34.7%) |
| 7:30 AM to 7:59 AM | 0 (0.0%) | 2 (4.1%) |
| 8:00 AM to 8:29 AM | 11 (16.2%) | 7 (14.3%) |
| 8:30 AM to 8:59 AM | 0 (0.0%) | 0 (0.0%) |
| 9:00 AM to 9:59 AM | 0 (0.0%) | 3 (6.1%) |
| 10:00 AM to 10:59 AM | 0 (0.0%) | 2 (4.1%) |
| 11:00 AM to 11:59 AM | 0 (0.0%) | 0 (0.0%) |
| 12:00 PM to 3:59 PM | 0 (0.0%) | 2 (4.1%) |
| 4:00 PM to 11:59 PM | 0 (0.0%) | 0 (0.0%) |
| Total | 68 (100.0%) | 49 (100.0%) |
Housing Occupancy in Taylor Landing
Occupancy by Ownership in Taylor Landing
Of the total 98 dwellings in Taylor Landing, owner-occupied units account for 95 (96.9%), while renter-occupied units make up 3 (3.1%).
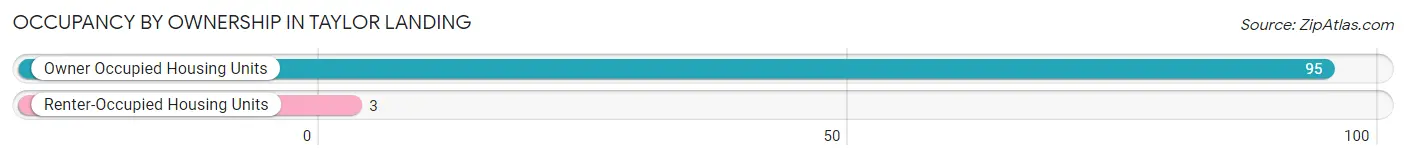
| Occupancy | # Housing Units | % Housing Units |
| Owner Occupied Housing Units | 95 | 96.9% |
| Renter-Occupied Housing Units | 3 | 3.1% |
| Total Occupied Housing Units | 98 | 100.0% |
Occupancy by Household Size in Taylor Landing
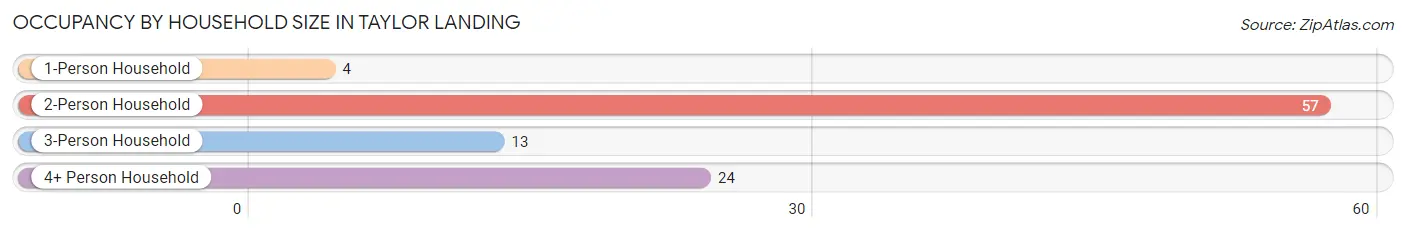
| Household Size | # Housing Units | % Housing Units |
| 1-Person Household | 4 | 4.1% |
| 2-Person Household | 57 | 58.2% |
| 3-Person Household | 13 | 13.3% |
| 4+ Person Household | 24 | 24.5% |
| Total Housing Units | 98 | 100.0% |
Occupancy by Ownership by Household Size in Taylor Landing
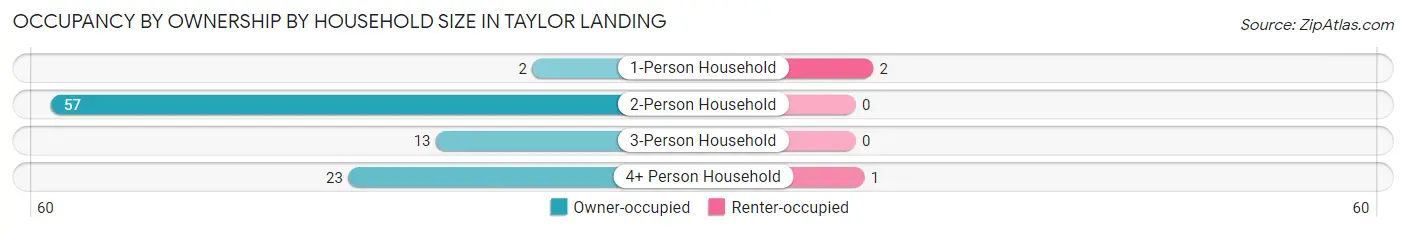
| Household Size | Owner-occupied | Renter-occupied |
| 1-Person Household | 2 (50.0%) | 2 (50.0%) |
| 2-Person Household | 57 (100.0%) | 0 (0.0%) |
| 3-Person Household | 13 (100.0%) | 0 (0.0%) |
| 4+ Person Household | 23 (95.8%) | 1 (4.2%) |
| Total Housing Units | 95 (96.9%) | 3 (3.1%) |
Occupancy by Educational Attainment in Taylor Landing
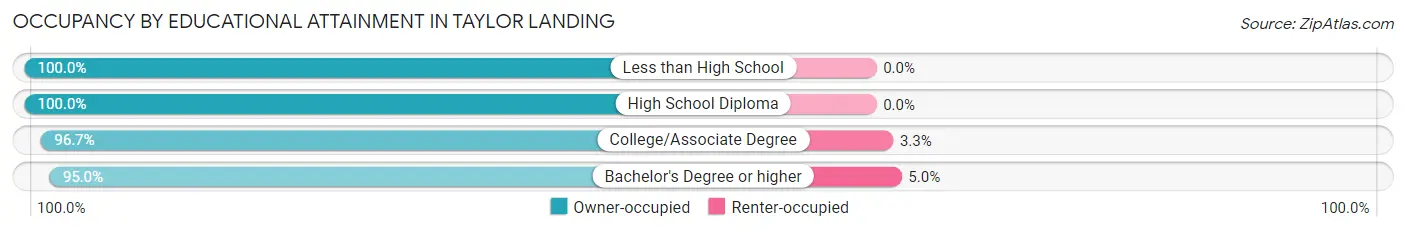
| Household Size | Owner-occupied | Renter-occupied |
| Less than High School | 7 (100.0%) | 0 (0.0%) |
| High School Diploma | 21 (100.0%) | 0 (0.0%) |
| College/Associate Degree | 29 (96.7%) | 1 (3.3%) |
| Bachelor's Degree or higher | 38 (95.0%) | 2 (5.0%) |
Occupancy by Age of Householder in Taylor Landing
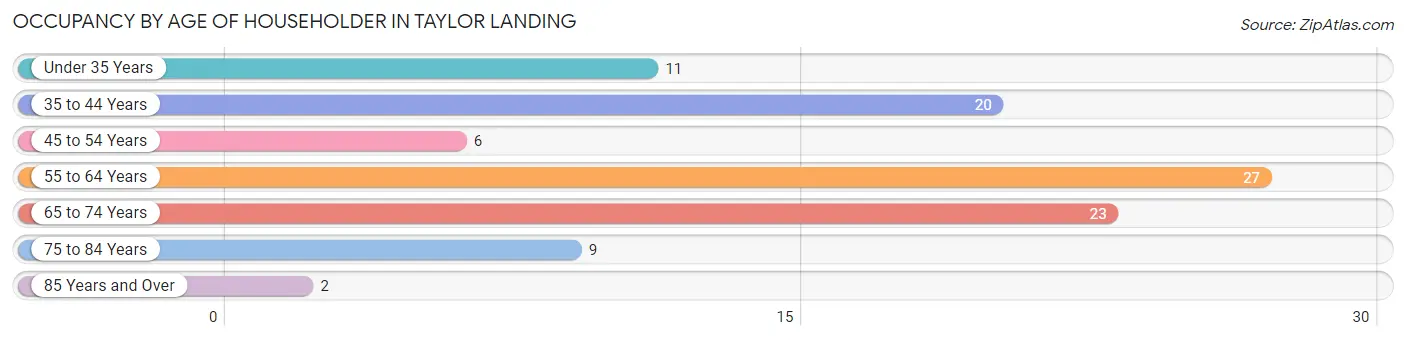
| Age Bracket | # Households | % Households |
| Under 35 Years | 11 | 11.2% |
| 35 to 44 Years | 20 | 20.4% |
| 45 to 54 Years | 6 | 6.1% |
| 55 to 64 Years | 27 | 27.6% |
| 65 to 74 Years | 23 | 23.5% |
| 75 to 84 Years | 9 | 9.2% |
| 85 Years and Over | 2 | 2.0% |
| Total | 98 | 100.0% |
Housing Finances in Taylor Landing
Median Income by Occupancy in Taylor Landing
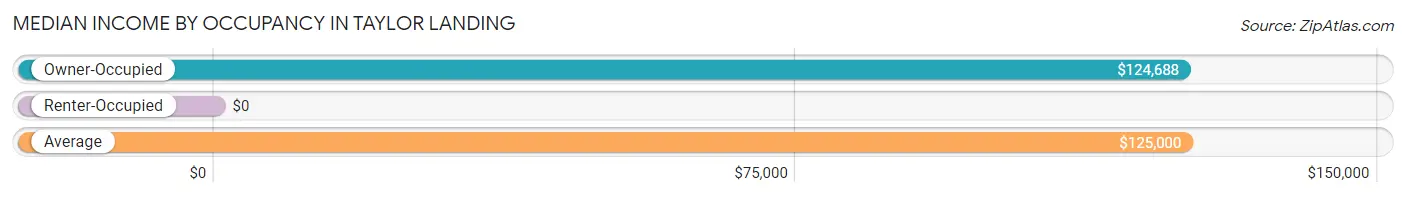
| Occupancy Type | # Households | Median Income |
| Owner-Occupied | 95 (96.9%) | $124,688 |
| Renter-Occupied | 3 (3.1%) | $0 |
| Average | 98 (100.0%) | $125,000 |
Occupancy by Householder Income Bracket in Taylor Landing
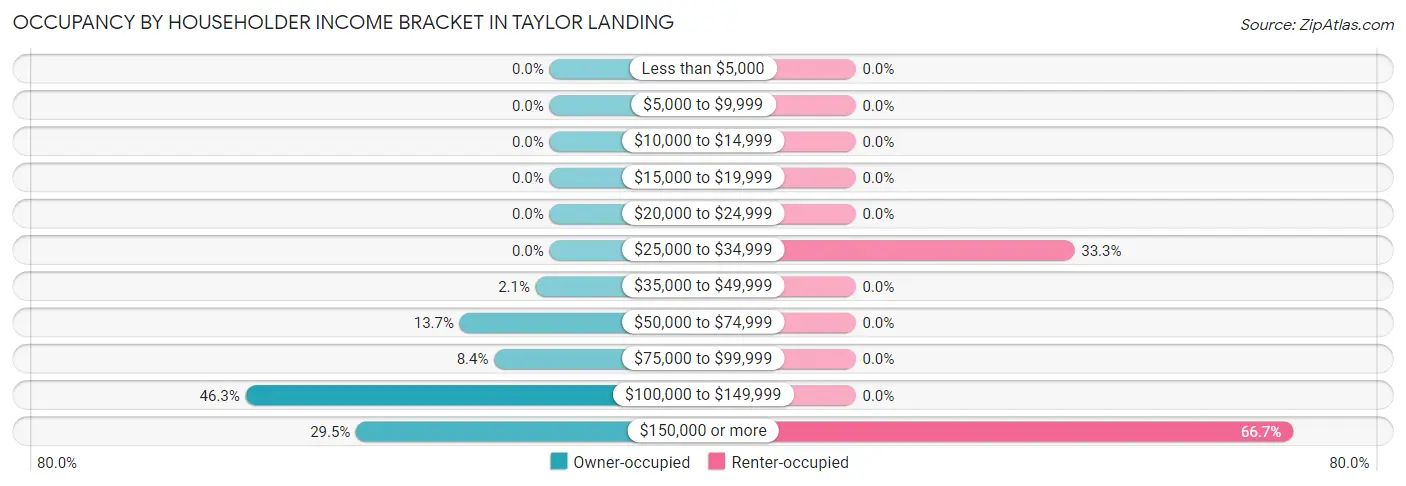
| Income Bracket | Owner-occupied | Renter-occupied |
| Less than $5,000 | 0 (0.0%) | 0 (0.0%) |
| $5,000 to $9,999 | 0 (0.0%) | 0 (0.0%) |
| $10,000 to $14,999 | 0 (0.0%) | 0 (0.0%) |
| $15,000 to $19,999 | 0 (0.0%) | 0 (0.0%) |
| $20,000 to $24,999 | 0 (0.0%) | 0 (0.0%) |
| $25,000 to $34,999 | 0 (0.0%) | 1 (33.3%) |
| $35,000 to $49,999 | 2 (2.1%) | 0 (0.0%) |
| $50,000 to $74,999 | 13 (13.7%) | 0 (0.0%) |
| $75,000 to $99,999 | 8 (8.4%) | 0 (0.0%) |
| $100,000 to $149,999 | 44 (46.3%) | 0 (0.0%) |
| $150,000 or more | 28 (29.5%) | 2 (66.7%) |
| Total | 95 (100.0%) | 3 (100.0%) |
Monthly Housing Cost Tiers in Taylor Landing
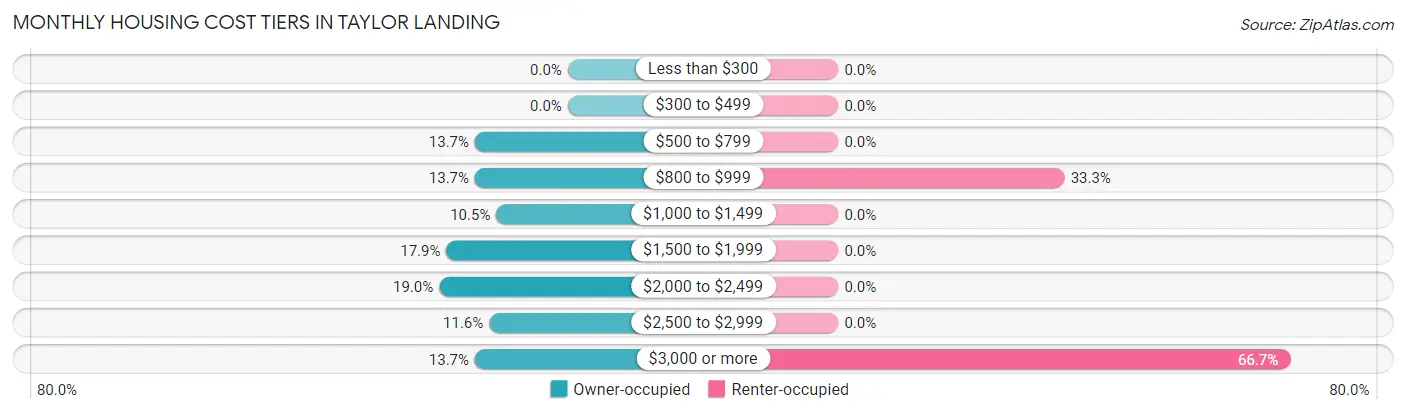
| Monthly Cost | Owner-occupied | Renter-occupied |
| Less than $300 | 0 (0.0%) | 0 (0.0%) |
| $300 to $499 | 0 (0.0%) | 0 (0.0%) |
| $500 to $799 | 13 (13.7%) | 0 (0.0%) |
| $800 to $999 | 13 (13.7%) | 1 (33.3%) |
| $1,000 to $1,499 | 10 (10.5%) | 0 (0.0%) |
| $1,500 to $1,999 | 17 (17.9%) | 0 (0.0%) |
| $2,000 to $2,499 | 18 (19.0%) | 0 (0.0%) |
| $2,500 to $2,999 | 11 (11.6%) | 0 (0.0%) |
| $3,000 or more | 13 (13.7%) | 2 (66.7%) |
| Total | 95 (100.0%) | 3 (100.0%) |
Physical Housing Characteristics in Taylor Landing
Housing Structures in Taylor Landing
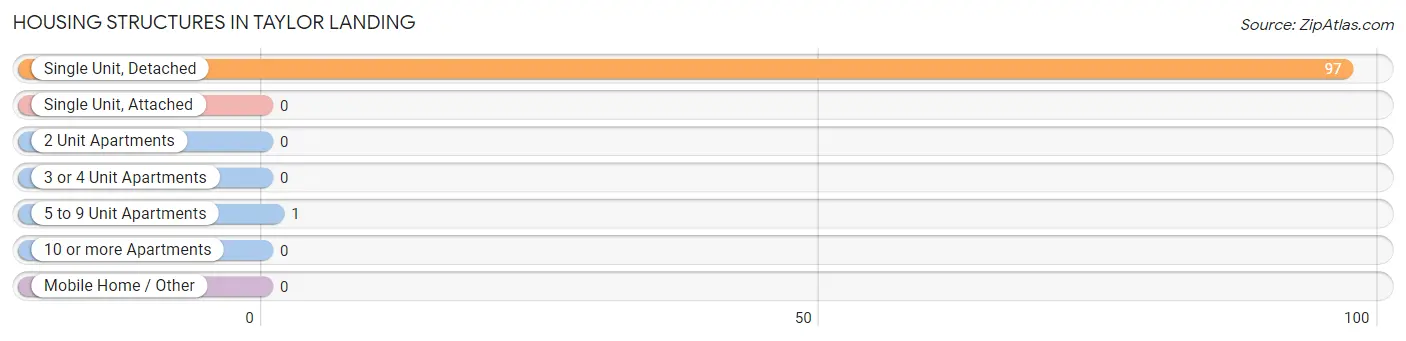
| Structure Type | # Housing Units | % Housing Units |
| Single Unit, Detached | 97 | 99.0% |
| Single Unit, Attached | 0 | 0.0% |
| 2 Unit Apartments | 0 | 0.0% |
| 3 or 4 Unit Apartments | 0 | 0.0% |
| 5 to 9 Unit Apartments | 1 | 1.0% |
| 10 or more Apartments | 0 | 0.0% |
| Mobile Home / Other | 0 | 0.0% |
| Total | 98 | 100.0% |
Housing Structures by Occupancy in Taylor Landing
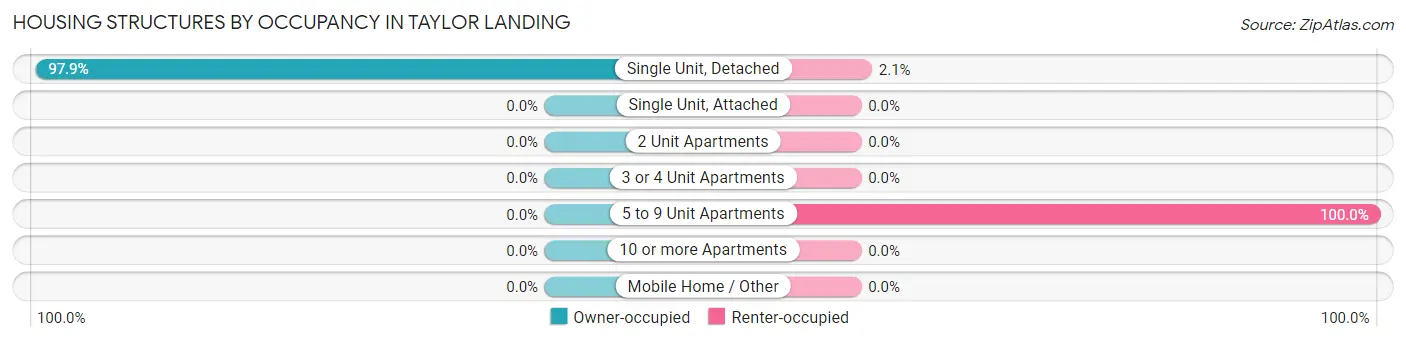
| Structure Type | Owner-occupied | Renter-occupied |
| Single Unit, Detached | 95 (97.9%) | 2 (2.1%) |
| Single Unit, Attached | 0 (0.0%) | 0 (0.0%) |
| 2 Unit Apartments | 0 (0.0%) | 0 (0.0%) |
| 3 or 4 Unit Apartments | 0 (0.0%) | 0 (0.0%) |
| 5 to 9 Unit Apartments | 0 (0.0%) | 1 (100.0%) |
| 10 or more Apartments | 0 (0.0%) | 0 (0.0%) |
| Mobile Home / Other | 0 (0.0%) | 0 (0.0%) |
| Total | 95 (96.9%) | 3 (3.1%) |
Housing Structures by Number of Rooms in Taylor Landing
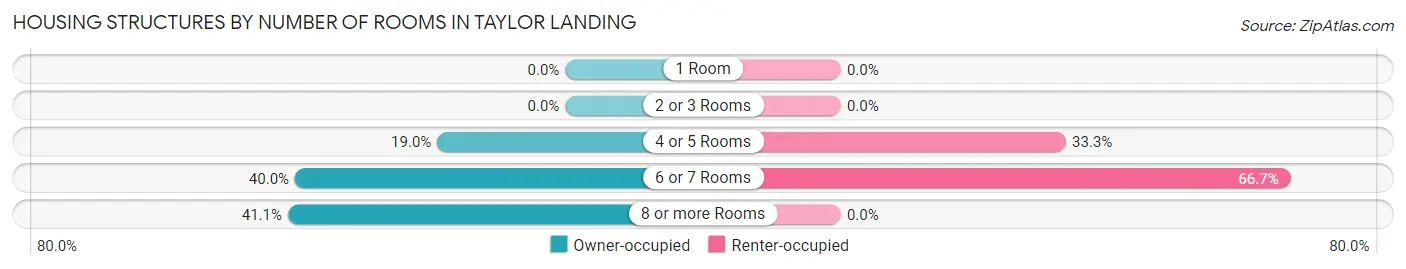
| Number of Rooms | Owner-occupied | Renter-occupied |
| 1 Room | 0 (0.0%) | 0 (0.0%) |
| 2 or 3 Rooms | 0 (0.0%) | 0 (0.0%) |
| 4 or 5 Rooms | 18 (19.0%) | 1 (33.3%) |
| 6 or 7 Rooms | 38 (40.0%) | 2 (66.7%) |
| 8 or more Rooms | 39 (41.0%) | 0 (0.0%) |
| Total | 95 (100.0%) | 3 (100.0%) |
Housing Structure by Heating Type in Taylor Landing
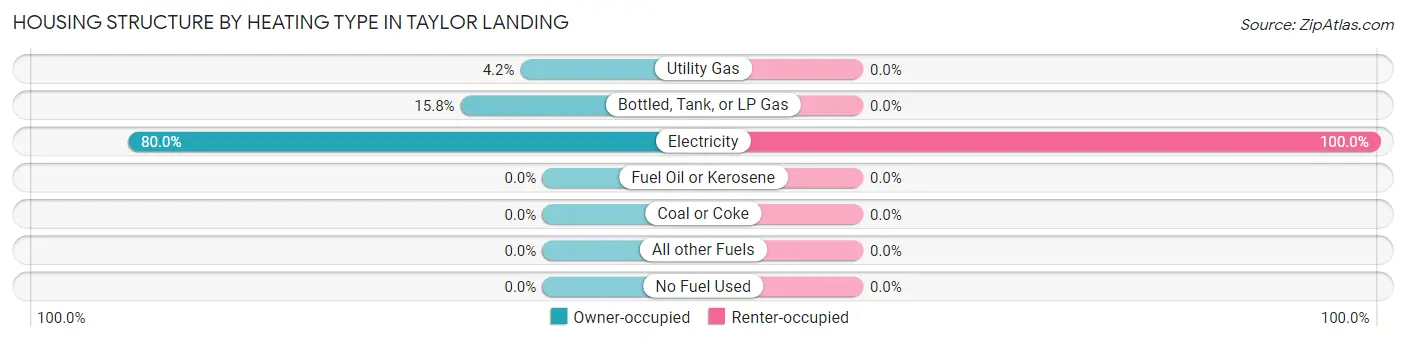
| Heating Type | Owner-occupied | Renter-occupied |
| Utility Gas | 4 (4.2%) | 0 (0.0%) |
| Bottled, Tank, or LP Gas | 15 (15.8%) | 0 (0.0%) |
| Electricity | 76 (80.0%) | 3 (100.0%) |
| Fuel Oil or Kerosene | 0 (0.0%) | 0 (0.0%) |
| Coal or Coke | 0 (0.0%) | 0 (0.0%) |
| All other Fuels | 0 (0.0%) | 0 (0.0%) |
| No Fuel Used | 0 (0.0%) | 0 (0.0%) |
| Total | 95 (100.0%) | 3 (100.0%) |
Household Vehicle Usage in Taylor Landing
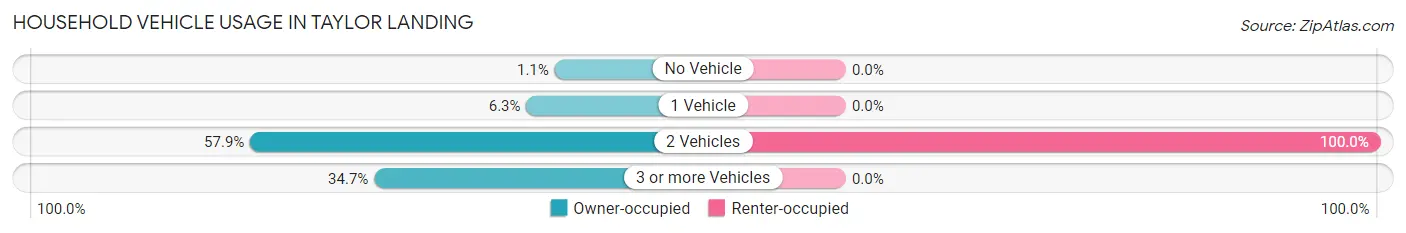
| Vehicles per Household | Owner-occupied | Renter-occupied |
| No Vehicle | 1 (1.1%) | 0 (0.0%) |
| 1 Vehicle | 6 (6.3%) | 0 (0.0%) |
| 2 Vehicles | 55 (57.9%) | 3 (100.0%) |
| 3 or more Vehicles | 33 (34.7%) | 0 (0.0%) |
| Total | 95 (100.0%) | 3 (100.0%) |
Real Estate & Mortgages in Taylor Landing
Real Estate and Mortgage Overview in Taylor Landing
| Characteristic | Without Mortgage | With Mortgage |
| Housing Units | 37 | 58 |
| Median Property Value | $262,500 | $283,300 |
| Median Household Income | $115,972 | $19 |
| Monthly Housing Costs | $855 | $13 |
| Real Estate Taxes | $2,795 | $2 |
Property Value by Mortgage Status in Taylor Landing
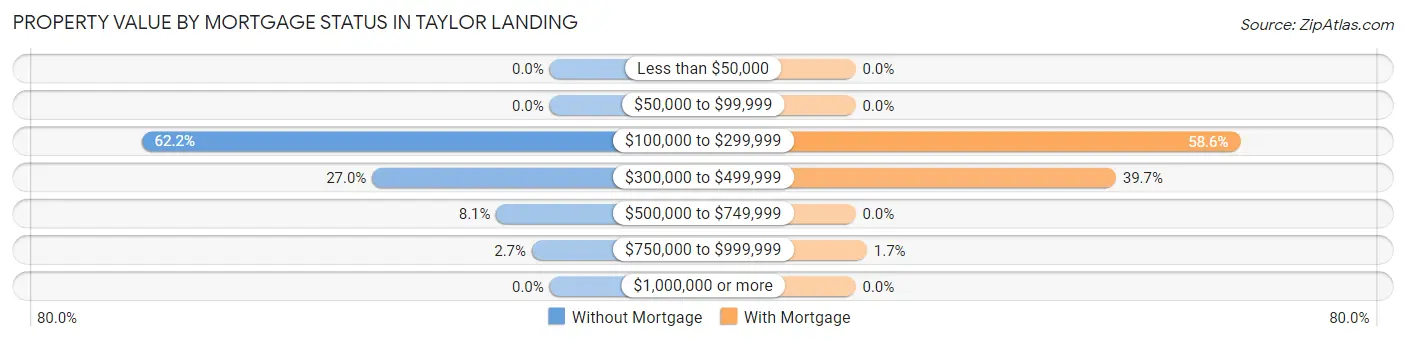
| Property Value | Without Mortgage | With Mortgage |
| Less than $50,000 | 0 (0.0%) | 0 (0.0%) |
| $50,000 to $99,999 | 0 (0.0%) | 0 (0.0%) |
| $100,000 to $299,999 | 23 (62.2%) | 34 (58.6%) |
| $300,000 to $499,999 | 10 (27.0%) | 23 (39.7%) |
| $500,000 to $749,999 | 3 (8.1%) | 0 (0.0%) |
| $750,000 to $999,999 | 1 (2.7%) | 1 (1.7%) |
| $1,000,000 or more | 0 (0.0%) | 0 (0.0%) |
| Total | 37 (100.0%) | 58 (100.0%) |
Household Income by Mortgage Status in Taylor Landing
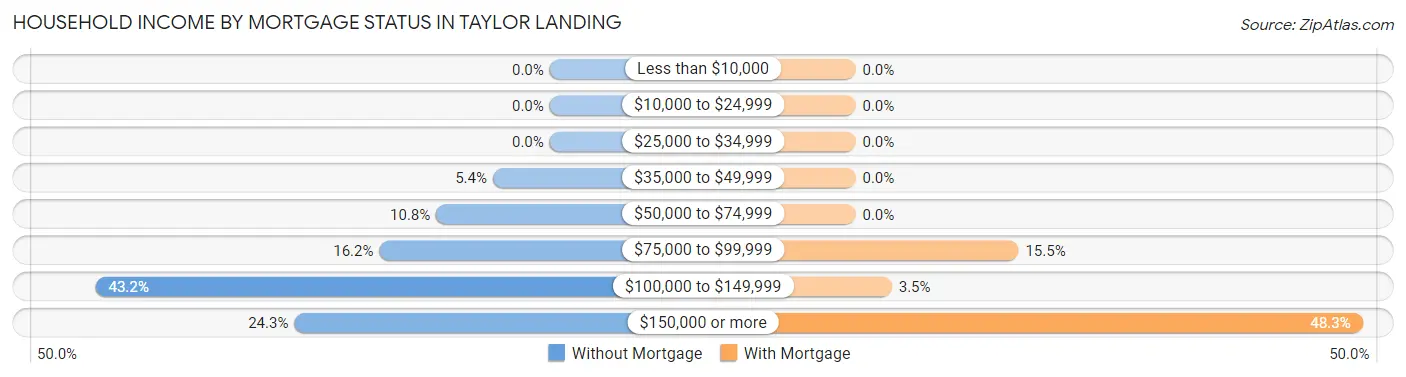
| Household Income | Without Mortgage | With Mortgage |
| Less than $10,000 | 0 (0.0%) | 0 (0.0%) |
| $10,000 to $24,999 | 0 (0.0%) | 0 (0.0%) |
| $25,000 to $34,999 | 0 (0.0%) | 0 (0.0%) |
| $35,000 to $49,999 | 2 (5.4%) | 0 (0.0%) |
| $50,000 to $74,999 | 4 (10.8%) | 0 (0.0%) |
| $75,000 to $99,999 | 6 (16.2%) | 9 (15.5%) |
| $100,000 to $149,999 | 16 (43.2%) | 2 (3.5%) |
| $150,000 or more | 9 (24.3%) | 28 (48.3%) |
| Total | 37 (100.0%) | 58 (100.0%) |
Property Value to Household Income Ratio in Taylor Landing
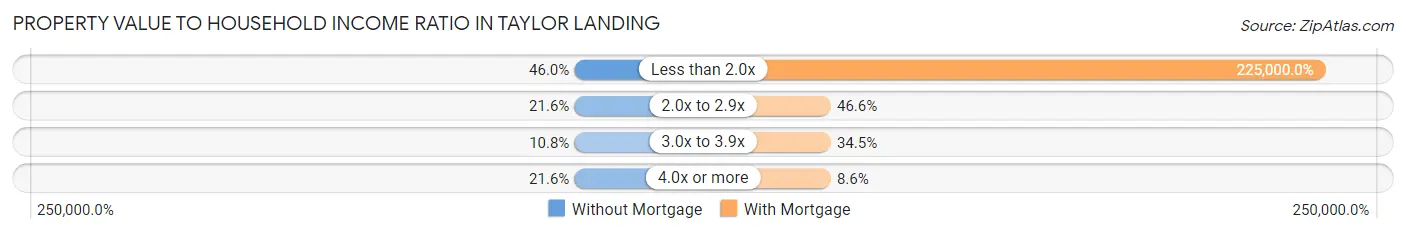
| Value-to-Income Ratio | Without Mortgage | With Mortgage |
| Less than 2.0x | 17 (46.0%) | 130,500 (225,000.0%) |
| 2.0x to 2.9x | 8 (21.6%) | 27 (46.6%) |
| 3.0x to 3.9x | 4 (10.8%) | 20 (34.5%) |
| 4.0x or more | 8 (21.6%) | 5 (8.6%) |
| Total | 37 (100.0%) | 58 (100.0%) |
Real Estate Taxes by Mortgage Status in Taylor Landing
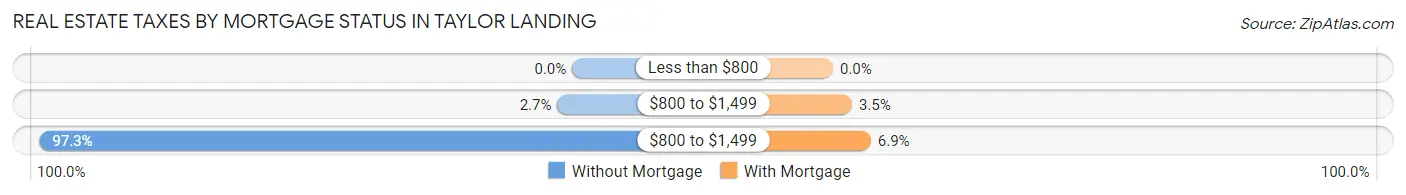
| Property Taxes | Without Mortgage | With Mortgage |
| Less than $800 | 0 (0.0%) | 0 (0.0%) |
| $800 to $1,499 | 1 (2.7%) | 2 (3.5%) |
| $800 to $1,499 | 36 (97.3%) | 4 (6.9%) |
| Total | 37 (100.0%) | 58 (100.0%) |
Health & Disability in Taylor Landing
Health Insurance Coverage by Age in Taylor Landing
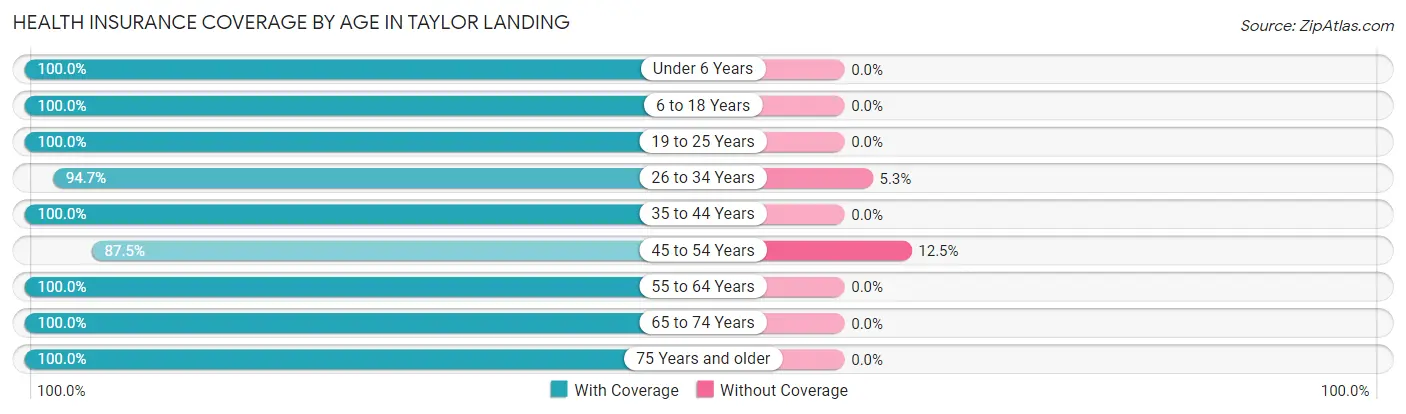
| Age Bracket | With Coverage | Without Coverage |
| Under 6 Years | 19 (100.0%) | 0 (0.0%) |
| 6 to 18 Years | 53 (100.0%) | 0 (0.0%) |
| 19 to 25 Years | 3 (100.0%) | 0 (0.0%) |
| 26 to 34 Years | 18 (94.7%) | 1 (5.3%) |
| 35 to 44 Years | 43 (100.0%) | 0 (0.0%) |
| 45 to 54 Years | 21 (87.5%) | 3 (12.5%) |
| 55 to 64 Years | 47 (100.0%) | 0 (0.0%) |
| 65 to 74 Years | 49 (100.0%) | 0 (0.0%) |
| 75 Years and older | 22 (100.0%) | 0 (0.0%) |
| Total | 275 (98.6%) | 4 (1.4%) |
Health Insurance Coverage by Citizenship Status in Taylor Landing
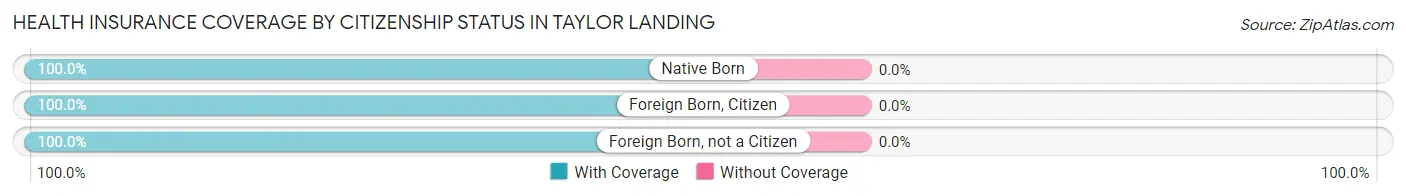
| Citizenship Status | With Coverage | Without Coverage |
| Native Born | 19 (100.0%) | 0 (0.0%) |
| Foreign Born, Citizen | 53 (100.0%) | 0 (0.0%) |
| Foreign Born, not a Citizen | 3 (100.0%) | 0 (0.0%) |
Health Insurance Coverage by Household Income in Taylor Landing
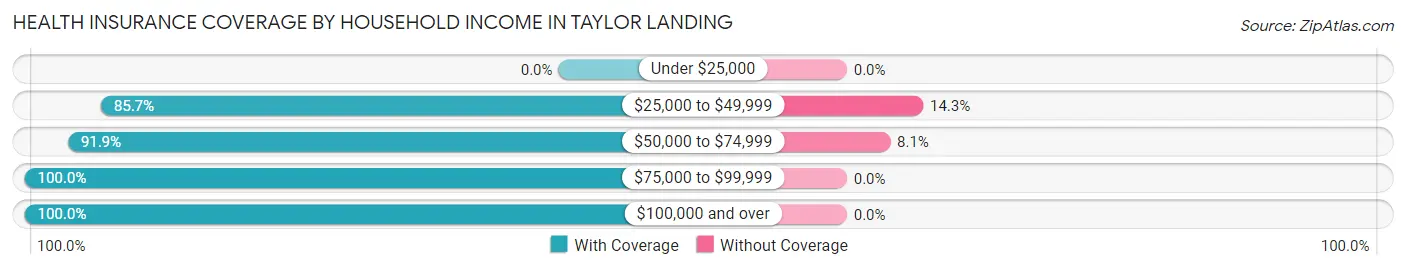
| Household Income | With Coverage | Without Coverage |
| Under $25,000 | 0 (0.0%) | 0 (0.0%) |
| $25,000 to $49,999 | 6 (85.7%) | 1 (14.3%) |
| $50,000 to $74,999 | 34 (91.9%) | 3 (8.1%) |
| $75,000 to $99,999 | 20 (100.0%) | 0 (0.0%) |
| $100,000 and over | 215 (100.0%) | 0 (0.0%) |
Public vs Private Health Insurance Coverage by Age in Taylor Landing
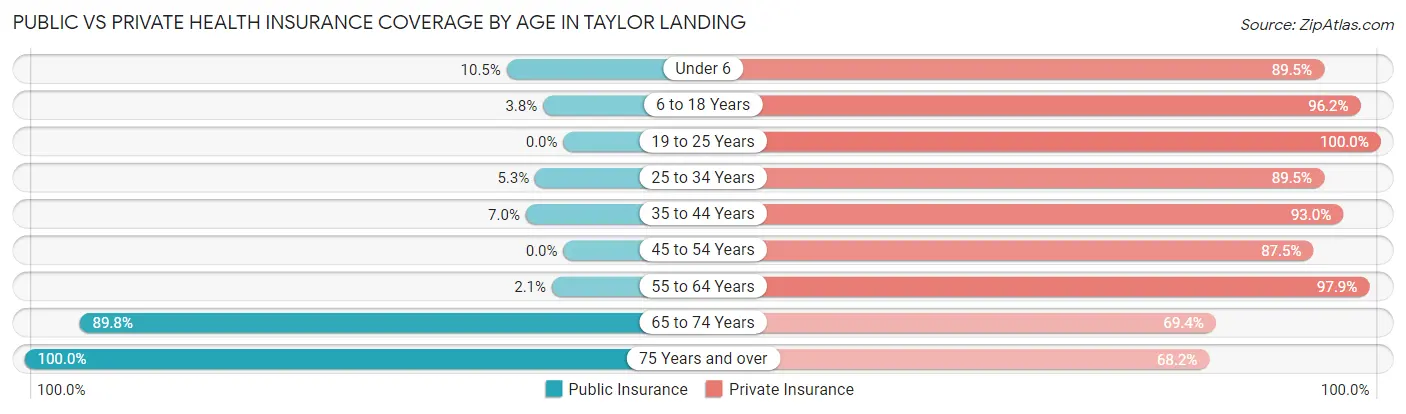
| Age Bracket | Public Insurance | Private Insurance |
| Under 6 | 2 (10.5%) | 17 (89.5%) |
| 6 to 18 Years | 2 (3.8%) | 51 (96.2%) |
| 19 to 25 Years | 0 (0.0%) | 3 (100.0%) |
| 25 to 34 Years | 1 (5.3%) | 17 (89.5%) |
| 35 to 44 Years | 3 (7.0%) | 40 (93.0%) |
| 45 to 54 Years | 0 (0.0%) | 21 (87.5%) |
| 55 to 64 Years | 1 (2.1%) | 46 (97.9%) |
| 65 to 74 Years | 44 (89.8%) | 34 (69.4%) |
| 75 Years and over | 22 (100.0%) | 15 (68.2%) |
| Total | 75 (26.9%) | 244 (87.5%) |
Disability Status by Sex by Age in Taylor Landing
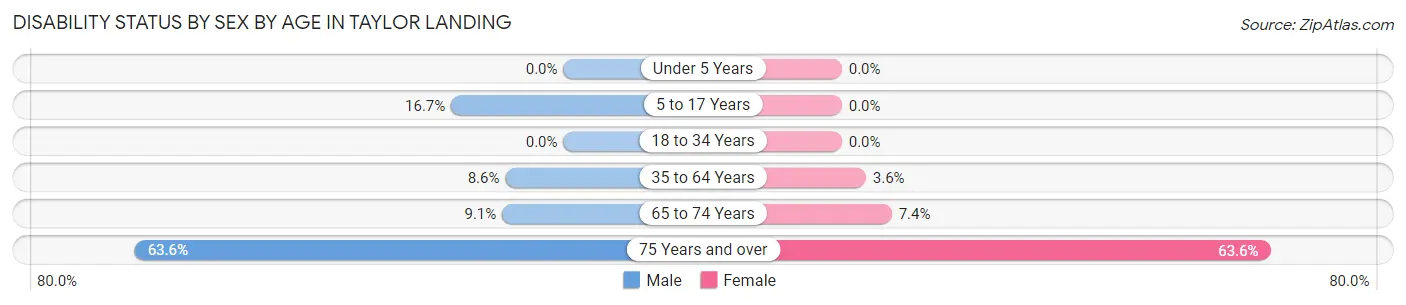
| Age Bracket | Male | Female |
| Under 5 Years | 0 (0.0%) | 0 (0.0%) |
| 5 to 17 Years | 3 (16.7%) | 0 (0.0%) |
| 18 to 34 Years | 0 (0.0%) | 0 (0.0%) |
| 35 to 64 Years | 5 (8.6%) | 2 (3.6%) |
| 65 to 74 Years | 2 (9.1%) | 2 (7.4%) |
| 75 Years and over | 7 (63.6%) | 7 (63.6%) |
Disability Class by Sex by Age in Taylor Landing
Disability Class: Hearing Difficulty
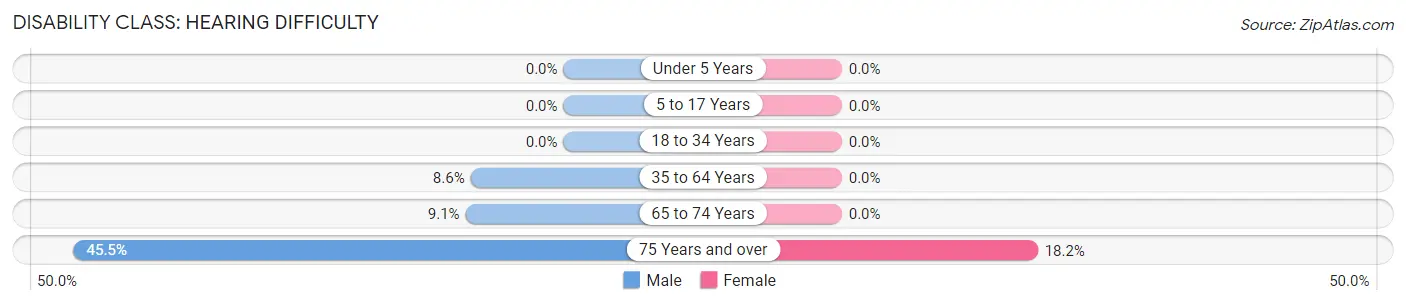
| Age Bracket | Male | Female |
| Under 5 Years | 0 (0.0%) | 0 (0.0%) |
| 5 to 17 Years | 0 (0.0%) | 0 (0.0%) |
| 18 to 34 Years | 0 (0.0%) | 0 (0.0%) |
| 35 to 64 Years | 5 (8.6%) | 0 (0.0%) |
| 65 to 74 Years | 2 (9.1%) | 0 (0.0%) |
| 75 Years and over | 5 (45.5%) | 2 (18.2%) |
Disability Class: Vision Difficulty
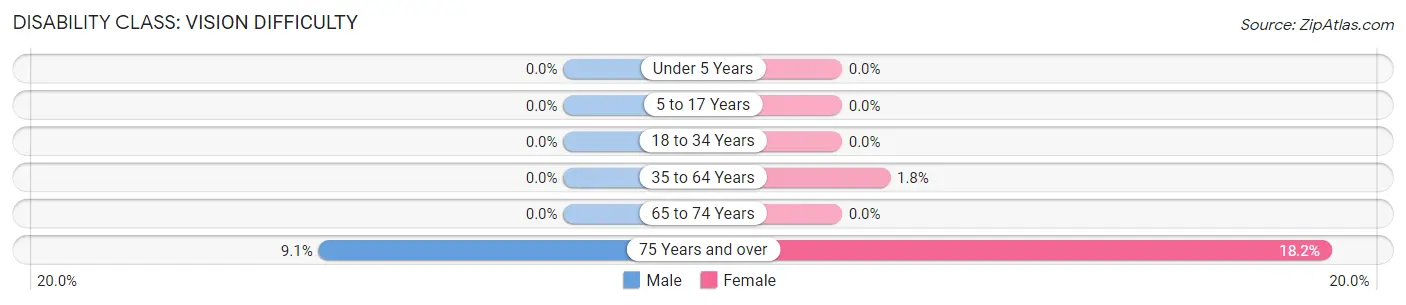
| Age Bracket | Male | Female |
| Under 5 Years | 0 (0.0%) | 0 (0.0%) |
| 5 to 17 Years | 0 (0.0%) | 0 (0.0%) |
| 18 to 34 Years | 0 (0.0%) | 0 (0.0%) |
| 35 to 64 Years | 0 (0.0%) | 1 (1.8%) |
| 65 to 74 Years | 0 (0.0%) | 0 (0.0%) |
| 75 Years and over | 1 (9.1%) | 2 (18.2%) |
Disability Class: Cognitive Difficulty
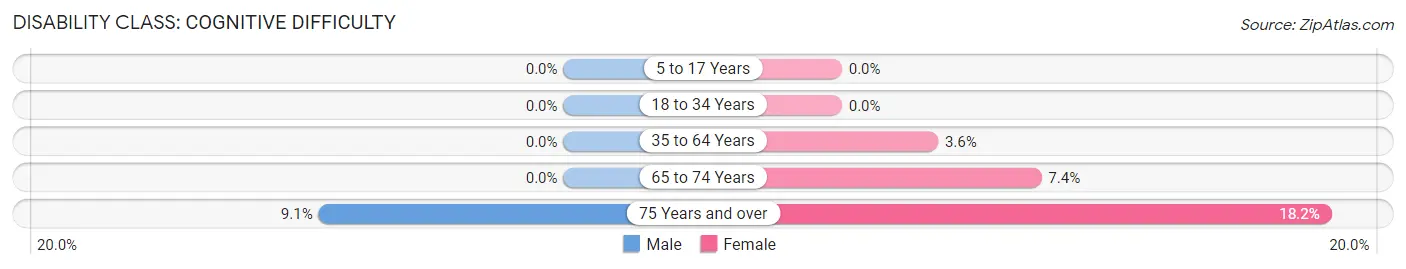
| Age Bracket | Male | Female |
| 5 to 17 Years | 0 (0.0%) | 0 (0.0%) |
| 18 to 34 Years | 0 (0.0%) | 0 (0.0%) |
| 35 to 64 Years | 0 (0.0%) | 2 (3.6%) |
| 65 to 74 Years | 0 (0.0%) | 2 (7.4%) |
| 75 Years and over | 1 (9.1%) | 2 (18.2%) |
Disability Class: Ambulatory Difficulty
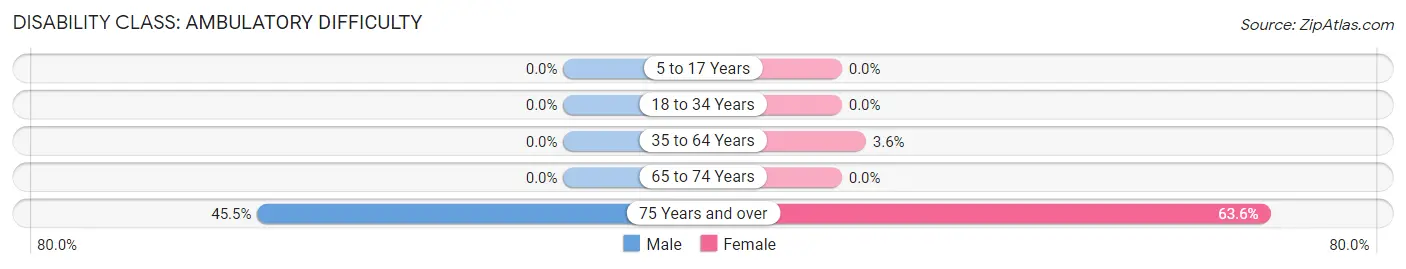
| Age Bracket | Male | Female |
| 5 to 17 Years | 0 (0.0%) | 0 (0.0%) |
| 18 to 34 Years | 0 (0.0%) | 0 (0.0%) |
| 35 to 64 Years | 0 (0.0%) | 2 (3.6%) |
| 65 to 74 Years | 0 (0.0%) | 0 (0.0%) |
| 75 Years and over | 5 (45.5%) | 7 (63.6%) |
Disability Class: Self-Care Difficulty
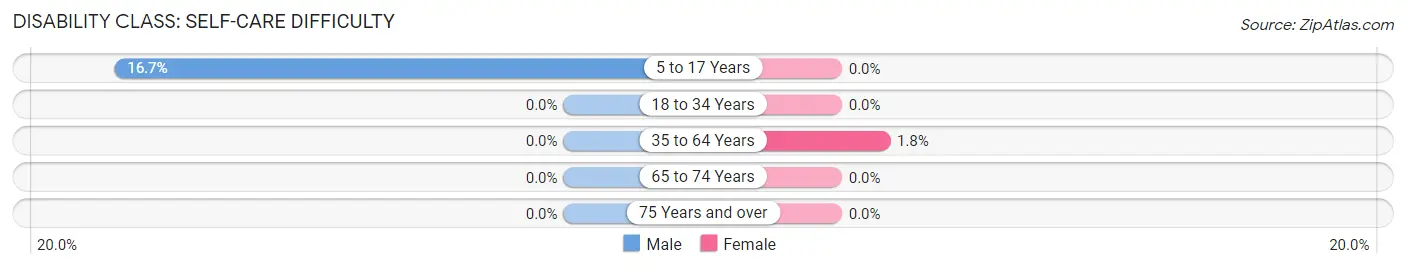
| Age Bracket | Male | Female |
| 5 to 17 Years | 3 (16.7%) | 0 (0.0%) |
| 18 to 34 Years | 0 (0.0%) | 0 (0.0%) |
| 35 to 64 Years | 0 (0.0%) | 1 (1.8%) |
| 65 to 74 Years | 0 (0.0%) | 0 (0.0%) |
| 75 Years and over | 0 (0.0%) | 0 (0.0%) |
Technology Access in Taylor Landing
Computing Device Access in Taylor Landing
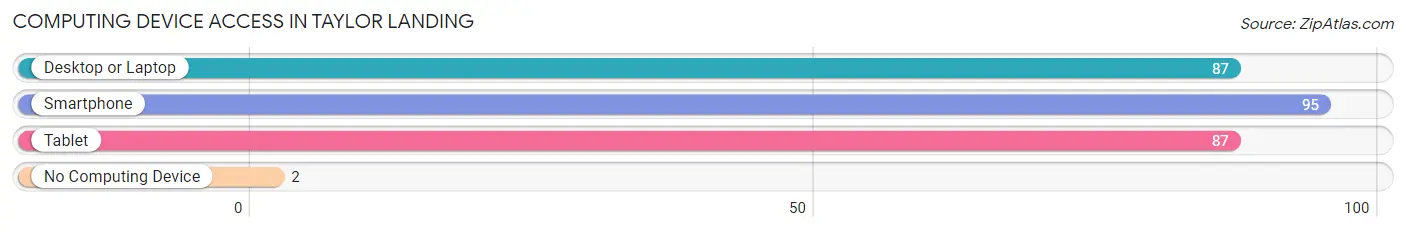
| Device Type | # Households | % Households |
| Desktop or Laptop | 87 | 88.8% |
| Smartphone | 95 | 96.9% |
| Tablet | 87 | 88.8% |
| No Computing Device | 2 | 2.0% |
| Total | 98 | 100.0% |
Internet Access in Taylor Landing
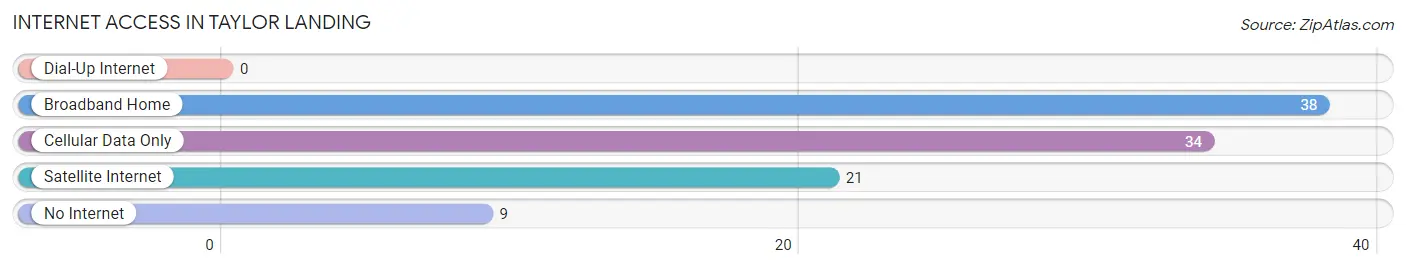
| Internet Type | # Households | % Households |
| Dial-Up Internet | 0 | 0.0% |
| Broadband Home | 38 | 38.8% |
| Cellular Data Only | 34 | 34.7% |
| Satellite Internet | 21 | 21.4% |
| No Internet | 9 | 9.2% |
| Total | 98 | 100.0% |
Taylor Landing Summary
History
Taylor Landing, Texas is a small unincorporated community located in the southeastern part of the state, in the county of Brazoria. The area was first settled in the early 1800s by a group of settlers from the nearby town of Brazoria. The settlers were attracted to the area due to its proximity to the Gulf of Mexico and the abundance of natural resources. The area was originally known as Taylor’s Landing, named after the first settler, William Taylor.
In 1836, the Republic of Texas was established and Taylor Landing was officially recognized as a town. The town was a popular stop for travelers and traders, as it was located on the main road between Houston and Galveston. The town was also a popular destination for fishermen, as the area was known for its abundance of fish.
In the late 1800s, the town began to grow and develop. The first school was built in 1876 and the first post office was established in 1877. The town also had a general store, a blacksmith shop, and a cotton gin.
In the early 1900s, the town began to decline due to the decline of the cotton industry. The town was also affected by the Great Depression and World War II. After the war, the town began to slowly recover and by the 1950s, the population had grown to around 500 people.
Geography
Taylor Landing is located in the southeastern part of Texas, in the county of Brazoria. The town is situated on the Gulf Coast, about 30 miles south of Houston. The town is surrounded by wetlands and marshlands, which provide a unique habitat for a variety of wildlife. The area is also known for its abundance of fish, which makes it a popular destination for fishermen.
The town is located on the Gulf Intracoastal Waterway, which is a major shipping route for the region. The town is also located near the San Bernard National Wildlife Refuge, which is a popular destination for birdwatchers and nature lovers.
Economy
The economy of Taylor Landing is largely based on fishing and tourism. The town is a popular destination for fishermen, as the area is known for its abundance of fish. The town also has a few small businesses, such as a general store, a bait shop, and a few restaurants.
The town is also home to a few small manufacturing companies, which produce a variety of products, such as furniture, clothing, and electronics. The town is also home to a few small farms, which produce a variety of crops, such as corn, soybeans, and cotton.
Demographics
As of the 2010 census, the population of Taylor Landing was 545 people. The town is predominantly white, with a small Hispanic population. The median household income is $45,000 and the median home value is $125,000. The town has a low unemployment rate and a high rate of homeownership.
Conclusion
Taylor Landing, Texas is a small unincorporated community located in the southeastern part of the state, in the county of Brazoria. The area was first settled in the early 1800s and has since grown to become a popular destination for fishermen and nature lovers. The town has a largely white population and a median household income of $45,000. The town is also home to a few small businesses and manufacturing companies, which produce a variety of products. The town is also home to a few small farms, which produce a variety of crops.
Common Questions
What is Per Capita Income in Taylor Landing?
Per Capita income in Taylor Landing is $49,532.
What is the Median Family Income in Taylor Landing?
Median Family Income in Taylor Landing is $123,750.
What is the Median Household income in Taylor Landing?
Median Household Income in Taylor Landing is $125,000.
What is Income or Wage Gap in Taylor Landing?
Income or Wage Gap in Taylor Landing is 33.9%.
Women in Taylor Landing earn 66.1 cents for every dollar earned by a man.
What is Inequality or Gini Index in Taylor Landing?
Inequality or Gini Index in Taylor Landing is 0.27.
What is the Total Population of Taylor Landing?
Total Population of Taylor Landing is 281.
What is the Total Male Population of Taylor Landing?
Total Male Population of Taylor Landing is 124.
What is the Total Female Population of Taylor Landing?
Total Female Population of Taylor Landing is 157.
What is the Ratio of Males per 100 Females in Taylor Landing?
There are 78.98 Males per 100 Females in Taylor Landing.
What is the Ratio of Females per 100 Males in Taylor Landing?
There are 126.61 Females per 100 Males in Taylor Landing.
What is the Median Population Age in Taylor Landing?
Median Population Age in Taylor Landing is 45.5 Years.
What is the Average Family Size in Taylor Landing
Average Family Size in Taylor Landing is 2.9 People.
What is the Average Household Size in Taylor Landing
Average Household Size in Taylor Landing is 2.9 People.
How Large is the Labor Force in Taylor Landing?
There are 120 People in the Labor Forcein in Taylor Landing.
What is the Percentage of People in the Labor Force in Taylor Landing?
56.3% of People are in the Labor Force in Taylor Landing.
What is the Unemployment Rate in Taylor Landing?
Unemployment Rate in Taylor Landing is 1.7%.