Point Venture, TX Map & Demographics
Point Venture Map
Point Venture Overview
$60,202
PER CAPITA INCOME
$137,500
AVG FAMILY INCOME
$112,250
AVG HOUSEHOLD INCOME
34.8%
WAGE / INCOME GAP [ % ]
65.2¢/ $1
WAGE / INCOME GAP [ $ ]
0.40
INEQUALITY / GINI INDEX
1,521
TOTAL POPULATION
774
MALE POPULATION
747
FEMALE POPULATION
103.61
MALES / 100 FEMALES
96.51
FEMALES / 100 MALES
47.1
MEDIAN AGE
2.8
AVG FAMILY SIZE
2.4
AVG HOUSEHOLD SIZE
827
LABOR FORCE [ PEOPLE ]
64.5%
PERCENT IN LABOR FORCE
4.6%
UNEMPLOYMENT RATE
Income in Point Venture
Income Overview in Point Venture
Per Capita Income in Point Venture is $60,202, while median incomes of families and households are $137,500 and $112,250 respectively.
| Characteristic | Number | Measure |
| Per Capita Income | 1,521 | $60,202 |
| Median Family Income | 464 | $137,500 |
| Mean Family Income | 464 | $154,899 |
| Median Household Income | 633 | $112,250 |
| Mean Household Income | 633 | $142,653 |
| Income Deficit | 464 | $0 |
| Wage / Income Gap (%) | 1,521 | 34.81% |
| Wage / Income Gap ($) | 1,521 | 65.19¢ per $1 |
| Gini / Inequality Index | 1,521 | 0.40 |
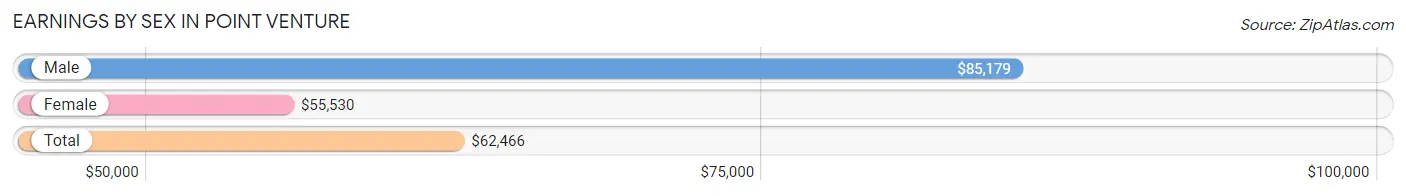
Earnings by Sex in Point Venture
Average Earnings in Point Venture are $62,466, $85,179 for men and $55,530 for women, a difference of 34.8%.
| Sex | Number | Average Earnings |
| Male | 461 (55.2%) | $85,179 |
| Female | 374 (44.8%) | $55,530 |
| Total | 835 (100.0%) | $62,466 |
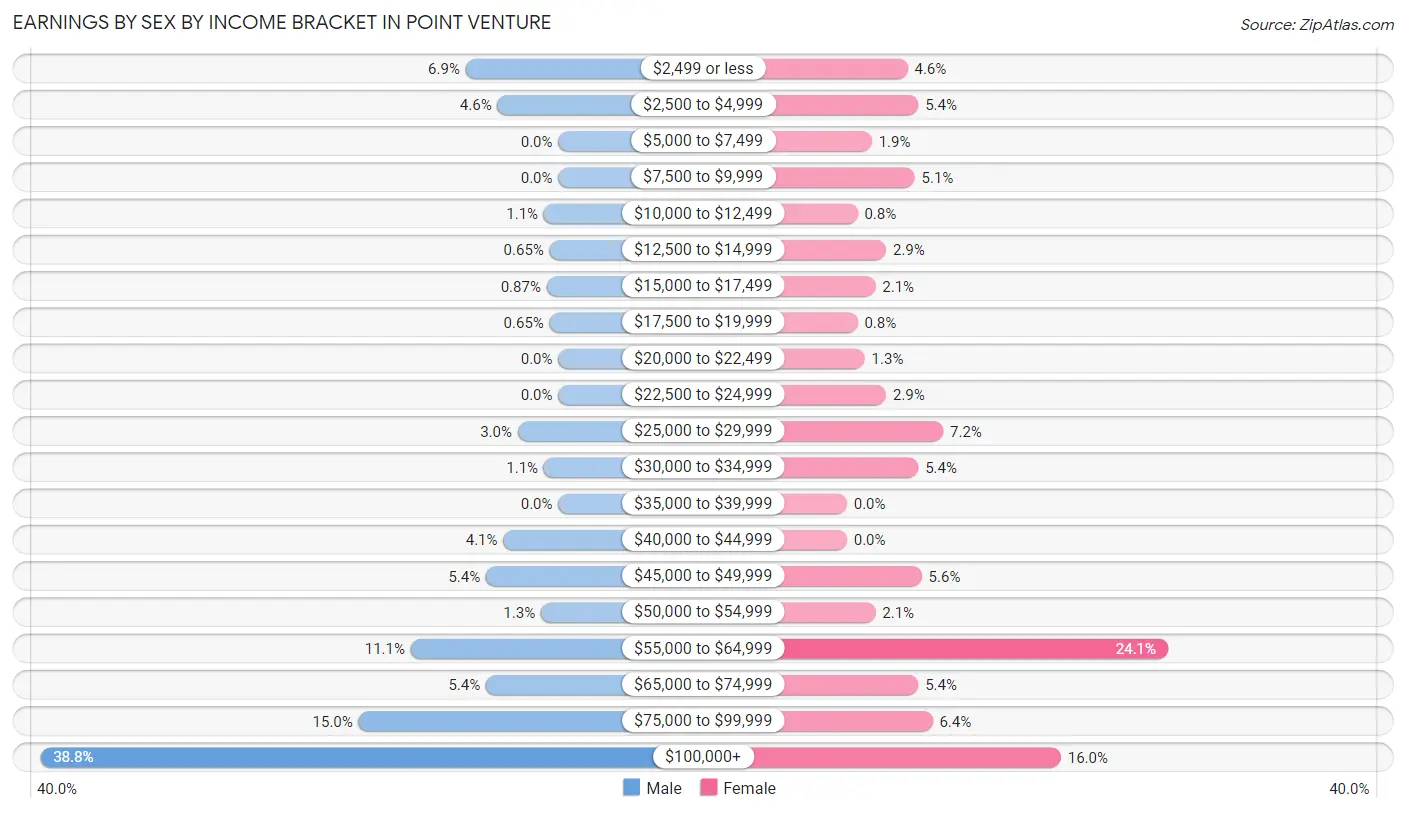
Earnings by Sex by Income Bracket in Point Venture
The most common earnings brackets in Point Venture are $100,000+ for men (179 | 38.8%) and $55,000 to $64,999 for women (90 | 24.1%).
| Income | Male | Female |
| $2,499 or less | 32 (6.9%) | 17 (4.5%) |
| $2,500 to $4,999 | 21 (4.6%) | 20 (5.3%) |
| $5,000 to $7,499 | 0 (0.0%) | 7 (1.9%) |
| $7,500 to $9,999 | 0 (0.0%) | 19 (5.1%) |
| $10,000 to $12,499 | 5 (1.1%) | 3 (0.8%) |
| $12,500 to $14,999 | 3 (0.6%) | 11 (2.9%) |
| $15,000 to $17,499 | 4 (0.9%) | 8 (2.1%) |
| $17,500 to $19,999 | 3 (0.6%) | 3 (0.8%) |
| $20,000 to $22,499 | 0 (0.0%) | 5 (1.3%) |
| $22,500 to $24,999 | 0 (0.0%) | 11 (2.9%) |
| $25,000 to $29,999 | 14 (3.0%) | 27 (7.2%) |
| $30,000 to $34,999 | 5 (1.1%) | 20 (5.3%) |
| $35,000 to $39,999 | 0 (0.0%) | 0 (0.0%) |
| $40,000 to $44,999 | 19 (4.1%) | 0 (0.0%) |
| $45,000 to $49,999 | 25 (5.4%) | 21 (5.6%) |
| $50,000 to $54,999 | 6 (1.3%) | 8 (2.1%) |
| $55,000 to $64,999 | 51 (11.1%) | 90 (24.1%) |
| $65,000 to $74,999 | 25 (5.4%) | 20 (5.3%) |
| $75,000 to $99,999 | 69 (15.0%) | 24 (6.4%) |
| $100,000+ | 179 (38.8%) | 60 (16.0%) |
| Total | 461 (100.0%) | 374 (100.0%) |
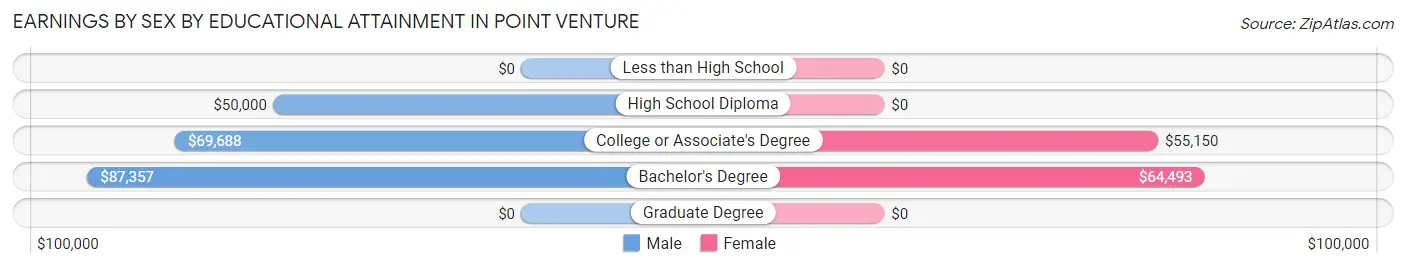
Earnings by Sex by Educational Attainment in Point Venture
Average earnings in Point Venture are $86,571 for men and $57,130 for women, a difference of 34.0%. Men with an educational attainment of bachelor's degree enjoy the highest average annual earnings of $87,357, while those with high school diploma education earn the least with $50,000. Women with an educational attainment of bachelor's degree earn the most with the average annual earnings of $64,493, while those with college or associate's degree education have the smallest earnings of $55,150.
| Educational Attainment | Male Income | Female Income |
| Less than High School | - | - |
| High School Diploma | $50,000 | $0 |
| College or Associate's Degree | $69,688 | $55,150 |
| Bachelor's Degree | $87,357 | $64,493 |
| Graduate Degree | - | - |
| Total | $86,571 | $57,130 |
Family Income in Point Venture
Family Income Brackets in Point Venture
According to the Point Venture family income data, there are 105 families falling into the $200,000+ income range, which is the most common income bracket and makes up 22.6% of all families.
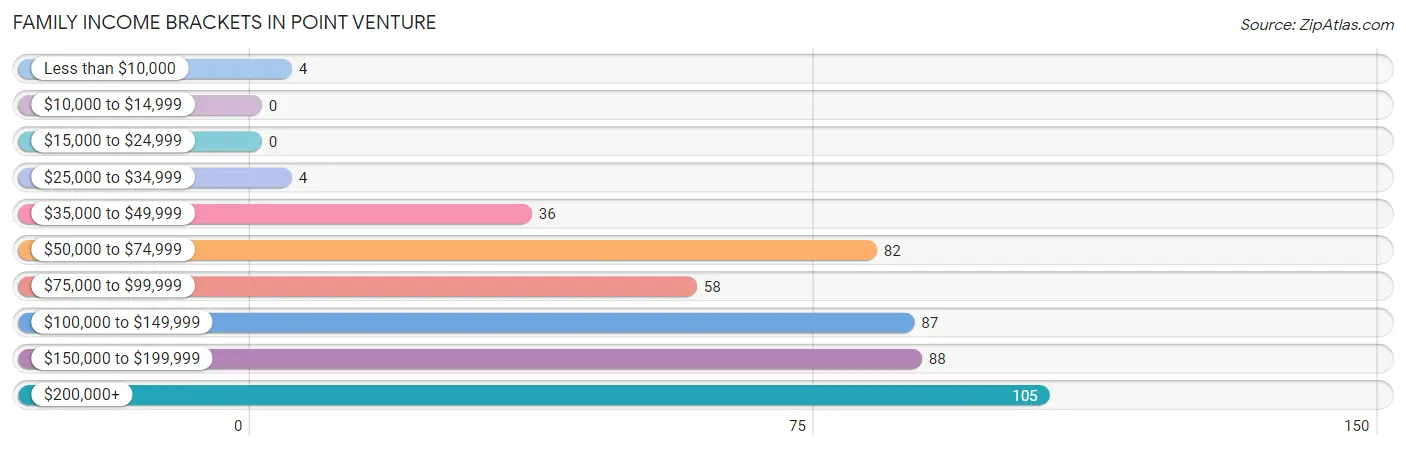
| Income Bracket | # Families | % Families |
| Less than $10,000 | 4 | 0.9% |
| $10,000 to $14,999 | 0 | 0.0% |
| $15,000 to $24,999 | 0 | 0.0% |
| $25,000 to $34,999 | 4 | 0.9% |
| $35,000 to $49,999 | 36 | 7.8% |
| $50,000 to $74,999 | 82 | 17.7% |
| $75,000 to $99,999 | 58 | 12.5% |
| $100,000 to $149,999 | 87 | 18.8% |
| $150,000 to $199,999 | 88 | 19.0% |
| $200,000+ | 105 | 22.6% |
Family Income by Famaliy Size in Point Venture
5-person families (17 | 3.7%) account for the highest median family income in Point Venture with $250,001 per family, while 2-person families (242 | 52.2%) have the highest median income of $53,750 per family member.
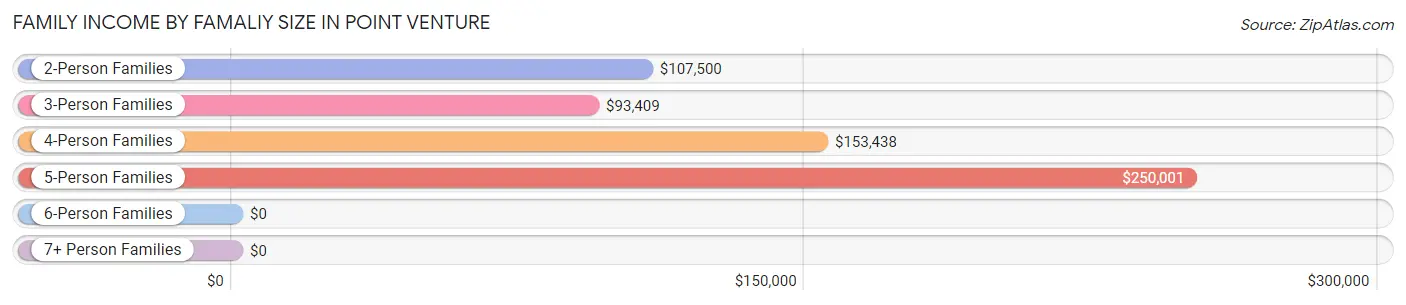
| Income Bracket | # Families | Median Income |
| 2-Person Families | 242 (52.2%) | $107,500 |
| 3-Person Families | 106 (22.8%) | $93,409 |
| 4-Person Families | 81 (17.5%) | $153,438 |
| 5-Person Families | 17 (3.7%) | $250,001 |
| 6-Person Families | 18 (3.9%) | $0 |
| 7+ Person Families | 0 (0.0%) | $0 |
| Total | 464 (100.0%) | $137,500 |
Family Income by Number of Earners in Point Venture
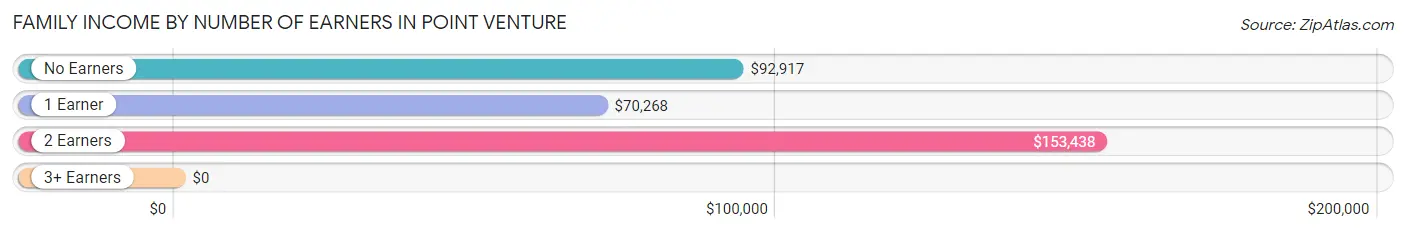
| Number of Earners | # Families | Median Income |
| No Earners | 79 (17.0%) | $92,917 |
| 1 Earner | 145 (31.2%) | $70,268 |
| 2 Earners | 201 (43.3%) | $153,438 |
| 3+ Earners | 39 (8.4%) | $0 |
| Total | 464 (100.0%) | $137,500 |
Household Income in Point Venture
Household Income Brackets in Point Venture
With 134 households falling in the category, the $50,000 to $74,999 income range is the most frequent in Point Venture, accounting for 21.2% of all households. In contrast, only 7 households (1.1%) fall into the $10,000 to $14,999 income bracket, making it the least populous group.
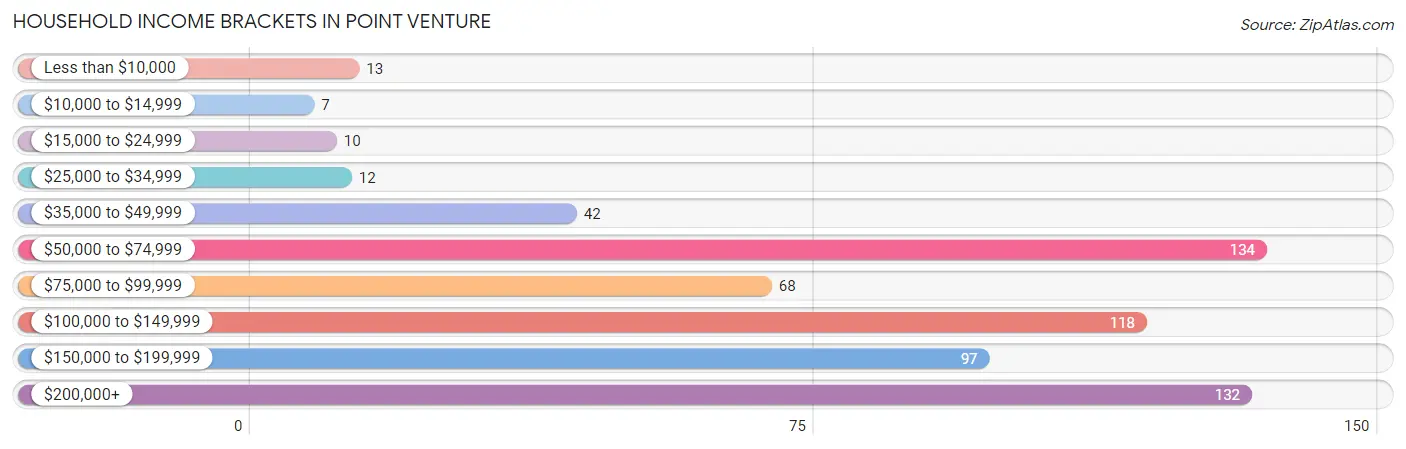
| Income Bracket | # Households | % Households |
| Less than $10,000 | 13 | 2.1% |
| $10,000 to $14,999 | 7 | 1.1% |
| $15,000 to $24,999 | 10 | 1.6% |
| $25,000 to $34,999 | 12 | 1.9% |
| $35,000 to $49,999 | 42 | 6.6% |
| $50,000 to $74,999 | 134 | 21.2% |
| $75,000 to $99,999 | 68 | 10.7% |
| $100,000 to $149,999 | 118 | 18.6% |
| $150,000 to $199,999 | 97 | 15.3% |
| $200,000+ | 132 | 20.9% |
Household Income by Householder Age in Point Venture
The median household income in Point Venture is $112,250, with the highest median household income of $149,153 found in the 45 to 64 years age bracket for the primary householder. A total of 299 households (47.2%) fall into this category. Meanwhile, the 15 to 24 years age bracket for the primary householder has the lowest median household income of $0, with 3 households (0.5%) in this group.
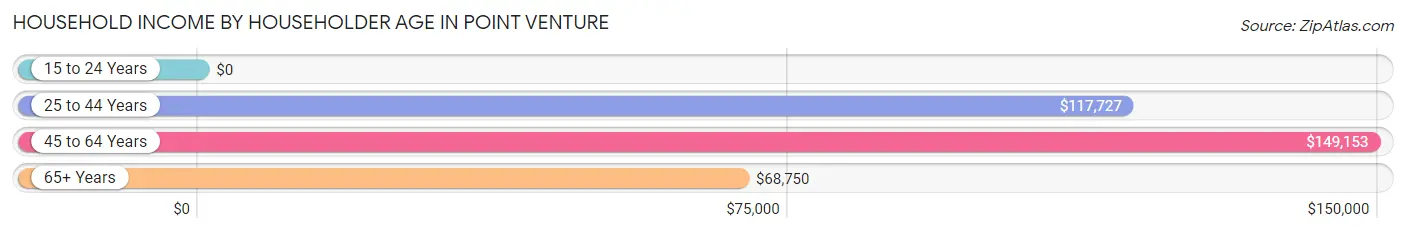
| Income Bracket | # Households | Median Income |
| 15 to 24 Years | 3 (0.5%) | $0 |
| 25 to 44 Years | 138 (21.8%) | $117,727 |
| 45 to 64 Years | 299 (47.2%) | $149,153 |
| 65+ Years | 193 (30.5%) | $68,750 |
| Total | 633 (100.0%) | $112,250 |
Poverty in Point Venture
Income Below Poverty by Sex and Age in Point Venture
With 2.5% poverty level for males and 2.1% for females among the residents of Point Venture, 45 to 54 year old males and 18 to 24 year old females are the most vulnerable to poverty, with 9 males (6.4%) and 3 females (15.0%) in their respective age groups living below the poverty level.
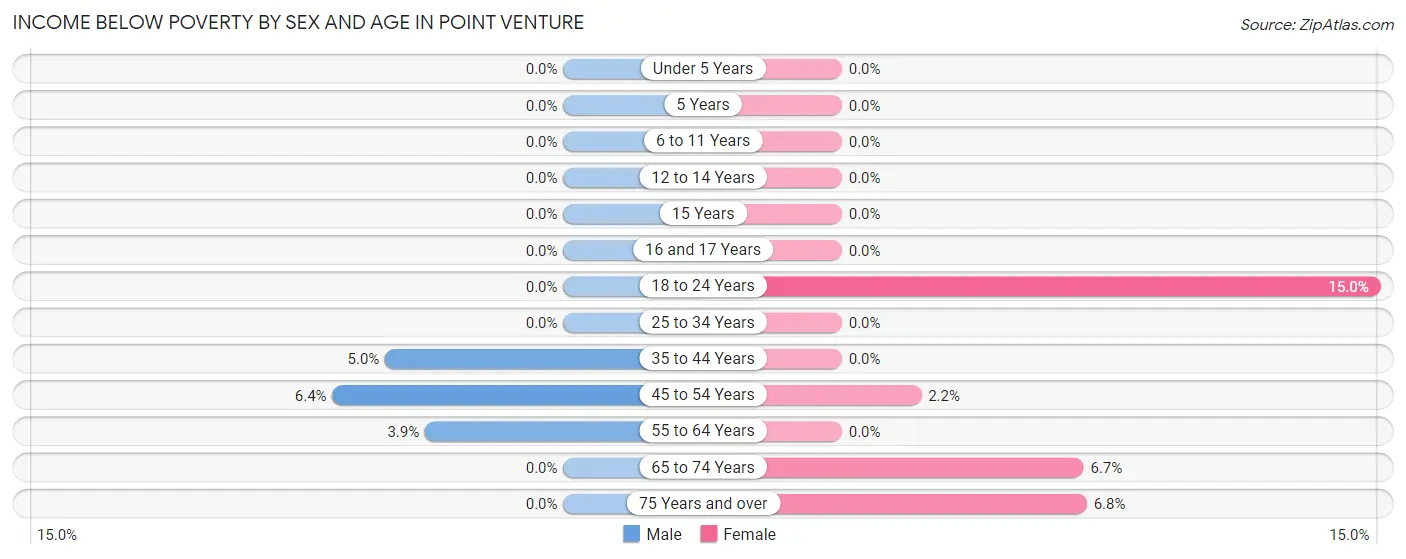
| Age Bracket | Male | Female |
| Under 5 Years | 0 (0.0%) | 0 (0.0%) |
| 5 Years | 0 (0.0%) | 0 (0.0%) |
| 6 to 11 Years | 0 (0.0%) | 0 (0.0%) |
| 12 to 14 Years | 0 (0.0%) | 0 (0.0%) |
| 15 Years | 0 (0.0%) | 0 (0.0%) |
| 16 and 17 Years | 0 (0.0%) | 0 (0.0%) |
| 18 to 24 Years | 0 (0.0%) | 3 (15.0%) |
| 25 to 34 Years | 0 (0.0%) | 0 (0.0%) |
| 35 to 44 Years | 6 (5.0%) | 0 (0.0%) |
| 45 to 54 Years | 9 (6.4%) | 3 (2.2%) |
| 55 to 64 Years | 4 (3.8%) | 0 (0.0%) |
| 65 to 74 Years | 0 (0.0%) | 7 (6.7%) |
| 75 Years and over | 0 (0.0%) | 3 (6.8%) |
| Total | 19 (2.5%) | 16 (2.1%) |
Income Above Poverty by Sex and Age in Point Venture
According to the poverty statistics in Point Venture, males aged under 5 years and females aged under 5 years are the age groups that are most secure financially, with 100.0% of males and 100.0% of females in these age groups living above the poverty line.
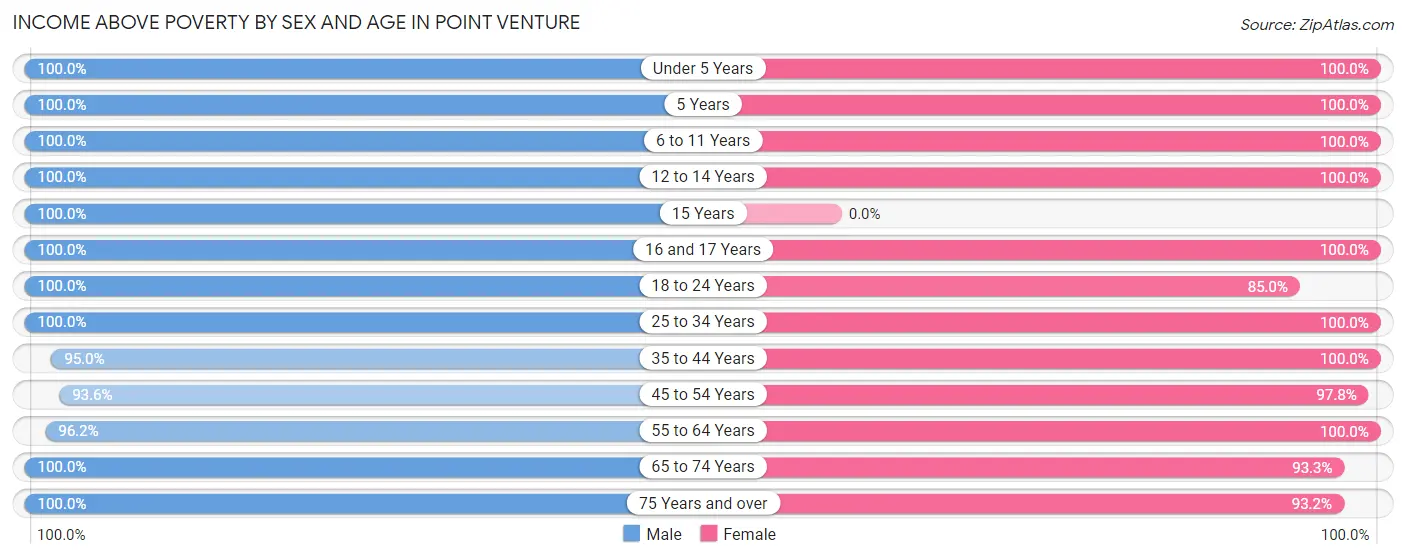
| Age Bracket | Male | Female |
| Under 5 Years | 10 (100.0%) | 3 (100.0%) |
| 5 Years | 27 (100.0%) | 15 (100.0%) |
| 6 to 11 Years | 72 (100.0%) | 31 (100.0%) |
| 12 to 14 Years | 31 (100.0%) | 38 (100.0%) |
| 15 Years | 12 (100.0%) | 0 (0.0%) |
| 16 and 17 Years | 19 (100.0%) | 48 (100.0%) |
| 18 to 24 Years | 45 (100.0%) | 17 (85.0%) |
| 25 to 34 Years | 28 (100.0%) | 51 (100.0%) |
| 35 to 44 Years | 115 (95.0%) | 141 (100.0%) |
| 45 to 54 Years | 131 (93.6%) | 133 (97.8%) |
| 55 to 64 Years | 100 (96.2%) | 116 (100.0%) |
| 65 to 74 Years | 120 (100.0%) | 97 (93.3%) |
| 75 Years and over | 45 (100.0%) | 41 (93.2%) |
| Total | 755 (97.6%) | 731 (97.9%) |
Income Below Poverty Among Married-Couple Families in Point Venture
The poverty statistics for married-couple families in Point Venture show that 1.0% or 4 of the total 407 families live below the poverty line. Families with no children have the highest poverty rate of 1.6%, comprising of 4 families. On the other hand, families with 1 or 2 children have the lowest poverty rate of 0.0%, which includes 0 families.
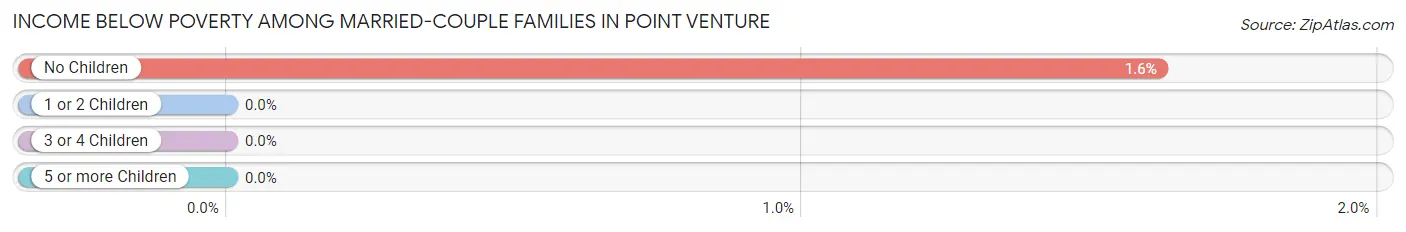
| Children | Above Poverty | Below Poverty |
| No Children | 243 (98.4%) | 4 (1.6%) |
| 1 or 2 Children | 136 (100.0%) | 0 (0.0%) |
| 3 or 4 Children | 24 (100.0%) | 0 (0.0%) |
| 5 or more Children | 0 (0.0%) | 0 (0.0%) |
| Total | 403 (99.0%) | 4 (1.0%) |
Income Below Poverty Among Single-Parent Households in Point Venture
| Children | Single Father | Single Mother |
| No Children | 0 (0.0%) | 0 (0.0%) |
| 1 or 2 Children | 0 (0.0%) | 0 (0.0%) |
| 3 or 4 Children | 0 (0.0%) | 0 (0.0%) |
| 5 or more Children | 0 (0.0%) | 0 (0.0%) |
| Total | 0 (0.0%) | 0 (0.0%) |
Income Below Poverty Among Married-Couple vs Single-Parent Households in Point Venture
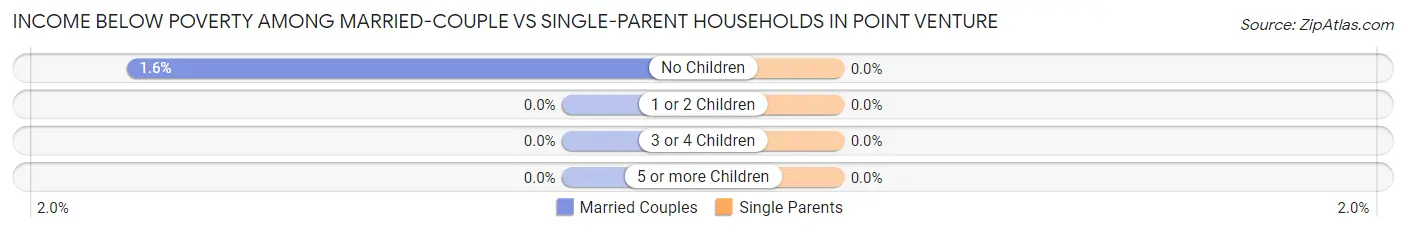
| Children | Married-Couple Families | Single-Parent Households |
| No Children | 4 (1.6%) | 0 (0.0%) |
| 1 or 2 Children | 0 (0.0%) | 0 (0.0%) |
| 3 or 4 Children | 0 (0.0%) | 0 (0.0%) |
| 5 or more Children | 0 (0.0%) | 0 (0.0%) |
| Total | 4 (1.0%) | 0 (0.0%) |
Race in Point Venture
The most populous races in Point Venture are White / Caucasian (1,321 | 86.9%), Hispanic or Latino (169 | 11.1%), and Two or more Races (103 | 6.8%).
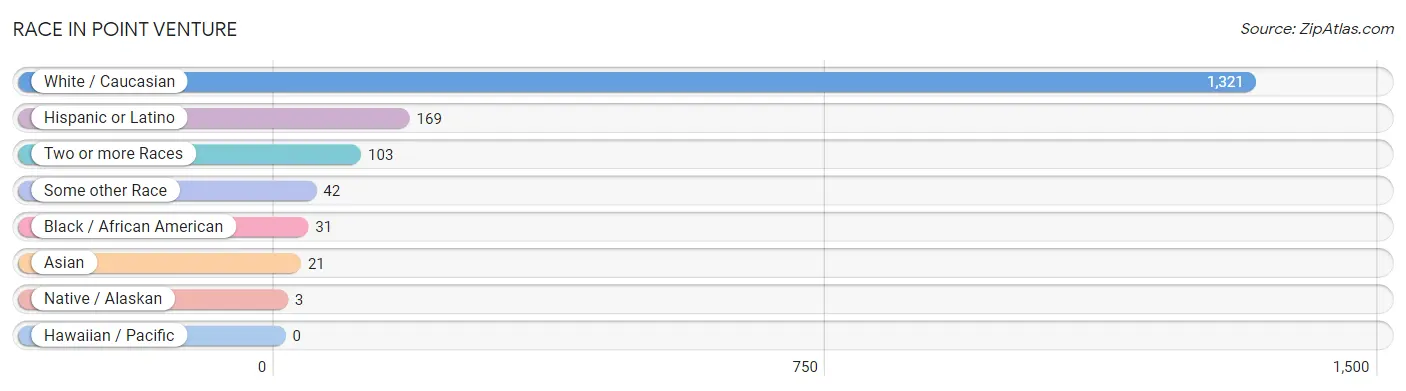
| Race | # Population | % Population |
| Asian | 21 | 1.4% |
| Black / African American | 31 | 2.0% |
| Hawaiian / Pacific | 0 | 0.0% |
| Hispanic or Latino | 169 | 11.1% |
| Native / Alaskan | 3 | 0.2% |
| White / Caucasian | 1,321 | 86.9% |
| Two or more Races | 103 | 6.8% |
| Some other Race | 42 | 2.8% |
| Total | 1,521 | 100.0% |
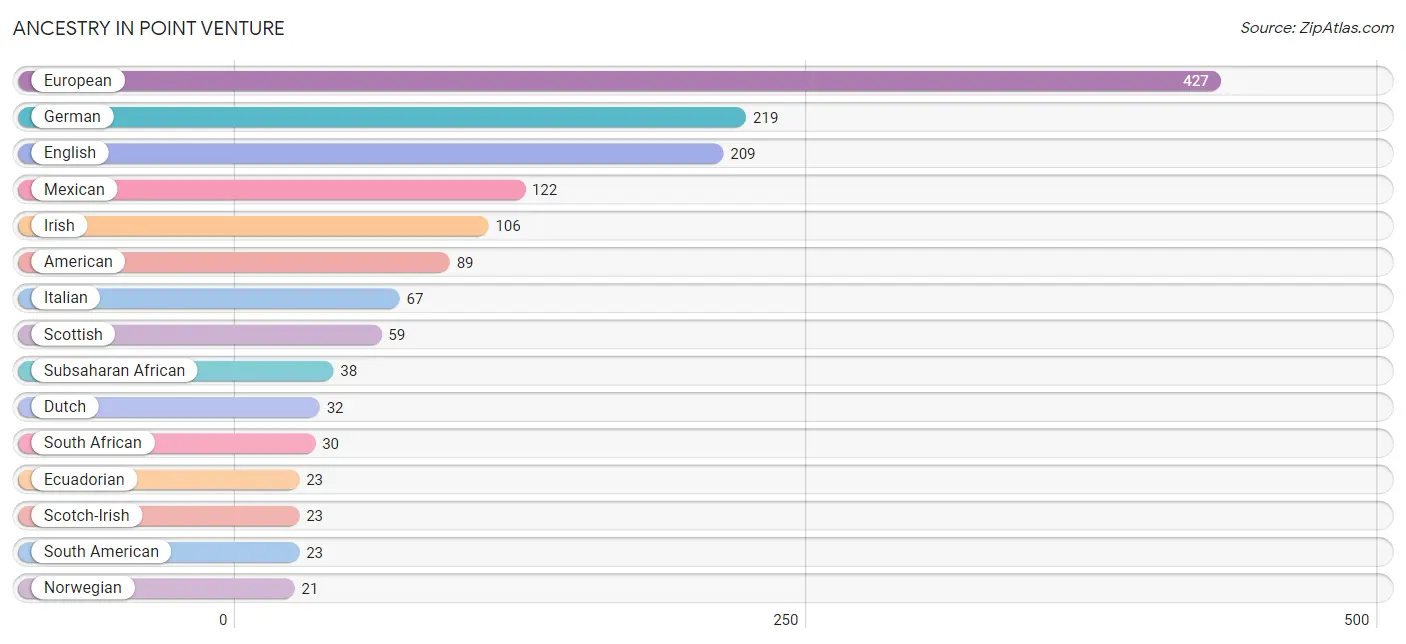
Ancestry in Point Venture
The most populous ancestries reported in Point Venture are European (427 | 28.1%), German (219 | 14.4%), English (209 | 13.7%), Mexican (122 | 8.0%), and Irish (106 | 7.0%), together accounting for 71.2% of all Point Venture residents.
| Ancestry | # Population | % Population |
| American | 89 | 5.9% |
| Apache | 4 | 0.3% |
| Armenian | 4 | 0.3% |
| Blackfeet | 12 | 0.8% |
| British | 8 | 0.5% |
| Burmese | 20 | 1.3% |
| Comanche | 3 | 0.2% |
| Croatian | 3 | 0.2% |
| Cuban | 19 | 1.3% |
| Czech | 8 | 0.5% |
| Danish | 3 | 0.2% |
| Dutch | 32 | 2.1% |
| Ecuadorian | 23 | 1.5% |
| English | 209 | 13.7% |
| Ethiopian | 8 | 0.5% |
| European | 427 | 28.1% |
| French | 14 | 0.9% |
| German | 219 | 14.4% |
| Irish | 106 | 7.0% |
| Italian | 67 | 4.4% |
| Mexican | 122 | 8.0% |
| Northern European | 4 | 0.3% |
| Norwegian | 21 | 1.4% |
| Polish | 13 | 0.9% |
| Portuguese | 4 | 0.3% |
| Puerto Rican | 5 | 0.3% |
| Scandinavian | 6 | 0.4% |
| Scotch-Irish | 23 | 1.5% |
| Scottish | 59 | 3.9% |
| Slovak | 3 | 0.2% |
| South African | 30 | 2.0% |
| South American | 23 | 1.5% |
| Sri Lankan | 5 | 0.3% |
| Subsaharan African | 38 | 2.5% |
| Swedish | 13 | 0.9% |
| Swiss | 3 | 0.2% |
| Trinidadian and Tobagonian | 12 | 0.8% |
| Welsh | 3 | 0.2% | View All 38 Rows |
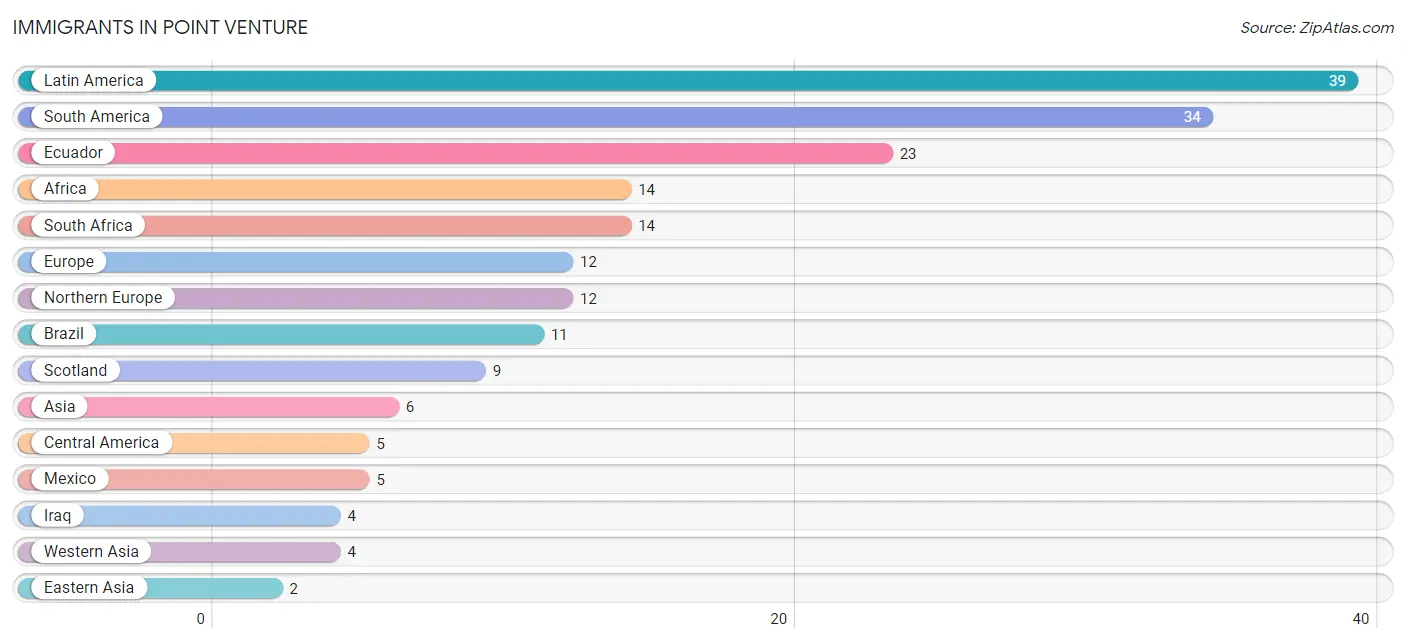
Immigrants in Point Venture
The most numerous immigrant groups reported in Point Venture came from Latin America (39 | 2.6%), South America (34 | 2.2%), Ecuador (23 | 1.5%), Africa (14 | 0.9%), and South Africa (14 | 0.9%), together accounting for 8.2% of all Point Venture residents.
| Immigration Origin | # Population | % Population |
| Africa | 14 | 0.9% |
| Asia | 6 | 0.4% |
| Brazil | 11 | 0.7% |
| Central America | 5 | 0.3% |
| Eastern Asia | 2 | 0.1% |
| Ecuador | 23 | 1.5% |
| Europe | 12 | 0.8% |
| Iraq | 4 | 0.3% |
| Korea | 2 | 0.1% |
| Latin America | 39 | 2.6% |
| Mexico | 5 | 0.3% |
| Northern Europe | 12 | 0.8% |
| Scotland | 9 | 0.6% |
| South Africa | 14 | 0.9% |
| South America | 34 | 2.2% |
| Western Asia | 4 | 0.3% | View All 16 Rows |
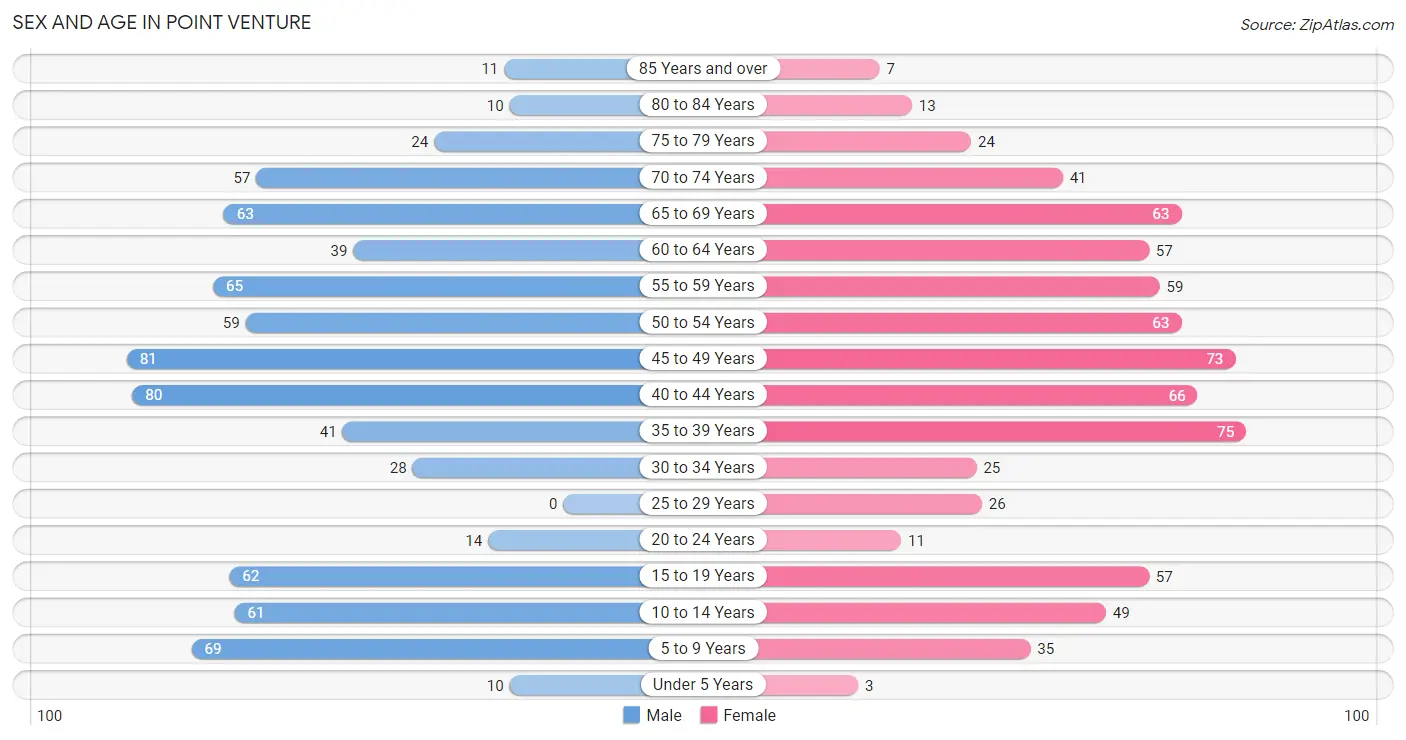
Sex and Age in Point Venture
Sex and Age in Point Venture
The most populous age groups in Point Venture are 45 to 49 Years (81 | 10.5%) for men and 35 to 39 Years (75 | 10.0%) for women.
| Age Bracket | Male | Female |
| Under 5 Years | 10 (1.3%) | 3 (0.4%) |
| 5 to 9 Years | 69 (8.9%) | 35 (4.7%) |
| 10 to 14 Years | 61 (7.9%) | 49 (6.6%) |
| 15 to 19 Years | 62 (8.0%) | 57 (7.6%) |
| 20 to 24 Years | 14 (1.8%) | 11 (1.5%) |
| 25 to 29 Years | 0 (0.0%) | 26 (3.5%) |
| 30 to 34 Years | 28 (3.6%) | 25 (3.4%) |
| 35 to 39 Years | 41 (5.3%) | 75 (10.0%) |
| 40 to 44 Years | 80 (10.3%) | 66 (8.8%) |
| 45 to 49 Years | 81 (10.5%) | 73 (9.8%) |
| 50 to 54 Years | 59 (7.6%) | 63 (8.4%) |
| 55 to 59 Years | 65 (8.4%) | 59 (7.9%) |
| 60 to 64 Years | 39 (5.0%) | 57 (7.6%) |
| 65 to 69 Years | 63 (8.1%) | 63 (8.4%) |
| 70 to 74 Years | 57 (7.4%) | 41 (5.5%) |
| 75 to 79 Years | 24 (3.1%) | 24 (3.2%) |
| 80 to 84 Years | 10 (1.3%) | 13 (1.7%) |
| 85 Years and over | 11 (1.4%) | 7 (0.9%) |
| Total | 774 (100.0%) | 747 (100.0%) |
Families and Households in Point Venture
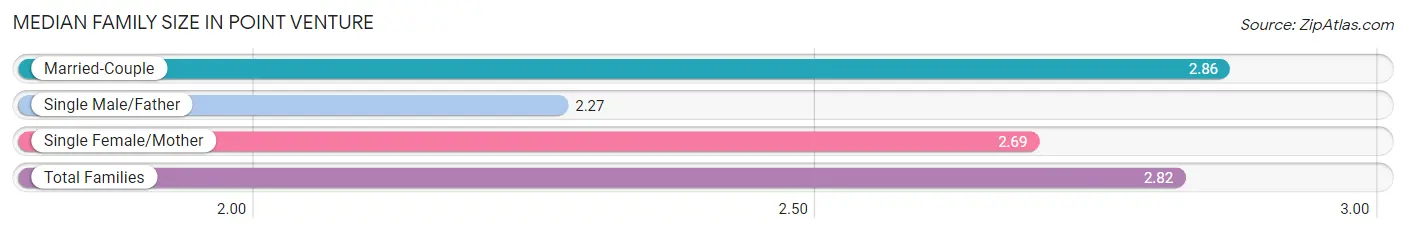
Median Family Size in Point Venture
The median family size in Point Venture is 2.82 persons per family, with married-couple families (407 | 87.7%) accounting for the largest median family size of 2.86 persons per family. On the other hand, single male/father families (22 | 4.7%) represent the smallest median family size with 2.27 persons per family.
| Family Type | # Families | Family Size |
| Married-Couple | 407 (87.7%) | 2.86 |
| Single Male/Father | 22 (4.7%) | 2.27 |
| Single Female/Mother | 35 (7.5%) | 2.69 |
| Total Families | 464 (100.0%) | 2.82 |
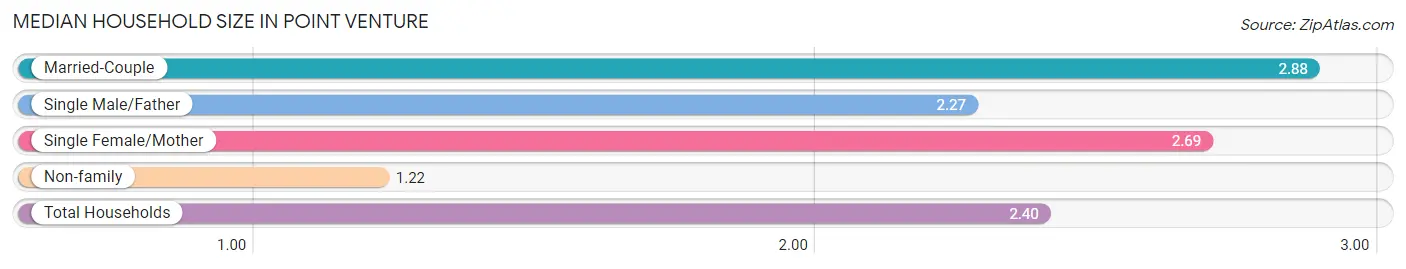
Median Household Size in Point Venture
The median household size in Point Venture is 2.40 persons per household, with married-couple households (407 | 64.3%) accounting for the largest median household size of 2.88 persons per household. non-family households (169 | 26.7%) represent the smallest median household size with 1.22 persons per household.
| Household Type | # Households | Household Size |
| Married-Couple | 407 (64.3%) | 2.88 |
| Single Male/Father | 22 (3.5%) | 2.27 |
| Single Female/Mother | 35 (5.5%) | 2.69 |
| Non-family | 169 (26.7%) | 1.22 |
| Total Households | 633 (100.0%) | 2.40 |
Household Size by Marriage Status in Point Venture
Out of a total of 633 households in Point Venture, 464 (73.3%) are family households, while 169 (26.7%) are nonfamily households. The most numerous type of family households are 2-person households, comprising 242, and the most common type of nonfamily households are 1-person households, comprising 136.
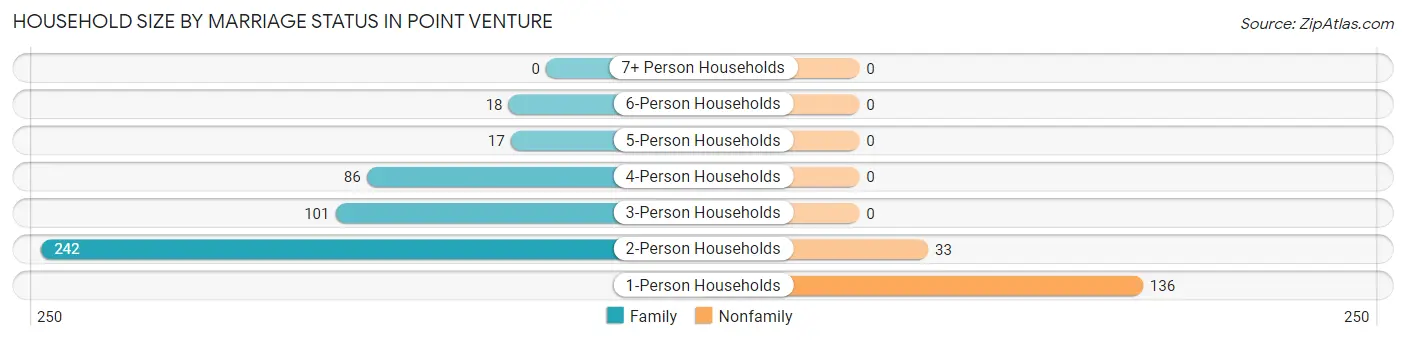
| Household Size | Family Households | Nonfamily Households |
| 1-Person Households | - | 136 (21.5%) |
| 2-Person Households | 242 (38.2%) | 33 (5.2%) |
| 3-Person Households | 101 (16.0%) | 0 (0.0%) |
| 4-Person Households | 86 (13.6%) | 0 (0.0%) |
| 5-Person Households | 17 (2.7%) | 0 (0.0%) |
| 6-Person Households | 18 (2.8%) | 0 (0.0%) |
| 7+ Person Households | 0 (0.0%) | 0 (0.0%) |
| Total | 464 (73.3%) | 169 (26.7%) |
Female Fertility in Point Venture
Fertility by Age in Point Venture
Average fertility rate in Point Venture is 42.0 births per 1,000 women. Women in the age bracket of 15 to 19 years have the highest fertility rate with 193.0 births per 1,000 women. Women in the age bracket of 15 to 19 years acount for 78.6% of all women with births.
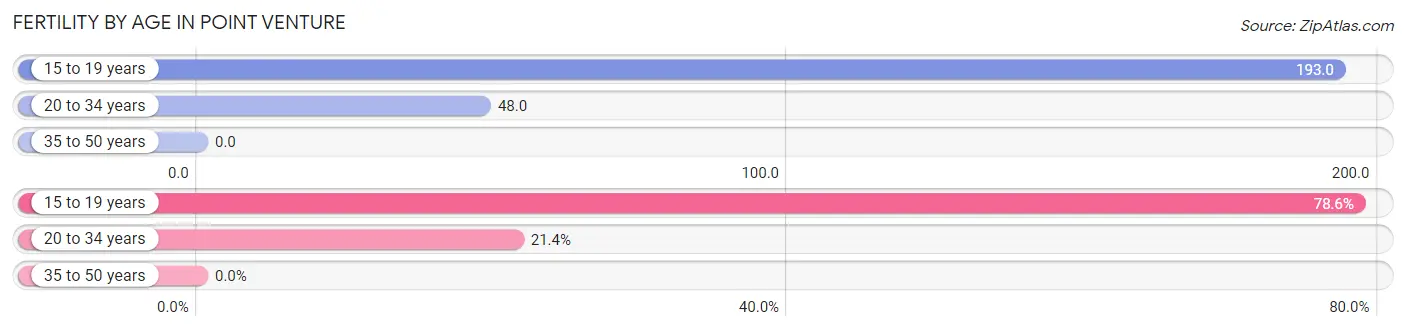
| Age Bracket | Women with Births | Births / 1,000 Women |
| 15 to 19 years | 11 (78.6%) | 193.0 |
| 20 to 34 years | 3 (21.4%) | 48.0 |
| 35 to 50 years | 0 (0.0%) | 0.0 |
| Total | 14 (100.0%) | 42.0 |
Fertility by Age by Marriage Status in Point Venture
21.4% of women with births (14) in Point Venture are married. The highest percentage of unmarried women with births falls into 15 to 19 years age bracket with 100.0% of them unmarried at the time of birth, while the lowest percentage of unmarried women with births belong to 20 to 34 years age bracket with 0.0% of them unmarried.
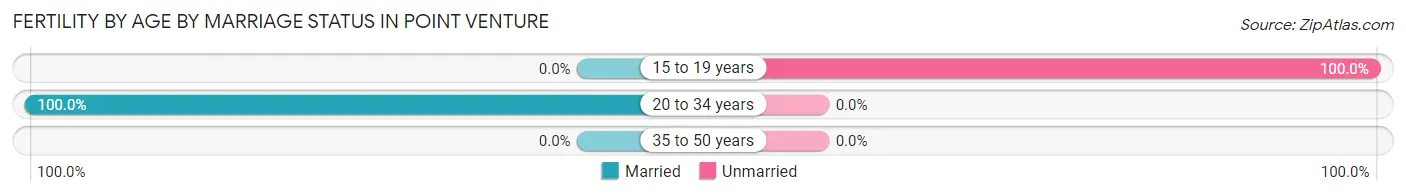
| Age Bracket | Married | Unmarried |
| 15 to 19 years | 0 (0.0%) | 11 (100.0%) |
| 20 to 34 years | 3 (100.0%) | 0 (0.0%) |
| 35 to 50 years | 0 (0.0%) | 0 (0.0%) |
| Total | 3 (21.4%) | 11 (78.6%) |
Fertility by Education in Point Venture
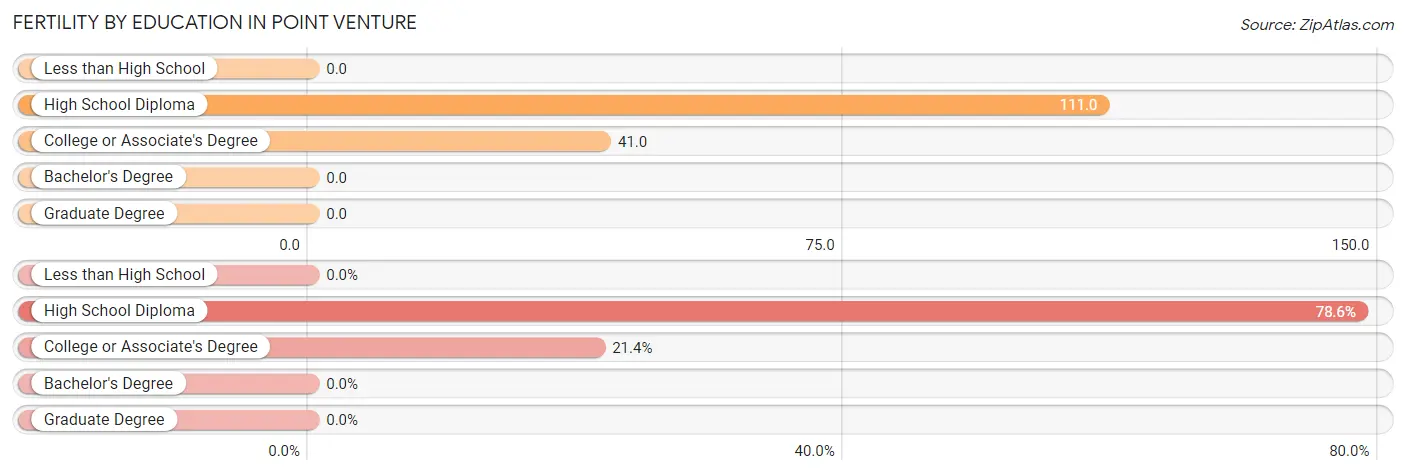
| Educational Attainment | Women with Births | Births / 1,000 Women |
| Less than High School | 0 (0.0%) | 0.0 |
| High School Diploma | 11 (78.6%) | 111.0 |
| College or Associate's Degree | 3 (21.4%) | 41.0 |
| Bachelor's Degree | 0 (0.0%) | 0.0 |
| Graduate Degree | 0 (0.0%) | 0.0 |
| Total | 14 (100.0%) | 42.0 |
Fertility by Education by Marriage Status in Point Venture
78.6% of women with births in Point Venture are unmarried. Women with the educational attainment of college or associate's degree are most likely to be married with 100.0% of them married at childbirth, while women with the educational attainment of high school diploma are least likely to be married with 100.0% of them unmarried at childbirth.
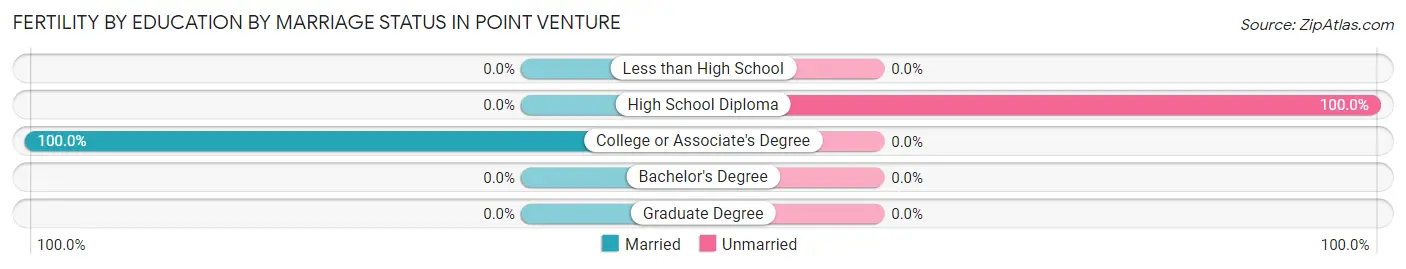
| Educational Attainment | Married | Unmarried |
| Less than High School | 0 (0.0%) | 0 (0.0%) |
| High School Diploma | 0 (0.0%) | 11 (100.0%) |
| College or Associate's Degree | 3 (100.0%) | 0 (0.0%) |
| Bachelor's Degree | 0 (0.0%) | 0 (0.0%) |
| Graduate Degree | 0 (0.0%) | 0 (0.0%) |
| Total | 3 (21.4%) | 11 (78.6%) |
Employment Characteristics in Point Venture
Employment by Class of Employer in Point Venture
Among the 731 employed individuals in Point Venture, private company employees (467 | 63.9%), self-employed (not incorporated) (109 | 14.9%), and self-employed (incorporated) (40 | 5.5%) make up the most common classes of employment.
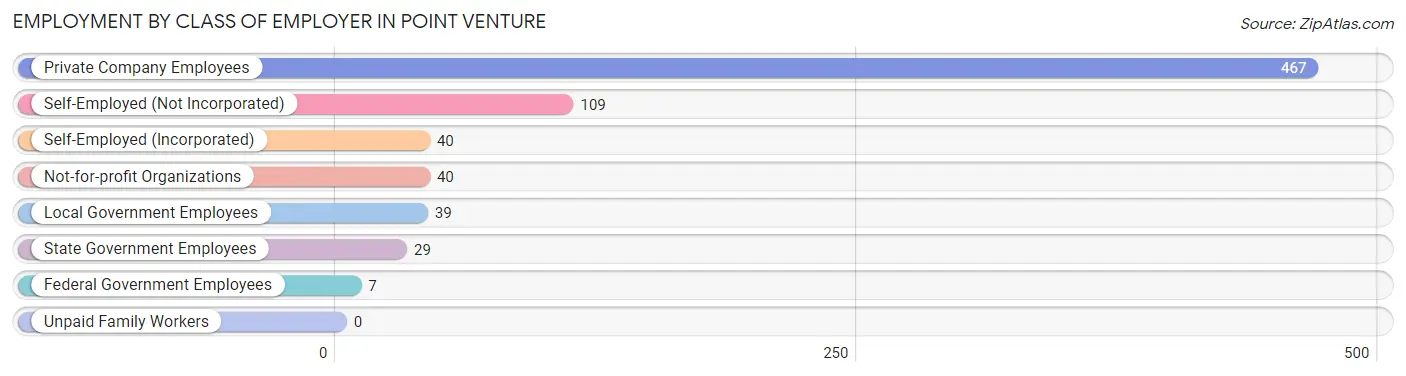
| Employer Class | # Employees | % Employees |
| Private Company Employees | 467 | 63.9% |
| Self-Employed (Incorporated) | 40 | 5.5% |
| Self-Employed (Not Incorporated) | 109 | 14.9% |
| Not-for-profit Organizations | 40 | 5.5% |
| Local Government Employees | 39 | 5.3% |
| State Government Employees | 29 | 4.0% |
| Federal Government Employees | 7 | 1.0% |
| Unpaid Family Workers | 0 | 0.0% |
| Total | 731 | 100.0% |
Employment Status by Age in Point Venture
According to the labor force statistics for Point Venture, out of the total population over 16 years of age (1,282), 64.5% or 827 individuals are in the labor force, with 4.6% or 38 of them unemployed. The age group with the highest labor force participation rate is 25 to 29 years, with 100.0% or 26 individuals in the labor force. Within the labor force, the 45 to 54 years age range has the highest percentage of unemployed individuals, with 12.4% or 29 of them being unemployed.
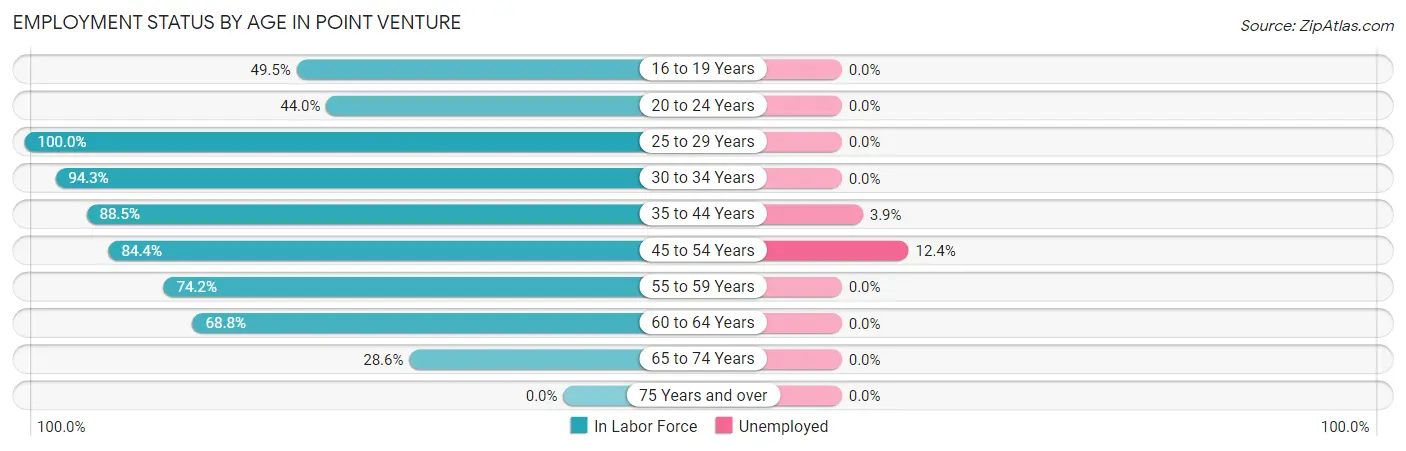
| Age Bracket | In Labor Force | Unemployed |
| 16 to 19 Years | 53 (49.5%) | 0 (0.0%) |
| 20 to 24 Years | 11 (44.0%) | 0 (0.0%) |
| 25 to 29 Years | 26 (100.0%) | 0 (0.0%) |
| 30 to 34 Years | 50 (94.3%) | 0 (0.0%) |
| 35 to 44 Years | 232 (88.5%) | 9 (3.9%) |
| 45 to 54 Years | 233 (84.4%) | 29 (12.4%) |
| 55 to 59 Years | 92 (74.2%) | 0 (0.0%) |
| 60 to 64 Years | 66 (68.8%) | 0 (0.0%) |
| 65 to 74 Years | 64 (28.6%) | 0 (0.0%) |
| 75 Years and over | 0 (0.0%) | 0 (0.0%) |
| Total | 827 (64.5%) | 38 (4.6%) |
Employment Status by Educational Attainment in Point Venture
According to labor force statistics for Point Venture, 83.5% of individuals (699) out of the total population between 25 and 64 years of age (837) are in the labor force, with 5.5% or 38 of them being unemployed. The group with the highest labor force participation rate are those with the educational attainment of bachelor's degree or higher, with 86.6% or 331 individuals in the labor force. Within the labor force, individuals with high school diploma education have the highest percentage of unemployment, with 23.9% or 34 of them being unemployed.
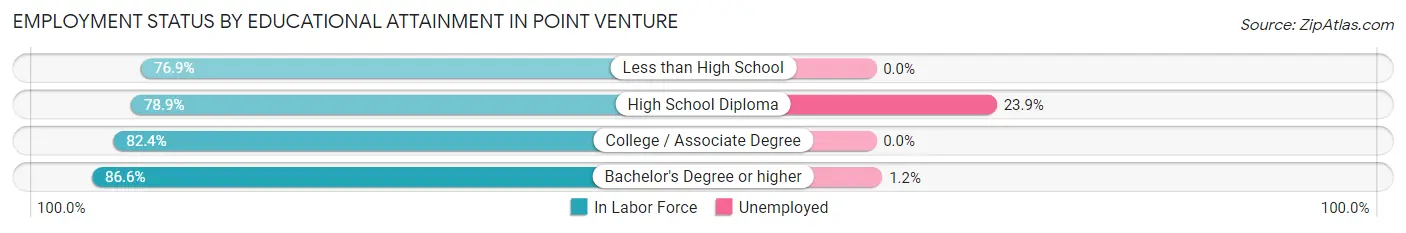
| Educational Attainment | In Labor Force | Unemployed |
| Less than High School | 10 (76.9%) | 0 (0.0%) |
| High School Diploma | 142 (78.9%) | 43 (23.9%) |
| College / Associate Degree | 216 (82.4%) | 0 (0.0%) |
| Bachelor's Degree or higher | 331 (86.6%) | 5 (1.2%) |
| Total | 699 (83.5%) | 46 (5.5%) |
Employment Occupations by Sex in Point Venture
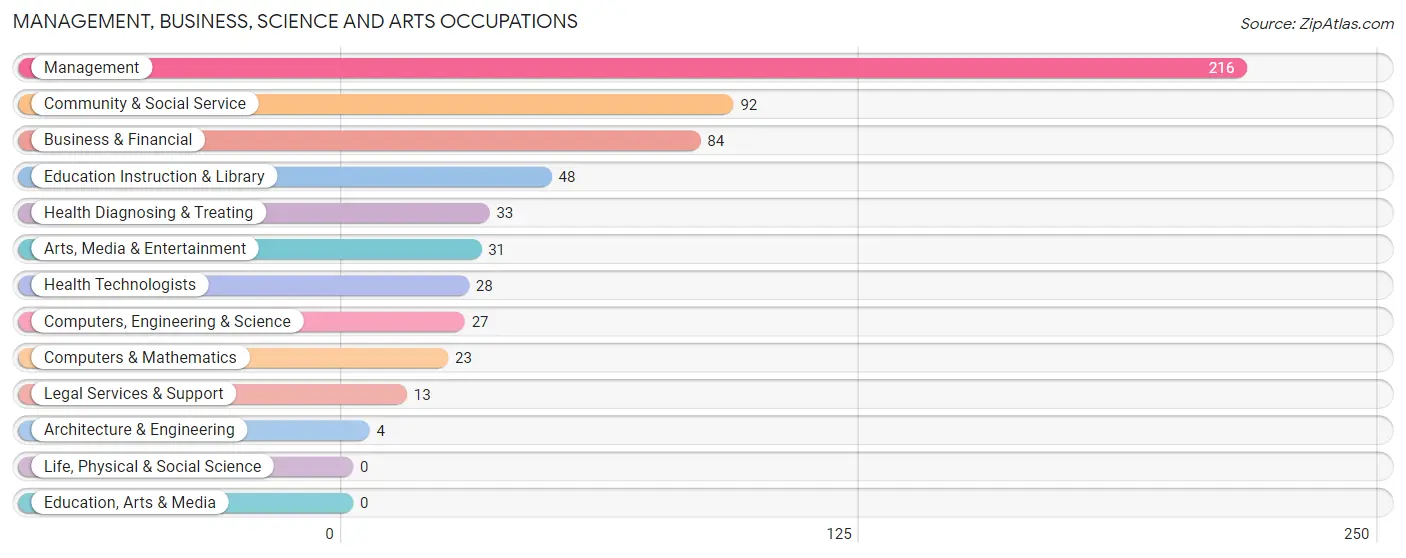
Management, Business, Science and Arts Occupations
The most common Management, Business, Science and Arts occupations in Point Venture are Management (216 | 27.5%), Community & Social Service (92 | 11.7%), Business & Financial (84 | 10.7%), Education Instruction & Library (48 | 6.1%), and Health Diagnosing & Treating (33 | 4.2%).
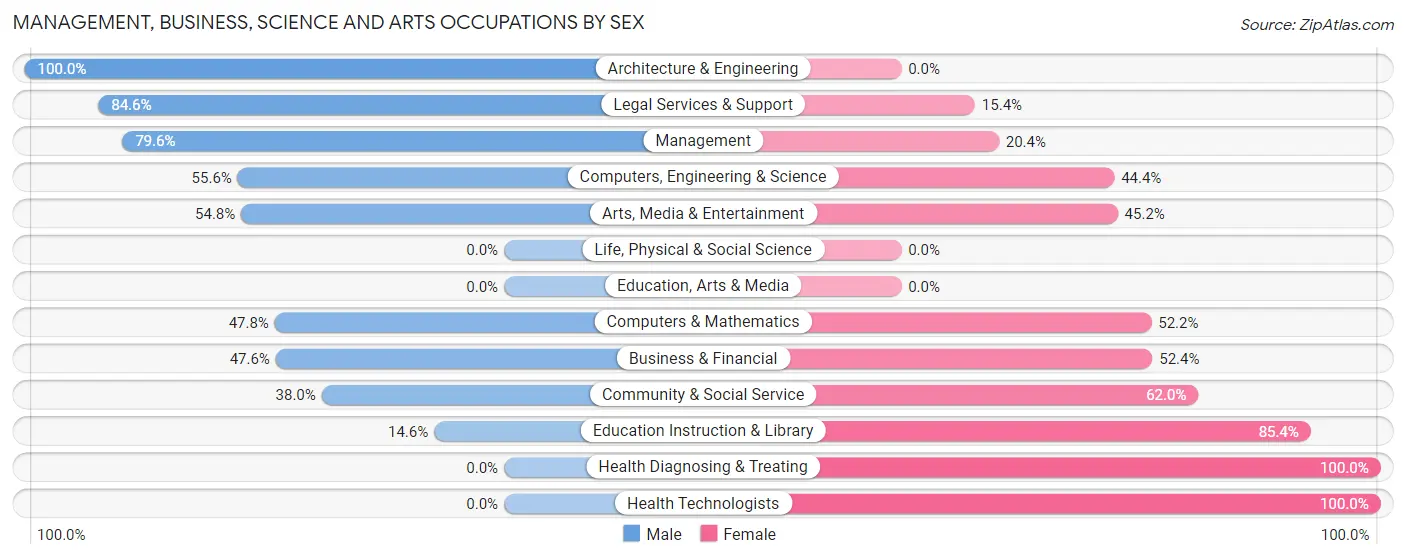
Management, Business, Science and Arts Occupations by Sex
Within the Management, Business, Science and Arts occupations in Point Venture, the most male-oriented occupations are Architecture & Engineering (100.0%), Legal Services & Support (84.6%), and Management (79.6%), while the most female-oriented occupations are Health Diagnosing & Treating (100.0%), Health Technologists (100.0%), and Education Instruction & Library (85.4%).
| Occupation | Male | Female |
| Management | 172 (79.6%) | 44 (20.4%) |
| Business & Financial | 40 (47.6%) | 44 (52.4%) |
| Computers, Engineering & Science | 15 (55.6%) | 12 (44.4%) |
| Computers & Mathematics | 11 (47.8%) | 12 (52.2%) |
| Architecture & Engineering | 4 (100.0%) | 0 (0.0%) |
| Life, Physical & Social Science | 0 (0.0%) | 0 (0.0%) |
| Community & Social Service | 35 (38.0%) | 57 (62.0%) |
| Education, Arts & Media | 0 (0.0%) | 0 (0.0%) |
| Legal Services & Support | 11 (84.6%) | 2 (15.4%) |
| Education Instruction & Library | 7 (14.6%) | 41 (85.4%) |
| Arts, Media & Entertainment | 17 (54.8%) | 14 (45.2%) |
| Health Diagnosing & Treating | 0 (0.0%) | 33 (100.0%) |
| Health Technologists | 0 (0.0%) | 28 (100.0%) |
| Total (Category) | 262 (58.0%) | 190 (42.0%) |
| Total (Overall) | 418 (53.1%) | 369 (46.9%) |
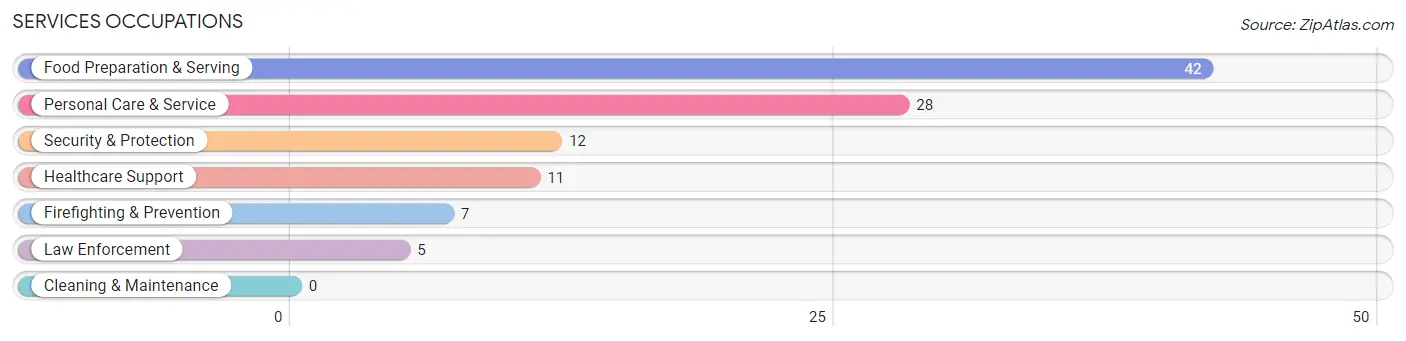
Services Occupations
The most common Services occupations in Point Venture are Food Preparation & Serving (42 | 5.3%), Personal Care & Service (28 | 3.6%), Security & Protection (12 | 1.5%), Healthcare Support (11 | 1.4%), and Firefighting & Prevention (7 | 0.9%).
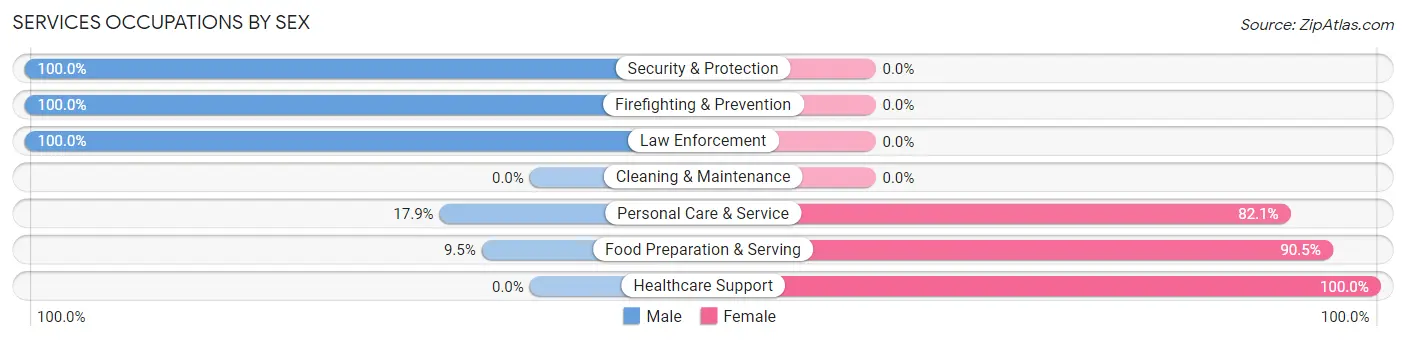
Services Occupations by Sex
Within the Services occupations in Point Venture, the most male-oriented occupations are Security & Protection (100.0%), Firefighting & Prevention (100.0%), and Law Enforcement (100.0%), while the most female-oriented occupations are Healthcare Support (100.0%), Food Preparation & Serving (90.5%), and Personal Care & Service (82.1%).
| Occupation | Male | Female |
| Healthcare Support | 0 (0.0%) | 11 (100.0%) |
| Security & Protection | 12 (100.0%) | 0 (0.0%) |
| Firefighting & Prevention | 7 (100.0%) | 0 (0.0%) |
| Law Enforcement | 5 (100.0%) | 0 (0.0%) |
| Food Preparation & Serving | 4 (9.5%) | 38 (90.5%) |
| Cleaning & Maintenance | 0 (0.0%) | 0 (0.0%) |
| Personal Care & Service | 5 (17.9%) | 23 (82.1%) |
| Total (Category) | 21 (22.6%) | 72 (77.4%) |
| Total (Overall) | 418 (53.1%) | 369 (46.9%) |
Sales and Office Occupations
The most common Sales and Office occupations in Point Venture are Sales & Related (99 | 12.6%), and Office & Administration (66 | 8.4%).

Sales and Office Occupations by Sex

| Occupation | Male | Female |
| Sales & Related | 59 (59.6%) | 40 (40.4%) |
| Office & Administration | 3 (4.5%) | 63 (95.5%) |
| Total (Category) | 62 (37.6%) | 103 (62.4%) |
| Total (Overall) | 418 (53.1%) | 369 (46.9%) |
Natural Resources, Construction and Maintenance Occupations
The most common Natural Resources, Construction and Maintenance occupations in Point Venture are Construction & Extraction (29 | 3.7%), and Installation, Maintenance & Repair (11 | 1.4%).
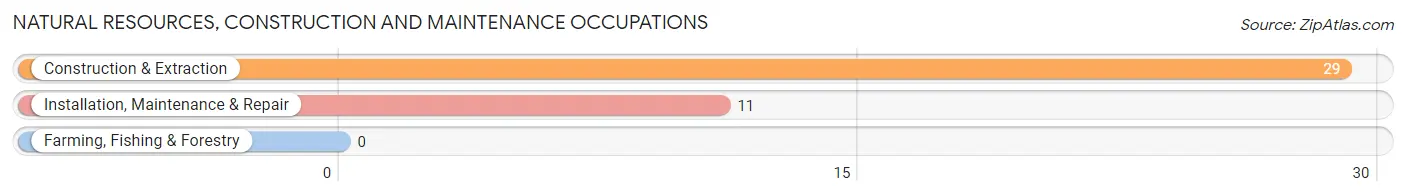
Natural Resources, Construction and Maintenance Occupations by Sex
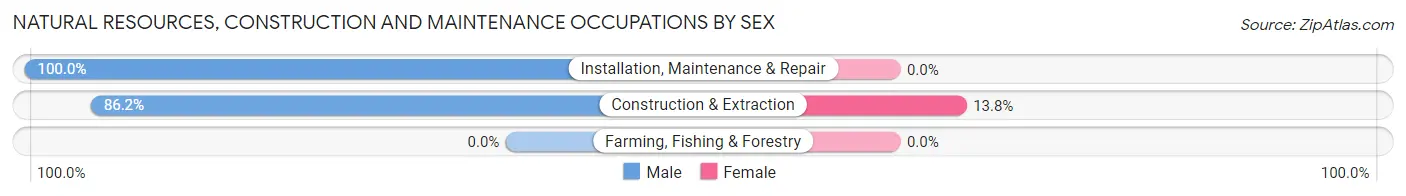
| Occupation | Male | Female |
| Farming, Fishing & Forestry | 0 (0.0%) | 0 (0.0%) |
| Construction & Extraction | 25 (86.2%) | 4 (13.8%) |
| Installation, Maintenance & Repair | 11 (100.0%) | 0 (0.0%) |
| Total (Category) | 36 (90.0%) | 4 (10.0%) |
| Total (Overall) | 418 (53.1%) | 369 (46.9%) |
Production, Transportation and Moving Occupations
The most common Production, Transportation and Moving occupations in Point Venture are Material Moving (22 | 2.8%), and Production (15 | 1.9%).
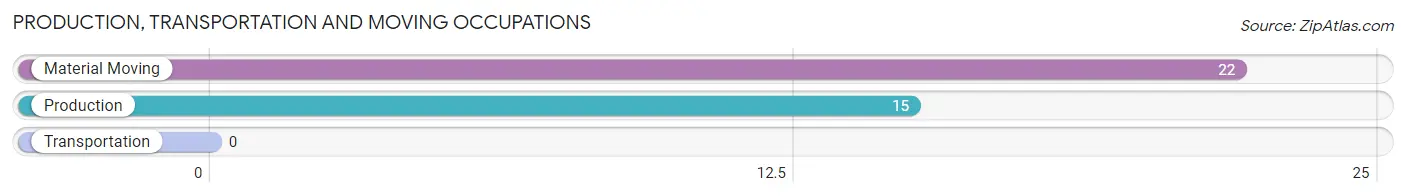
Production, Transportation and Moving Occupations by Sex
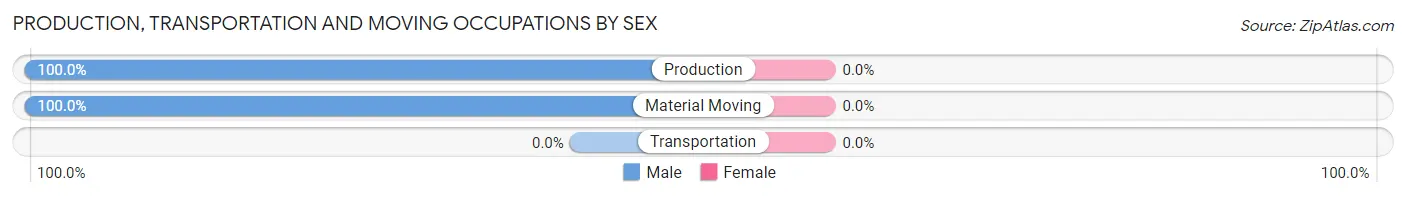
| Occupation | Male | Female |
| Production | 15 (100.0%) | 0 (0.0%) |
| Transportation | 0 (0.0%) | 0 (0.0%) |
| Material Moving | 22 (100.0%) | 0 (0.0%) |
| Total (Category) | 37 (100.0%) | 0 (0.0%) |
| Total (Overall) | 418 (53.1%) | 369 (46.9%) |
Employment Industries by Sex in Point Venture
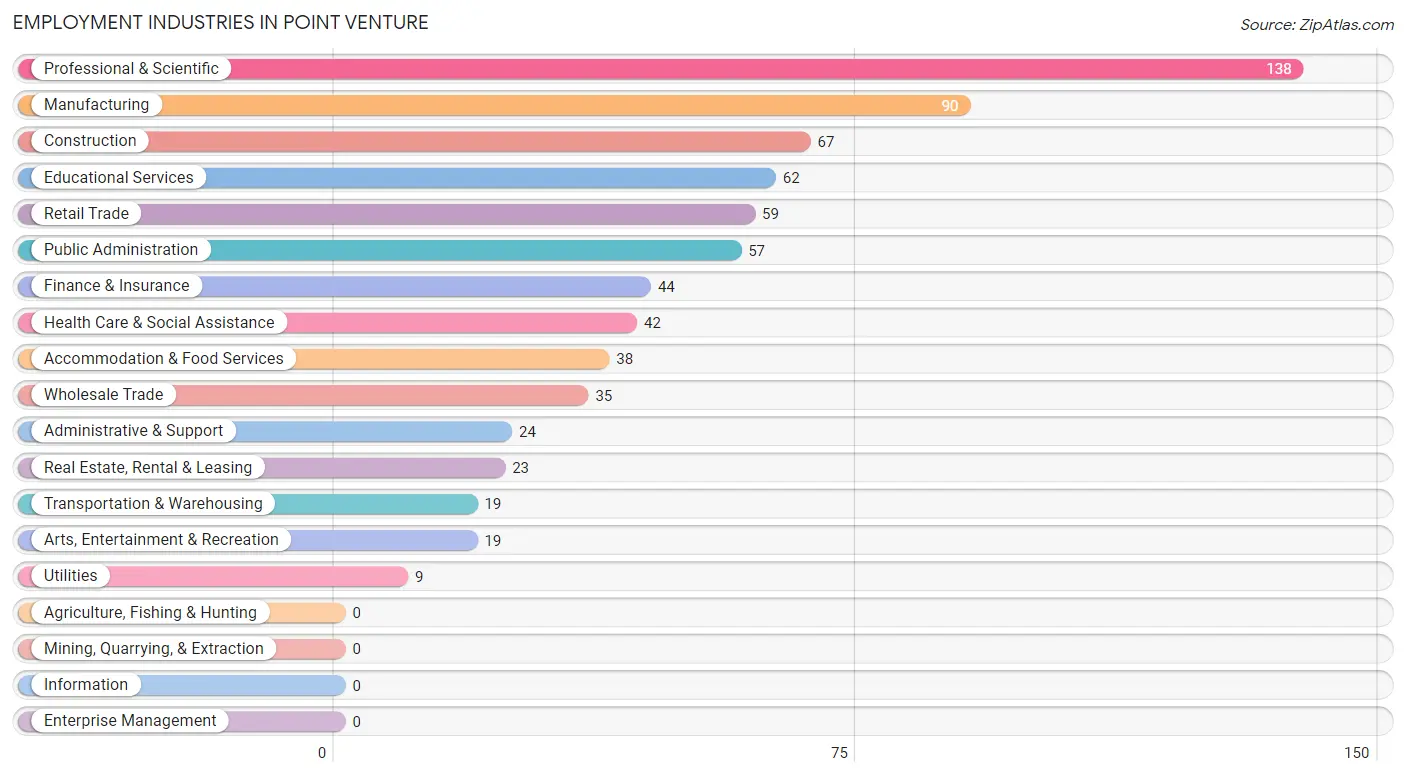
Employment Industries in Point Venture
The major employment industries in Point Venture include Professional & Scientific (138 | 17.5%), Manufacturing (90 | 11.4%), Construction (67 | 8.5%), Educational Services (62 | 7.9%), and Retail Trade (59 | 7.5%).
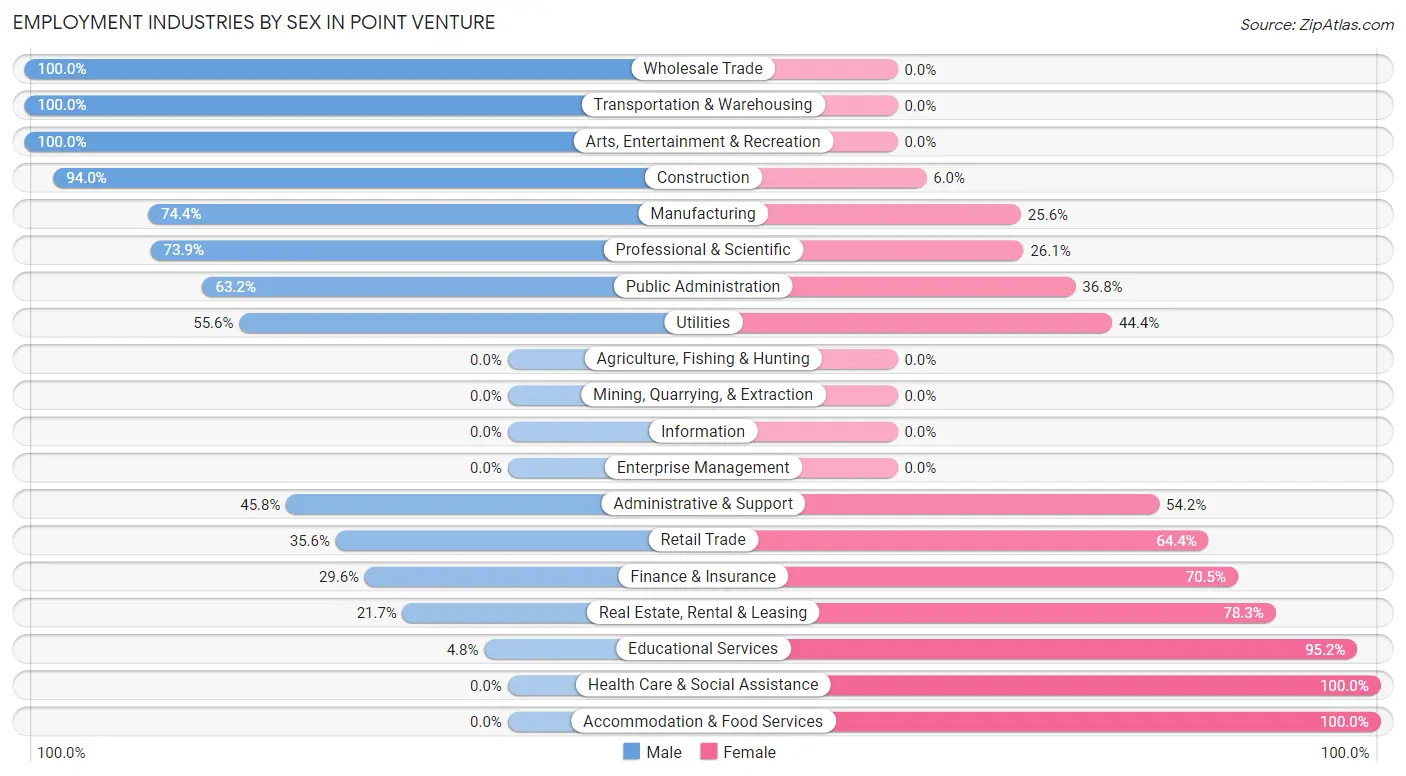
Employment Industries by Sex in Point Venture
The Point Venture industries that see more men than women are Wholesale Trade (100.0%), Transportation & Warehousing (100.0%), and Arts, Entertainment & Recreation (100.0%), whereas the industries that tend to have a higher number of women are Health Care & Social Assistance (100.0%), Accommodation & Food Services (100.0%), and Educational Services (95.2%).
| Industry | Male | Female |
| Agriculture, Fishing & Hunting | 0 (0.0%) | 0 (0.0%) |
| Mining, Quarrying, & Extraction | 0 (0.0%) | 0 (0.0%) |
| Construction | 63 (94.0%) | 4 (6.0%) |
| Manufacturing | 67 (74.4%) | 23 (25.6%) |
| Wholesale Trade | 35 (100.0%) | 0 (0.0%) |
| Retail Trade | 21 (35.6%) | 38 (64.4%) |
| Transportation & Warehousing | 19 (100.0%) | 0 (0.0%) |
| Utilities | 5 (55.6%) | 4 (44.4%) |
| Information | 0 (0.0%) | 0 (0.0%) |
| Finance & Insurance | 13 (29.5%) | 31 (70.5%) |
| Real Estate, Rental & Leasing | 5 (21.7%) | 18 (78.3%) |
| Professional & Scientific | 102 (73.9%) | 36 (26.1%) |
| Enterprise Management | 0 (0.0%) | 0 (0.0%) |
| Administrative & Support | 11 (45.8%) | 13 (54.2%) |
| Educational Services | 3 (4.8%) | 59 (95.2%) |
| Health Care & Social Assistance | 0 (0.0%) | 42 (100.0%) |
| Arts, Entertainment & Recreation | 19 (100.0%) | 0 (0.0%) |
| Accommodation & Food Services | 0 (0.0%) | 38 (100.0%) |
| Public Administration | 36 (63.2%) | 21 (36.8%) |
| Total | 418 (53.1%) | 369 (46.9%) |
Education in Point Venture
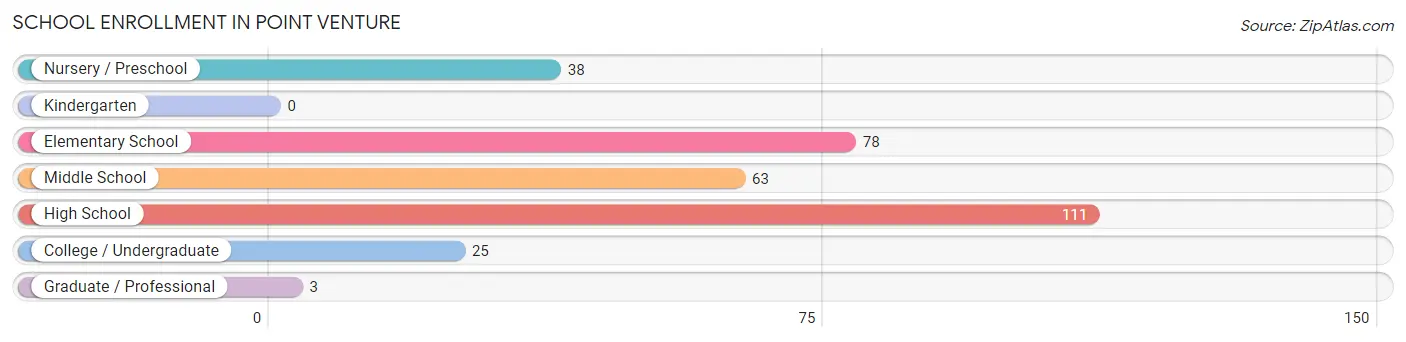
School Enrollment in Point Venture
The most common levels of schooling among the 318 students in Point Venture are high school (111 | 34.9%), elementary school (78 | 24.5%), and middle school (63 | 19.8%).
| School Level | # Students | % Students |
| Nursery / Preschool | 38 | 11.9% |
| Kindergarten | 0 | 0.0% |
| Elementary School | 78 | 24.5% |
| Middle School | 63 | 19.8% |
| High School | 111 | 34.9% |
| College / Undergraduate | 25 | 7.9% |
| Graduate / Professional | 3 | 0.9% |
| Total | 318 | 100.0% |
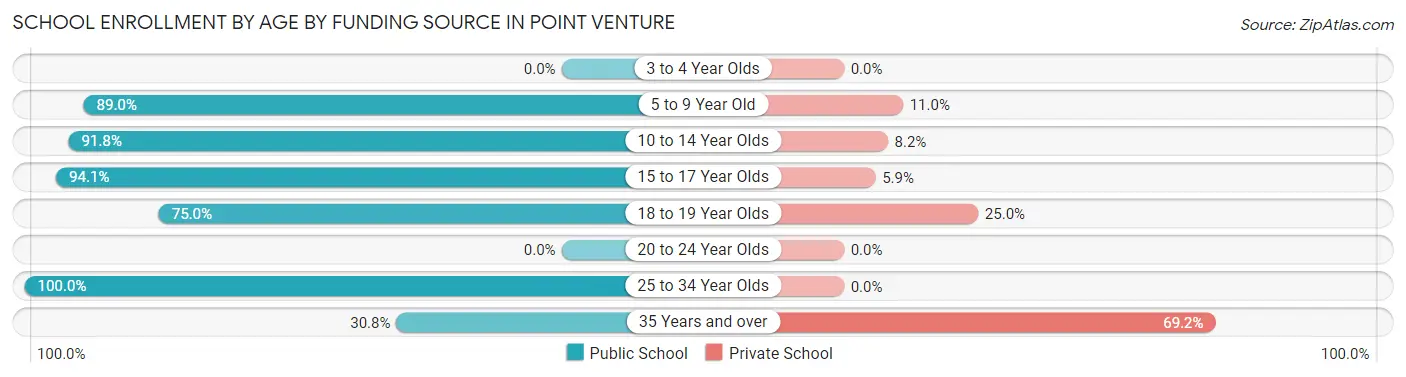
School Enrollment by Age by Funding Source in Point Venture
Out of a total of 318 students who are enrolled in schools in Point Venture, 39 (12.3%) attend a private institution, while the remaining 279 (87.7%) are enrolled in public schools. The age group of 35 years and over has the highest likelihood of being enrolled in private schools, with 9 (69.2% in the age bracket) enrolled. Conversely, the age group of 25 to 34 year olds has the lowest likelihood of being enrolled in a private school, with 3 (100.0% in the age bracket) attending a public institution.
| Age Bracket | Public School | Private School |
| 3 to 4 Year Olds | 0 (0.0%) | 0 (0.0%) |
| 5 to 9 Year Old | 89 (89.0%) | 11 (11.0%) |
| 10 to 14 Year Olds | 101 (91.8%) | 9 (8.2%) |
| 15 to 17 Year Olds | 64 (94.1%) | 4 (5.9%) |
| 18 to 19 Year Olds | 18 (75.0%) | 6 (25.0%) |
| 20 to 24 Year Olds | 0 (0.0%) | 0 (0.0%) |
| 25 to 34 Year Olds | 3 (100.0%) | 0 (0.0%) |
| 35 Years and over | 4 (30.8%) | 9 (69.2%) |
| Total | 279 (87.7%) | 39 (12.3%) |
Educational Attainment by Field of Study in Point Venture
Business (152 | 24.4%), education (103 | 16.5%), social sciences (100 | 16.1%), science & technology (60 | 9.6%), and arts & humanities (51 | 8.2%) are the most common fields of study among 623 individuals in Point Venture who have obtained a bachelor's degree or higher.
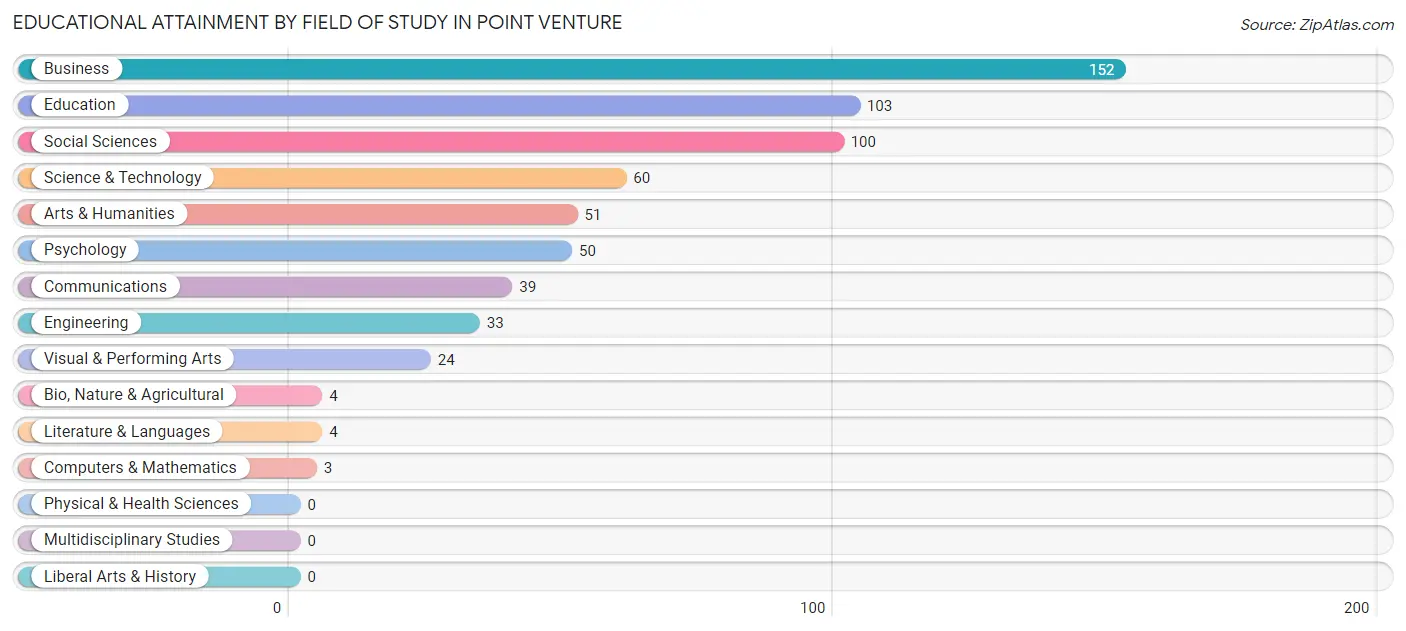
| Field of Study | # Graduates | % Graduates |
| Computers & Mathematics | 3 | 0.5% |
| Bio, Nature & Agricultural | 4 | 0.6% |
| Physical & Health Sciences | 0 | 0.0% |
| Psychology | 50 | 8.0% |
| Social Sciences | 100 | 16.1% |
| Engineering | 33 | 5.3% |
| Multidisciplinary Studies | 0 | 0.0% |
| Science & Technology | 60 | 9.6% |
| Business | 152 | 24.4% |
| Education | 103 | 16.5% |
| Literature & Languages | 4 | 0.6% |
| Liberal Arts & History | 0 | 0.0% |
| Visual & Performing Arts | 24 | 3.8% |
| Communications | 39 | 6.3% |
| Arts & Humanities | 51 | 8.2% |
| Total | 623 | 100.0% |
Transportation & Commute in Point Venture
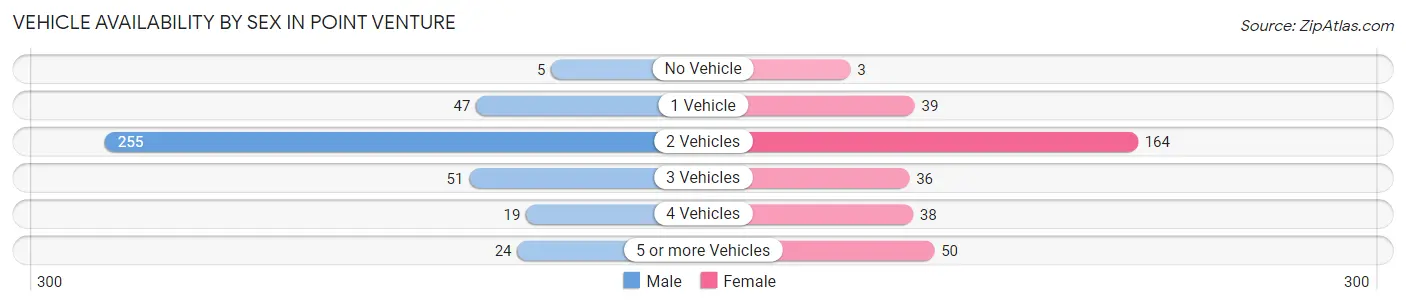
Vehicle Availability by Sex in Point Venture
The most prevalent vehicle ownership categories in Point Venture are males with 2 vehicles (255, accounting for 63.6%) and females with 2 vehicles (164, making up 77.3%).
| Vehicles Available | Male | Female |
| No Vehicle | 5 (1.3%) | 3 (0.9%) |
| 1 Vehicle | 47 (11.7%) | 39 (11.8%) |
| 2 Vehicles | 255 (63.6%) | 164 (49.7%) |
| 3 Vehicles | 51 (12.7%) | 36 (10.9%) |
| 4 Vehicles | 19 (4.7%) | 38 (11.5%) |
| 5 or more Vehicles | 24 (6.0%) | 50 (15.1%) |
| Total | 401 (100.0%) | 330 (100.0%) |
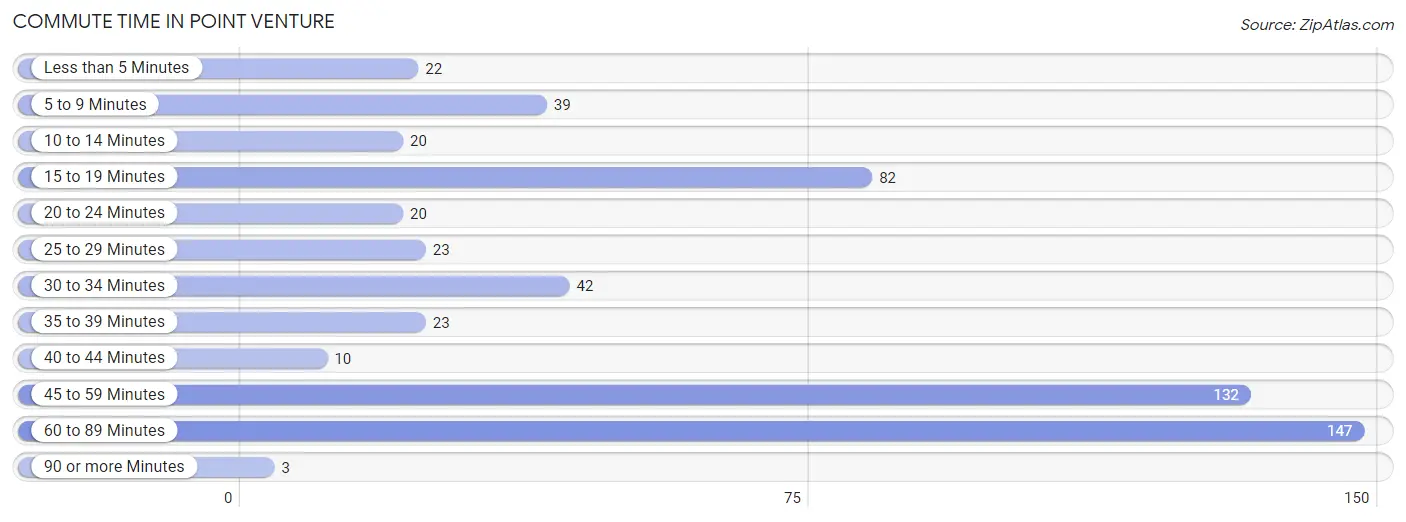
Commute Time in Point Venture
The most frequently occuring commute durations in Point Venture are 60 to 89 minutes (147 commuters, 26.1%), 45 to 59 minutes (132 commuters, 23.4%), and 15 to 19 minutes (82 commuters, 14.6%).
| Commute Time | # Commuters | % Commuters |
| Less than 5 Minutes | 22 | 3.9% |
| 5 to 9 Minutes | 39 | 6.9% |
| 10 to 14 Minutes | 20 | 3.5% |
| 15 to 19 Minutes | 82 | 14.6% |
| 20 to 24 Minutes | 20 | 3.5% |
| 25 to 29 Minutes | 23 | 4.1% |
| 30 to 34 Minutes | 42 | 7.5% |
| 35 to 39 Minutes | 23 | 4.1% |
| 40 to 44 Minutes | 10 | 1.8% |
| 45 to 59 Minutes | 132 | 23.4% |
| 60 to 89 Minutes | 147 | 26.1% |
| 90 or more Minutes | 3 | 0.5% |
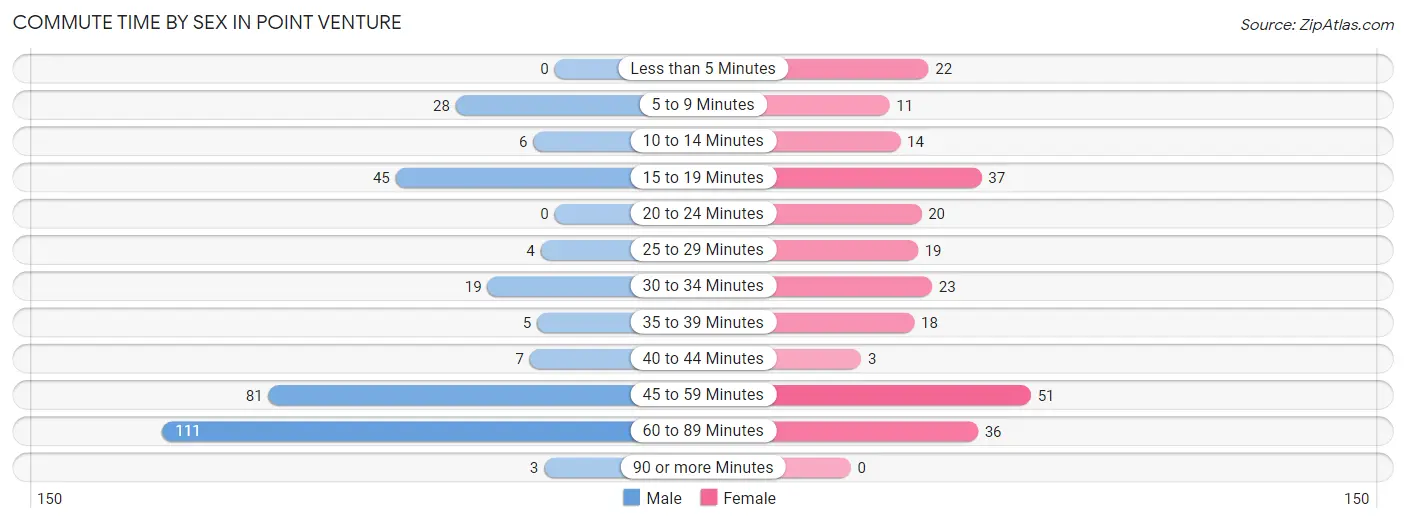
Commute Time by Sex in Point Venture
The most common commute times in Point Venture are 60 to 89 minutes (111 commuters, 35.9%) for males and 45 to 59 minutes (51 commuters, 20.1%) for females.
| Commute Time | Male | Female |
| Less than 5 Minutes | 0 (0.0%) | 22 (8.7%) |
| 5 to 9 Minutes | 28 (9.1%) | 11 (4.3%) |
| 10 to 14 Minutes | 6 (1.9%) | 14 (5.5%) |
| 15 to 19 Minutes | 45 (14.6%) | 37 (14.6%) |
| 20 to 24 Minutes | 0 (0.0%) | 20 (7.9%) |
| 25 to 29 Minutes | 4 (1.3%) | 19 (7.5%) |
| 30 to 34 Minutes | 19 (6.1%) | 23 (9.1%) |
| 35 to 39 Minutes | 5 (1.6%) | 18 (7.1%) |
| 40 to 44 Minutes | 7 (2.3%) | 3 (1.2%) |
| 45 to 59 Minutes | 81 (26.2%) | 51 (20.1%) |
| 60 to 89 Minutes | 111 (35.9%) | 36 (14.2%) |
| 90 or more Minutes | 3 (1.0%) | 0 (0.0%) |
Time of Departure to Work by Sex in Point Venture
The most frequent times of departure to work in Point Venture are 7:00 AM to 7:29 AM (155, 50.2%) for males and 6:00 AM to 6:29 AM (58, 22.8%) for females.
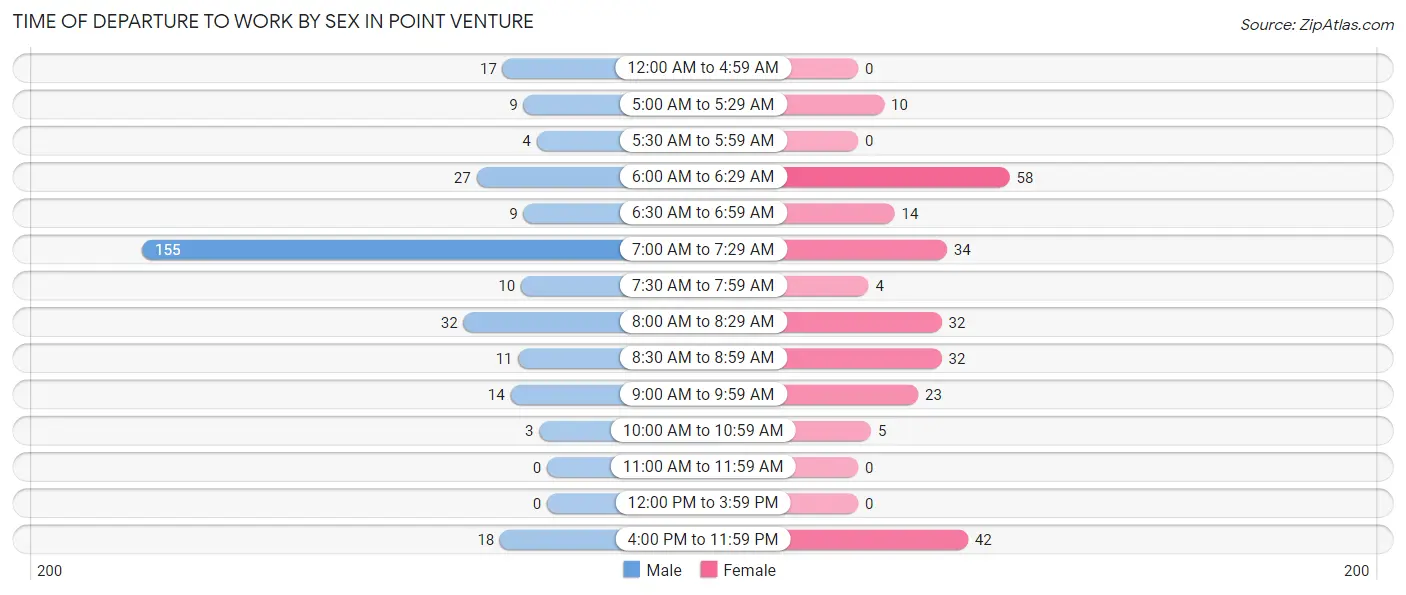
| Time of Departure | Male | Female |
| 12:00 AM to 4:59 AM | 17 (5.5%) | 0 (0.0%) |
| 5:00 AM to 5:29 AM | 9 (2.9%) | 10 (3.9%) |
| 5:30 AM to 5:59 AM | 4 (1.3%) | 0 (0.0%) |
| 6:00 AM to 6:29 AM | 27 (8.7%) | 58 (22.8%) |
| 6:30 AM to 6:59 AM | 9 (2.9%) | 14 (5.5%) |
| 7:00 AM to 7:29 AM | 155 (50.2%) | 34 (13.4%) |
| 7:30 AM to 7:59 AM | 10 (3.2%) | 4 (1.6%) |
| 8:00 AM to 8:29 AM | 32 (10.4%) | 32 (12.6%) |
| 8:30 AM to 8:59 AM | 11 (3.6%) | 32 (12.6%) |
| 9:00 AM to 9:59 AM | 14 (4.5%) | 23 (9.1%) |
| 10:00 AM to 10:59 AM | 3 (1.0%) | 5 (2.0%) |
| 11:00 AM to 11:59 AM | 0 (0.0%) | 0 (0.0%) |
| 12:00 PM to 3:59 PM | 0 (0.0%) | 0 (0.0%) |
| 4:00 PM to 11:59 PM | 18 (5.8%) | 42 (16.5%) |
| Total | 309 (100.0%) | 254 (100.0%) |
Housing Occupancy in Point Venture
Occupancy by Ownership in Point Venture
Of the total 633 dwellings in Point Venture, owner-occupied units account for 550 (86.9%), while renter-occupied units make up 83 (13.1%).
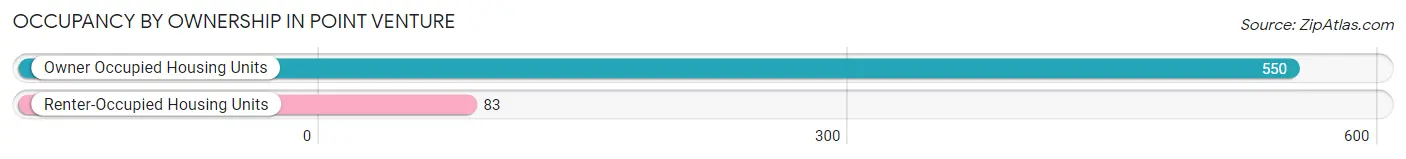
| Occupancy | # Housing Units | % Housing Units |
| Owner Occupied Housing Units | 550 | 86.9% |
| Renter-Occupied Housing Units | 83 | 13.1% |
| Total Occupied Housing Units | 633 | 100.0% |
Occupancy by Household Size in Point Venture
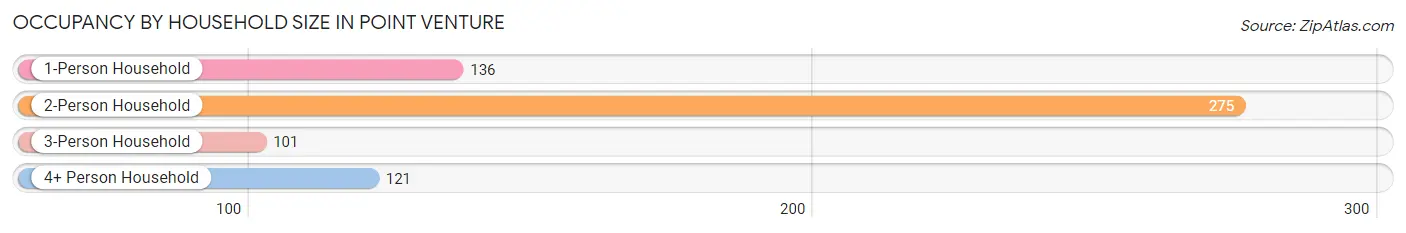
| Household Size | # Housing Units | % Housing Units |
| 1-Person Household | 136 | 21.5% |
| 2-Person Household | 275 | 43.4% |
| 3-Person Household | 101 | 16.0% |
| 4+ Person Household | 121 | 19.1% |
| Total Housing Units | 633 | 100.0% |
Occupancy by Ownership by Household Size in Point Venture
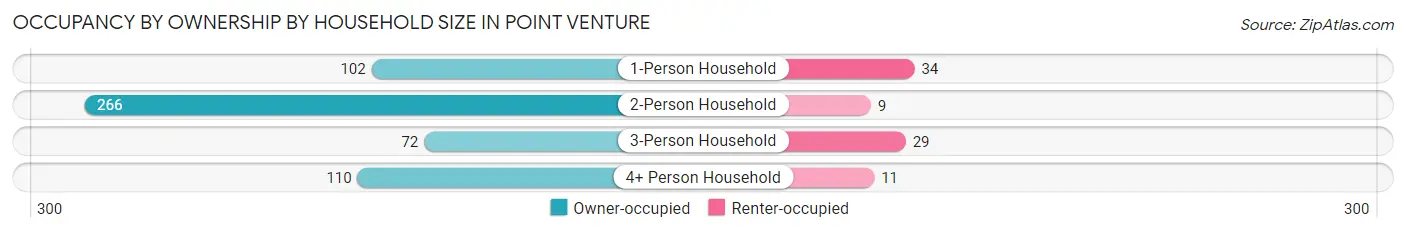
| Household Size | Owner-occupied | Renter-occupied |
| 1-Person Household | 102 (75.0%) | 34 (25.0%) |
| 2-Person Household | 266 (96.7%) | 9 (3.3%) |
| 3-Person Household | 72 (71.3%) | 29 (28.7%) |
| 4+ Person Household | 110 (90.9%) | 11 (9.1%) |
| Total Housing Units | 550 (86.9%) | 83 (13.1%) |
Occupancy by Educational Attainment in Point Venture
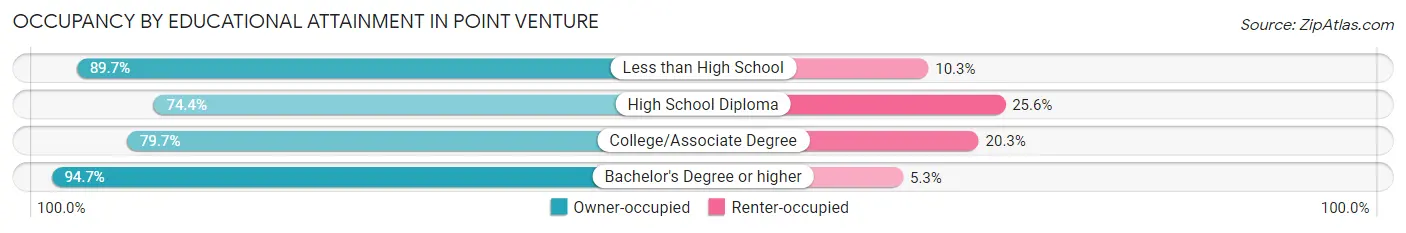
| Household Size | Owner-occupied | Renter-occupied |
| Less than High School | 26 (89.7%) | 3 (10.3%) |
| High School Diploma | 32 (74.4%) | 11 (25.6%) |
| College/Associate Degree | 208 (79.7%) | 53 (20.3%) |
| Bachelor's Degree or higher | 284 (94.7%) | 16 (5.3%) |
Occupancy by Age of Householder in Point Venture
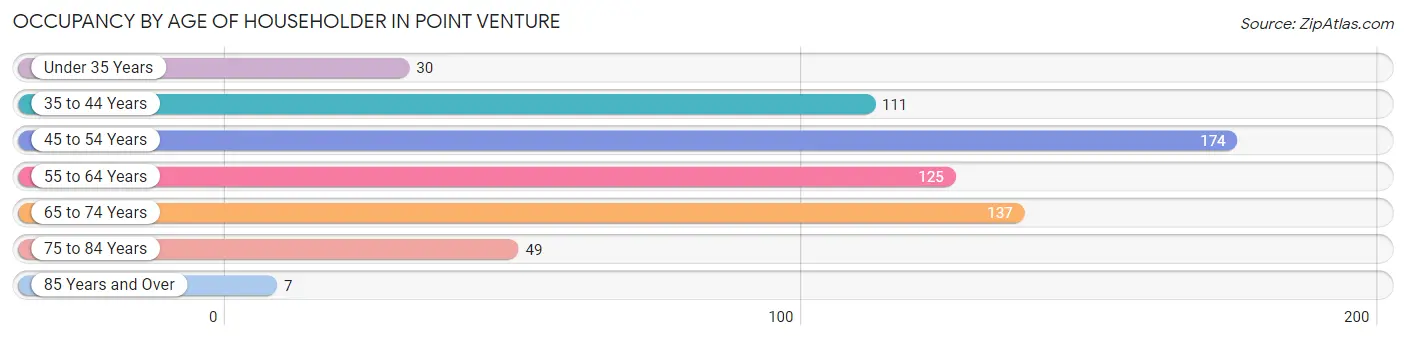
| Age Bracket | # Households | % Households |
| Under 35 Years | 30 | 4.7% |
| 35 to 44 Years | 111 | 17.5% |
| 45 to 54 Years | 174 | 27.5% |
| 55 to 64 Years | 125 | 19.8% |
| 65 to 74 Years | 137 | 21.6% |
| 75 to 84 Years | 49 | 7.7% |
| 85 Years and Over | 7 | 1.1% |
| Total | 633 | 100.0% |
Housing Finances in Point Venture
Median Income by Occupancy in Point Venture
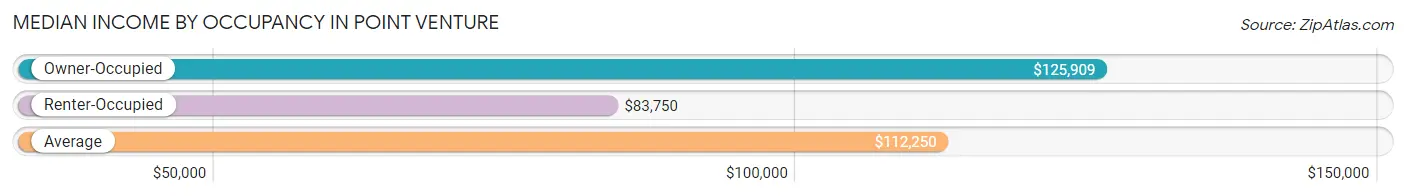
| Occupancy Type | # Households | Median Income |
| Owner-Occupied | 550 (86.9%) | $125,909 |
| Renter-Occupied | 83 (13.1%) | $83,750 |
| Average | 633 (100.0%) | $112,250 |
Occupancy by Householder Income Bracket in Point Venture
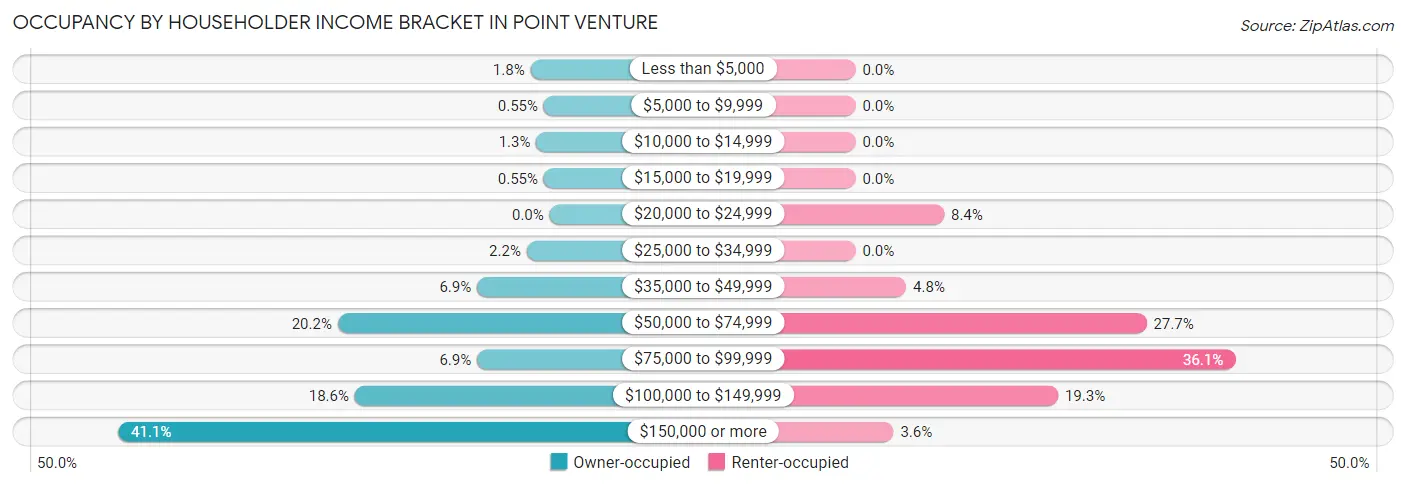
| Income Bracket | Owner-occupied | Renter-occupied |
| Less than $5,000 | 10 (1.8%) | 0 (0.0%) |
| $5,000 to $9,999 | 3 (0.5%) | 0 (0.0%) |
| $10,000 to $14,999 | 7 (1.3%) | 0 (0.0%) |
| $15,000 to $19,999 | 3 (0.5%) | 0 (0.0%) |
| $20,000 to $24,999 | 0 (0.0%) | 7 (8.4%) |
| $25,000 to $34,999 | 12 (2.2%) | 0 (0.0%) |
| $35,000 to $49,999 | 38 (6.9%) | 4 (4.8%) |
| $50,000 to $74,999 | 111 (20.2%) | 23 (27.7%) |
| $75,000 to $99,999 | 38 (6.9%) | 30 (36.1%) |
| $100,000 to $149,999 | 102 (18.5%) | 16 (19.3%) |
| $150,000 or more | 226 (41.1%) | 3 (3.6%) |
| Total | 550 (100.0%) | 83 (100.0%) |
Monthly Housing Cost Tiers in Point Venture
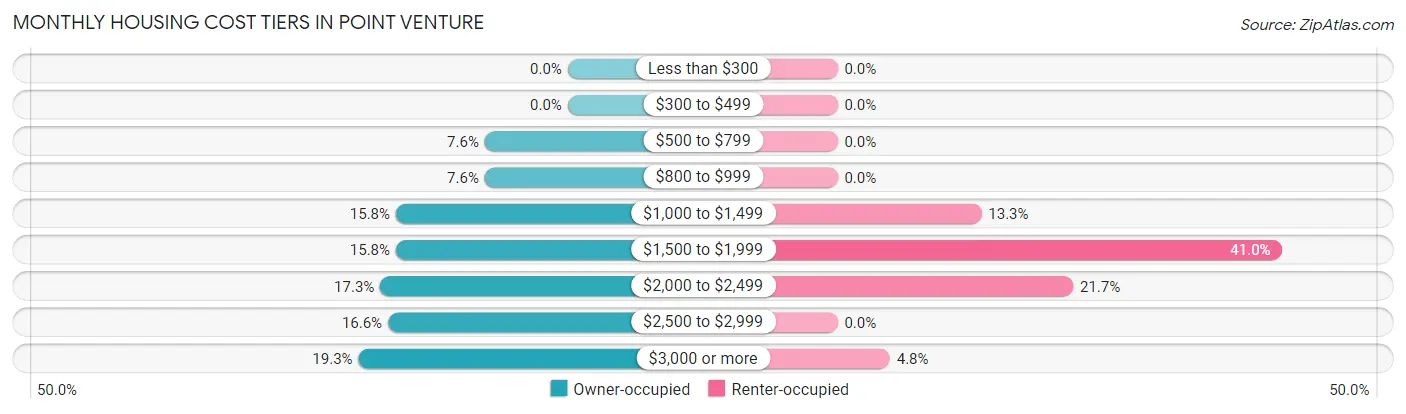
| Monthly Cost | Owner-occupied | Renter-occupied |
| Less than $300 | 0 (0.0%) | 0 (0.0%) |
| $300 to $499 | 0 (0.0%) | 0 (0.0%) |
| $500 to $799 | 42 (7.6%) | 0 (0.0%) |
| $800 to $999 | 42 (7.6%) | 0 (0.0%) |
| $1,000 to $1,499 | 87 (15.8%) | 11 (13.3%) |
| $1,500 to $1,999 | 87 (15.8%) | 34 (41.0%) |
| $2,000 to $2,499 | 95 (17.3%) | 18 (21.7%) |
| $2,500 to $2,999 | 91 (16.6%) | 0 (0.0%) |
| $3,000 or more | 106 (19.3%) | 4 (4.8%) |
| Total | 550 (100.0%) | 83 (100.0%) |
Physical Housing Characteristics in Point Venture
Housing Structures in Point Venture
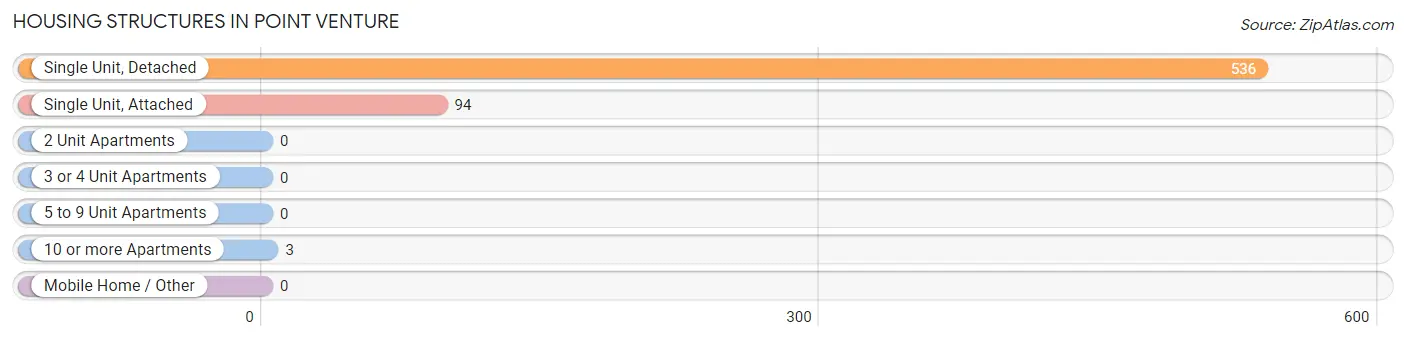
| Structure Type | # Housing Units | % Housing Units |
| Single Unit, Detached | 536 | 84.7% |
| Single Unit, Attached | 94 | 14.8% |
| 2 Unit Apartments | 0 | 0.0% |
| 3 or 4 Unit Apartments | 0 | 0.0% |
| 5 to 9 Unit Apartments | 0 | 0.0% |
| 10 or more Apartments | 3 | 0.5% |
| Mobile Home / Other | 0 | 0.0% |
| Total | 633 | 100.0% |
Housing Structures by Occupancy in Point Venture
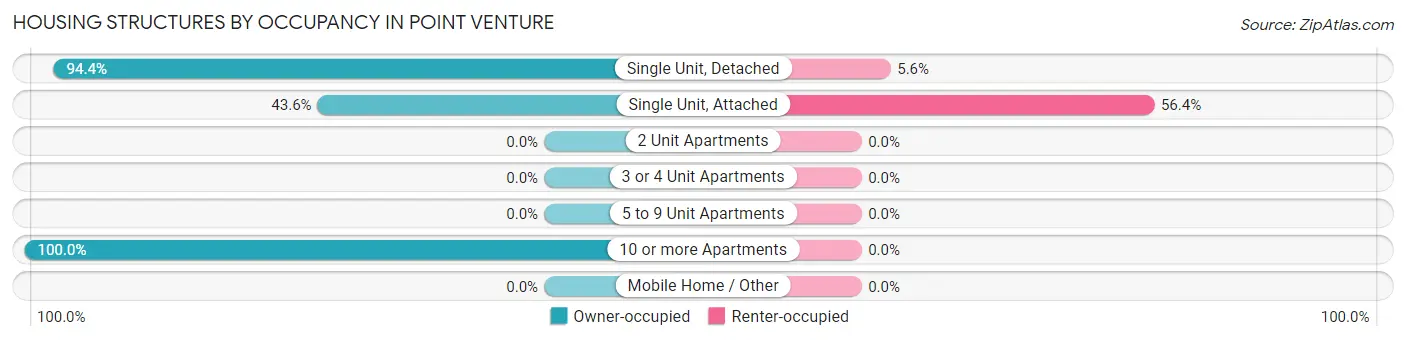
| Structure Type | Owner-occupied | Renter-occupied |
| Single Unit, Detached | 506 (94.4%) | 30 (5.6%) |
| Single Unit, Attached | 41 (43.6%) | 53 (56.4%) |
| 2 Unit Apartments | 0 (0.0%) | 0 (0.0%) |
| 3 or 4 Unit Apartments | 0 (0.0%) | 0 (0.0%) |
| 5 to 9 Unit Apartments | 0 (0.0%) | 0 (0.0%) |
| 10 or more Apartments | 3 (100.0%) | 0 (0.0%) |
| Mobile Home / Other | 0 (0.0%) | 0 (0.0%) |
| Total | 550 (86.9%) | 83 (13.1%) |
Housing Structures by Number of Rooms in Point Venture
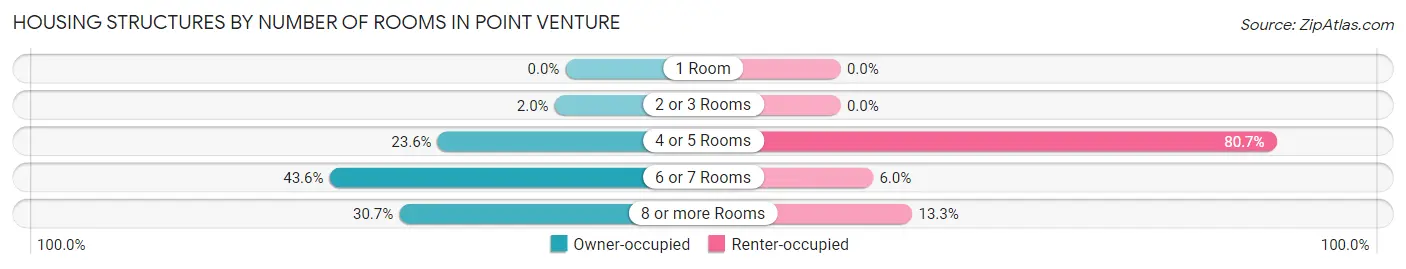
| Number of Rooms | Owner-occupied | Renter-occupied |
| 1 Room | 0 (0.0%) | 0 (0.0%) |
| 2 or 3 Rooms | 11 (2.0%) | 0 (0.0%) |
| 4 or 5 Rooms | 130 (23.6%) | 67 (80.7%) |
| 6 or 7 Rooms | 240 (43.6%) | 5 (6.0%) |
| 8 or more Rooms | 169 (30.7%) | 11 (13.3%) |
| Total | 550 (100.0%) | 83 (100.0%) |
Housing Structure by Heating Type in Point Venture
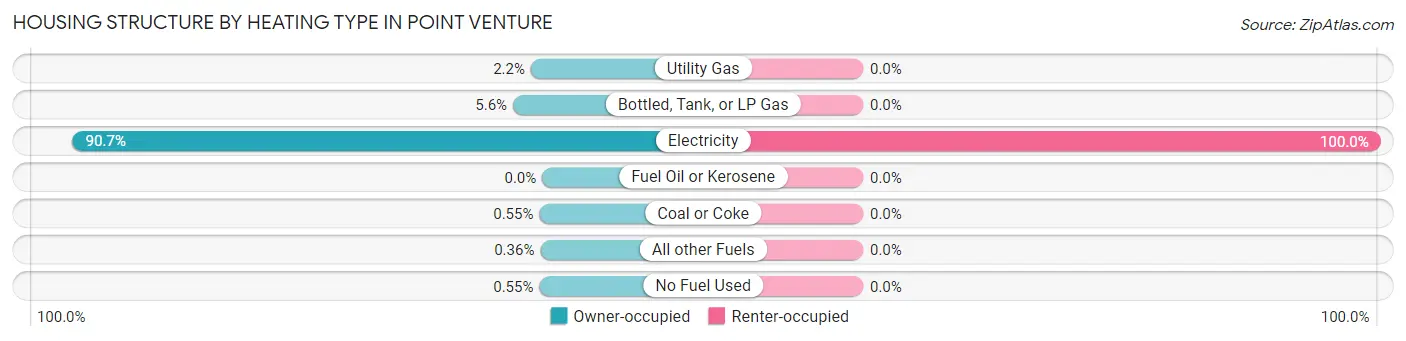
| Heating Type | Owner-occupied | Renter-occupied |
| Utility Gas | 12 (2.2%) | 0 (0.0%) |
| Bottled, Tank, or LP Gas | 31 (5.6%) | 0 (0.0%) |
| Electricity | 499 (90.7%) | 83 (100.0%) |
| Fuel Oil or Kerosene | 0 (0.0%) | 0 (0.0%) |
| Coal or Coke | 3 (0.5%) | 0 (0.0%) |
| All other Fuels | 2 (0.4%) | 0 (0.0%) |
| No Fuel Used | 3 (0.5%) | 0 (0.0%) |
| Total | 550 (100.0%) | 83 (100.0%) |
Household Vehicle Usage in Point Venture
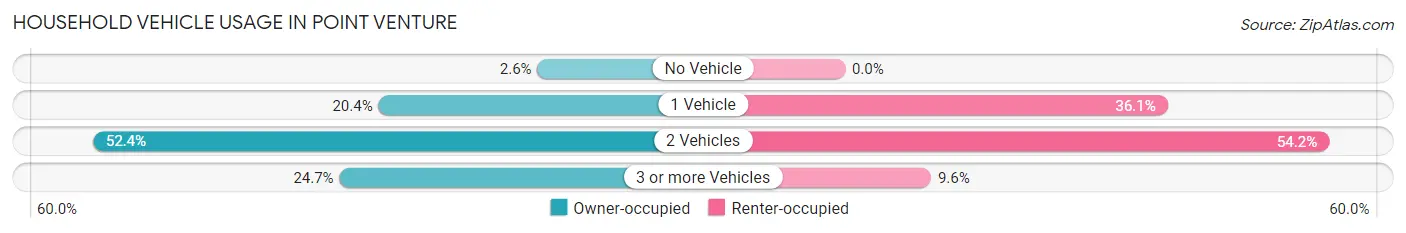
| Vehicles per Household | Owner-occupied | Renter-occupied |
| No Vehicle | 14 (2.5%) | 0 (0.0%) |
| 1 Vehicle | 112 (20.4%) | 30 (36.1%) |
| 2 Vehicles | 288 (52.4%) | 45 (54.2%) |
| 3 or more Vehicles | 136 (24.7%) | 8 (9.6%) |
| Total | 550 (100.0%) | 83 (100.0%) |
Real Estate & Mortgages in Point Venture
Real Estate and Mortgage Overview in Point Venture
| Characteristic | Without Mortgage | With Mortgage |
| Housing Units | 159 | 391 |
| Median Property Value | $389,200 | $388,200 |
| Median Household Income | $110,795 | $157 |
| Monthly Housing Costs | $998 | $102 |
| Real Estate Taxes | $7,377 | $18 |
Property Value by Mortgage Status in Point Venture
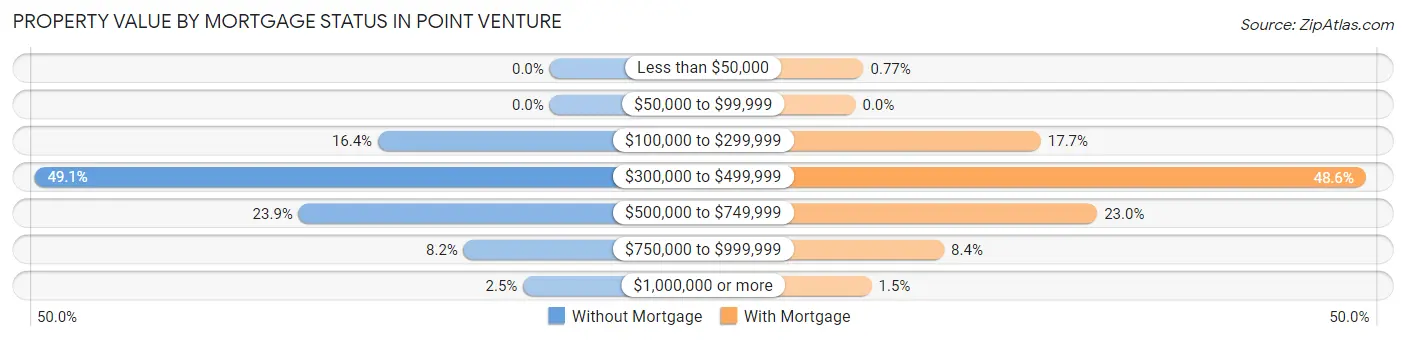
| Property Value | Without Mortgage | With Mortgage |
| Less than $50,000 | 0 (0.0%) | 3 (0.8%) |
| $50,000 to $99,999 | 0 (0.0%) | 0 (0.0%) |
| $100,000 to $299,999 | 26 (16.4%) | 69 (17.6%) |
| $300,000 to $499,999 | 78 (49.1%) | 190 (48.6%) |
| $500,000 to $749,999 | 38 (23.9%) | 90 (23.0%) |
| $750,000 to $999,999 | 13 (8.2%) | 33 (8.4%) |
| $1,000,000 or more | 4 (2.5%) | 6 (1.5%) |
| Total | 159 (100.0%) | 391 (100.0%) |
Household Income by Mortgage Status in Point Venture
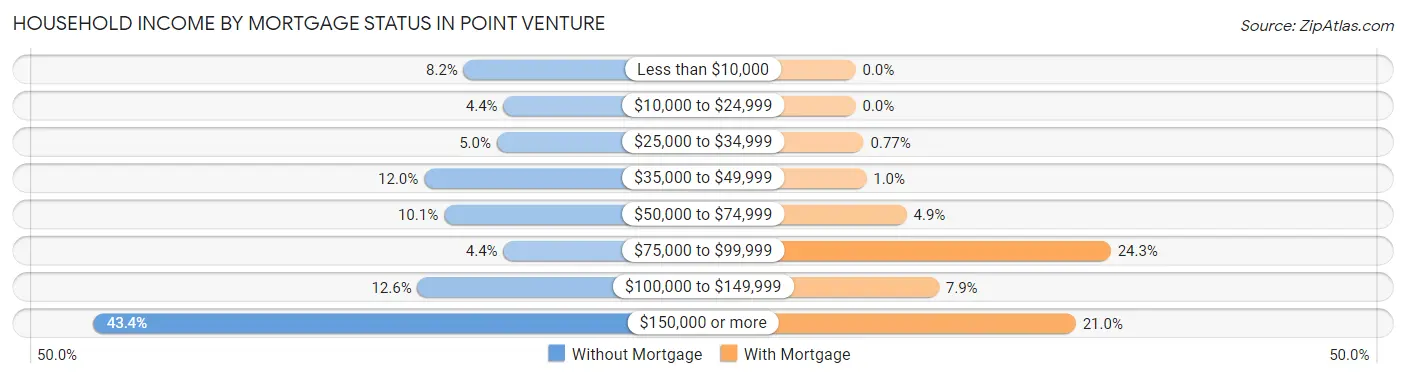
| Household Income | Without Mortgage | With Mortgage |
| Less than $10,000 | 13 (8.2%) | 0 (0.0%) |
| $10,000 to $24,999 | 7 (4.4%) | 0 (0.0%) |
| $25,000 to $34,999 | 8 (5.0%) | 3 (0.8%) |
| $35,000 to $49,999 | 19 (11.9%) | 4 (1.0%) |
| $50,000 to $74,999 | 16 (10.1%) | 19 (4.9%) |
| $75,000 to $99,999 | 7 (4.4%) | 95 (24.3%) |
| $100,000 to $149,999 | 20 (12.6%) | 31 (7.9%) |
| $150,000 or more | 69 (43.4%) | 82 (21.0%) |
| Total | 159 (100.0%) | 391 (100.0%) |
Property Value to Household Income Ratio in Point Venture
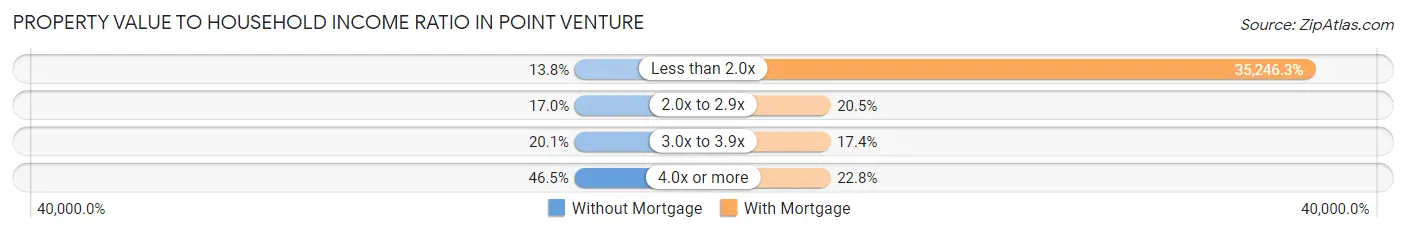
| Value-to-Income Ratio | Without Mortgage | With Mortgage |
| Less than 2.0x | 22 (13.8%) | 137,813 (35,246.3%) |
| 2.0x to 2.9x | 27 (17.0%) | 80 (20.5%) |
| 3.0x to 3.9x | 32 (20.1%) | 68 (17.4%) |
| 4.0x or more | 74 (46.5%) | 89 (22.8%) |
| Total | 159 (100.0%) | 391 (100.0%) |
Real Estate Taxes by Mortgage Status in Point Venture
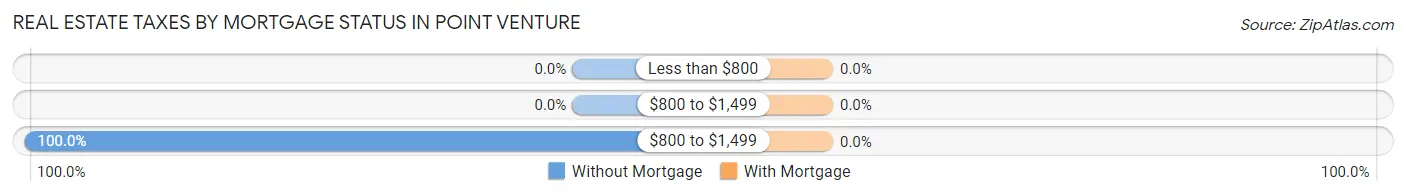
| Property Taxes | Without Mortgage | With Mortgage |
| Less than $800 | 0 (0.0%) | 0 (0.0%) |
| $800 to $1,499 | 0 (0.0%) | 0 (0.0%) |
| $800 to $1,499 | 159 (100.0%) | 0 (0.0%) |
| Total | 159 (100.0%) | 391 (100.0%) |
Health & Disability in Point Venture
Health Insurance Coverage by Age in Point Venture
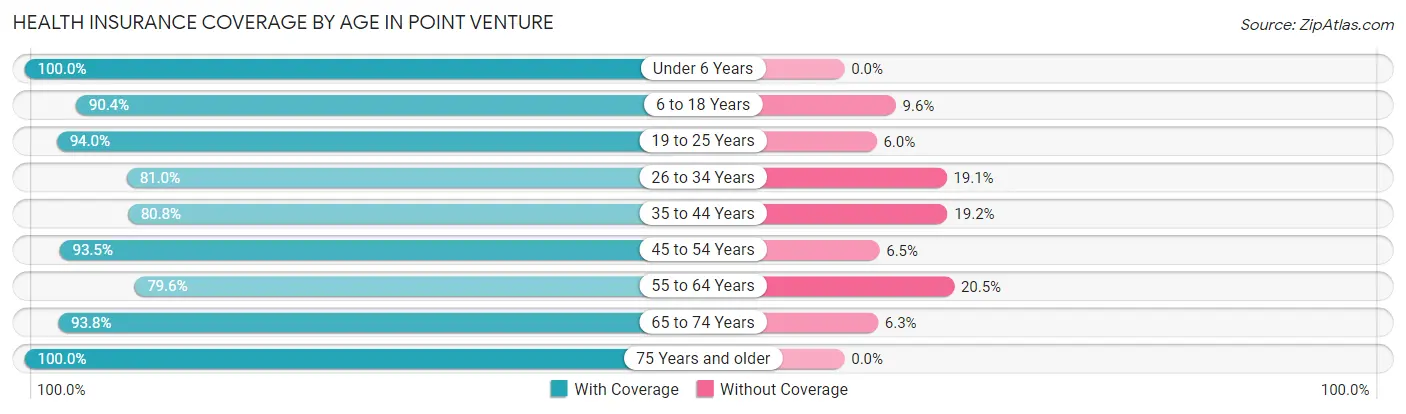
| Age Bracket | With Coverage | Without Coverage |
| Under 6 Years | 55 (100.0%) | 0 (0.0%) |
| 6 to 18 Years | 255 (90.4%) | 27 (9.6%) |
| 19 to 25 Years | 47 (94.0%) | 3 (6.0%) |
| 26 to 34 Years | 51 (80.9%) | 12 (19.1%) |
| 35 to 44 Years | 210 (80.8%) | 50 (19.2%) |
| 45 to 54 Years | 258 (93.5%) | 18 (6.5%) |
| 55 to 64 Years | 175 (79.5%) | 45 (20.4%) |
| 65 to 74 Years | 210 (93.8%) | 14 (6.2%) |
| 75 Years and older | 89 (100.0%) | 0 (0.0%) |
| Total | 1,350 (88.9%) | 169 (11.1%) |
Health Insurance Coverage by Citizenship Status in Point Venture
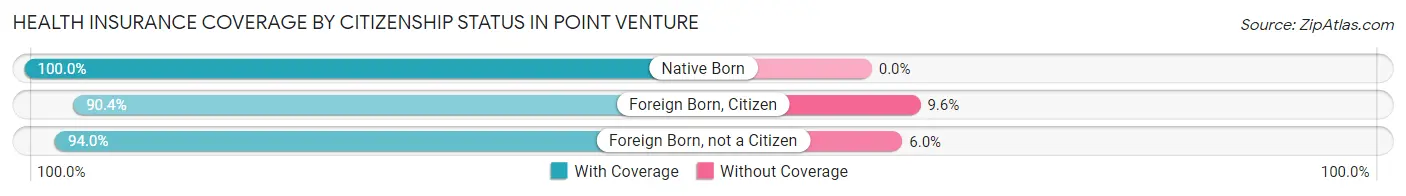
| Citizenship Status | With Coverage | Without Coverage |
| Native Born | 55 (100.0%) | 0 (0.0%) |
| Foreign Born, Citizen | 255 (90.4%) | 27 (9.6%) |
| Foreign Born, not a Citizen | 47 (94.0%) | 3 (6.0%) |
Health Insurance Coverage by Household Income in Point Venture
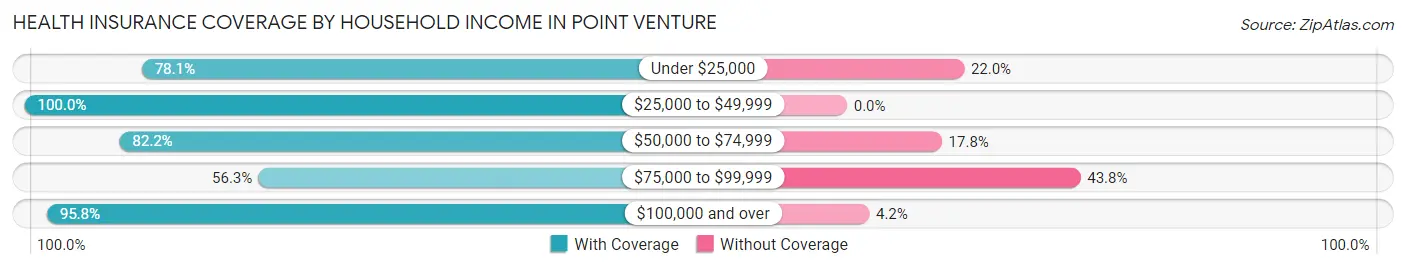
| Household Income | With Coverage | Without Coverage |
| Under $25,000 | 32 (78.0%) | 9 (22.0%) |
| $25,000 to $49,999 | 100 (100.0%) | 0 (0.0%) |
| $50,000 to $74,999 | 199 (82.2%) | 43 (17.8%) |
| $75,000 to $99,999 | 99 (56.2%) | 77 (43.8%) |
| $100,000 and over | 920 (95.8%) | 40 (4.2%) |
Public vs Private Health Insurance Coverage by Age in Point Venture
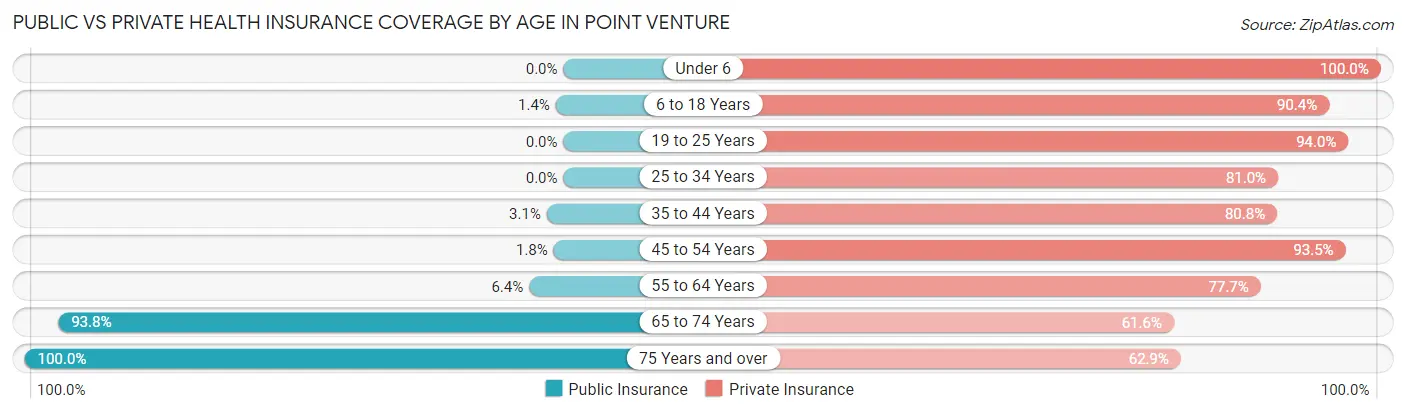
| Age Bracket | Public Insurance | Private Insurance |
| Under 6 | 0 (0.0%) | 55 (100.0%) |
| 6 to 18 Years | 4 (1.4%) | 255 (90.4%) |
| 19 to 25 Years | 0 (0.0%) | 47 (94.0%) |
| 25 to 34 Years | 0 (0.0%) | 51 (80.9%) |
| 35 to 44 Years | 8 (3.1%) | 210 (80.8%) |
| 45 to 54 Years | 5 (1.8%) | 258 (93.5%) |
| 55 to 64 Years | 14 (6.4%) | 171 (77.7%) |
| 65 to 74 Years | 210 (93.8%) | 138 (61.6%) |
| 75 Years and over | 89 (100.0%) | 56 (62.9%) |
| Total | 330 (21.7%) | 1,241 (81.7%) |
Disability Status by Sex by Age in Point Venture
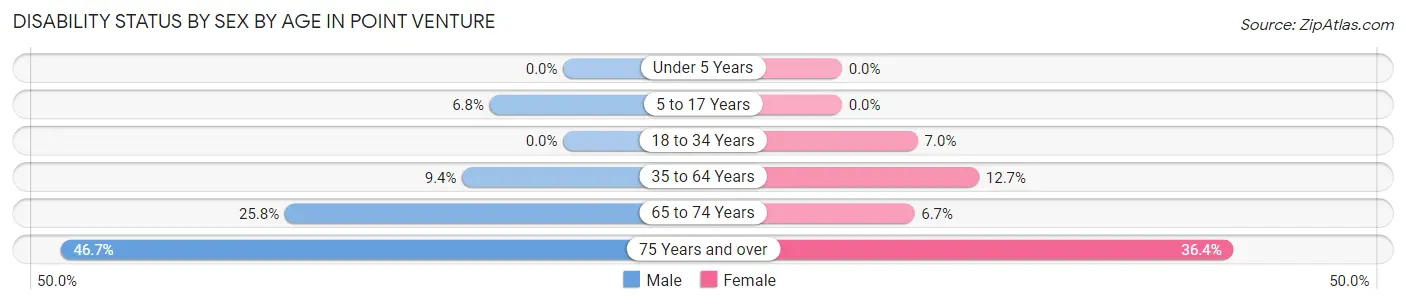
| Age Bracket | Male | Female |
| Under 5 Years | 0 (0.0%) | 0 (0.0%) |
| 5 to 17 Years | 11 (6.8%) | 0 (0.0%) |
| 18 to 34 Years | 0 (0.0%) | 5 (7.0%) |
| 35 to 64 Years | 34 (9.4%) | 50 (12.7%) |
| 65 to 74 Years | 31 (25.8%) | 7 (6.7%) |
| 75 Years and over | 21 (46.7%) | 16 (36.4%) |
Disability Class by Sex by Age in Point Venture
Disability Class: Hearing Difficulty
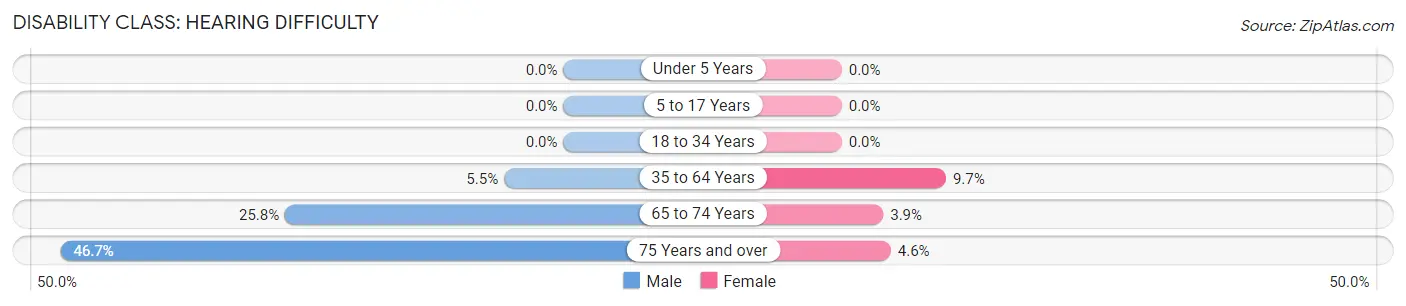
| Age Bracket | Male | Female |
| Under 5 Years | 0 (0.0%) | 0 (0.0%) |
| 5 to 17 Years | 0 (0.0%) | 0 (0.0%) |
| 18 to 34 Years | 0 (0.0%) | 0 (0.0%) |
| 35 to 64 Years | 20 (5.5%) | 38 (9.7%) |
| 65 to 74 Years | 31 (25.8%) | 4 (3.8%) |
| 75 Years and over | 21 (46.7%) | 2 (4.5%) |
Disability Class: Vision Difficulty
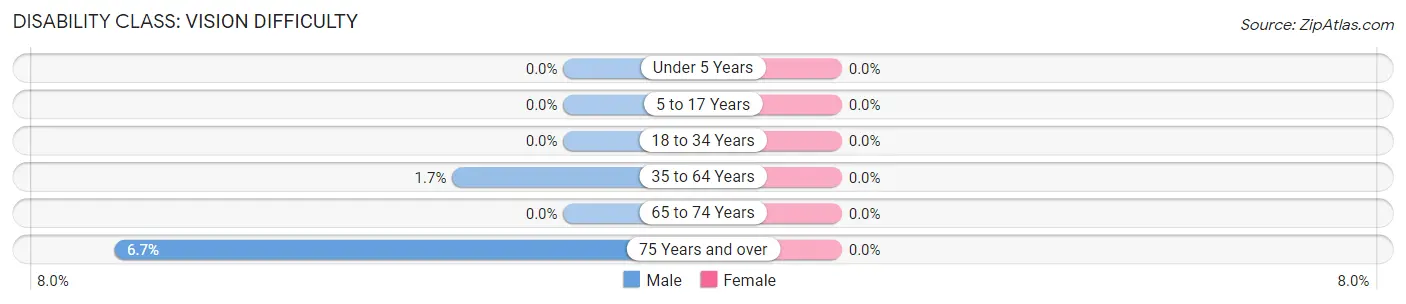
| Age Bracket | Male | Female |
| Under 5 Years | 0 (0.0%) | 0 (0.0%) |
| 5 to 17 Years | 0 (0.0%) | 0 (0.0%) |
| 18 to 34 Years | 0 (0.0%) | 0 (0.0%) |
| 35 to 64 Years | 6 (1.7%) | 0 (0.0%) |
| 65 to 74 Years | 0 (0.0%) | 0 (0.0%) |
| 75 Years and over | 3 (6.7%) | 0 (0.0%) |
Disability Class: Cognitive Difficulty
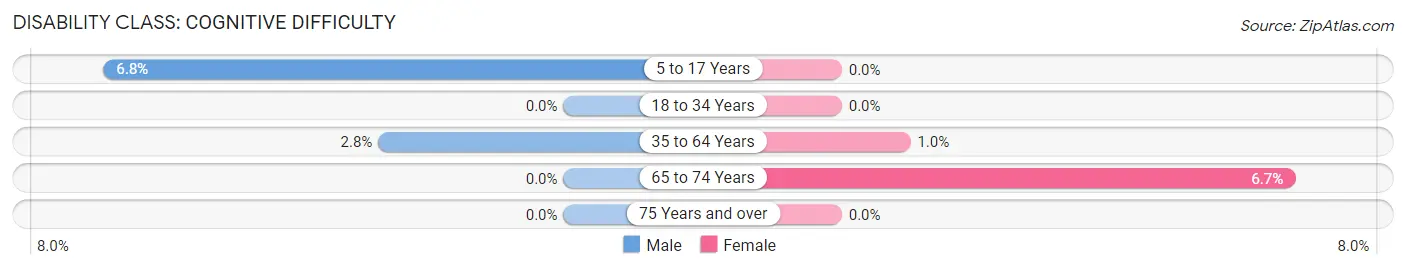
| Age Bracket | Male | Female |
| 5 to 17 Years | 11 (6.8%) | 0 (0.0%) |
| 18 to 34 Years | 0 (0.0%) | 0 (0.0%) |
| 35 to 64 Years | 10 (2.8%) | 4 (1.0%) |
| 65 to 74 Years | 0 (0.0%) | 7 (6.7%) |
| 75 Years and over | 0 (0.0%) | 0 (0.0%) |
Disability Class: Ambulatory Difficulty
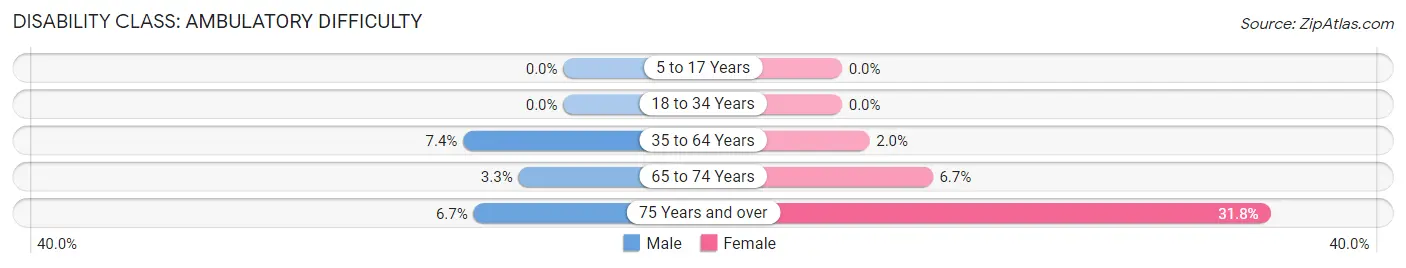
| Age Bracket | Male | Female |
| 5 to 17 Years | 0 (0.0%) | 0 (0.0%) |
| 18 to 34 Years | 0 (0.0%) | 0 (0.0%) |
| 35 to 64 Years | 27 (7.4%) | 8 (2.0%) |
| 65 to 74 Years | 4 (3.3%) | 7 (6.7%) |
| 75 Years and over | 3 (6.7%) | 14 (31.8%) |
Disability Class: Self-Care Difficulty
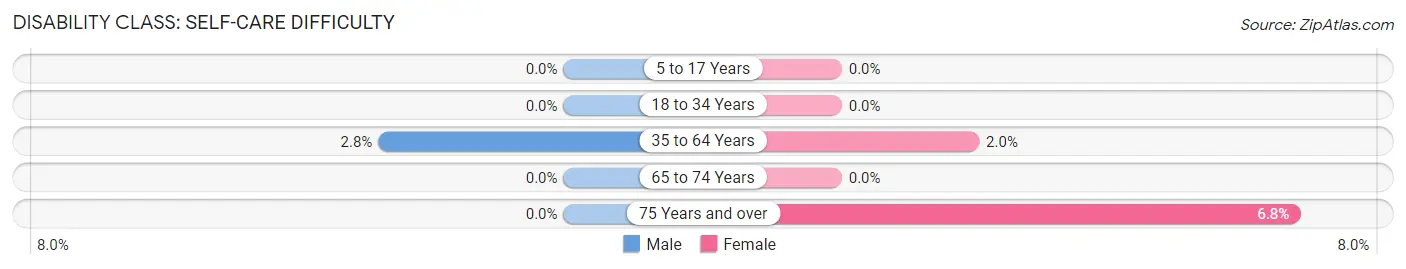
| Age Bracket | Male | Female |
| 5 to 17 Years | 0 (0.0%) | 0 (0.0%) |
| 18 to 34 Years | 0 (0.0%) | 0 (0.0%) |
| 35 to 64 Years | 10 (2.8%) | 8 (2.0%) |
| 65 to 74 Years | 0 (0.0%) | 0 (0.0%) |
| 75 Years and over | 0 (0.0%) | 3 (6.8%) |
Technology Access in Point Venture
Computing Device Access in Point Venture
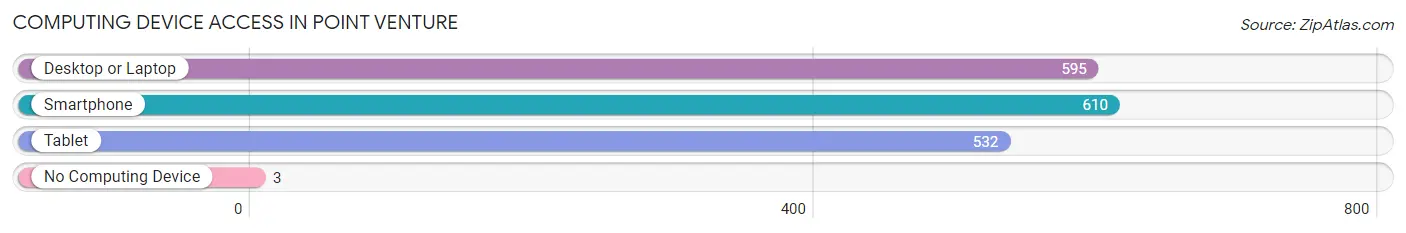
| Device Type | # Households | % Households |
| Desktop or Laptop | 595 | 94.0% |
| Smartphone | 610 | 96.4% |
| Tablet | 532 | 84.0% |
| No Computing Device | 3 | 0.5% |
| Total | 633 | 100.0% |
Internet Access in Point Venture
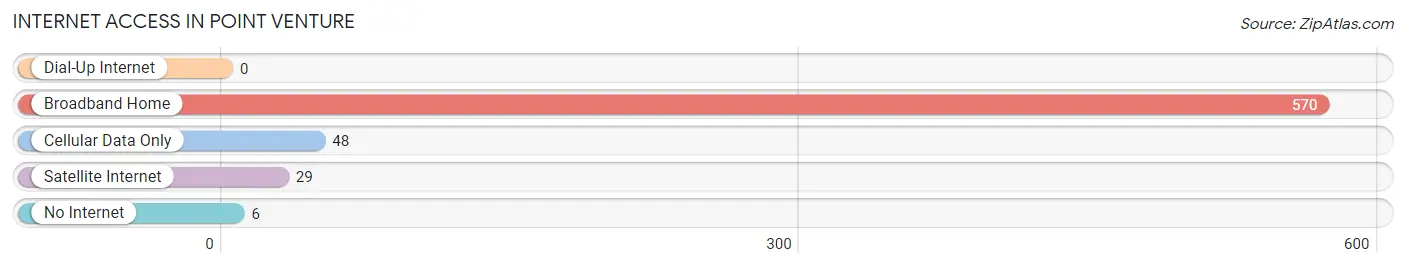
| Internet Type | # Households | % Households |
| Dial-Up Internet | 0 | 0.0% |
| Broadband Home | 570 | 90.0% |
| Cellular Data Only | 48 | 7.6% |
| Satellite Internet | 29 | 4.6% |
| No Internet | 6 | 0.9% |
| Total | 633 | 100.0% |
Point Venture Summary
Point Venture, TX is a small town located in Travis County, Texas, United States. It is situated on the north shore of Lake Travis, about 25 miles northwest of Austin. The population was 1,093 at the 2010 census.
History
Point Venture was founded in the late 1800s by German immigrants who were looking for a place to settle and start a new life. The town was originally called “Point” because of its location at the tip of a peninsula on Lake Travis. The name was later changed to “Point Venture” to reflect the spirit of adventure and exploration that the settlers brought with them.
The town was officially incorporated in 1965 and has since grown to become a popular destination for tourists and locals alike. The town is known for its beautiful views of Lake Travis and its many outdoor activities, such as fishing, boating, and swimming.
Geography
Point Venture is located at 30°31'25" North, 97°56'45" West (30.523607, -97.945862). It is situated on the north shore of Lake Travis, about 25 miles northwest of Austin. The town has a total area of 1.2 square miles, all of which is land.
Economy
The economy of Point Venture is largely based on tourism. The town is a popular destination for visitors looking to enjoy the lake and its many outdoor activities. The town also has a few small businesses, such as restaurants, bars, and shops.
Demographics
As of the 2010 census, there were 1,093 people, 441 households, and 315 families residing in the town. The population density was 908.3 people per square mile. The racial makeup of the town was 94.2% White, 0.7% African American, 0.2% Native American, 0.7% Asian, 0.1% Pacific Islander, 2.2% from other races, and 2.0% from two or more races. Hispanic or Latino of any race were 6.2% of the population.
The median income for a household in the town was $50,000, and the median income for a family was $60,000. Males had a median income of $45,000 versus $30,000 for females. The per capita income for the town was $25,000. About 4.2% of families and 5.7% of the population were below the poverty line, including 6.3% of those under age 18 and 4.2% of those age 65 or over.
Common Questions
What is Per Capita Income in Point Venture?
Per Capita income in Point Venture is $60,202.
What is the Median Family Income in Point Venture?
Median Family Income in Point Venture is $137,500.
What is the Median Household income in Point Venture?
Median Household Income in Point Venture is $112,250.
What is Income or Wage Gap in Point Venture?
Income or Wage Gap in Point Venture is 34.8%.
Women in Point Venture earn 65.2 cents for every dollar earned by a man.
What is Inequality or Gini Index in Point Venture?
Inequality or Gini Index in Point Venture is 0.40.
What is the Total Population of Point Venture?
Total Population of Point Venture is 1,521.
What is the Total Male Population of Point Venture?
Total Male Population of Point Venture is 774.
What is the Total Female Population of Point Venture?
Total Female Population of Point Venture is 747.
What is the Ratio of Males per 100 Females in Point Venture?
There are 103.61 Males per 100 Females in Point Venture.
What is the Ratio of Females per 100 Males in Point Venture?
There are 96.51 Females per 100 Males in Point Venture.
What is the Median Population Age in Point Venture?
Median Population Age in Point Venture is 47.1 Years.
What is the Average Family Size in Point Venture
Average Family Size in Point Venture is 2.8 People.
What is the Average Household Size in Point Venture
Average Household Size in Point Venture is 2.4 People.
How Large is the Labor Force in Point Venture?
There are 827 People in the Labor Forcein in Point Venture.
What is the Percentage of People in the Labor Force in Point Venture?
64.5% of People are in the Labor Force in Point Venture.
What is the Unemployment Rate in Point Venture?
Unemployment Rate in Point Venture is 4.6%.