Hornsby Bend, TX Map & Demographics
Hornsby Bend Map
Hornsby Bend Overview
$40,327
PER CAPITA INCOME
$81,683
AVG FAMILY INCOME
$81,775
AVG HOUSEHOLD INCOME
10.7%
WAGE / INCOME GAP [ % ]
89.3¢/ $1
WAGE / INCOME GAP [ $ ]
$19,174
FAMILY INCOME DEFICIT
0.45
INEQUALITY / GINI INDEX
11,031
TOTAL POPULATION
5,284
MALE POPULATION
5,747
FEMALE POPULATION
91.94
MALES / 100 FEMALES
108.76
FEMALES / 100 MALES
36.4
MEDIAN AGE
3.1
AVG FAMILY SIZE
2.9
AVG HOUSEHOLD SIZE
6,348
LABOR FORCE [ PEOPLE ]
71.7%
PERCENT IN LABOR FORCE
1.6%
UNEMPLOYMENT RATE
Income in Hornsby Bend
Income Overview in Hornsby Bend
Per Capita Income in Hornsby Bend is $40,327, while median incomes of families and households are $81,683 and $81,775 respectively.
| Characteristic | Number | Measure |
| Per Capita Income | 11,031 | $40,327 |
| Median Family Income | 2,943 | $81,683 |
| Mean Family Income | 2,943 | $109,224 |
| Median Household Income | 3,830 | $81,775 |
| Mean Household Income | 3,830 | $115,290 |
| Income Deficit | 2,943 | $19,174 |
| Wage / Income Gap (%) | 11,031 | 10.73% |
| Wage / Income Gap ($) | 11,031 | 89.27¢ per $1 |
| Gini / Inequality Index | 11,031 | 0.45 |
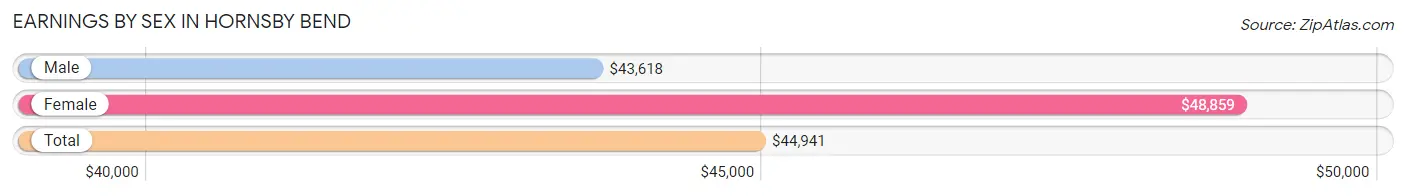
Earnings by Sex in Hornsby Bend
Average Earnings in Hornsby Bend are $44,941, $43,618 for men and $48,859 for women, a difference of 10.7%.
| Sex | Number | Average Earnings |
| Male | 3,163 (49.1%) | $43,618 |
| Female | 3,281 (50.9%) | $48,859 |
| Total | 6,444 (100.0%) | $44,941 |
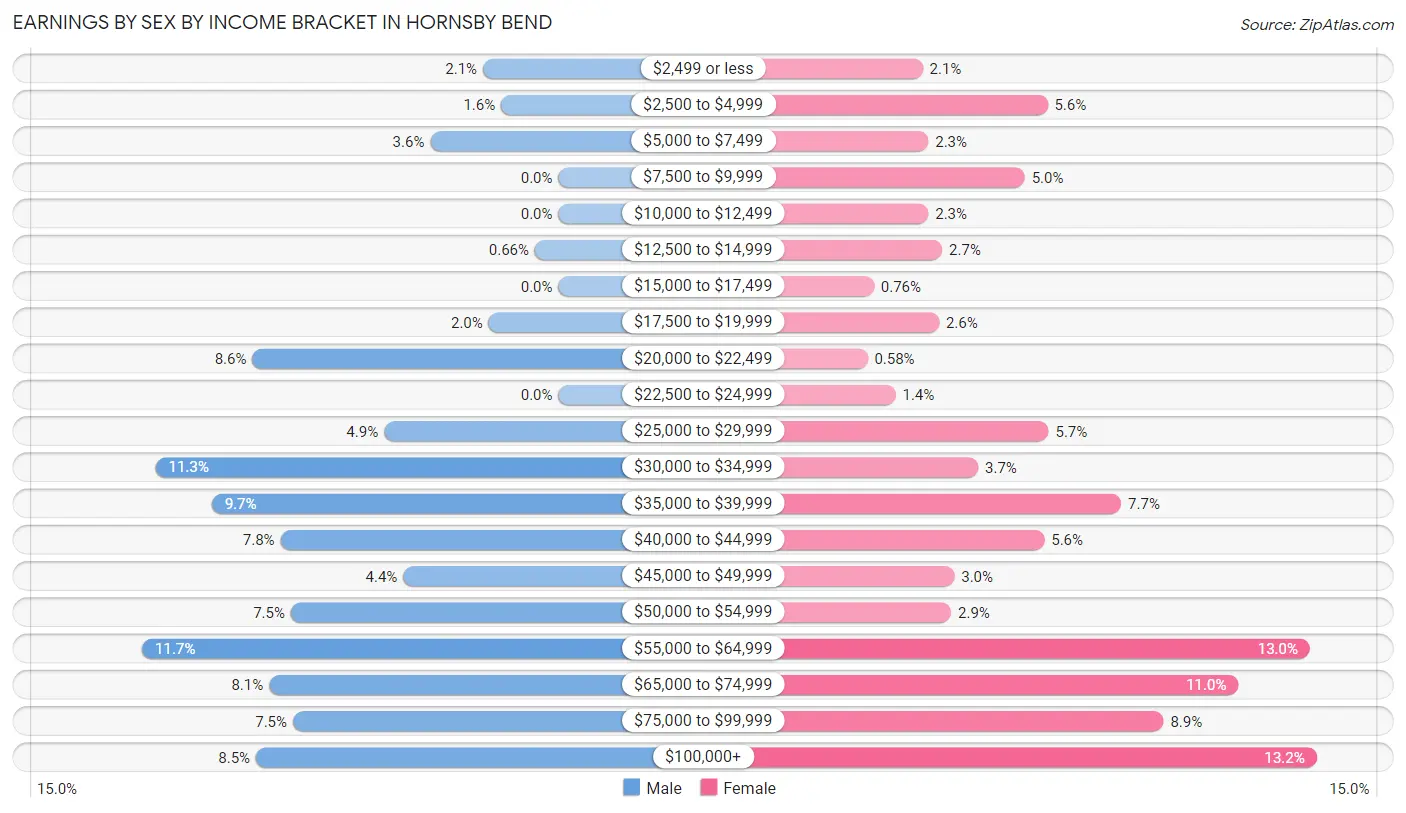
Earnings by Sex by Income Bracket in Hornsby Bend
The most common earnings brackets in Hornsby Bend are $55,000 to $64,999 for men (370 | 11.7%) and $100,000+ for women (433 | 13.2%).
| Income | Male | Female |
| $2,499 or less | 67 (2.1%) | 70 (2.1%) |
| $2,500 to $4,999 | 51 (1.6%) | 185 (5.6%) |
| $5,000 to $7,499 | 114 (3.6%) | 75 (2.3%) |
| $7,500 to $9,999 | 0 (0.0%) | 164 (5.0%) |
| $10,000 to $12,499 | 0 (0.0%) | 75 (2.3%) |
| $12,500 to $14,999 | 21 (0.7%) | 88 (2.7%) |
| $15,000 to $17,499 | 0 (0.0%) | 25 (0.8%) |
| $17,500 to $19,999 | 62 (2.0%) | 85 (2.6%) |
| $20,000 to $22,499 | 272 (8.6%) | 19 (0.6%) |
| $22,500 to $24,999 | 0 (0.0%) | 45 (1.4%) |
| $25,000 to $29,999 | 155 (4.9%) | 186 (5.7%) |
| $30,000 to $34,999 | 358 (11.3%) | 121 (3.7%) |
| $35,000 to $39,999 | 308 (9.7%) | 253 (7.7%) |
| $40,000 to $44,999 | 247 (7.8%) | 182 (5.6%) |
| $45,000 to $49,999 | 138 (4.4%) | 99 (3.0%) |
| $50,000 to $54,999 | 238 (7.5%) | 96 (2.9%) |
| $55,000 to $64,999 | 370 (11.7%) | 427 (13.0%) |
| $65,000 to $74,999 | 257 (8.1%) | 361 (11.0%) |
| $75,000 to $99,999 | 236 (7.5%) | 292 (8.9%) |
| $100,000+ | 269 (8.5%) | 433 (13.2%) |
| Total | 3,163 (100.0%) | 3,281 (100.0%) |
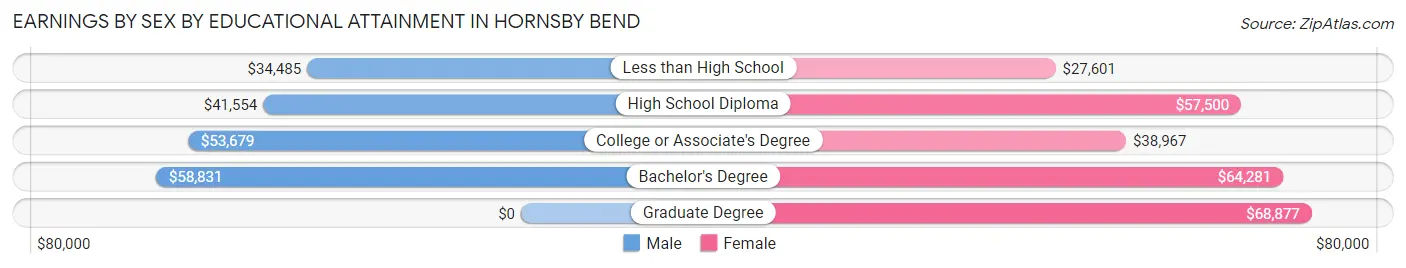
Earnings by Sex by Educational Attainment in Hornsby Bend
Average earnings in Hornsby Bend are $46,842 for men and $55,057 for women, a difference of 14.9%. Men with an educational attainment of bachelor's degree enjoy the highest average annual earnings of $58,831, while those with less than high school education earn the least with $34,485. Women with an educational attainment of graduate degree earn the most with the average annual earnings of $68,877, while those with less than high school education have the smallest earnings of $27,601.
| Educational Attainment | Male Income | Female Income |
| Less than High School | $34,485 | $27,601 |
| High School Diploma | $41,554 | $57,500 |
| College or Associate's Degree | $53,679 | $38,967 |
| Bachelor's Degree | $58,831 | $64,281 |
| Graduate Degree | - | - |
| Total | $46,842 | $55,057 |
Family Income in Hornsby Bend
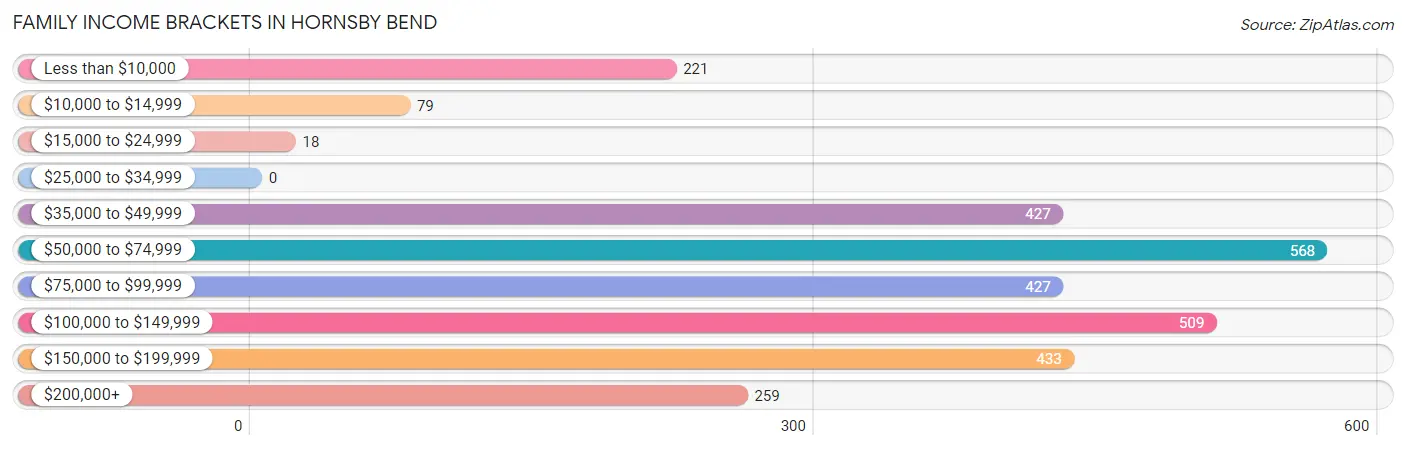
Family Income Brackets in Hornsby Bend
According to the Hornsby Bend family income data, there are 568 families falling into the $50,000 to $74,999 income range, which is the most common income bracket and makes up 19.3% of all families.
| Income Bracket | # Families | % Families |
| Less than $10,000 | 221 | 7.5% |
| $10,000 to $14,999 | 79 | 2.7% |
| $15,000 to $24,999 | 18 | 0.6% |
| $25,000 to $34,999 | 0 | 0.0% |
| $35,000 to $49,999 | 427 | 14.5% |
| $50,000 to $74,999 | 568 | 19.3% |
| $75,000 to $99,999 | 427 | 14.5% |
| $100,000 to $149,999 | 509 | 17.3% |
| $150,000 to $199,999 | 433 | 14.7% |
| $200,000+ | 259 | 8.8% |
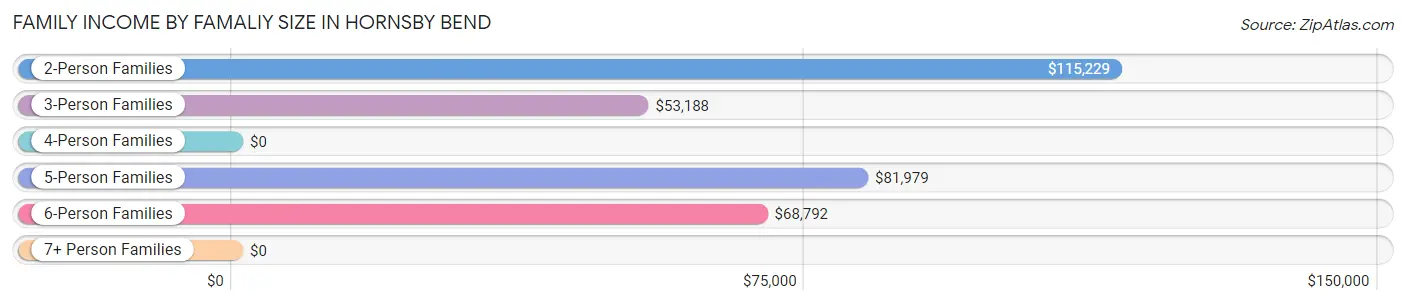
Family Income by Famaliy Size in Hornsby Bend
2-person families (1,281 | 43.5%) account for the highest median family income in Hornsby Bend with $115,229 per family, while 2-person families (1,281 | 43.5%) have the highest median income of $57,614 per family member.
| Income Bracket | # Families | Median Income |
| 2-Person Families | 1,281 (43.5%) | $115,229 |
| 3-Person Families | 643 (21.8%) | $53,188 |
| 4-Person Families | 380 (12.9%) | $0 |
| 5-Person Families | 442 (15.0%) | $81,979 |
| 6-Person Families | 168 (5.7%) | $68,792 |
| 7+ Person Families | 29 (1.0%) | $0 |
| Total | 2,943 (100.0%) | $81,683 |
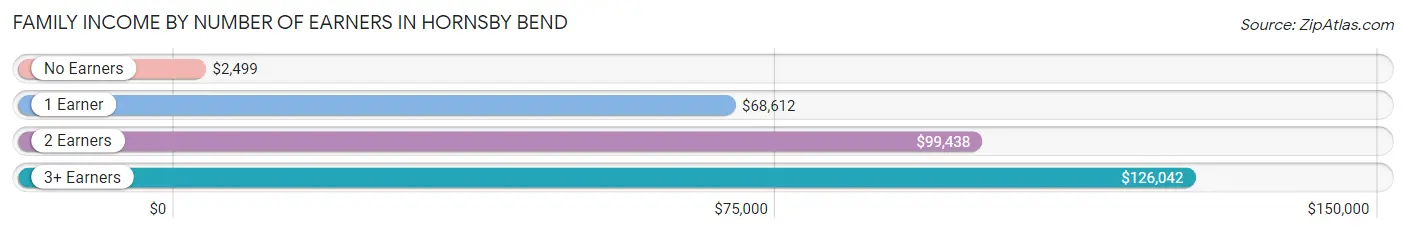
Family Income by Number of Earners in Hornsby Bend
The median family income in Hornsby Bend is $81,683, with families comprising 3+ earners (571) having the highest median family income of $126,042, while families with no earners (311) have the lowest median family income of $2,499, accounting for 19.4% and 10.6% of families, respectively.
| Number of Earners | # Families | Median Income |
| No Earners | 311 (10.6%) | $2,499 |
| 1 Earner | 1,036 (35.2%) | $68,612 |
| 2 Earners | 1,025 (34.8%) | $99,438 |
| 3+ Earners | 571 (19.4%) | $126,042 |
| Total | 2,943 (100.0%) | $81,683 |
Household Income in Hornsby Bend
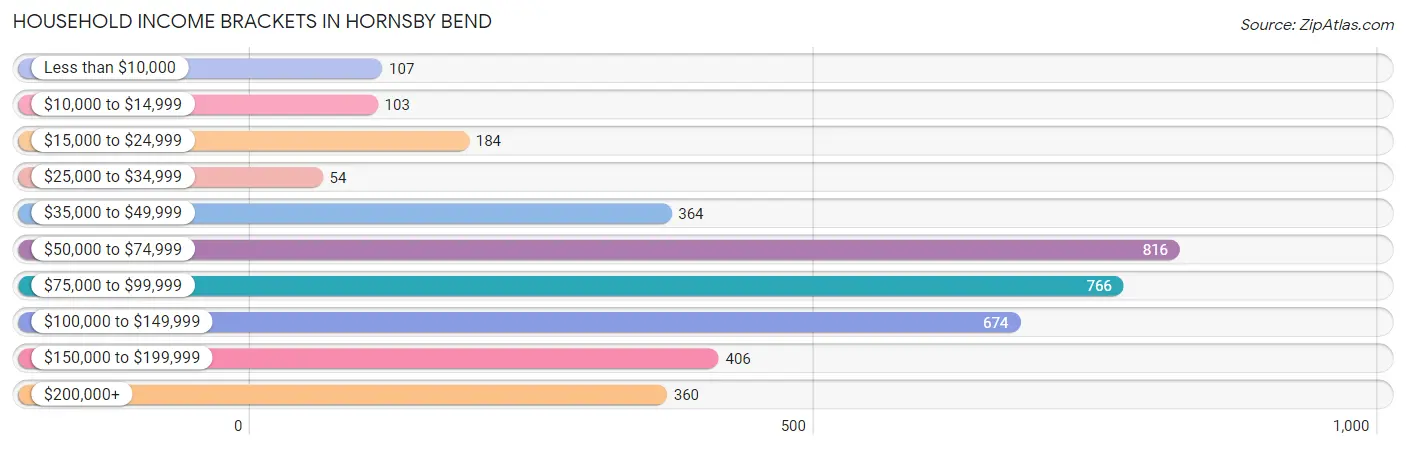
Household Income Brackets in Hornsby Bend
With 816 households falling in the category, the $50,000 to $74,999 income range is the most frequent in Hornsby Bend, accounting for 21.3% of all households. In contrast, only 54 households (1.4%) fall into the $25,000 to $34,999 income bracket, making it the least populous group.
| Income Bracket | # Households | % Households |
| Less than $10,000 | 107 | 2.8% |
| $10,000 to $14,999 | 103 | 2.7% |
| $15,000 to $24,999 | 184 | 4.8% |
| $25,000 to $34,999 | 54 | 1.4% |
| $35,000 to $49,999 | 364 | 9.5% |
| $50,000 to $74,999 | 816 | 21.3% |
| $75,000 to $99,999 | 766 | 20.0% |
| $100,000 to $149,999 | 674 | 17.6% |
| $150,000 to $199,999 | 406 | 10.6% |
| $200,000+ | 360 | 9.4% |
Household Income by Householder Age in Hornsby Bend
The median household income in Hornsby Bend is $81,775, with the highest median household income of $126,974 found in the 65+ years age bracket for the primary householder. A total of 514 households (13.4%) fall into this category. Meanwhile, the 15 to 24 years age bracket for the primary householder has the lowest median household income of $0, with 70 households (1.8%) in this group.
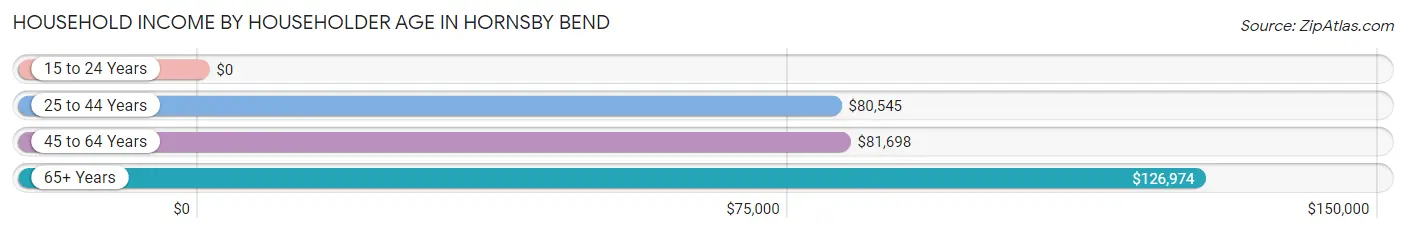
| Income Bracket | # Households | Median Income |
| 15 to 24 Years | 70 (1.8%) | $0 |
| 25 to 44 Years | 1,604 (41.9%) | $80,545 |
| 45 to 64 Years | 1,642 (42.9%) | $81,698 |
| 65+ Years | 514 (13.4%) | $126,974 |
| Total | 3,830 (100.0%) | $81,775 |
Poverty in Hornsby Bend
Income Below Poverty by Sex and Age in Hornsby Bend
With 8.1% poverty level for males and 14.8% for females among the residents of Hornsby Bend, 16 and 17 year old males and 16 and 17 year old females are the most vulnerable to poverty, with 191 males (51.2%) and 133 females (44.9%) in their respective age groups living below the poverty level.
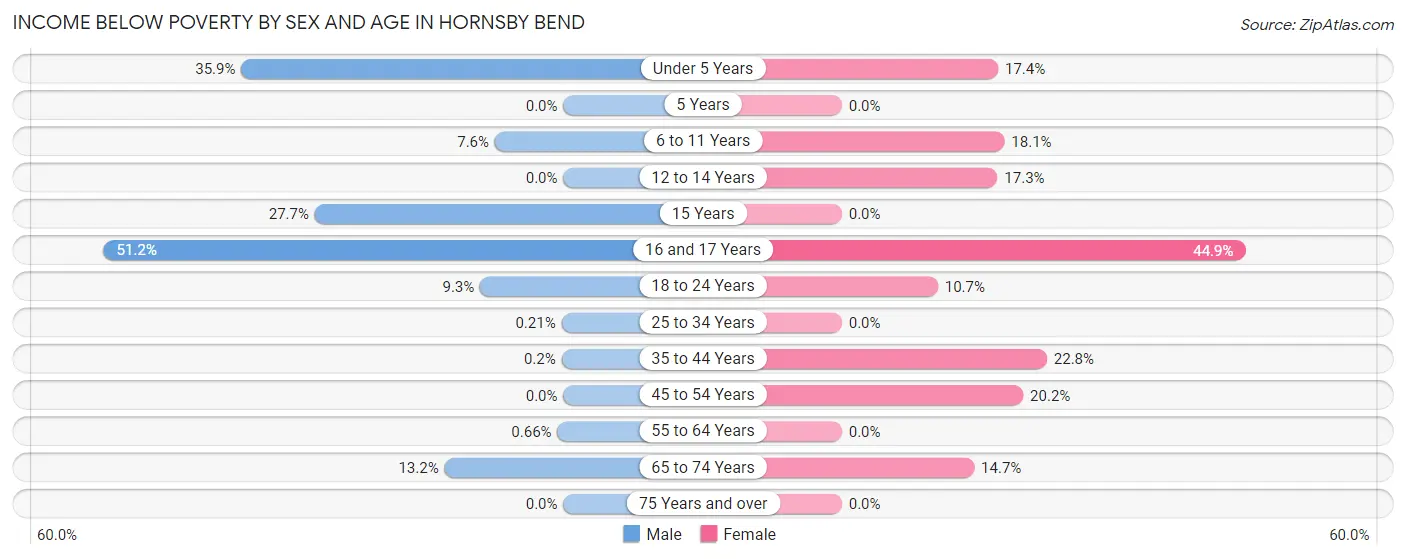
| Age Bracket | Male | Female |
| Under 5 Years | 80 (35.9%) | 67 (17.4%) |
| 5 Years | 0 (0.0%) | 0 (0.0%) |
| 6 to 11 Years | 27 (7.6%) | 86 (18.1%) |
| 12 to 14 Years | 0 (0.0%) | 13 (17.3%) |
| 15 Years | 62 (27.7%) | 0 (0.0%) |
| 16 and 17 Years | 191 (51.2%) | 133 (44.9%) |
| 18 to 24 Years | 28 (9.3%) | 28 (10.7%) |
| 25 to 34 Years | 2 (0.2%) | 0 (0.0%) |
| 35 to 44 Years | 2 (0.2%) | 230 (22.8%) |
| 45 to 54 Years | 0 (0.0%) | 204 (20.2%) |
| 55 to 64 Years | 4 (0.7%) | 0 (0.0%) |
| 65 to 74 Years | 27 (13.2%) | 79 (14.7%) |
| 75 Years and over | 0 (0.0%) | 0 (0.0%) |
| Total | 423 (8.1%) | 840 (14.8%) |
Income Above Poverty by Sex and Age in Hornsby Bend
According to the poverty statistics in Hornsby Bend, males aged 5 years and females aged 5 years are the age groups that are most secure financially, with 100.0% of males and 100.0% of females in these age groups living above the poverty line.
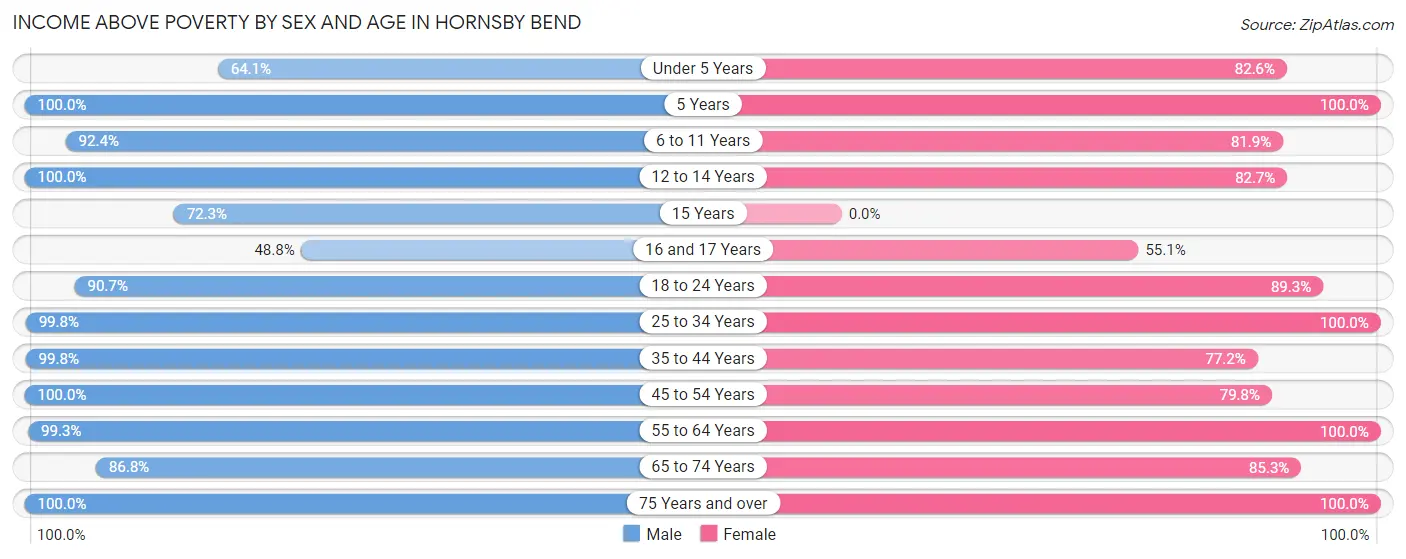
| Age Bracket | Male | Female |
| Under 5 Years | 143 (64.1%) | 318 (82.6%) |
| 5 Years | 24 (100.0%) | 4 (100.0%) |
| 6 to 11 Years | 327 (92.4%) | 389 (81.9%) |
| 12 to 14 Years | 275 (100.0%) | 62 (82.7%) |
| 15 Years | 162 (72.3%) | 0 (0.0%) |
| 16 and 17 Years | 182 (48.8%) | 163 (55.1%) |
| 18 to 24 Years | 274 (90.7%) | 234 (89.3%) |
| 25 to 34 Years | 949 (99.8%) | 781 (100.0%) |
| 35 to 44 Years | 1,005 (99.8%) | 777 (77.2%) |
| 45 to 54 Years | 641 (100.0%) | 806 (79.8%) |
| 55 to 64 Years | 602 (99.3%) | 787 (100.0%) |
| 65 to 74 Years | 177 (86.8%) | 457 (85.3%) |
| 75 Years and over | 16 (100.0%) | 74 (100.0%) |
| Total | 4,777 (91.9%) | 4,852 (85.2%) |
Income Below Poverty Among Married-Couple Families in Hornsby Bend
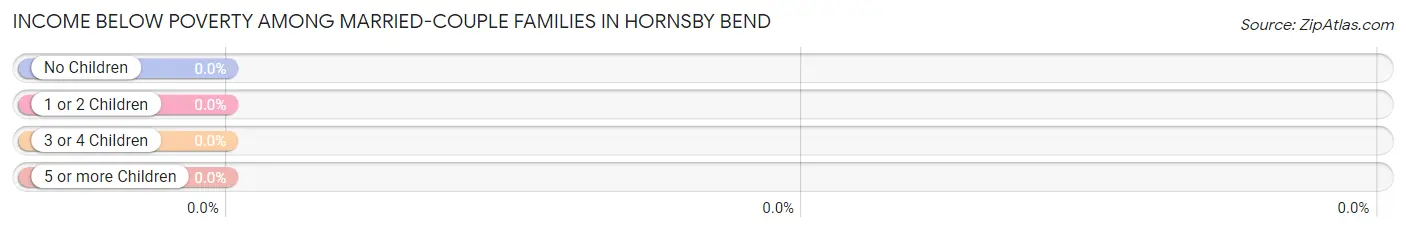
| Children | Above Poverty | Below Poverty |
| No Children | 1,105 (100.0%) | 0 (0.0%) |
| 1 or 2 Children | 596 (100.0%) | 0 (0.0%) |
| 3 or 4 Children | 227 (100.0%) | 0 (0.0%) |
| 5 or more Children | 0 (0.0%) | 0 (0.0%) |
| Total | 1,928 (100.0%) | 0 (0.0%) |
Income Below Poverty Among Single-Parent Households in Hornsby Bend
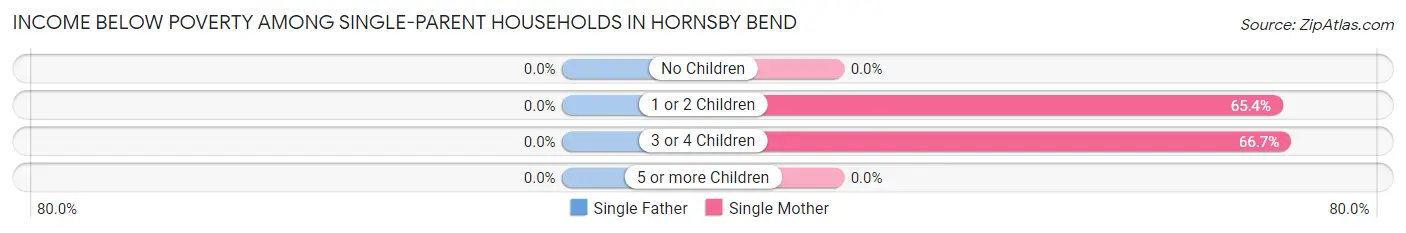
| Children | Single Father | Single Mother |
| No Children | 0 (0.0%) | 0 (0.0%) |
| 1 or 2 Children | 0 (0.0%) | 231 (65.4%) |
| 3 or 4 Children | 0 (0.0%) | 88 (66.7%) |
| 5 or more Children | 0 (0.0%) | 0 (0.0%) |
| Total | 0 (0.0%) | 319 (41.2%) |
Income Below Poverty Among Married-Couple vs Single-Parent Households in Hornsby Bend
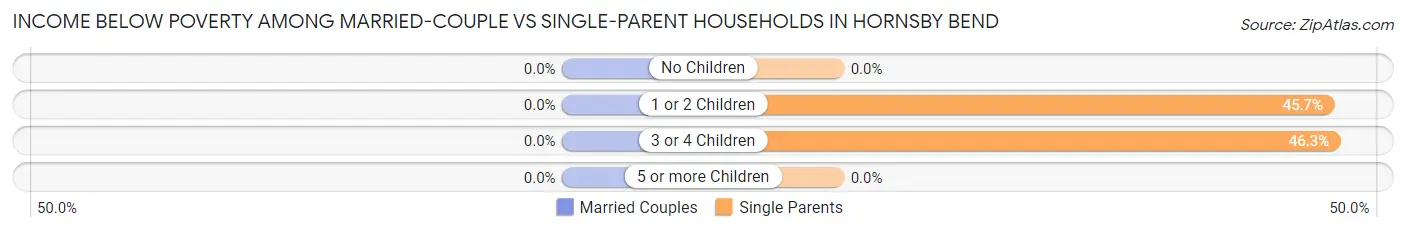
| Children | Married-Couple Families | Single-Parent Households |
| No Children | 0 (0.0%) | 0 (0.0%) |
| 1 or 2 Children | 0 (0.0%) | 231 (45.7%) |
| 3 or 4 Children | 0 (0.0%) | 88 (46.3%) |
| 5 or more Children | 0 (0.0%) | 0 (0.0%) |
| Total | 0 (0.0%) | 319 (31.4%) |
Race in Hornsby Bend
The most populous races in Hornsby Bend are Hispanic or Latino (7,101 | 64.4%), White / Caucasian (3,780 | 34.3%), and Some other Race (3,558 | 32.3%).
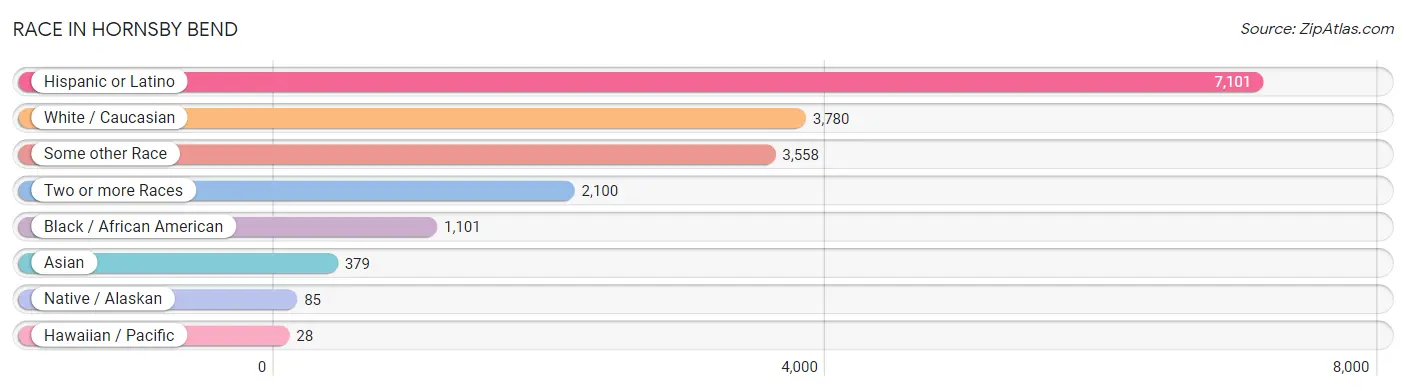
| Race | # Population | % Population |
| Asian | 379 | 3.4% |
| Black / African American | 1,101 | 10.0% |
| Hawaiian / Pacific | 28 | 0.3% |
| Hispanic or Latino | 7,101 | 64.4% |
| Native / Alaskan | 85 | 0.8% |
| White / Caucasian | 3,780 | 34.3% |
| Two or more Races | 2,100 | 19.0% |
| Some other Race | 3,558 | 32.3% |
| Total | 11,031 | 100.0% |
Ancestry in Hornsby Bend
The most populous ancestries reported in Hornsby Bend are Mexican (5,265 | 47.7%), Central American (465 | 4.2%), South American (413 | 3.7%), Honduran (338 | 3.1%), and Subsaharan African (336 | 3.0%), together accounting for 61.8% of all Hornsby Bend residents.
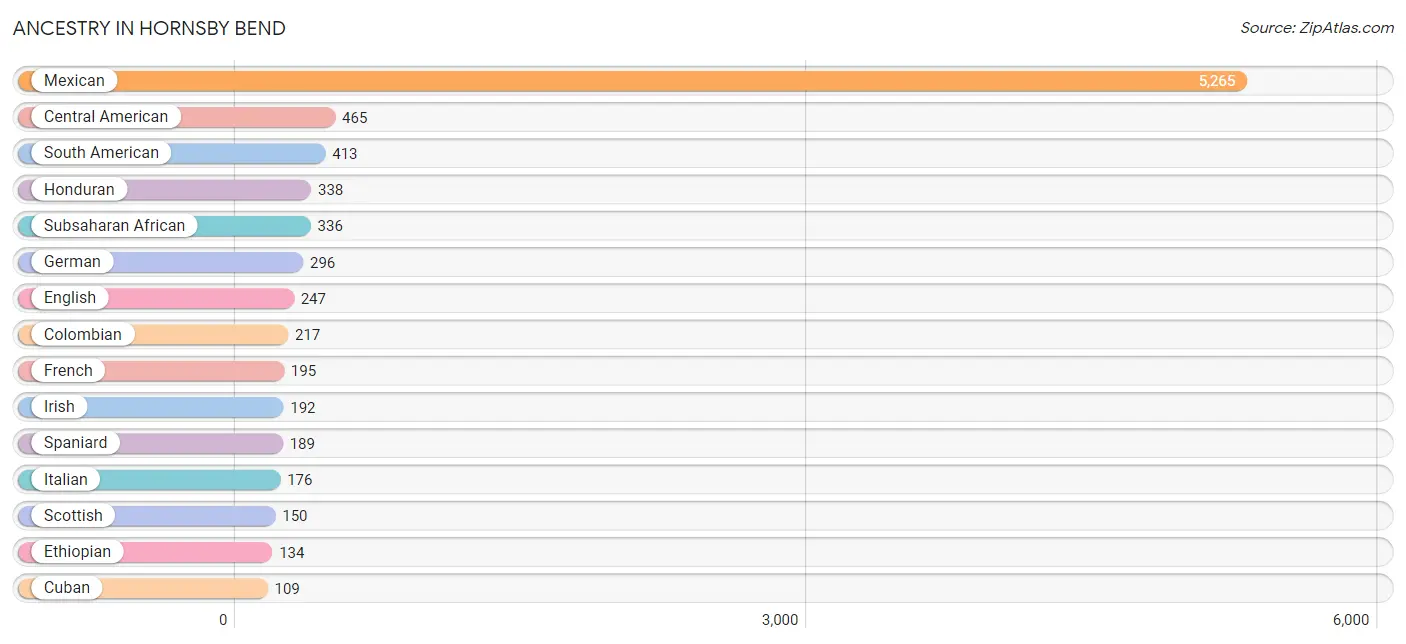
| Ancestry | # Population | % Population |
| African | 38 | 0.3% |
| American | 94 | 0.9% |
| Belgian | 20 | 0.2% |
| Bolivian | 56 | 0.5% |
| Burmese | 16 | 0.2% |
| Central American | 465 | 4.2% |
| Cherokee | 26 | 0.2% |
| Chilean | 70 | 0.6% |
| Colombian | 217 | 2.0% |
| Cuban | 109 | 1.0% |
| English | 247 | 2.2% |
| Ethiopian | 134 | 1.2% |
| European | 69 | 0.6% |
| French | 195 | 1.8% |
| German | 296 | 2.7% |
| German Russian | 28 | 0.3% |
| Guamanian / Chamorro | 79 | 0.7% |
| Guyanese | 19 | 0.2% |
| Honduran | 338 | 3.1% |
| Hungarian | 22 | 0.2% |
| Indian (Asian) | 28 | 0.3% |
| Irish | 192 | 1.7% |
| Italian | 176 | 1.6% |
| Japanese | 84 | 0.8% |
| Korean | 78 | 0.7% |
| Mexican | 5,265 | 47.7% |
| Mexican American Indian | 103 | 0.9% |
| Nicaraguan | 56 | 0.5% |
| Nigerian | 69 | 0.6% |
| Pakistani | 52 | 0.5% |
| Panamanian | 43 | 0.4% |
| Polish | 84 | 0.8% |
| Portuguese | 23 | 0.2% |
| Puerto Rican | 65 | 0.6% |
| Romanian | 18 | 0.2% |
| Russian | 21 | 0.2% |
| Salvadoran | 28 | 0.3% |
| Scottish | 150 | 1.4% |
| South American | 413 | 3.7% |
| South American Indian | 30 | 0.3% |
| Spaniard | 189 | 1.7% |
| Sri Lankan | 49 | 0.4% |
| Subsaharan African | 336 | 3.0% |
| Swedish | 35 | 0.3% |
| Swiss | 16 | 0.2% |
| Thai | 102 | 0.9% |
| Venezuelan | 70 | 0.6% |
| Vietnamese | 44 | 0.4% | View All 48 Rows |
Immigrants in Hornsby Bend
The most numerous immigrant groups reported in Hornsby Bend came from Latin America (2,186 | 19.8%), Central America (1,892 | 17.2%), Mexico (1,714 | 15.5%), Asia (312 | 2.8%), and South America (278 | 2.5%), together accounting for 57.9% of all Hornsby Bend residents.
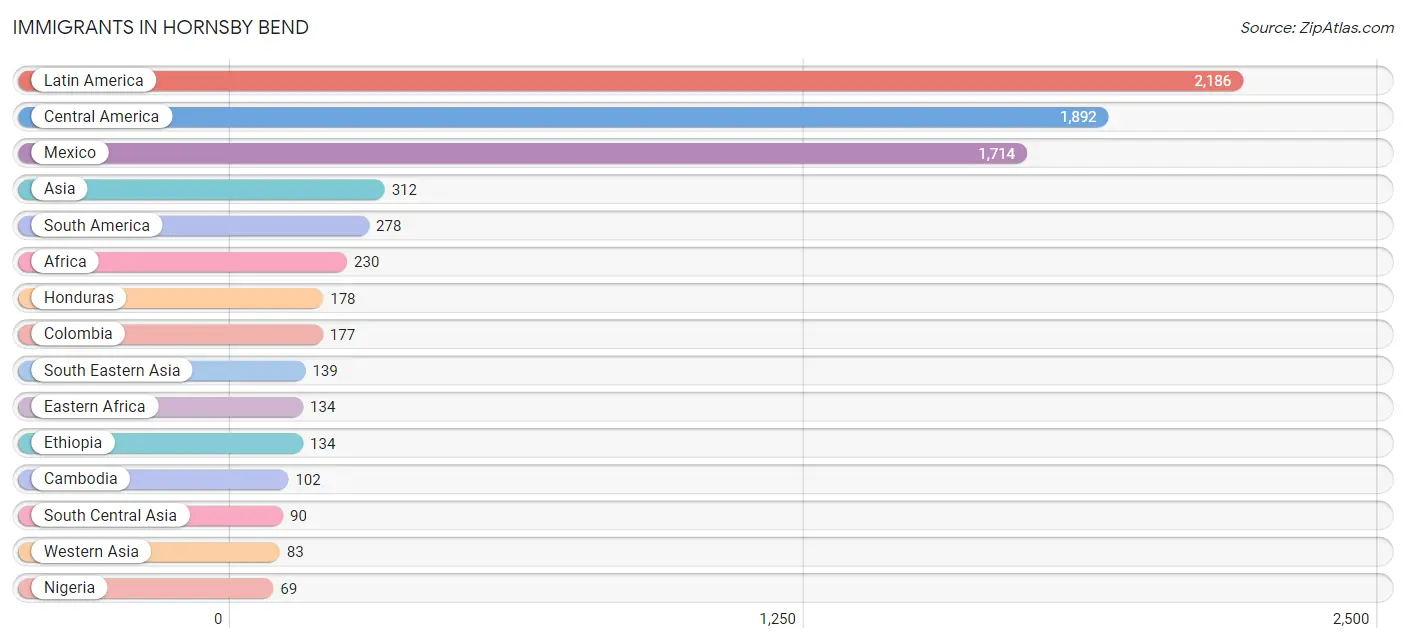
| Immigration Origin | # Population | % Population |
| Africa | 230 | 2.1% |
| Asia | 312 | 2.8% |
| Bangladesh | 33 | 0.3% |
| Belarus | 24 | 0.2% |
| Belgium | 20 | 0.2% |
| Bolivia | 56 | 0.5% |
| Cambodia | 102 | 0.9% |
| Canada | 26 | 0.2% |
| Caribbean | 16 | 0.2% |
| Central America | 1,892 | 17.2% |
| Colombia | 177 | 1.6% |
| Cuba | 16 | 0.2% |
| Eastern Africa | 134 | 1.2% |
| Eastern Europe | 24 | 0.2% |
| Ethiopia | 134 | 1.2% |
| Europe | 44 | 0.4% |
| Guyana | 19 | 0.2% |
| Honduras | 178 | 1.6% |
| India | 57 | 0.5% |
| Laos | 17 | 0.2% |
| Latin America | 2,186 | 19.8% |
| Mexico | 1,714 | 15.5% |
| Morocco | 27 | 0.2% |
| Nigeria | 69 | 0.6% |
| Northern Africa | 27 | 0.2% |
| South America | 278 | 2.5% |
| South Central Asia | 90 | 0.8% |
| South Eastern Asia | 139 | 1.3% |
| Venezuela | 26 | 0.2% |
| Vietnam | 20 | 0.2% |
| Western Africa | 69 | 0.6% |
| Western Asia | 83 | 0.7% |
| Western Europe | 20 | 0.2% | View All 33 Rows |
Sex and Age in Hornsby Bend
Sex and Age in Hornsby Bend
The most populous age groups in Hornsby Bend are 35 to 39 Years (721 | 13.6%) for men and 45 to 49 Years (734 | 12.8%) for women.
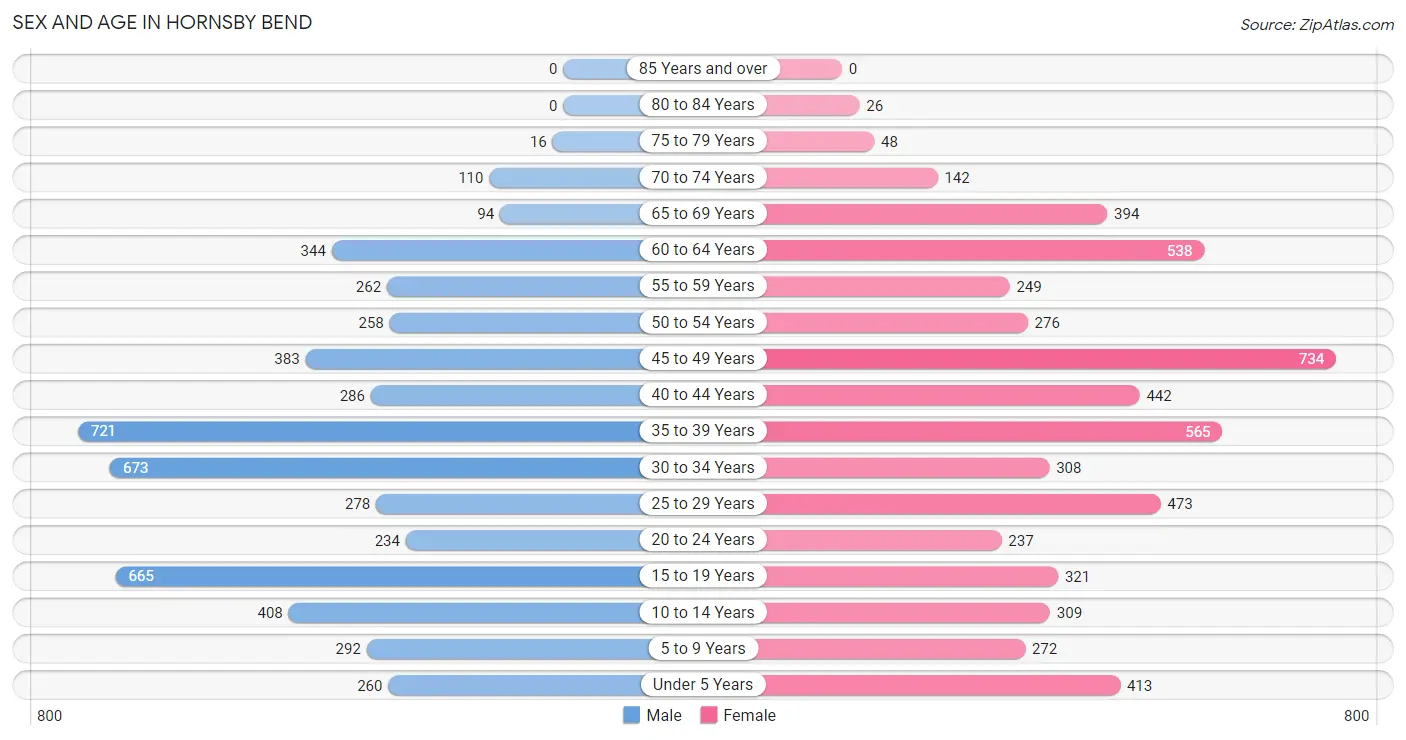
| Age Bracket | Male | Female |
| Under 5 Years | 260 (4.9%) | 413 (7.2%) |
| 5 to 9 Years | 292 (5.5%) | 272 (4.7%) |
| 10 to 14 Years | 408 (7.7%) | 309 (5.4%) |
| 15 to 19 Years | 665 (12.6%) | 321 (5.6%) |
| 20 to 24 Years | 234 (4.4%) | 237 (4.1%) |
| 25 to 29 Years | 278 (5.3%) | 473 (8.2%) |
| 30 to 34 Years | 673 (12.7%) | 308 (5.4%) |
| 35 to 39 Years | 721 (13.6%) | 565 (9.8%) |
| 40 to 44 Years | 286 (5.4%) | 442 (7.7%) |
| 45 to 49 Years | 383 (7.2%) | 734 (12.8%) |
| 50 to 54 Years | 258 (4.9%) | 276 (4.8%) |
| 55 to 59 Years | 262 (5.0%) | 249 (4.3%) |
| 60 to 64 Years | 344 (6.5%) | 538 (9.4%) |
| 65 to 69 Years | 94 (1.8%) | 394 (6.9%) |
| 70 to 74 Years | 110 (2.1%) | 142 (2.5%) |
| 75 to 79 Years | 16 (0.3%) | 48 (0.8%) |
| 80 to 84 Years | 0 (0.0%) | 26 (0.4%) |
| 85 Years and over | 0 (0.0%) | 0 (0.0%) |
| Total | 5,284 (100.0%) | 5,747 (100.0%) |
Families and Households in Hornsby Bend
Median Family Size in Hornsby Bend
The median family size in Hornsby Bend is 3.11 persons per family, with single male/father families (240 | 8.2%) accounting for the largest median family size of 3.55 persons per family. On the other hand, married-couple families (1,928 | 65.5%) represent the smallest median family size with 3.00 persons per family.
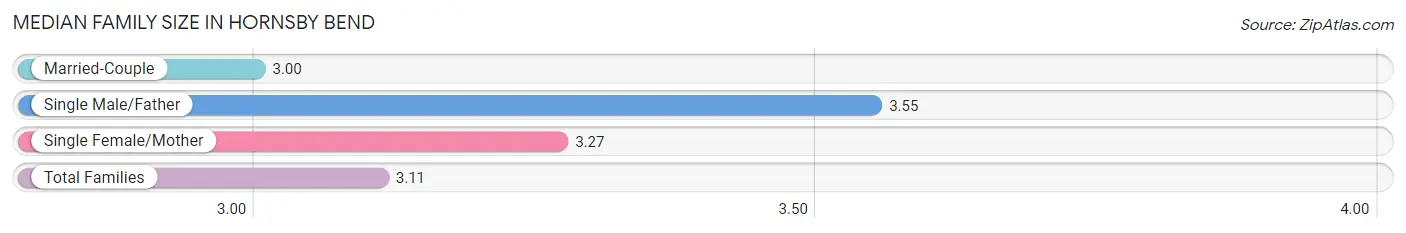
| Family Type | # Families | Family Size |
| Married-Couple | 1,928 (65.5%) | 3.00 |
| Single Male/Father | 240 (8.2%) | 3.55 |
| Single Female/Mother | 775 (26.3%) | 3.27 |
| Total Families | 2,943 (100.0%) | 3.11 |
Median Household Size in Hornsby Bend
The median household size in Hornsby Bend is 2.87 persons per household, with single male/father households (240 | 6.3%) accounting for the largest median household size of 4.05 persons per household. non-family households (887 | 23.2%) represent the smallest median household size with 1.19 persons per household.
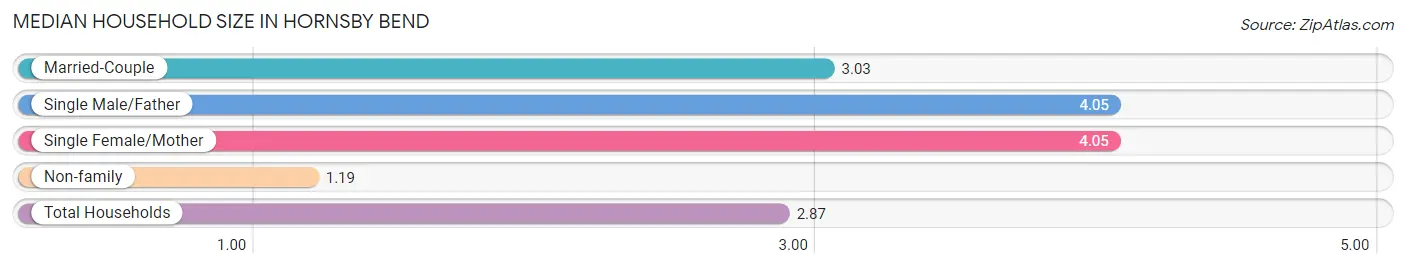
| Household Type | # Households | Household Size |
| Married-Couple | 1,928 (50.3%) | 3.03 |
| Single Male/Father | 240 (6.3%) | 4.05 |
| Single Female/Mother | 775 (20.2%) | 4.05 |
| Non-family | 887 (23.2%) | 1.19 |
| Total Households | 3,830 (100.0%) | 2.87 |
Household Size by Marriage Status in Hornsby Bend
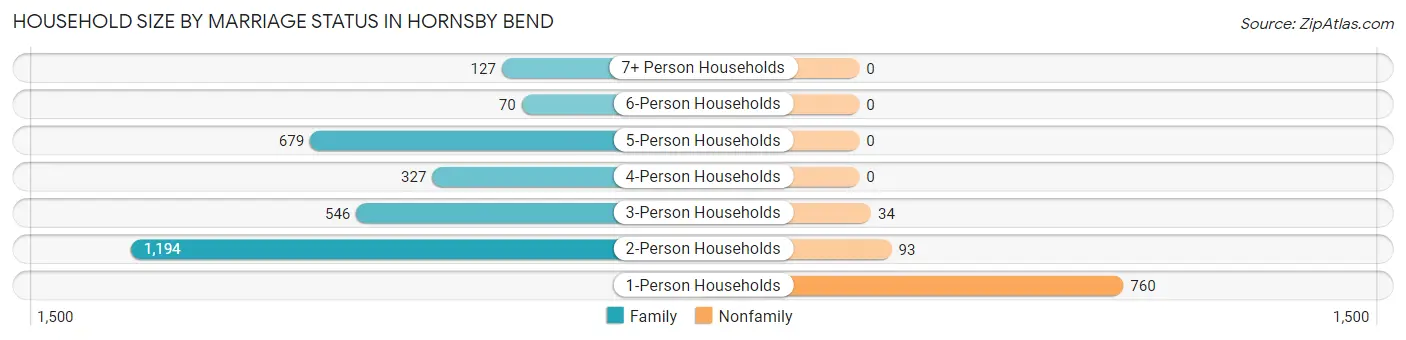
Out of a total of 3,830 households in Hornsby Bend, 2,943 (76.8%) are family households, while 887 (23.2%) are nonfamily households. The most numerous type of family households are 2-person households, comprising 1,194, and the most common type of nonfamily households are 1-person households, comprising 760.
| Household Size | Family Households | Nonfamily Households |
| 1-Person Households | - | 760 (19.8%) |
| 2-Person Households | 1,194 (31.2%) | 93 (2.4%) |
| 3-Person Households | 546 (14.3%) | 34 (0.9%) |
| 4-Person Households | 327 (8.5%) | 0 (0.0%) |
| 5-Person Households | 679 (17.7%) | 0 (0.0%) |
| 6-Person Households | 70 (1.8%) | 0 (0.0%) |
| 7+ Person Households | 127 (3.3%) | 0 (0.0%) |
| Total | 2,943 (76.8%) | 887 (23.2%) |
Female Fertility in Hornsby Bend
Fertility by Age in Hornsby Bend
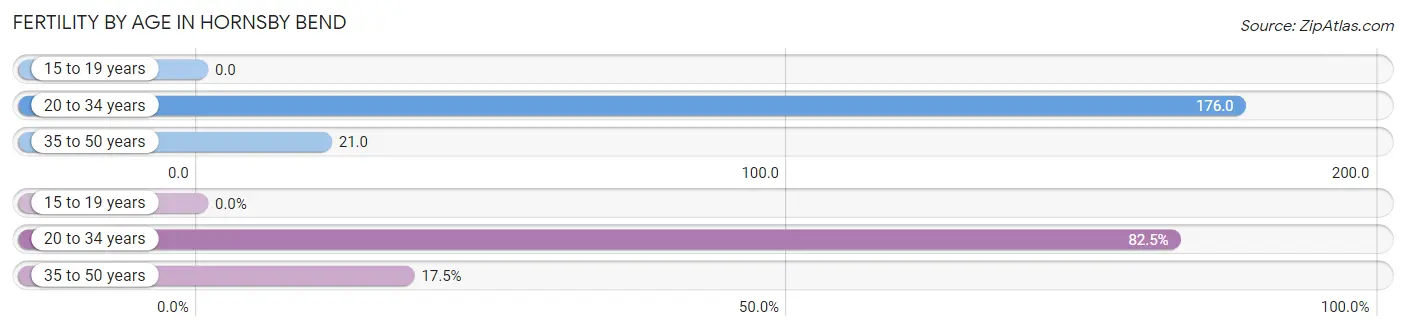
Average fertility rate in Hornsby Bend is 68.0 births per 1,000 women. Women in the age bracket of 20 to 34 years have the highest fertility rate with 176.0 births per 1,000 women. Women in the age bracket of 20 to 34 years acount for 82.5% of all women with births.
| Age Bracket | Women with Births | Births / 1,000 Women |
| 15 to 19 years | 0 (0.0%) | 0.0 |
| 20 to 34 years | 179 (82.5%) | 176.0 |
| 35 to 50 years | 38 (17.5%) | 21.0 |
| Total | 217 (100.0%) | 68.0 |
Fertility by Age by Marriage Status in Hornsby Bend
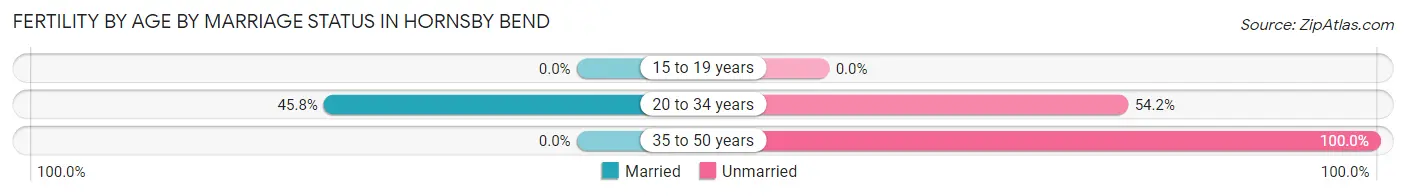
37.8% of women with births (217) in Hornsby Bend are married. The highest percentage of unmarried women with births falls into 35 to 50 years age bracket with 100.0% of them unmarried at the time of birth, while the lowest percentage of unmarried women with births belong to 20 to 34 years age bracket with 54.2% of them unmarried.
| Age Bracket | Married | Unmarried |
| 15 to 19 years | 0 (0.0%) | 0 (0.0%) |
| 20 to 34 years | 82 (45.8%) | 97 (54.2%) |
| 35 to 50 years | 0 (0.0%) | 38 (100.0%) |
| Total | 82 (37.8%) | 135 (62.2%) |
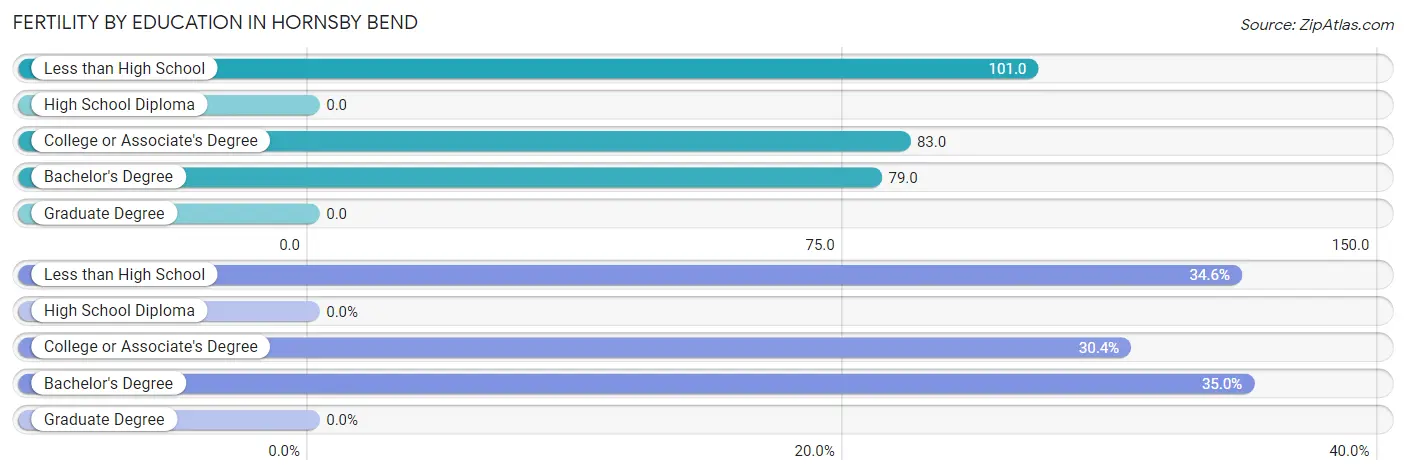
Fertility by Education in Hornsby Bend
| Educational Attainment | Women with Births | Births / 1,000 Women |
| Less than High School | 75 (34.6%) | 101.0 |
| High School Diploma | 0 (0.0%) | 0.0 |
| College or Associate's Degree | 66 (30.4%) | 83.0 |
| Bachelor's Degree | 76 (35.0%) | 79.0 |
| Graduate Degree | 0 (0.0%) | 0.0 |
| Total | 217 (100.0%) | 68.0 |
Fertility by Education by Marriage Status in Hornsby Bend
62.2% of women with births in Hornsby Bend are unmarried. Women with the educational attainment of bachelor's degree are most likely to be married with 59.2% of them married at childbirth, while women with the educational attainment of college or associate's degree are least likely to be married with 100.0% of them unmarried at childbirth.
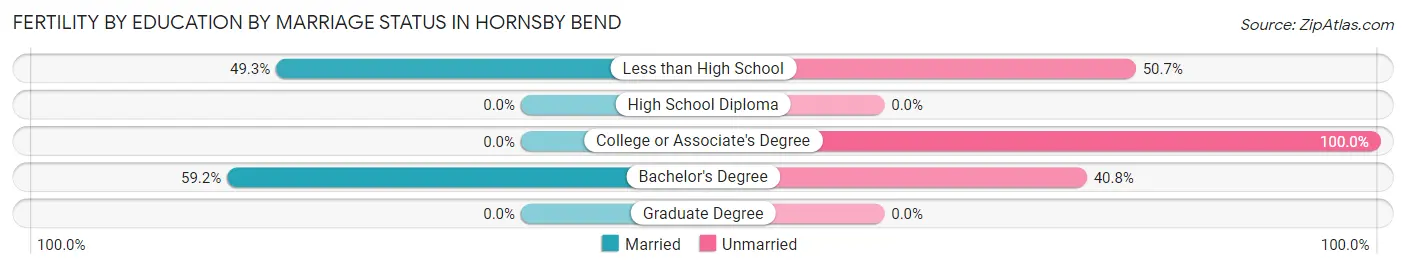
| Educational Attainment | Married | Unmarried |
| Less than High School | 37 (49.3%) | 38 (50.7%) |
| High School Diploma | 0 (0.0%) | 0 (0.0%) |
| College or Associate's Degree | 0 (0.0%) | 66 (100.0%) |
| Bachelor's Degree | 45 (59.2%) | 31 (40.8%) |
| Graduate Degree | 0 (0.0%) | 0 (0.0%) |
| Total | 82 (37.8%) | 135 (62.2%) |
Employment Characteristics in Hornsby Bend
Employment by Class of Employer in Hornsby Bend
Among the 6,134 employed individuals in Hornsby Bend, private company employees (3,910 | 63.7%), local government employees (930 | 15.2%), and self-employed (not incorporated) (453 | 7.4%) make up the most common classes of employment.
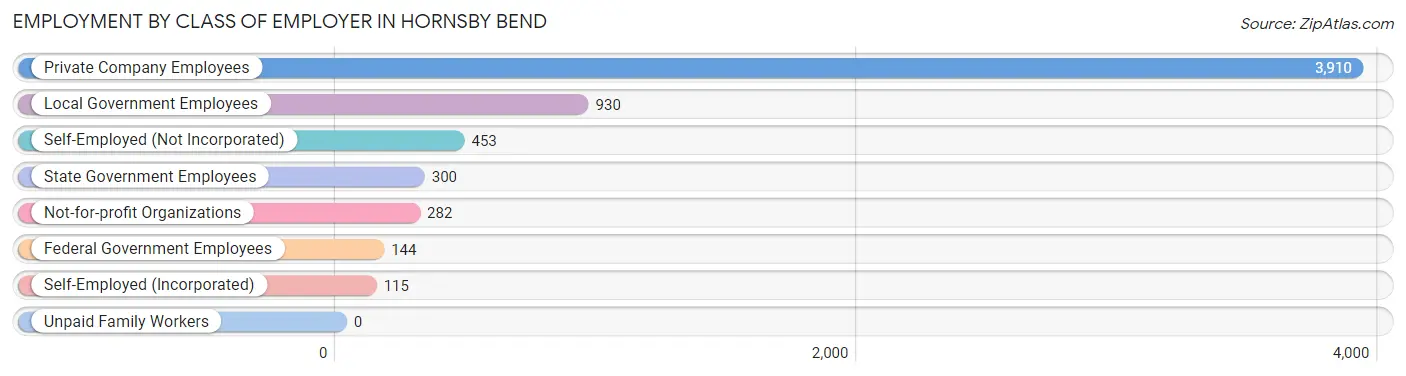
| Employer Class | # Employees | % Employees |
| Private Company Employees | 3,910 | 63.7% |
| Self-Employed (Incorporated) | 115 | 1.9% |
| Self-Employed (Not Incorporated) | 453 | 7.4% |
| Not-for-profit Organizations | 282 | 4.6% |
| Local Government Employees | 930 | 15.2% |
| State Government Employees | 300 | 4.9% |
| Federal Government Employees | 144 | 2.4% |
| Unpaid Family Workers | 0 | 0.0% |
| Total | 6,134 | 100.0% |
Employment Status by Age in Hornsby Bend
According to the labor force statistics for Hornsby Bend, out of the total population over 16 years of age (8,853), 71.7% or 6,348 individuals are in the labor force, with 1.6% or 102 of them unemployed. The age group with the highest labor force participation rate is 30 to 34 years, with 99.2% or 973 individuals in the labor force. Within the labor force, the 35 to 44 years age range has the highest percentage of unemployed individuals, with 6.8% or 103 of them being unemployed.
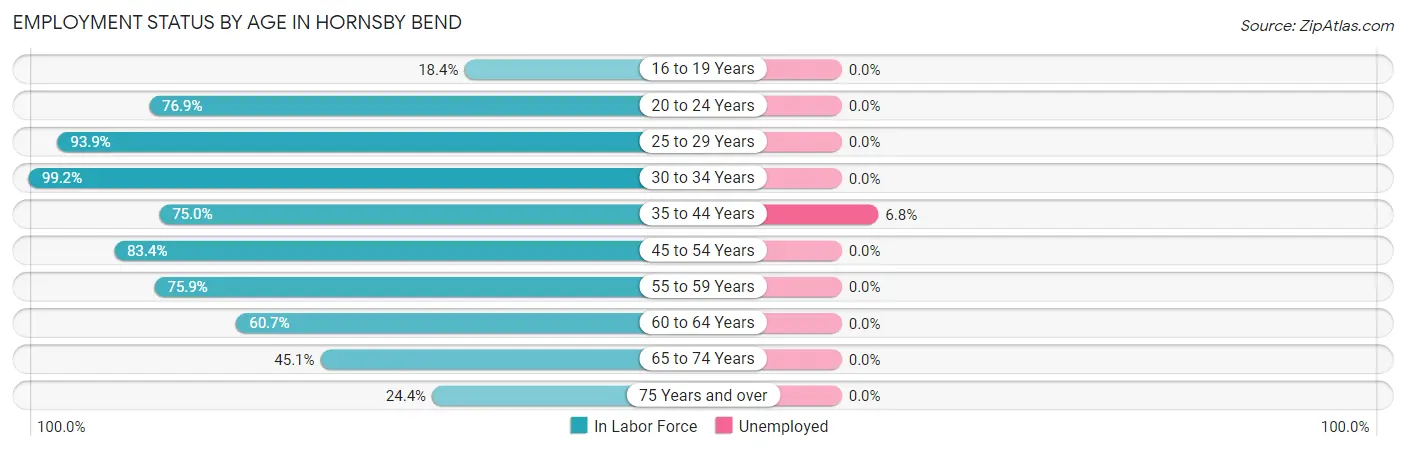
| Age Bracket | In Labor Force | Unemployed |
| 16 to 19 Years | 140 (18.4%) | 0 (0.0%) |
| 20 to 24 Years | 362 (76.9%) | 0 (0.0%) |
| 25 to 29 Years | 705 (93.9%) | 0 (0.0%) |
| 30 to 34 Years | 973 (99.2%) | 0 (0.0%) |
| 35 to 44 Years | 1,510 (75.0%) | 103 (6.8%) |
| 45 to 54 Years | 1,377 (83.4%) | 0 (0.0%) |
| 55 to 59 Years | 388 (75.9%) | 0 (0.0%) |
| 60 to 64 Years | 535 (60.7%) | 0 (0.0%) |
| 65 to 74 Years | 334 (45.1%) | 0 (0.0%) |
| 75 Years and over | 22 (24.4%) | 0 (0.0%) |
| Total | 6,348 (71.7%) | 102 (1.6%) |
Employment Status by Educational Attainment in Hornsby Bend
According to labor force statistics for Hornsby Bend, 80.8% of individuals (5,486) out of the total population between 25 and 64 years of age (6,790) are in the labor force, with 1.9% or 104 of them being unemployed. The group with the highest labor force participation rate are those with the educational attainment of bachelor's degree or higher, with 97.1% or 2,110 individuals in the labor force. Within the labor force, individuals with less than high school education have the highest percentage of unemployment, with 7.3% or 76 of them being unemployed.
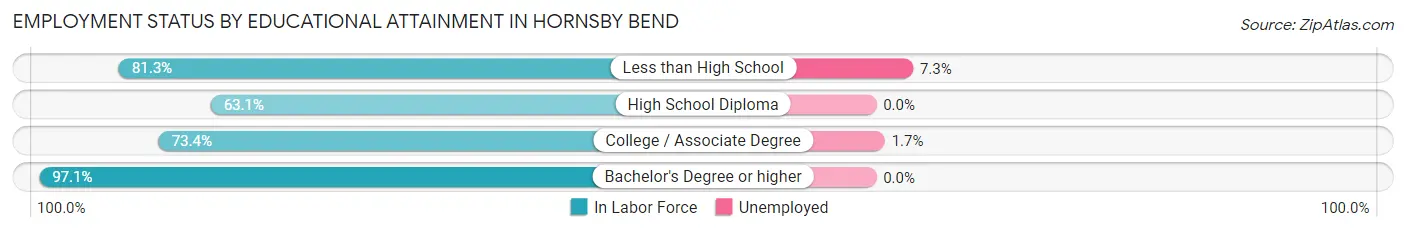
| Educational Attainment | In Labor Force | Unemployed |
| Less than High School | 1,039 (81.3%) | 93 (7.3%) |
| High School Diploma | 699 (63.1%) | 0 (0.0%) |
| College / Associate Degree | 1,638 (73.4%) | 38 (1.7%) |
| Bachelor's Degree or higher | 2,110 (97.1%) | 0 (0.0%) |
| Total | 5,486 (80.8%) | 129 (1.9%) |
Employment Occupations by Sex in Hornsby Bend
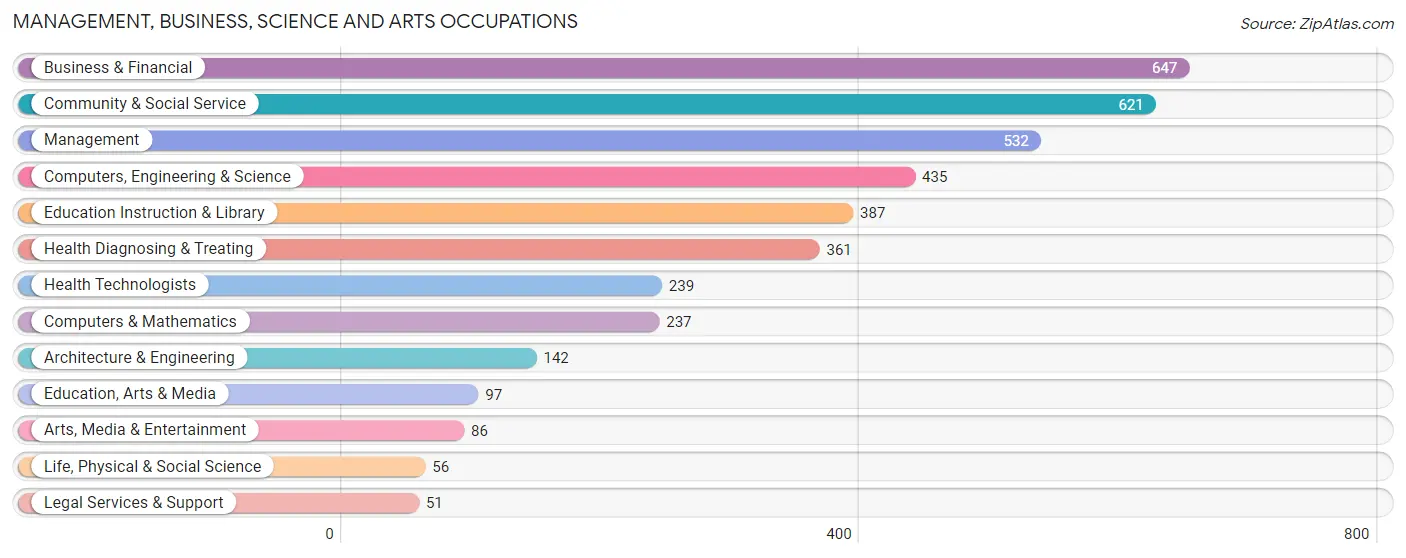
Management, Business, Science and Arts Occupations
The most common Management, Business, Science and Arts occupations in Hornsby Bend are Business & Financial (647 | 10.4%), Community & Social Service (621 | 10.0%), Management (532 | 8.6%), Computers, Engineering & Science (435 | 7.0%), and Education Instruction & Library (387 | 6.2%).
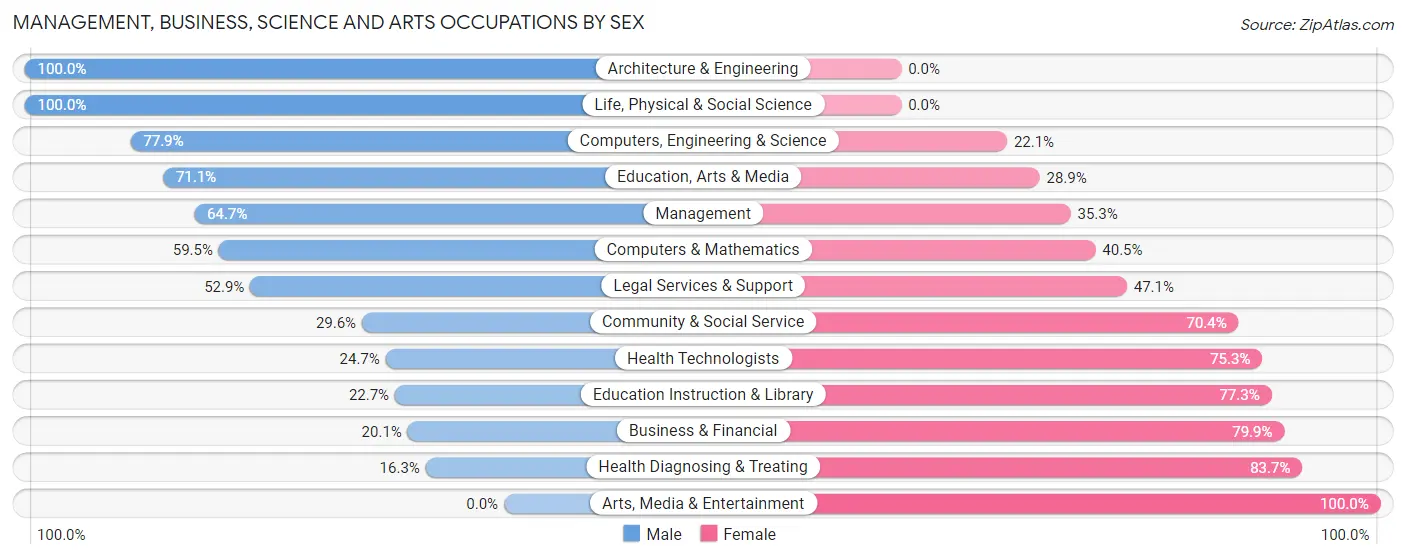
Management, Business, Science and Arts Occupations by Sex
Within the Management, Business, Science and Arts occupations in Hornsby Bend, the most male-oriented occupations are Architecture & Engineering (100.0%), Life, Physical & Social Science (100.0%), and Computers, Engineering & Science (77.9%), while the most female-oriented occupations are Arts, Media & Entertainment (100.0%), Health Diagnosing & Treating (83.7%), and Business & Financial (79.9%).
| Occupation | Male | Female |
| Management | 344 (64.7%) | 188 (35.3%) |
| Business & Financial | 130 (20.1%) | 517 (79.9%) |
| Computers, Engineering & Science | 339 (77.9%) | 96 (22.1%) |
| Computers & Mathematics | 141 (59.5%) | 96 (40.5%) |
| Architecture & Engineering | 142 (100.0%) | 0 (0.0%) |
| Life, Physical & Social Science | 56 (100.0%) | 0 (0.0%) |
| Community & Social Service | 184 (29.6%) | 437 (70.4%) |
| Education, Arts & Media | 69 (71.1%) | 28 (28.9%) |
| Legal Services & Support | 27 (52.9%) | 24 (47.1%) |
| Education Instruction & Library | 88 (22.7%) | 299 (77.3%) |
| Arts, Media & Entertainment | 0 (0.0%) | 86 (100.0%) |
| Health Diagnosing & Treating | 59 (16.3%) | 302 (83.7%) |
| Health Technologists | 59 (24.7%) | 180 (75.3%) |
| Total (Category) | 1,056 (40.7%) | 1,540 (59.3%) |
| Total (Overall) | 3,046 (49.0%) | 3,172 (51.0%) |
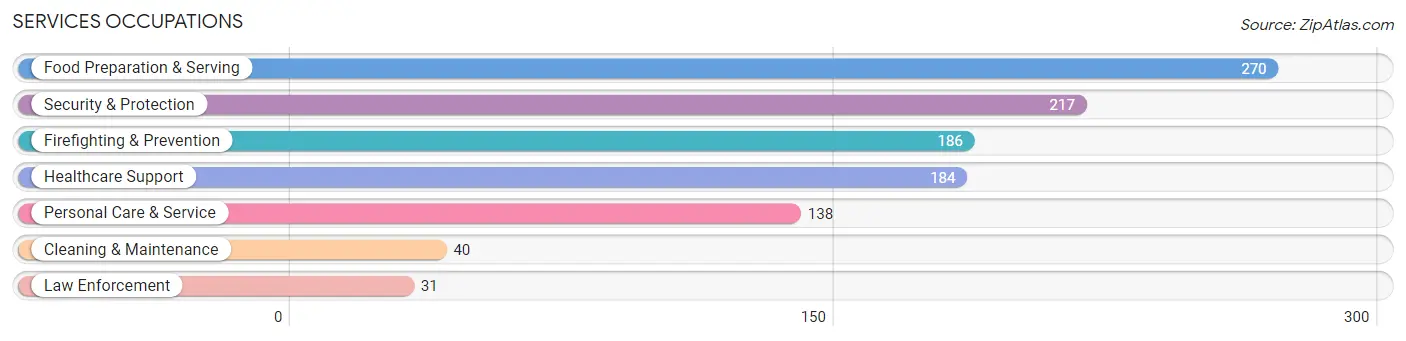
Services Occupations
The most common Services occupations in Hornsby Bend are Food Preparation & Serving (270 | 4.3%), Security & Protection (217 | 3.5%), Firefighting & Prevention (186 | 3.0%), Healthcare Support (184 | 3.0%), and Personal Care & Service (138 | 2.2%).
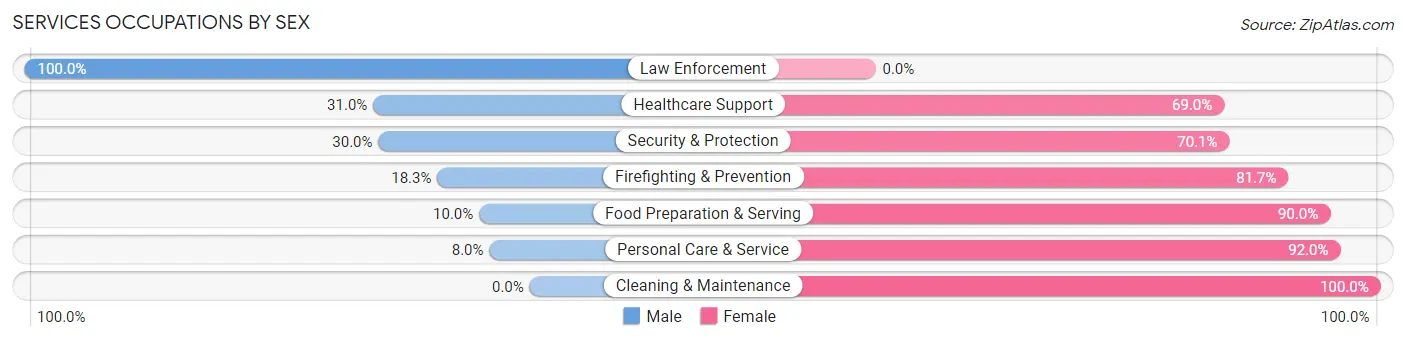
Services Occupations by Sex
Within the Services occupations in Hornsby Bend, the most male-oriented occupations are Law Enforcement (100.0%), Healthcare Support (31.0%), and Security & Protection (29.9%), while the most female-oriented occupations are Cleaning & Maintenance (100.0%), Personal Care & Service (92.0%), and Food Preparation & Serving (90.0%).
| Occupation | Male | Female |
| Healthcare Support | 57 (31.0%) | 127 (69.0%) |
| Security & Protection | 65 (29.9%) | 152 (70.1%) |
| Firefighting & Prevention | 34 (18.3%) | 152 (81.7%) |
| Law Enforcement | 31 (100.0%) | 0 (0.0%) |
| Food Preparation & Serving | 27 (10.0%) | 243 (90.0%) |
| Cleaning & Maintenance | 0 (0.0%) | 40 (100.0%) |
| Personal Care & Service | 11 (8.0%) | 127 (92.0%) |
| Total (Category) | 160 (18.9%) | 689 (81.1%) |
| Total (Overall) | 3,046 (49.0%) | 3,172 (51.0%) |
Sales and Office Occupations
The most common Sales and Office occupations in Hornsby Bend are Office & Administration (794 | 12.8%), and Sales & Related (441 | 7.1%).
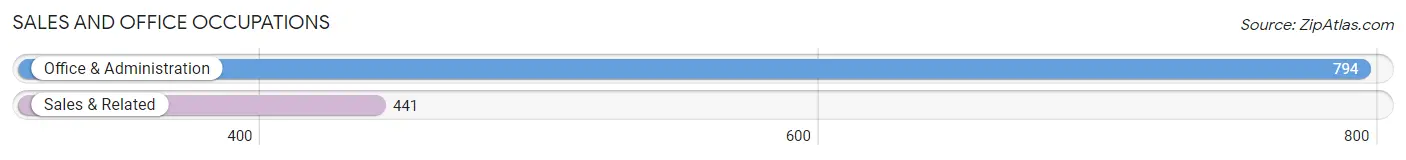
Sales and Office Occupations by Sex
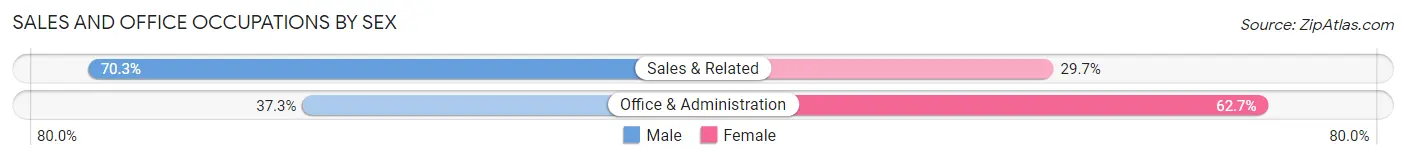
| Occupation | Male | Female |
| Sales & Related | 310 (70.3%) | 131 (29.7%) |
| Office & Administration | 296 (37.3%) | 498 (62.7%) |
| Total (Category) | 606 (49.1%) | 629 (50.9%) |
| Total (Overall) | 3,046 (49.0%) | 3,172 (51.0%) |
Natural Resources, Construction and Maintenance Occupations
The most common Natural Resources, Construction and Maintenance occupations in Hornsby Bend are Construction & Extraction (619 | 10.0%), and Installation, Maintenance & Repair (98 | 1.6%).
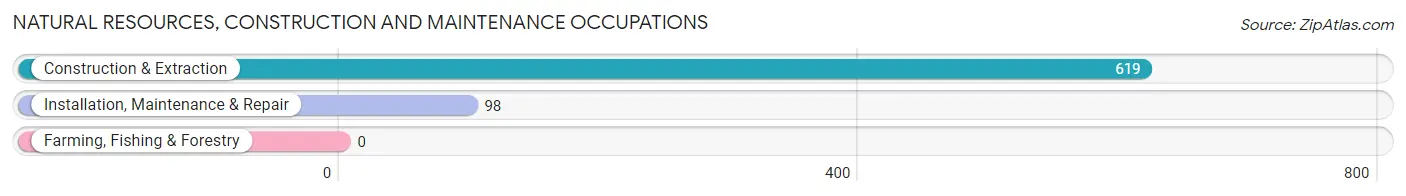
Natural Resources, Construction and Maintenance Occupations by Sex
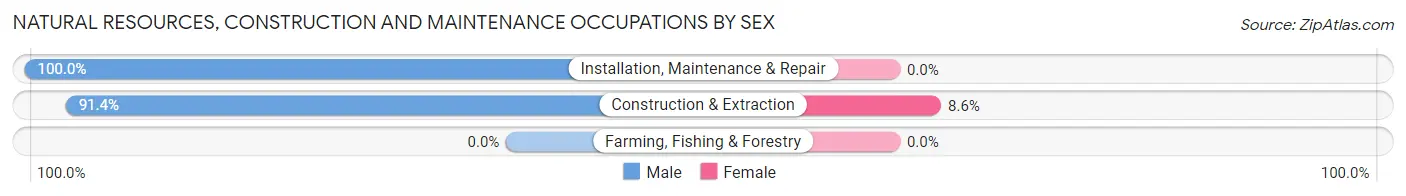
| Occupation | Male | Female |
| Farming, Fishing & Forestry | 0 (0.0%) | 0 (0.0%) |
| Construction & Extraction | 566 (91.4%) | 53 (8.6%) |
| Installation, Maintenance & Repair | 98 (100.0%) | 0 (0.0%) |
| Total (Category) | 664 (92.6%) | 53 (7.4%) |
| Total (Overall) | 3,046 (49.0%) | 3,172 (51.0%) |
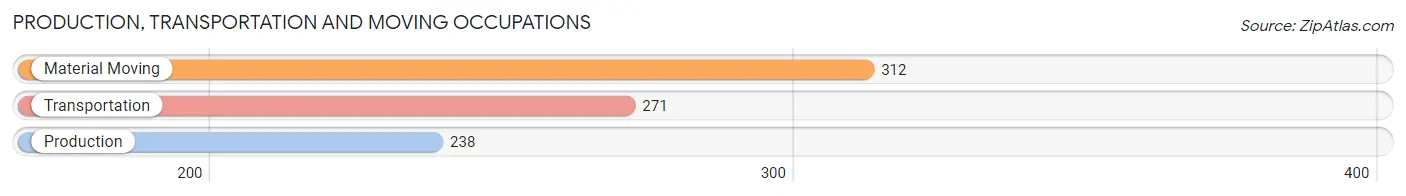
Production, Transportation and Moving Occupations
The most common Production, Transportation and Moving occupations in Hornsby Bend are Material Moving (312 | 5.0%), Transportation (271 | 4.4%), and Production (238 | 3.8%).
Production, Transportation and Moving Occupations by Sex
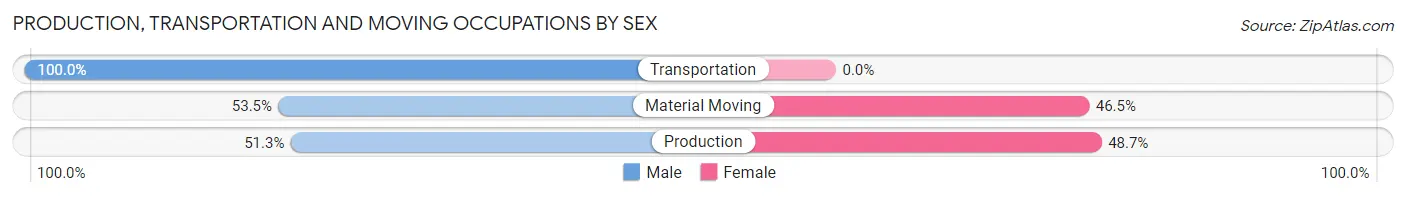
| Occupation | Male | Female |
| Production | 122 (51.3%) | 116 (48.7%) |
| Transportation | 271 (100.0%) | 0 (0.0%) |
| Material Moving | 167 (53.5%) | 145 (46.5%) |
| Total (Category) | 560 (68.2%) | 261 (31.8%) |
| Total (Overall) | 3,046 (49.0%) | 3,172 (51.0%) |
Employment Industries by Sex in Hornsby Bend
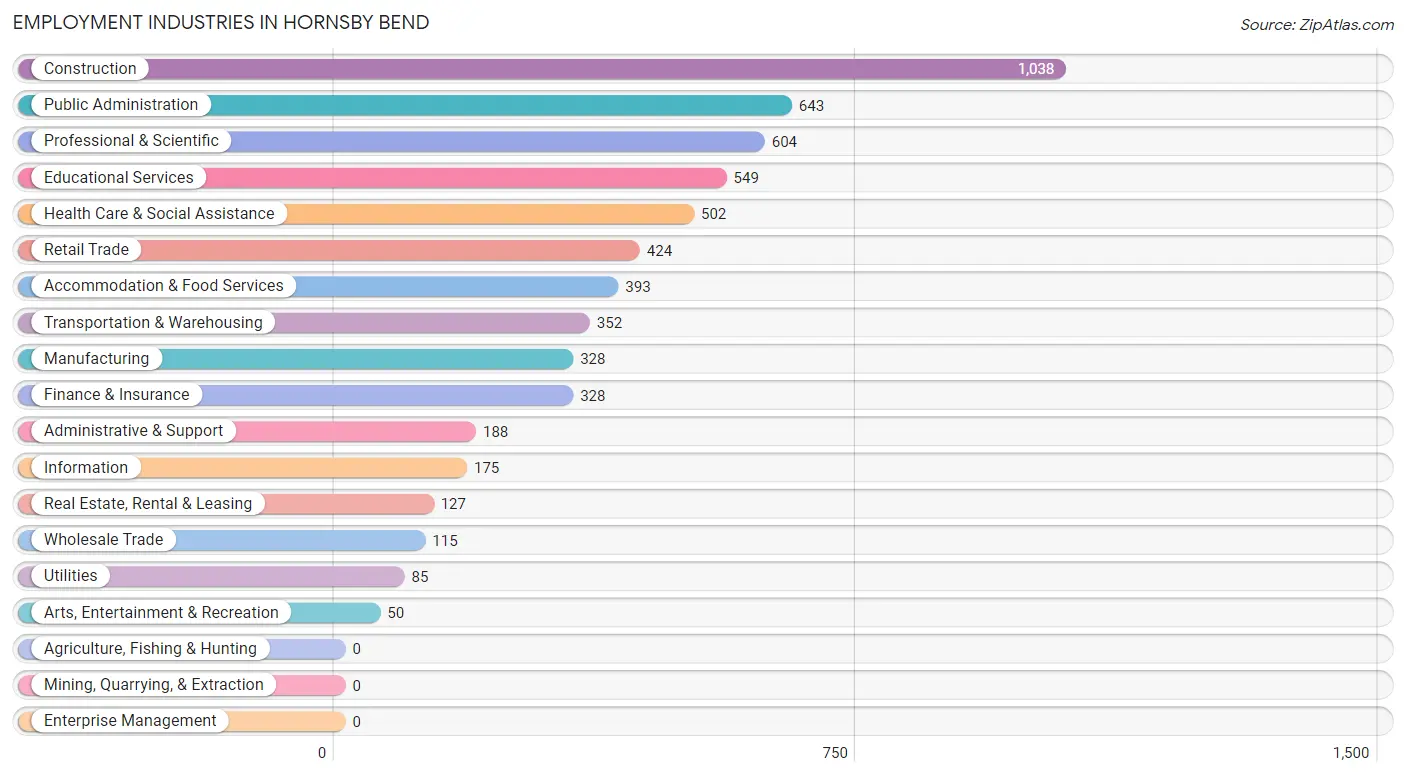
Employment Industries in Hornsby Bend
The major employment industries in Hornsby Bend include Construction (1,038 | 16.7%), Public Administration (643 | 10.3%), Professional & Scientific (604 | 9.7%), Educational Services (549 | 8.8%), and Health Care & Social Assistance (502 | 8.1%).
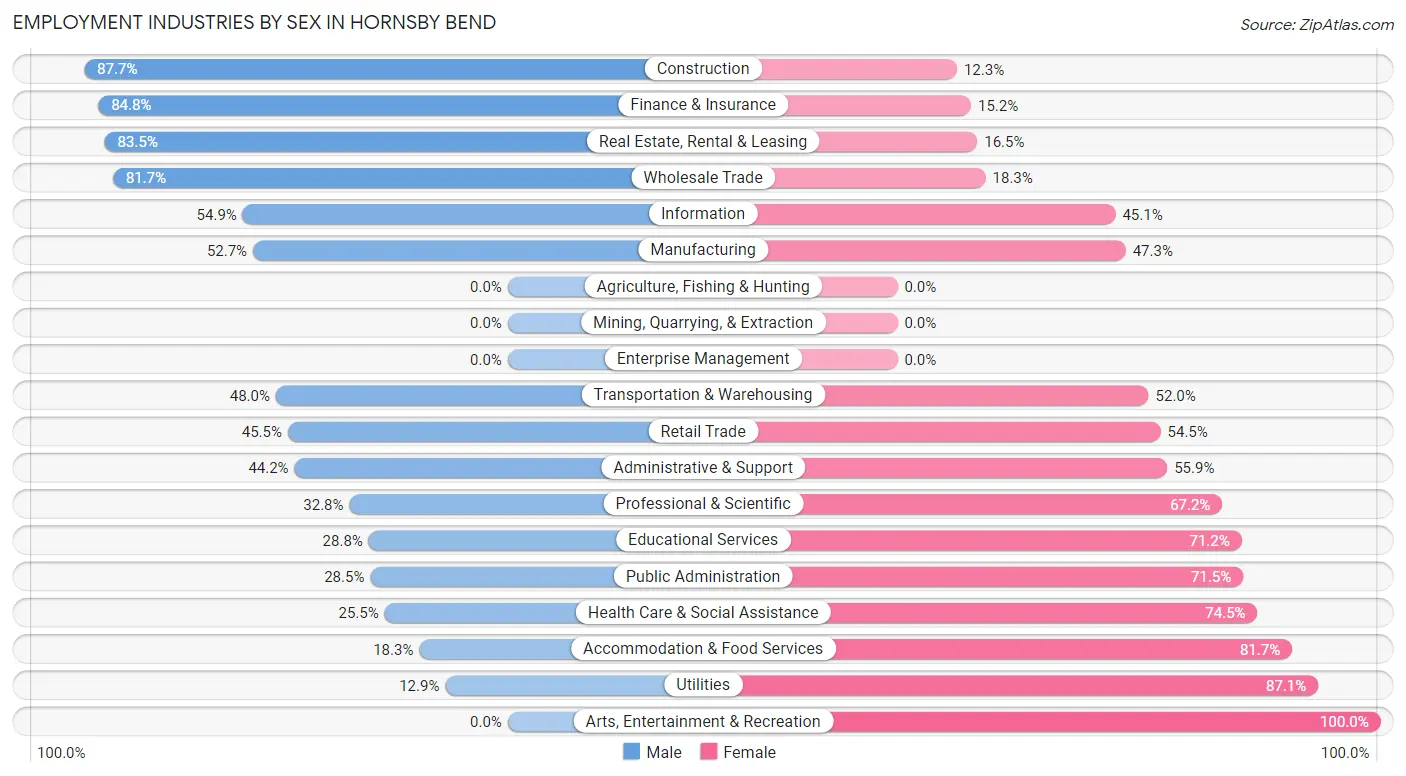
Employment Industries by Sex in Hornsby Bend
The Hornsby Bend industries that see more men than women are Construction (87.7%), Finance & Insurance (84.8%), and Real Estate, Rental & Leasing (83.5%), whereas the industries that tend to have a higher number of women are Arts, Entertainment & Recreation (100.0%), Utilities (87.1%), and Accommodation & Food Services (81.7%).
| Industry | Male | Female |
| Agriculture, Fishing & Hunting | 0 (0.0%) | 0 (0.0%) |
| Mining, Quarrying, & Extraction | 0 (0.0%) | 0 (0.0%) |
| Construction | 910 (87.7%) | 128 (12.3%) |
| Manufacturing | 173 (52.7%) | 155 (47.3%) |
| Wholesale Trade | 94 (81.7%) | 21 (18.3%) |
| Retail Trade | 193 (45.5%) | 231 (54.5%) |
| Transportation & Warehousing | 169 (48.0%) | 183 (52.0%) |
| Utilities | 11 (12.9%) | 74 (87.1%) |
| Information | 96 (54.9%) | 79 (45.1%) |
| Finance & Insurance | 278 (84.8%) | 50 (15.2%) |
| Real Estate, Rental & Leasing | 106 (83.5%) | 21 (16.5%) |
| Professional & Scientific | 198 (32.8%) | 406 (67.2%) |
| Enterprise Management | 0 (0.0%) | 0 (0.0%) |
| Administrative & Support | 83 (44.2%) | 105 (55.8%) |
| Educational Services | 158 (28.8%) | 391 (71.2%) |
| Health Care & Social Assistance | 128 (25.5%) | 374 (74.5%) |
| Arts, Entertainment & Recreation | 0 (0.0%) | 50 (100.0%) |
| Accommodation & Food Services | 72 (18.3%) | 321 (81.7%) |
| Public Administration | 183 (28.5%) | 460 (71.5%) |
| Total | 3,046 (49.0%) | 3,172 (51.0%) |
Education in Hornsby Bend
School Enrollment in Hornsby Bend
The most common levels of schooling among the 2,730 students in Hornsby Bend are high school (1,093 | 40.0%), elementary school (565 | 20.7%), and middle school (473 | 17.3%).
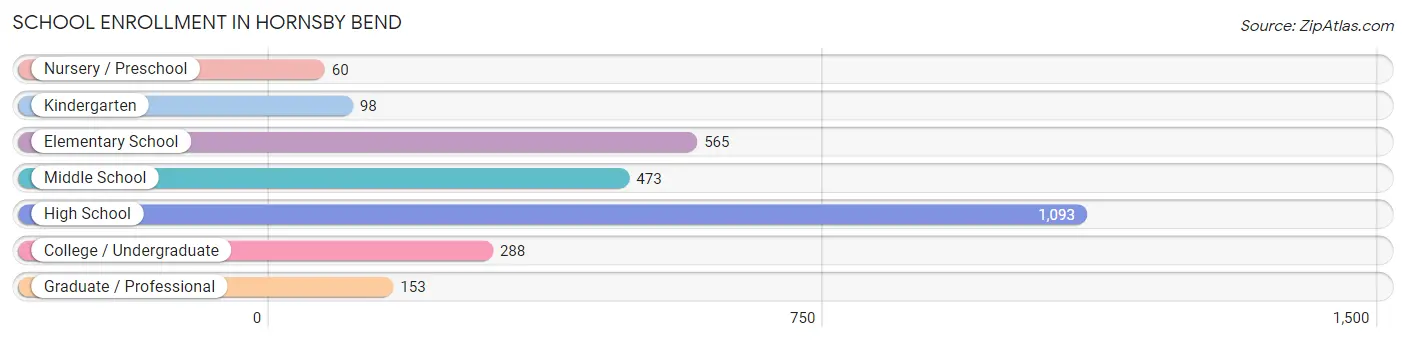
| School Level | # Students | % Students |
| Nursery / Preschool | 60 | 2.2% |
| Kindergarten | 98 | 3.6% |
| Elementary School | 565 | 20.7% |
| Middle School | 473 | 17.3% |
| High School | 1,093 | 40.0% |
| College / Undergraduate | 288 | 10.5% |
| Graduate / Professional | 153 | 5.6% |
| Total | 2,730 | 100.0% |
School Enrollment by Age by Funding Source in Hornsby Bend
Out of a total of 2,730 students who are enrolled in schools in Hornsby Bend, 191 (7.0%) attend a private institution, while the remaining 2,539 (93.0%) are enrolled in public schools. The age group of 18 to 19 year olds has the highest likelihood of being enrolled in private schools, with 21 (52.5% in the age bracket) enrolled. Conversely, the age group of 3 to 4 year olds has the lowest likelihood of being enrolled in a private school, with 74 (100.0% in the age bracket) attending a public institution.
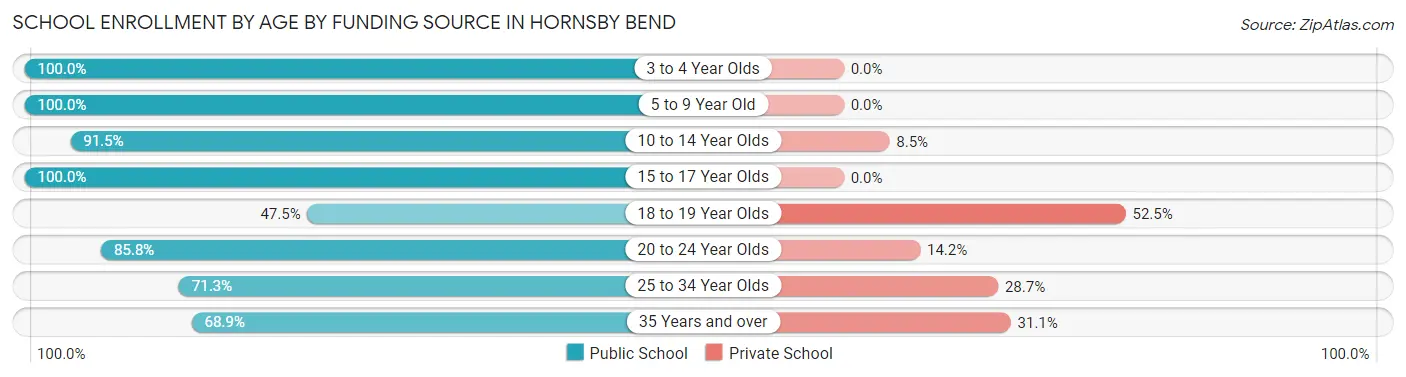
| Age Bracket | Public School | Private School |
| 3 to 4 Year Olds | 74 (100.0%) | 0 (0.0%) |
| 5 to 9 Year Old | 516 (100.0%) | 0 (0.0%) |
| 10 to 14 Year Olds | 656 (91.5%) | 61 (8.5%) |
| 15 to 17 Year Olds | 893 (100.0%) | 0 (0.0%) |
| 18 to 19 Year Olds | 19 (47.5%) | 21 (52.5%) |
| 20 to 24 Year Olds | 205 (85.8%) | 34 (14.2%) |
| 25 to 34 Year Olds | 62 (71.3%) | 25 (28.7%) |
| 35 Years and over | 113 (68.9%) | 51 (31.1%) |
| Total | 2,539 (93.0%) | 191 (7.0%) |
Educational Attainment by Field of Study in Hornsby Bend
Business (638 | 21.5%), psychology (504 | 17.0%), education (413 | 13.9%), science & technology (266 | 9.0%), and communications (199 | 6.7%) are the most common fields of study among 2,968 individuals in Hornsby Bend who have obtained a bachelor's degree or higher.
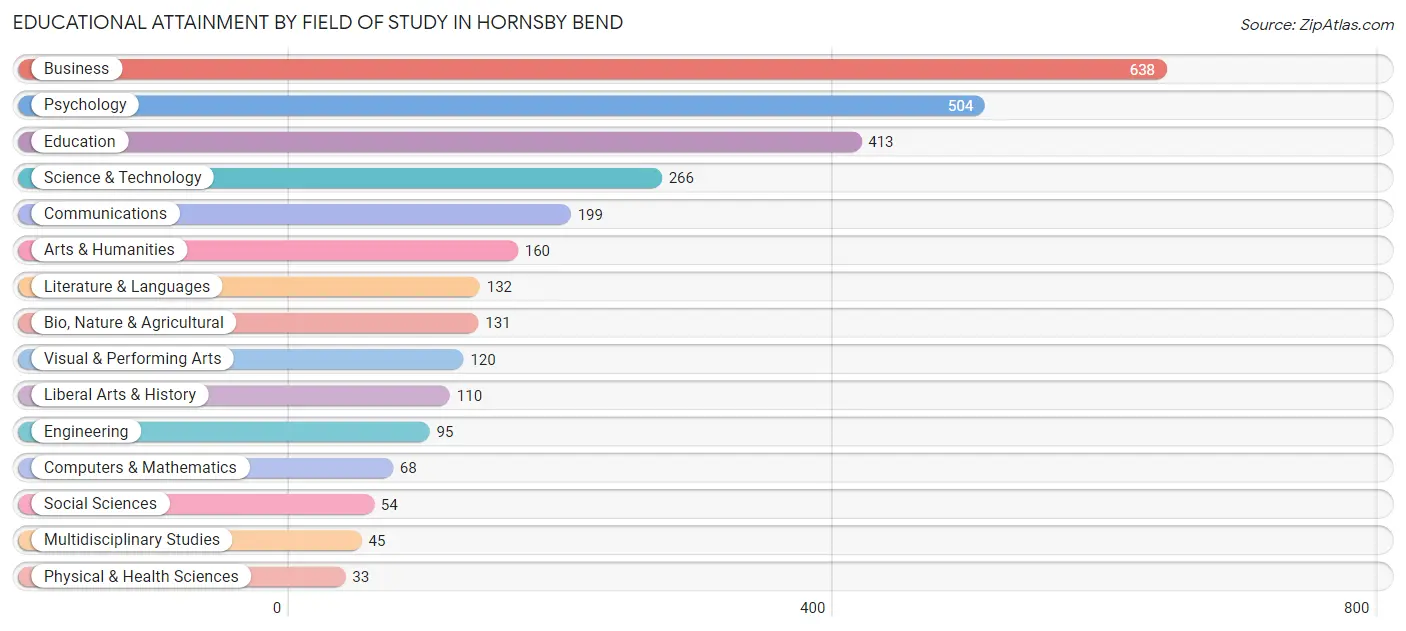
| Field of Study | # Graduates | % Graduates |
| Computers & Mathematics | 68 | 2.3% |
| Bio, Nature & Agricultural | 131 | 4.4% |
| Physical & Health Sciences | 33 | 1.1% |
| Psychology | 504 | 17.0% |
| Social Sciences | 54 | 1.8% |
| Engineering | 95 | 3.2% |
| Multidisciplinary Studies | 45 | 1.5% |
| Science & Technology | 266 | 9.0% |
| Business | 638 | 21.5% |
| Education | 413 | 13.9% |
| Literature & Languages | 132 | 4.4% |
| Liberal Arts & History | 110 | 3.7% |
| Visual & Performing Arts | 120 | 4.0% |
| Communications | 199 | 6.7% |
| Arts & Humanities | 160 | 5.4% |
| Total | 2,968 | 100.0% |
Transportation & Commute in Hornsby Bend
Vehicle Availability by Sex in Hornsby Bend
The most prevalent vehicle ownership categories in Hornsby Bend are males with 2 vehicles (943, accounting for 31.2%) and females with 2 vehicles (1,331, making up 30.3%).
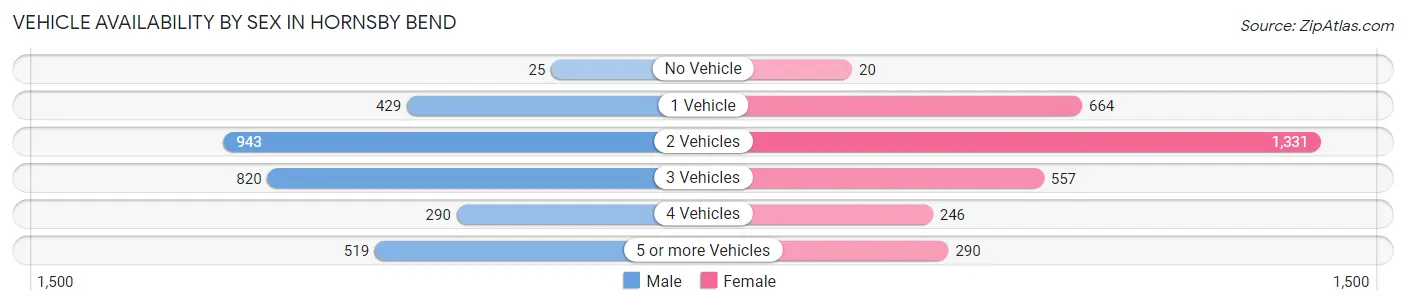
| Vehicles Available | Male | Female |
| No Vehicle | 25 (0.8%) | 20 (0.6%) |
| 1 Vehicle | 429 (14.2%) | 664 (21.4%) |
| 2 Vehicles | 943 (31.2%) | 1,331 (42.8%) |
| 3 Vehicles | 820 (27.1%) | 557 (17.9%) |
| 4 Vehicles | 290 (9.6%) | 246 (7.9%) |
| 5 or more Vehicles | 519 (17.2%) | 290 (9.3%) |
| Total | 3,026 (100.0%) | 3,108 (100.0%) |
Commute Time in Hornsby Bend
The most frequently occuring commute durations in Hornsby Bend are 30 to 34 minutes (1,439 commuters, 27.9%), 20 to 24 minutes (1,011 commuters, 19.6%), and 35 to 39 minutes (786 commuters, 15.3%).
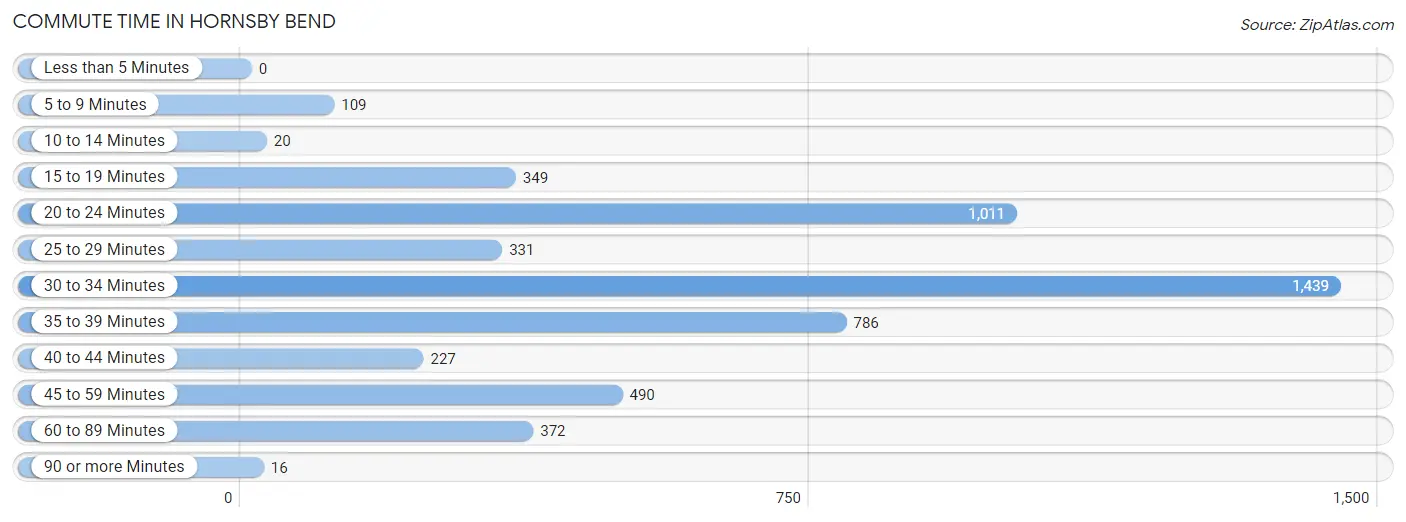
| Commute Time | # Commuters | % Commuters |
| Less than 5 Minutes | 0 | 0.0% |
| 5 to 9 Minutes | 109 | 2.1% |
| 10 to 14 Minutes | 20 | 0.4% |
| 15 to 19 Minutes | 349 | 6.8% |
| 20 to 24 Minutes | 1,011 | 19.6% |
| 25 to 29 Minutes | 331 | 6.4% |
| 30 to 34 Minutes | 1,439 | 27.9% |
| 35 to 39 Minutes | 786 | 15.3% |
| 40 to 44 Minutes | 227 | 4.4% |
| 45 to 59 Minutes | 490 | 9.5% |
| 60 to 89 Minutes | 372 | 7.2% |
| 90 or more Minutes | 16 | 0.3% |
Commute Time by Sex in Hornsby Bend
The most common commute times in Hornsby Bend are 20 to 24 minutes (732 commuters, 28.9%) for males and 30 to 34 minutes (895 commuters, 34.2%) for females.
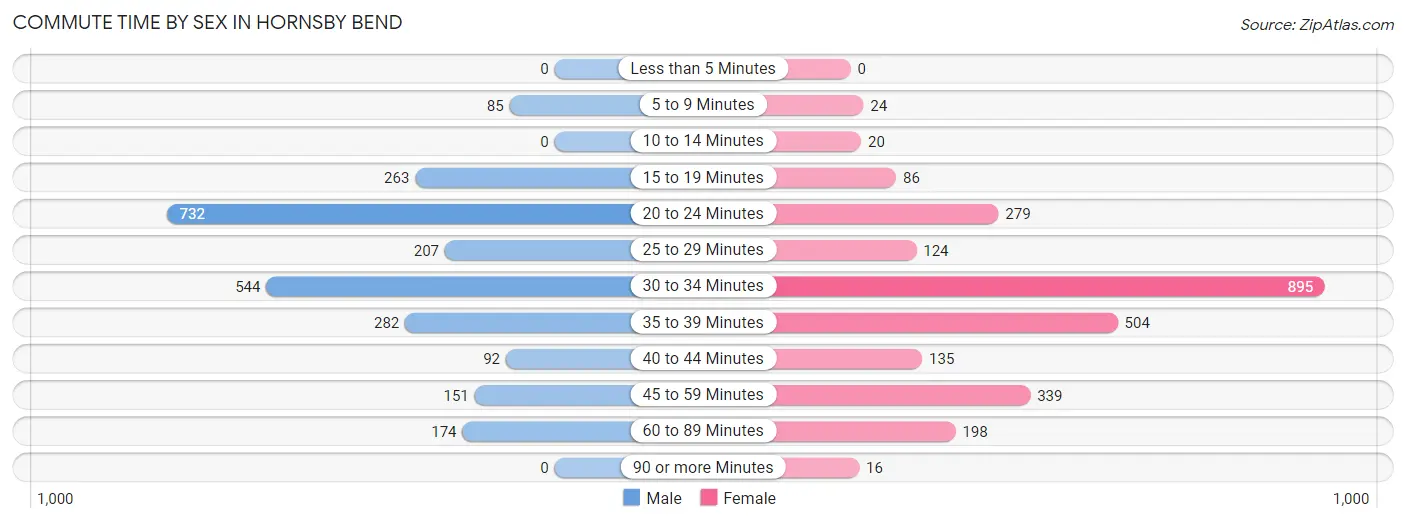
| Commute Time | Male | Female |
| Less than 5 Minutes | 0 (0.0%) | 0 (0.0%) |
| 5 to 9 Minutes | 85 (3.4%) | 24 (0.9%) |
| 10 to 14 Minutes | 0 (0.0%) | 20 (0.8%) |
| 15 to 19 Minutes | 263 (10.4%) | 86 (3.3%) |
| 20 to 24 Minutes | 732 (28.9%) | 279 (10.6%) |
| 25 to 29 Minutes | 207 (8.2%) | 124 (4.7%) |
| 30 to 34 Minutes | 544 (21.5%) | 895 (34.2%) |
| 35 to 39 Minutes | 282 (11.2%) | 504 (19.2%) |
| 40 to 44 Minutes | 92 (3.6%) | 135 (5.1%) |
| 45 to 59 Minutes | 151 (6.0%) | 339 (12.9%) |
| 60 to 89 Minutes | 174 (6.9%) | 198 (7.6%) |
| 90 or more Minutes | 0 (0.0%) | 16 (0.6%) |
Time of Departure to Work by Sex in Hornsby Bend
The most frequent times of departure to work in Hornsby Bend are 6:00 AM to 6:29 AM (886, 35.0%) for males and 8:00 AM to 8:29 AM (425, 16.2%) for females.
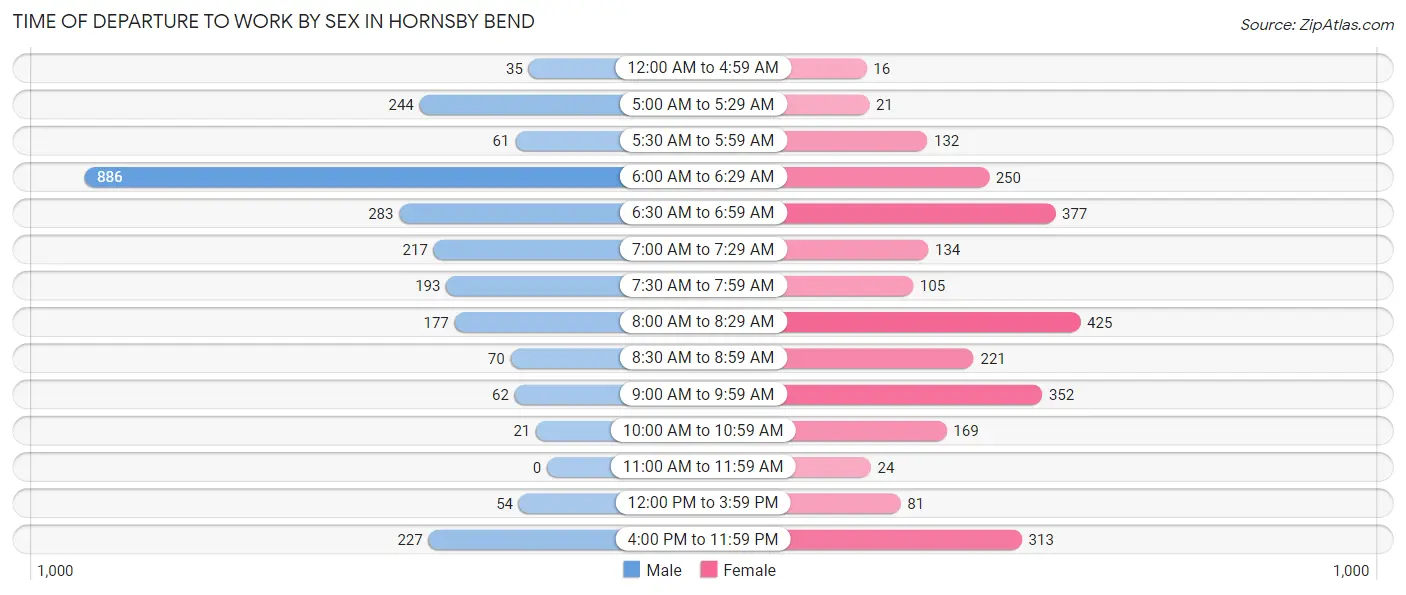
| Time of Departure | Male | Female |
| 12:00 AM to 4:59 AM | 35 (1.4%) | 16 (0.6%) |
| 5:00 AM to 5:29 AM | 244 (9.6%) | 21 (0.8%) |
| 5:30 AM to 5:59 AM | 61 (2.4%) | 132 (5.0%) |
| 6:00 AM to 6:29 AM | 886 (35.0%) | 250 (9.5%) |
| 6:30 AM to 6:59 AM | 283 (11.2%) | 377 (14.4%) |
| 7:00 AM to 7:29 AM | 217 (8.6%) | 134 (5.1%) |
| 7:30 AM to 7:59 AM | 193 (7.6%) | 105 (4.0%) |
| 8:00 AM to 8:29 AM | 177 (7.0%) | 425 (16.2%) |
| 8:30 AM to 8:59 AM | 70 (2.8%) | 221 (8.4%) |
| 9:00 AM to 9:59 AM | 62 (2.5%) | 352 (13.4%) |
| 10:00 AM to 10:59 AM | 21 (0.8%) | 169 (6.5%) |
| 11:00 AM to 11:59 AM | 0 (0.0%) | 24 (0.9%) |
| 12:00 PM to 3:59 PM | 54 (2.1%) | 81 (3.1%) |
| 4:00 PM to 11:59 PM | 227 (9.0%) | 313 (11.9%) |
| Total | 2,530 (100.0%) | 2,620 (100.0%) |
Housing Occupancy in Hornsby Bend
Occupancy by Ownership in Hornsby Bend
Of the total 3,830 dwellings in Hornsby Bend, owner-occupied units account for 3,240 (84.6%), while renter-occupied units make up 590 (15.4%).
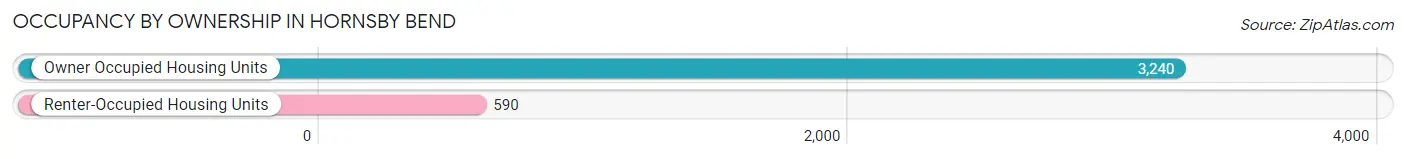
| Occupancy | # Housing Units | % Housing Units |
| Owner Occupied Housing Units | 3,240 | 84.6% |
| Renter-Occupied Housing Units | 590 | 15.4% |
| Total Occupied Housing Units | 3,830 | 100.0% |
Occupancy by Household Size in Hornsby Bend
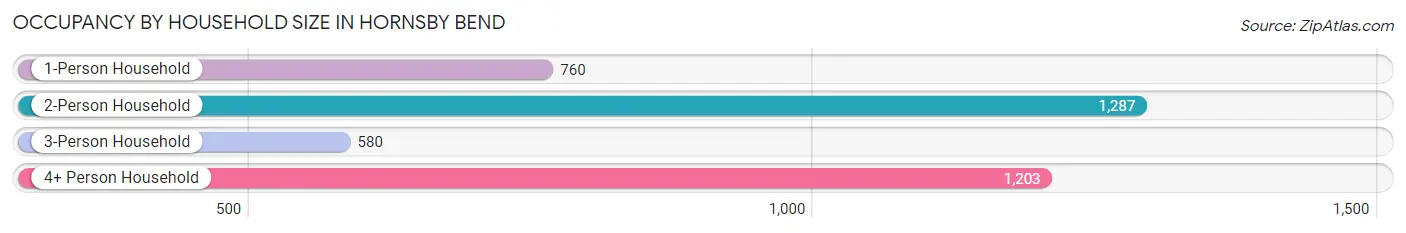
| Household Size | # Housing Units | % Housing Units |
| 1-Person Household | 760 | 19.8% |
| 2-Person Household | 1,287 | 33.6% |
| 3-Person Household | 580 | 15.1% |
| 4+ Person Household | 1,203 | 31.4% |
| Total Housing Units | 3,830 | 100.0% |
Occupancy by Ownership by Household Size in Hornsby Bend
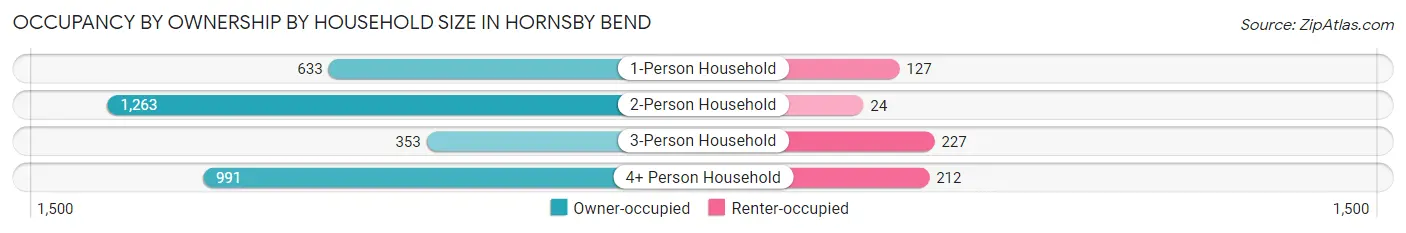
| Household Size | Owner-occupied | Renter-occupied |
| 1-Person Household | 633 (83.3%) | 127 (16.7%) |
| 2-Person Household | 1,263 (98.1%) | 24 (1.9%) |
| 3-Person Household | 353 (60.9%) | 227 (39.1%) |
| 4+ Person Household | 991 (82.4%) | 212 (17.6%) |
| Total Housing Units | 3,240 (84.6%) | 590 (15.4%) |
Occupancy by Educational Attainment in Hornsby Bend
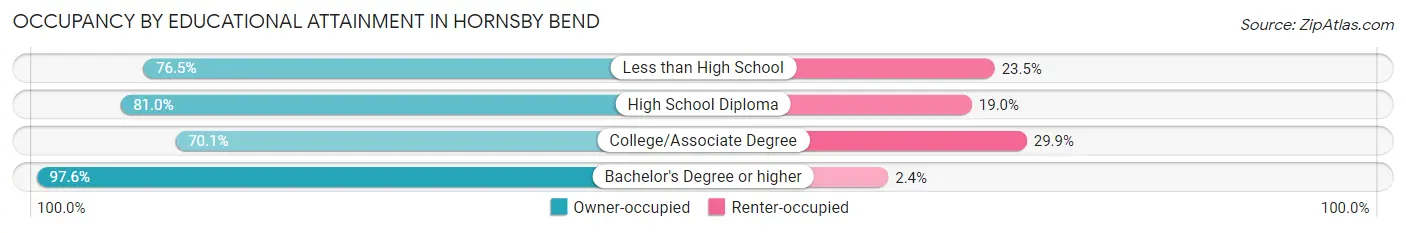
| Household Size | Owner-occupied | Renter-occupied |
| Less than High School | 358 (76.5%) | 110 (23.5%) |
| High School Diploma | 581 (81.0%) | 136 (19.0%) |
| College/Associate Degree | 716 (70.1%) | 305 (29.9%) |
| Bachelor's Degree or higher | 1,585 (97.6%) | 39 (2.4%) |
Occupancy by Age of Householder in Hornsby Bend
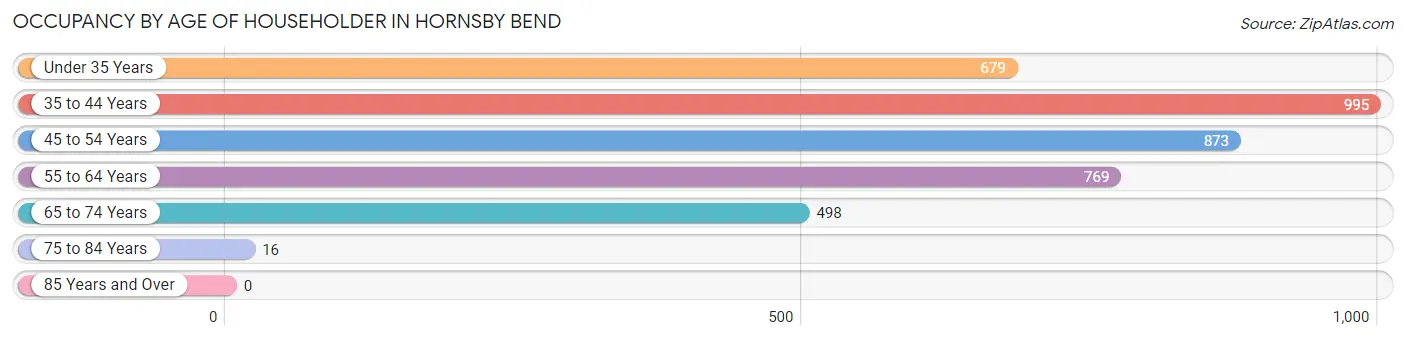
| Age Bracket | # Households | % Households |
| Under 35 Years | 679 | 17.7% |
| 35 to 44 Years | 995 | 26.0% |
| 45 to 54 Years | 873 | 22.8% |
| 55 to 64 Years | 769 | 20.1% |
| 65 to 74 Years | 498 | 13.0% |
| 75 to 84 Years | 16 | 0.4% |
| 85 Years and Over | 0 | 0.0% |
| Total | 3,830 | 100.0% |
Housing Finances in Hornsby Bend
Median Income by Occupancy in Hornsby Bend
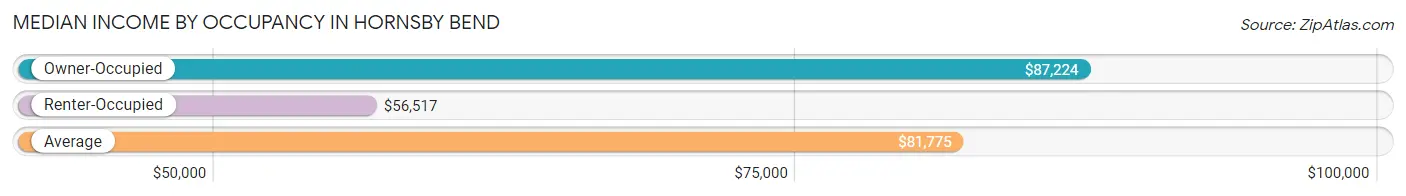
| Occupancy Type | # Households | Median Income |
| Owner-Occupied | 3,240 (84.6%) | $87,224 |
| Renter-Occupied | 590 (15.4%) | $56,517 |
| Average | 3,830 (100.0%) | $81,775 |
Occupancy by Householder Income Bracket in Hornsby Bend
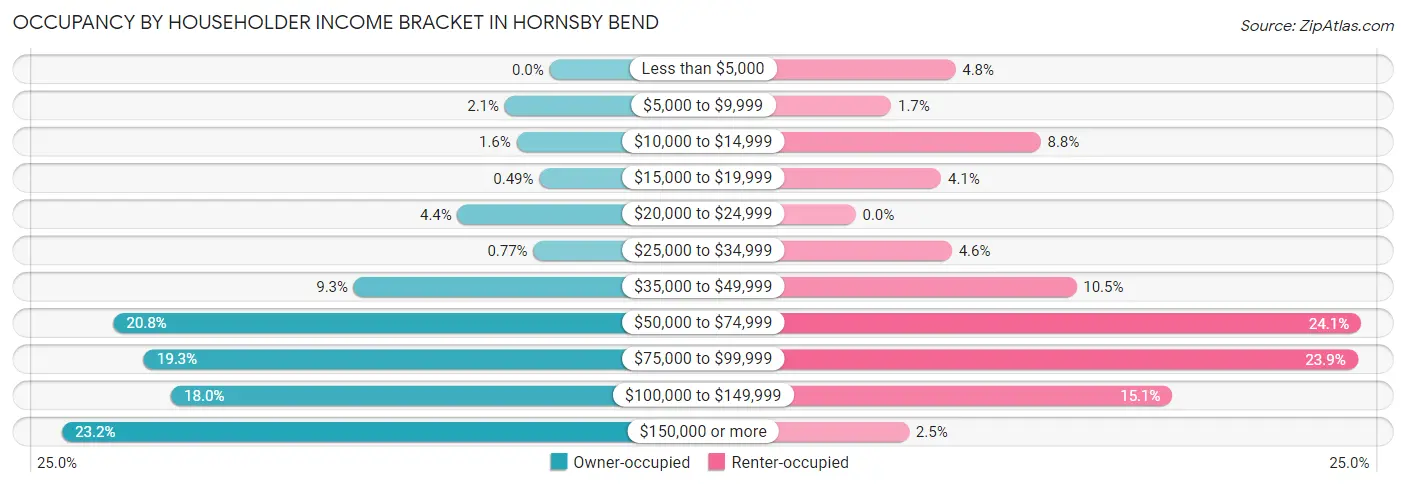
| Income Bracket | Owner-occupied | Renter-occupied |
| Less than $5,000 | 0 (0.0%) | 28 (4.8%) |
| $5,000 to $9,999 | 69 (2.1%) | 10 (1.7%) |
| $10,000 to $14,999 | 51 (1.6%) | 52 (8.8%) |
| $15,000 to $19,999 | 16 (0.5%) | 24 (4.1%) |
| $20,000 to $24,999 | 142 (4.4%) | 0 (0.0%) |
| $25,000 to $34,999 | 25 (0.8%) | 27 (4.6%) |
| $35,000 to $49,999 | 302 (9.3%) | 62 (10.5%) |
| $50,000 to $74,999 | 673 (20.8%) | 142 (24.1%) |
| $75,000 to $99,999 | 626 (19.3%) | 141 (23.9%) |
| $100,000 to $149,999 | 584 (18.0%) | 89 (15.1%) |
| $150,000 or more | 752 (23.2%) | 15 (2.5%) |
| Total | 3,240 (100.0%) | 590 (100.0%) |
Monthly Housing Cost Tiers in Hornsby Bend
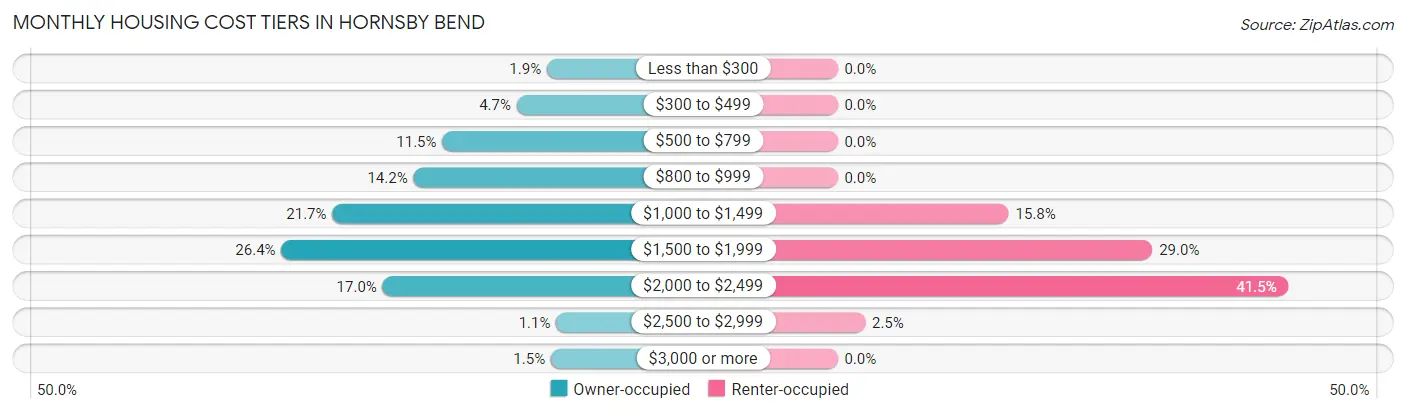
| Monthly Cost | Owner-occupied | Renter-occupied |
| Less than $300 | 62 (1.9%) | 0 (0.0%) |
| $300 to $499 | 152 (4.7%) | 0 (0.0%) |
| $500 to $799 | 374 (11.5%) | 0 (0.0%) |
| $800 to $999 | 460 (14.2%) | 0 (0.0%) |
| $1,000 to $1,499 | 702 (21.7%) | 93 (15.8%) |
| $1,500 to $1,999 | 854 (26.4%) | 171 (29.0%) |
| $2,000 to $2,499 | 552 (17.0%) | 245 (41.5%) |
| $2,500 to $2,999 | 34 (1.1%) | 15 (2.5%) |
| $3,000 or more | 50 (1.5%) | 0 (0.0%) |
| Total | 3,240 (100.0%) | 590 (100.0%) |
Physical Housing Characteristics in Hornsby Bend
Housing Structures in Hornsby Bend
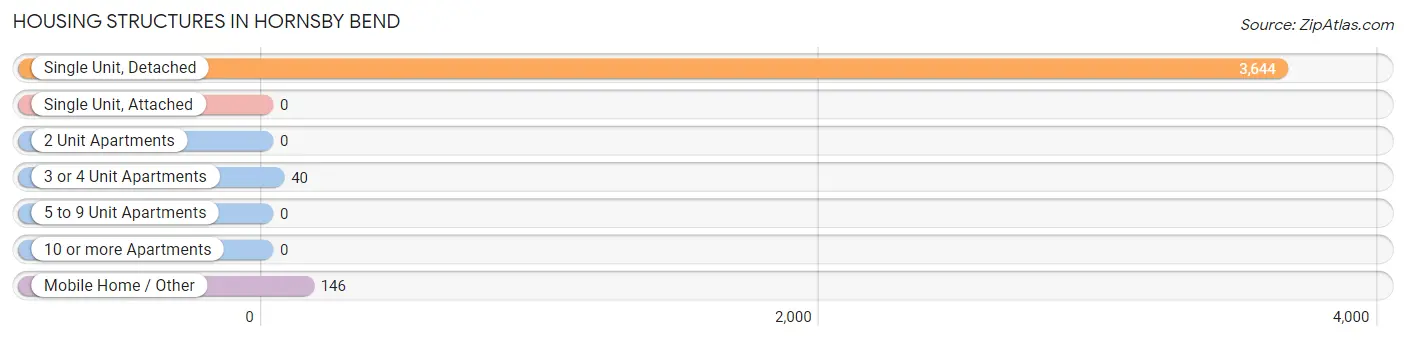
| Structure Type | # Housing Units | % Housing Units |
| Single Unit, Detached | 3,644 | 95.1% |
| Single Unit, Attached | 0 | 0.0% |
| 2 Unit Apartments | 0 | 0.0% |
| 3 or 4 Unit Apartments | 40 | 1.0% |
| 5 to 9 Unit Apartments | 0 | 0.0% |
| 10 or more Apartments | 0 | 0.0% |
| Mobile Home / Other | 146 | 3.8% |
| Total | 3,830 | 100.0% |
Housing Structures by Occupancy in Hornsby Bend
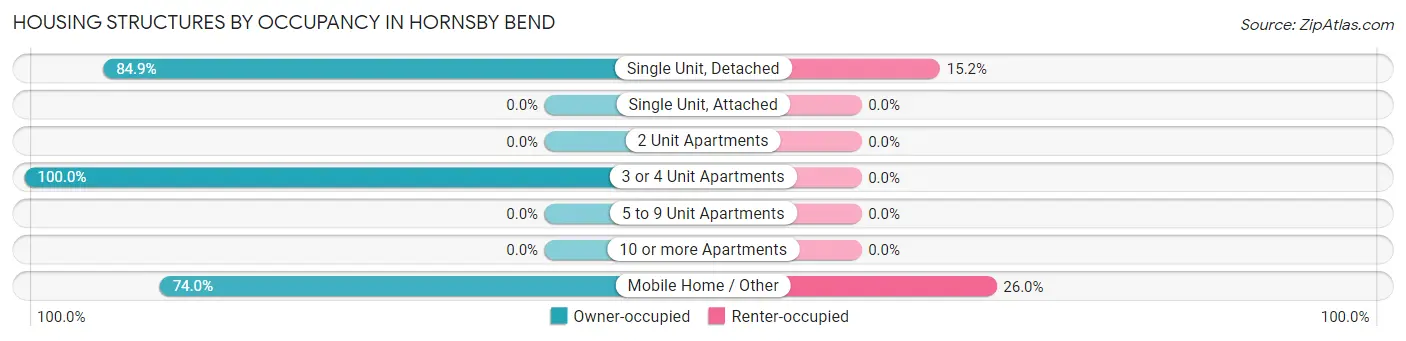
| Structure Type | Owner-occupied | Renter-occupied |
| Single Unit, Detached | 3,092 (84.9%) | 552 (15.1%) |
| Single Unit, Attached | 0 (0.0%) | 0 (0.0%) |
| 2 Unit Apartments | 0 (0.0%) | 0 (0.0%) |
| 3 or 4 Unit Apartments | 40 (100.0%) | 0 (0.0%) |
| 5 to 9 Unit Apartments | 0 (0.0%) | 0 (0.0%) |
| 10 or more Apartments | 0 (0.0%) | 0 (0.0%) |
| Mobile Home / Other | 108 (74.0%) | 38 (26.0%) |
| Total | 3,240 (84.6%) | 590 (15.4%) |
Housing Structures by Number of Rooms in Hornsby Bend
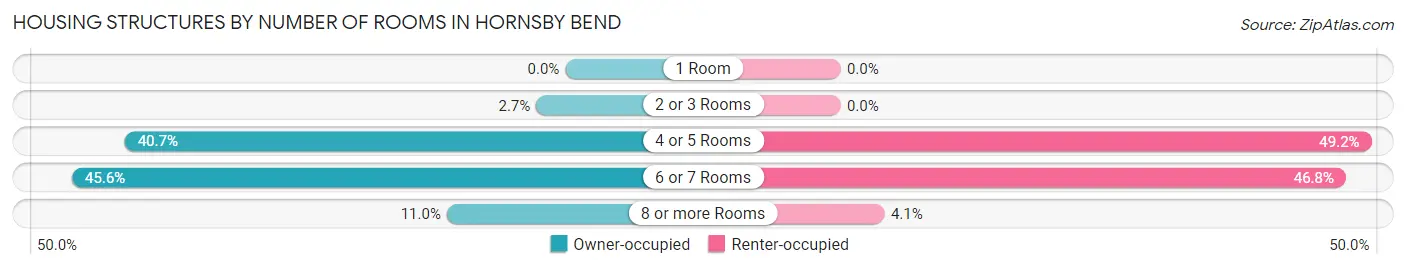
| Number of Rooms | Owner-occupied | Renter-occupied |
| 1 Room | 0 (0.0%) | 0 (0.0%) |
| 2 or 3 Rooms | 87 (2.7%) | 0 (0.0%) |
| 4 or 5 Rooms | 1,320 (40.7%) | 290 (49.1%) |
| 6 or 7 Rooms | 1,478 (45.6%) | 276 (46.8%) |
| 8 or more Rooms | 355 (11.0%) | 24 (4.1%) |
| Total | 3,240 (100.0%) | 590 (100.0%) |
Housing Structure by Heating Type in Hornsby Bend
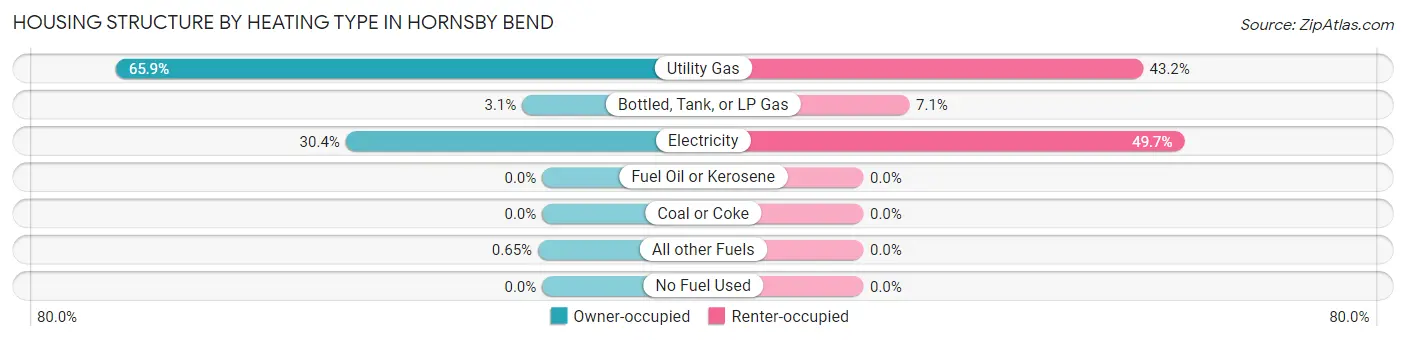
| Heating Type | Owner-occupied | Renter-occupied |
| Utility Gas | 2,135 (65.9%) | 255 (43.2%) |
| Bottled, Tank, or LP Gas | 100 (3.1%) | 42 (7.1%) |
| Electricity | 984 (30.4%) | 293 (49.7%) |
| Fuel Oil or Kerosene | 0 (0.0%) | 0 (0.0%) |
| Coal or Coke | 0 (0.0%) | 0 (0.0%) |
| All other Fuels | 21 (0.6%) | 0 (0.0%) |
| No Fuel Used | 0 (0.0%) | 0 (0.0%) |
| Total | 3,240 (100.0%) | 590 (100.0%) |
Household Vehicle Usage in Hornsby Bend
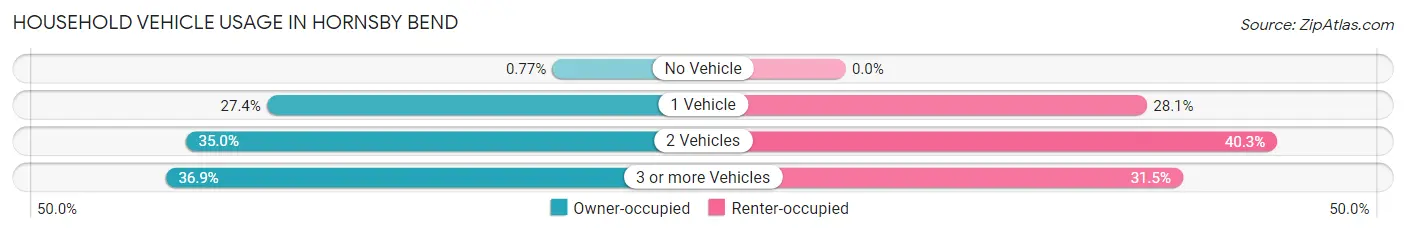
| Vehicles per Household | Owner-occupied | Renter-occupied |
| No Vehicle | 25 (0.8%) | 0 (0.0%) |
| 1 Vehicle | 888 (27.4%) | 166 (28.1%) |
| 2 Vehicles | 1,133 (35.0%) | 238 (40.3%) |
| 3 or more Vehicles | 1,194 (36.8%) | 186 (31.5%) |
| Total | 3,240 (100.0%) | 590 (100.0%) |
Real Estate & Mortgages in Hornsby Bend
Real Estate and Mortgage Overview in Hornsby Bend
| Characteristic | Without Mortgage | With Mortgage |
| Housing Units | 1,039 | 2,201 |
| Median Property Value | $226,900 | $244,400 |
| Median Household Income | $91,060 | $506 |
| Monthly Housing Costs | $694 | $50 |
| Real Estate Taxes | $3,790 | $100 |
Property Value by Mortgage Status in Hornsby Bend
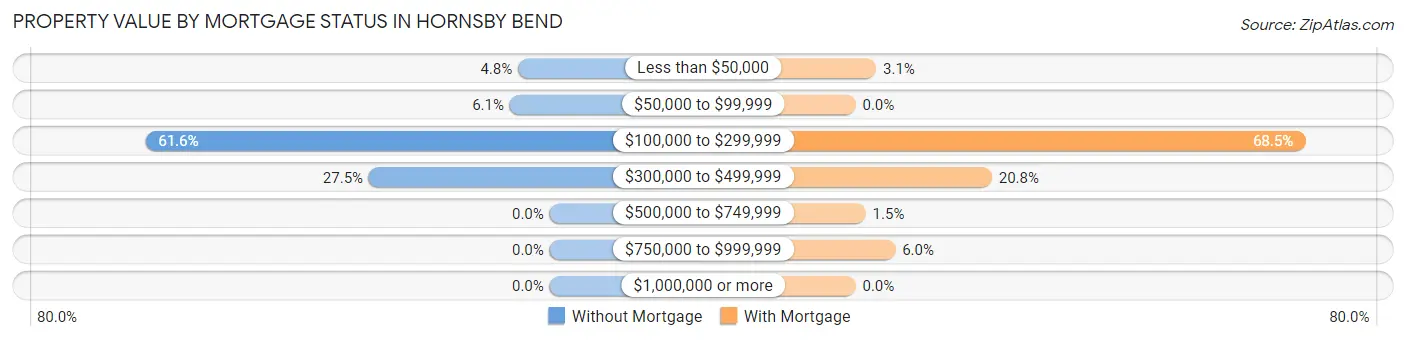
| Property Value | Without Mortgage | With Mortgage |
| Less than $50,000 | 50 (4.8%) | 69 (3.1%) |
| $50,000 to $99,999 | 63 (6.1%) | 0 (0.0%) |
| $100,000 to $299,999 | 640 (61.6%) | 1,508 (68.5%) |
| $300,000 to $499,999 | 286 (27.5%) | 457 (20.8%) |
| $500,000 to $749,999 | 0 (0.0%) | 34 (1.5%) |
| $750,000 to $999,999 | 0 (0.0%) | 133 (6.0%) |
| $1,000,000 or more | 0 (0.0%) | 0 (0.0%) |
| Total | 1,039 (100.0%) | 2,201 (100.0%) |
Household Income by Mortgage Status in Hornsby Bend
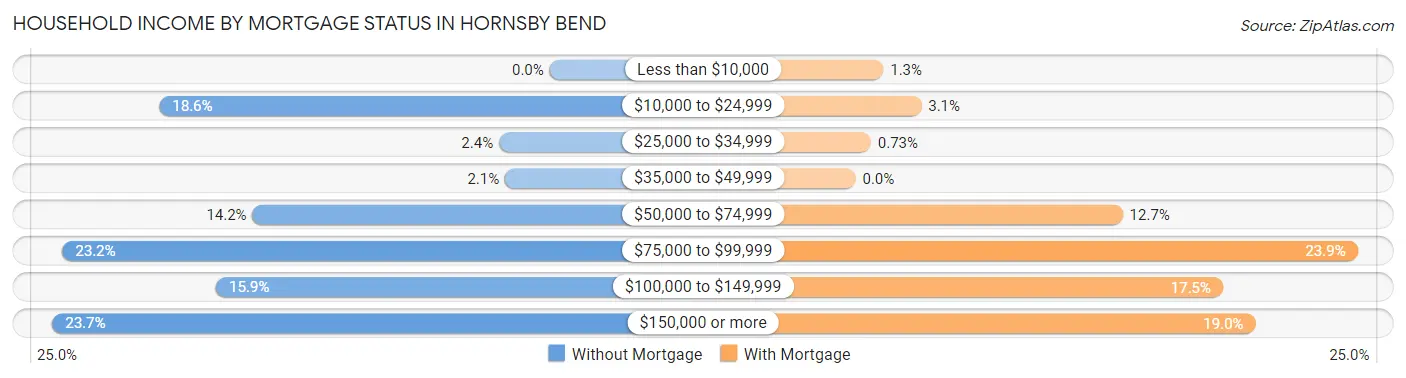
| Household Income | Without Mortgage | With Mortgage |
| Less than $10,000 | 0 (0.0%) | 29 (1.3%) |
| $10,000 to $24,999 | 193 (18.6%) | 69 (3.1%) |
| $25,000 to $34,999 | 25 (2.4%) | 16 (0.7%) |
| $35,000 to $49,999 | 22 (2.1%) | 0 (0.0%) |
| $50,000 to $74,999 | 147 (14.1%) | 280 (12.7%) |
| $75,000 to $99,999 | 241 (23.2%) | 526 (23.9%) |
| $100,000 to $149,999 | 165 (15.9%) | 385 (17.5%) |
| $150,000 or more | 246 (23.7%) | 419 (19.0%) |
| Total | 1,039 (100.0%) | 2,201 (100.0%) |
Property Value to Household Income Ratio in Hornsby Bend
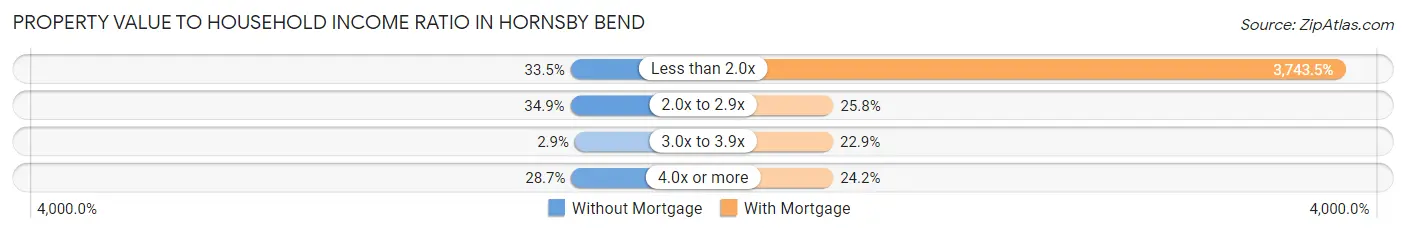
| Value-to-Income Ratio | Without Mortgage | With Mortgage |
| Less than 2.0x | 348 (33.5%) | 82,395 (3,743.5%) |
| 2.0x to 2.9x | 363 (34.9%) | 567 (25.8%) |
| 3.0x to 3.9x | 30 (2.9%) | 503 (22.9%) |
| 4.0x or more | 298 (28.7%) | 532 (24.2%) |
| Total | 1,039 (100.0%) | 2,201 (100.0%) |
Real Estate Taxes by Mortgage Status in Hornsby Bend
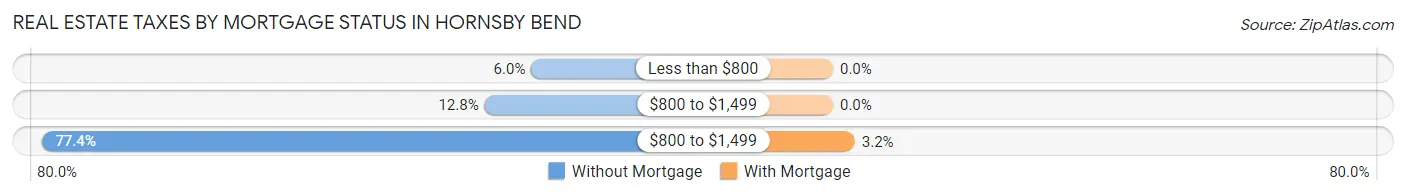
| Property Taxes | Without Mortgage | With Mortgage |
| Less than $800 | 62 (6.0%) | 0 (0.0%) |
| $800 to $1,499 | 133 (12.8%) | 0 (0.0%) |
| $800 to $1,499 | 804 (77.4%) | 70 (3.2%) |
| Total | 1,039 (100.0%) | 2,201 (100.0%) |
Health & Disability in Hornsby Bend
Health Insurance Coverage by Age in Hornsby Bend
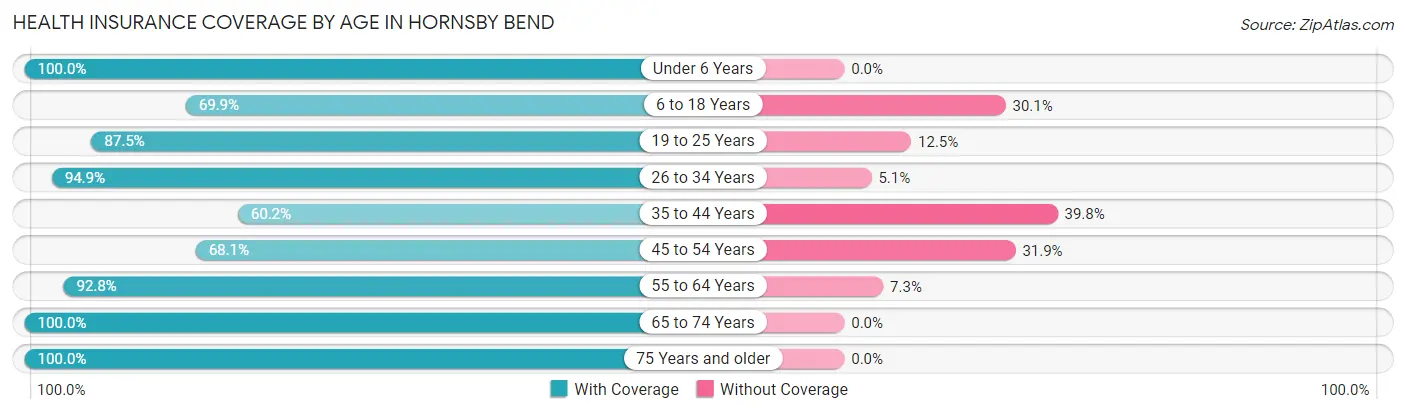
| Age Bracket | With Coverage | Without Coverage |
| Under 6 Years | 701 (100.0%) | 0 (0.0%) |
| 6 to 18 Years | 1,551 (69.9%) | 667 (30.1%) |
| 19 to 25 Years | 527 (87.5%) | 75 (12.5%) |
| 26 to 34 Years | 1,516 (94.9%) | 81 (5.1%) |
| 35 to 44 Years | 1,213 (60.2%) | 801 (39.8%) |
| 45 to 54 Years | 1,124 (68.1%) | 527 (31.9%) |
| 55 to 64 Years | 1,292 (92.7%) | 101 (7.2%) |
| 65 to 74 Years | 740 (100.0%) | 0 (0.0%) |
| 75 Years and older | 90 (100.0%) | 0 (0.0%) |
| Total | 8,754 (79.5%) | 2,252 (20.5%) |
Health Insurance Coverage by Citizenship Status in Hornsby Bend
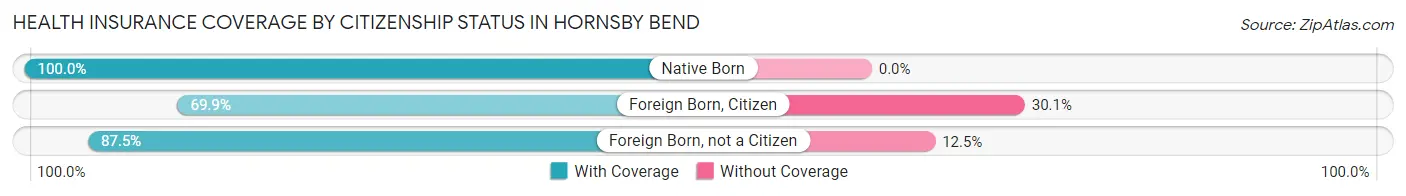
| Citizenship Status | With Coverage | Without Coverage |
| Native Born | 701 (100.0%) | 0 (0.0%) |
| Foreign Born, Citizen | 1,551 (69.9%) | 667 (30.1%) |
| Foreign Born, not a Citizen | 527 (87.5%) | 75 (12.5%) |
Health Insurance Coverage by Household Income in Hornsby Bend
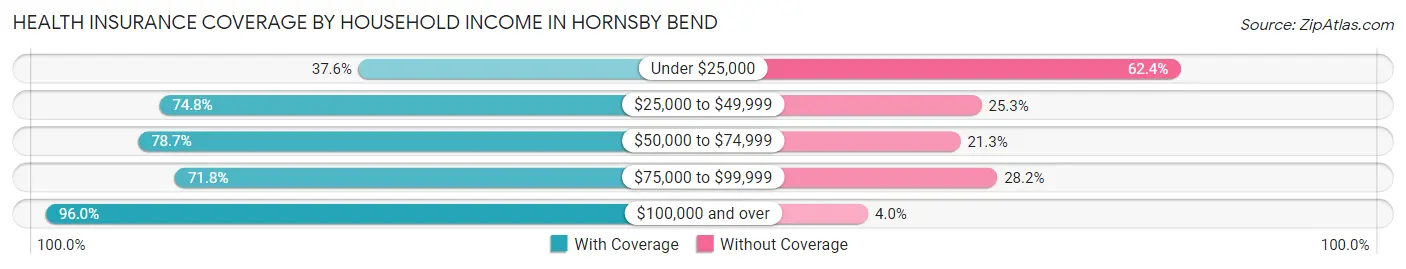
| Household Income | With Coverage | Without Coverage |
| Under $25,000 | 357 (37.6%) | 593 (62.4%) |
| $25,000 to $49,999 | 962 (74.8%) | 325 (25.3%) |
| $50,000 to $74,999 | 1,711 (78.7%) | 463 (21.3%) |
| $75,000 to $99,999 | 1,787 (71.8%) | 701 (28.2%) |
| $100,000 and over | 3,923 (96.0%) | 163 (4.0%) |
Public vs Private Health Insurance Coverage by Age in Hornsby Bend
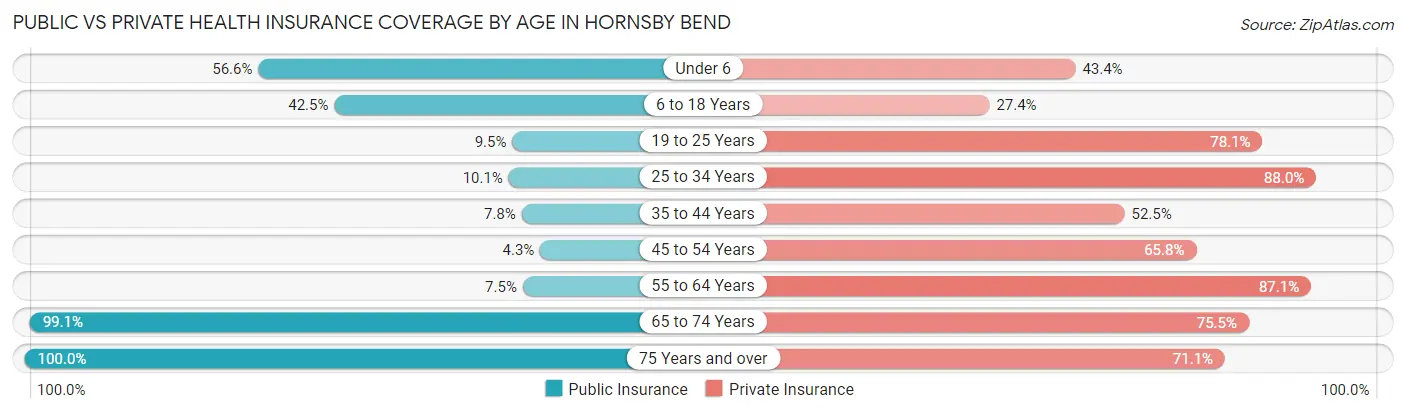
| Age Bracket | Public Insurance | Private Insurance |
| Under 6 | 397 (56.6%) | 304 (43.4%) |
| 6 to 18 Years | 943 (42.5%) | 608 (27.4%) |
| 19 to 25 Years | 57 (9.5%) | 470 (78.1%) |
| 25 to 34 Years | 162 (10.1%) | 1,406 (88.0%) |
| 35 to 44 Years | 156 (7.7%) | 1,057 (52.5%) |
| 45 to 54 Years | 71 (4.3%) | 1,086 (65.8%) |
| 55 to 64 Years | 105 (7.5%) | 1,213 (87.1%) |
| 65 to 74 Years | 733 (99.1%) | 559 (75.5%) |
| 75 Years and over | 90 (100.0%) | 64 (71.1%) |
| Total | 2,714 (24.7%) | 6,767 (61.5%) |
Disability Status by Sex by Age in Hornsby Bend
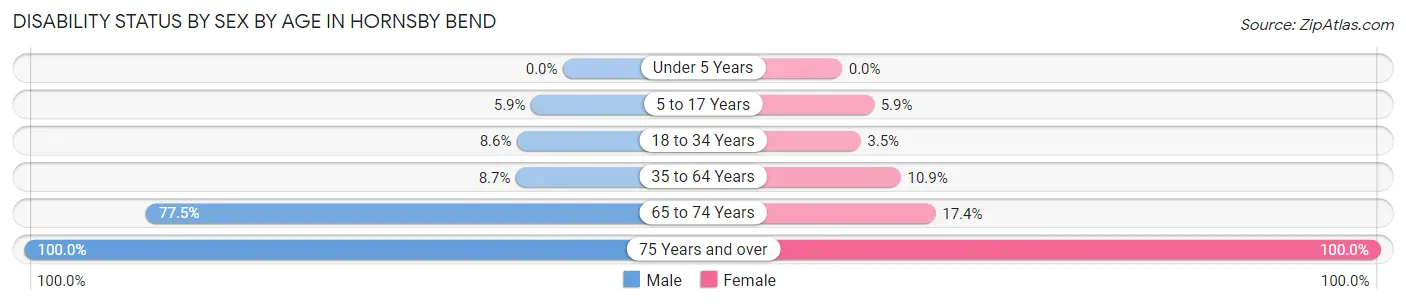
| Age Bracket | Male | Female |
| Under 5 Years | 0 (0.0%) | 0 (0.0%) |
| 5 to 17 Years | 77 (5.9%) | 52 (5.9%) |
| 18 to 34 Years | 105 (8.6%) | 36 (3.5%) |
| 35 to 64 Years | 197 (8.7%) | 306 (10.9%) |
| 65 to 74 Years | 158 (77.4%) | 93 (17.3%) |
| 75 Years and over | 16 (100.0%) | 74 (100.0%) |
Disability Class by Sex by Age in Hornsby Bend
Disability Class: Hearing Difficulty
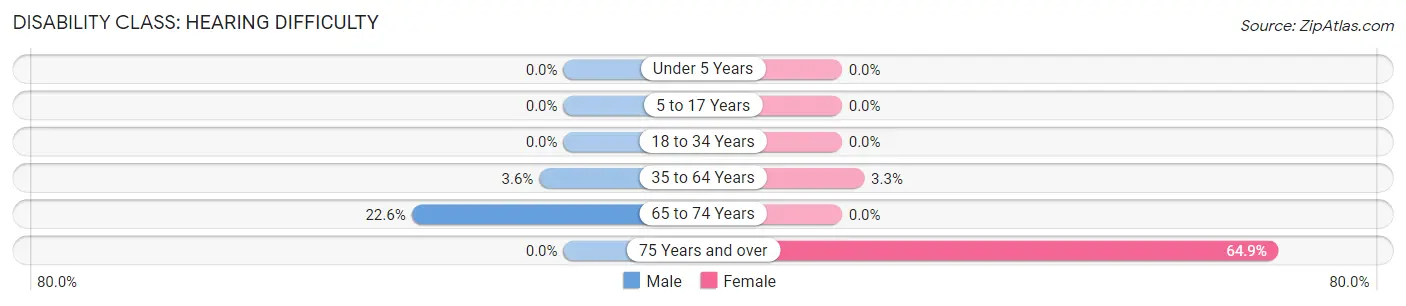
| Age Bracket | Male | Female |
| Under 5 Years | 0 (0.0%) | 0 (0.0%) |
| 5 to 17 Years | 0 (0.0%) | 0 (0.0%) |
| 18 to 34 Years | 0 (0.0%) | 0 (0.0%) |
| 35 to 64 Years | 81 (3.6%) | 93 (3.3%) |
| 65 to 74 Years | 46 (22.6%) | 0 (0.0%) |
| 75 Years and over | 0 (0.0%) | 48 (64.9%) |
Disability Class: Vision Difficulty
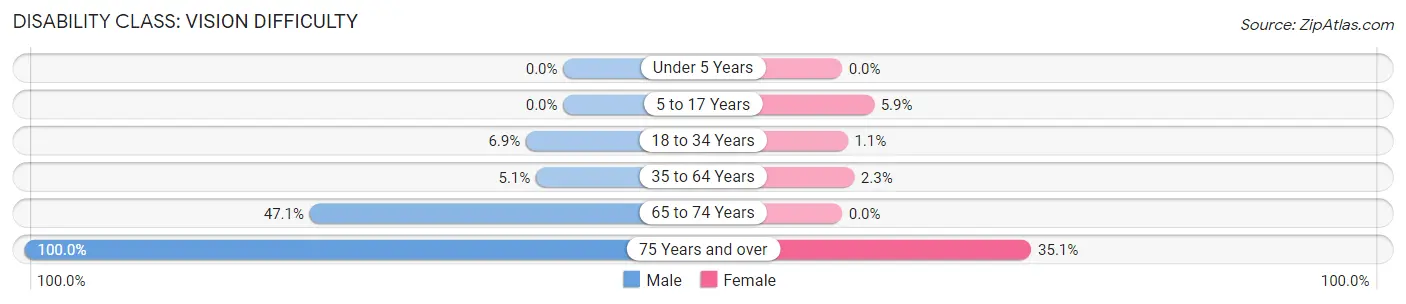
| Age Bracket | Male | Female |
| Under 5 Years | 0 (0.0%) | 0 (0.0%) |
| 5 to 17 Years | 0 (0.0%) | 52 (5.9%) |
| 18 to 34 Years | 85 (6.9%) | 11 (1.1%) |
| 35 to 64 Years | 114 (5.1%) | 63 (2.2%) |
| 65 to 74 Years | 96 (47.1%) | 0 (0.0%) |
| 75 Years and over | 16 (100.0%) | 26 (35.1%) |
Disability Class: Cognitive Difficulty
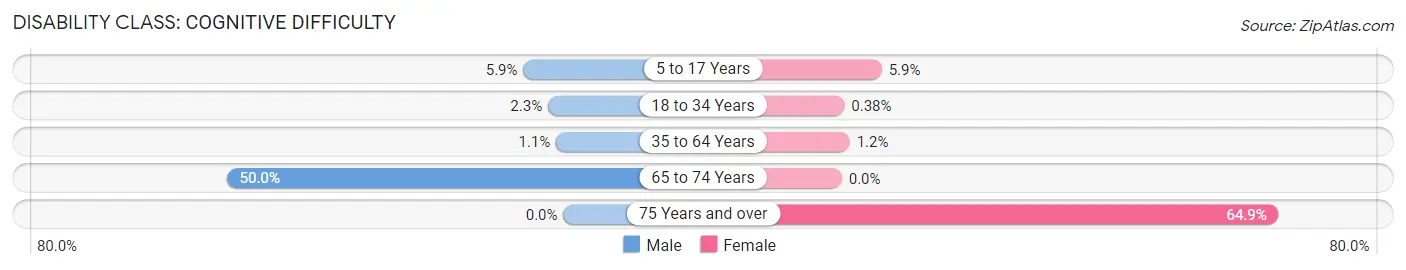
| Age Bracket | Male | Female |
| 5 to 17 Years | 77 (5.9%) | 52 (5.9%) |
| 18 to 34 Years | 28 (2.3%) | 4 (0.4%) |
| 35 to 64 Years | 24 (1.1%) | 33 (1.2%) |
| 65 to 74 Years | 102 (50.0%) | 0 (0.0%) |
| 75 Years and over | 0 (0.0%) | 48 (64.9%) |
Disability Class: Ambulatory Difficulty
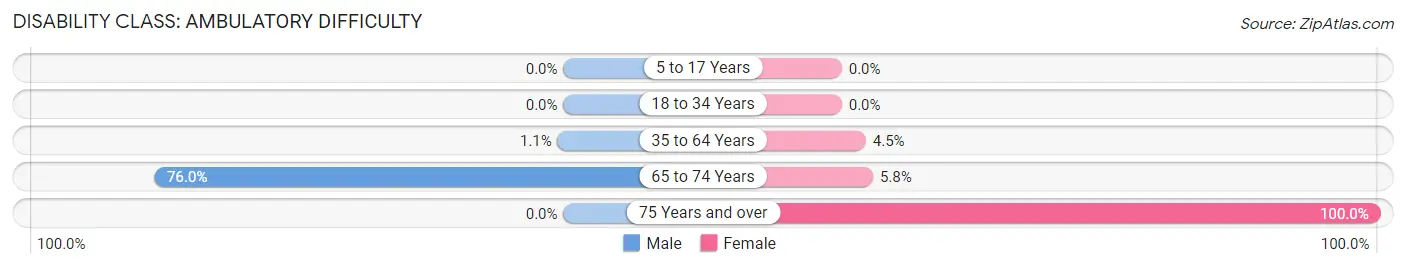
| Age Bracket | Male | Female |
| 5 to 17 Years | 0 (0.0%) | 0 (0.0%) |
| 18 to 34 Years | 0 (0.0%) | 0 (0.0%) |
| 35 to 64 Years | 24 (1.1%) | 125 (4.5%) |
| 65 to 74 Years | 155 (76.0%) | 31 (5.8%) |
| 75 Years and over | 0 (0.0%) | 74 (100.0%) |
Disability Class: Self-Care Difficulty

| Age Bracket | Male | Female |
| 5 to 17 Years | 0 (0.0%) | 0 (0.0%) |
| 18 to 34 Years | 0 (0.0%) | 0 (0.0%) |
| 35 to 64 Years | 0 (0.0%) | 61 (2.2%) |
| 65 to 74 Years | 99 (48.5%) | 0 (0.0%) |
| 75 Years and over | 0 (0.0%) | 48 (64.9%) |
Technology Access in Hornsby Bend
Computing Device Access in Hornsby Bend
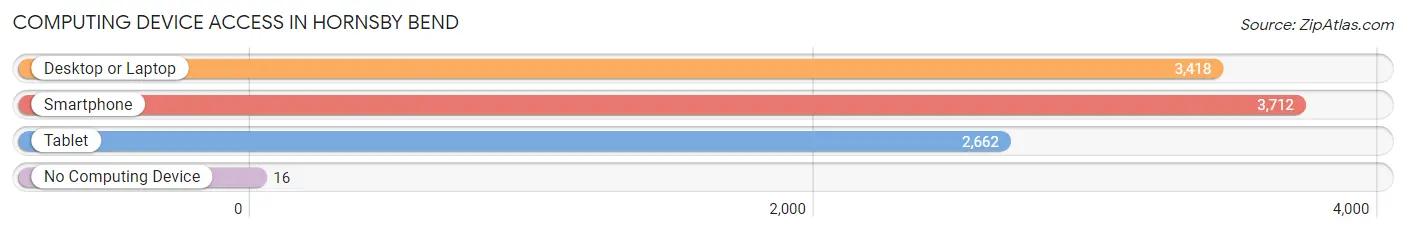
| Device Type | # Households | % Households |
| Desktop or Laptop | 3,418 | 89.2% |
| Smartphone | 3,712 | 96.9% |
| Tablet | 2,662 | 69.5% |
| No Computing Device | 16 | 0.4% |
| Total | 3,830 | 100.0% |
Internet Access in Hornsby Bend
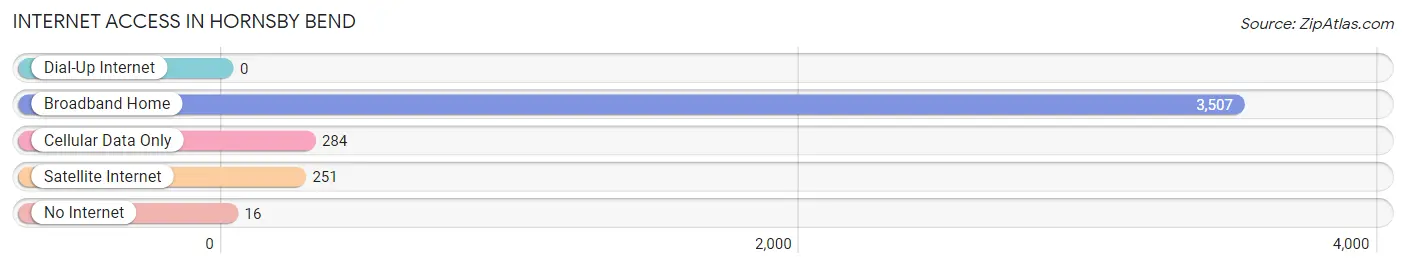
| Internet Type | # Households | % Households |
| Dial-Up Internet | 0 | 0.0% |
| Broadband Home | 3,507 | 91.6% |
| Cellular Data Only | 284 | 7.4% |
| Satellite Internet | 251 | 6.6% |
| No Internet | 16 | 0.4% |
| Total | 3,830 | 100.0% |
Hornsby Bend Summary
Hornsby Bend is an unincorporated community located in Travis County, Texas, United States. It is situated on the eastern edge of the city of Austin, approximately 12 miles southeast of downtown. The community is named after the Hornsby family, who settled in the area in the late 19th century.
History
The Hornsby family first settled in the area in the late 19th century. The family was originally from Tennessee and moved to Texas in search of a better life. The family established a homestead in the area and began farming the land. The community was officially established in 1891 when the Hornsby family opened a post office.
The community grew slowly over the years, but remained largely rural until the 1950s. In the 1950s, the city of Austin began to expand and the area around Hornsby Bend began to develop. The community was annexed by the city of Austin in the 1970s and is now considered part of the city.
Geography
Hornsby Bend is located in Travis County, Texas, approximately 12 miles southeast of downtown Austin. The community is situated on the eastern edge of the city of Austin, near the intersection of Highway 71 and FM 969. The area is mostly flat, with some rolling hills. The terrain is mostly grassland, with some trees and shrubs.
The climate in Hornsby Bend is generally mild, with hot summers and mild winters. The average temperature in the summer is around 90°F, while the average temperature in the winter is around 50°F. The area receives an average of 33 inches of rain per year.
Economy
The economy of Hornsby Bend is largely based on agriculture. The area is home to several farms, which produce a variety of crops, including corn, wheat, and hay. The area is also home to several businesses, including a grocery store, a gas station, and a few restaurants.
The area is also home to several industrial businesses, including a concrete plant, a metal fabrication plant, and a plastics manufacturing plant. The area is also home to several technology companies, including a software development company and a web design firm.
Demographics
As of the 2010 census, the population of Hornsby Bend was 1,845. The population is mostly white (83.3%), with a small Hispanic population (14.2%). The median household income in the area is $50,000, and the median home value is $200,000.
The area is served by the Austin Independent School District. The area is home to several schools, including Hornsby Bend Elementary School, Hornsby Bend Middle School, and Hornsby Bend High School.
Conclusion
Hornsby Bend is an unincorporated community located in Travis County, Texas, United States. It is situated on the eastern edge of the city of Austin, approximately 12 miles southeast of downtown. The community is named after the Hornsby family, who settled in the area in the late 19th century. The economy of Hornsby Bend is largely based on agriculture, with some industrial and technology businesses. The population of Hornsby Bend is mostly white, with a small Hispanic population. The area is served by the Austin Independent School District.
Common Questions
What is Per Capita Income in Hornsby Bend?
Per Capita income in Hornsby Bend is $40,327.
What is the Median Family Income in Hornsby Bend?
Median Family Income in Hornsby Bend is $81,683.
What is the Median Household income in Hornsby Bend?
Median Household Income in Hornsby Bend is $81,775.
What is Income or Wage Gap in Hornsby Bend?
Income or Wage Gap in Hornsby Bend is 10.7%.
Women in Hornsby Bend earn 89.3 cents for every dollar earned by a man.
What is Family Income Deficit in Hornsby Bend?
Family Income Deficit in Hornsby Bend is $19,174.
Families that are below poverty line in Hornsby Bend earn $19,174 less on average than the poverty threshold level.
What is Inequality or Gini Index in Hornsby Bend?
Inequality or Gini Index in Hornsby Bend is 0.45.
What is the Total Population of Hornsby Bend?
Total Population of Hornsby Bend is 11,031.
What is the Total Male Population of Hornsby Bend?
Total Male Population of Hornsby Bend is 5,284.
What is the Total Female Population of Hornsby Bend?
Total Female Population of Hornsby Bend is 5,747.
What is the Ratio of Males per 100 Females in Hornsby Bend?
There are 91.94 Males per 100 Females in Hornsby Bend.
What is the Ratio of Females per 100 Males in Hornsby Bend?
There are 108.76 Females per 100 Males in Hornsby Bend.
What is the Median Population Age in Hornsby Bend?
Median Population Age in Hornsby Bend is 36.4 Years.
What is the Average Family Size in Hornsby Bend
Average Family Size in Hornsby Bend is 3.1 People.
What is the Average Household Size in Hornsby Bend
Average Household Size in Hornsby Bend is 2.9 People.
How Large is the Labor Force in Hornsby Bend?
There are 6,348 People in the Labor Forcein in Hornsby Bend.
What is the Percentage of People in the Labor Force in Hornsby Bend?
71.7% of People are in the Labor Force in Hornsby Bend.
What is the Unemployment Rate in Hornsby Bend?
Unemployment Rate in Hornsby Bend is 1.6%.