Red Oak, TX Map & Demographics
Red Oak Map
Red Oak Overview
$37,415
PER CAPITA INCOME
$108,254
AVG FAMILY INCOME
$105,309
AVG HOUSEHOLD INCOME
23.1%
WAGE / INCOME GAP [ % ]
76.9¢/ $1
WAGE / INCOME GAP [ $ ]
0.36
INEQUALITY / GINI INDEX
14,853
TOTAL POPULATION
7,603
MALE POPULATION
7,250
FEMALE POPULATION
104.87
MALES / 100 FEMALES
95.36
FEMALES / 100 MALES
36.2
MEDIAN AGE
3.5
AVG FAMILY SIZE
3.2
AVG HOUSEHOLD SIZE
8,271
LABOR FORCE [ PEOPLE ]
73.4%
PERCENT IN LABOR FORCE
2.9%
UNEMPLOYMENT RATE
Red Oak Zip Codes
Income in Red Oak
Income Overview in Red Oak
Per Capita Income in Red Oak is $37,415, while median incomes of families and households are $108,254 and $105,309 respectively.
| Characteristic | Number | Measure |
| Per Capita Income | 14,853 | $37,415 |
| Median Family Income | 3,887 | $108,254 |
| Mean Family Income | 3,887 | $122,231 |
| Median Household Income | 4,655 | $105,309 |
| Mean Household Income | 4,655 | $117,367 |
| Income Deficit | 3,887 | $0 |
| Wage / Income Gap (%) | 14,853 | 23.06% |
| Wage / Income Gap ($) | 14,853 | 76.94¢ per $1 |
| Gini / Inequality Index | 14,853 | 0.36 |
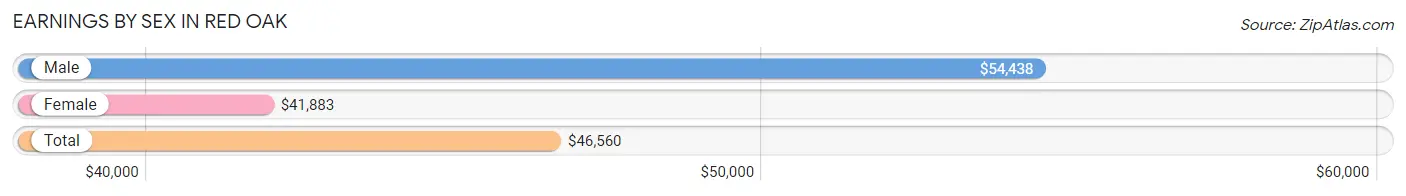
Earnings by Sex in Red Oak
Average Earnings in Red Oak are $46,560, $54,438 for men and $41,883 for women, a difference of 23.1%.
| Sex | Number | Average Earnings |
| Male | 4,554 (52.8%) | $54,438 |
| Female | 4,071 (47.2%) | $41,883 |
| Total | 8,625 (100.0%) | $46,560 |
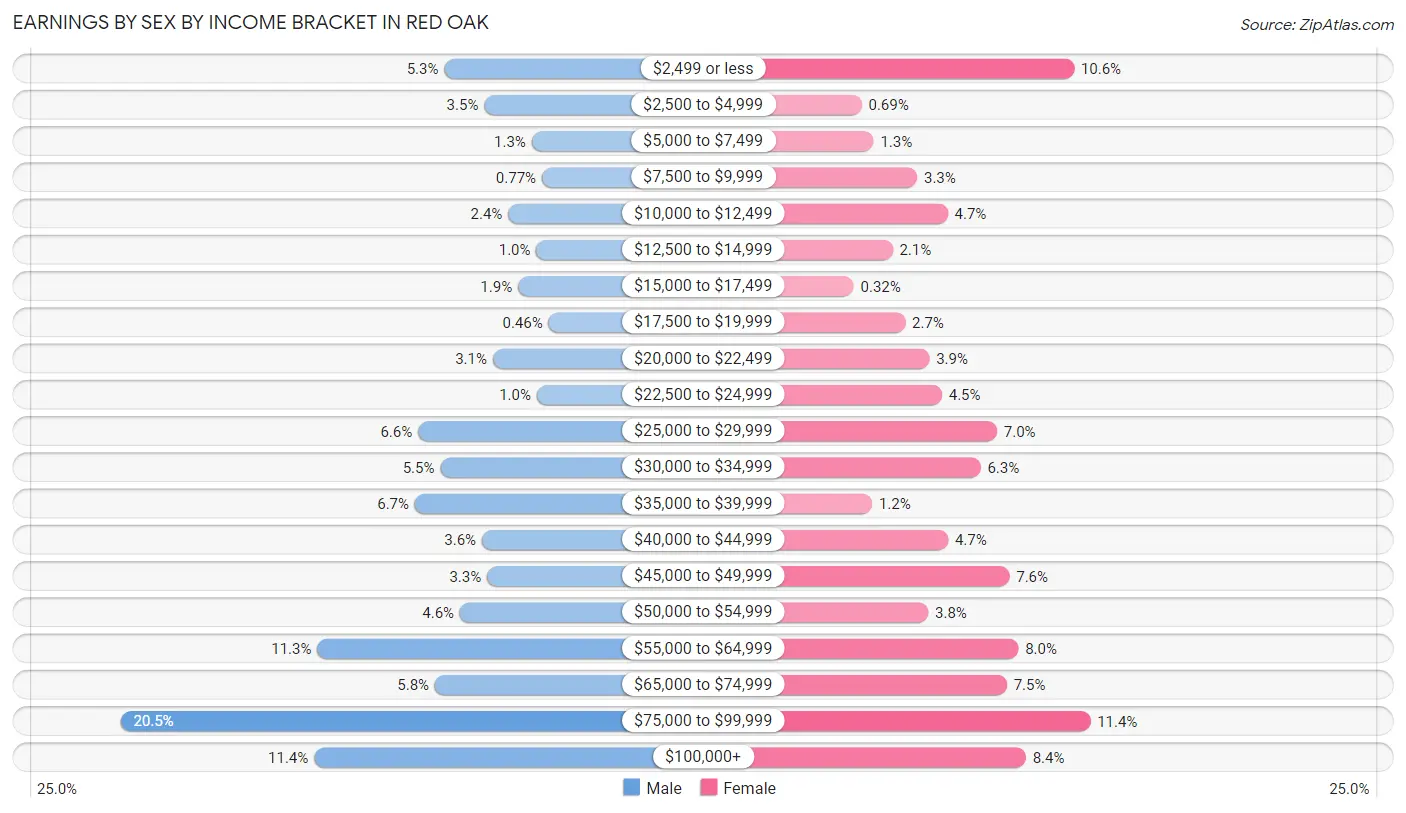
Earnings by Sex by Income Bracket in Red Oak
The most common earnings brackets in Red Oak are $75,000 to $99,999 for men (934 | 20.5%) and $75,000 to $99,999 for women (464 | 11.4%).
| Income | Male | Female |
| $2,499 or less | 243 (5.3%) | 433 (10.6%) |
| $2,500 to $4,999 | 158 (3.5%) | 28 (0.7%) |
| $5,000 to $7,499 | 57 (1.3%) | 51 (1.3%) |
| $7,500 to $9,999 | 35 (0.8%) | 134 (3.3%) |
| $10,000 to $12,499 | 107 (2.4%) | 192 (4.7%) |
| $12,500 to $14,999 | 47 (1.0%) | 87 (2.1%) |
| $15,000 to $17,499 | 86 (1.9%) | 13 (0.3%) |
| $17,500 to $19,999 | 21 (0.5%) | 111 (2.7%) |
| $20,000 to $22,499 | 140 (3.1%) | 157 (3.9%) |
| $22,500 to $24,999 | 46 (1.0%) | 181 (4.4%) |
| $25,000 to $29,999 | 299 (6.6%) | 286 (7.0%) |
| $30,000 to $34,999 | 252 (5.5%) | 255 (6.3%) |
| $35,000 to $39,999 | 306 (6.7%) | 48 (1.2%) |
| $40,000 to $44,999 | 163 (3.6%) | 193 (4.7%) |
| $45,000 to $49,999 | 152 (3.3%) | 310 (7.6%) |
| $50,000 to $54,999 | 210 (4.6%) | 155 (3.8%) |
| $55,000 to $64,999 | 514 (11.3%) | 327 (8.0%) |
| $65,000 to $74,999 | 263 (5.8%) | 305 (7.5%) |
| $75,000 to $99,999 | 934 (20.5%) | 464 (11.4%) |
| $100,000+ | 521 (11.4%) | 341 (8.4%) |
| Total | 4,554 (100.0%) | 4,071 (100.0%) |
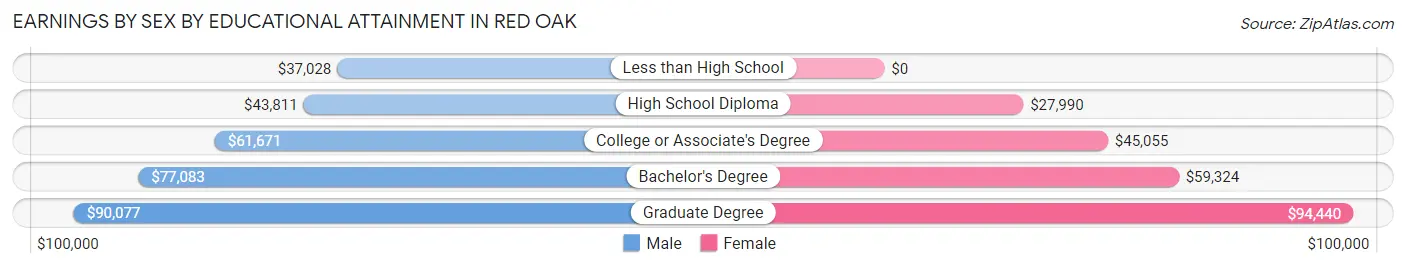
Earnings by Sex by Educational Attainment in Red Oak
Average earnings in Red Oak are $59,157 for men and $46,925 for women, a difference of 20.7%. Men with an educational attainment of graduate degree enjoy the highest average annual earnings of $90,077, while those with less than high school education earn the least with $37,028. Women with an educational attainment of graduate degree earn the most with the average annual earnings of $94,440, while those with high school diploma education have the smallest earnings of $27,990.
| Educational Attainment | Male Income | Female Income |
| Less than High School | $37,028 | $0 |
| High School Diploma | $43,811 | $27,990 |
| College or Associate's Degree | $61,671 | $45,055 |
| Bachelor's Degree | $77,083 | $59,324 |
| Graduate Degree | $90,077 | $94,440 |
| Total | $59,157 | $46,925 |
Family Income in Red Oak
Family Income Brackets in Red Oak
According to the Red Oak family income data, there are 1,108 families falling into the $100,000 to $149,999 income range, which is the most common income bracket and makes up 28.5% of all families.
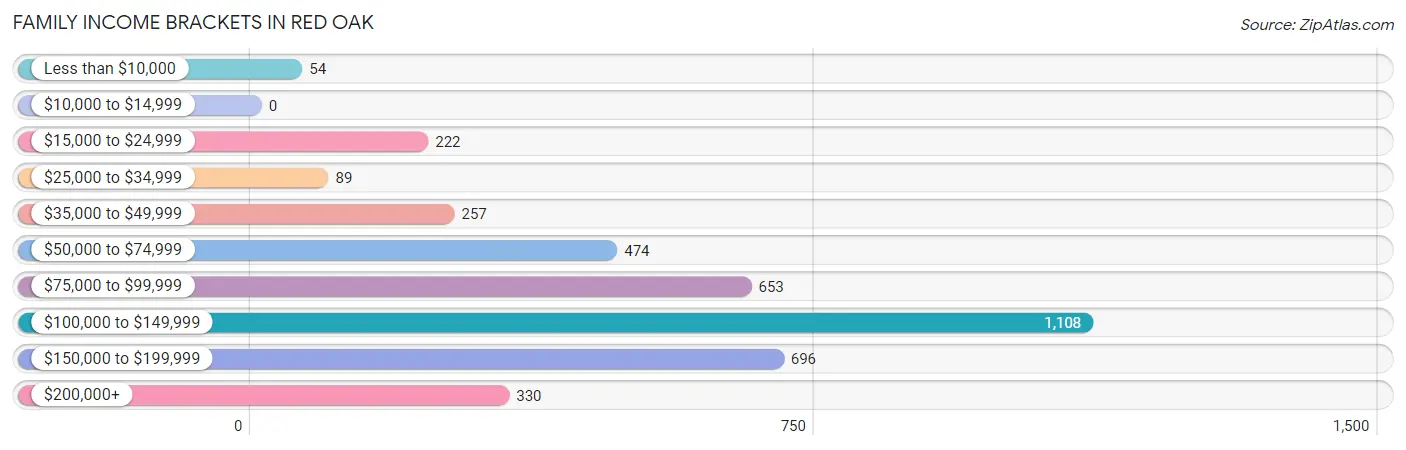
| Income Bracket | # Families | % Families |
| Less than $10,000 | 54 | 1.4% |
| $10,000 to $14,999 | 0 | 0.0% |
| $15,000 to $24,999 | 222 | 5.7% |
| $25,000 to $34,999 | 89 | 2.3% |
| $35,000 to $49,999 | 257 | 6.6% |
| $50,000 to $74,999 | 474 | 12.2% |
| $75,000 to $99,999 | 653 | 16.8% |
| $100,000 to $149,999 | 1,108 | 28.5% |
| $150,000 to $199,999 | 696 | 17.9% |
| $200,000+ | 330 | 8.5% |
Family Income by Famaliy Size in Red Oak
6-person families (321 | 8.3%) account for the highest median family income in Red Oak with $179,886 per family, while 2-person families (1,249 | 32.1%) have the highest median income of $44,760 per family member.
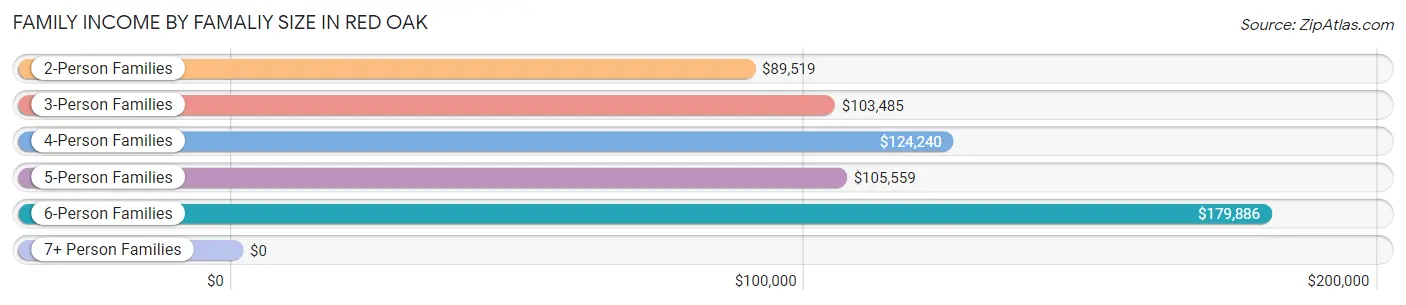
| Income Bracket | # Families | Median Income |
| 2-Person Families | 1,249 (32.1%) | $89,519 |
| 3-Person Families | 1,162 (29.9%) | $103,485 |
| 4-Person Families | 699 (18.0%) | $124,240 |
| 5-Person Families | 439 (11.3%) | $105,559 |
| 6-Person Families | 321 (8.3%) | $179,886 |
| 7+ Person Families | 17 (0.4%) | $0 |
| Total | 3,887 (100.0%) | $108,254 |
Family Income by Number of Earners in Red Oak
The median family income in Red Oak is $108,254, with families comprising 3+ earners (869) having the highest median family income of $139,341, while families with no earners (230) have the lowest median family income of $51,875, accounting for 22.4% and 5.9% of families, respectively.
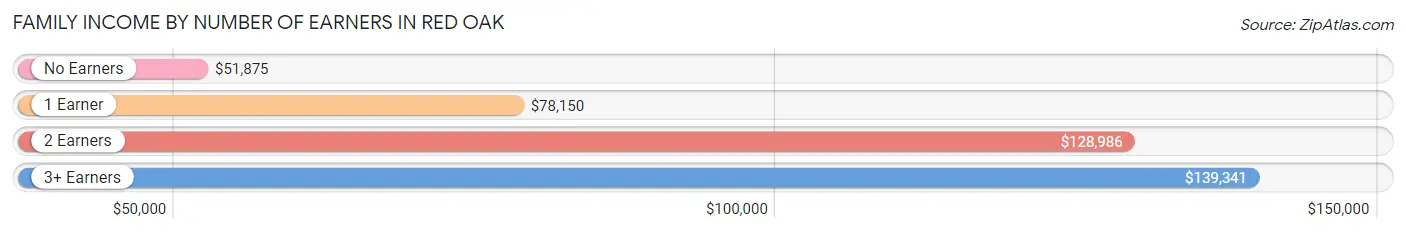
| Number of Earners | # Families | Median Income |
| No Earners | 230 (5.9%) | $51,875 |
| 1 Earner | 1,059 (27.2%) | $78,150 |
| 2 Earners | 1,729 (44.5%) | $128,986 |
| 3+ Earners | 869 (22.4%) | $139,341 |
| Total | 3,887 (100.0%) | $108,254 |
Household Income in Red Oak
Household Income Brackets in Red Oak
With 1,238 households falling in the category, the $100,000 to $149,999 income range is the most frequent in Red Oak, accounting for 26.6% of all households. In contrast, only 70 households (1.5%) fall into the less than $10,000 income bracket, making it the least populous group.
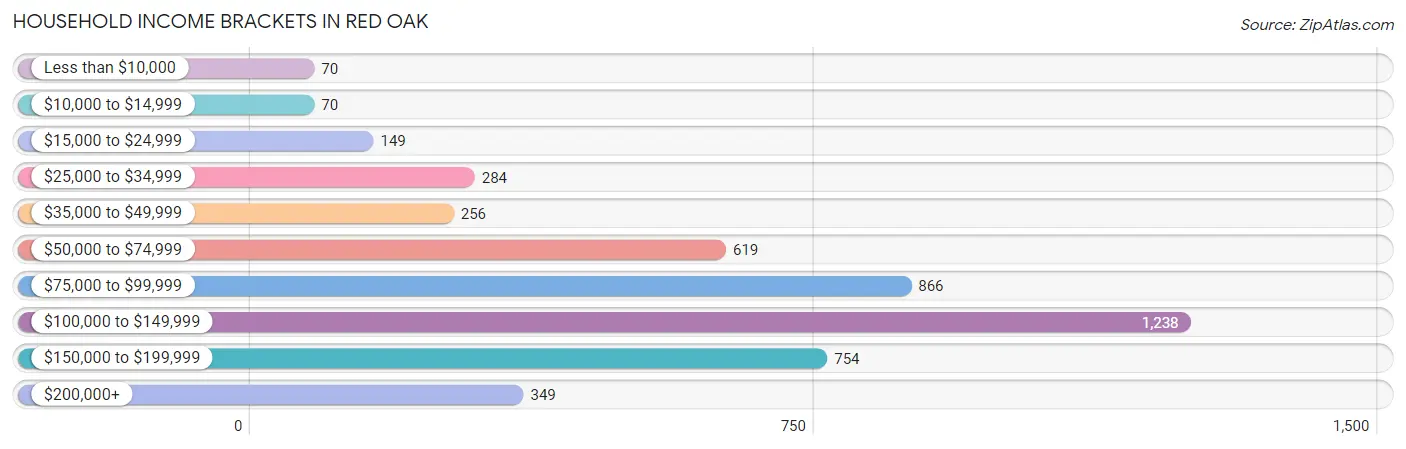
| Income Bracket | # Households | % Households |
| Less than $10,000 | 70 | 1.5% |
| $10,000 to $14,999 | 70 | 1.5% |
| $15,000 to $24,999 | 149 | 3.2% |
| $25,000 to $34,999 | 284 | 6.1% |
| $35,000 to $49,999 | 256 | 5.5% |
| $50,000 to $74,999 | 619 | 13.3% |
| $75,000 to $99,999 | 866 | 18.6% |
| $100,000 to $149,999 | 1,238 | 26.6% |
| $150,000 to $199,999 | 754 | 16.2% |
| $200,000+ | 349 | 7.5% |
Household Income by Householder Age in Red Oak
The median household income in Red Oak is $105,309, with the highest median household income of $118,448 found in the 45 to 64 years age bracket for the primary householder. A total of 2,062 households (44.3%) fall into this category. Meanwhile, the 15 to 24 years age bracket for the primary householder has the lowest median household income of $0, with 72 households (1.5%) in this group.
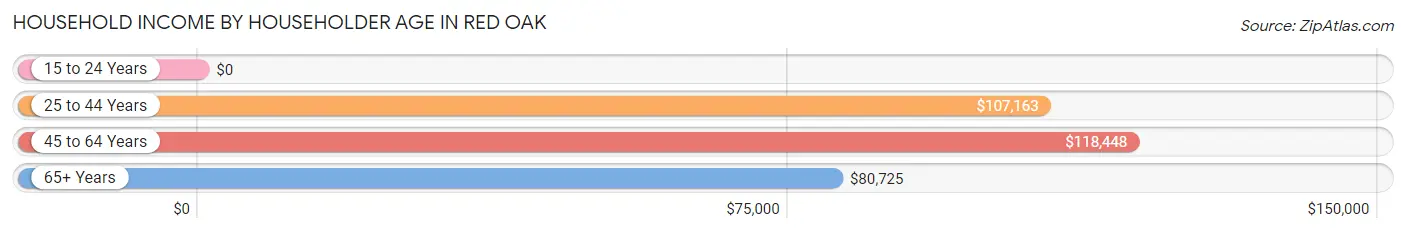
| Income Bracket | # Households | Median Income |
| 15 to 24 Years | 72 (1.5%) | $0 |
| 25 to 44 Years | 1,857 (39.9%) | $107,163 |
| 45 to 64 Years | 2,062 (44.3%) | $118,448 |
| 65+ Years | 664 (14.3%) | $80,725 |
| Total | 4,655 (100.0%) | $105,309 |
Poverty in Red Oak
Income Below Poverty by Sex and Age in Red Oak
With 5.6% poverty level for males and 10.7% for females among the residents of Red Oak, 5 year old males and 6 to 11 year old females are the most vulnerable to poverty, with 20 males (23.3%) and 219 females (30.5%) in their respective age groups living below the poverty level.
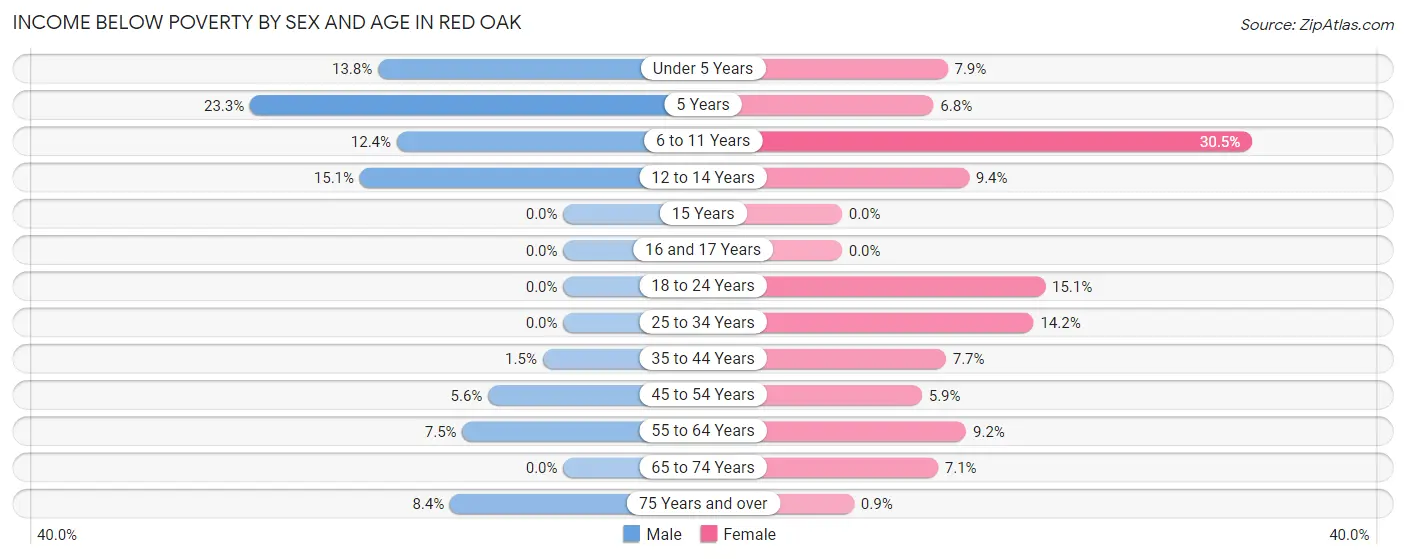
| Age Bracket | Male | Female |
| Under 5 Years | 79 (13.8%) | 23 (7.9%) |
| 5 Years | 20 (23.3%) | 20 (6.8%) |
| 6 to 11 Years | 75 (12.4%) | 219 (30.5%) |
| 12 to 14 Years | 79 (15.1%) | 23 (9.4%) |
| 15 Years | 0 (0.0%) | 0 (0.0%) |
| 16 and 17 Years | 0 (0.0%) | 0 (0.0%) |
| 18 to 24 Years | 0 (0.0%) | 80 (15.1%) |
| 25 to 34 Years | 0 (0.0%) | 143 (14.2%) |
| 35 to 44 Years | 21 (1.5%) | 87 (7.7%) |
| 45 to 54 Years | 75 (5.6%) | 74 (5.9%) |
| 55 to 64 Years | 53 (7.5%) | 62 (9.2%) |
| 65 to 74 Years | 0 (0.0%) | 31 (7.1%) |
| 75 Years and over | 18 (8.4%) | 2 (0.9%) |
| Total | 420 (5.6%) | 764 (10.7%) |
Income Above Poverty by Sex and Age in Red Oak
According to the poverty statistics in Red Oak, males aged 15 years and females aged 15 years are the age groups that are most secure financially, with 100.0% of males and 100.0% of females in these age groups living above the poverty line.
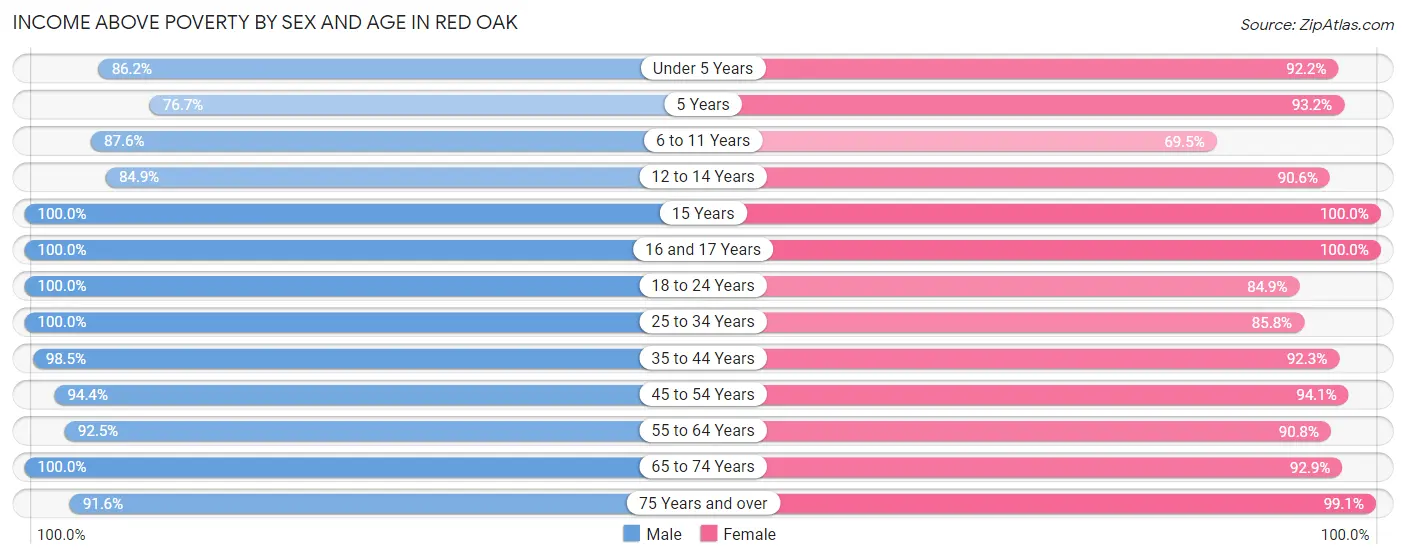
| Age Bracket | Male | Female |
| Under 5 Years | 495 (86.2%) | 270 (92.1%) |
| 5 Years | 66 (76.7%) | 274 (93.2%) |
| 6 to 11 Years | 532 (87.6%) | 500 (69.5%) |
| 12 to 14 Years | 444 (84.9%) | 221 (90.6%) |
| 15 Years | 195 (100.0%) | 49 (100.0%) |
| 16 and 17 Years | 333 (100.0%) | 296 (100.0%) |
| 18 to 24 Years | 489 (100.0%) | 450 (84.9%) |
| 25 to 34 Years | 800 (100.0%) | 862 (85.8%) |
| 35 to 44 Years | 1,353 (98.5%) | 1,040 (92.3%) |
| 45 to 54 Years | 1,269 (94.4%) | 1,171 (94.1%) |
| 55 to 64 Years | 655 (92.5%) | 610 (90.8%) |
| 65 to 74 Years | 321 (100.0%) | 404 (92.9%) |
| 75 Years and over | 196 (91.6%) | 219 (99.1%) |
| Total | 7,148 (94.5%) | 6,366 (89.3%) |
Income Below Poverty Among Married-Couple Families in Red Oak
The poverty statistics for married-couple families in Red Oak show that 1.6% or 48 of the total 2,946 families live below the poverty line. Families with 3 or 4 children have the highest poverty rate of 4.6%, comprising of 21 families. On the other hand, families with no children have the lowest poverty rate of 0.0%, which includes 0 families.
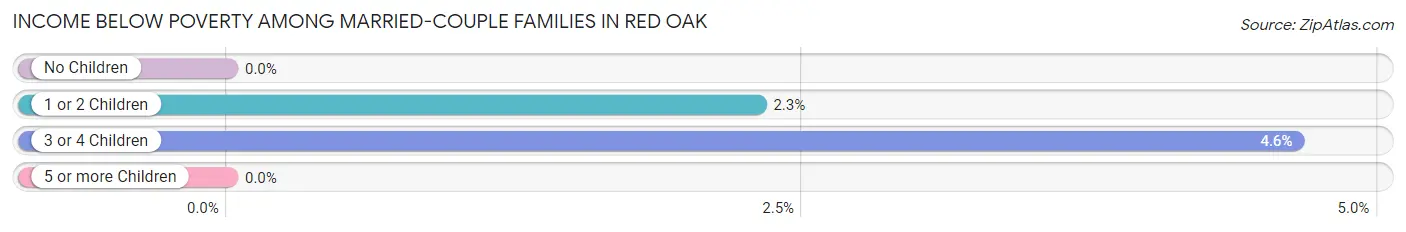
| Children | Above Poverty | Below Poverty |
| No Children | 1,321 (100.0%) | 0 (0.0%) |
| 1 or 2 Children | 1,145 (97.7%) | 27 (2.3%) |
| 3 or 4 Children | 432 (95.4%) | 21 (4.6%) |
| 5 or more Children | 0 (0.0%) | 0 (0.0%) |
| Total | 2,898 (98.4%) | 48 (1.6%) |
Income Below Poverty Among Single-Parent Households in Red Oak
According to the poverty data in Red Oak, 13.4% or 53 single-father households and 32.4% or 177 single-mother households are living below the poverty line. Among single-father households, those with no children have the highest poverty rate, with 27 households (17.3%) experiencing poverty. Likewise, among single-mother households, those with 3 or 4 children have the highest poverty rate, with 50 households (68.5%) falling below the poverty line.
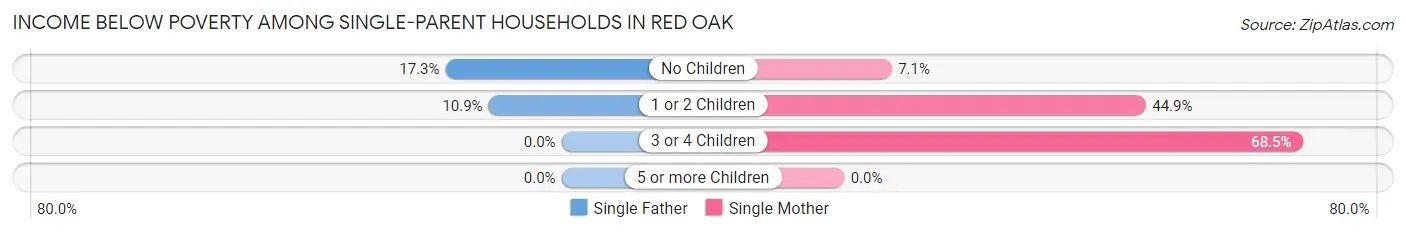
| Children | Single Father | Single Mother |
| No Children | 27 (17.3%) | 16 (7.1%) |
| 1 or 2 Children | 26 (10.9%) | 111 (44.9%) |
| 3 or 4 Children | 0 (0.0%) | 50 (68.5%) |
| 5 or more Children | 0 (0.0%) | 0 (0.0%) |
| Total | 53 (13.4%) | 177 (32.4%) |
Income Below Poverty Among Married-Couple vs Single-Parent Households in Red Oak
The poverty data for Red Oak shows that 48 of the married-couple family households (1.6%) and 230 of the single-parent households (24.4%) are living below the poverty level. Within the married-couple family households, those with 3 or 4 children have the highest poverty rate, with 21 households (4.6%) falling below the poverty line. Among the single-parent households, those with 3 or 4 children have the highest poverty rate, with 50 household (68.5%) living below poverty.
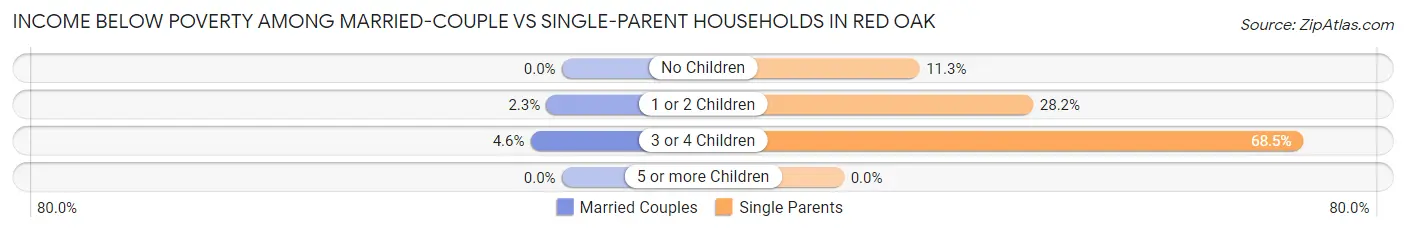
| Children | Married-Couple Families | Single-Parent Households |
| No Children | 0 (0.0%) | 43 (11.3%) |
| 1 or 2 Children | 27 (2.3%) | 137 (28.2%) |
| 3 or 4 Children | 21 (4.6%) | 50 (68.5%) |
| 5 or more Children | 0 (0.0%) | 0 (0.0%) |
| Total | 48 (1.6%) | 230 (24.4%) |
Race in Red Oak
The most populous races in Red Oak are White / Caucasian (7,063 | 47.5%), Black / African American (5,125 | 34.5%), and Hispanic or Latino (2,709 | 18.2%).
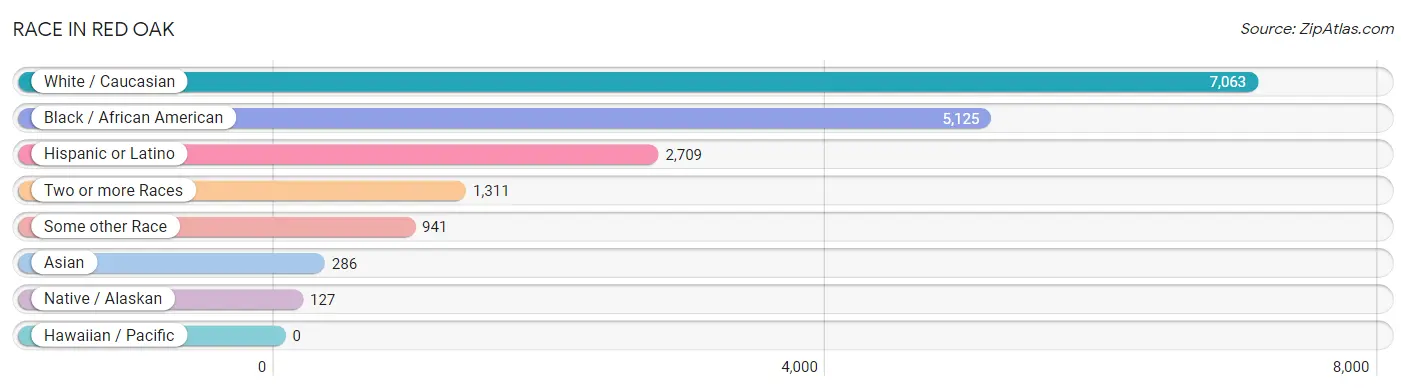
| Race | # Population | % Population |
| Asian | 286 | 1.9% |
| Black / African American | 5,125 | 34.5% |
| Hawaiian / Pacific | 0 | 0.0% |
| Hispanic or Latino | 2,709 | 18.2% |
| Native / Alaskan | 127 | 0.9% |
| White / Caucasian | 7,063 | 47.5% |
| Two or more Races | 1,311 | 8.8% |
| Some other Race | 941 | 6.3% |
| Total | 14,853 | 100.0% |
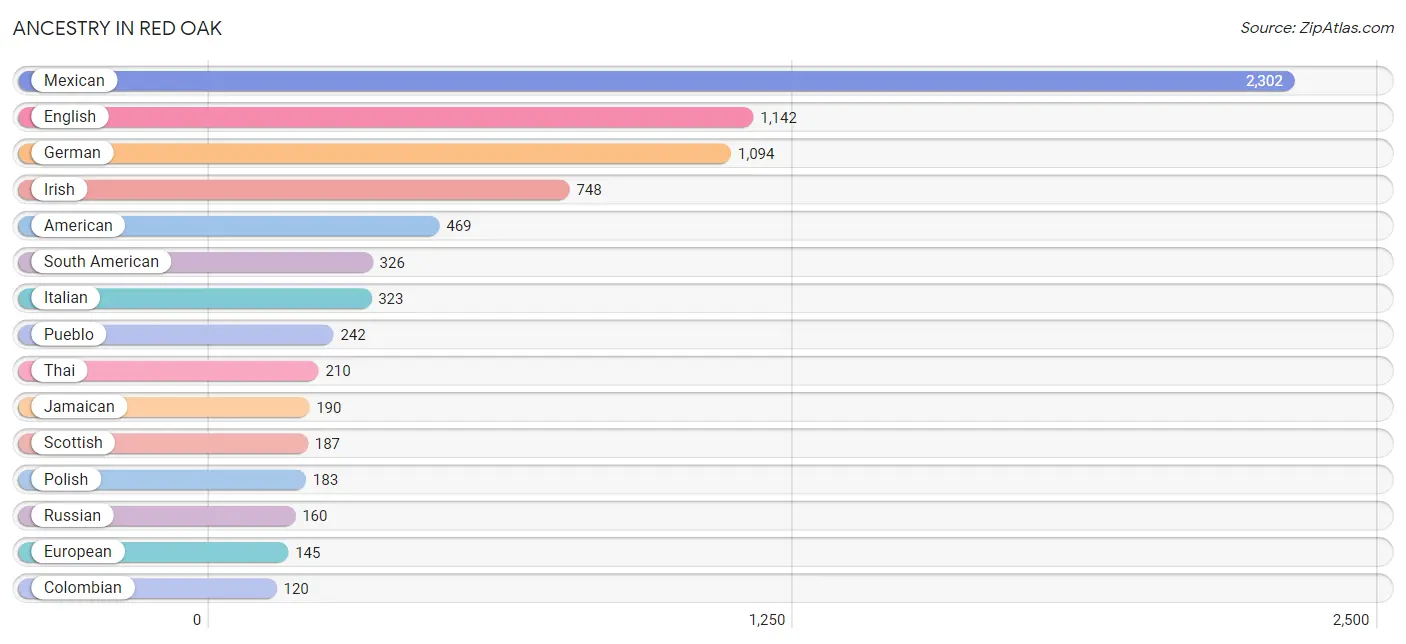
Ancestry in Red Oak
The most populous ancestries reported in Red Oak are Mexican (2,302 | 15.5%), English (1,142 | 7.7%), German (1,094 | 7.4%), Irish (748 | 5.0%), and American (469 | 3.2%), together accounting for 38.8% of all Red Oak residents.
| Ancestry | # Population | % Population |
| African | 18 | 0.1% |
| American | 469 | 3.2% |
| Arab | 98 | 0.7% |
| British | 38 | 0.3% |
| Cajun | 7 | 0.1% |
| Central American | 13 | 0.1% |
| Cherokee | 25 | 0.2% |
| Colombian | 120 | 0.8% |
| Czech | 74 | 0.5% |
| Danish | 7 | 0.1% |
| Dominican | 17 | 0.1% |
| Dutch | 67 | 0.4% |
| Dutch West Indian | 45 | 0.3% |
| Ecuadorian | 104 | 0.7% |
| Egyptian | 31 | 0.2% |
| English | 1,142 | 7.7% |
| European | 145 | 1.0% |
| French | 118 | 0.8% |
| French Canadian | 54 | 0.4% |
| German | 1,094 | 7.4% |
| Greek | 26 | 0.2% |
| Guatemalan | 13 | 0.1% |
| Hungarian | 36 | 0.2% |
| Irish | 748 | 5.0% |
| Italian | 323 | 2.2% |
| Jamaican | 190 | 1.3% |
| Korean | 54 | 0.4% |
| Mexican | 2,302 | 15.5% |
| Mexican American Indian | 36 | 0.2% |
| Polish | 183 | 1.2% |
| Portuguese | 29 | 0.2% |
| Pueblo | 242 | 1.6% |
| Russian | 160 | 1.1% |
| Scotch-Irish | 93 | 0.6% |
| Scottish | 187 | 1.3% |
| South American | 326 | 2.2% |
| Spaniard | 8 | 0.1% |
| Subsaharan African | 59 | 0.4% |
| Swedish | 29 | 0.2% |
| Thai | 210 | 1.4% |
| Turkish | 24 | 0.2% |
| Uruguayan | 102 | 0.7% |
| Welsh | 95 | 0.6% | View All 43 Rows |
Immigrants in Red Oak
The most numerous immigrant groups reported in Red Oak came from Latin America (978 | 6.6%), Central America (529 | 3.6%), Mexico (516 | 3.5%), South America (242 | 1.6%), and Asia (237 | 1.6%), together accounting for 16.8% of all Red Oak residents.
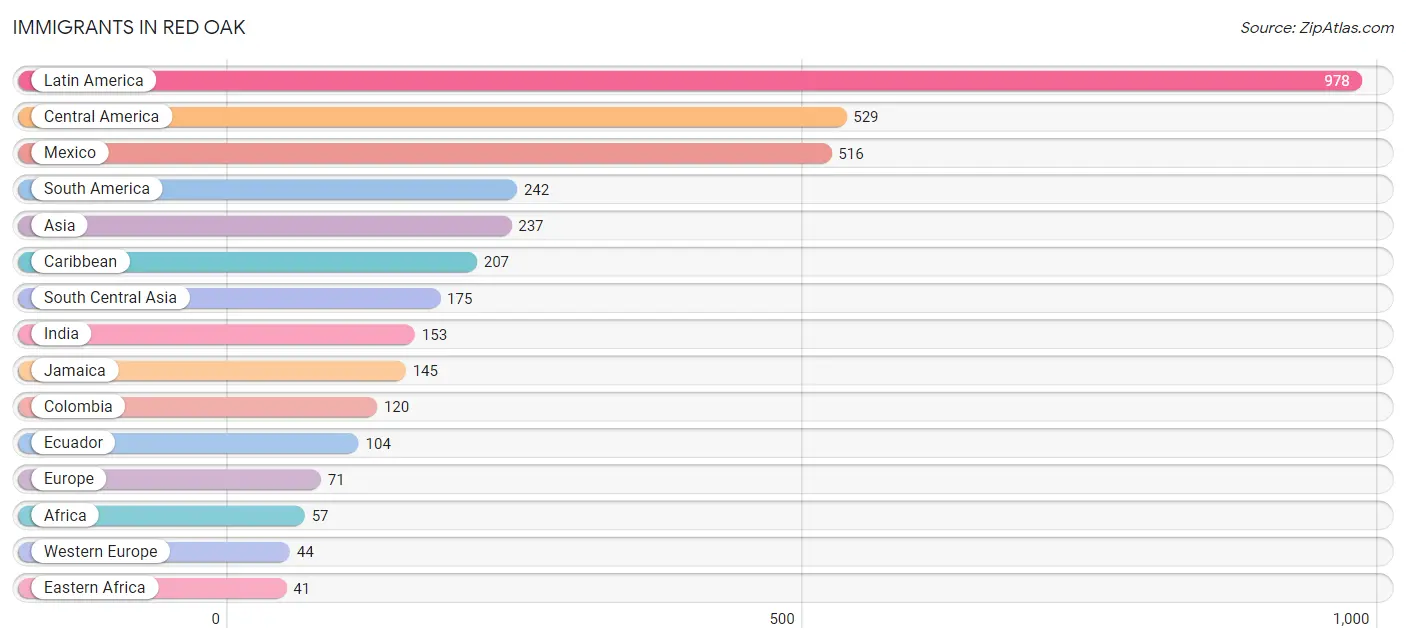
| Immigration Origin | # Population | % Population |
| Africa | 57 | 0.4% |
| Asia | 237 | 1.6% |
| Caribbean | 207 | 1.4% |
| Central America | 529 | 3.6% |
| Chile | 18 | 0.1% |
| Colombia | 120 | 0.8% |
| Dominican Republic | 17 | 0.1% |
| Eastern Africa | 41 | 0.3% |
| Ecuador | 104 | 0.7% |
| Egypt | 16 | 0.1% |
| Europe | 71 | 0.5% |
| Germany | 16 | 0.1% |
| Guatemala | 13 | 0.1% |
| India | 153 | 1.0% |
| Italy | 27 | 0.2% |
| Jamaica | 145 | 1.0% |
| Jordan | 27 | 0.2% |
| Latin America | 978 | 6.6% |
| Mexico | 516 | 3.5% |
| Netherlands | 28 | 0.2% |
| Northern Africa | 16 | 0.1% |
| Pakistan | 22 | 0.2% |
| Philippines | 35 | 0.2% |
| South America | 242 | 1.6% |
| South Central Asia | 175 | 1.2% |
| South Eastern Asia | 35 | 0.2% |
| Southern Europe | 27 | 0.2% |
| Western Asia | 27 | 0.2% |
| Western Europe | 44 | 0.3% | View All 29 Rows |
Sex and Age in Red Oak
Sex and Age in Red Oak
The most populous age groups in Red Oak are 35 to 39 Years (897 | 11.8%) for men and 5 to 9 Years (860 | 11.9%) for women.
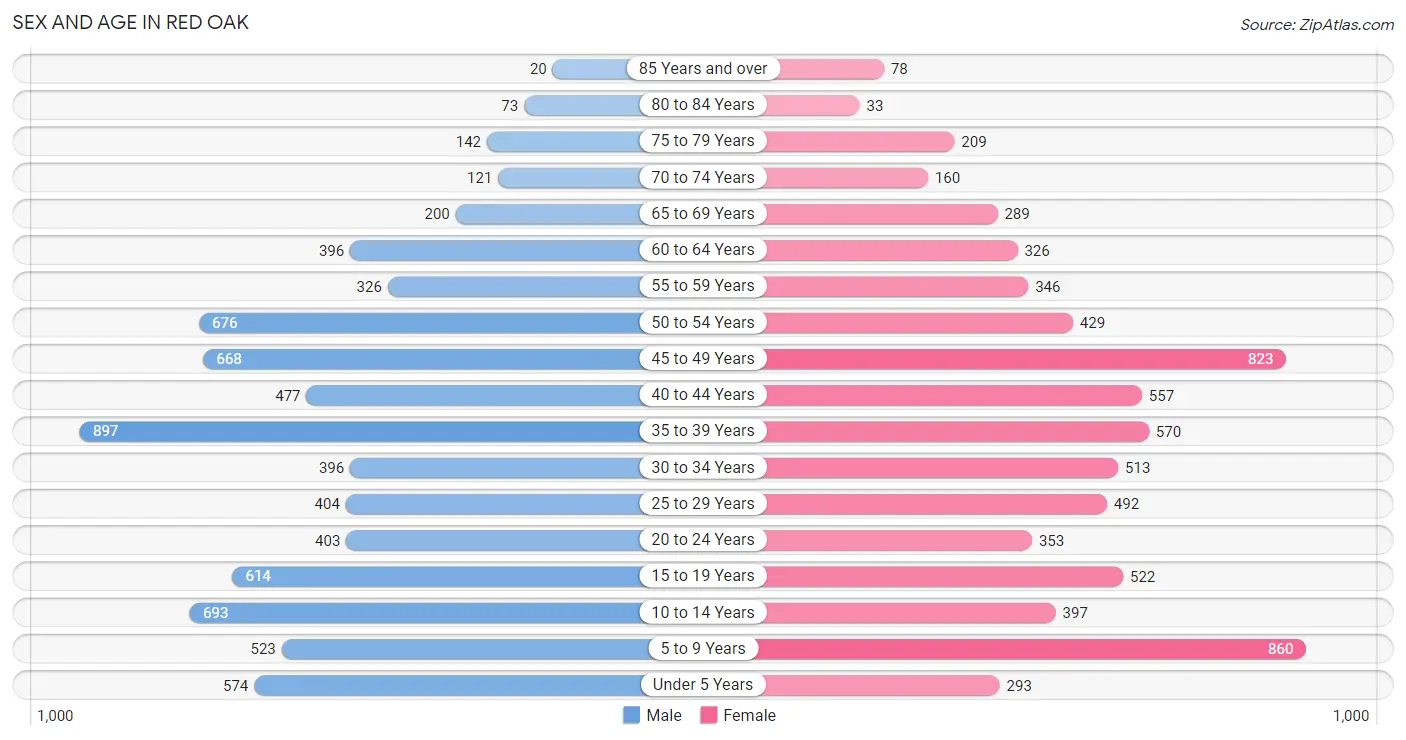
| Age Bracket | Male | Female |
| Under 5 Years | 574 (7.5%) | 293 (4.0%) |
| 5 to 9 Years | 523 (6.9%) | 860 (11.9%) |
| 10 to 14 Years | 693 (9.1%) | 397 (5.5%) |
| 15 to 19 Years | 614 (8.1%) | 522 (7.2%) |
| 20 to 24 Years | 403 (5.3%) | 353 (4.9%) |
| 25 to 29 Years | 404 (5.3%) | 492 (6.8%) |
| 30 to 34 Years | 396 (5.2%) | 513 (7.1%) |
| 35 to 39 Years | 897 (11.8%) | 570 (7.9%) |
| 40 to 44 Years | 477 (6.3%) | 557 (7.7%) |
| 45 to 49 Years | 668 (8.8%) | 823 (11.4%) |
| 50 to 54 Years | 676 (8.9%) | 429 (5.9%) |
| 55 to 59 Years | 326 (4.3%) | 346 (4.8%) |
| 60 to 64 Years | 396 (5.2%) | 326 (4.5%) |
| 65 to 69 Years | 200 (2.6%) | 289 (4.0%) |
| 70 to 74 Years | 121 (1.6%) | 160 (2.2%) |
| 75 to 79 Years | 142 (1.9%) | 209 (2.9%) |
| 80 to 84 Years | 73 (1.0%) | 33 (0.5%) |
| 85 Years and over | 20 (0.3%) | 78 (1.1%) |
| Total | 7,603 (100.0%) | 7,250 (100.0%) |
Families and Households in Red Oak
Median Family Size in Red Oak
The median family size in Red Oak is 3.50 persons per family, with married-couple families (2,946 | 75.8%) accounting for the largest median family size of 3.67 persons per family. On the other hand, single male/father families (395 | 10.2%) represent the smallest median family size with 2.73 persons per family.

| Family Type | # Families | Family Size |
| Married-Couple | 2,946 (75.8%) | 3.67 |
| Single Male/Father | 395 (10.2%) | 2.73 |
| Single Female/Mother | 546 (14.1%) | 3.13 |
| Total Families | 3,887 (100.0%) | 3.50 |
Median Household Size in Red Oak
The median household size in Red Oak is 3.16 persons per household, with married-couple households (2,946 | 63.3%) accounting for the largest median household size of 3.68 persons per household. non-family households (768 | 16.5%) represent the smallest median household size with 1.02 persons per household.
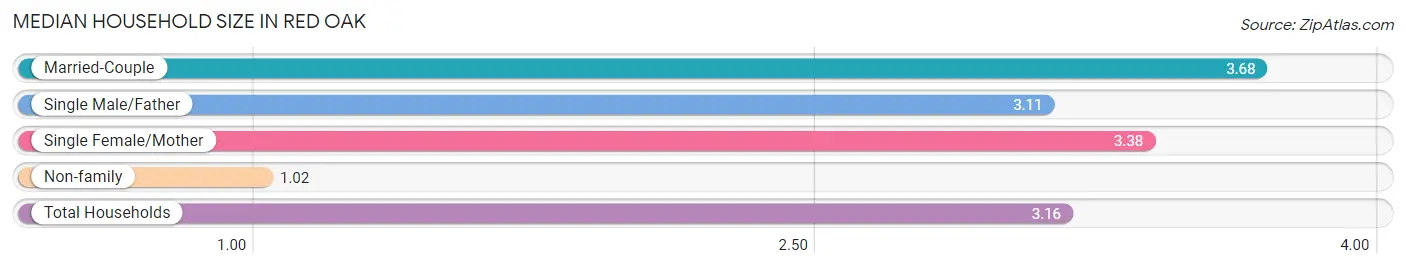
| Household Type | # Households | Household Size |
| Married-Couple | 2,946 (63.3%) | 3.68 |
| Single Male/Father | 395 (8.5%) | 3.11 |
| Single Female/Mother | 546 (11.7%) | 3.38 |
| Non-family | 768 (16.5%) | 1.02 |
| Total Households | 4,655 (100.0%) | 3.16 |
Household Size by Marriage Status in Red Oak
Out of a total of 4,655 households in Red Oak, 3,887 (83.5%) are family households, while 768 (16.5%) are nonfamily households. The most numerous type of family households are 3-person households, comprising 1,126, and the most common type of nonfamily households are 1-person households, comprising 753.
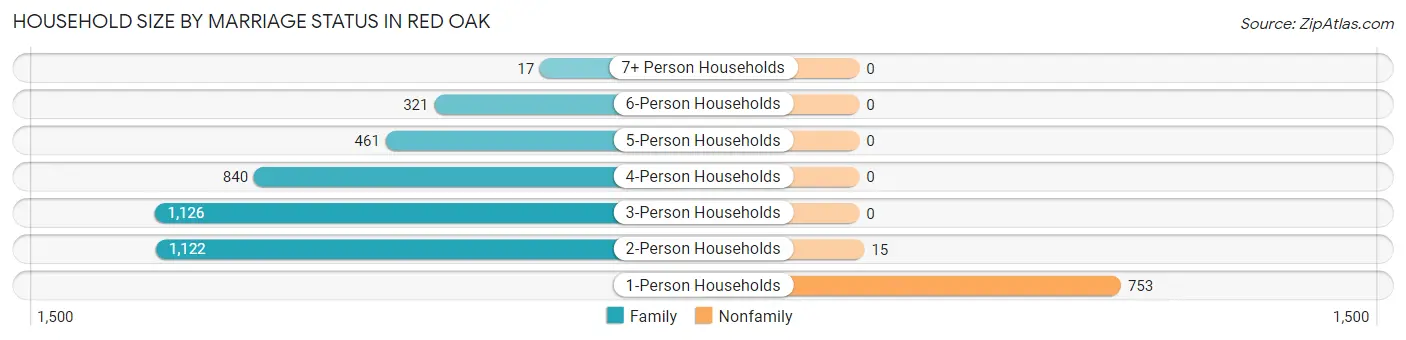
| Household Size | Family Households | Nonfamily Households |
| 1-Person Households | - | 753 (16.2%) |
| 2-Person Households | 1,122 (24.1%) | 15 (0.3%) |
| 3-Person Households | 1,126 (24.2%) | 0 (0.0%) |
| 4-Person Households | 840 (18.0%) | 0 (0.0%) |
| 5-Person Households | 461 (9.9%) | 0 (0.0%) |
| 6-Person Households | 321 (6.9%) | 0 (0.0%) |
| 7+ Person Households | 17 (0.4%) | 0 (0.0%) |
| Total | 3,887 (83.5%) | 768 (16.5%) |
Female Fertility in Red Oak
Fertility by Age in Red Oak
Average fertility rate in Red Oak is 79.0 births per 1,000 women. Women in the age bracket of 20 to 34 years have the highest fertility rate with 158.0 births per 1,000 women. Women in the age bracket of 20 to 34 years acount for 70.7% of all women with births.
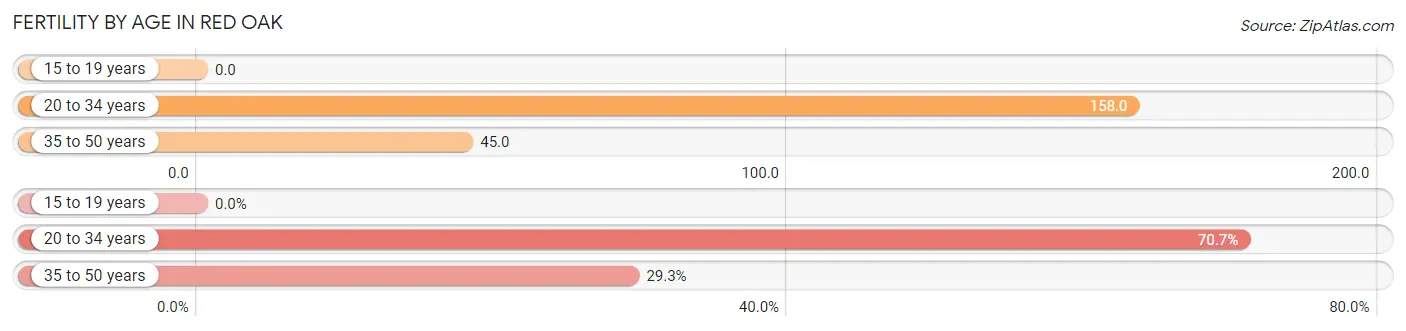
| Age Bracket | Women with Births | Births / 1,000 Women |
| 15 to 19 years | 0 (0.0%) | 0.0 |
| 20 to 34 years | 215 (70.7%) | 158.0 |
| 35 to 50 years | 89 (29.3%) | 45.0 |
| Total | 304 (100.0%) | 79.0 |
Fertility by Age by Marriage Status in Red Oak
36.5% of women with births (304) in Red Oak are married. The highest percentage of unmarried women with births falls into 20 to 34 years age bracket with 67.4% of them unmarried at the time of birth, while the lowest percentage of unmarried women with births belong to 35 to 50 years age bracket with 53.9% of them unmarried.
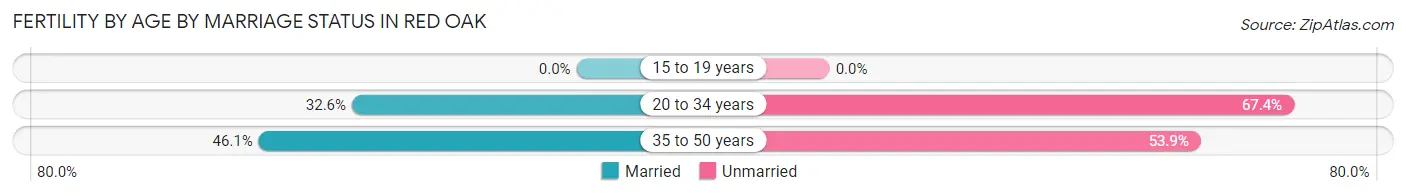
| Age Bracket | Married | Unmarried |
| 15 to 19 years | 0 (0.0%) | 0 (0.0%) |
| 20 to 34 years | 70 (32.6%) | 145 (67.4%) |
| 35 to 50 years | 41 (46.1%) | 48 (53.9%) |
| Total | 111 (36.5%) | 193 (63.5%) |
Fertility by Education in Red Oak
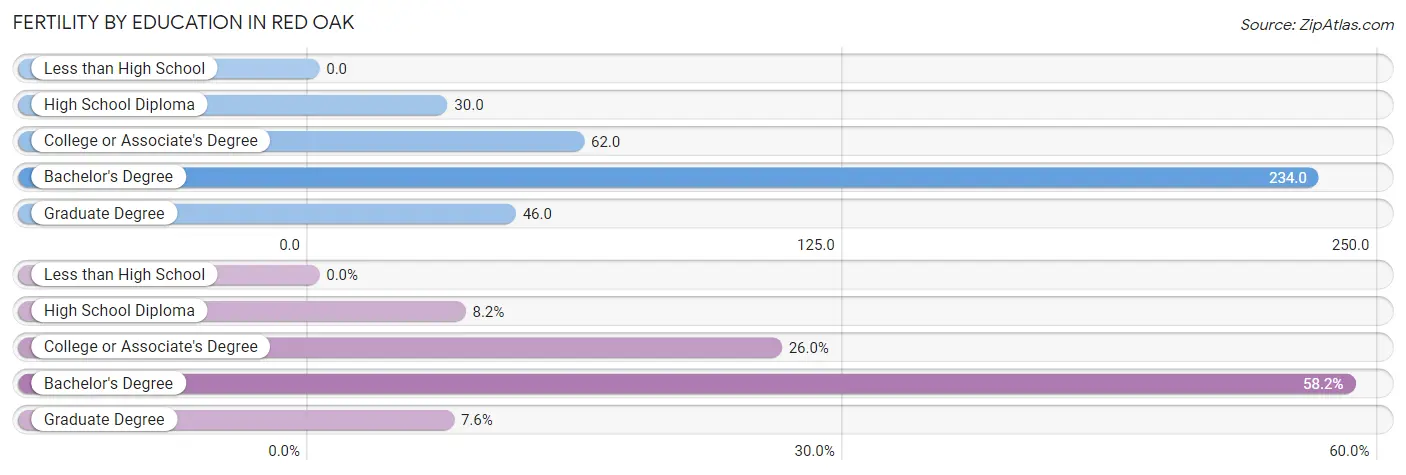
| Educational Attainment | Women with Births | Births / 1,000 Women |
| Less than High School | 0 (0.0%) | 0.0 |
| High School Diploma | 25 (8.2%) | 30.0 |
| College or Associate's Degree | 79 (26.0%) | 62.0 |
| Bachelor's Degree | 177 (58.2%) | 234.0 |
| Graduate Degree | 23 (7.6%) | 46.0 |
| Total | 304 (100.0%) | 79.0 |
Fertility by Education by Marriage Status in Red Oak
63.5% of women with births in Red Oak are unmarried. Women with the educational attainment of college or associate's degree are most likely to be married with 48.1% of them married at childbirth, while women with the educational attainment of high school diploma are least likely to be married with 100.0% of them unmarried at childbirth.
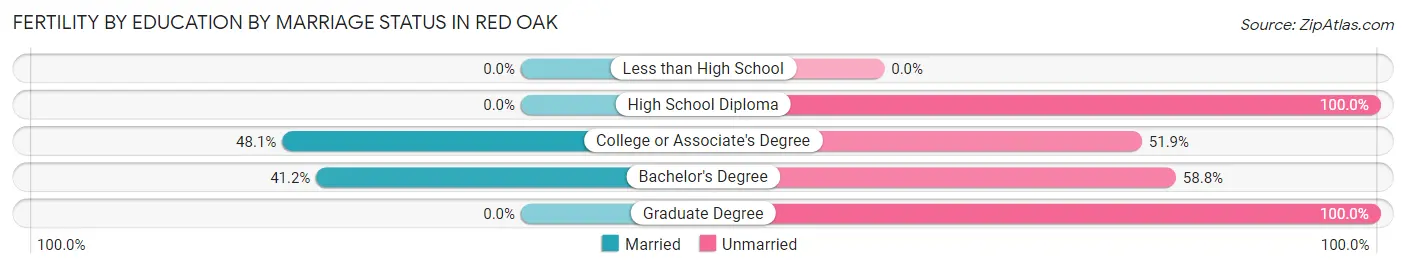
| Educational Attainment | Married | Unmarried |
| Less than High School | 0 (0.0%) | 0 (0.0%) |
| High School Diploma | 0 (0.0%) | 25 (100.0%) |
| College or Associate's Degree | 38 (48.1%) | 41 (51.9%) |
| Bachelor's Degree | 73 (41.2%) | 104 (58.8%) |
| Graduate Degree | 0 (0.0%) | 23 (100.0%) |
| Total | 111 (36.5%) | 193 (63.5%) |
Employment Characteristics in Red Oak
Employment by Class of Employer in Red Oak
Among the 7,961 employed individuals in Red Oak, private company employees (5,536 | 69.5%), local government employees (970 | 12.2%), and not-for-profit organizations (420 | 5.3%) make up the most common classes of employment.
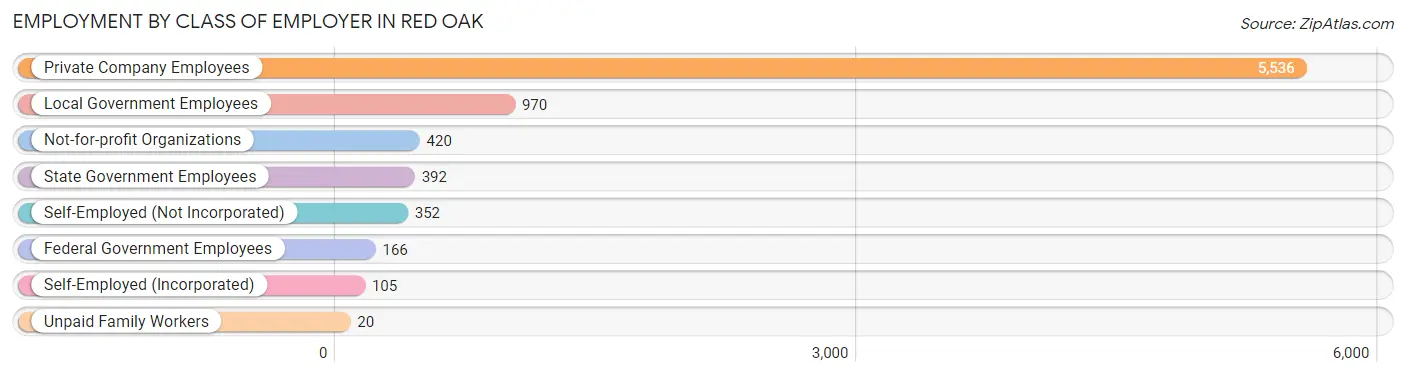
| Employer Class | # Employees | % Employees |
| Private Company Employees | 5,536 | 69.5% |
| Self-Employed (Incorporated) | 105 | 1.3% |
| Self-Employed (Not Incorporated) | 352 | 4.4% |
| Not-for-profit Organizations | 420 | 5.3% |
| Local Government Employees | 970 | 12.2% |
| State Government Employees | 392 | 4.9% |
| Federal Government Employees | 166 | 2.1% |
| Unpaid Family Workers | 20 | 0.3% |
| Total | 7,961 | 100.0% |
Employment Status by Age in Red Oak
According to the labor force statistics for Red Oak, out of the total population over 16 years of age (11,269), 73.4% or 8,271 individuals are in the labor force, with 2.9% or 240 of them unemployed. The age group with the highest labor force participation rate is 25 to 29 years, with 100.0% or 896 individuals in the labor force. Within the labor force, the 25 to 29 years age range has the highest percentage of unemployed individuals, with 11.2% or 100 of them being unemployed.
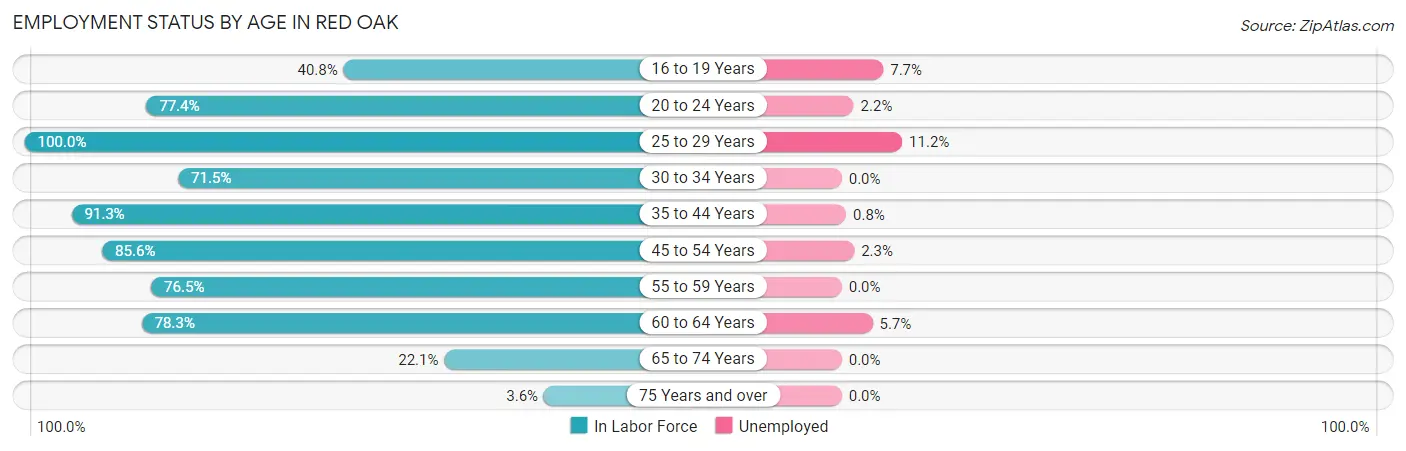
| Age Bracket | In Labor Force | Unemployed |
| 16 to 19 Years | 364 (40.8%) | 28 (7.7%) |
| 20 to 24 Years | 585 (77.4%) | 13 (2.2%) |
| 25 to 29 Years | 896 (100.0%) | 100 (11.2%) |
| 30 to 34 Years | 650 (71.5%) | 0 (0.0%) |
| 35 to 44 Years | 2,283 (91.3%) | 18 (0.8%) |
| 45 to 54 Years | 2,222 (85.6%) | 51 (2.3%) |
| 55 to 59 Years | 514 (76.5%) | 0 (0.0%) |
| 60 to 64 Years | 565 (78.3%) | 32 (5.7%) |
| 65 to 74 Years | 170 (22.1%) | 0 (0.0%) |
| 75 Years and over | 20 (3.6%) | 0 (0.0%) |
| Total | 8,271 (73.4%) | 240 (2.9%) |
Employment Status by Educational Attainment in Red Oak
According to labor force statistics for Red Oak, 85.9% of individuals (7,126) out of the total population between 25 and 64 years of age (8,296) are in the labor force, with 2.8% or 200 of them being unemployed. The group with the highest labor force participation rate are those with the educational attainment of college / associate degree, with 89.1% or 2,904 individuals in the labor force. Within the labor force, individuals with college / associate degree education have the highest percentage of unemployment, with 3.4% or 99 of them being unemployed.
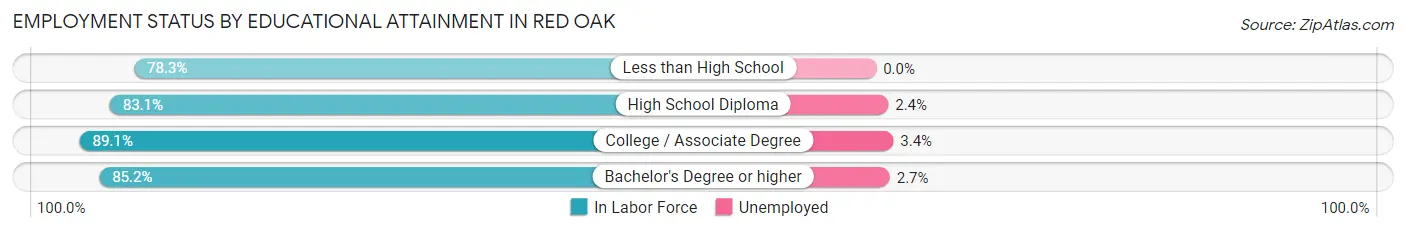
| Educational Attainment | In Labor Force | Unemployed |
| Less than High School | 249 (78.3%) | 0 (0.0%) |
| High School Diploma | 1,765 (83.1%) | 51 (2.4%) |
| College / Associate Degree | 2,904 (89.1%) | 111 (3.4%) |
| Bachelor's Degree or higher | 2,211 (85.2%) | 70 (2.7%) |
| Total | 7,126 (85.9%) | 232 (2.8%) |
Employment Occupations by Sex in Red Oak
Management, Business, Science and Arts Occupations
The most common Management, Business, Science and Arts occupations in Red Oak are Management (1,268 | 15.8%), Community & Social Service (714 | 8.9%), Business & Financial (698 | 8.7%), Education Instruction & Library (485 | 6.0%), and Health Diagnosing & Treating (231 | 2.9%).
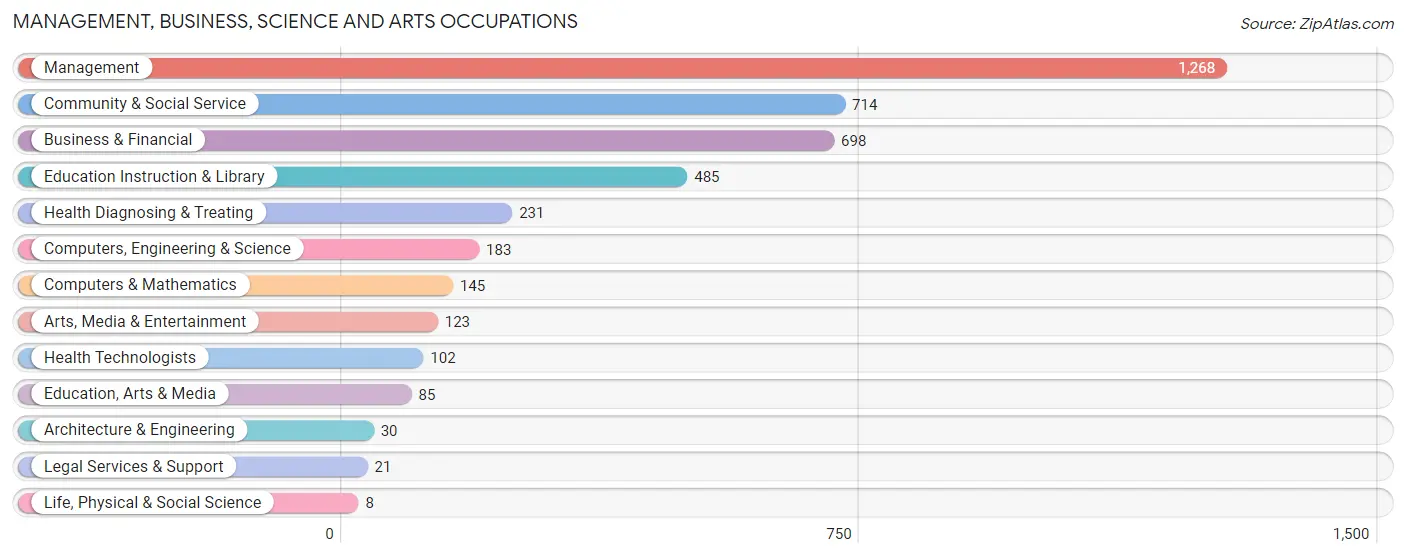
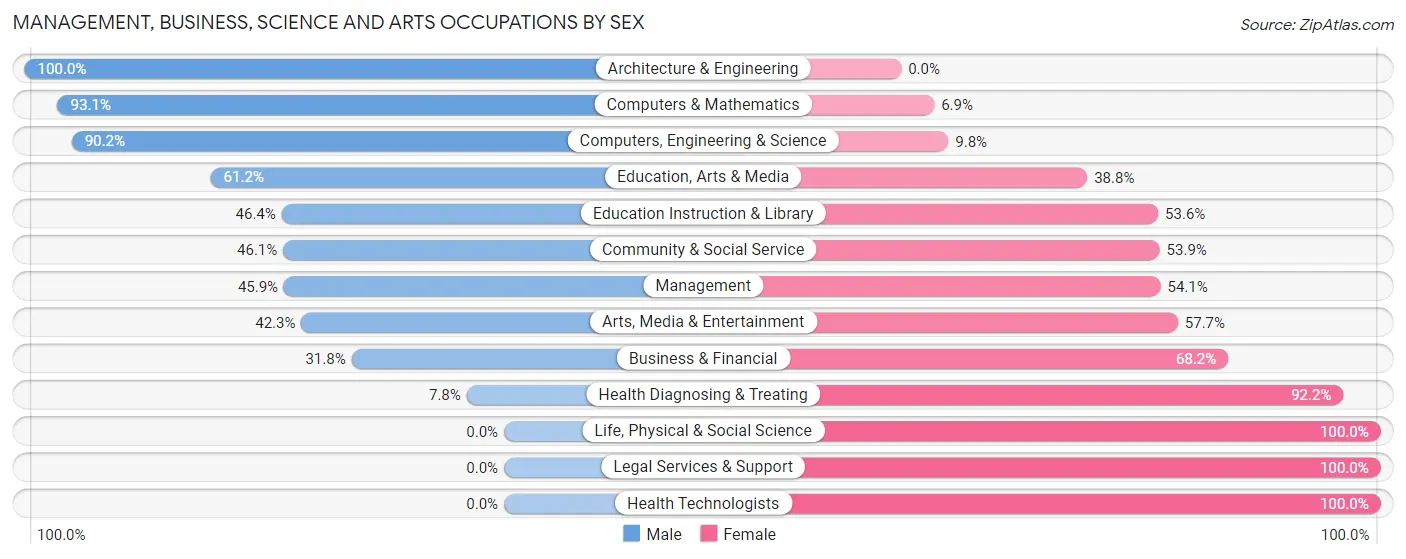
Management, Business, Science and Arts Occupations by Sex
Within the Management, Business, Science and Arts occupations in Red Oak, the most male-oriented occupations are Architecture & Engineering (100.0%), Computers & Mathematics (93.1%), and Computers, Engineering & Science (90.2%), while the most female-oriented occupations are Life, Physical & Social Science (100.0%), Legal Services & Support (100.0%), and Health Technologists (100.0%).
| Occupation | Male | Female |
| Management | 582 (45.9%) | 686 (54.1%) |
| Business & Financial | 222 (31.8%) | 476 (68.2%) |
| Computers, Engineering & Science | 165 (90.2%) | 18 (9.8%) |
| Computers & Mathematics | 135 (93.1%) | 10 (6.9%) |
| Architecture & Engineering | 30 (100.0%) | 0 (0.0%) |
| Life, Physical & Social Science | 0 (0.0%) | 8 (100.0%) |
| Community & Social Service | 329 (46.1%) | 385 (53.9%) |
| Education, Arts & Media | 52 (61.2%) | 33 (38.8%) |
| Legal Services & Support | 0 (0.0%) | 21 (100.0%) |
| Education Instruction & Library | 225 (46.4%) | 260 (53.6%) |
| Arts, Media & Entertainment | 52 (42.3%) | 71 (57.7%) |
| Health Diagnosing & Treating | 18 (7.8%) | 213 (92.2%) |
| Health Technologists | 0 (0.0%) | 102 (100.0%) |
| Total (Category) | 1,316 (42.5%) | 1,778 (57.5%) |
| Total (Overall) | 4,204 (52.4%) | 3,823 (47.6%) |
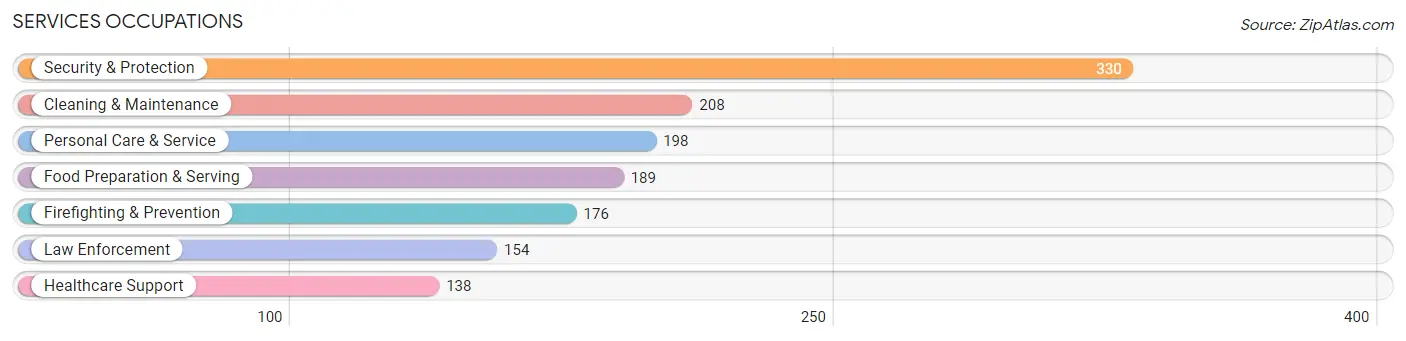
Services Occupations
The most common Services occupations in Red Oak are Security & Protection (330 | 4.1%), Cleaning & Maintenance (208 | 2.6%), Personal Care & Service (198 | 2.5%), Food Preparation & Serving (189 | 2.4%), and Firefighting & Prevention (176 | 2.2%).
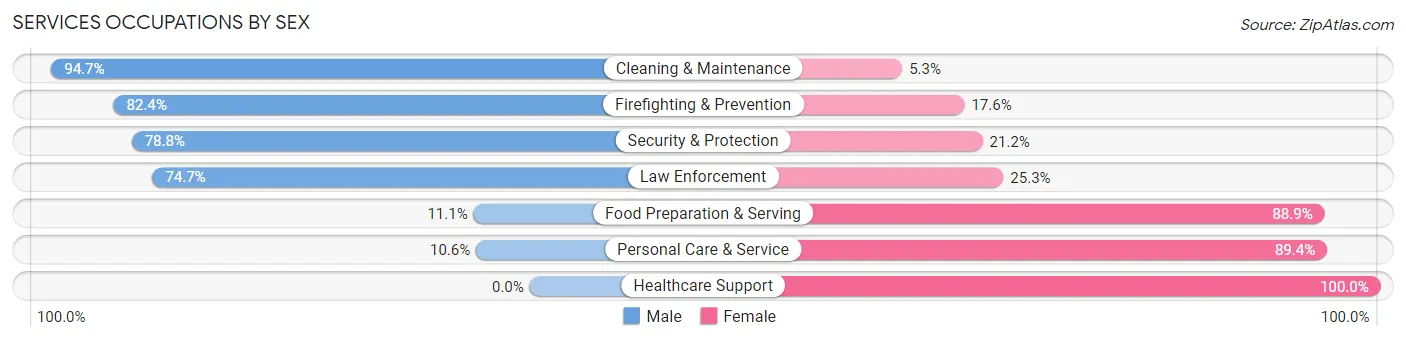
Services Occupations by Sex
Within the Services occupations in Red Oak, the most male-oriented occupations are Cleaning & Maintenance (94.7%), Firefighting & Prevention (82.4%), and Security & Protection (78.8%), while the most female-oriented occupations are Healthcare Support (100.0%), Personal Care & Service (89.4%), and Food Preparation & Serving (88.9%).
| Occupation | Male | Female |
| Healthcare Support | 0 (0.0%) | 138 (100.0%) |
| Security & Protection | 260 (78.8%) | 70 (21.2%) |
| Firefighting & Prevention | 145 (82.4%) | 31 (17.6%) |
| Law Enforcement | 115 (74.7%) | 39 (25.3%) |
| Food Preparation & Serving | 21 (11.1%) | 168 (88.9%) |
| Cleaning & Maintenance | 197 (94.7%) | 11 (5.3%) |
| Personal Care & Service | 21 (10.6%) | 177 (89.4%) |
| Total (Category) | 499 (46.9%) | 564 (53.1%) |
| Total (Overall) | 4,204 (52.4%) | 3,823 (47.6%) |
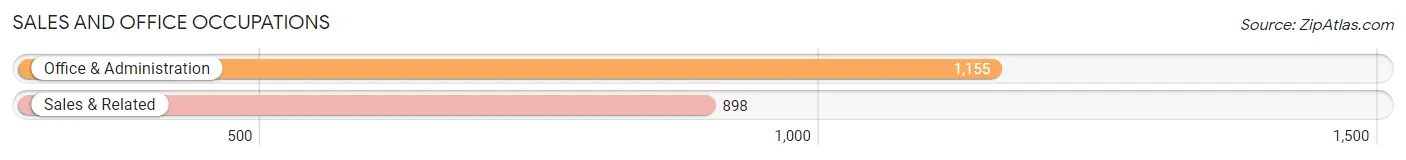
Sales and Office Occupations
The most common Sales and Office occupations in Red Oak are Office & Administration (1,155 | 14.4%), and Sales & Related (898 | 11.2%).
Sales and Office Occupations by Sex
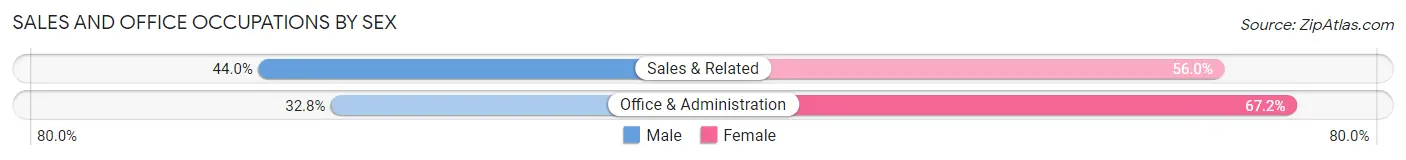
| Occupation | Male | Female |
| Sales & Related | 395 (44.0%) | 503 (56.0%) |
| Office & Administration | 379 (32.8%) | 776 (67.2%) |
| Total (Category) | 774 (37.7%) | 1,279 (62.3%) |
| Total (Overall) | 4,204 (52.4%) | 3,823 (47.6%) |
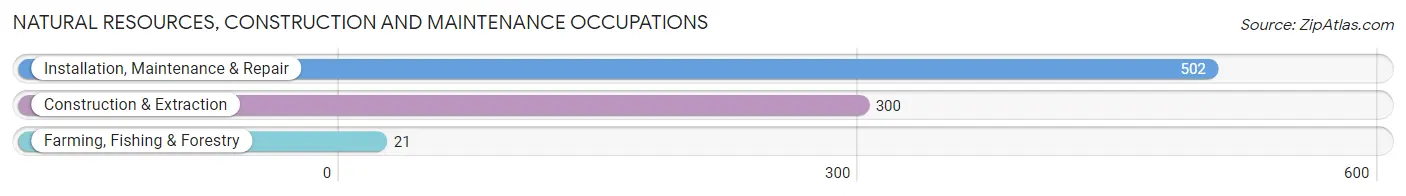
Natural Resources, Construction and Maintenance Occupations
The most common Natural Resources, Construction and Maintenance occupations in Red Oak are Installation, Maintenance & Repair (502 | 6.2%), Construction & Extraction (300 | 3.7%), and Farming, Fishing & Forestry (21 | 0.3%).
Natural Resources, Construction and Maintenance Occupations by Sex
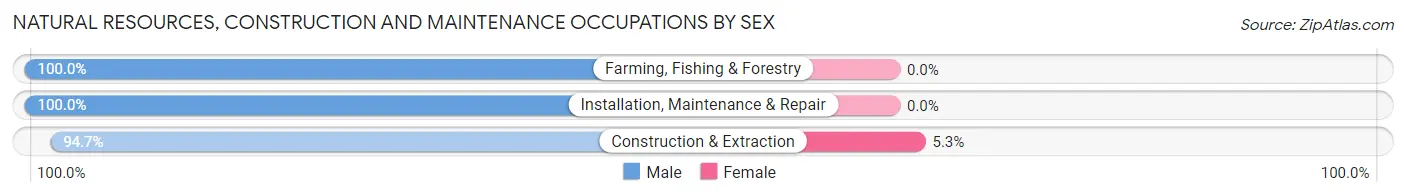
| Occupation | Male | Female |
| Farming, Fishing & Forestry | 21 (100.0%) | 0 (0.0%) |
| Construction & Extraction | 284 (94.7%) | 16 (5.3%) |
| Installation, Maintenance & Repair | 502 (100.0%) | 0 (0.0%) |
| Total (Category) | 807 (98.1%) | 16 (1.9%) |
| Total (Overall) | 4,204 (52.4%) | 3,823 (47.6%) |
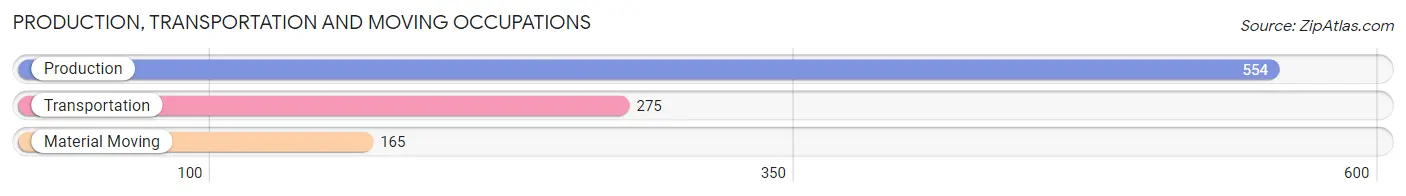
Production, Transportation and Moving Occupations
The most common Production, Transportation and Moving occupations in Red Oak are Production (554 | 6.9%), Transportation (275 | 3.4%), and Material Moving (165 | 2.1%).
Production, Transportation and Moving Occupations by Sex
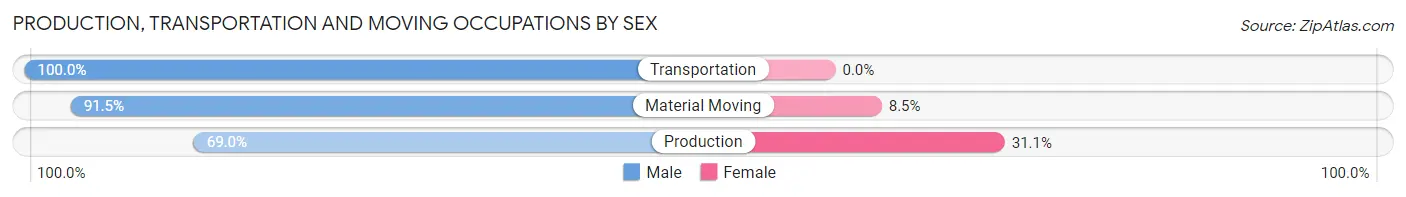
| Occupation | Male | Female |
| Production | 382 (69.0%) | 172 (31.0%) |
| Transportation | 275 (100.0%) | 0 (0.0%) |
| Material Moving | 151 (91.5%) | 14 (8.5%) |
| Total (Category) | 808 (81.3%) | 186 (18.7%) |
| Total (Overall) | 4,204 (52.4%) | 3,823 (47.6%) |
Employment Industries by Sex in Red Oak
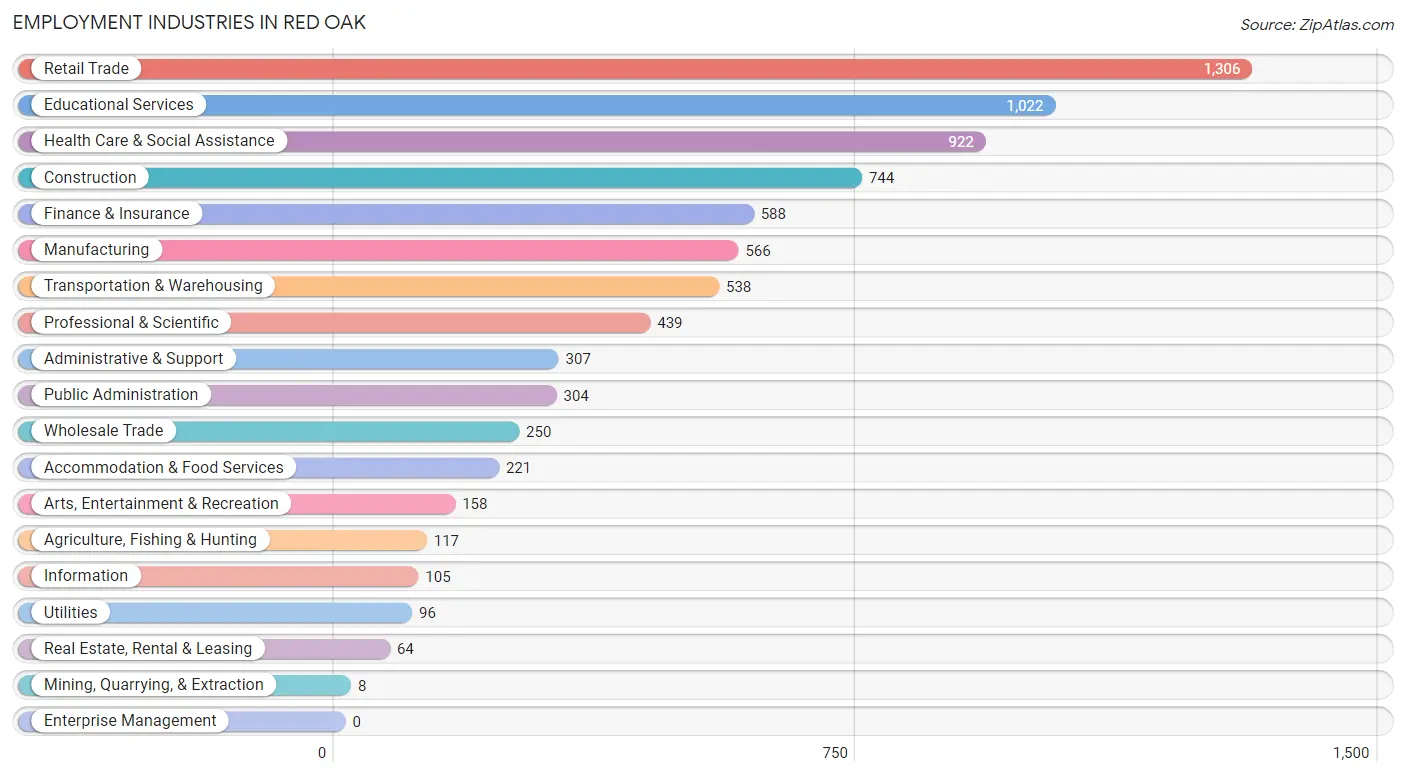
Employment Industries in Red Oak
The major employment industries in Red Oak include Retail Trade (1,306 | 16.3%), Educational Services (1,022 | 12.7%), Health Care & Social Assistance (922 | 11.5%), Construction (744 | 9.3%), and Finance & Insurance (588 | 7.3%).
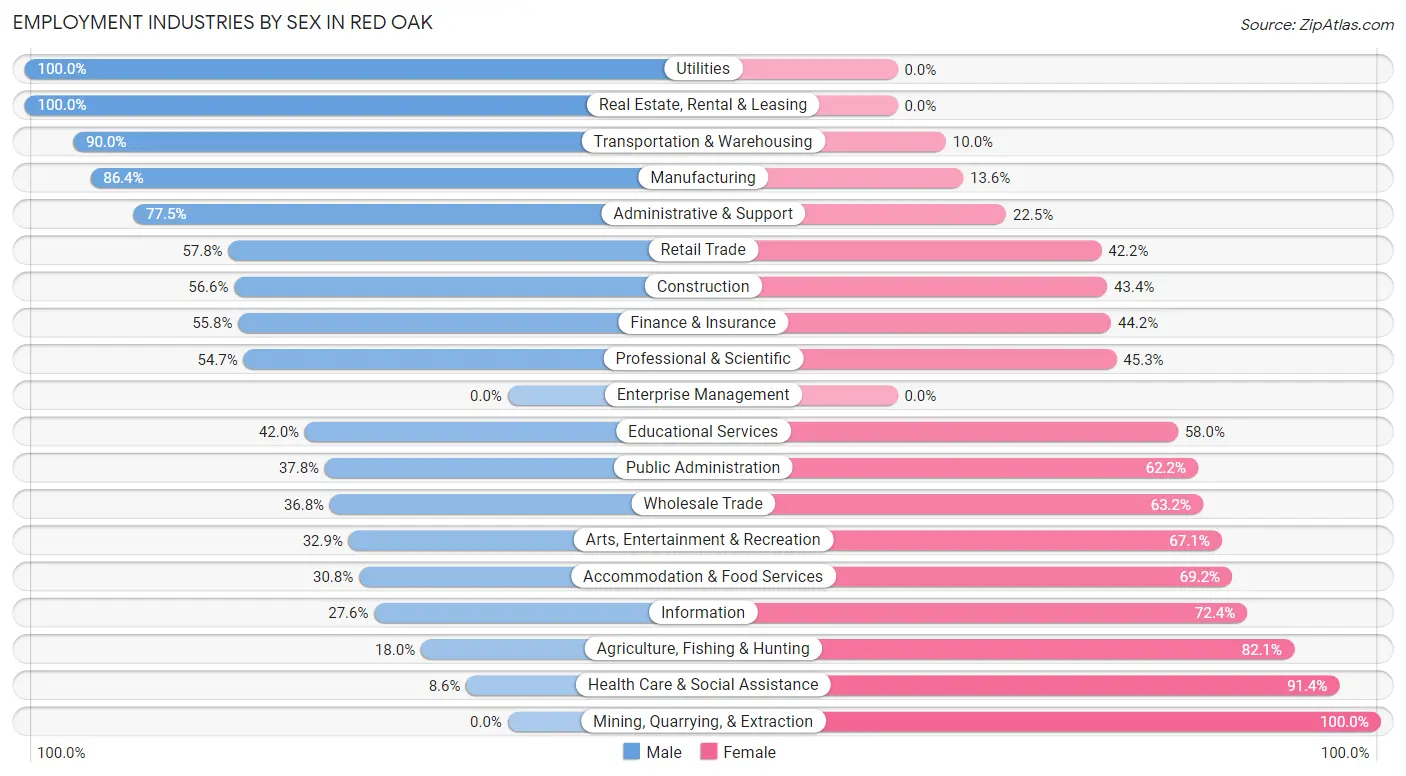
Employment Industries by Sex in Red Oak
The Red Oak industries that see more men than women are Utilities (100.0%), Real Estate, Rental & Leasing (100.0%), and Transportation & Warehousing (90.0%), whereas the industries that tend to have a higher number of women are Mining, Quarrying, & Extraction (100.0%), Health Care & Social Assistance (91.4%), and Agriculture, Fishing & Hunting (82.1%).
| Industry | Male | Female |
| Agriculture, Fishing & Hunting | 21 (17.9%) | 96 (82.1%) |
| Mining, Quarrying, & Extraction | 0 (0.0%) | 8 (100.0%) |
| Construction | 421 (56.6%) | 323 (43.4%) |
| Manufacturing | 489 (86.4%) | 77 (13.6%) |
| Wholesale Trade | 92 (36.8%) | 158 (63.2%) |
| Retail Trade | 755 (57.8%) | 551 (42.2%) |
| Transportation & Warehousing | 484 (90.0%) | 54 (10.0%) |
| Utilities | 96 (100.0%) | 0 (0.0%) |
| Information | 29 (27.6%) | 76 (72.4%) |
| Finance & Insurance | 328 (55.8%) | 260 (44.2%) |
| Real Estate, Rental & Leasing | 64 (100.0%) | 0 (0.0%) |
| Professional & Scientific | 240 (54.7%) | 199 (45.3%) |
| Enterprise Management | 0 (0.0%) | 0 (0.0%) |
| Administrative & Support | 238 (77.5%) | 69 (22.5%) |
| Educational Services | 429 (42.0%) | 593 (58.0%) |
| Health Care & Social Assistance | 79 (8.6%) | 843 (91.4%) |
| Arts, Entertainment & Recreation | 52 (32.9%) | 106 (67.1%) |
| Accommodation & Food Services | 68 (30.8%) | 153 (69.2%) |
| Public Administration | 115 (37.8%) | 189 (62.2%) |
| Total | 4,204 (52.4%) | 3,823 (47.6%) |
Education in Red Oak
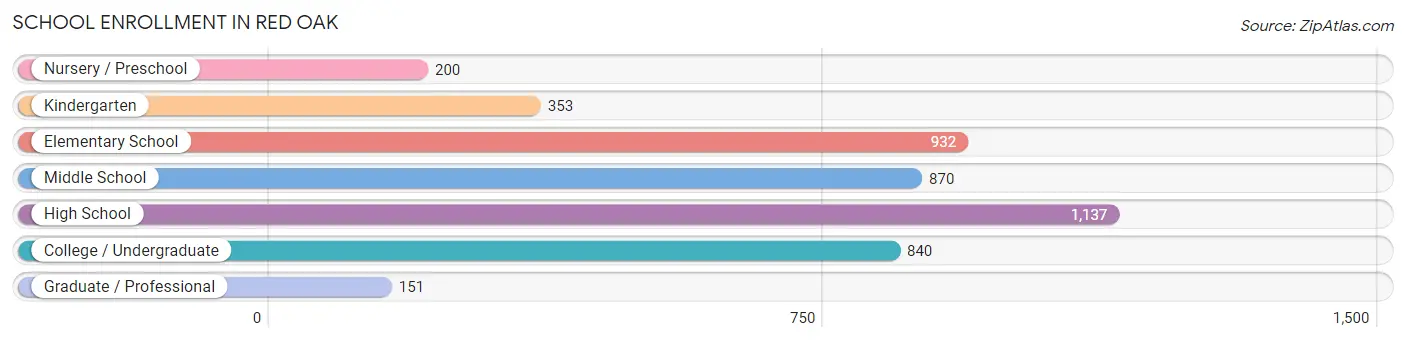
School Enrollment in Red Oak
The most common levels of schooling among the 4,483 students in Red Oak are high school (1,137 | 25.4%), elementary school (932 | 20.8%), and middle school (870 | 19.4%).
| School Level | # Students | % Students |
| Nursery / Preschool | 200 | 4.5% |
| Kindergarten | 353 | 7.9% |
| Elementary School | 932 | 20.8% |
| Middle School | 870 | 19.4% |
| High School | 1,137 | 25.4% |
| College / Undergraduate | 840 | 18.7% |
| Graduate / Professional | 151 | 3.4% |
| Total | 4,483 | 100.0% |
School Enrollment by Age by Funding Source in Red Oak
Out of a total of 4,483 students who are enrolled in schools in Red Oak, 596 (13.3%) attend a private institution, while the remaining 3,887 (86.7%) are enrolled in public schools. The age group of 3 to 4 year olds has the highest likelihood of being enrolled in private schools, with 40 (58.0% in the age bracket) enrolled. Conversely, the age group of 18 to 19 year olds has the lowest likelihood of being enrolled in a private school, with 183 (100.0% in the age bracket) attending a public institution.
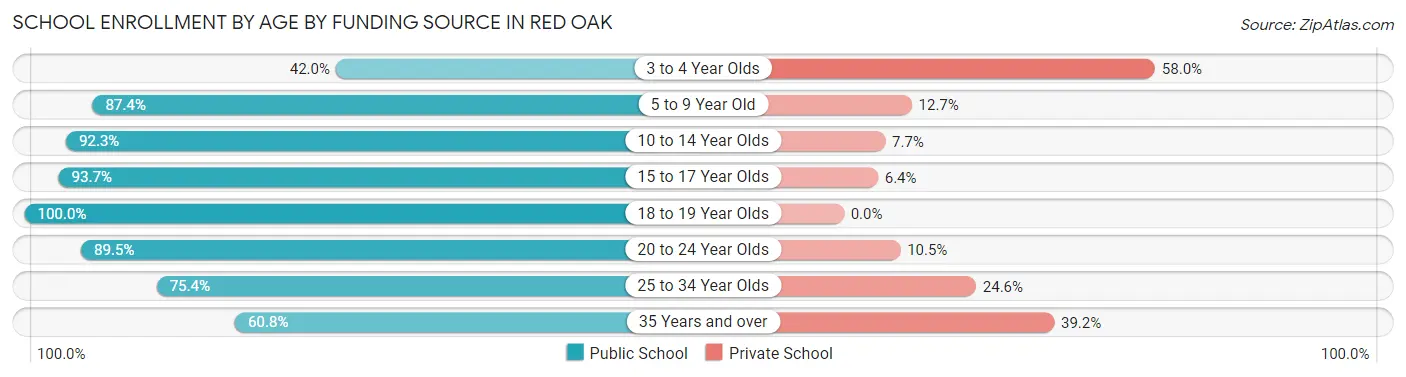
| Age Bracket | Public School | Private School |
| 3 to 4 Year Olds | 29 (42.0%) | 40 (58.0%) |
| 5 to 9 Year Old | 1,208 (87.4%) | 175 (12.7%) |
| 10 to 14 Year Olds | 1,006 (92.3%) | 84 (7.7%) |
| 15 to 17 Year Olds | 782 (93.6%) | 53 (6.4%) |
| 18 to 19 Year Olds | 183 (100.0%) | 0 (0.0%) |
| 20 to 24 Year Olds | 221 (89.5%) | 26 (10.5%) |
| 25 to 34 Year Olds | 248 (75.4%) | 81 (24.6%) |
| 35 Years and over | 211 (60.8%) | 136 (39.2%) |
| Total | 3,887 (86.7%) | 596 (13.3%) |
Educational Attainment by Field of Study in Red Oak
Business (788 | 25.2%), arts & humanities (353 | 11.3%), education (317 | 10.2%), liberal arts & history (279 | 8.9%), and communications (226 | 7.2%) are the most common fields of study among 3,124 individuals in Red Oak who have obtained a bachelor's degree or higher.
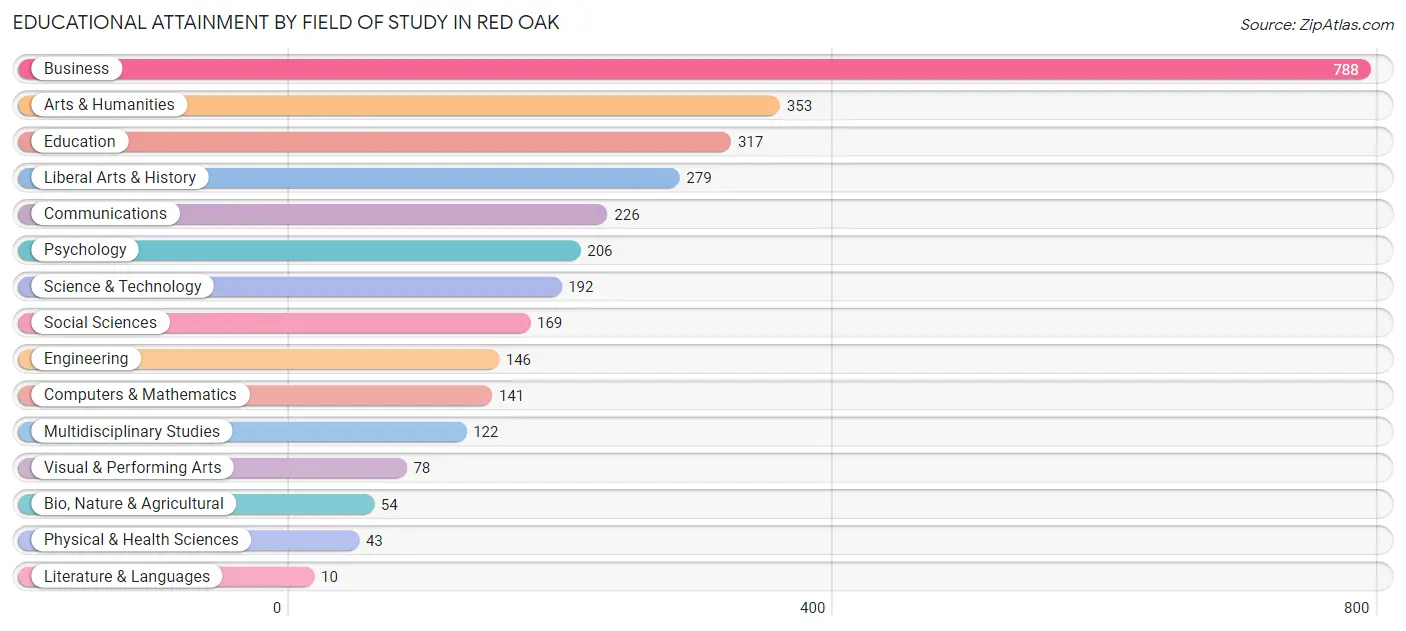
| Field of Study | # Graduates | % Graduates |
| Computers & Mathematics | 141 | 4.5% |
| Bio, Nature & Agricultural | 54 | 1.7% |
| Physical & Health Sciences | 43 | 1.4% |
| Psychology | 206 | 6.6% |
| Social Sciences | 169 | 5.4% |
| Engineering | 146 | 4.7% |
| Multidisciplinary Studies | 122 | 3.9% |
| Science & Technology | 192 | 6.1% |
| Business | 788 | 25.2% |
| Education | 317 | 10.2% |
| Literature & Languages | 10 | 0.3% |
| Liberal Arts & History | 279 | 8.9% |
| Visual & Performing Arts | 78 | 2.5% |
| Communications | 226 | 7.2% |
| Arts & Humanities | 353 | 11.3% |
| Total | 3,124 | 100.0% |
Transportation & Commute in Red Oak
Vehicle Availability by Sex in Red Oak
The most prevalent vehicle ownership categories in Red Oak are males with 2 vehicles (1,411, accounting for 33.6%) and females with 2 vehicles (1,252, making up 37.6%).
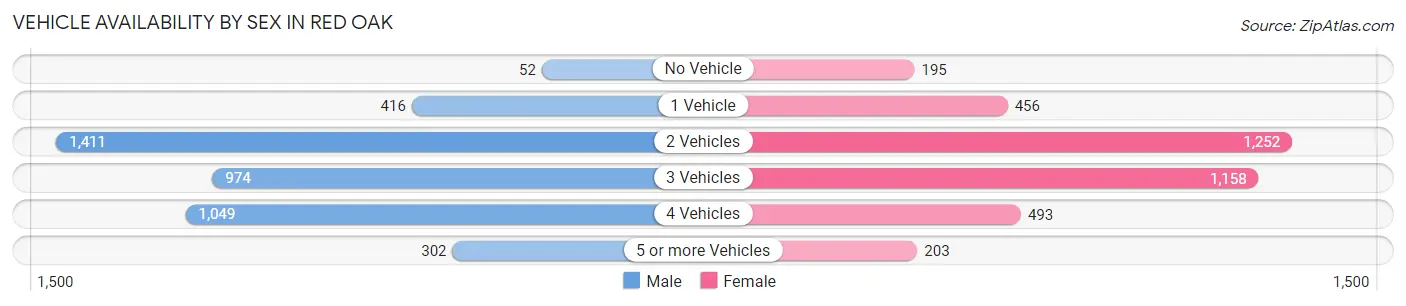
| Vehicles Available | Male | Female |
| No Vehicle | 52 (1.2%) | 195 (5.2%) |
| 1 Vehicle | 416 (9.9%) | 456 (12.1%) |
| 2 Vehicles | 1,411 (33.6%) | 1,252 (33.3%) |
| 3 Vehicles | 974 (23.2%) | 1,158 (30.8%) |
| 4 Vehicles | 1,049 (24.9%) | 493 (13.1%) |
| 5 or more Vehicles | 302 (7.2%) | 203 (5.4%) |
| Total | 4,204 (100.0%) | 3,757 (100.0%) |
Commute Time in Red Oak
The most frequently occuring commute durations in Red Oak are 45 to 59 minutes (1,261 commuters, 18.4%), 15 to 19 minutes (1,155 commuters, 16.9%), and 30 to 34 minutes (804 commuters, 11.8%).
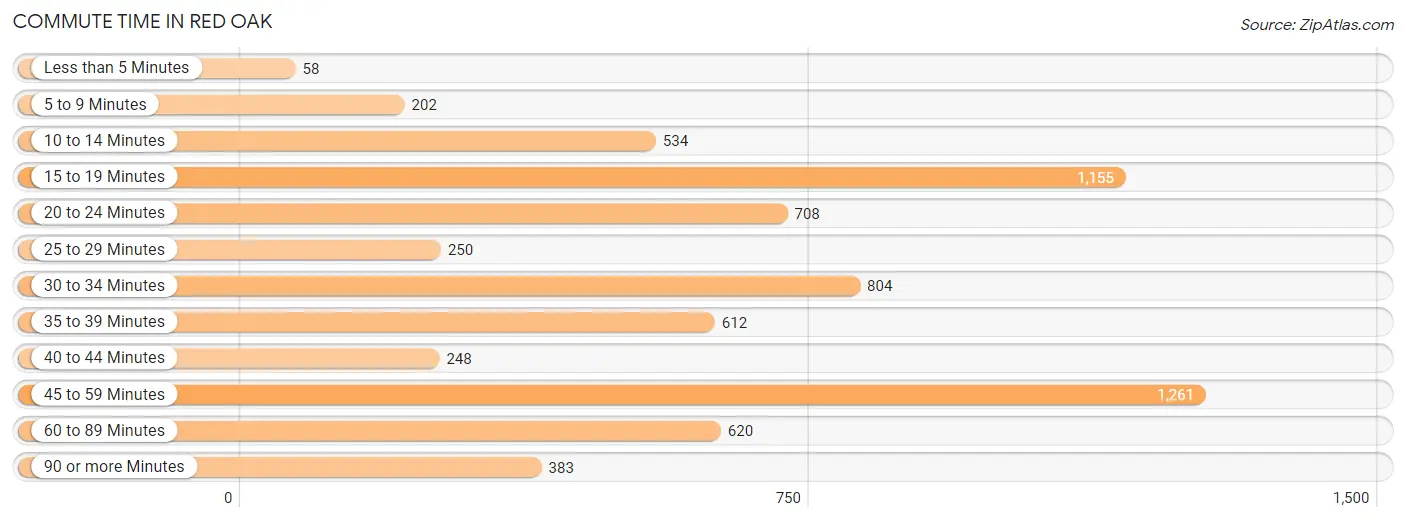
| Commute Time | # Commuters | % Commuters |
| Less than 5 Minutes | 58 | 0.9% |
| 5 to 9 Minutes | 202 | 3.0% |
| 10 to 14 Minutes | 534 | 7.8% |
| 15 to 19 Minutes | 1,155 | 16.9% |
| 20 to 24 Minutes | 708 | 10.4% |
| 25 to 29 Minutes | 250 | 3.7% |
| 30 to 34 Minutes | 804 | 11.8% |
| 35 to 39 Minutes | 612 | 8.9% |
| 40 to 44 Minutes | 248 | 3.6% |
| 45 to 59 Minutes | 1,261 | 18.4% |
| 60 to 89 Minutes | 620 | 9.1% |
| 90 or more Minutes | 383 | 5.6% |
Commute Time by Sex in Red Oak
The most common commute times in Red Oak are 15 to 19 minutes (738 commuters, 19.4%) for males and 45 to 59 minutes (615 commuters, 20.3%) for females.
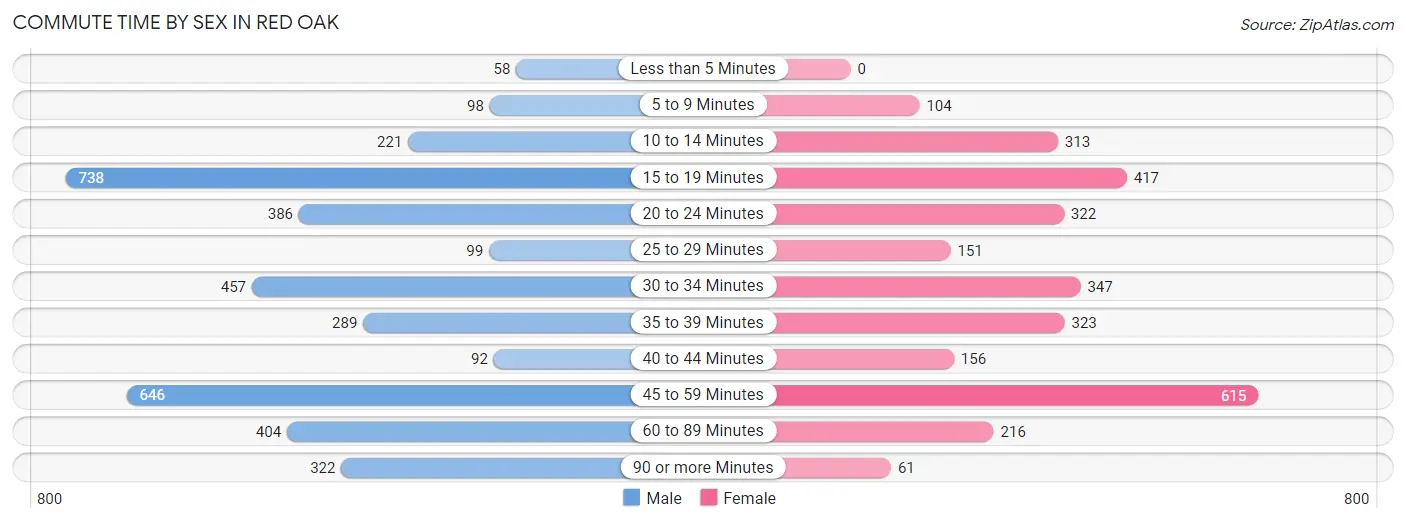
| Commute Time | Male | Female |
| Less than 5 Minutes | 58 (1.5%) | 0 (0.0%) |
| 5 to 9 Minutes | 98 (2.6%) | 104 (3.4%) |
| 10 to 14 Minutes | 221 (5.8%) | 313 (10.3%) |
| 15 to 19 Minutes | 738 (19.4%) | 417 (13.8%) |
| 20 to 24 Minutes | 386 (10.1%) | 322 (10.6%) |
| 25 to 29 Minutes | 99 (2.6%) | 151 (5.0%) |
| 30 to 34 Minutes | 457 (12.0%) | 347 (11.5%) |
| 35 to 39 Minutes | 289 (7.6%) | 323 (10.7%) |
| 40 to 44 Minutes | 92 (2.4%) | 156 (5.2%) |
| 45 to 59 Minutes | 646 (17.0%) | 615 (20.3%) |
| 60 to 89 Minutes | 404 (10.6%) | 216 (7.1%) |
| 90 or more Minutes | 322 (8.5%) | 61 (2.0%) |
Time of Departure to Work by Sex in Red Oak
The most frequent times of departure to work in Red Oak are 12:00 AM to 4:59 AM (653, 17.1%) for males and 7:00 AM to 7:29 AM (570, 18.8%) for females.
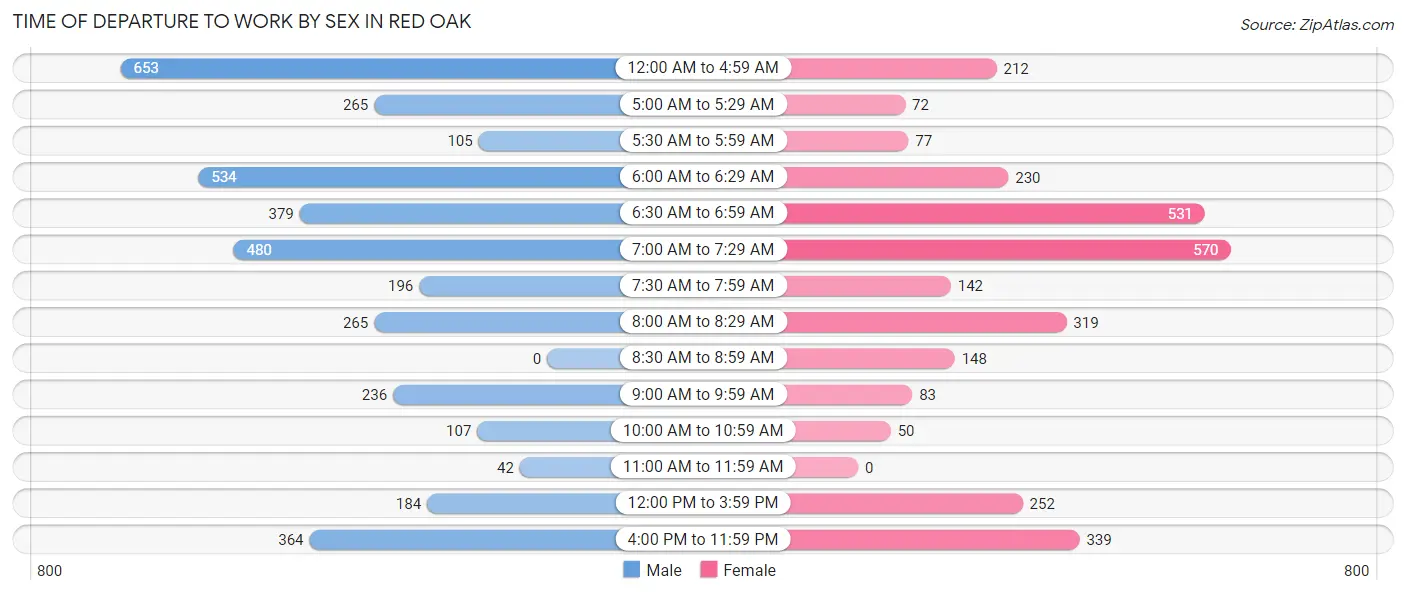
| Time of Departure | Male | Female |
| 12:00 AM to 4:59 AM | 653 (17.1%) | 212 (7.0%) |
| 5:00 AM to 5:29 AM | 265 (7.0%) | 72 (2.4%) |
| 5:30 AM to 5:59 AM | 105 (2.8%) | 77 (2.5%) |
| 6:00 AM to 6:29 AM | 534 (14.0%) | 230 (7.6%) |
| 6:30 AM to 6:59 AM | 379 (10.0%) | 531 (17.5%) |
| 7:00 AM to 7:29 AM | 480 (12.6%) | 570 (18.8%) |
| 7:30 AM to 7:59 AM | 196 (5.1%) | 142 (4.7%) |
| 8:00 AM to 8:29 AM | 265 (7.0%) | 319 (10.5%) |
| 8:30 AM to 8:59 AM | 0 (0.0%) | 148 (4.9%) |
| 9:00 AM to 9:59 AM | 236 (6.2%) | 83 (2.7%) |
| 10:00 AM to 10:59 AM | 107 (2.8%) | 50 (1.7%) |
| 11:00 AM to 11:59 AM | 42 (1.1%) | 0 (0.0%) |
| 12:00 PM to 3:59 PM | 184 (4.8%) | 252 (8.3%) |
| 4:00 PM to 11:59 PM | 364 (9.6%) | 339 (11.2%) |
| Total | 3,810 (100.0%) | 3,025 (100.0%) |
Housing Occupancy in Red Oak
Occupancy by Ownership in Red Oak
Of the total 4,655 dwellings in Red Oak, owner-occupied units account for 3,645 (78.3%), while renter-occupied units make up 1,010 (21.7%).
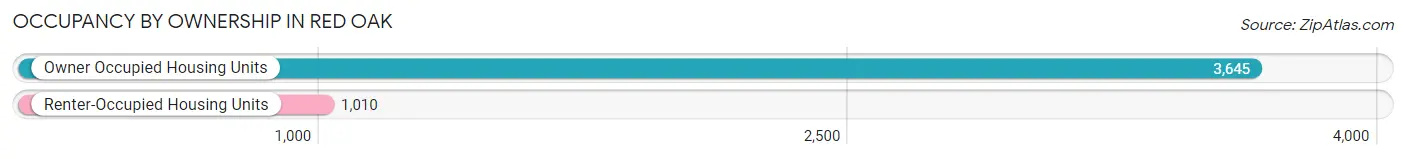
| Occupancy | # Housing Units | % Housing Units |
| Owner Occupied Housing Units | 3,645 | 78.3% |
| Renter-Occupied Housing Units | 1,010 | 21.7% |
| Total Occupied Housing Units | 4,655 | 100.0% |
Occupancy by Household Size in Red Oak
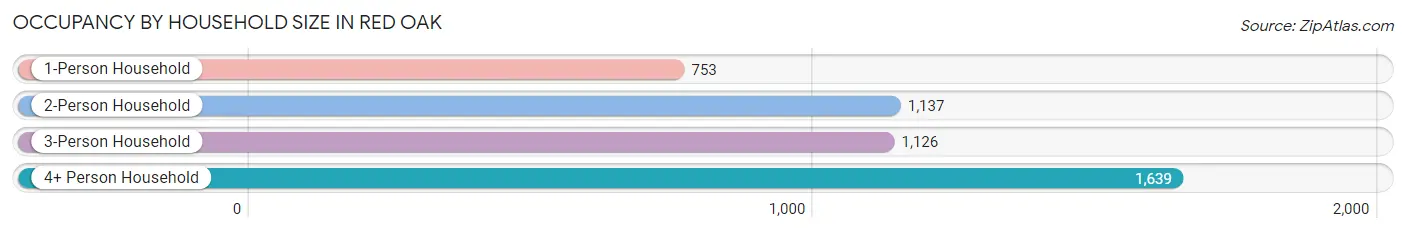
| Household Size | # Housing Units | % Housing Units |
| 1-Person Household | 753 | 16.2% |
| 2-Person Household | 1,137 | 24.4% |
| 3-Person Household | 1,126 | 24.2% |
| 4+ Person Household | 1,639 | 35.2% |
| Total Housing Units | 4,655 | 100.0% |
Occupancy by Ownership by Household Size in Red Oak
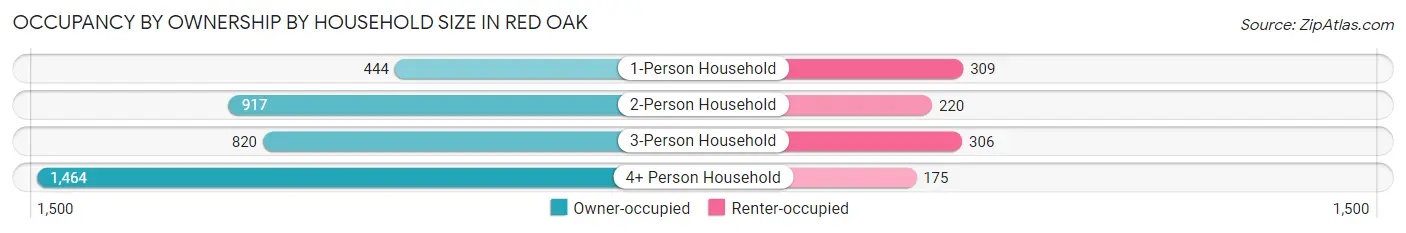
| Household Size | Owner-occupied | Renter-occupied |
| 1-Person Household | 444 (59.0%) | 309 (41.0%) |
| 2-Person Household | 917 (80.6%) | 220 (19.4%) |
| 3-Person Household | 820 (72.8%) | 306 (27.2%) |
| 4+ Person Household | 1,464 (89.3%) | 175 (10.7%) |
| Total Housing Units | 3,645 (78.3%) | 1,010 (21.7%) |
Occupancy by Educational Attainment in Red Oak
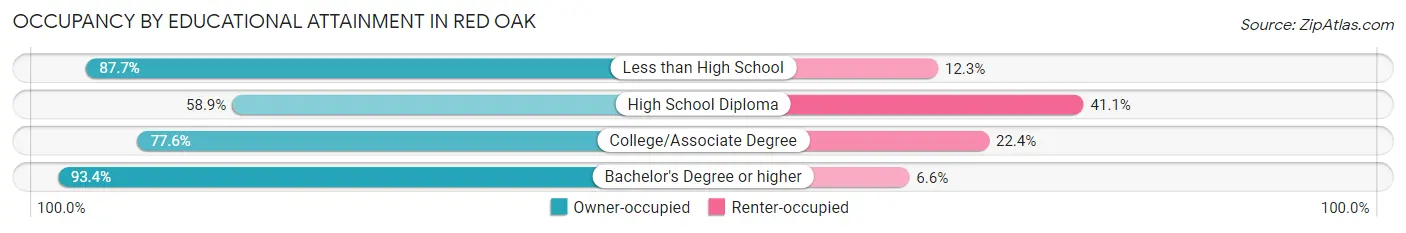
| Household Size | Owner-occupied | Renter-occupied |
| Less than High School | 93 (87.7%) | 13 (12.3%) |
| High School Diploma | 671 (58.9%) | 469 (41.1%) |
| College/Associate Degree | 1,491 (77.6%) | 430 (22.4%) |
| Bachelor's Degree or higher | 1,390 (93.4%) | 98 (6.6%) |
Occupancy by Age of Householder in Red Oak
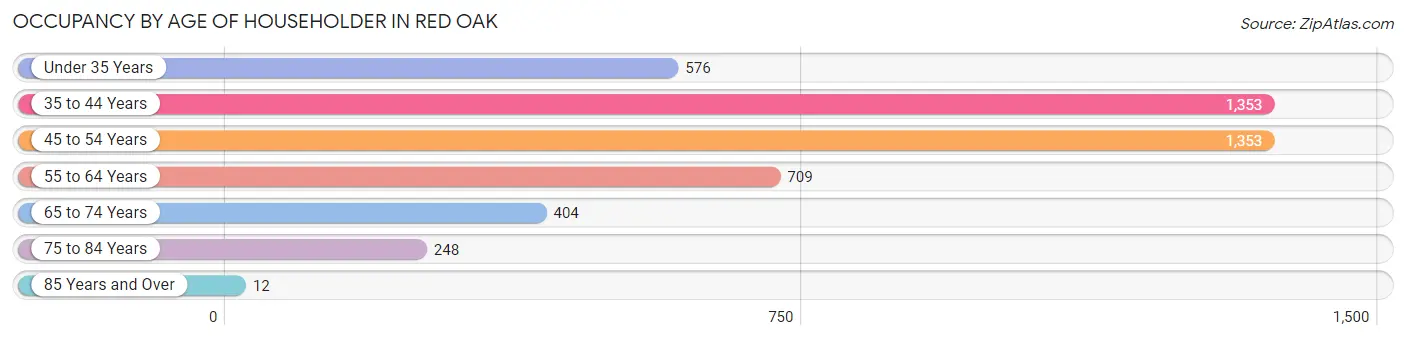
| Age Bracket | # Households | % Households |
| Under 35 Years | 576 | 12.4% |
| 35 to 44 Years | 1,353 | 29.1% |
| 45 to 54 Years | 1,353 | 29.1% |
| 55 to 64 Years | 709 | 15.2% |
| 65 to 74 Years | 404 | 8.7% |
| 75 to 84 Years | 248 | 5.3% |
| 85 Years and Over | 12 | 0.3% |
| Total | 4,655 | 100.0% |
Housing Finances in Red Oak
Median Income by Occupancy in Red Oak
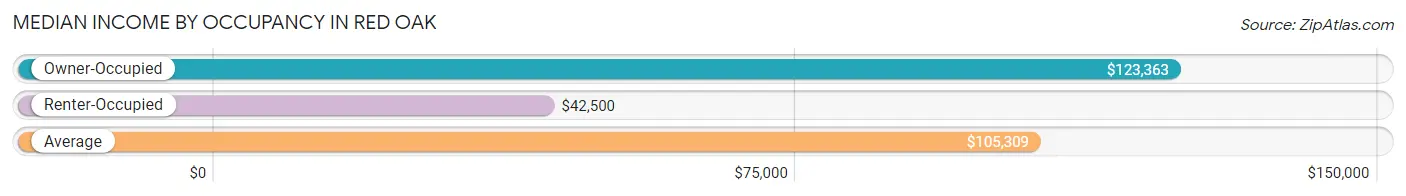
| Occupancy Type | # Households | Median Income |
| Owner-Occupied | 3,645 (78.3%) | $123,363 |
| Renter-Occupied | 1,010 (21.7%) | $42,500 |
| Average | 4,655 (100.0%) | $105,309 |
Occupancy by Householder Income Bracket in Red Oak
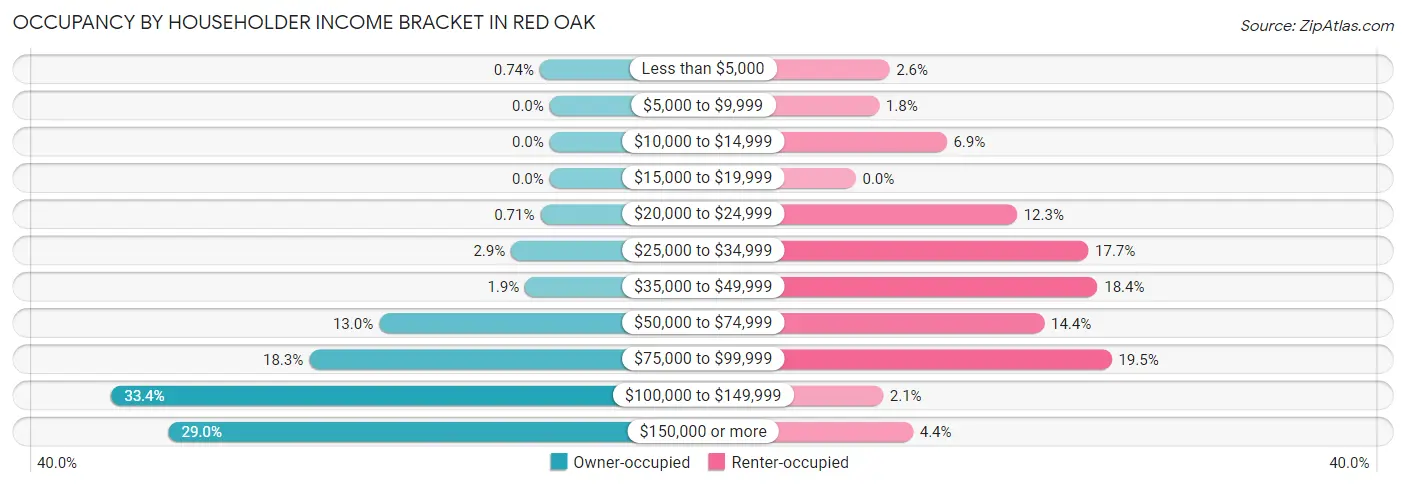
| Income Bracket | Owner-occupied | Renter-occupied |
| Less than $5,000 | 27 (0.7%) | 26 (2.6%) |
| $5,000 to $9,999 | 0 (0.0%) | 18 (1.8%) |
| $10,000 to $14,999 | 0 (0.0%) | 70 (6.9%) |
| $15,000 to $19,999 | 0 (0.0%) | 0 (0.0%) |
| $20,000 to $24,999 | 26 (0.7%) | 124 (12.3%) |
| $25,000 to $34,999 | 107 (2.9%) | 179 (17.7%) |
| $35,000 to $49,999 | 68 (1.9%) | 186 (18.4%) |
| $50,000 to $74,999 | 474 (13.0%) | 145 (14.4%) |
| $75,000 to $99,999 | 668 (18.3%) | 197 (19.5%) |
| $100,000 to $149,999 | 1,217 (33.4%) | 21 (2.1%) |
| $150,000 or more | 1,058 (29.0%) | 44 (4.4%) |
| Total | 3,645 (100.0%) | 1,010 (100.0%) |
Monthly Housing Cost Tiers in Red Oak
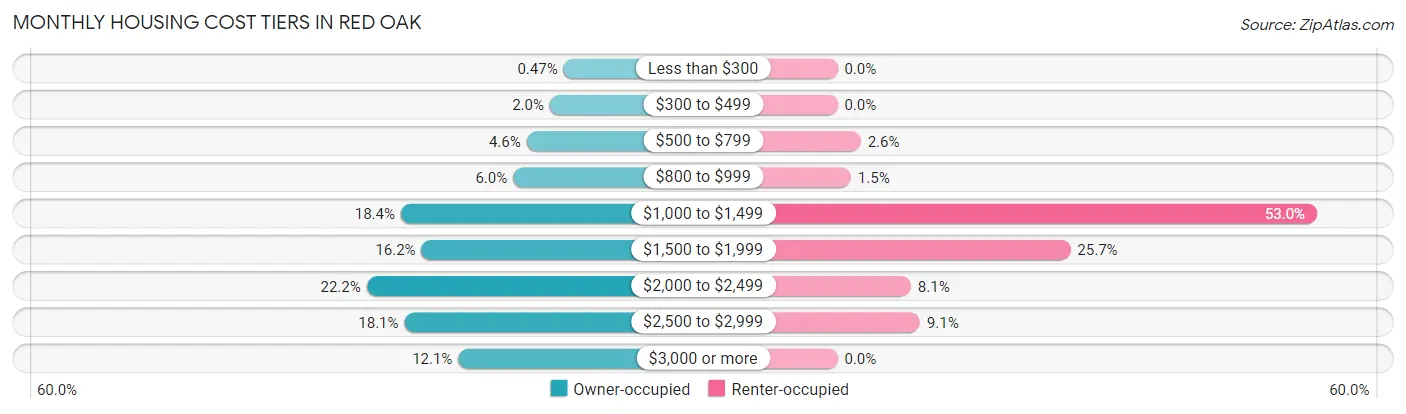
| Monthly Cost | Owner-occupied | Renter-occupied |
| Less than $300 | 17 (0.5%) | 0 (0.0%) |
| $300 to $499 | 72 (2.0%) | 0 (0.0%) |
| $500 to $799 | 166 (4.5%) | 26 (2.6%) |
| $800 to $999 | 220 (6.0%) | 15 (1.5%) |
| $1,000 to $1,499 | 672 (18.4%) | 535 (53.0%) |
| $1,500 to $1,999 | 589 (16.2%) | 260 (25.7%) |
| $2,000 to $2,499 | 810 (22.2%) | 82 (8.1%) |
| $2,500 to $2,999 | 658 (18.0%) | 92 (9.1%) |
| $3,000 or more | 441 (12.1%) | 0 (0.0%) |
| Total | 3,645 (100.0%) | 1,010 (100.0%) |
Physical Housing Characteristics in Red Oak
Housing Structures in Red Oak
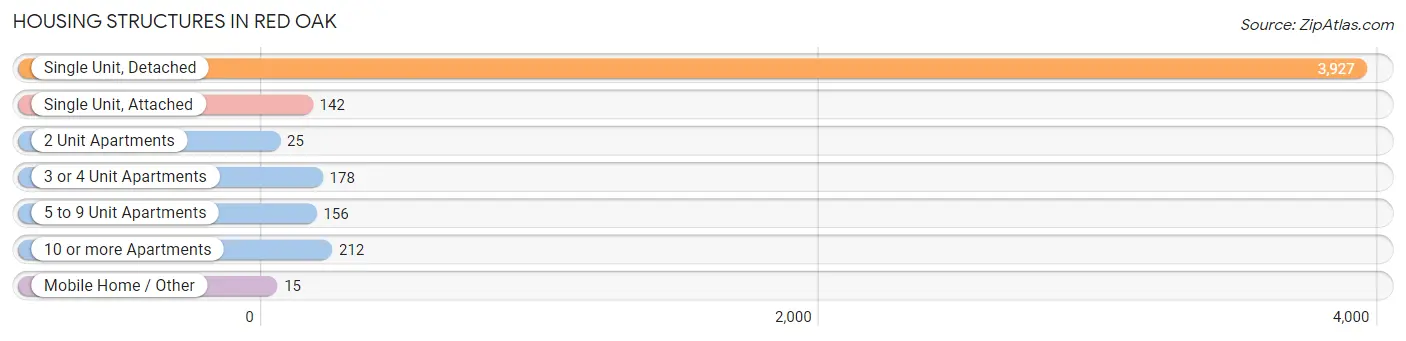
| Structure Type | # Housing Units | % Housing Units |
| Single Unit, Detached | 3,927 | 84.4% |
| Single Unit, Attached | 142 | 3.0% |
| 2 Unit Apartments | 25 | 0.5% |
| 3 or 4 Unit Apartments | 178 | 3.8% |
| 5 to 9 Unit Apartments | 156 | 3.4% |
| 10 or more Apartments | 212 | 4.5% |
| Mobile Home / Other | 15 | 0.3% |
| Total | 4,655 | 100.0% |
Housing Structures by Occupancy in Red Oak
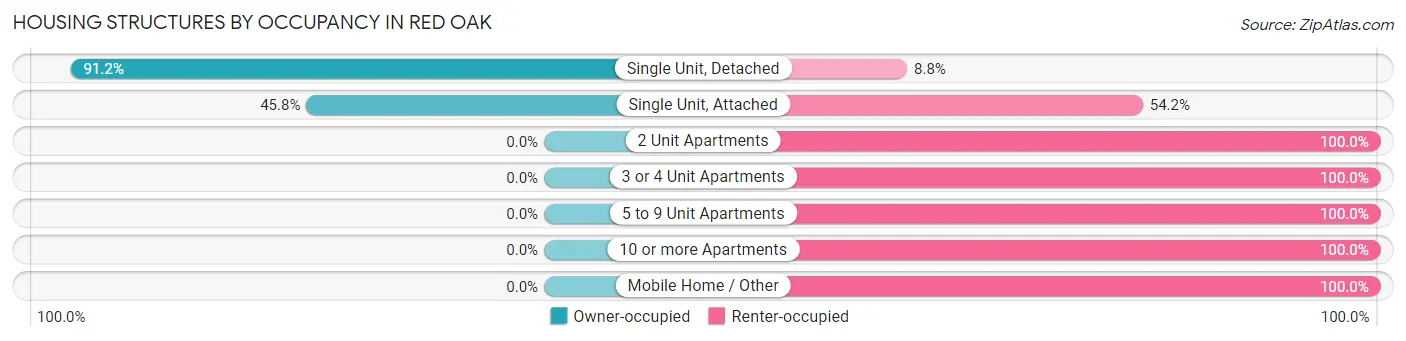
| Structure Type | Owner-occupied | Renter-occupied |
| Single Unit, Detached | 3,580 (91.2%) | 347 (8.8%) |
| Single Unit, Attached | 65 (45.8%) | 77 (54.2%) |
| 2 Unit Apartments | 0 (0.0%) | 25 (100.0%) |
| 3 or 4 Unit Apartments | 0 (0.0%) | 178 (100.0%) |
| 5 to 9 Unit Apartments | 0 (0.0%) | 156 (100.0%) |
| 10 or more Apartments | 0 (0.0%) | 212 (100.0%) |
| Mobile Home / Other | 0 (0.0%) | 15 (100.0%) |
| Total | 3,645 (78.3%) | 1,010 (21.7%) |
Housing Structures by Number of Rooms in Red Oak
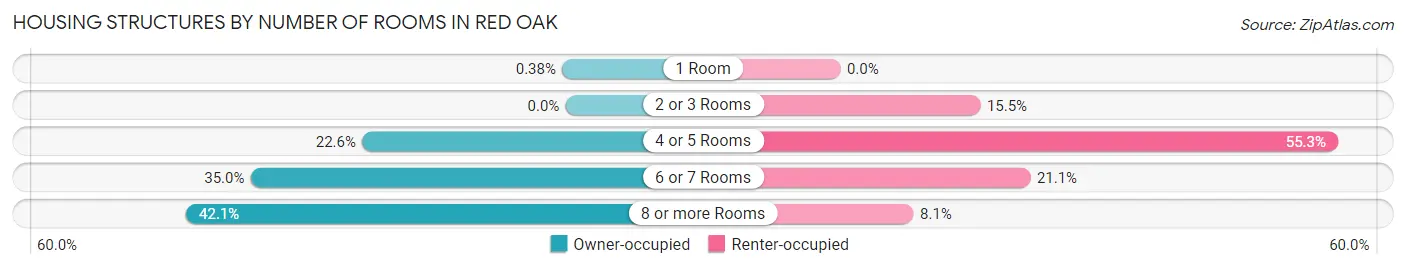
| Number of Rooms | Owner-occupied | Renter-occupied |
| 1 Room | 14 (0.4%) | 0 (0.0%) |
| 2 or 3 Rooms | 0 (0.0%) | 157 (15.5%) |
| 4 or 5 Rooms | 823 (22.6%) | 558 (55.2%) |
| 6 or 7 Rooms | 1,274 (34.9%) | 213 (21.1%) |
| 8 or more Rooms | 1,534 (42.1%) | 82 (8.1%) |
| Total | 3,645 (100.0%) | 1,010 (100.0%) |
Housing Structure by Heating Type in Red Oak
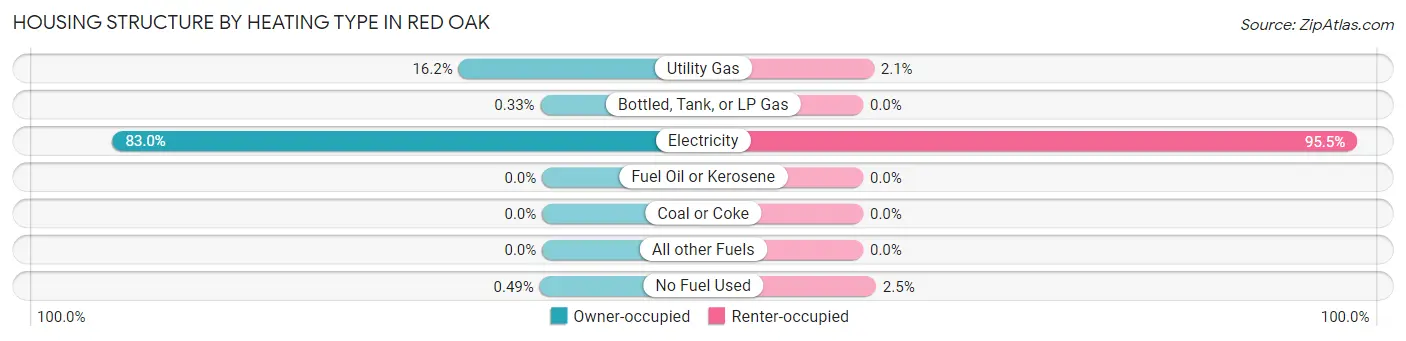
| Heating Type | Owner-occupied | Renter-occupied |
| Utility Gas | 589 (16.2%) | 21 (2.1%) |
| Bottled, Tank, or LP Gas | 12 (0.3%) | 0 (0.0%) |
| Electricity | 3,026 (83.0%) | 964 (95.5%) |
| Fuel Oil or Kerosene | 0 (0.0%) | 0 (0.0%) |
| Coal or Coke | 0 (0.0%) | 0 (0.0%) |
| All other Fuels | 0 (0.0%) | 0 (0.0%) |
| No Fuel Used | 18 (0.5%) | 25 (2.5%) |
| Total | 3,645 (100.0%) | 1,010 (100.0%) |
Household Vehicle Usage in Red Oak
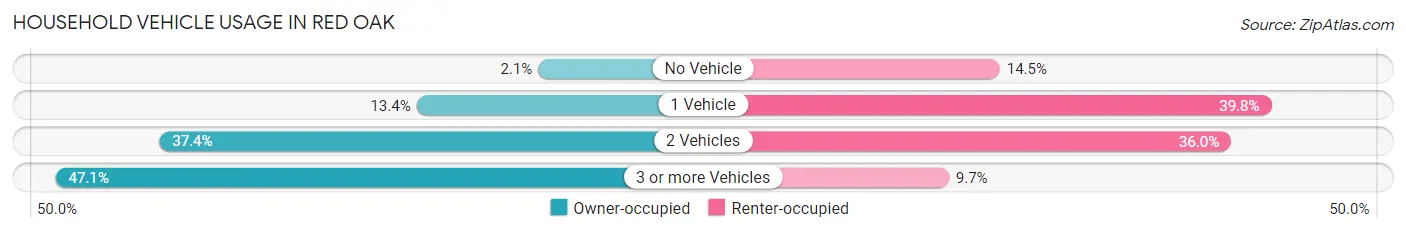
| Vehicles per Household | Owner-occupied | Renter-occupied |
| No Vehicle | 75 (2.1%) | 146 (14.5%) |
| 1 Vehicle | 489 (13.4%) | 402 (39.8%) |
| 2 Vehicles | 1,364 (37.4%) | 364 (36.0%) |
| 3 or more Vehicles | 1,717 (47.1%) | 98 (9.7%) |
| Total | 3,645 (100.0%) | 1,010 (100.0%) |
Real Estate & Mortgages in Red Oak
Real Estate and Mortgage Overview in Red Oak
| Characteristic | Without Mortgage | With Mortgage |
| Housing Units | 575 | 3,070 |
| Median Property Value | $266,600 | $286,600 |
| Median Household Income | $89,535 | $973 |
| Monthly Housing Costs | $868 | $441 |
| Real Estate Taxes | $4,650 | $83 |
Property Value by Mortgage Status in Red Oak
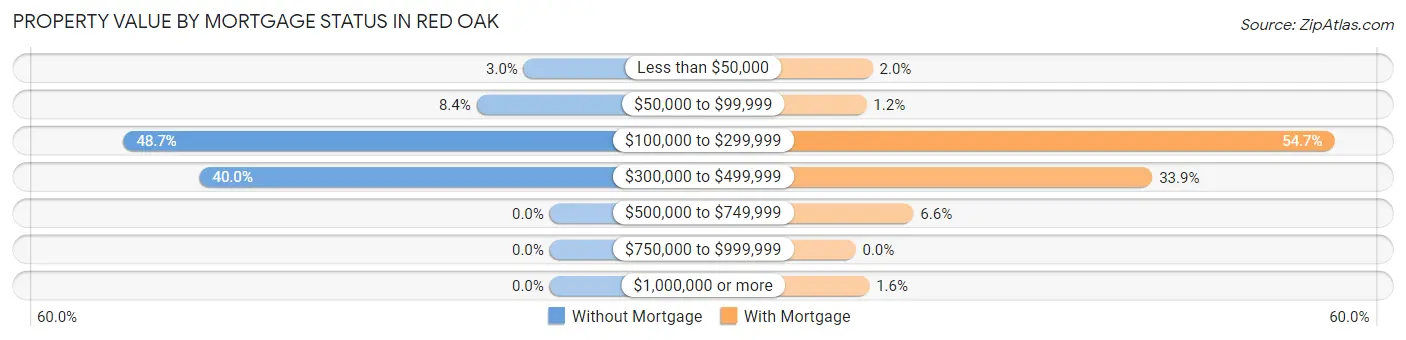
| Property Value | Without Mortgage | With Mortgage |
| Less than $50,000 | 17 (3.0%) | 60 (1.9%) |
| $50,000 to $99,999 | 48 (8.4%) | 38 (1.2%) |
| $100,000 to $299,999 | 280 (48.7%) | 1,680 (54.7%) |
| $300,000 to $499,999 | 230 (40.0%) | 1,041 (33.9%) |
| $500,000 to $749,999 | 0 (0.0%) | 203 (6.6%) |
| $750,000 to $999,999 | 0 (0.0%) | 0 (0.0%) |
| $1,000,000 or more | 0 (0.0%) | 48 (1.6%) |
| Total | 575 (100.0%) | 3,070 (100.0%) |
Household Income by Mortgage Status in Red Oak
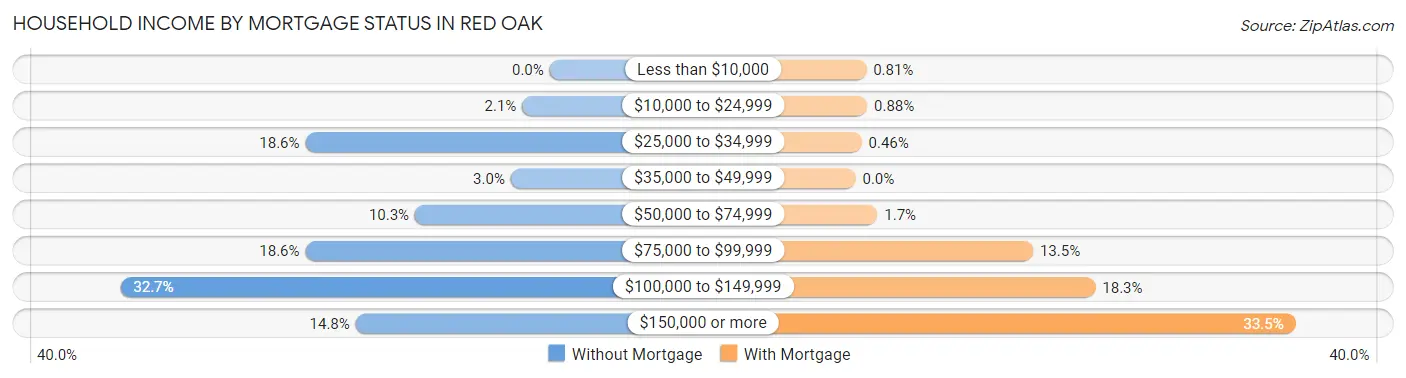
| Household Income | Without Mortgage | With Mortgage |
| Less than $10,000 | 0 (0.0%) | 25 (0.8%) |
| $10,000 to $24,999 | 12 (2.1%) | 27 (0.9%) |
| $25,000 to $34,999 | 107 (18.6%) | 14 (0.5%) |
| $35,000 to $49,999 | 17 (3.0%) | 0 (0.0%) |
| $50,000 to $74,999 | 59 (10.3%) | 51 (1.7%) |
| $75,000 to $99,999 | 107 (18.6%) | 415 (13.5%) |
| $100,000 to $149,999 | 188 (32.7%) | 561 (18.3%) |
| $150,000 or more | 85 (14.8%) | 1,029 (33.5%) |
| Total | 575 (100.0%) | 3,070 (100.0%) |
Property Value to Household Income Ratio in Red Oak
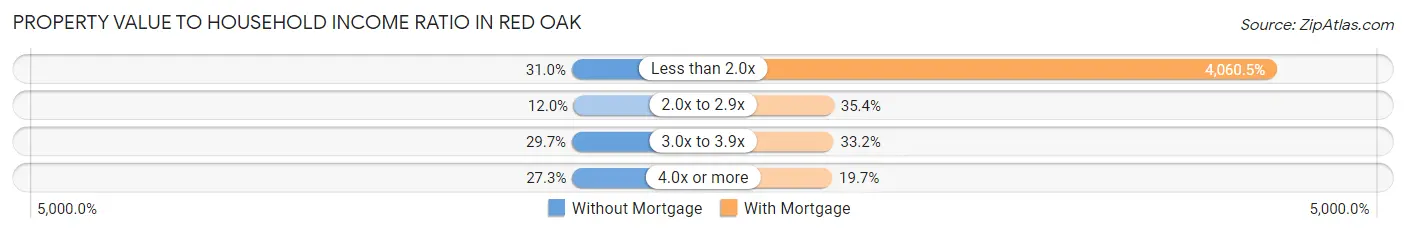
| Value-to-Income Ratio | Without Mortgage | With Mortgage |
| Less than 2.0x | 178 (31.0%) | 124,658 (4,060.5%) |
| 2.0x to 2.9x | 69 (12.0%) | 1,088 (35.4%) |
| 3.0x to 3.9x | 171 (29.7%) | 1,020 (33.2%) |
| 4.0x or more | 157 (27.3%) | 606 (19.7%) |
| Total | 575 (100.0%) | 3,070 (100.0%) |
Real Estate Taxes by Mortgage Status in Red Oak
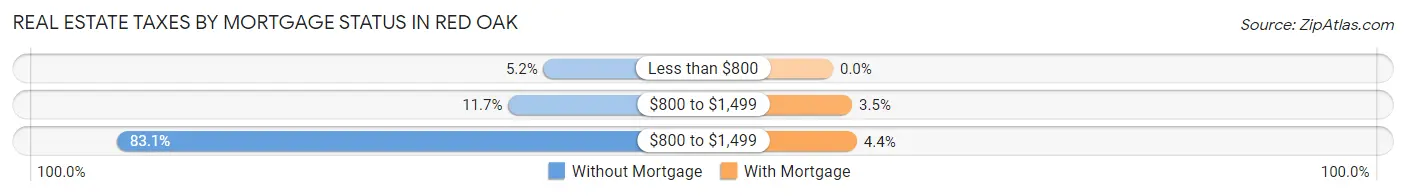
| Property Taxes | Without Mortgage | With Mortgage |
| Less than $800 | 30 (5.2%) | 0 (0.0%) |
| $800 to $1,499 | 67 (11.7%) | 107 (3.5%) |
| $800 to $1,499 | 478 (83.1%) | 134 (4.4%) |
| Total | 575 (100.0%) | 3,070 (100.0%) |
Health & Disability in Red Oak
Health Insurance Coverage by Age in Red Oak
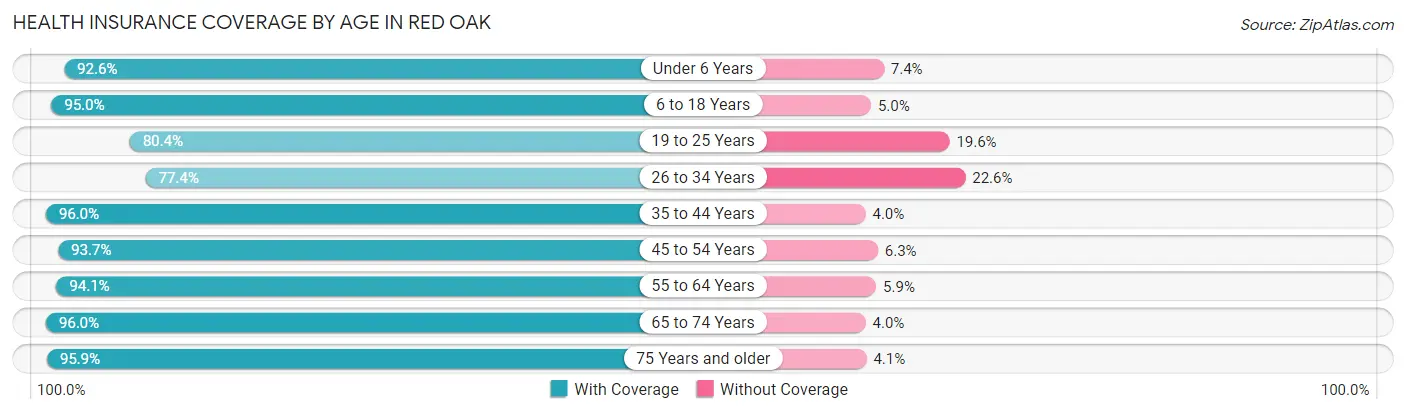
| Age Bracket | With Coverage | Without Coverage |
| Under 6 Years | 1,155 (92.6%) | 92 (7.4%) |
| 6 to 18 Years | 2,998 (95.0%) | 157 (5.0%) |
| 19 to 25 Years | 832 (80.4%) | 203 (19.6%) |
| 26 to 34 Years | 1,239 (77.4%) | 361 (22.6%) |
| 35 to 44 Years | 2,402 (96.0%) | 99 (4.0%) |
| 45 to 54 Years | 2,427 (93.7%) | 162 (6.3%) |
| 55 to 64 Years | 1,298 (94.1%) | 82 (5.9%) |
| 65 to 74 Years | 726 (96.0%) | 30 (4.0%) |
| 75 Years and older | 417 (95.9%) | 18 (4.1%) |
| Total | 13,494 (91.8%) | 1,204 (8.2%) |
Health Insurance Coverage by Citizenship Status in Red Oak
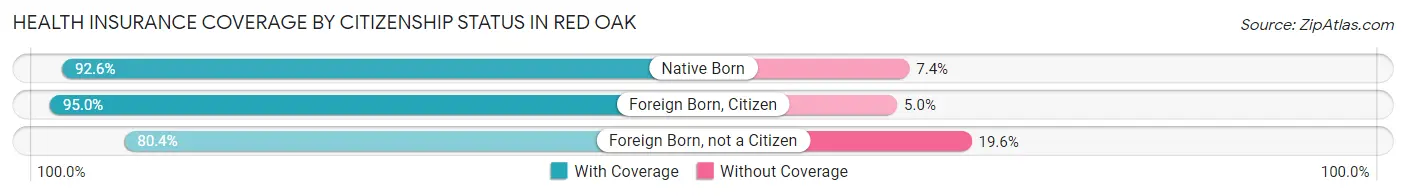
| Citizenship Status | With Coverage | Without Coverage |
| Native Born | 1,155 (92.6%) | 92 (7.4%) |
| Foreign Born, Citizen | 2,998 (95.0%) | 157 (5.0%) |
| Foreign Born, not a Citizen | 832 (80.4%) | 203 (19.6%) |
Health Insurance Coverage by Household Income in Red Oak
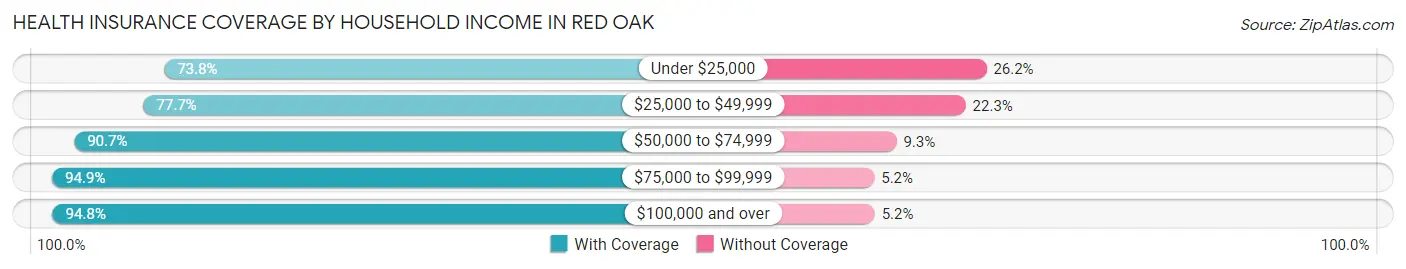
| Household Income | With Coverage | Without Coverage |
| Under $25,000 | 621 (73.8%) | 220 (26.2%) |
| $25,000 to $49,999 | 834 (77.7%) | 239 (22.3%) |
| $50,000 to $74,999 | 1,736 (90.7%) | 178 (9.3%) |
| $75,000 to $99,999 | 2,339 (94.9%) | 127 (5.1%) |
| $100,000 and over | 7,955 (94.8%) | 440 (5.2%) |
Public vs Private Health Insurance Coverage by Age in Red Oak
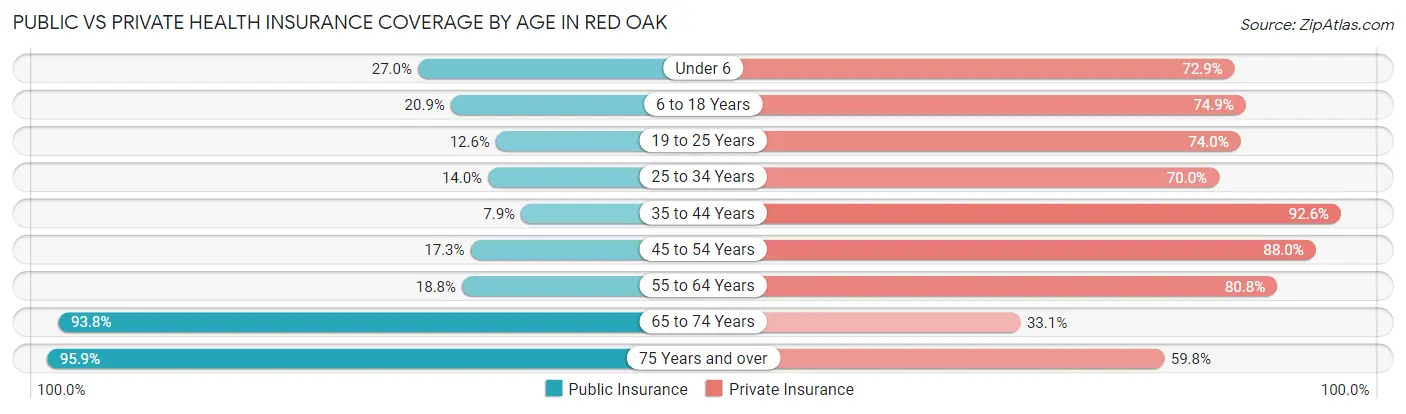
| Age Bracket | Public Insurance | Private Insurance |
| Under 6 | 337 (27.0%) | 909 (72.9%) |
| 6 to 18 Years | 660 (20.9%) | 2,364 (74.9%) |
| 19 to 25 Years | 130 (12.6%) | 766 (74.0%) |
| 25 to 34 Years | 224 (14.0%) | 1,120 (70.0%) |
| 35 to 44 Years | 197 (7.9%) | 2,317 (92.6%) |
| 45 to 54 Years | 447 (17.3%) | 2,277 (87.9%) |
| 55 to 64 Years | 260 (18.8%) | 1,115 (80.8%) |
| 65 to 74 Years | 709 (93.8%) | 250 (33.1%) |
| 75 Years and over | 417 (95.9%) | 260 (59.8%) |
| Total | 3,381 (23.0%) | 11,378 (77.4%) |
Disability Status by Sex by Age in Red Oak
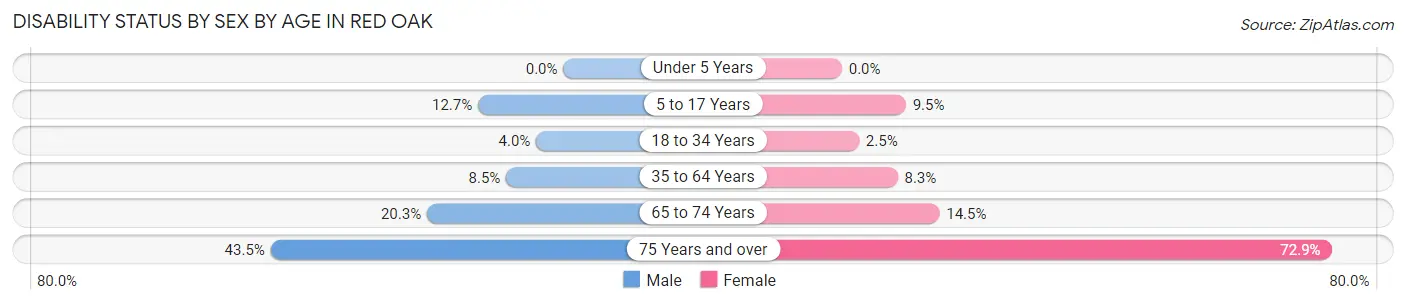
| Age Bracket | Male | Female |
| Under 5 Years | 0 (0.0%) | 0 (0.0%) |
| 5 to 17 Years | 221 (12.7%) | 152 (9.5%) |
| 18 to 34 Years | 52 (4.0%) | 39 (2.5%) |
| 35 to 64 Years | 291 (8.5%) | 252 (8.3%) |
| 65 to 74 Years | 65 (20.3%) | 63 (14.5%) |
| 75 Years and over | 93 (43.5%) | 161 (72.9%) |
Disability Class by Sex by Age in Red Oak
Disability Class: Hearing Difficulty
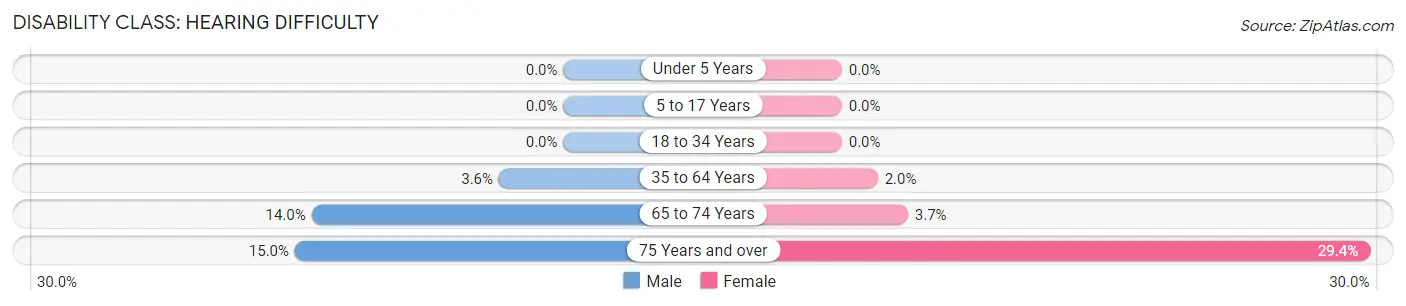
| Age Bracket | Male | Female |
| Under 5 Years | 0 (0.0%) | 0 (0.0%) |
| 5 to 17 Years | 0 (0.0%) | 0 (0.0%) |
| 18 to 34 Years | 0 (0.0%) | 0 (0.0%) |
| 35 to 64 Years | 123 (3.6%) | 61 (2.0%) |
| 65 to 74 Years | 45 (14.0%) | 16 (3.7%) |
| 75 Years and over | 32 (14.9%) | 65 (29.4%) |
Disability Class: Vision Difficulty
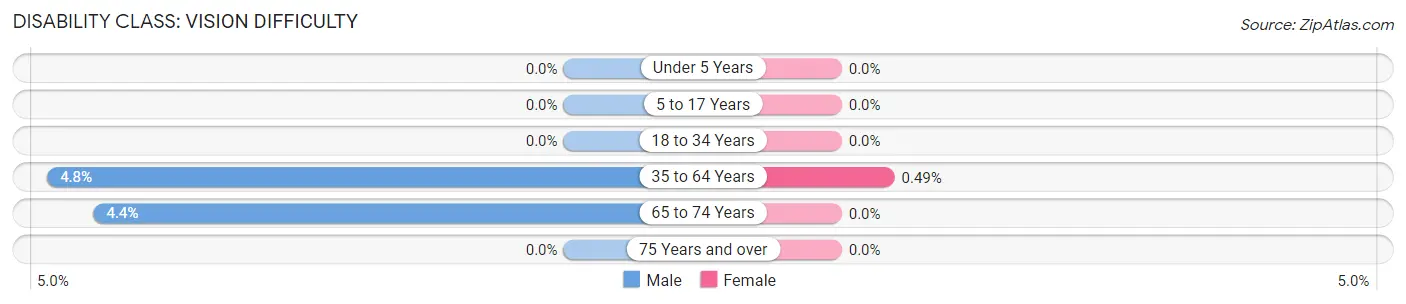
| Age Bracket | Male | Female |
| Under 5 Years | 0 (0.0%) | 0 (0.0%) |
| 5 to 17 Years | 0 (0.0%) | 0 (0.0%) |
| 18 to 34 Years | 0 (0.0%) | 0 (0.0%) |
| 35 to 64 Years | 164 (4.8%) | 15 (0.5%) |
| 65 to 74 Years | 14 (4.4%) | 0 (0.0%) |
| 75 Years and over | 0 (0.0%) | 0 (0.0%) |
Disability Class: Cognitive Difficulty
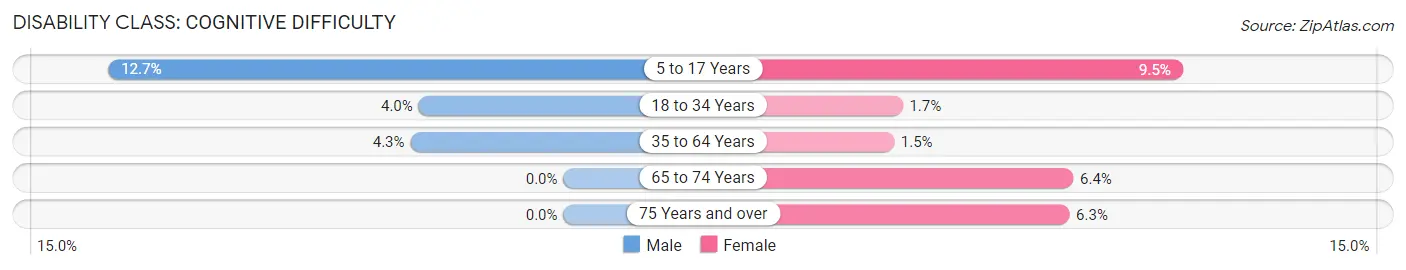
| Age Bracket | Male | Female |
| 5 to 17 Years | 221 (12.7%) | 152 (9.5%) |
| 18 to 34 Years | 52 (4.0%) | 26 (1.7%) |
| 35 to 64 Years | 146 (4.3%) | 44 (1.5%) |
| 65 to 74 Years | 0 (0.0%) | 28 (6.4%) |
| 75 Years and over | 0 (0.0%) | 14 (6.3%) |
Disability Class: Ambulatory Difficulty
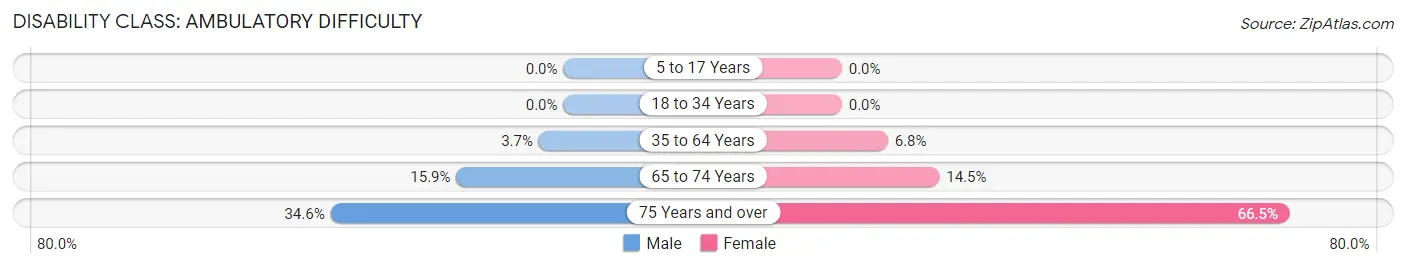
| Age Bracket | Male | Female |
| 5 to 17 Years | 0 (0.0%) | 0 (0.0%) |
| 18 to 34 Years | 0 (0.0%) | 0 (0.0%) |
| 35 to 64 Years | 125 (3.6%) | 208 (6.8%) |
| 65 to 74 Years | 51 (15.9%) | 63 (14.5%) |
| 75 Years and over | 74 (34.6%) | 147 (66.5%) |
Disability Class: Self-Care Difficulty
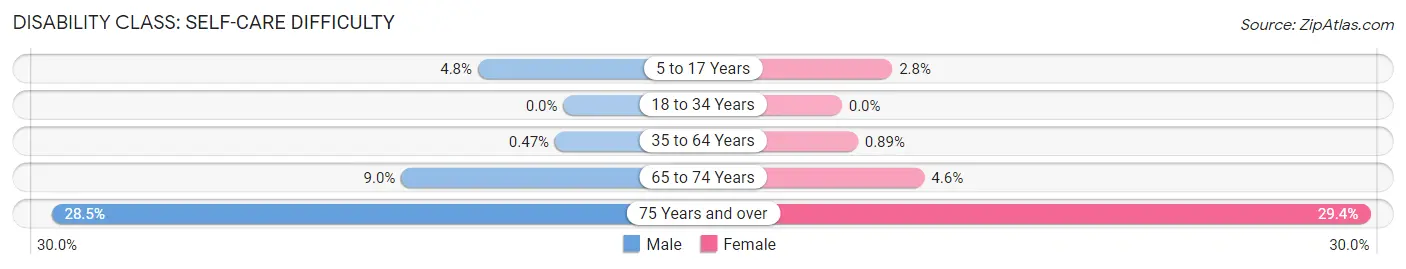
| Age Bracket | Male | Female |
| 5 to 17 Years | 83 (4.8%) | 45 (2.8%) |
| 18 to 34 Years | 0 (0.0%) | 0 (0.0%) |
| 35 to 64 Years | 16 (0.5%) | 27 (0.9%) |
| 65 to 74 Years | 29 (9.0%) | 20 (4.6%) |
| 75 Years and over | 61 (28.5%) | 65 (29.4%) |
Technology Access in Red Oak
Computing Device Access in Red Oak
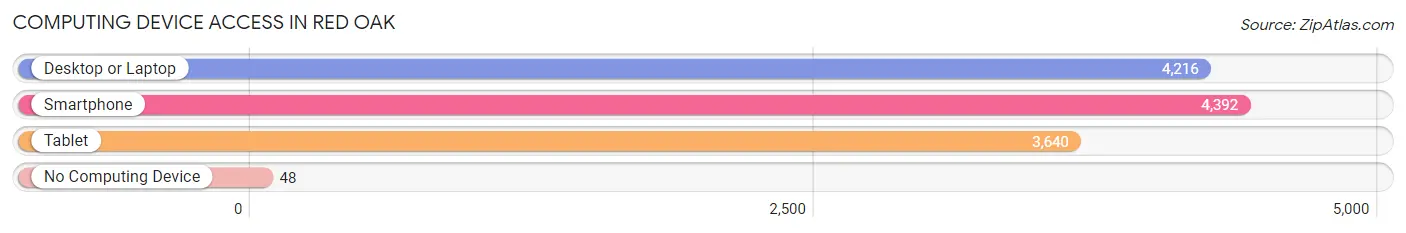
| Device Type | # Households | % Households |
| Desktop or Laptop | 4,216 | 90.6% |
| Smartphone | 4,392 | 94.4% |
| Tablet | 3,640 | 78.2% |
| No Computing Device | 48 | 1.0% |
| Total | 4,655 | 100.0% |
Internet Access in Red Oak
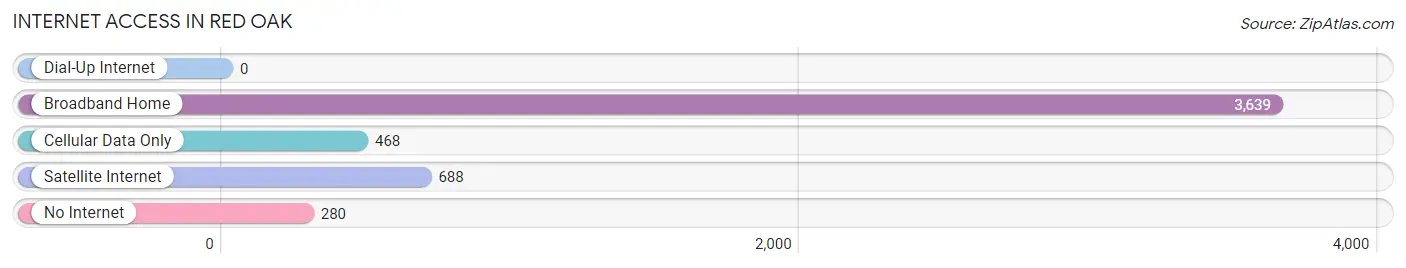
| Internet Type | # Households | % Households |
| Dial-Up Internet | 0 | 0.0% |
| Broadband Home | 3,639 | 78.2% |
| Cellular Data Only | 468 | 10.1% |
| Satellite Internet | 688 | 14.8% |
| No Internet | 280 | 6.0% |
| Total | 4,655 | 100.0% |
Red Oak Summary
Red Oak, Texas is a small city located in Ellis County, Texas, United States. It is situated about 20 miles south of Dallas and is part of the Dallas-Fort Worth metropolitan area. The city has a population of about 11,000 people and is known for its small-town charm and friendly atmosphere.
History
Red Oak was founded in 1873 by a group of settlers from Kentucky and Tennessee. The town was named after the red oak trees that grew in the area. The first post office was established in 1876 and the town was incorporated in 1883.
The town grew slowly but steadily over the years, and by the early 1900s, it had become a thriving agricultural center. Cotton, corn, and other crops were grown in the area, and the town was home to several businesses, including a cotton gin, a grist mill, and a blacksmith shop.
In the 1920s, the town began to experience a period of growth and development. The population increased, and new businesses opened, including a bank, a movie theater, and a hotel. The town also became a popular destination for tourists, who came to enjoy the area’s natural beauty and outdoor activities.
Geography
Red Oak is located in Ellis County, Texas, about 20 miles south of Dallas. The city is situated on the banks of the Trinity River and is surrounded by rolling hills and wooded areas. The climate is generally mild, with hot summers and cool winters.
Economy
Red Oak’s economy is largely based on agriculture and tourism. The city is home to several farms, which produce cotton, corn, and other crops. The city is also a popular destination for tourists, who come to enjoy the area’s natural beauty and outdoor activities.
In addition to agriculture and tourism, Red Oak is home to several businesses, including a bank, a movie theater, and a hotel. The city is also home to several manufacturing companies, which produce a variety of products, including furniture, clothing, and electronics.
Demographics
As of the 2010 census, Red Oak had a population of 11,000 people. The racial makeup of the city was 79.3% White, 14.2% African American, 0.7% Native American, 0.7% Asian, and 4.1% from other races. The median household income was $45,000, and the median age was 36.
Red Oak is a small city with a friendly atmosphere and a strong sense of community. The city is home to several businesses, farms, and tourist attractions, and it is a popular destination for visitors who come to enjoy the area’s natural beauty and outdoor activities.
Common Questions
What is Per Capita Income in Red Oak?
Per Capita income in Red Oak is $37,415.
What is the Median Family Income in Red Oak?
Median Family Income in Red Oak is $108,254.
What is the Median Household income in Red Oak?
Median Household Income in Red Oak is $105,309.
What is Income or Wage Gap in Red Oak?
Income or Wage Gap in Red Oak is 23.1%.
Women in Red Oak earn 76.9 cents for every dollar earned by a man.
What is Inequality or Gini Index in Red Oak?
Inequality or Gini Index in Red Oak is 0.36.
What is the Total Population of Red Oak?
Total Population of Red Oak is 14,853.
What is the Total Male Population of Red Oak?
Total Male Population of Red Oak is 7,603.
What is the Total Female Population of Red Oak?
Total Female Population of Red Oak is 7,250.
What is the Ratio of Males per 100 Females in Red Oak?
There are 104.87 Males per 100 Females in Red Oak.
What is the Ratio of Females per 100 Males in Red Oak?
There are 95.36 Females per 100 Males in Red Oak.
What is the Median Population Age in Red Oak?
Median Population Age in Red Oak is 36.2 Years.
What is the Average Family Size in Red Oak
Average Family Size in Red Oak is 3.5 People.
What is the Average Household Size in Red Oak
Average Household Size in Red Oak is 3.2 People.
How Large is the Labor Force in Red Oak?
There are 8,271 People in the Labor Forcein in Red Oak.
What is the Percentage of People in the Labor Force in Red Oak?
73.4% of People are in the Labor Force in Red Oak.
What is the Unemployment Rate in Red Oak?
Unemployment Rate in Red Oak is 2.9%.