Columbus, TX Map & Demographics
Columbus Map
Columbus Overview
$48,210
PER CAPITA INCOME
$71,652
AVG FAMILY INCOME
$56,250
AVG HOUSEHOLD INCOME
1.1%
WAGE / INCOME GAP [ % ]
98.9¢/ $1
WAGE / INCOME GAP [ $ ]
0.55
INEQUALITY / GINI INDEX
3,686
TOTAL POPULATION
1,936
MALE POPULATION
1,750
FEMALE POPULATION
110.63
MALES / 100 FEMALES
90.39
FEMALES / 100 MALES
47.0
MEDIAN AGE
3.1
AVG FAMILY SIZE
2.4
AVG HOUSEHOLD SIZE
1,628
LABOR FORCE [ PEOPLE ]
51.7%
PERCENT IN LABOR FORCE
3.3%
UNEMPLOYMENT RATE
Columbus Zip Codes
Columbus Area Codes
Income in Columbus
Income Overview in Columbus
Per Capita Income in Columbus is $48,210, while median incomes of families and households are $71,652 and $56,250 respectively.
| Characteristic | Number | Measure |
| Per Capita Income | 3,686 | $48,210 |
| Median Family Income | 774 | $71,652 |
| Mean Family Income | 774 | $139,988 |
| Median Household Income | 1,443 | $56,250 |
| Mean Household Income | 1,443 | $102,144 |
| Income Deficit | 774 | $0 |
| Wage / Income Gap (%) | 3,686 | 1.11% |
| Wage / Income Gap ($) | 3,686 | 98.89¢ per $1 |
| Gini / Inequality Index | 3,686 | 0.55 |
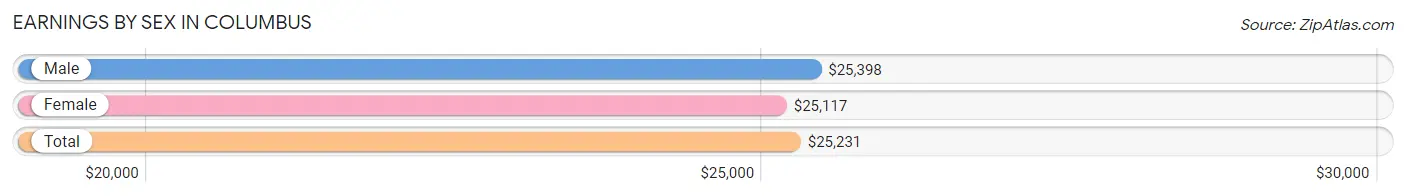
Earnings by Sex in Columbus
Average Earnings in Columbus are $25,231, $25,398 for men and $25,117 for women, a difference of 1.1%.
| Sex | Number | Average Earnings |
| Male | 1,025 (58.0%) | $25,398 |
| Female | 741 (42.0%) | $25,117 |
| Total | 1,766 (100.0%) | $25,231 |
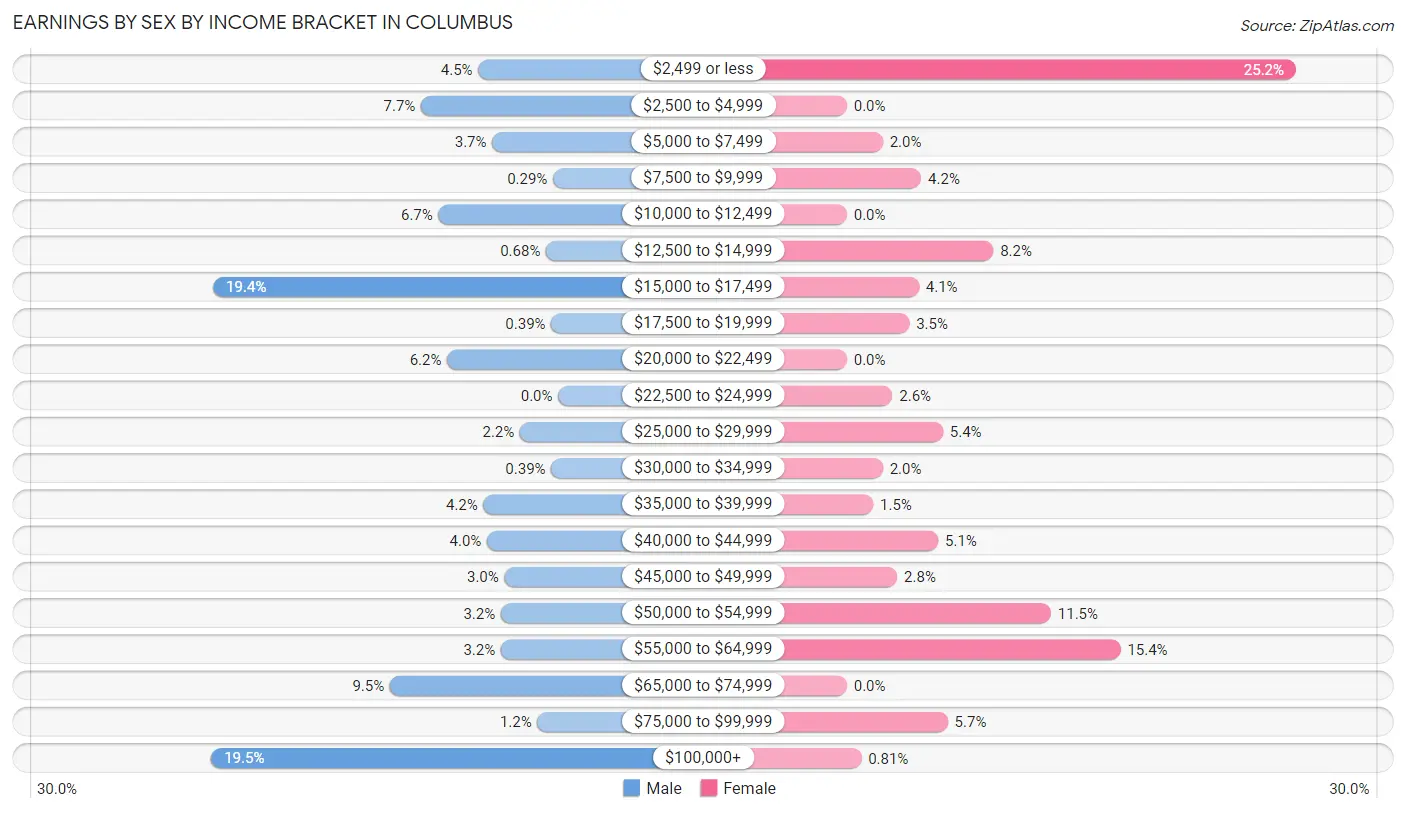
Earnings by Sex by Income Bracket in Columbus
The most common earnings brackets in Columbus are $100,000+ for men (200 | 19.5%) and $2,499 or less for women (187 | 25.2%).
| Income | Male | Female |
| $2,499 or less | 46 (4.5%) | 187 (25.2%) |
| $2,500 to $4,999 | 79 (7.7%) | 0 (0.0%) |
| $5,000 to $7,499 | 38 (3.7%) | 15 (2.0%) |
| $7,500 to $9,999 | 3 (0.3%) | 31 (4.2%) |
| $10,000 to $12,499 | 69 (6.7%) | 0 (0.0%) |
| $12,500 to $14,999 | 7 (0.7%) | 61 (8.2%) |
| $15,000 to $17,499 | 199 (19.4%) | 30 (4.1%) |
| $17,500 to $19,999 | 4 (0.4%) | 26 (3.5%) |
| $20,000 to $22,499 | 64 (6.2%) | 0 (0.0%) |
| $22,500 to $24,999 | 0 (0.0%) | 19 (2.6%) |
| $25,000 to $29,999 | 22 (2.1%) | 40 (5.4%) |
| $30,000 to $34,999 | 4 (0.4%) | 15 (2.0%) |
| $35,000 to $39,999 | 43 (4.2%) | 11 (1.5%) |
| $40,000 to $44,999 | 41 (4.0%) | 38 (5.1%) |
| $45,000 to $49,999 | 31 (3.0%) | 21 (2.8%) |
| $50,000 to $54,999 | 33 (3.2%) | 85 (11.5%) |
| $55,000 to $64,999 | 33 (3.2%) | 114 (15.4%) |
| $65,000 to $74,999 | 97 (9.5%) | 0 (0.0%) |
| $75,000 to $99,999 | 12 (1.2%) | 42 (5.7%) |
| $100,000+ | 200 (19.5%) | 6 (0.8%) |
| Total | 1,025 (100.0%) | 741 (100.0%) |
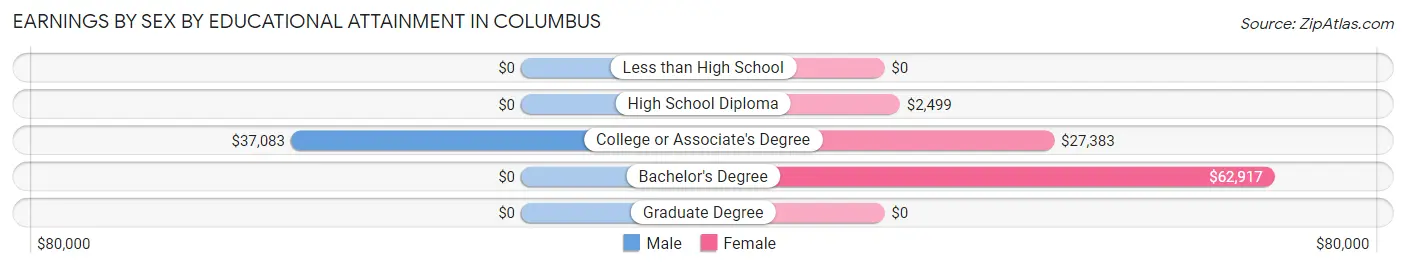
Earnings by Sex by Educational Attainment in Columbus
Average earnings in Columbus are $36,977 for men and $30,167 for women, a difference of 18.4%. Men with an educational attainment of college or associate's degree enjoy the highest average annual earnings of $37,083, while those with college or associate's degree education earn the least with $37,083. Women with an educational attainment of bachelor's degree earn the most with the average annual earnings of $62,917, while those with high school diploma education have the smallest earnings of $2,499.
| Educational Attainment | Male Income | Female Income |
| Less than High School | - | - |
| High School Diploma | - | - |
| College or Associate's Degree | $37,083 | $27,383 |
| Bachelor's Degree | - | - |
| Graduate Degree | - | - |
| Total | $36,977 | $30,167 |
Family Income in Columbus
Family Income Brackets in Columbus
According to the Columbus family income data, there are 193 families falling into the $35,000 to $49,999 income range, which is the most common income bracket and makes up 24.9% of all families.
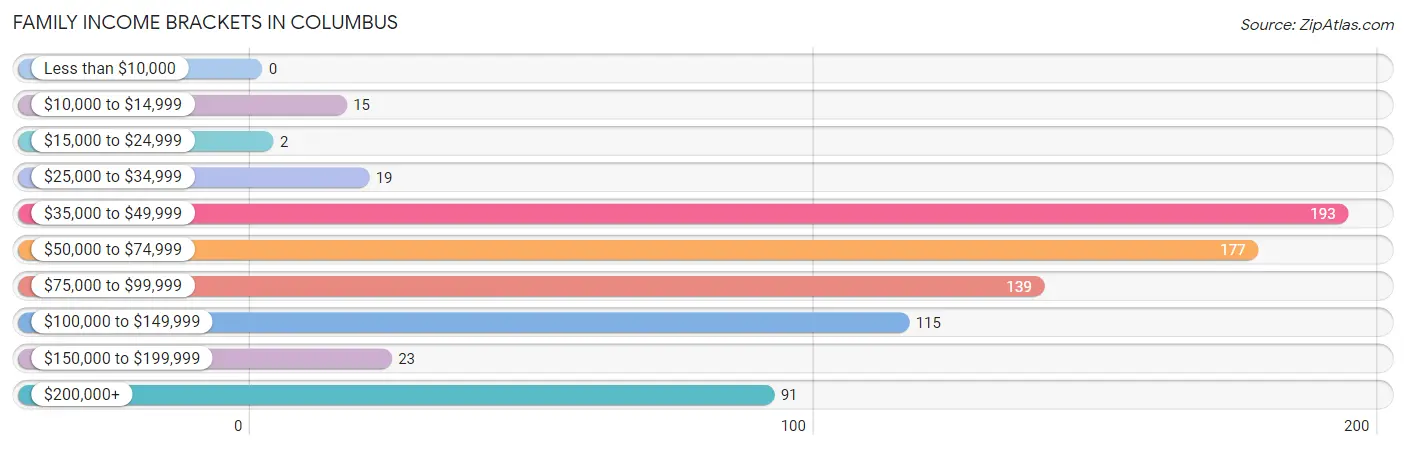
| Income Bracket | # Families | % Families |
| Less than $10,000 | 0 | 0.0% |
| $10,000 to $14,999 | 15 | 1.9% |
| $15,000 to $24,999 | 2 | 0.3% |
| $25,000 to $34,999 | 19 | 2.5% |
| $35,000 to $49,999 | 193 | 24.9% |
| $50,000 to $74,999 | 177 | 22.9% |
| $75,000 to $99,999 | 139 | 18.0% |
| $100,000 to $149,999 | 115 | 14.9% |
| $150,000 to $199,999 | 23 | 3.0% |
| $200,000+ | 91 | 11.8% |
Family Income by Famaliy Size in Columbus
3-person families (194 | 25.1%) account for the highest median family income in Columbus with $90,882 per family, while 3-person families (194 | 25.1%) have the highest median income of $30,294 per family member.
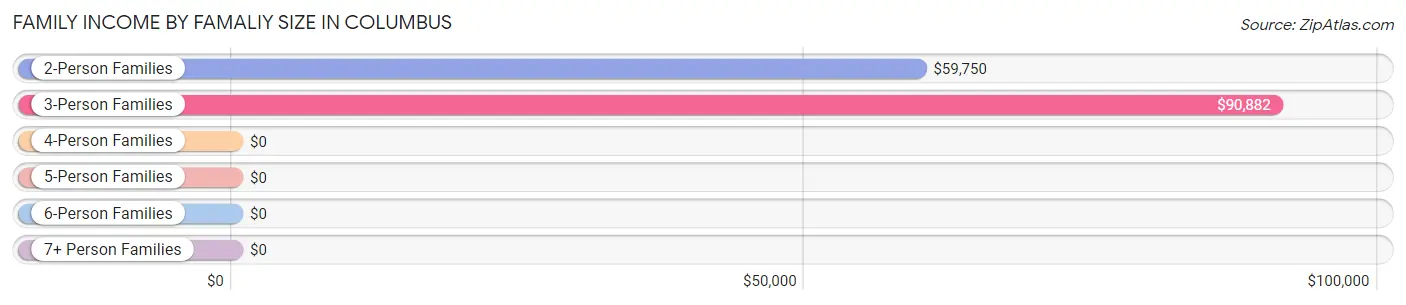
| Income Bracket | # Families | Median Income |
| 2-Person Families | 440 (56.9%) | $59,750 |
| 3-Person Families | 194 (25.1%) | $90,882 |
| 4-Person Families | 85 (11.0%) | $0 |
| 5-Person Families | 37 (4.8%) | $0 |
| 6-Person Families | 12 (1.5%) | $0 |
| 7+ Person Families | 6 (0.8%) | $0 |
| Total | 774 (100.0%) | $71,652 |
Family Income by Number of Earners in Columbus
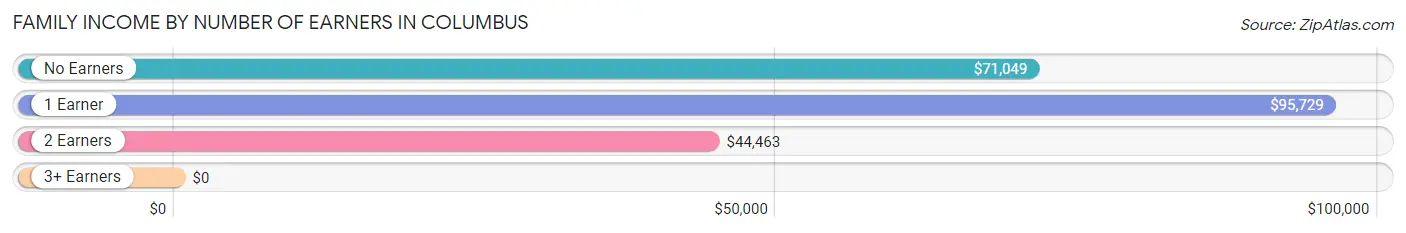
| Number of Earners | # Families | Median Income |
| No Earners | 141 (18.2%) | $71,049 |
| 1 Earner | 275 (35.5%) | $95,729 |
| 2 Earners | 311 (40.2%) | $44,463 |
| 3+ Earners | 47 (6.1%) | $0 |
| Total | 774 (100.0%) | $71,652 |
Household Income in Columbus
Household Income Brackets in Columbus
With 382 households falling in the category, the $50,000 to $74,999 income range is the most frequent in Columbus, accounting for 26.5% of all households. In contrast, only 22 households (1.5%) fall into the less than $10,000 income bracket, making it the least populous group.
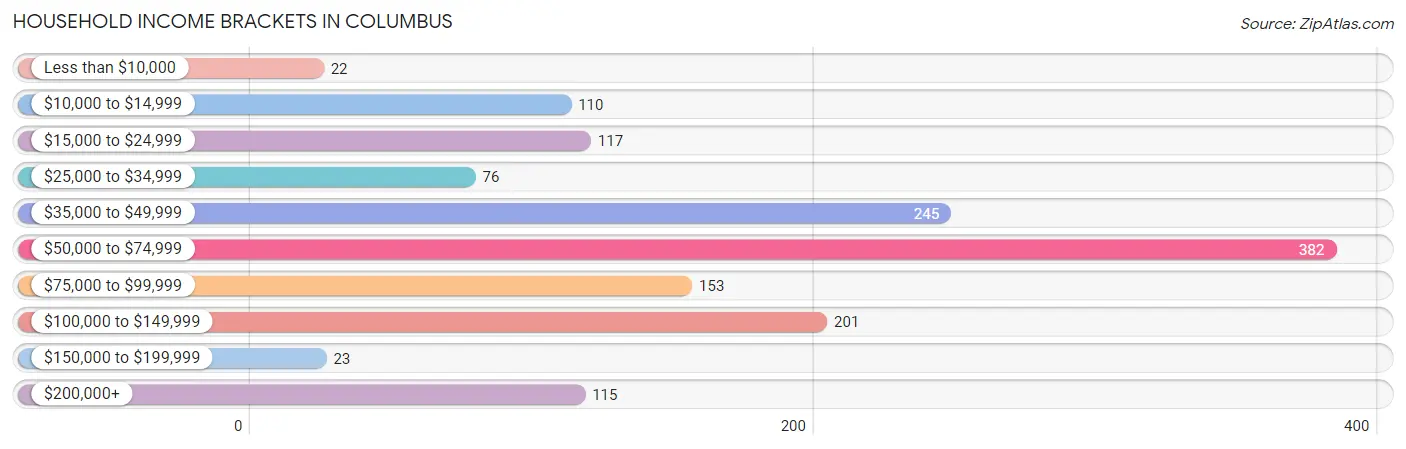
| Income Bracket | # Households | % Households |
| Less than $10,000 | 22 | 1.5% |
| $10,000 to $14,999 | 110 | 7.6% |
| $15,000 to $24,999 | 117 | 8.1% |
| $25,000 to $34,999 | 76 | 5.3% |
| $35,000 to $49,999 | 245 | 17.0% |
| $50,000 to $74,999 | 382 | 26.5% |
| $75,000 to $99,999 | 153 | 10.6% |
| $100,000 to $149,999 | 201 | 13.9% |
| $150,000 to $199,999 | 23 | 1.6% |
| $200,000+ | 115 | 8.0% |
Household Income by Householder Age in Columbus
The median household income in Columbus is $56,250, with the highest median household income of $86,406 found in the 25 to 44 years age bracket for the primary householder. A total of 317 households (22.0%) fall into this category. Meanwhile, the 15 to 24 years age bracket for the primary householder has the lowest median household income of $0, with 30 households (2.1%) in this group.
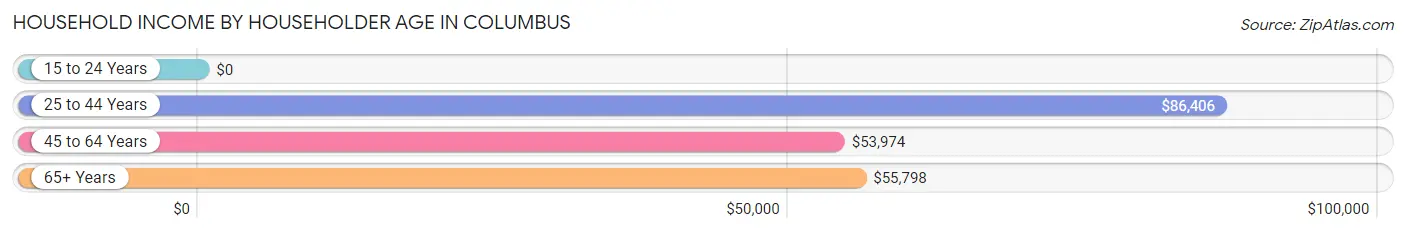
| Income Bracket | # Households | Median Income |
| 15 to 24 Years | 30 (2.1%) | $0 |
| 25 to 44 Years | 317 (22.0%) | $86,406 |
| 45 to 64 Years | 452 (31.3%) | $53,974 |
| 65+ Years | 644 (44.6%) | $55,798 |
| Total | 1,443 (100.0%) | $56,250 |
Poverty in Columbus
Income Below Poverty by Sex and Age in Columbus
With 11.6% poverty level for males and 11.5% for females among the residents of Columbus, 16 and 17 year old males and 18 to 24 year old females are the most vulnerable to poverty, with 95 males (100.0%) and 107 females (48.9%) in their respective age groups living below the poverty level.
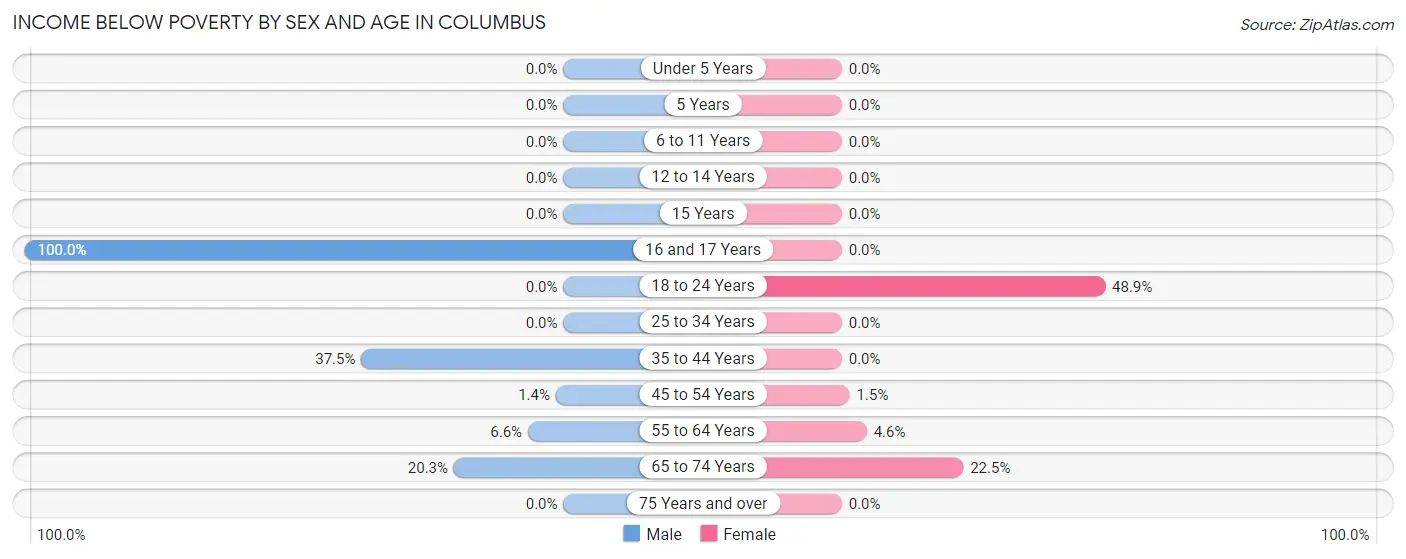
| Age Bracket | Male | Female |
| Under 5 Years | 0 (0.0%) | 0 (0.0%) |
| 5 Years | 0 (0.0%) | 0 (0.0%) |
| 6 to 11 Years | 0 (0.0%) | 0 (0.0%) |
| 12 to 14 Years | 0 (0.0%) | 0 (0.0%) |
| 15 Years | 0 (0.0%) | 0 (0.0%) |
| 16 and 17 Years | 95 (100.0%) | 0 (0.0%) |
| 18 to 24 Years | 0 (0.0%) | 107 (48.9%) |
| 25 to 34 Years | 0 (0.0%) | 0 (0.0%) |
| 35 to 44 Years | 45 (37.5%) | 0 (0.0%) |
| 45 to 54 Years | 3 (1.4%) | 2 (1.5%) |
| 55 to 64 Years | 13 (6.6%) | 15 (4.6%) |
| 65 to 74 Years | 51 (20.3%) | 64 (22.5%) |
| 75 Years and over | 0 (0.0%) | 0 (0.0%) |
| Total | 207 (11.6%) | 188 (11.5%) |
Income Above Poverty by Sex and Age in Columbus
According to the poverty statistics in Columbus, males aged under 5 years and females aged under 5 years are the age groups that are most secure financially, with 100.0% of males and 100.0% of females in these age groups living above the poverty line.
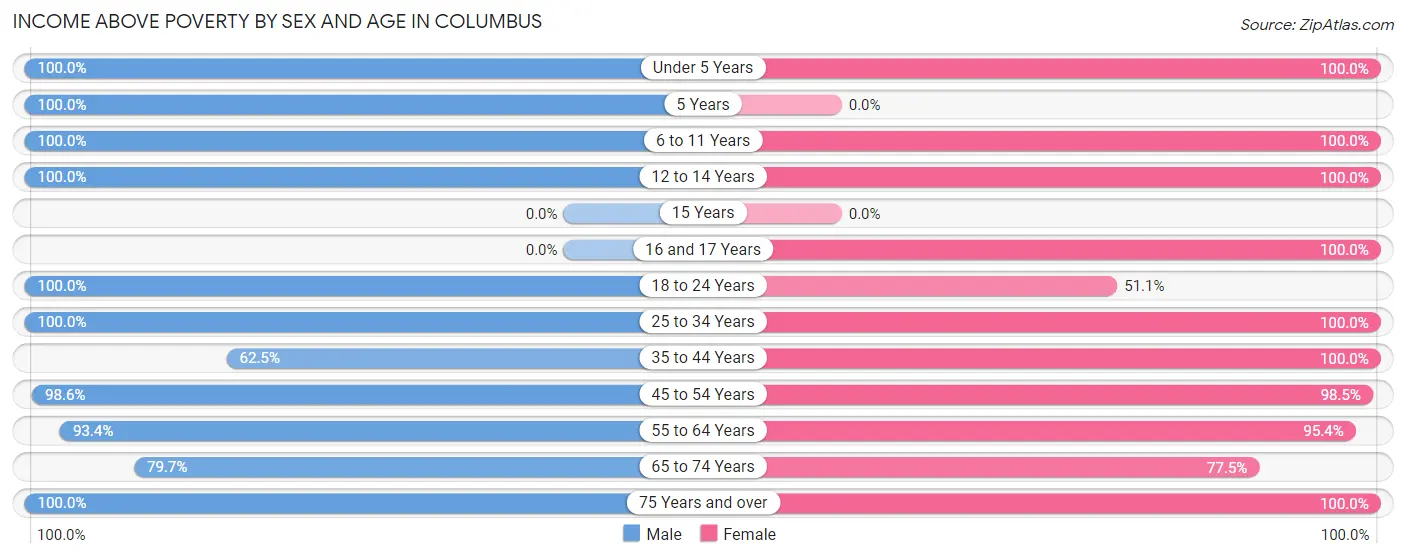
| Age Bracket | Male | Female |
| Under 5 Years | 85 (100.0%) | 144 (100.0%) |
| 5 Years | 13 (100.0%) | 0 (0.0%) |
| 6 to 11 Years | 223 (100.0%) | 31 (100.0%) |
| 12 to 14 Years | 7 (100.0%) | 34 (100.0%) |
| 15 Years | 0 (0.0%) | 0 (0.0%) |
| 16 and 17 Years | 0 (0.0%) | 16 (100.0%) |
| 18 to 24 Years | 203 (100.0%) | 112 (51.1%) |
| 25 to 34 Years | 257 (100.0%) | 141 (100.0%) |
| 35 to 44 Years | 75 (62.5%) | 56 (100.0%) |
| 45 to 54 Years | 210 (98.6%) | 135 (98.5%) |
| 55 to 64 Years | 185 (93.4%) | 309 (95.4%) |
| 65 to 74 Years | 200 (79.7%) | 220 (77.5%) |
| 75 Years and over | 123 (100.0%) | 253 (100.0%) |
| Total | 1,581 (88.4%) | 1,451 (88.5%) |
Income Below Poverty Among Married-Couple Families in Columbus
The poverty statistics for married-couple families in Columbus show that 2.1% or 15 of the total 705 families live below the poverty line. Families with no children have the highest poverty rate of 3.0%, comprising of 15 families. On the other hand, families with 1 or 2 children have the lowest poverty rate of 0.0%, which includes 0 families.
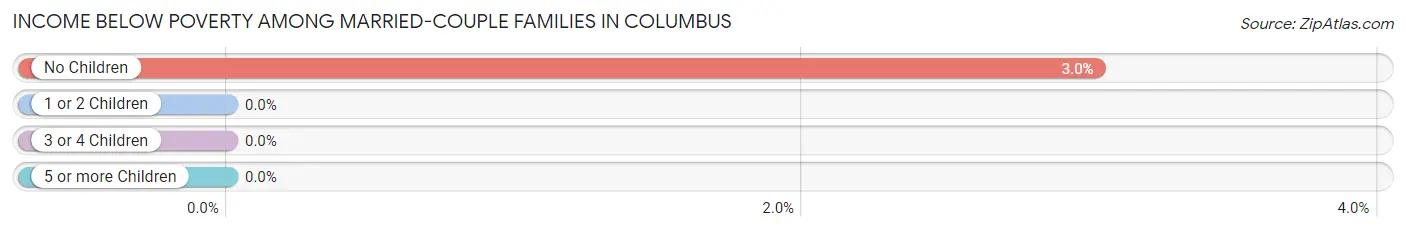
| Children | Above Poverty | Below Poverty |
| No Children | 481 (97.0%) | 15 (3.0%) |
| 1 or 2 Children | 185 (100.0%) | 0 (0.0%) |
| 3 or 4 Children | 18 (100.0%) | 0 (0.0%) |
| 5 or more Children | 6 (100.0%) | 0 (0.0%) |
| Total | 690 (97.9%) | 15 (2.1%) |
Income Below Poverty Among Single-Parent Households in Columbus
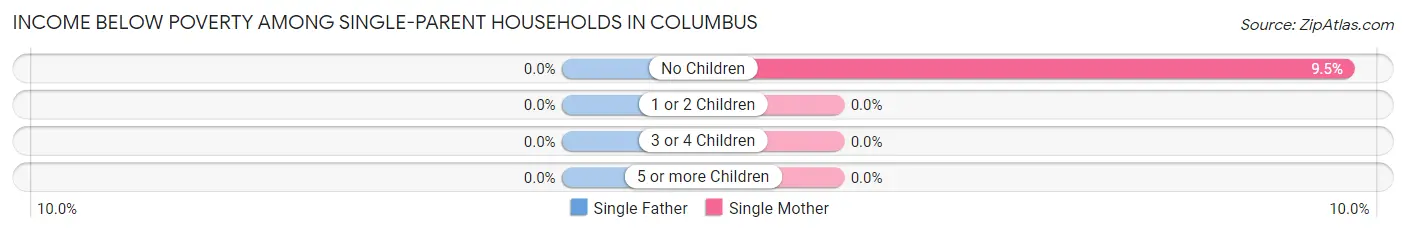
| Children | Single Father | Single Mother |
| No Children | 0 (0.0%) | 2 (9.5%) |
| 1 or 2 Children | 0 (0.0%) | 0 (0.0%) |
| 3 or 4 Children | 0 (0.0%) | 0 (0.0%) |
| 5 or more Children | 0 (0.0%) | 0 (0.0%) |
| Total | 0 (0.0%) | 2 (7.4%) |
Income Below Poverty Among Married-Couple vs Single-Parent Households in Columbus
The poverty data for Columbus shows that 15 of the married-couple family households (2.1%) and 2 of the single-parent households (2.9%) are living below the poverty level. Within the married-couple family households, those with no children have the highest poverty rate, with 15 households (3.0%) falling below the poverty line. Among the single-parent households, those with no children have the highest poverty rate, with 2 household (8.3%) living below poverty.
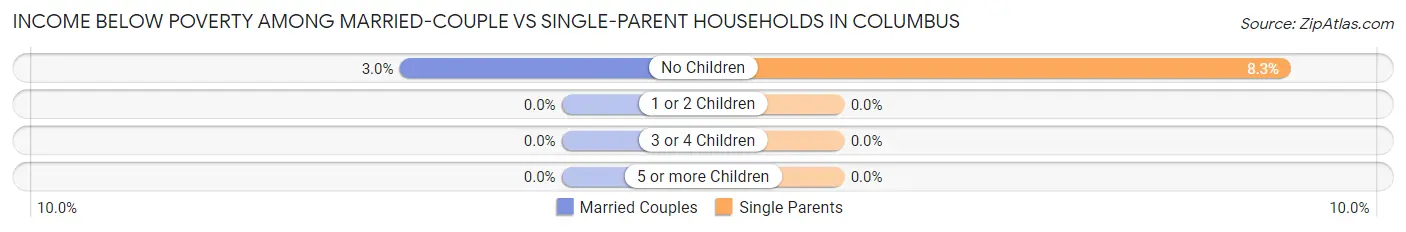
| Children | Married-Couple Families | Single-Parent Households |
| No Children | 15 (3.0%) | 2 (8.3%) |
| 1 or 2 Children | 0 (0.0%) | 0 (0.0%) |
| 3 or 4 Children | 0 (0.0%) | 0 (0.0%) |
| 5 or more Children | 0 (0.0%) | 0 (0.0%) |
| Total | 15 (2.1%) | 2 (2.9%) |
Race in Columbus
The most populous races in Columbus are White / Caucasian (2,553 | 69.3%), Hispanic or Latino (747 | 20.3%), and Black / African American (595 | 16.1%).
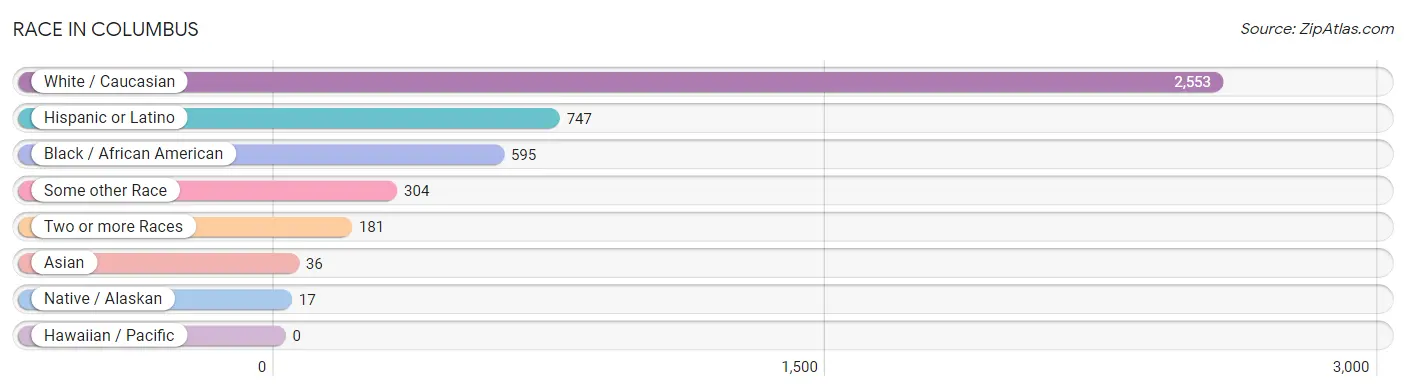
| Race | # Population | % Population |
| Asian | 36 | 1.0% |
| Black / African American | 595 | 16.1% |
| Hawaiian / Pacific | 0 | 0.0% |
| Hispanic or Latino | 747 | 20.3% |
| Native / Alaskan | 17 | 0.5% |
| White / Caucasian | 2,553 | 69.3% |
| Two or more Races | 181 | 4.9% |
| Some other Race | 304 | 8.3% |
| Total | 3,686 | 100.0% |
Ancestry in Columbus
The most populous ancestries reported in Columbus are German (1,158 | 31.4%), Mexican (651 | 17.7%), Czech (220 | 6.0%), Scottish (201 | 5.4%), and English (190 | 5.1%), together accounting for 65.6% of all Columbus residents.
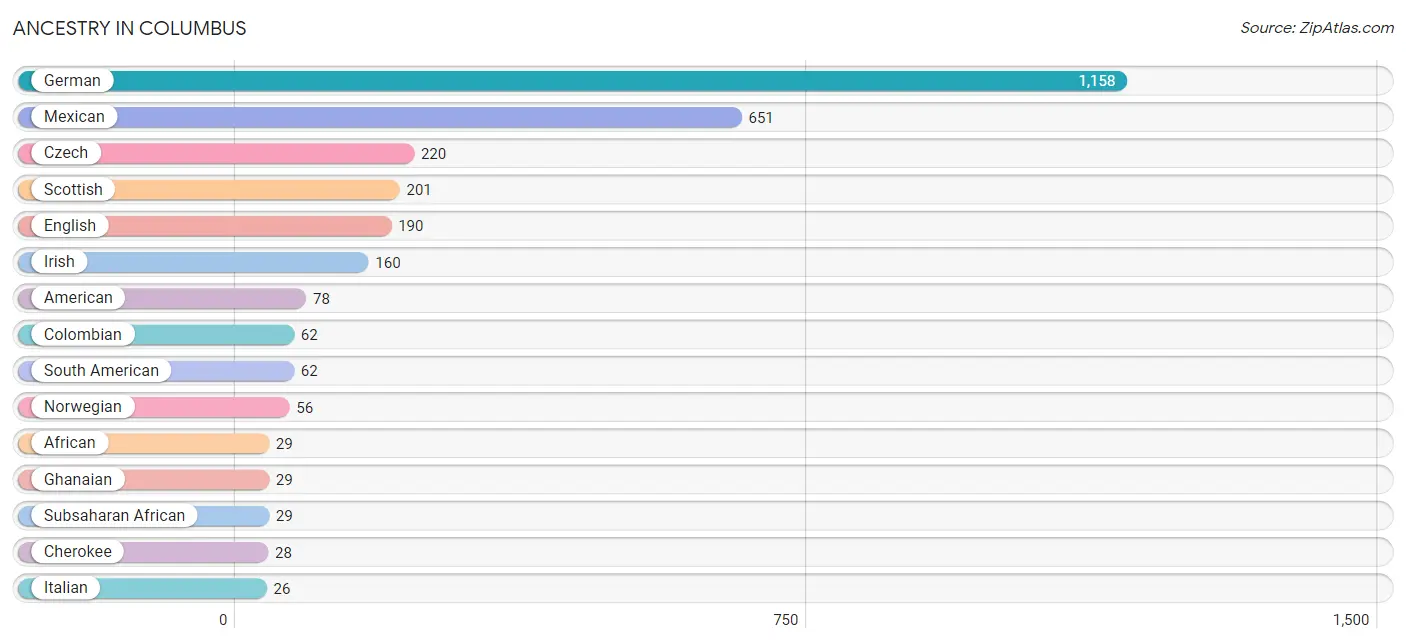
| Ancestry | # Population | % Population |
| African | 29 | 0.8% |
| American | 78 | 2.1% |
| Australian | 5 | 0.1% |
| British | 22 | 0.6% |
| Central American | 6 | 0.2% |
| Cherokee | 28 | 0.8% |
| Colombian | 62 | 1.7% |
| Croatian | 2 | 0.1% |
| Czech | 220 | 6.0% |
| Danish | 7 | 0.2% |
| Dutch | 15 | 0.4% |
| English | 190 | 5.1% |
| European | 13 | 0.4% |
| French | 8 | 0.2% |
| German | 1,158 | 31.4% |
| Ghanaian | 29 | 0.8% |
| Irish | 160 | 4.3% |
| Italian | 26 | 0.7% |
| Mexican | 651 | 17.7% |
| Nicaraguan | 3 | 0.1% |
| Norwegian | 56 | 1.5% |
| Polish | 14 | 0.4% |
| Russian | 18 | 0.5% |
| Salvadoran | 3 | 0.1% |
| Scottish | 201 | 5.4% |
| Serbian | 19 | 0.5% |
| South American | 62 | 1.7% |
| Subsaharan African | 29 | 0.8% |
| Swedish | 5 | 0.1% |
| Vietnamese | 17 | 0.5% | View All 30 Rows |
Immigrants in Columbus
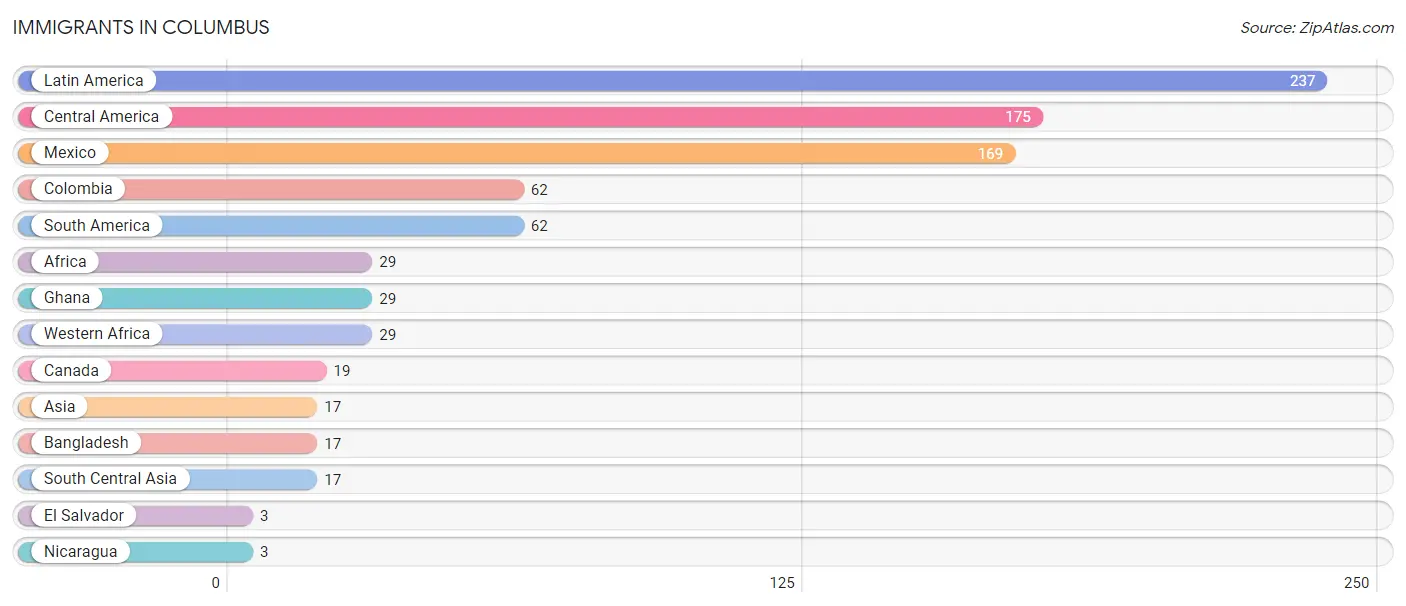
The most numerous immigrant groups reported in Columbus came from Latin America (237 | 6.4%), Central America (175 | 4.8%), Mexico (169 | 4.6%), Colombia (62 | 1.7%), and South America (62 | 1.7%), together accounting for 19.1% of all Columbus residents.
| Immigration Origin | # Population | % Population |
| Africa | 29 | 0.8% |
| Asia | 17 | 0.5% |
| Bangladesh | 17 | 0.5% |
| Canada | 19 | 0.5% |
| Central America | 175 | 4.8% |
| Colombia | 62 | 1.7% |
| El Salvador | 3 | 0.1% |
| Ghana | 29 | 0.8% |
| Latin America | 237 | 6.4% |
| Mexico | 169 | 4.6% |
| Nicaragua | 3 | 0.1% |
| South America | 62 | 1.7% |
| South Central Asia | 17 | 0.5% |
| Western Africa | 29 | 0.8% | View All 14 Rows |
Sex and Age in Columbus
Sex and Age in Columbus
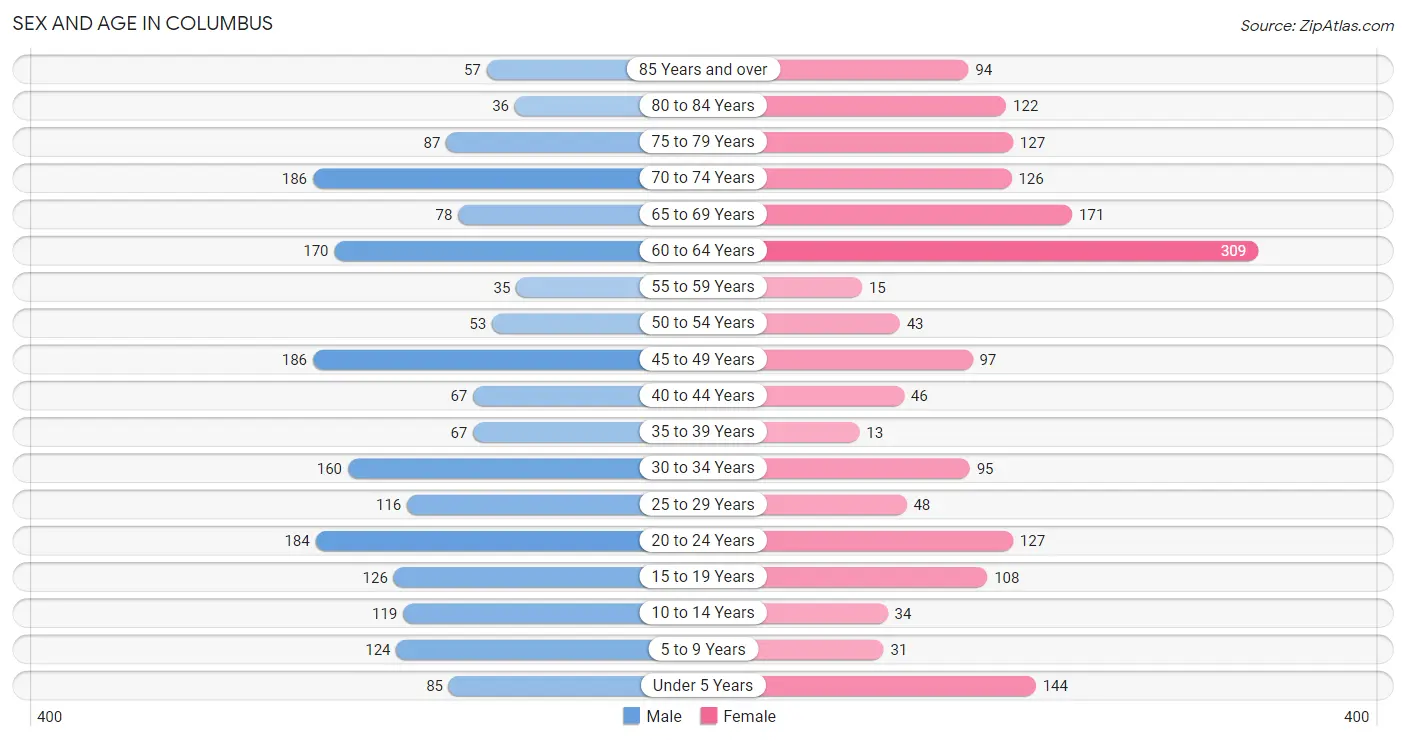
The most populous age groups in Columbus are 45 to 49 Years (186 | 9.6%) for men and 60 to 64 Years (309 | 17.7%) for women.
| Age Bracket | Male | Female |
| Under 5 Years | 85 (4.4%) | 144 (8.2%) |
| 5 to 9 Years | 124 (6.4%) | 31 (1.8%) |
| 10 to 14 Years | 119 (6.1%) | 34 (1.9%) |
| 15 to 19 Years | 126 (6.5%) | 108 (6.2%) |
| 20 to 24 Years | 184 (9.5%) | 127 (7.3%) |
| 25 to 29 Years | 116 (6.0%) | 48 (2.7%) |
| 30 to 34 Years | 160 (8.3%) | 95 (5.4%) |
| 35 to 39 Years | 67 (3.5%) | 13 (0.7%) |
| 40 to 44 Years | 67 (3.5%) | 46 (2.6%) |
| 45 to 49 Years | 186 (9.6%) | 97 (5.5%) |
| 50 to 54 Years | 53 (2.7%) | 43 (2.5%) |
| 55 to 59 Years | 35 (1.8%) | 15 (0.9%) |
| 60 to 64 Years | 170 (8.8%) | 309 (17.7%) |
| 65 to 69 Years | 78 (4.0%) | 171 (9.8%) |
| 70 to 74 Years | 186 (9.6%) | 126 (7.2%) |
| 75 to 79 Years | 87 (4.5%) | 127 (7.3%) |
| 80 to 84 Years | 36 (1.9%) | 122 (7.0%) |
| 85 Years and over | 57 (2.9%) | 94 (5.4%) |
| Total | 1,936 (100.0%) | 1,750 (100.0%) |
Families and Households in Columbus
Median Family Size in Columbus
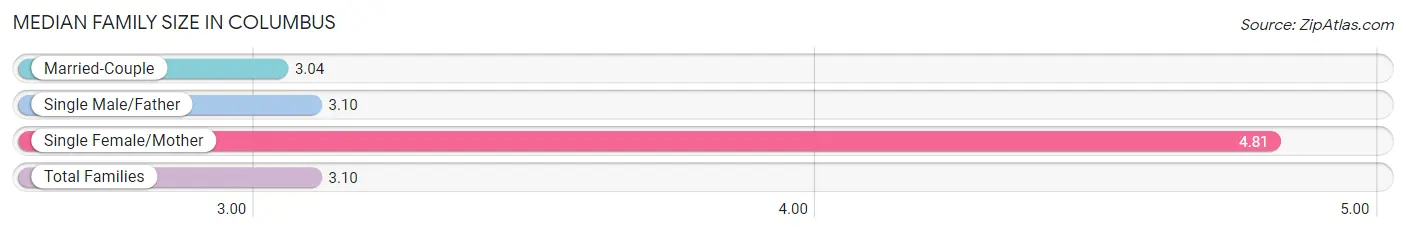
The median family size in Columbus is 3.10 persons per family, with single female/mother families (27 | 3.5%) accounting for the largest median family size of 4.81 persons per family. On the other hand, married-couple families (705 | 91.1%) represent the smallest median family size with 3.04 persons per family.
| Family Type | # Families | Family Size |
| Married-Couple | 705 (91.1%) | 3.04 |
| Single Male/Father | 42 (5.4%) | 3.10 |
| Single Female/Mother | 27 (3.5%) | 4.81 |
| Total Families | 774 (100.0%) | 3.10 |
Median Household Size in Columbus
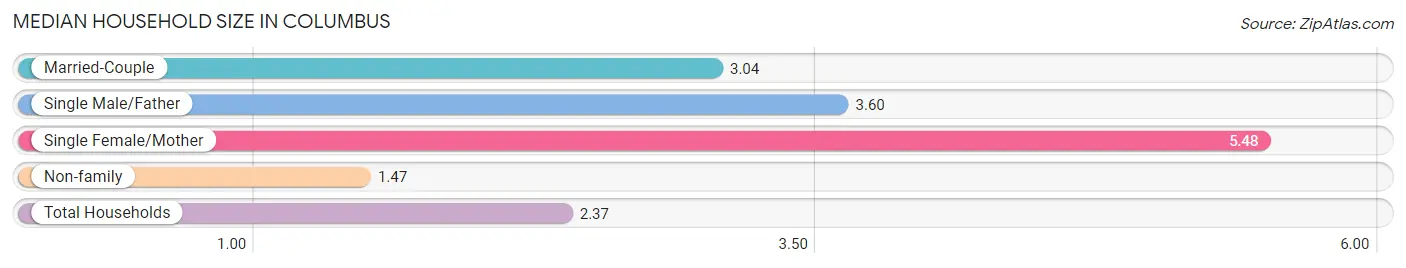
The median household size in Columbus is 2.37 persons per household, with single female/mother households (27 | 1.9%) accounting for the largest median household size of 5.48 persons per household. non-family households (669 | 46.4%) represent the smallest median household size with 1.47 persons per household.
| Household Type | # Households | Household Size |
| Married-Couple | 705 (48.9%) | 3.04 |
| Single Male/Father | 42 (2.9%) | 3.60 |
| Single Female/Mother | 27 (1.9%) | 5.48 |
| Non-family | 669 (46.4%) | 1.47 |
| Total Households | 1,443 (100.0%) | 2.37 |
Household Size by Marriage Status in Columbus
Out of a total of 1,443 households in Columbus, 774 (53.6%) are family households, while 669 (46.4%) are nonfamily households. The most numerous type of family households are 2-person households, comprising 438, and the most common type of nonfamily households are 1-person households, comprising 512.
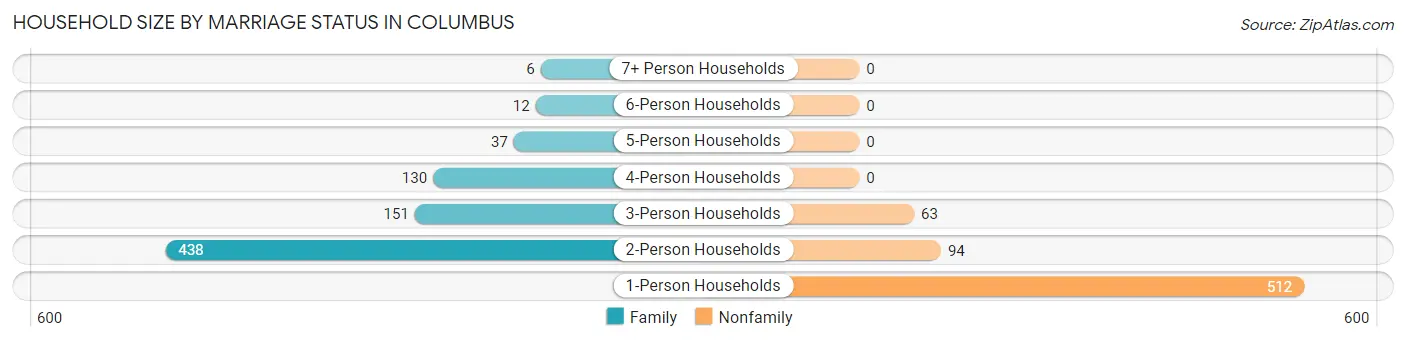
| Household Size | Family Households | Nonfamily Households |
| 1-Person Households | - | 512 (35.5%) |
| 2-Person Households | 438 (30.3%) | 94 (6.5%) |
| 3-Person Households | 151 (10.5%) | 63 (4.4%) |
| 4-Person Households | 130 (9.0%) | 0 (0.0%) |
| 5-Person Households | 37 (2.6%) | 0 (0.0%) |
| 6-Person Households | 12 (0.8%) | 0 (0.0%) |
| 7+ Person Households | 6 (0.4%) | 0 (0.0%) |
| Total | 774 (53.6%) | 669 (46.4%) |
Female Fertility in Columbus
Fertility by Age in Columbus
Average fertility rate in Columbus is 71.0 births per 1,000 women. Women in the age bracket of 20 to 34 years have the highest fertility rate with 141.0 births per 1,000 women. Women in the age bracket of 20 to 34 years acount for 100.0% of all women with births.
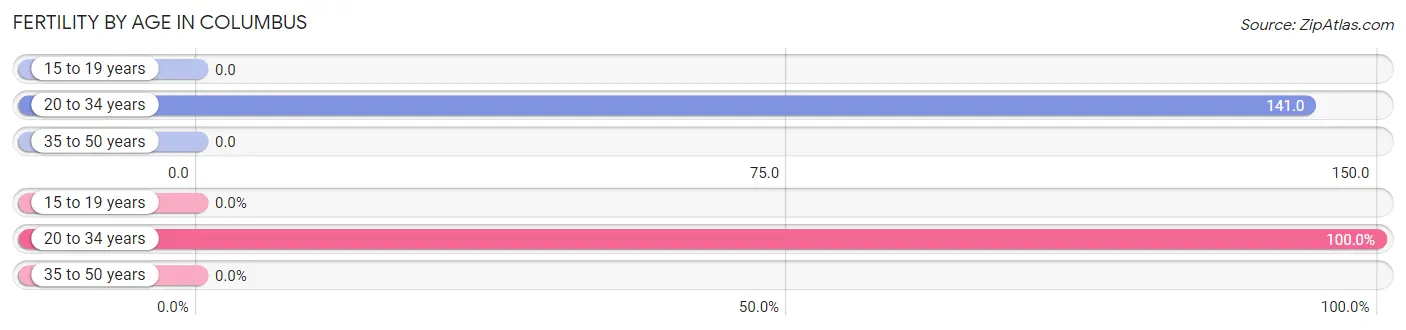
| Age Bracket | Women with Births | Births / 1,000 Women |
| 15 to 19 years | 0 (0.0%) | 0.0 |
| 20 to 34 years | 38 (100.0%) | 141.0 |
| 35 to 50 years | 0 (0.0%) | 0.0 |
| Total | 38 (100.0%) | 71.0 |
Fertility by Age by Marriage Status in Columbus
94.7% of women with births (38) in Columbus are married. The highest percentage of unmarried women with births falls into 20 to 34 years age bracket with 5.3% of them unmarried at the time of birth, while the lowest percentage of unmarried women with births belong to 20 to 34 years age bracket with 5.3% of them unmarried.
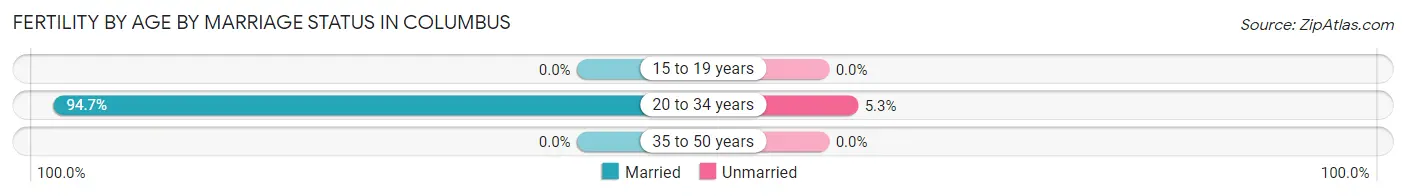
| Age Bracket | Married | Unmarried |
| 15 to 19 years | 0 (0.0%) | 0 (0.0%) |
| 20 to 34 years | 36 (94.7%) | 2 (5.3%) |
| 35 to 50 years | 0 (0.0%) | 0 (0.0%) |
| Total | 36 (94.7%) | 2 (5.3%) |
Fertility by Education in Columbus
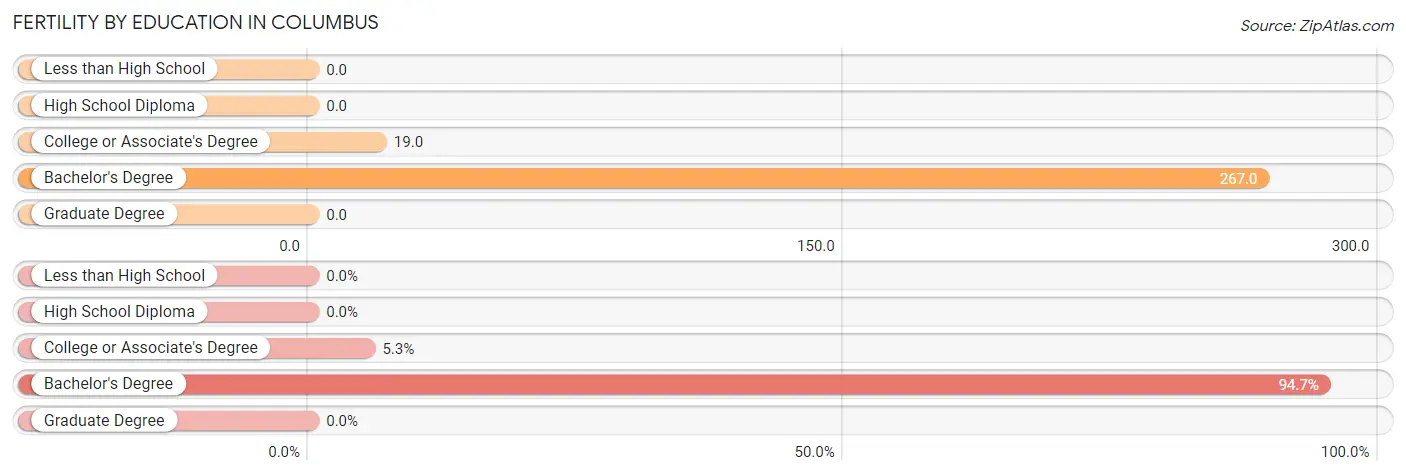
| Educational Attainment | Women with Births | Births / 1,000 Women |
| Less than High School | 0 (0.0%) | 0.0 |
| High School Diploma | 0 (0.0%) | 0.0 |
| College or Associate's Degree | 2 (5.3%) | 19.0 |
| Bachelor's Degree | 36 (94.7%) | 267.0 |
| Graduate Degree | 0 (0.0%) | 0.0 |
| Total | 38 (100.0%) | 71.0 |
Fertility by Education by Marriage Status in Columbus
5.3% of women with births in Columbus are unmarried. Women with the educational attainment of bachelor's degree are most likely to be married with 100.0% of them married at childbirth, while women with the educational attainment of college or associate's degree are least likely to be married with 100.0% of them unmarried at childbirth.
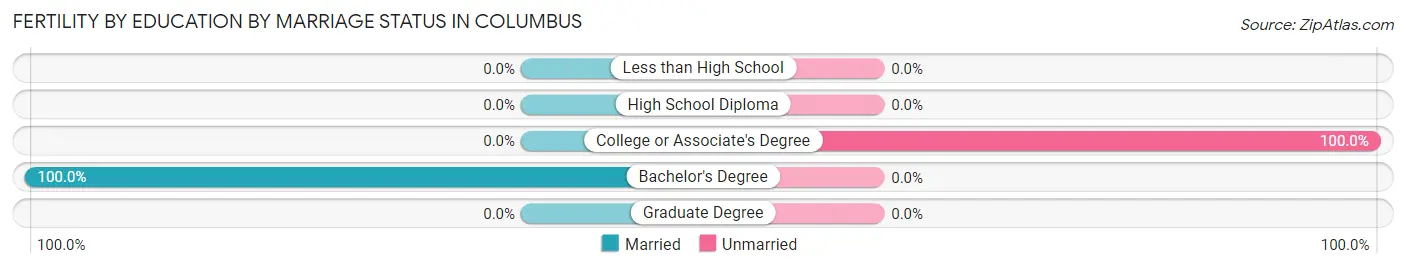
| Educational Attainment | Married | Unmarried |
| Less than High School | 0 (0.0%) | 0 (0.0%) |
| High School Diploma | 0 (0.0%) | 0 (0.0%) |
| College or Associate's Degree | 0 (0.0%) | 2 (100.0%) |
| Bachelor's Degree | 36 (100.0%) | 0 (0.0%) |
| Graduate Degree | 0 (0.0%) | 0 (0.0%) |
| Total | 36 (94.7%) | 2 (5.3%) |
Employment Characteristics in Columbus
Employment by Class of Employer in Columbus
Among the 1,545 employed individuals in Columbus, private company employees (777 | 50.3%), self-employed (not incorporated) (303 | 19.6%), and not-for-profit organizations (239 | 15.5%) make up the most common classes of employment.
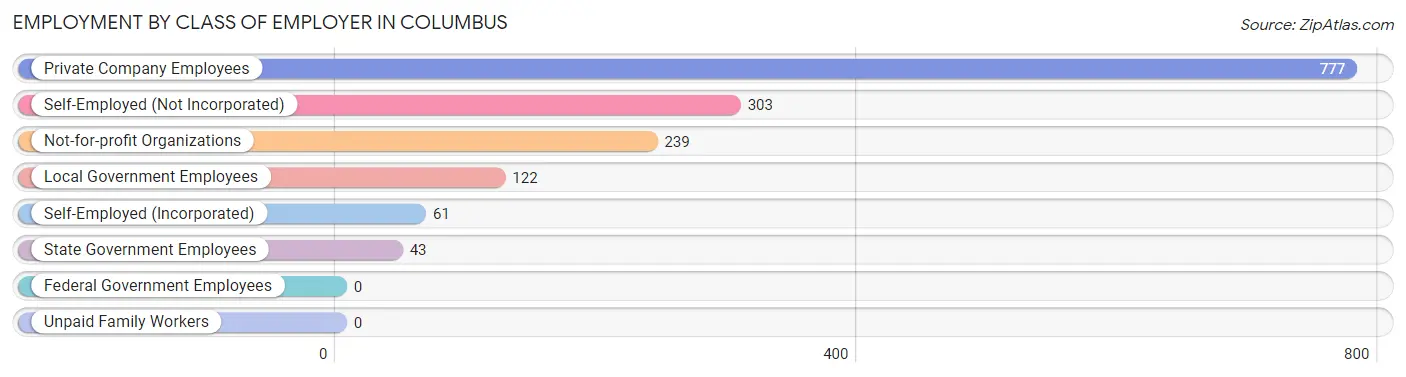
| Employer Class | # Employees | % Employees |
| Private Company Employees | 777 | 50.3% |
| Self-Employed (Incorporated) | 61 | 4.0% |
| Self-Employed (Not Incorporated) | 303 | 19.6% |
| Not-for-profit Organizations | 239 | 15.5% |
| Local Government Employees | 122 | 7.9% |
| State Government Employees | 43 | 2.8% |
| Federal Government Employees | 0 | 0.0% |
| Unpaid Family Workers | 0 | 0.0% |
| Total | 1,545 | 100.0% |
Employment Status by Age in Columbus
According to the labor force statistics for Columbus, out of the total population over 16 years of age (3,149), 51.7% or 1,628 individuals are in the labor force, with 3.3% or 54 of them unemployed. The age group with the highest labor force participation rate is 20 to 24 years, with 98.1% or 305 individuals in the labor force. Within the labor force, the 30 to 34 years age range has the highest percentage of unemployed individuals, with 17.0% or 34 of them being unemployed.
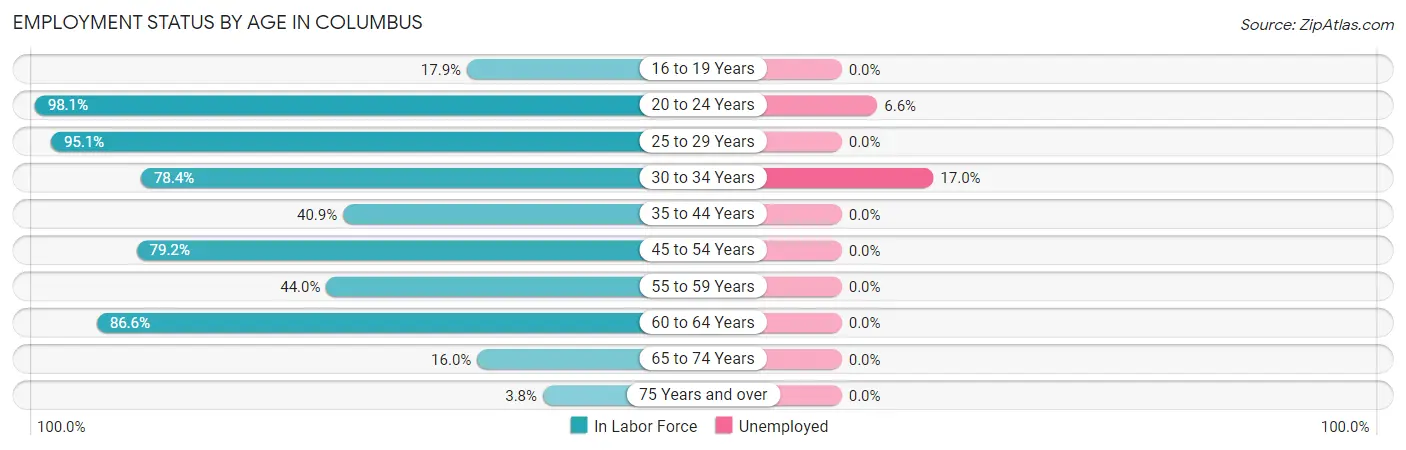
| Age Bracket | In Labor Force | Unemployed |
| 16 to 19 Years | 42 (17.9%) | 0 (0.0%) |
| 20 to 24 Years | 305 (98.1%) | 20 (6.6%) |
| 25 to 29 Years | 156 (95.1%) | 0 (0.0%) |
| 30 to 34 Years | 200 (78.4%) | 34 (17.0%) |
| 35 to 44 Years | 79 (40.9%) | 0 (0.0%) |
| 45 to 54 Years | 300 (79.2%) | 0 (0.0%) |
| 55 to 59 Years | 22 (44.0%) | 0 (0.0%) |
| 60 to 64 Years | 415 (86.6%) | 0 (0.0%) |
| 65 to 74 Years | 90 (16.0%) | 0 (0.0%) |
| 75 Years and over | 20 (3.8%) | 0 (0.0%) |
| Total | 1,628 (51.7%) | 54 (3.3%) |
Employment Status by Educational Attainment in Columbus
According to labor force statistics for Columbus, 77.1% of individuals (1,172) out of the total population between 25 and 64 years of age (1,520) are in the labor force, with 2.9% or 34 of them being unemployed. The group with the highest labor force participation rate are those with the educational attainment of high school diploma, with 84.4% or 553 individuals in the labor force. Within the labor force, individuals with college / associate degree education have the highest percentage of unemployment, with 20.9% or 34 of them being unemployed.
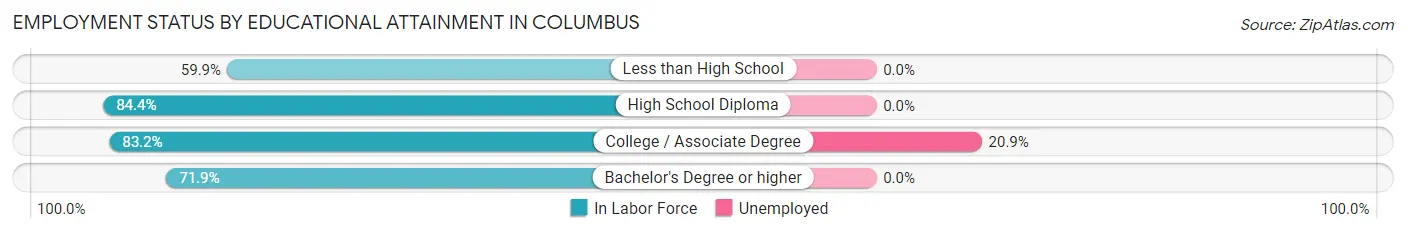
| Educational Attainment | In Labor Force | Unemployed |
| Less than High School | 124 (59.9%) | 0 (0.0%) |
| High School Diploma | 553 (84.4%) | 0 (0.0%) |
| College / Associate Degree | 163 (83.2%) | 41 (20.9%) |
| Bachelor's Degree or higher | 332 (71.9%) | 0 (0.0%) |
| Total | 1,172 (77.1%) | 44 (2.9%) |
Employment Occupations by Sex in Columbus
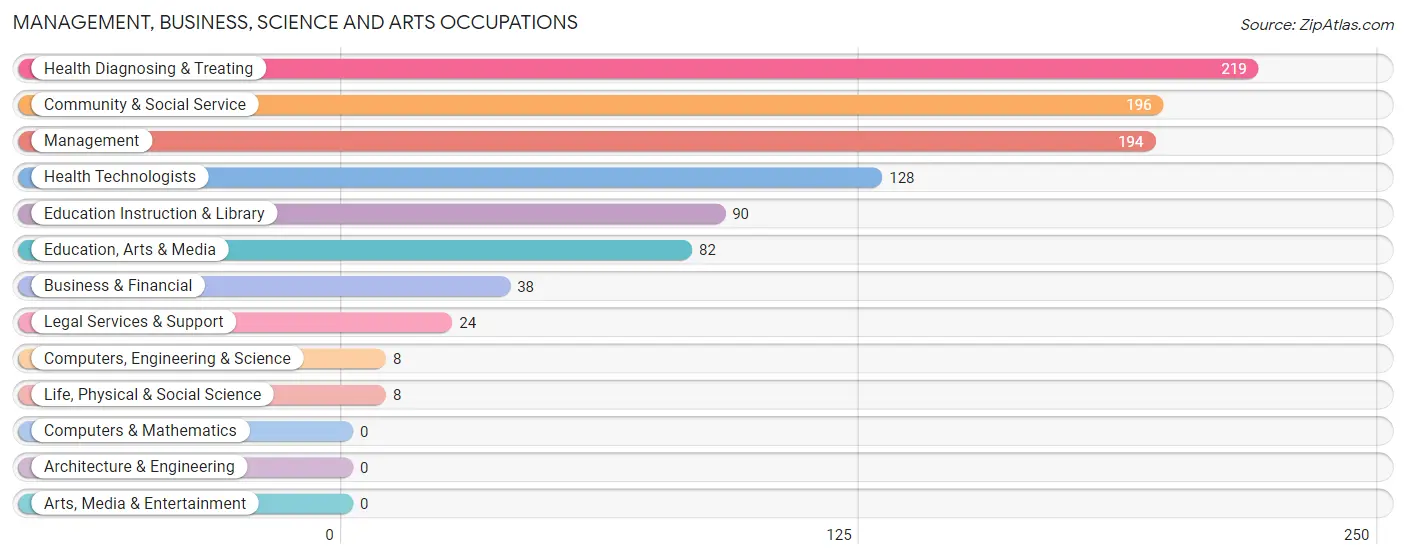
Management, Business, Science and Arts Occupations
The most common Management, Business, Science and Arts occupations in Columbus are Health Diagnosing & Treating (219 | 13.9%), Community & Social Service (196 | 12.4%), Management (194 | 12.3%), Health Technologists (128 | 8.1%), and Education Instruction & Library (90 | 5.7%).
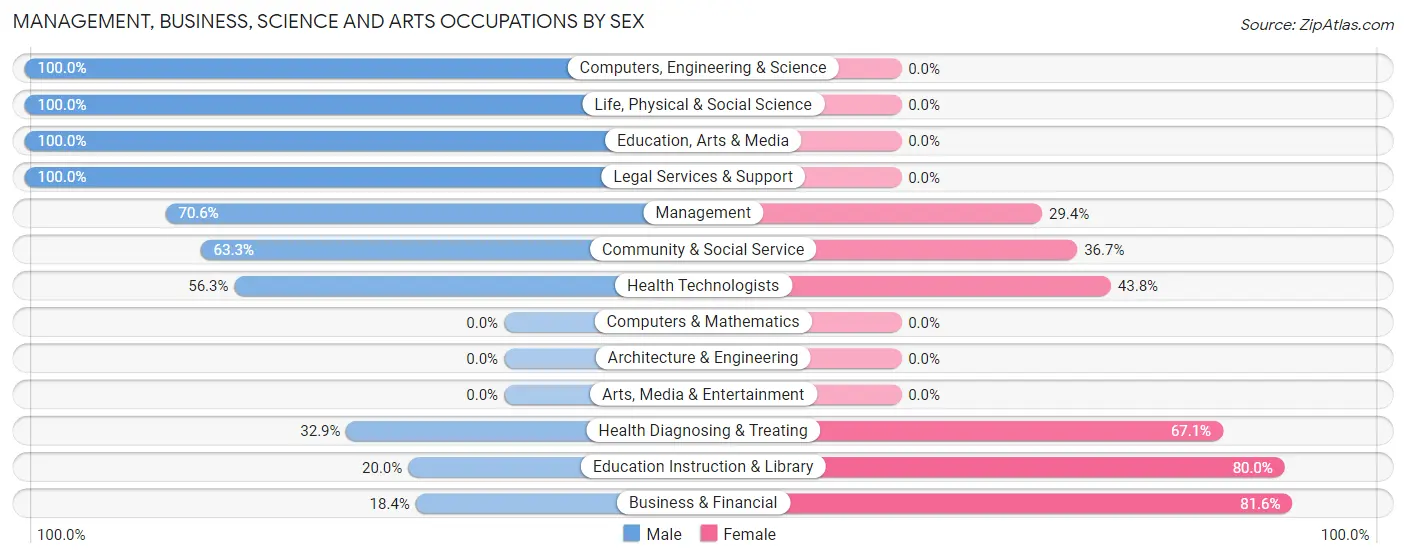
Management, Business, Science and Arts Occupations by Sex
Within the Management, Business, Science and Arts occupations in Columbus, the most male-oriented occupations are Computers, Engineering & Science (100.0%), Life, Physical & Social Science (100.0%), and Education, Arts & Media (100.0%), while the most female-oriented occupations are Business & Financial (81.6%), Education Instruction & Library (80.0%), and Health Diagnosing & Treating (67.1%).
| Occupation | Male | Female |
| Management | 137 (70.6%) | 57 (29.4%) |
| Business & Financial | 7 (18.4%) | 31 (81.6%) |
| Computers, Engineering & Science | 8 (100.0%) | 0 (0.0%) |
| Computers & Mathematics | 0 (0.0%) | 0 (0.0%) |
| Architecture & Engineering | 0 (0.0%) | 0 (0.0%) |
| Life, Physical & Social Science | 8 (100.0%) | 0 (0.0%) |
| Community & Social Service | 124 (63.3%) | 72 (36.7%) |
| Education, Arts & Media | 82 (100.0%) | 0 (0.0%) |
| Legal Services & Support | 24 (100.0%) | 0 (0.0%) |
| Education Instruction & Library | 18 (20.0%) | 72 (80.0%) |
| Arts, Media & Entertainment | 0 (0.0%) | 0 (0.0%) |
| Health Diagnosing & Treating | 72 (32.9%) | 147 (67.1%) |
| Health Technologists | 72 (56.2%) | 56 (43.8%) |
| Total (Category) | 348 (53.1%) | 307 (46.9%) |
| Total (Overall) | 894 (56.8%) | 681 (43.2%) |
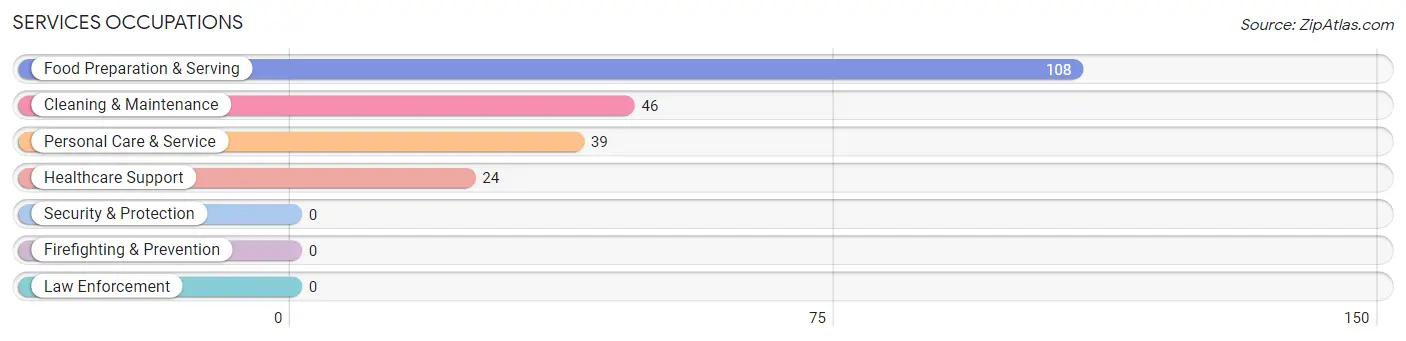
Services Occupations
The most common Services occupations in Columbus are Food Preparation & Serving (108 | 6.9%), Cleaning & Maintenance (46 | 2.9%), Personal Care & Service (39 | 2.5%), and Healthcare Support (24 | 1.5%).
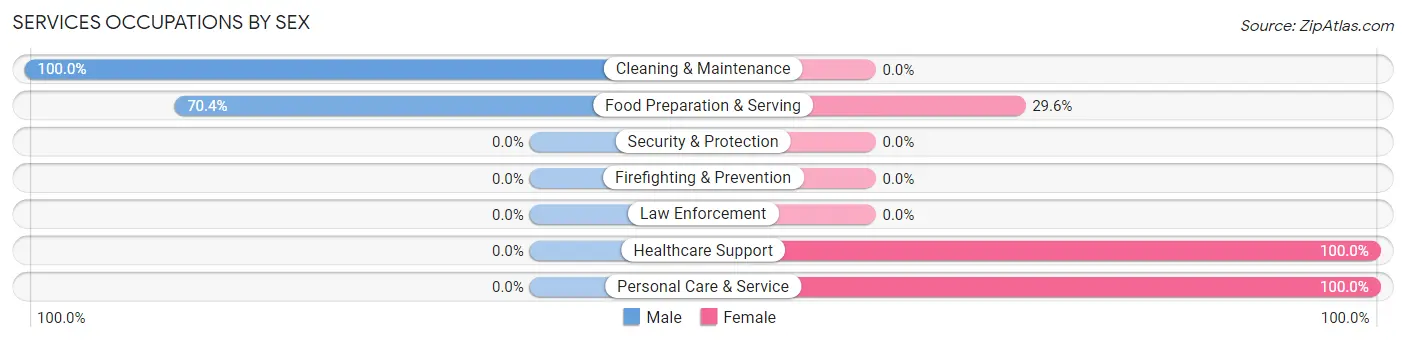
Services Occupations by Sex
Within the Services occupations in Columbus, the most male-oriented occupations are Cleaning & Maintenance (100.0%), and Food Preparation & Serving (70.4%), while the most female-oriented occupations are Healthcare Support (100.0%), Personal Care & Service (100.0%), and Food Preparation & Serving (29.6%).
| Occupation | Male | Female |
| Healthcare Support | 0 (0.0%) | 24 (100.0%) |
| Security & Protection | 0 (0.0%) | 0 (0.0%) |
| Firefighting & Prevention | 0 (0.0%) | 0 (0.0%) |
| Law Enforcement | 0 (0.0%) | 0 (0.0%) |
| Food Preparation & Serving | 76 (70.4%) | 32 (29.6%) |
| Cleaning & Maintenance | 46 (100.0%) | 0 (0.0%) |
| Personal Care & Service | 0 (0.0%) | 39 (100.0%) |
| Total (Category) | 122 (56.2%) | 95 (43.8%) |
| Total (Overall) | 894 (56.8%) | 681 (43.2%) |
Sales and Office Occupations
The most common Sales and Office occupations in Columbus are , and Sales & Related (432 | 27.4%).

Sales and Office Occupations by Sex
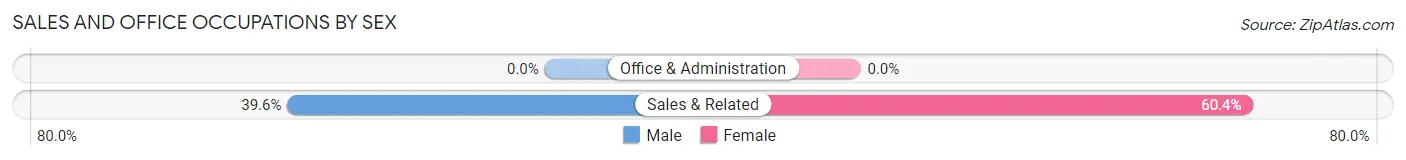
| Occupation | Male | Female |
| Sales & Related | 171 (39.6%) | 261 (60.4%) |
| Office & Administration | 0 (0.0%) | 0 (0.0%) |
| Total (Category) | 171 (39.6%) | 261 (60.4%) |
| Total (Overall) | 894 (56.8%) | 681 (43.2%) |
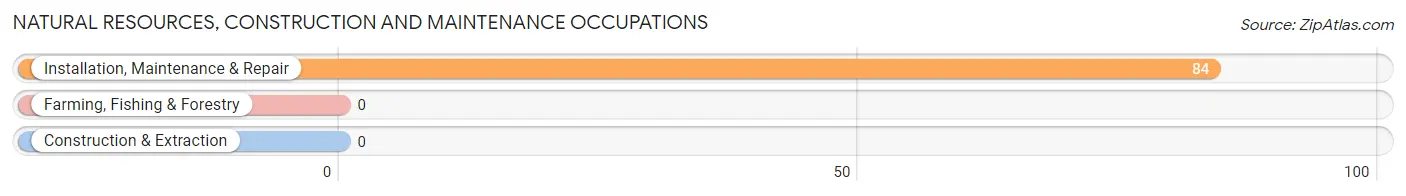
Natural Resources, Construction and Maintenance Occupations
The most common Natural Resources, Construction and Maintenance occupations in Columbus are , and Installation, Maintenance & Repair (84 | 5.3%).
Natural Resources, Construction and Maintenance Occupations by Sex
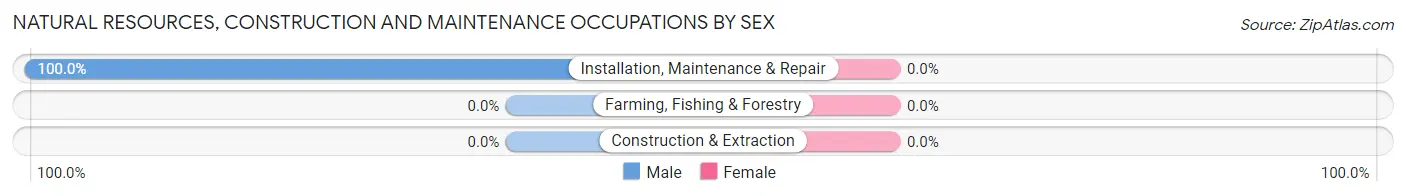
| Occupation | Male | Female |
| Farming, Fishing & Forestry | 0 (0.0%) | 0 (0.0%) |
| Construction & Extraction | 0 (0.0%) | 0 (0.0%) |
| Installation, Maintenance & Repair | 84 (100.0%) | 0 (0.0%) |
| Total (Category) | 84 (100.0%) | 0 (0.0%) |
| Total (Overall) | 894 (56.8%) | 681 (43.2%) |
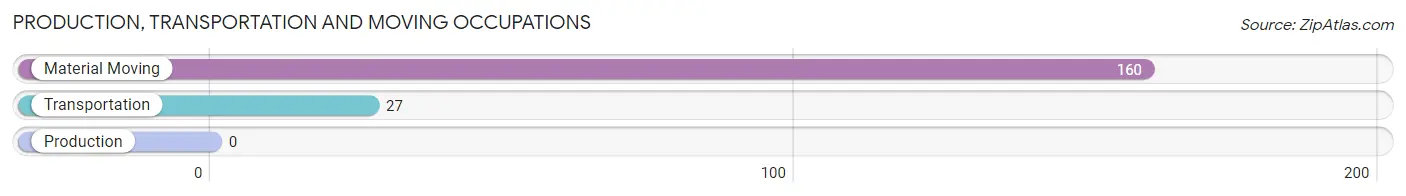
Production, Transportation and Moving Occupations
The most common Production, Transportation and Moving occupations in Columbus are Material Moving (160 | 10.2%), and Transportation (27 | 1.7%).
Production, Transportation and Moving Occupations by Sex
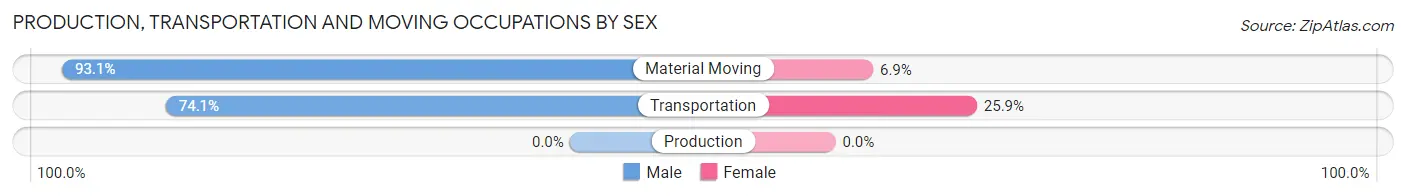
| Occupation | Male | Female |
| Production | 0 (0.0%) | 0 (0.0%) |
| Transportation | 20 (74.1%) | 7 (25.9%) |
| Material Moving | 149 (93.1%) | 11 (6.9%) |
| Total (Category) | 169 (90.4%) | 18 (9.6%) |
| Total (Overall) | 894 (56.8%) | 681 (43.2%) |
Employment Industries by Sex in Columbus
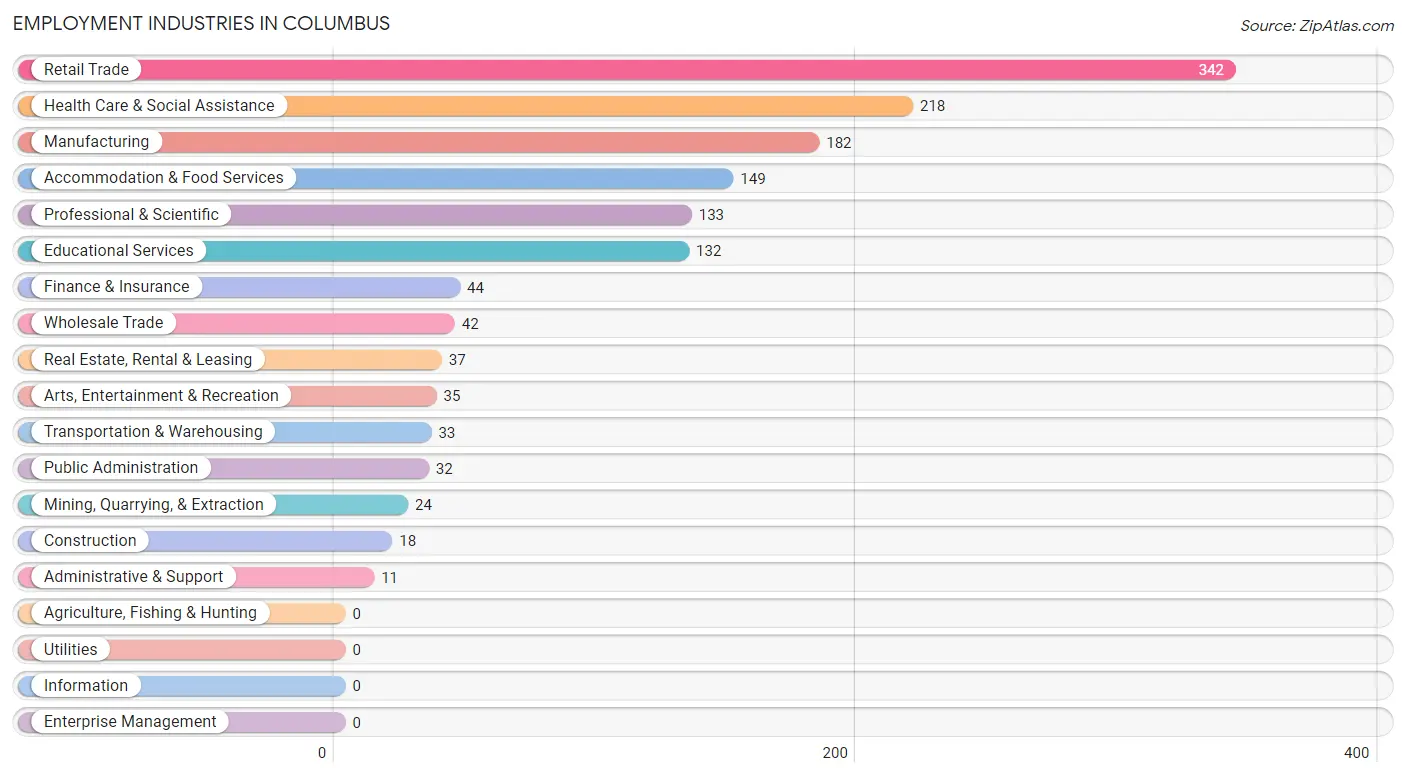
Employment Industries in Columbus
The major employment industries in Columbus include Retail Trade (342 | 21.7%), Health Care & Social Assistance (218 | 13.8%), Manufacturing (182 | 11.6%), Accommodation & Food Services (149 | 9.5%), and Professional & Scientific (133 | 8.4%).
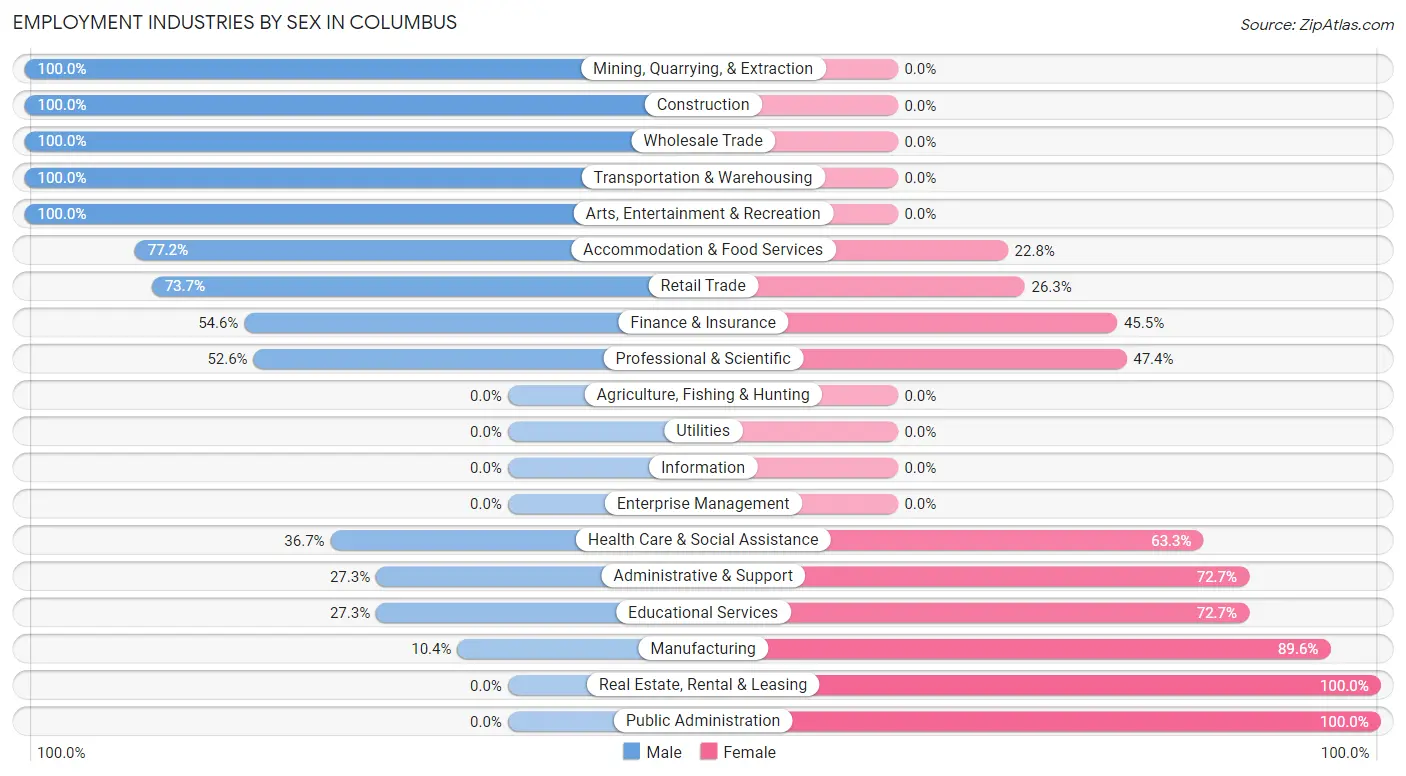
Employment Industries by Sex in Columbus
The Columbus industries that see more men than women are Mining, Quarrying, & Extraction (100.0%), Construction (100.0%), and Wholesale Trade (100.0%), whereas the industries that tend to have a higher number of women are Real Estate, Rental & Leasing (100.0%), Public Administration (100.0%), and Manufacturing (89.6%).
| Industry | Male | Female |
| Agriculture, Fishing & Hunting | 0 (0.0%) | 0 (0.0%) |
| Mining, Quarrying, & Extraction | 24 (100.0%) | 0 (0.0%) |
| Construction | 18 (100.0%) | 0 (0.0%) |
| Manufacturing | 19 (10.4%) | 163 (89.6%) |
| Wholesale Trade | 42 (100.0%) | 0 (0.0%) |
| Retail Trade | 252 (73.7%) | 90 (26.3%) |
| Transportation & Warehousing | 33 (100.0%) | 0 (0.0%) |
| Utilities | 0 (0.0%) | 0 (0.0%) |
| Information | 0 (0.0%) | 0 (0.0%) |
| Finance & Insurance | 24 (54.5%) | 20 (45.5%) |
| Real Estate, Rental & Leasing | 0 (0.0%) | 37 (100.0%) |
| Professional & Scientific | 70 (52.6%) | 63 (47.4%) |
| Enterprise Management | 0 (0.0%) | 0 (0.0%) |
| Administrative & Support | 3 (27.3%) | 8 (72.7%) |
| Educational Services | 36 (27.3%) | 96 (72.7%) |
| Health Care & Social Assistance | 80 (36.7%) | 138 (63.3%) |
| Arts, Entertainment & Recreation | 35 (100.0%) | 0 (0.0%) |
| Accommodation & Food Services | 115 (77.2%) | 34 (22.8%) |
| Public Administration | 0 (0.0%) | 32 (100.0%) |
| Total | 894 (56.8%) | 681 (43.2%) |
Education in Columbus
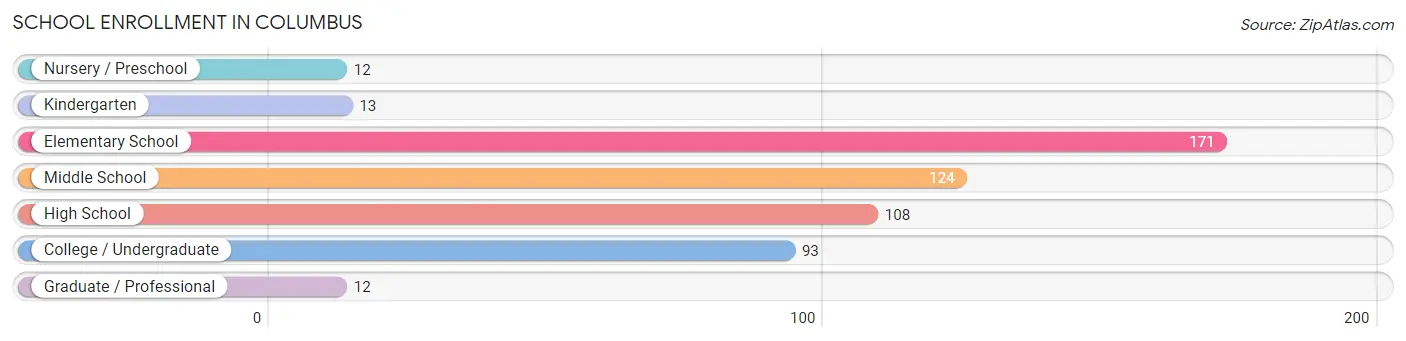
School Enrollment in Columbus
The most common levels of schooling among the 533 students in Columbus are elementary school (171 | 32.1%), middle school (124 | 23.3%), and high school (108 | 20.3%).
| School Level | # Students | % Students |
| Nursery / Preschool | 12 | 2.2% |
| Kindergarten | 13 | 2.4% |
| Elementary School | 171 | 32.1% |
| Middle School | 124 | 23.3% |
| High School | 108 | 20.3% |
| College / Undergraduate | 93 | 17.4% |
| Graduate / Professional | 12 | 2.2% |
| Total | 533 | 100.0% |
School Enrollment by Age by Funding Source in Columbus
Out of a total of 533 students who are enrolled in schools in Columbus, 6 (1.1%) attend a private institution, while the remaining 527 (98.9%) are enrolled in public schools. The age group of 25 to 34 year olds has the highest likelihood of being enrolled in private schools, with 6 (75.0% in the age bracket) enrolled. Conversely, the age group of 3 to 4 year olds has the lowest likelihood of being enrolled in a private school, with 12 (100.0% in the age bracket) attending a public institution.
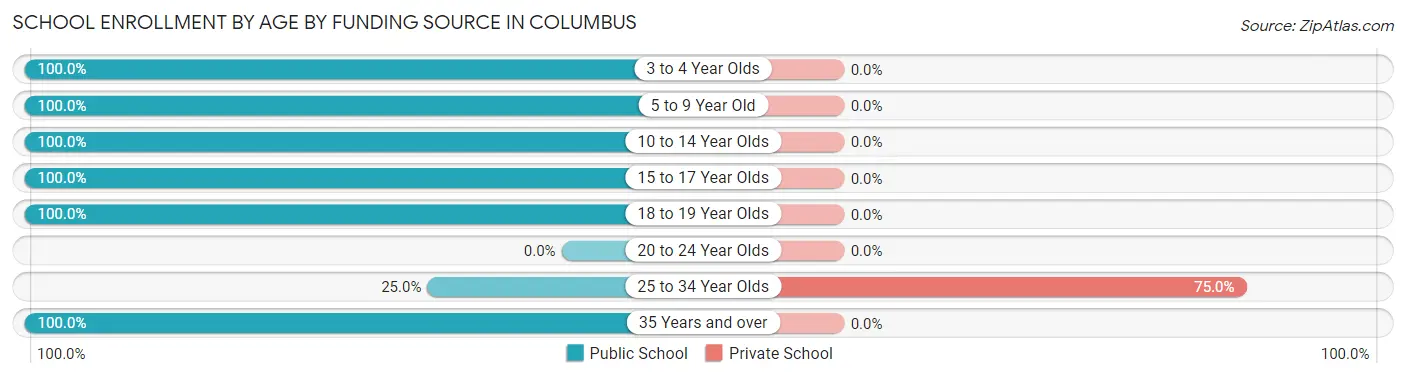
| Age Bracket | Public School | Private School |
| 3 to 4 Year Olds | 12 (100.0%) | 0 (0.0%) |
| 5 to 9 Year Old | 155 (100.0%) | 0 (0.0%) |
| 10 to 14 Year Olds | 153 (100.0%) | 0 (0.0%) |
| 15 to 17 Year Olds | 76 (100.0%) | 0 (0.0%) |
| 18 to 19 Year Olds | 117 (100.0%) | 0 (0.0%) |
| 20 to 24 Year Olds | 0 (0.0%) | 0 (0.0%) |
| 25 to 34 Year Olds | 2 (25.0%) | 6 (75.0%) |
| 35 Years and over | 12 (100.0%) | 0 (0.0%) |
| Total | 527 (98.9%) | 6 (1.1%) |
Educational Attainment by Field of Study in Columbus
Social sciences (104 | 12.6%), liberal arts & history (101 | 12.3%), communications (101 | 12.3%), science & technology (100 | 12.1%), and education (99 | 12.0%) are the most common fields of study among 824 individuals in Columbus who have obtained a bachelor's degree or higher.
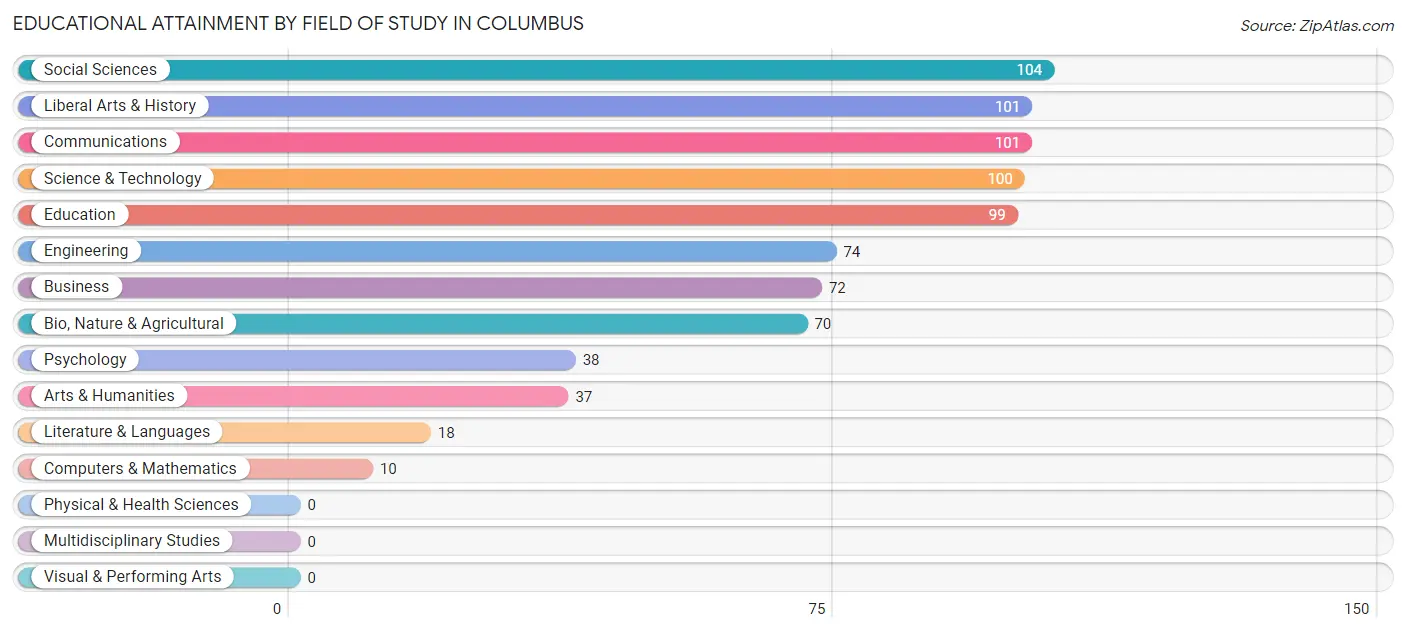
| Field of Study | # Graduates | % Graduates |
| Computers & Mathematics | 10 | 1.2% |
| Bio, Nature & Agricultural | 70 | 8.5% |
| Physical & Health Sciences | 0 | 0.0% |
| Psychology | 38 | 4.6% |
| Social Sciences | 104 | 12.6% |
| Engineering | 74 | 9.0% |
| Multidisciplinary Studies | 0 | 0.0% |
| Science & Technology | 100 | 12.1% |
| Business | 72 | 8.7% |
| Education | 99 | 12.0% |
| Literature & Languages | 18 | 2.2% |
| Liberal Arts & History | 101 | 12.3% |
| Visual & Performing Arts | 0 | 0.0% |
| Communications | 101 | 12.3% |
| Arts & Humanities | 37 | 4.5% |
| Total | 824 | 100.0% |
Transportation & Commute in Columbus
Vehicle Availability by Sex in Columbus
The most prevalent vehicle ownership categories in Columbus are males with 2 vehicles (475, accounting for 53.1%) and females with 2 vehicles (379, making up 73.0%).
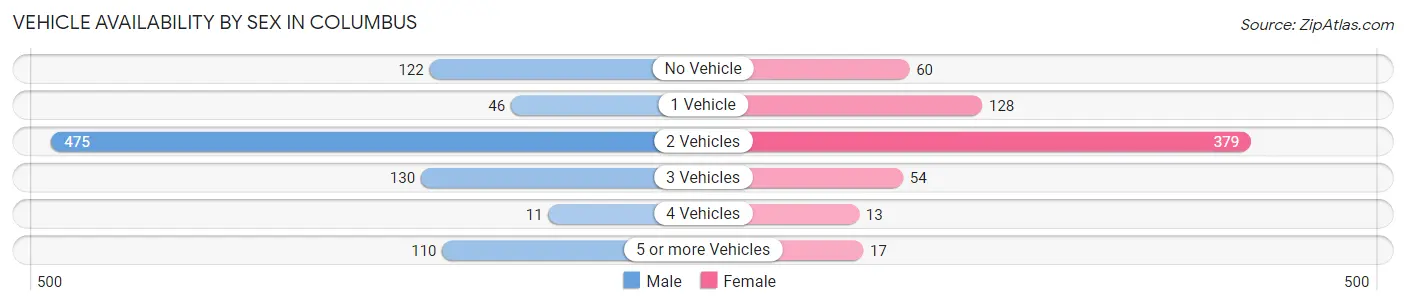
| Vehicles Available | Male | Female |
| No Vehicle | 122 (13.7%) | 60 (9.2%) |
| 1 Vehicle | 46 (5.1%) | 128 (19.7%) |
| 2 Vehicles | 475 (53.1%) | 379 (58.2%) |
| 3 Vehicles | 130 (14.5%) | 54 (8.3%) |
| 4 Vehicles | 11 (1.2%) | 13 (2.0%) |
| 5 or more Vehicles | 110 (12.3%) | 17 (2.6%) |
| Total | 894 (100.0%) | 651 (100.0%) |
Commute Time in Columbus
The most frequently occuring commute durations in Columbus are 5 to 9 minutes (650 commuters, 43.4%), 15 to 19 minutes (193 commuters, 12.9%), and 60 to 89 minutes (129 commuters, 8.6%).
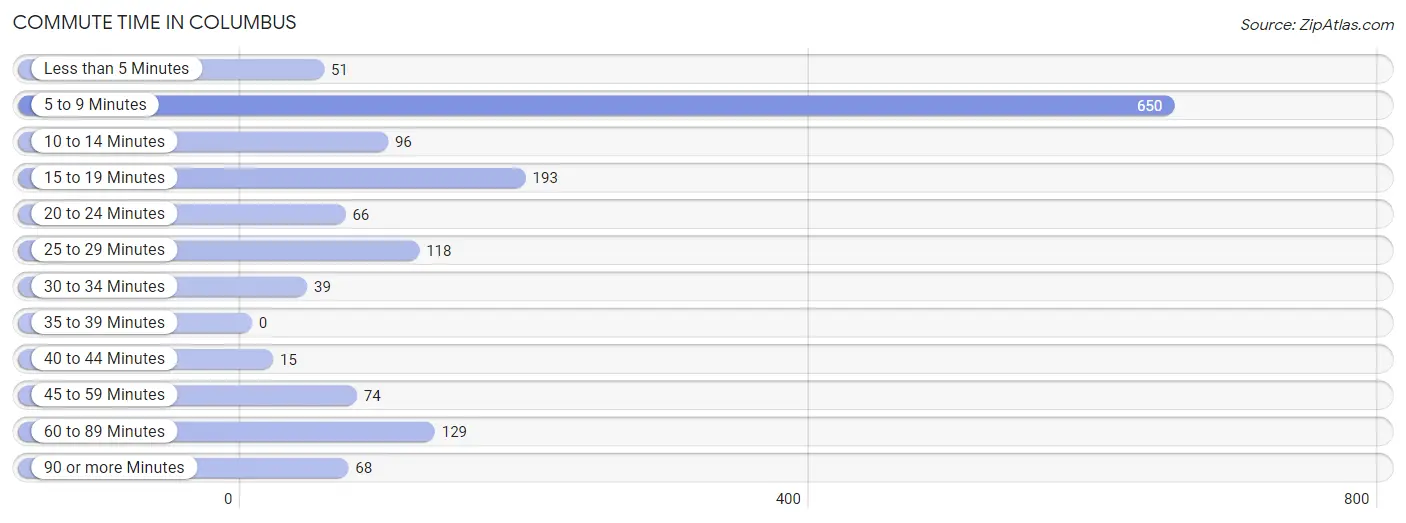
| Commute Time | # Commuters | % Commuters |
| Less than 5 Minutes | 51 | 3.4% |
| 5 to 9 Minutes | 650 | 43.4% |
| 10 to 14 Minutes | 96 | 6.4% |
| 15 to 19 Minutes | 193 | 12.9% |
| 20 to 24 Minutes | 66 | 4.4% |
| 25 to 29 Minutes | 118 | 7.9% |
| 30 to 34 Minutes | 39 | 2.6% |
| 35 to 39 Minutes | 0 | 0.0% |
| 40 to 44 Minutes | 15 | 1.0% |
| 45 to 59 Minutes | 74 | 4.9% |
| 60 to 89 Minutes | 129 | 8.6% |
| 90 or more Minutes | 68 | 4.5% |
Commute Time by Sex in Columbus
The most common commute times in Columbus are 5 to 9 minutes (329 commuters, 38.8%) for males and 5 to 9 minutes (321 commuters, 49.3%) for females.
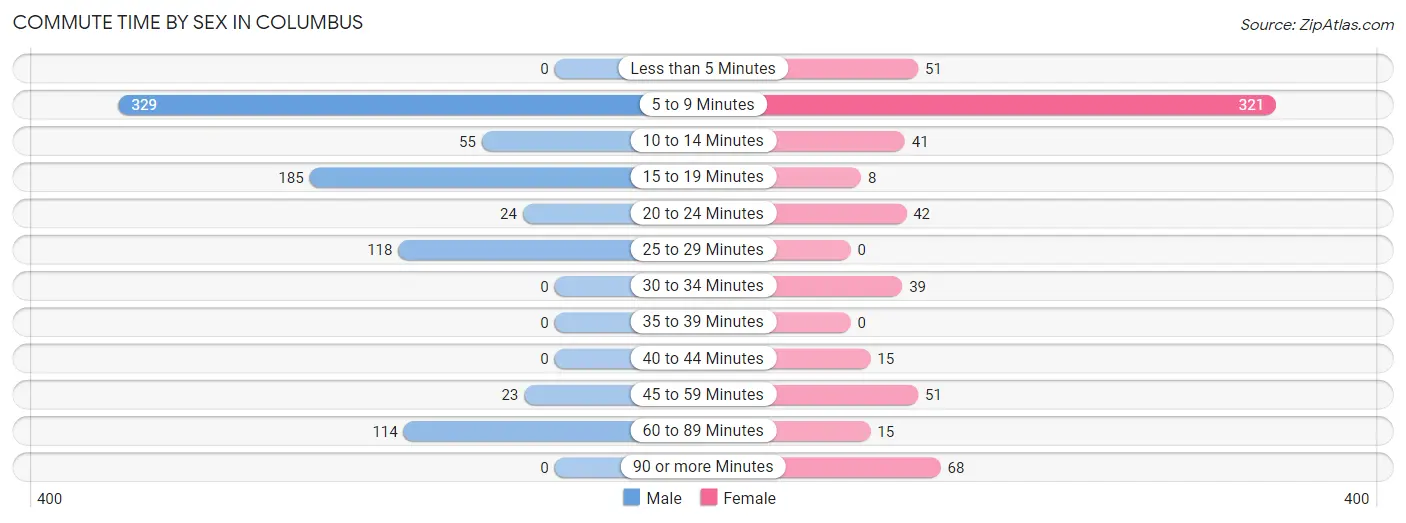
| Commute Time | Male | Female |
| Less than 5 Minutes | 0 (0.0%) | 51 (7.8%) |
| 5 to 9 Minutes | 329 (38.8%) | 321 (49.3%) |
| 10 to 14 Minutes | 55 (6.5%) | 41 (6.3%) |
| 15 to 19 Minutes | 185 (21.8%) | 8 (1.2%) |
| 20 to 24 Minutes | 24 (2.8%) | 42 (6.5%) |
| 25 to 29 Minutes | 118 (13.9%) | 0 (0.0%) |
| 30 to 34 Minutes | 0 (0.0%) | 39 (6.0%) |
| 35 to 39 Minutes | 0 (0.0%) | 0 (0.0%) |
| 40 to 44 Minutes | 0 (0.0%) | 15 (2.3%) |
| 45 to 59 Minutes | 23 (2.7%) | 51 (7.8%) |
| 60 to 89 Minutes | 114 (13.4%) | 15 (2.3%) |
| 90 or more Minutes | 0 (0.0%) | 68 (10.4%) |
Time of Departure to Work by Sex in Columbus
The most frequent times of departure to work in Columbus are 5:00 AM to 5:29 AM (190, 22.4%) for males and 12:00 AM to 4:59 AM (174, 26.7%) for females.
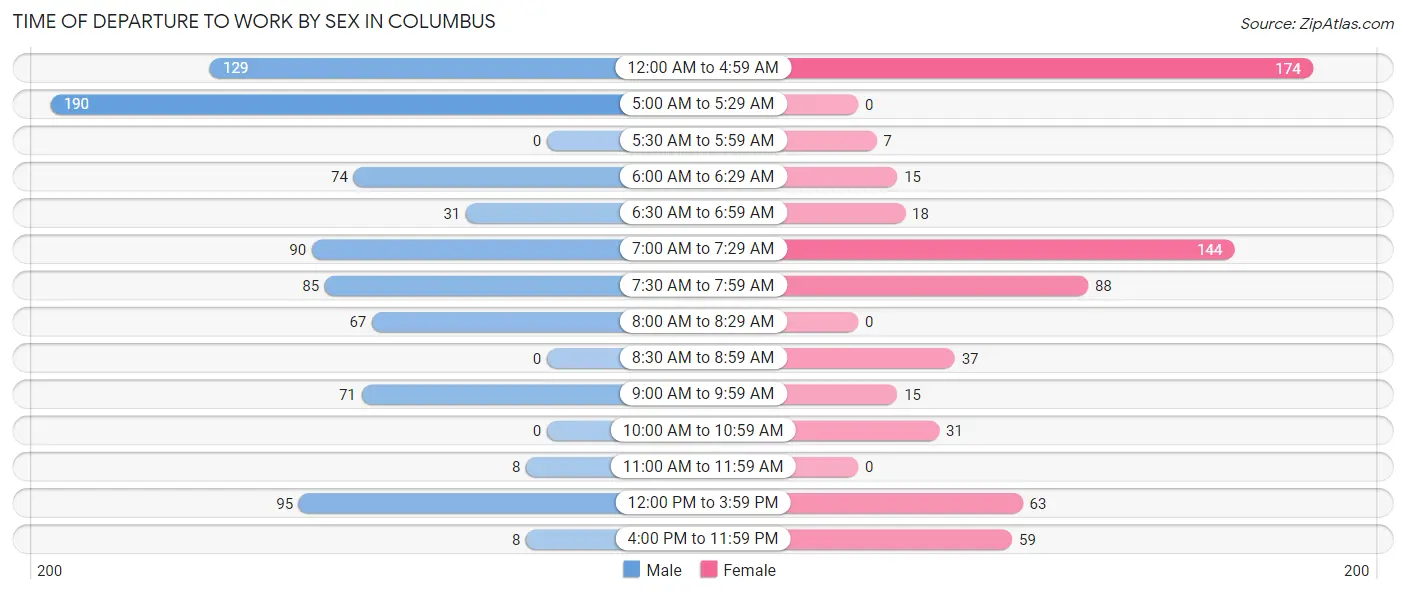
| Time of Departure | Male | Female |
| 12:00 AM to 4:59 AM | 129 (15.2%) | 174 (26.7%) |
| 5:00 AM to 5:29 AM | 190 (22.4%) | 0 (0.0%) |
| 5:30 AM to 5:59 AM | 0 (0.0%) | 7 (1.1%) |
| 6:00 AM to 6:29 AM | 74 (8.7%) | 15 (2.3%) |
| 6:30 AM to 6:59 AM | 31 (3.7%) | 18 (2.8%) |
| 7:00 AM to 7:29 AM | 90 (10.6%) | 144 (22.1%) |
| 7:30 AM to 7:59 AM | 85 (10.0%) | 88 (13.5%) |
| 8:00 AM to 8:29 AM | 67 (7.9%) | 0 (0.0%) |
| 8:30 AM to 8:59 AM | 0 (0.0%) | 37 (5.7%) |
| 9:00 AM to 9:59 AM | 71 (8.4%) | 15 (2.3%) |
| 10:00 AM to 10:59 AM | 0 (0.0%) | 31 (4.8%) |
| 11:00 AM to 11:59 AM | 8 (0.9%) | 0 (0.0%) |
| 12:00 PM to 3:59 PM | 95 (11.2%) | 63 (9.7%) |
| 4:00 PM to 11:59 PM | 8 (0.9%) | 59 (9.1%) |
| Total | 848 (100.0%) | 651 (100.0%) |
Housing Occupancy in Columbus
Occupancy by Ownership in Columbus
Of the total 1,443 dwellings in Columbus, owner-occupied units account for 1,071 (74.2%), while renter-occupied units make up 372 (25.8%).
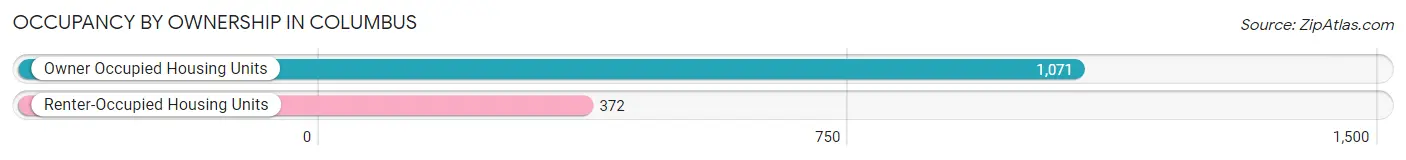
| Occupancy | # Housing Units | % Housing Units |
| Owner Occupied Housing Units | 1,071 | 74.2% |
| Renter-Occupied Housing Units | 372 | 25.8% |
| Total Occupied Housing Units | 1,443 | 100.0% |
Occupancy by Household Size in Columbus
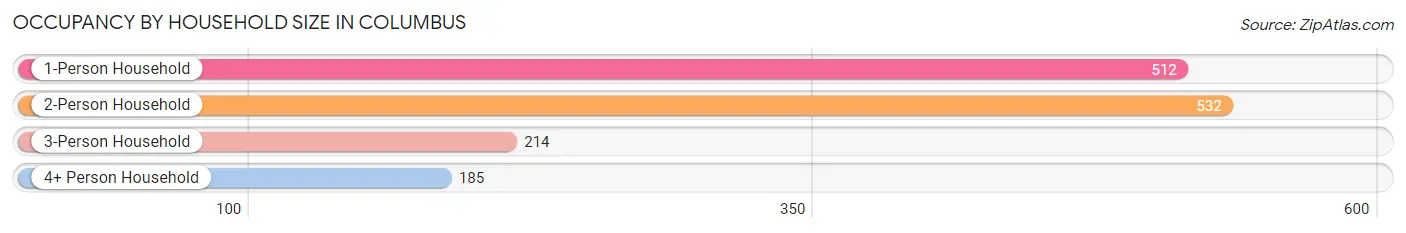
| Household Size | # Housing Units | % Housing Units |
| 1-Person Household | 512 | 35.5% |
| 2-Person Household | 532 | 36.9% |
| 3-Person Household | 214 | 14.8% |
| 4+ Person Household | 185 | 12.8% |
| Total Housing Units | 1,443 | 100.0% |
Occupancy by Ownership by Household Size in Columbus
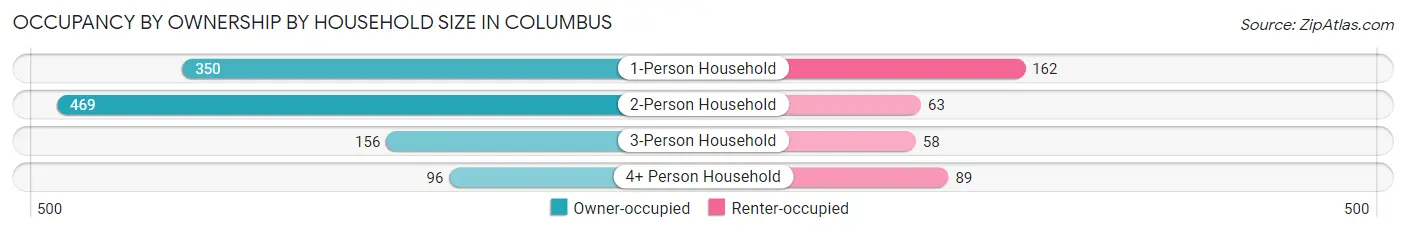
| Household Size | Owner-occupied | Renter-occupied |
| 1-Person Household | 350 (68.4%) | 162 (31.6%) |
| 2-Person Household | 469 (88.2%) | 63 (11.8%) |
| 3-Person Household | 156 (72.9%) | 58 (27.1%) |
| 4+ Person Household | 96 (51.9%) | 89 (48.1%) |
| Total Housing Units | 1,071 (74.2%) | 372 (25.8%) |
Occupancy by Educational Attainment in Columbus
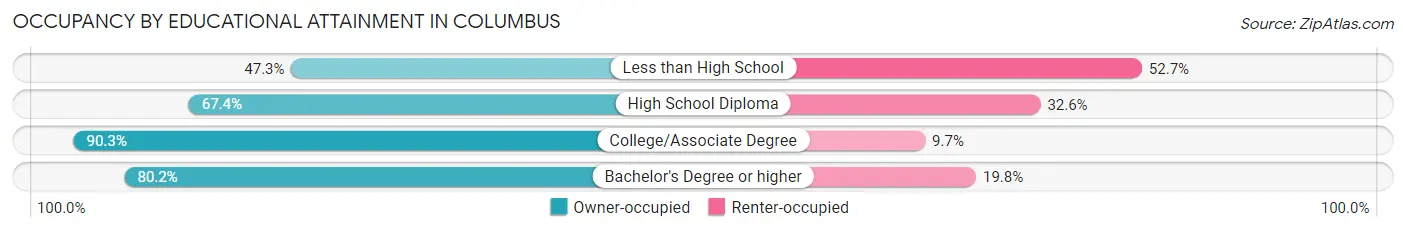
| Household Size | Owner-occupied | Renter-occupied |
| Less than High School | 79 (47.3%) | 88 (52.7%) |
| High School Diploma | 352 (67.4%) | 170 (32.6%) |
| College/Associate Degree | 316 (90.3%) | 34 (9.7%) |
| Bachelor's Degree or higher | 324 (80.2%) | 80 (19.8%) |
Occupancy by Age of Householder in Columbus
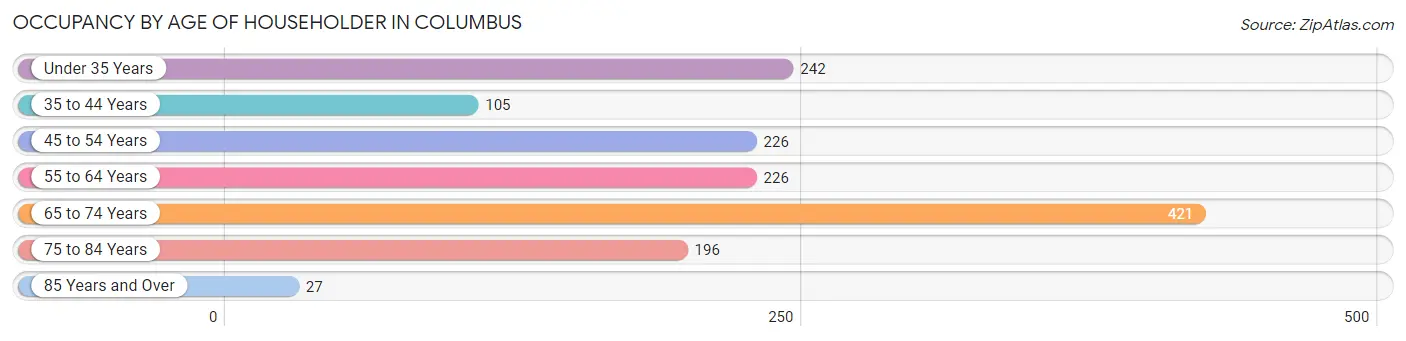
| Age Bracket | # Households | % Households |
| Under 35 Years | 242 | 16.8% |
| 35 to 44 Years | 105 | 7.3% |
| 45 to 54 Years | 226 | 15.7% |
| 55 to 64 Years | 226 | 15.7% |
| 65 to 74 Years | 421 | 29.2% |
| 75 to 84 Years | 196 | 13.6% |
| 85 Years and Over | 27 | 1.9% |
| Total | 1,443 | 100.0% |
Housing Finances in Columbus
Median Income by Occupancy in Columbus
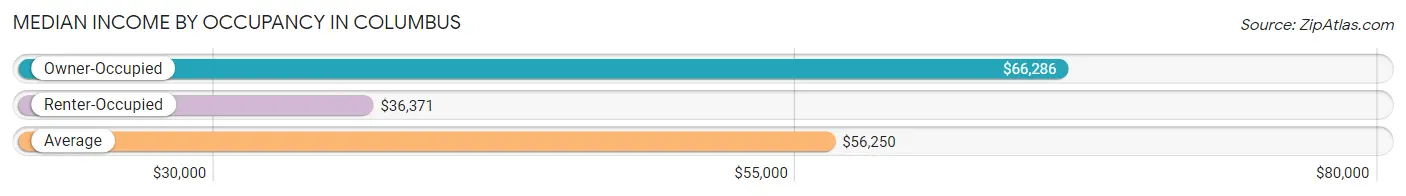
| Occupancy Type | # Households | Median Income |
| Owner-Occupied | 1,071 (74.2%) | $66,286 |
| Renter-Occupied | 372 (25.8%) | $36,371 |
| Average | 1,443 (100.0%) | $56,250 |
Occupancy by Householder Income Bracket in Columbus
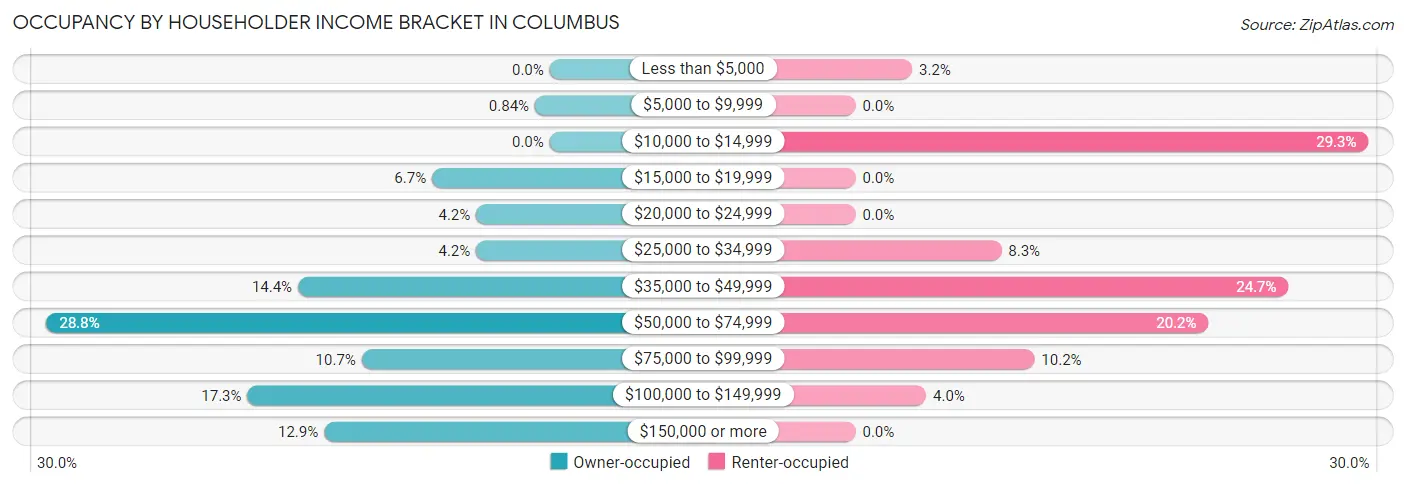
| Income Bracket | Owner-occupied | Renter-occupied |
| Less than $5,000 | 0 (0.0%) | 12 (3.2%) |
| $5,000 to $9,999 | 9 (0.8%) | 0 (0.0%) |
| $10,000 to $14,999 | 0 (0.0%) | 109 (29.3%) |
| $15,000 to $19,999 | 72 (6.7%) | 0 (0.0%) |
| $20,000 to $24,999 | 45 (4.2%) | 0 (0.0%) |
| $25,000 to $34,999 | 45 (4.2%) | 31 (8.3%) |
| $35,000 to $49,999 | 154 (14.4%) | 92 (24.7%) |
| $50,000 to $74,999 | 308 (28.8%) | 75 (20.2%) |
| $75,000 to $99,999 | 115 (10.7%) | 38 (10.2%) |
| $100,000 to $149,999 | 185 (17.3%) | 15 (4.0%) |
| $150,000 or more | 138 (12.9%) | 0 (0.0%) |
| Total | 1,071 (100.0%) | 372 (100.0%) |
Monthly Housing Cost Tiers in Columbus
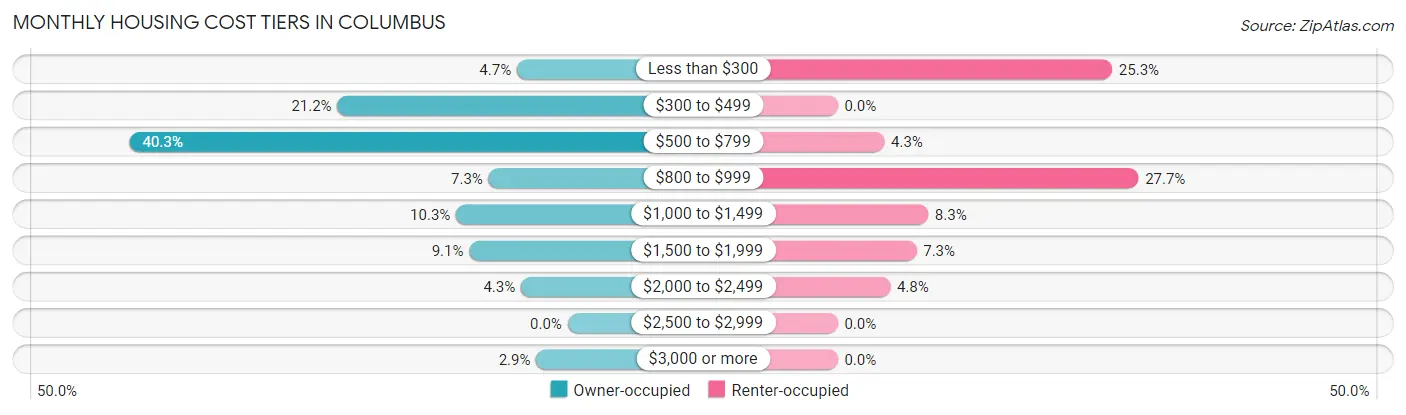
| Monthly Cost | Owner-occupied | Renter-occupied |
| Less than $300 | 50 (4.7%) | 94 (25.3%) |
| $300 to $499 | 227 (21.2%) | 0 (0.0%) |
| $500 to $799 | 432 (40.3%) | 16 (4.3%) |
| $800 to $999 | 78 (7.3%) | 103 (27.7%) |
| $1,000 to $1,499 | 110 (10.3%) | 31 (8.3%) |
| $1,500 to $1,999 | 97 (9.1%) | 27 (7.3%) |
| $2,000 to $2,499 | 46 (4.3%) | 18 (4.8%) |
| $2,500 to $2,999 | 0 (0.0%) | 0 (0.0%) |
| $3,000 or more | 31 (2.9%) | 0 (0.0%) |
| Total | 1,071 (100.0%) | 372 (100.0%) |
Physical Housing Characteristics in Columbus
Housing Structures in Columbus
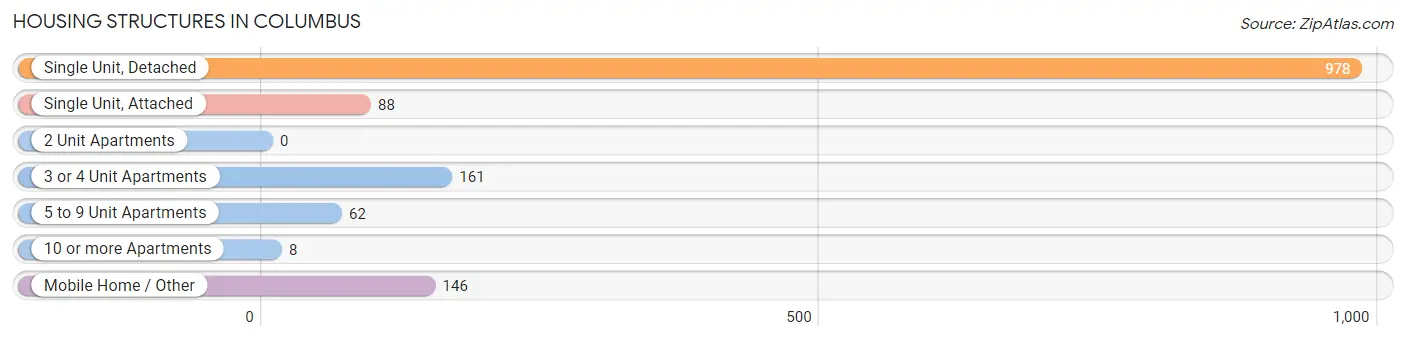
| Structure Type | # Housing Units | % Housing Units |
| Single Unit, Detached | 978 | 67.8% |
| Single Unit, Attached | 88 | 6.1% |
| 2 Unit Apartments | 0 | 0.0% |
| 3 or 4 Unit Apartments | 161 | 11.2% |
| 5 to 9 Unit Apartments | 62 | 4.3% |
| 10 or more Apartments | 8 | 0.5% |
| Mobile Home / Other | 146 | 10.1% |
| Total | 1,443 | 100.0% |
Housing Structures by Occupancy in Columbus
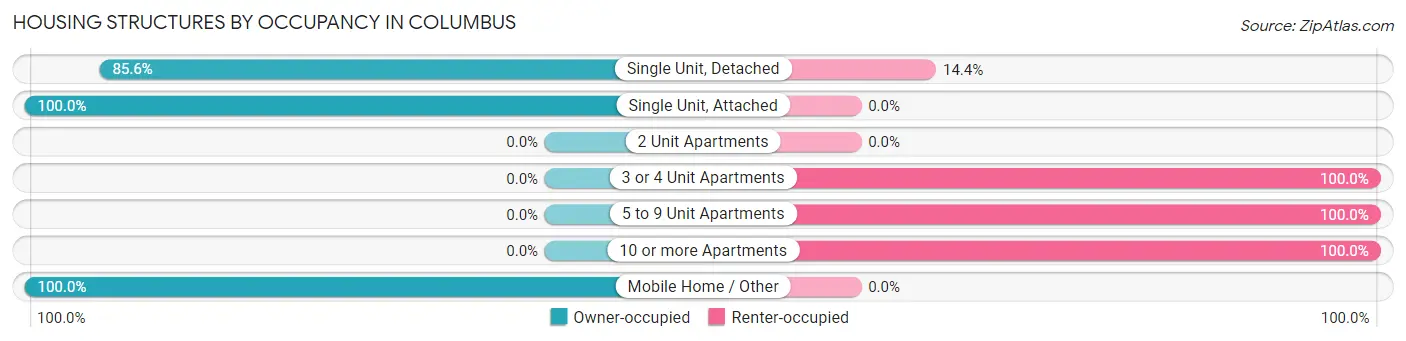
| Structure Type | Owner-occupied | Renter-occupied |
| Single Unit, Detached | 837 (85.6%) | 141 (14.4%) |
| Single Unit, Attached | 88 (100.0%) | 0 (0.0%) |
| 2 Unit Apartments | 0 (0.0%) | 0 (0.0%) |
| 3 or 4 Unit Apartments | 0 (0.0%) | 161 (100.0%) |
| 5 to 9 Unit Apartments | 0 (0.0%) | 62 (100.0%) |
| 10 or more Apartments | 0 (0.0%) | 8 (100.0%) |
| Mobile Home / Other | 146 (100.0%) | 0 (0.0%) |
| Total | 1,071 (74.2%) | 372 (25.8%) |
Housing Structures by Number of Rooms in Columbus
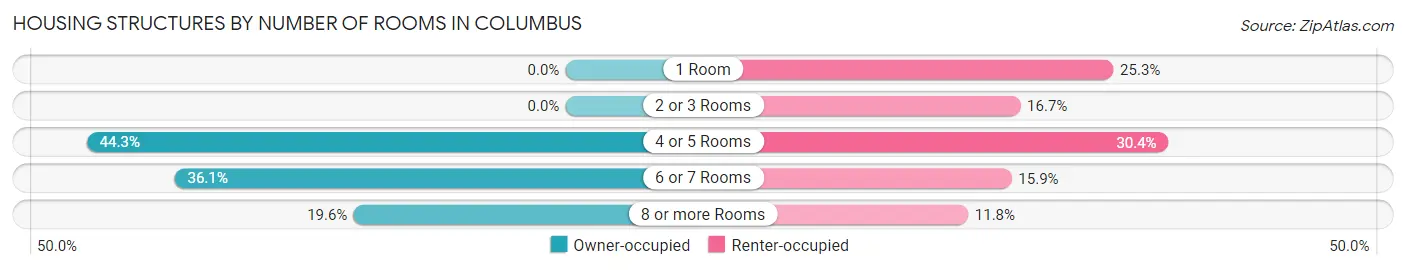
| Number of Rooms | Owner-occupied | Renter-occupied |
| 1 Room | 0 (0.0%) | 94 (25.3%) |
| 2 or 3 Rooms | 0 (0.0%) | 62 (16.7%) |
| 4 or 5 Rooms | 474 (44.3%) | 113 (30.4%) |
| 6 or 7 Rooms | 387 (36.1%) | 59 (15.9%) |
| 8 or more Rooms | 210 (19.6%) | 44 (11.8%) |
| Total | 1,071 (100.0%) | 372 (100.0%) |
Housing Structure by Heating Type in Columbus
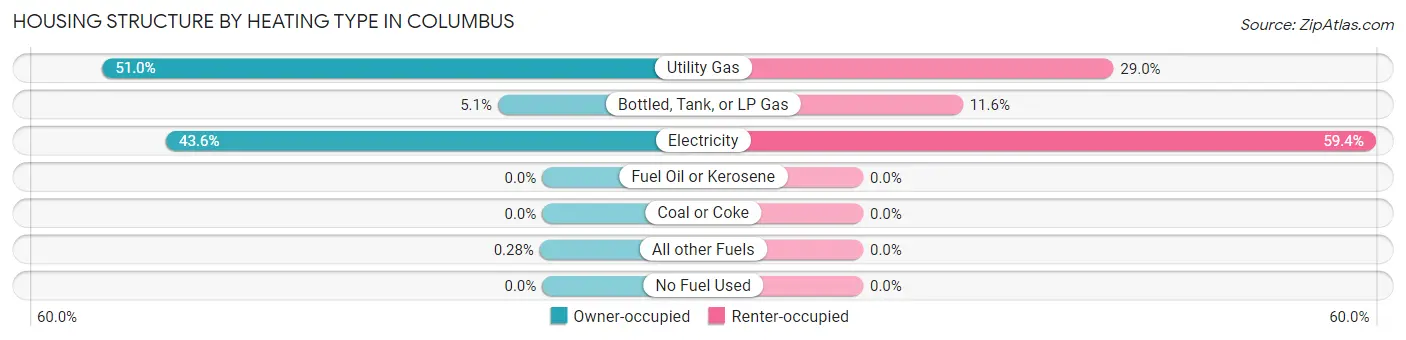
| Heating Type | Owner-occupied | Renter-occupied |
| Utility Gas | 546 (51.0%) | 108 (29.0%) |
| Bottled, Tank, or LP Gas | 55 (5.1%) | 43 (11.6%) |
| Electricity | 467 (43.6%) | 221 (59.4%) |
| Fuel Oil or Kerosene | 0 (0.0%) | 0 (0.0%) |
| Coal or Coke | 0 (0.0%) | 0 (0.0%) |
| All other Fuels | 3 (0.3%) | 0 (0.0%) |
| No Fuel Used | 0 (0.0%) | 0 (0.0%) |
| Total | 1,071 (100.0%) | 372 (100.0%) |
Household Vehicle Usage in Columbus
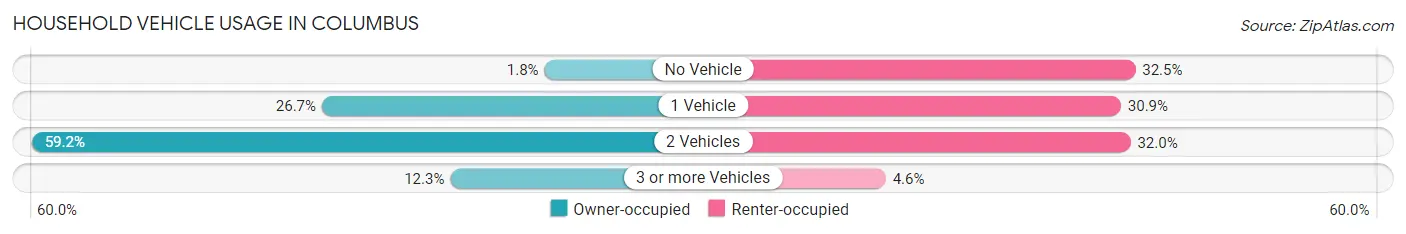
| Vehicles per Household | Owner-occupied | Renter-occupied |
| No Vehicle | 19 (1.8%) | 121 (32.5%) |
| 1 Vehicle | 286 (26.7%) | 115 (30.9%) |
| 2 Vehicles | 634 (59.2%) | 119 (32.0%) |
| 3 or more Vehicles | 132 (12.3%) | 17 (4.6%) |
| Total | 1,071 (100.0%) | 372 (100.0%) |
Real Estate & Mortgages in Columbus
Real Estate and Mortgage Overview in Columbus
| Characteristic | Without Mortgage | With Mortgage |
| Housing Units | 810 | 261 |
| Median Property Value | $193,500 | $322,300 |
| Median Household Income | $59,419 | $80 |
| Monthly Housing Costs | $591 | $31 |
| Real Estate Taxes | $2,495 | $0 |
Property Value by Mortgage Status in Columbus
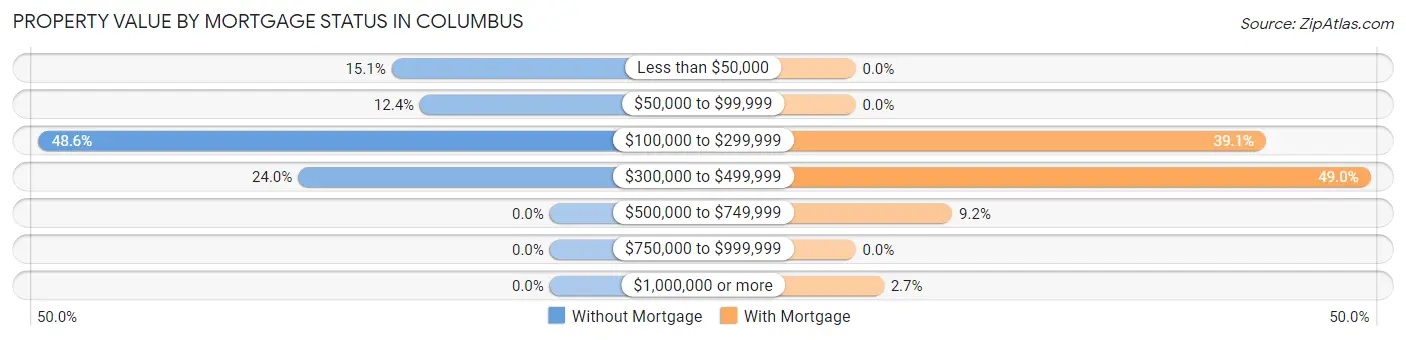
| Property Value | Without Mortgage | With Mortgage |
| Less than $50,000 | 122 (15.1%) | 0 (0.0%) |
| $50,000 to $99,999 | 100 (12.3%) | 0 (0.0%) |
| $100,000 to $299,999 | 394 (48.6%) | 102 (39.1%) |
| $300,000 to $499,999 | 194 (23.9%) | 128 (49.0%) |
| $500,000 to $749,999 | 0 (0.0%) | 24 (9.2%) |
| $750,000 to $999,999 | 0 (0.0%) | 0 (0.0%) |
| $1,000,000 or more | 0 (0.0%) | 7 (2.7%) |
| Total | 810 (100.0%) | 261 (100.0%) |
Household Income by Mortgage Status in Columbus
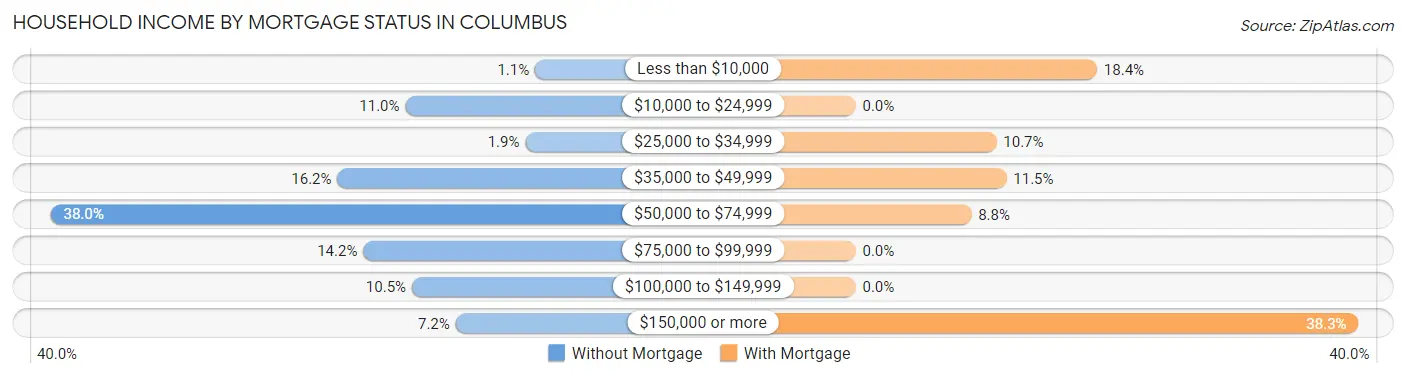
| Household Income | Without Mortgage | With Mortgage |
| Less than $10,000 | 9 (1.1%) | 48 (18.4%) |
| $10,000 to $24,999 | 89 (11.0%) | 0 (0.0%) |
| $25,000 to $34,999 | 15 (1.8%) | 28 (10.7%) |
| $35,000 to $49,999 | 131 (16.2%) | 30 (11.5%) |
| $50,000 to $74,999 | 308 (38.0%) | 23 (8.8%) |
| $75,000 to $99,999 | 115 (14.2%) | 0 (0.0%) |
| $100,000 to $149,999 | 85 (10.5%) | 0 (0.0%) |
| $150,000 or more | 58 (7.2%) | 100 (38.3%) |
| Total | 810 (100.0%) | 261 (100.0%) |
Property Value to Household Income Ratio in Columbus
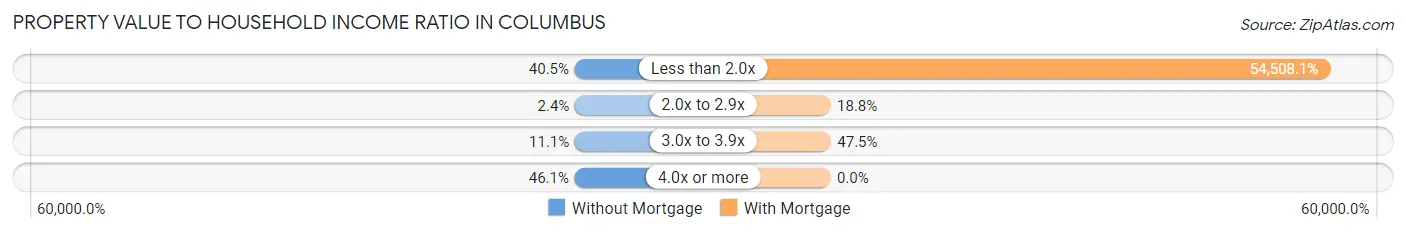
| Value-to-Income Ratio | Without Mortgage | With Mortgage |
| Less than 2.0x | 328 (40.5%) | 142,266 (54,508.1%) |
| 2.0x to 2.9x | 19 (2.4%) | 49 (18.8%) |
| 3.0x to 3.9x | 90 (11.1%) | 124 (47.5%) |
| 4.0x or more | 373 (46.1%) | 0 (0.0%) |
| Total | 810 (100.0%) | 261 (100.0%) |
Real Estate Taxes by Mortgage Status in Columbus
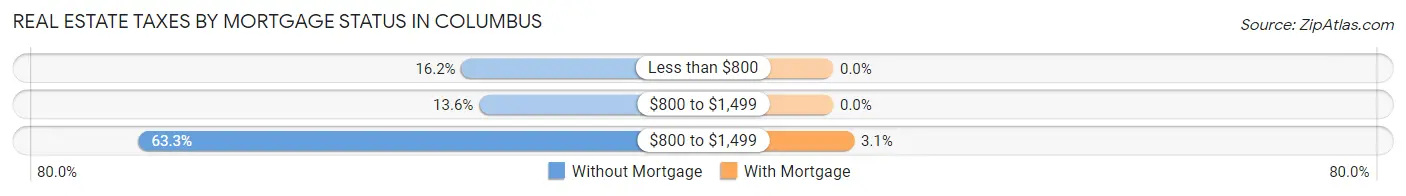
| Property Taxes | Without Mortgage | With Mortgage |
| Less than $800 | 131 (16.2%) | 0 (0.0%) |
| $800 to $1,499 | 110 (13.6%) | 0 (0.0%) |
| $800 to $1,499 | 513 (63.3%) | 8 (3.1%) |
| Total | 810 (100.0%) | 261 (100.0%) |
Health & Disability in Columbus
Health Insurance Coverage by Age in Columbus
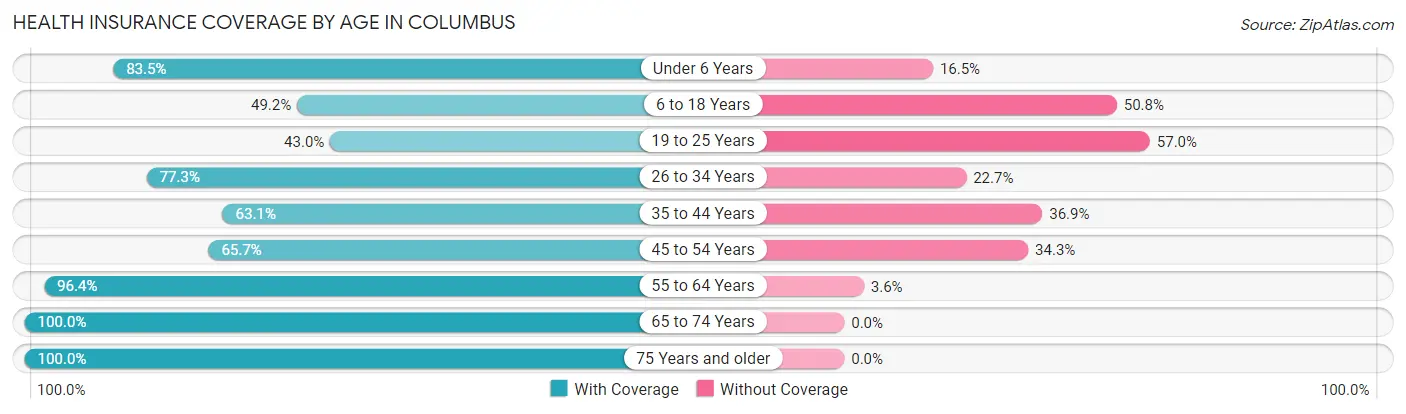
| Age Bracket | With Coverage | Without Coverage |
| Under 6 Years | 202 (83.5%) | 40 (16.5%) |
| 6 to 18 Years | 212 (49.2%) | 219 (50.8%) |
| 19 to 25 Years | 185 (43.0%) | 245 (57.0%) |
| 26 to 34 Years | 282 (77.3%) | 83 (22.7%) |
| 35 to 44 Years | 111 (63.1%) | 65 (36.9%) |
| 45 to 54 Years | 230 (65.7%) | 120 (34.3%) |
| 55 to 64 Years | 503 (96.4%) | 19 (3.6%) |
| 65 to 74 Years | 535 (100.0%) | 0 (0.0%) |
| 75 Years and older | 376 (100.0%) | 0 (0.0%) |
| Total | 2,636 (76.9%) | 791 (23.1%) |
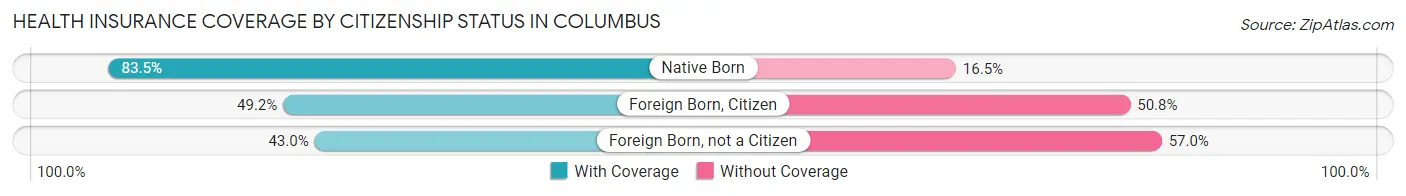
Health Insurance Coverage by Citizenship Status in Columbus
| Citizenship Status | With Coverage | Without Coverage |
| Native Born | 202 (83.5%) | 40 (16.5%) |
| Foreign Born, Citizen | 212 (49.2%) | 219 (50.8%) |
| Foreign Born, not a Citizen | 185 (43.0%) | 245 (57.0%) |
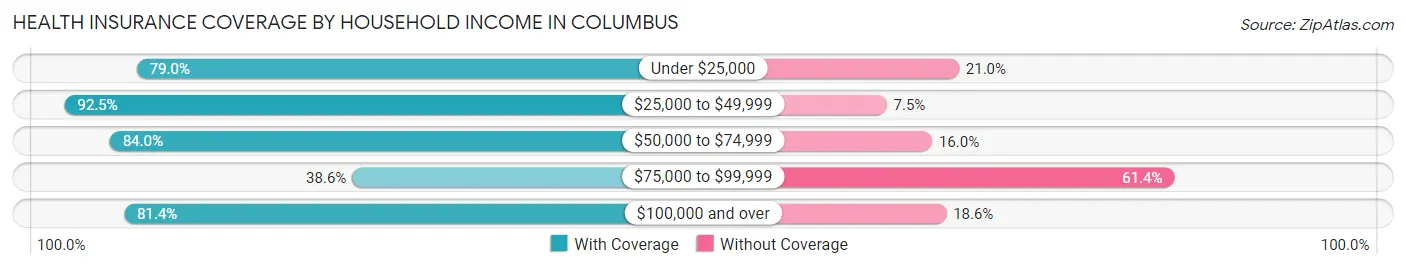
Health Insurance Coverage by Household Income in Columbus
| Household Income | With Coverage | Without Coverage |
| Under $25,000 | 320 (79.0%) | 85 (21.0%) |
| $25,000 to $49,999 | 757 (92.5%) | 61 (7.5%) |
| $50,000 to $74,999 | 516 (84.0%) | 98 (16.0%) |
| $75,000 to $99,999 | 226 (38.6%) | 359 (61.4%) |
| $100,000 and over | 813 (81.4%) | 186 (18.6%) |
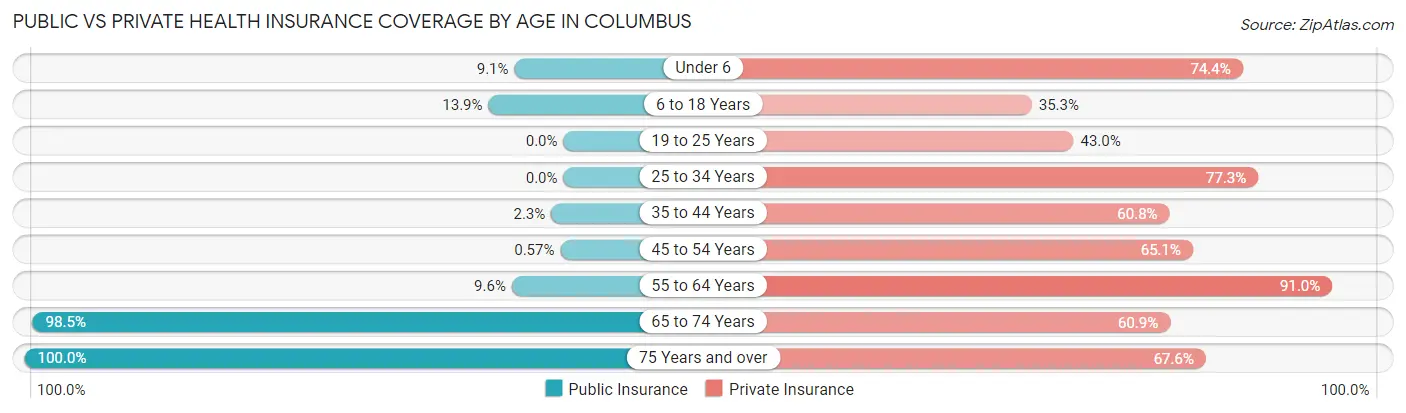
Public vs Private Health Insurance Coverage by Age in Columbus
| Age Bracket | Public Insurance | Private Insurance |
| Under 6 | 22 (9.1%) | 180 (74.4%) |
| 6 to 18 Years | 60 (13.9%) | 152 (35.3%) |
| 19 to 25 Years | 0 (0.0%) | 185 (43.0%) |
| 25 to 34 Years | 0 (0.0%) | 282 (77.3%) |
| 35 to 44 Years | 4 (2.3%) | 107 (60.8%) |
| 45 to 54 Years | 2 (0.6%) | 228 (65.1%) |
| 55 to 64 Years | 50 (9.6%) | 475 (91.0%) |
| 65 to 74 Years | 527 (98.5%) | 326 (60.9%) |
| 75 Years and over | 376 (100.0%) | 254 (67.5%) |
| Total | 1,041 (30.4%) | 2,189 (63.9%) |
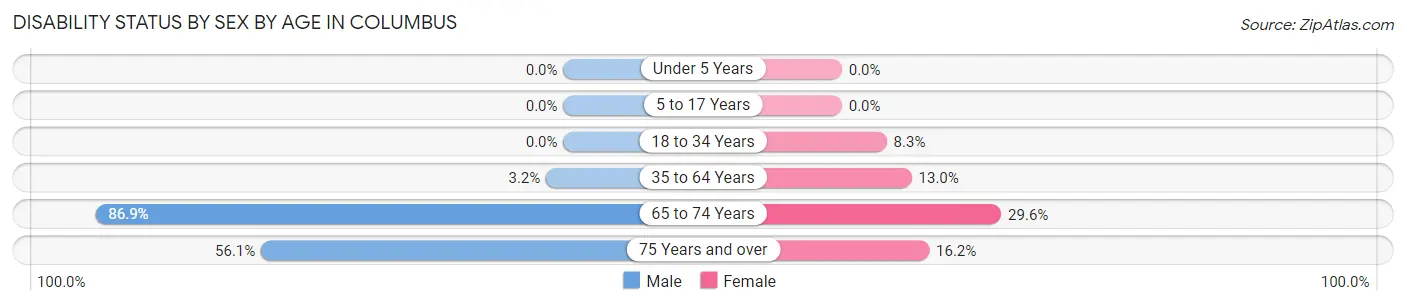
Disability Status by Sex by Age in Columbus
| Age Bracket | Male | Female |
| Under 5 Years | 0 (0.0%) | 0 (0.0%) |
| 5 to 17 Years | 0 (0.0%) | 0 (0.0%) |
| 18 to 34 Years | 0 (0.0%) | 30 (8.3%) |
| 35 to 64 Years | 17 (3.2%) | 67 (13.0%) |
| 65 to 74 Years | 218 (86.9%) | 84 (29.6%) |
| 75 Years and over | 69 (56.1%) | 41 (16.2%) |
Disability Class by Sex by Age in Columbus
Disability Class: Hearing Difficulty
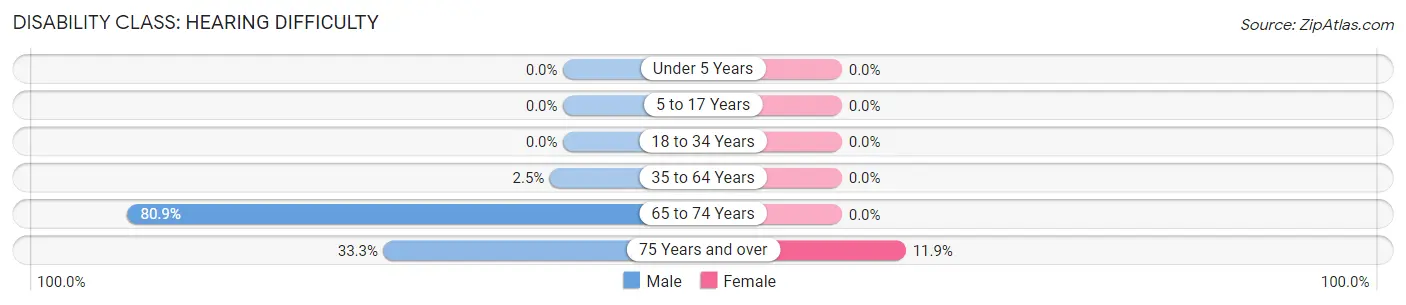
| Age Bracket | Male | Female |
| Under 5 Years | 0 (0.0%) | 0 (0.0%) |
| 5 to 17 Years | 0 (0.0%) | 0 (0.0%) |
| 18 to 34 Years | 0 (0.0%) | 0 (0.0%) |
| 35 to 64 Years | 13 (2.5%) | 0 (0.0%) |
| 65 to 74 Years | 203 (80.9%) | 0 (0.0%) |
| 75 Years and over | 41 (33.3%) | 30 (11.9%) |
Disability Class: Vision Difficulty
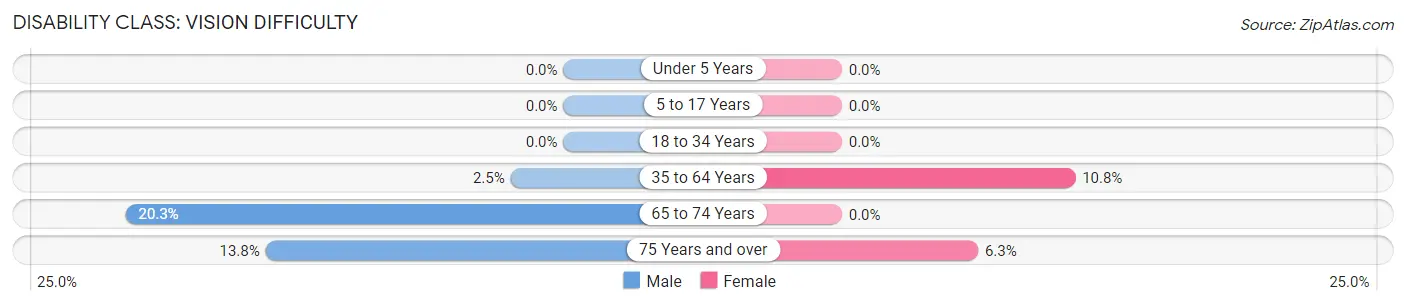
| Age Bracket | Male | Female |
| Under 5 Years | 0 (0.0%) | 0 (0.0%) |
| 5 to 17 Years | 0 (0.0%) | 0 (0.0%) |
| 18 to 34 Years | 0 (0.0%) | 0 (0.0%) |
| 35 to 64 Years | 13 (2.5%) | 56 (10.8%) |
| 65 to 74 Years | 51 (20.3%) | 0 (0.0%) |
| 75 Years and over | 17 (13.8%) | 16 (6.3%) |
Disability Class: Cognitive Difficulty
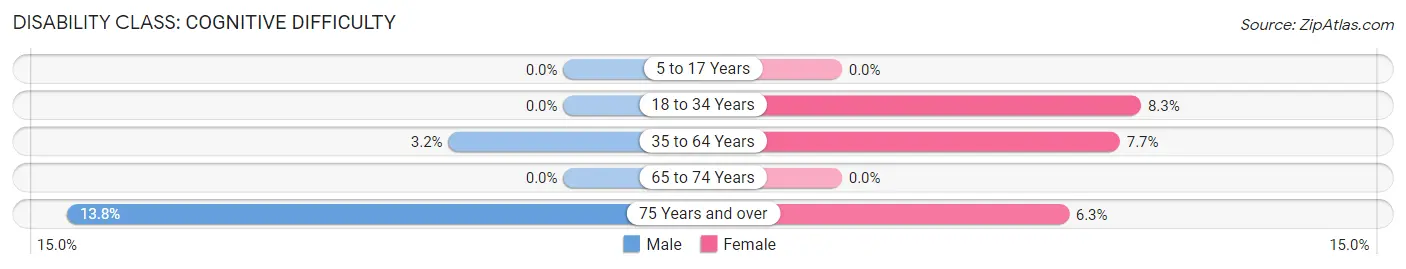
| Age Bracket | Male | Female |
| 5 to 17 Years | 0 (0.0%) | 0 (0.0%) |
| 18 to 34 Years | 0 (0.0%) | 30 (8.3%) |
| 35 to 64 Years | 17 (3.2%) | 40 (7.7%) |
| 65 to 74 Years | 0 (0.0%) | 0 (0.0%) |
| 75 Years and over | 17 (13.8%) | 16 (6.3%) |
Disability Class: Ambulatory Difficulty
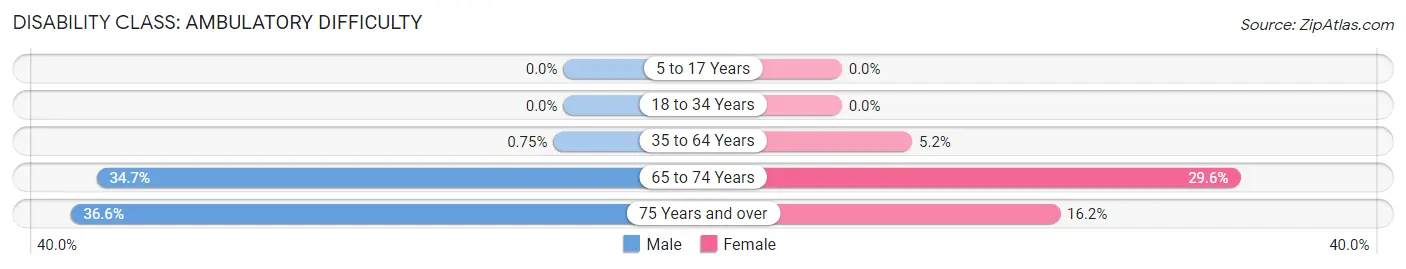
| Age Bracket | Male | Female |
| 5 to 17 Years | 0 (0.0%) | 0 (0.0%) |
| 18 to 34 Years | 0 (0.0%) | 0 (0.0%) |
| 35 to 64 Years | 4 (0.7%) | 27 (5.2%) |
| 65 to 74 Years | 87 (34.7%) | 84 (29.6%) |
| 75 Years and over | 45 (36.6%) | 41 (16.2%) |
Disability Class: Self-Care Difficulty
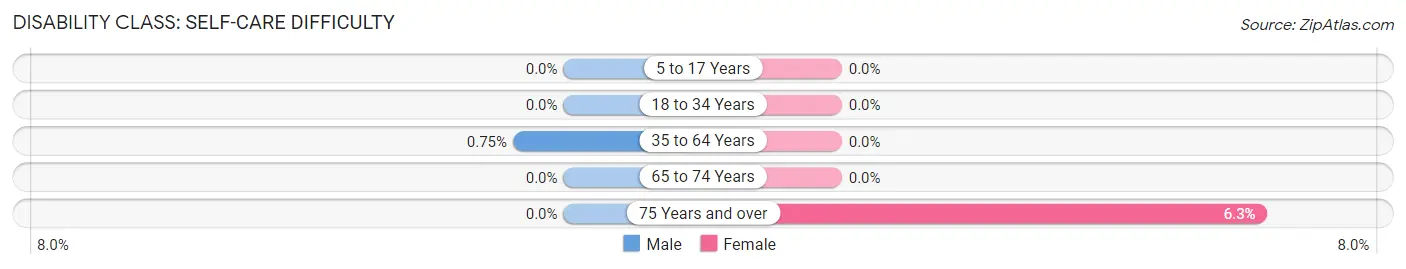
| Age Bracket | Male | Female |
| 5 to 17 Years | 0 (0.0%) | 0 (0.0%) |
| 18 to 34 Years | 0 (0.0%) | 0 (0.0%) |
| 35 to 64 Years | 4 (0.7%) | 0 (0.0%) |
| 65 to 74 Years | 0 (0.0%) | 0 (0.0%) |
| 75 Years and over | 0 (0.0%) | 16 (6.3%) |
Technology Access in Columbus
Computing Device Access in Columbus
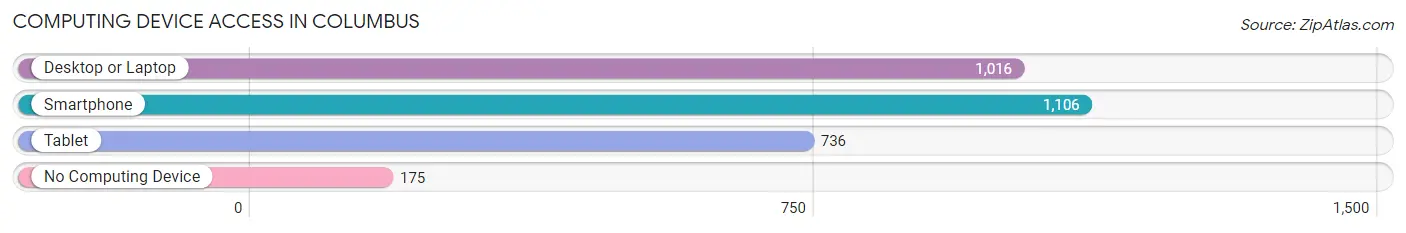
| Device Type | # Households | % Households |
| Desktop or Laptop | 1,016 | 70.4% |
| Smartphone | 1,106 | 76.6% |
| Tablet | 736 | 51.0% |
| No Computing Device | 175 | 12.1% |
| Total | 1,443 | 100.0% |
Internet Access in Columbus
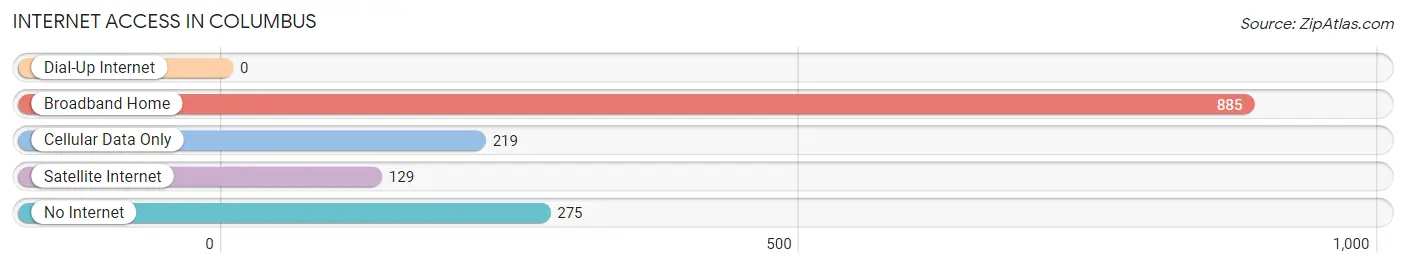
| Internet Type | # Households | % Households |
| Dial-Up Internet | 0 | 0.0% |
| Broadband Home | 885 | 61.3% |
| Cellular Data Only | 219 | 15.2% |
| Satellite Internet | 129 | 8.9% |
| No Internet | 275 | 19.1% |
| Total | 1,443 | 100.0% |
Columbus Summary
Columbus, Texas is a small city located in Colorado County, Texas, United States. It is situated on the Colorado River, about halfway between Houston and San Antonio. The city has a population of 3,655 as of the 2010 census.
History
The area around Columbus was first settled in 1821 by Stephen F. Austin and his colonists. The town was founded in 1837 and named after Christopher Columbus. It was the first county seat of Colorado County and was incorporated in 1837.
The city was a major port on the Colorado River and was a major center for cotton production. During the Civil War, the city was the site of a major battle between Confederate and Union forces. After the war, the city continued to grow and prosper, becoming a major center for trade and commerce.
Geography
Columbus is located at the intersection of Interstate 10 and US Highway 90, about halfway between Houston and San Antonio. The city is situated on the Colorado River, and is surrounded by rolling hills and woodlands. The climate is humid subtropical, with hot summers and mild winters.
Economy
The economy of Columbus is largely based on agriculture and manufacturing. The city is home to several large manufacturing plants, including a paper mill, a steel mill, and a plastics plant. The city is also home to several large agricultural operations, including a large cattle ranch and a large cotton farm.
The city is also home to several large retail stores, including Walmart, Target, and Home Depot. The city is also home to several restaurants, bars, and other businesses.
Demographics
As of the 2010 census, the population of Columbus was 3,655. The racial makeup of the city was 75.3% White, 17.2% African American, 0.4% Native American, 0.3% Asian, 0.1% Pacific Islander, 4.7% from other races, and 2.0% from two or more races. Hispanic or Latino of any race were 11.3% of the population.
The median income for a household in the city was $31,250, and the median income for a family was $37,500. The per capita income for the city was $17,845. About 17.2% of families and 20.3% of the population were below the poverty line, including 28.3% of those under age 18 and 11.2% of those age 65 or over.
Conclusion
Columbus, Texas is a small city located in Colorado County, Texas, United States. It is situated on the Colorado River, about halfway between Houston and San Antonio. The city has a population of 3,655 as of the 2010 census. The economy of Columbus is largely based on agriculture and manufacturing, and the city is home to several large retail stores, restaurants, and other businesses. The racial makeup of the city is 75.3% White, 17.2% African American, 0.4% Native American, 0.3% Asian, 0.1% Pacific Islander, 4.7% from other races, and 2.0% from two or more races. The median income for a household in the city was $31,250, and the median income for a family was $37,500.
Common Questions
What is Per Capita Income in Columbus?
Per Capita income in Columbus is $48,210.
What is the Median Family Income in Columbus?
Median Family Income in Columbus is $71,652.
What is the Median Household income in Columbus?
Median Household Income in Columbus is $56,250.
What is Income or Wage Gap in Columbus?
Income or Wage Gap in Columbus is 1.1%.
Women in Columbus earn 98.9 cents for every dollar earned by a man.
What is Inequality or Gini Index in Columbus?
Inequality or Gini Index in Columbus is 0.55.
What is the Total Population of Columbus?
Total Population of Columbus is 3,686.
What is the Total Male Population of Columbus?
Total Male Population of Columbus is 1,936.
What is the Total Female Population of Columbus?
Total Female Population of Columbus is 1,750.
What is the Ratio of Males per 100 Females in Columbus?
There are 110.63 Males per 100 Females in Columbus.
What is the Ratio of Females per 100 Males in Columbus?
There are 90.39 Females per 100 Males in Columbus.
What is the Median Population Age in Columbus?
Median Population Age in Columbus is 47.0 Years.
What is the Average Family Size in Columbus
Average Family Size in Columbus is 3.1 People.
What is the Average Household Size in Columbus
Average Household Size in Columbus is 2.4 People.
How Large is the Labor Force in Columbus?
There are 1,628 People in the Labor Forcein in Columbus.
What is the Percentage of People in the Labor Force in Columbus?
51.7% of People are in the Labor Force in Columbus.
What is the Unemployment Rate in Columbus?
Unemployment Rate in Columbus is 3.3%.