Pine Island, TX Map & Demographics
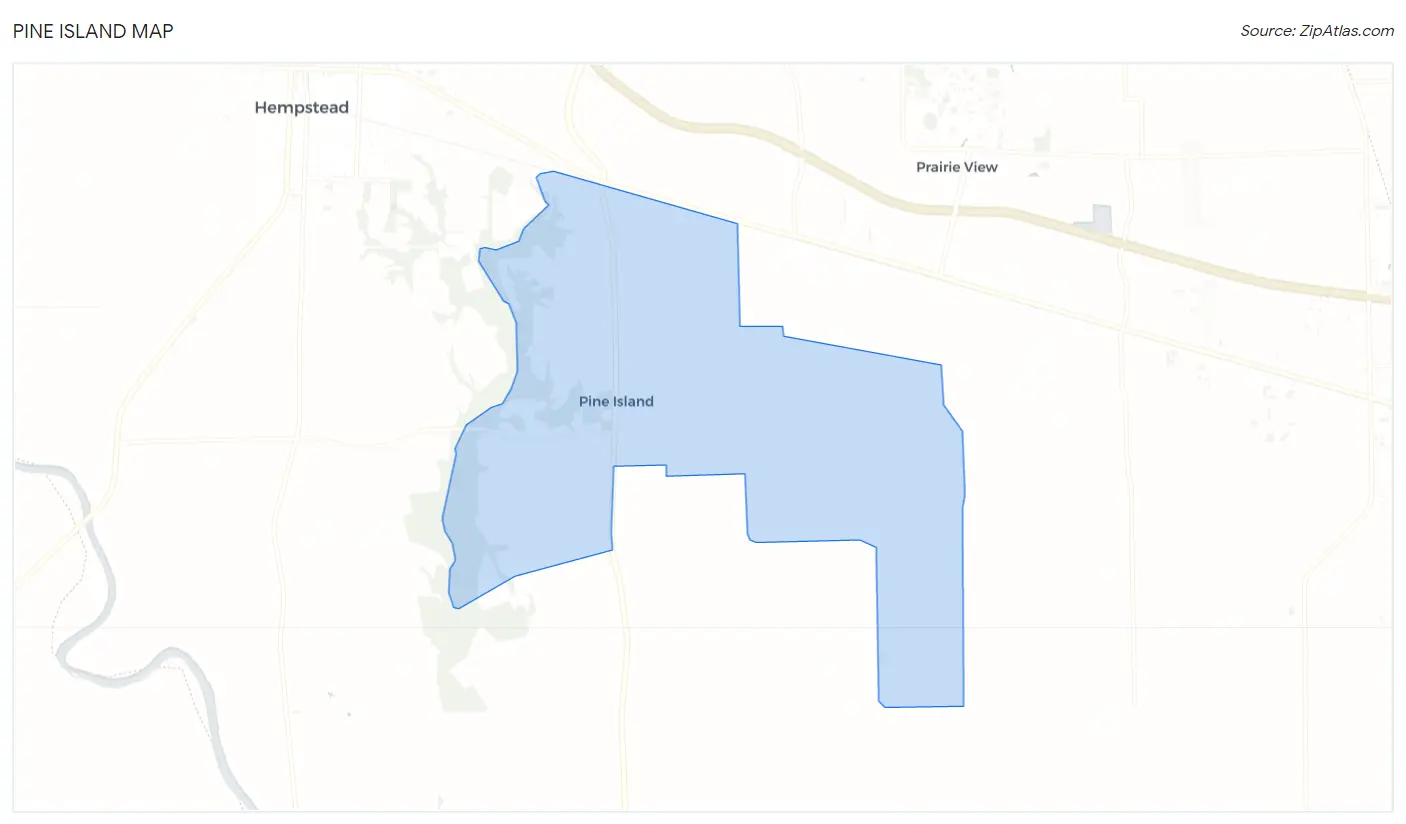
Pine Island Map
Pine Island Overview
$32,176
PER CAPITA INCOME
$82,625
AVG FAMILY INCOME
$49,784
AVG HOUSEHOLD INCOME
41.3%
WAGE / INCOME GAP [ % ]
58.7¢/ $1
WAGE / INCOME GAP [ $ ]
0.51
INEQUALITY / GINI INDEX
1,258
TOTAL POPULATION
654
MALE POPULATION
604
FEMALE POPULATION
108.28
MALES / 100 FEMALES
92.35
FEMALES / 100 MALES
41.4
MEDIAN AGE
3.5
AVG FAMILY SIZE
2.6
AVG HOUSEHOLD SIZE
414
LABOR FORCE [ PEOPLE ]
42.0%
PERCENT IN LABOR FORCE
5.8%
UNEMPLOYMENT RATE
Income in Pine Island
Income Overview in Pine Island
Per Capita Income in Pine Island is $32,176, while median incomes of families and households are $82,625 and $49,784 respectively.
| Characteristic | Number | Measure |
| Per Capita Income | 1,258 | $32,176 |
| Median Family Income | 279 | $82,625 |
| Mean Family Income | 279 | $125,905 |
| Median Household Income | 477 | $49,784 |
| Mean Household Income | 477 | $88,147 |
| Income Deficit | 279 | $0 |
| Wage / Income Gap (%) | 1,258 | 41.31% |
| Wage / Income Gap ($) | 1,258 | 58.69¢ per $1 |
| Gini / Inequality Index | 1,258 | 0.51 |
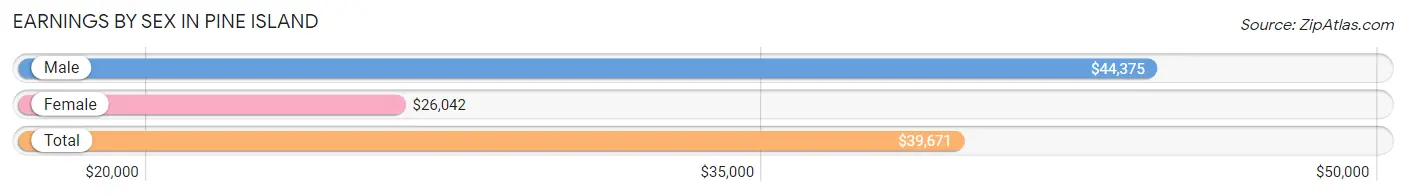
Earnings by Sex in Pine Island
Average Earnings in Pine Island are $39,671, $44,375 for men and $26,042 for women, a difference of 41.3%.
| Sex | Number | Average Earnings |
| Male | 292 (62.3%) | $44,375 |
| Female | 177 (37.7%) | $26,042 |
| Total | 469 (100.0%) | $39,671 |
Earnings by Sex by Income Bracket in Pine Island
The most common earnings brackets in Pine Island are $100,000+ for men (82 | 28.1%) and $100,000+ for women (37 | 20.9%).
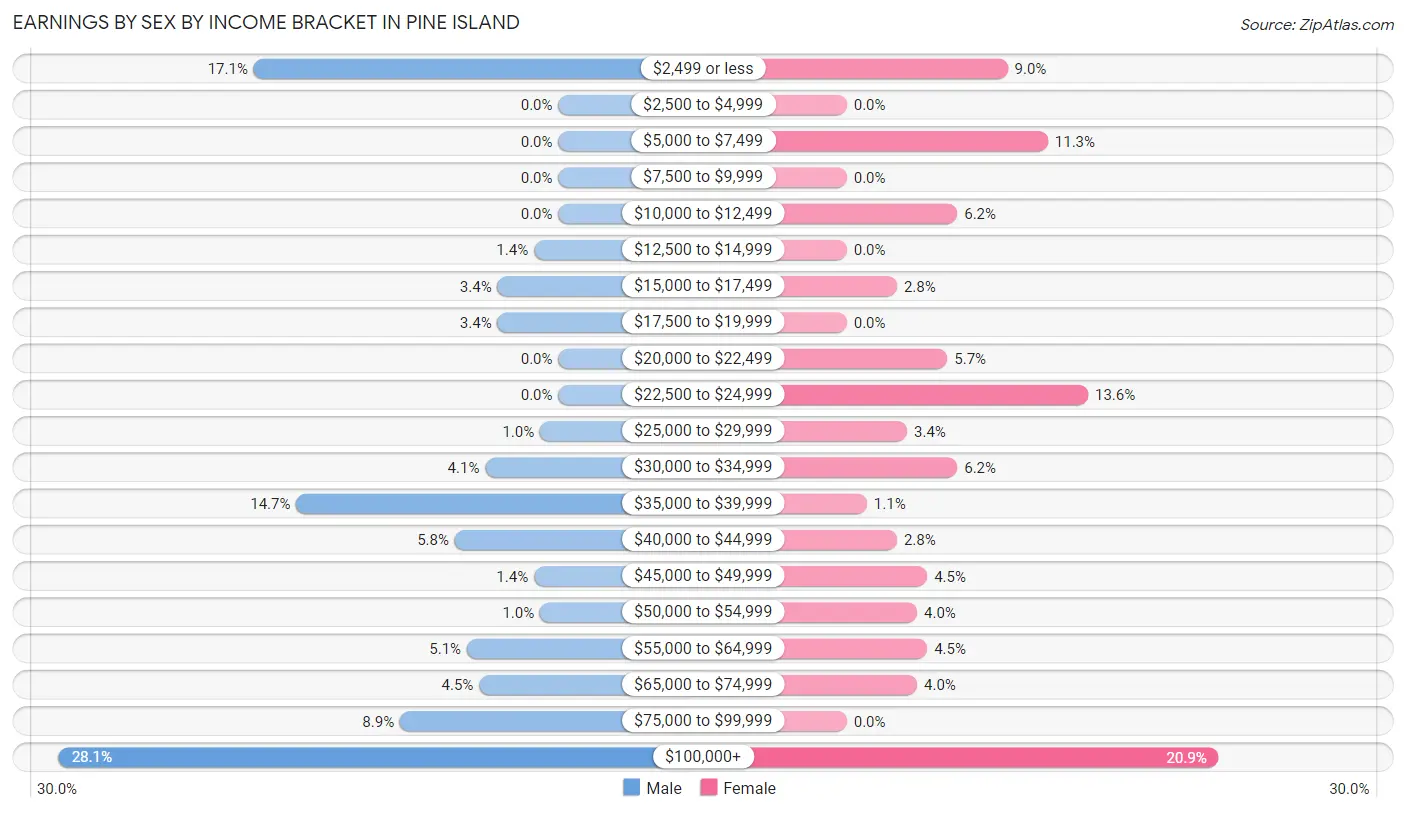
| Income | Male | Female |
| $2,499 or less | 50 (17.1%) | 16 (9.0%) |
| $2,500 to $4,999 | 0 (0.0%) | 0 (0.0%) |
| $5,000 to $7,499 | 0 (0.0%) | 20 (11.3%) |
| $7,500 to $9,999 | 0 (0.0%) | 0 (0.0%) |
| $10,000 to $12,499 | 0 (0.0%) | 11 (6.2%) |
| $12,500 to $14,999 | 4 (1.4%) | 0 (0.0%) |
| $15,000 to $17,499 | 10 (3.4%) | 5 (2.8%) |
| $17,500 to $19,999 | 10 (3.4%) | 0 (0.0%) |
| $20,000 to $22,499 | 0 (0.0%) | 10 (5.7%) |
| $22,500 to $24,999 | 0 (0.0%) | 24 (13.6%) |
| $25,000 to $29,999 | 3 (1.0%) | 6 (3.4%) |
| $30,000 to $34,999 | 12 (4.1%) | 11 (6.2%) |
| $35,000 to $39,999 | 43 (14.7%) | 2 (1.1%) |
| $40,000 to $44,999 | 17 (5.8%) | 5 (2.8%) |
| $45,000 to $49,999 | 4 (1.4%) | 8 (4.5%) |
| $50,000 to $54,999 | 3 (1.0%) | 7 (4.0%) |
| $55,000 to $64,999 | 15 (5.1%) | 8 (4.5%) |
| $65,000 to $74,999 | 13 (4.4%) | 7 (4.0%) |
| $75,000 to $99,999 | 26 (8.9%) | 0 (0.0%) |
| $100,000+ | 82 (28.1%) | 37 (20.9%) |
| Total | 292 (100.0%) | 177 (100.0%) |
Earnings by Sex by Educational Attainment in Pine Island
Average earnings in Pine Island are $55,192 for men and $34,205 for women, a difference of 38.0%. Men with an educational attainment of graduate degree enjoy the highest average annual earnings of $174,107, while those with high school diploma education earn the least with $38,971. Women with an educational attainment of college or associate's degree earn the most with the average annual earnings of $51,875, while those with college or associate's degree education have the smallest earnings of $51,875.
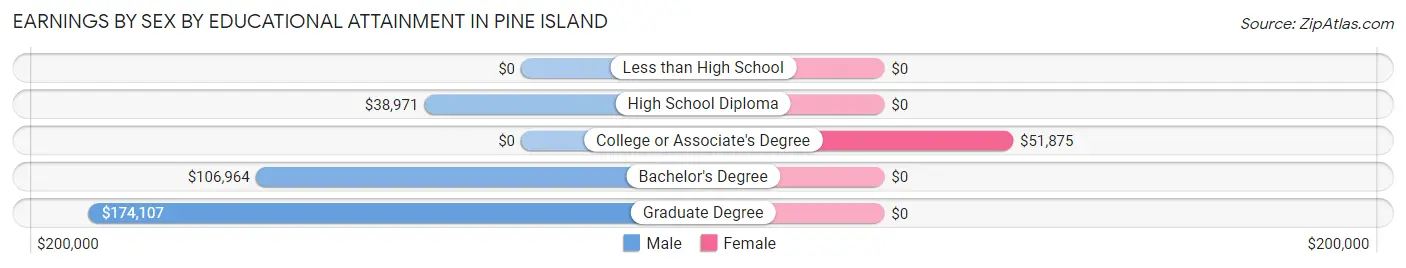
| Educational Attainment | Male Income | Female Income |
| Less than High School | - | - |
| High School Diploma | $38,971 | $0 |
| College or Associate's Degree | - | - |
| Bachelor's Degree | $106,964 | $0 |
| Graduate Degree | $174,107 | $0 |
| Total | $55,192 | $34,205 |
Family Income in Pine Island
Family Income Brackets in Pine Island
According to the Pine Island family income data, there are 71 families falling into the $35,000 to $49,999 income range, which is the most common income bracket and makes up 25.5% of all families.
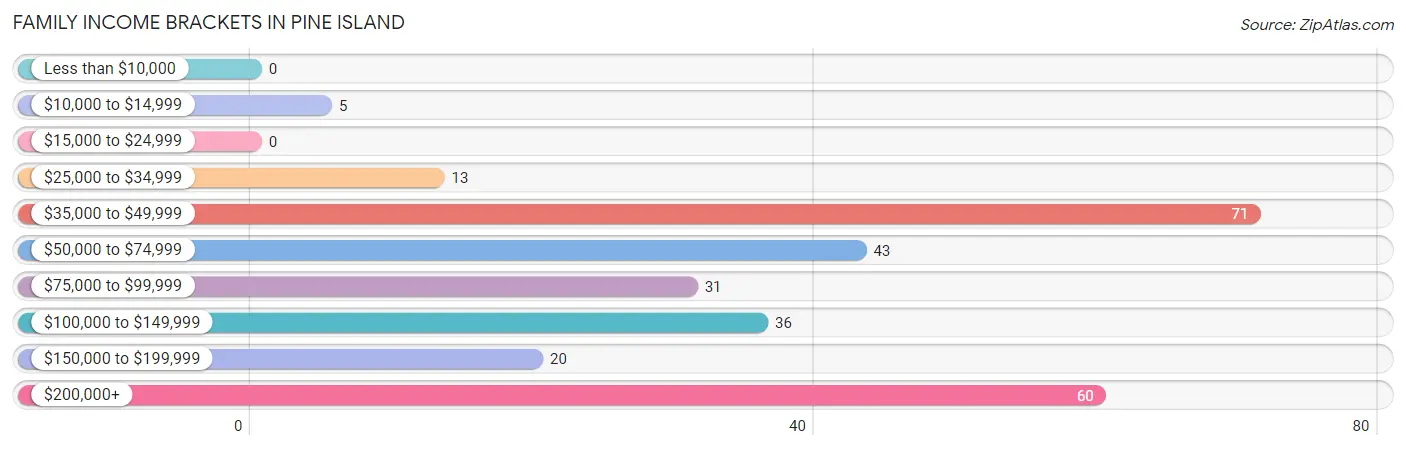
| Income Bracket | # Families | % Families |
| Less than $10,000 | 0 | 0.0% |
| $10,000 to $14,999 | 5 | 1.8% |
| $15,000 to $24,999 | 0 | 0.0% |
| $25,000 to $34,999 | 13 | 4.7% |
| $35,000 to $49,999 | 71 | 25.4% |
| $50,000 to $74,999 | 43 | 15.4% |
| $75,000 to $99,999 | 31 | 11.1% |
| $100,000 to $149,999 | 36 | 12.9% |
| $150,000 to $199,999 | 20 | 7.2% |
| $200,000+ | 60 | 21.5% |
Family Income by Famaliy Size in Pine Island
4-person families (39 | 14.0%) account for the highest median family income in Pine Island with $203,472 per family, while 4-person families (39 | 14.0%) have the highest median income of $50,868 per family member.
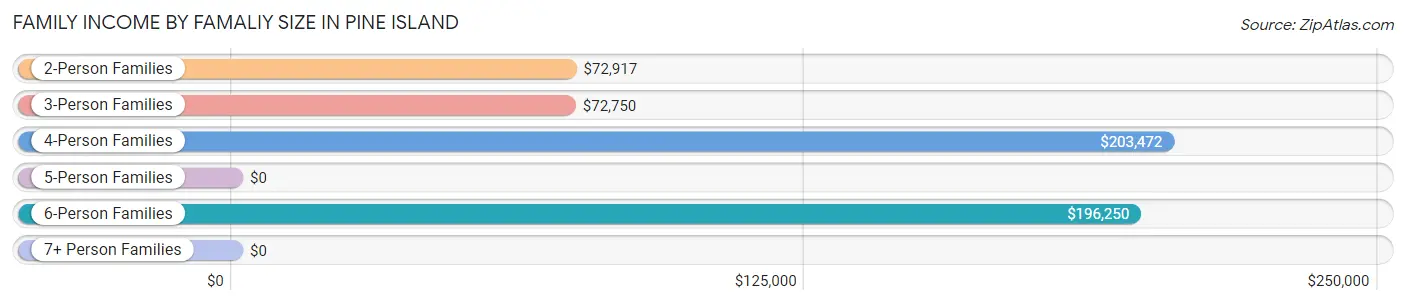
| Income Bracket | # Families | Median Income |
| 2-Person Families | 125 (44.8%) | $72,917 |
| 3-Person Families | 90 (32.3%) | $72,750 |
| 4-Person Families | 39 (14.0%) | $203,472 |
| 5-Person Families | 5 (1.8%) | $0 |
| 6-Person Families | 17 (6.1%) | $196,250 |
| 7+ Person Families | 3 (1.1%) | $0 |
| Total | 279 (100.0%) | $82,625 |
Family Income by Number of Earners in Pine Island
The median family income in Pine Island is $82,625, with families comprising 2 earners (80) having the highest median family income of $231,000, while families with no earners (72) have the lowest median family income of $47,188, accounting for 28.7% and 25.8% of families, respectively.
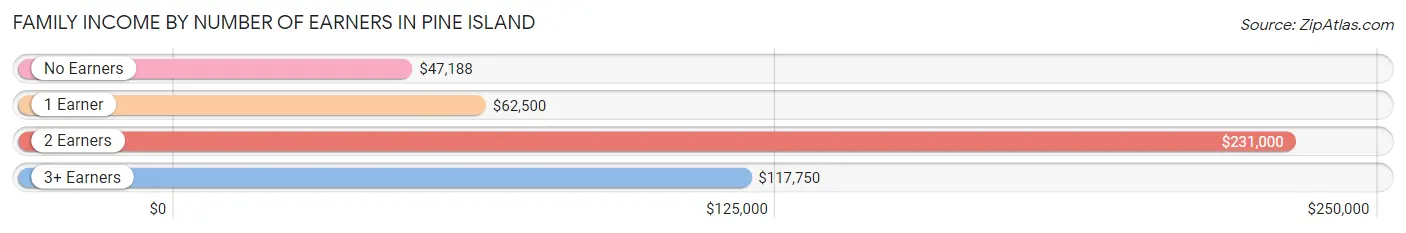
| Number of Earners | # Families | Median Income |
| No Earners | 72 (25.8%) | $47,188 |
| 1 Earner | 108 (38.7%) | $62,500 |
| 2 Earners | 80 (28.7%) | $231,000 |
| 3+ Earners | 19 (6.8%) | $117,750 |
| Total | 279 (100.0%) | $82,625 |
Household Income in Pine Island
Household Income Brackets in Pine Island
With 94 households falling in the category, the $35,000 to $49,999 income range is the most frequent in Pine Island, accounting for 19.7% of all households. In contrast, only 13 households (2.7%) fall into the $15,000 to $24,999 income bracket, making it the least populous group.
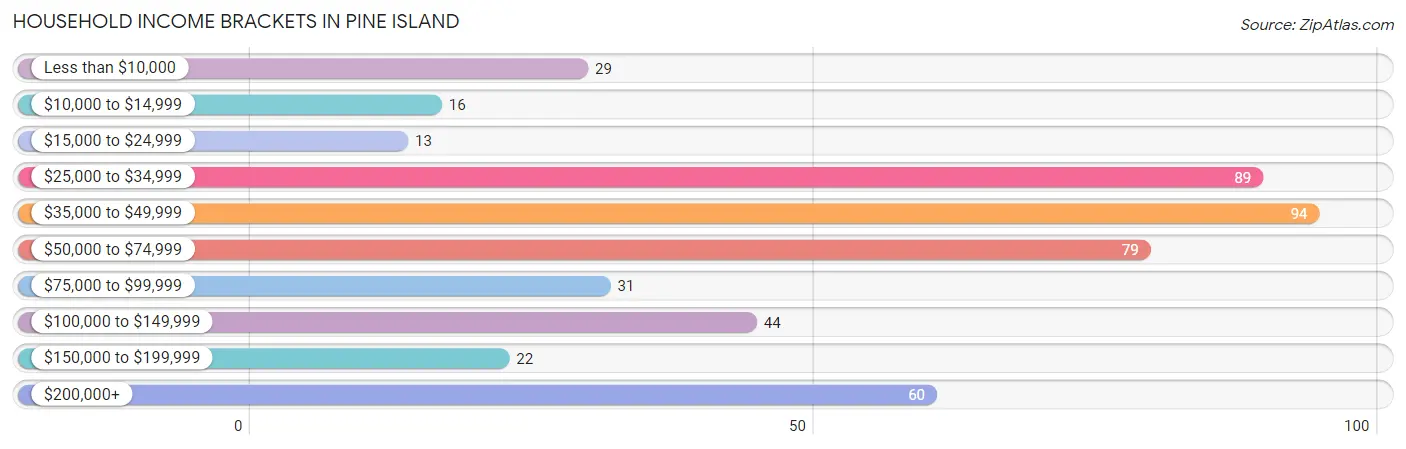
| Income Bracket | # Households | % Households |
| Less than $10,000 | 29 | 6.1% |
| $10,000 to $14,999 | 16 | 3.4% |
| $15,000 to $24,999 | 13 | 2.7% |
| $25,000 to $34,999 | 89 | 18.7% |
| $35,000 to $49,999 | 94 | 19.7% |
| $50,000 to $74,999 | 79 | 16.6% |
| $75,000 to $99,999 | 31 | 6.5% |
| $100,000 to $149,999 | 44 | 9.2% |
| $150,000 to $199,999 | 22 | 4.6% |
| $200,000+ | 60 | 12.6% |
Household Income by Householder Age in Pine Island
The median household income in Pine Island is $49,784, with the highest median household income of $68,472 found in the 25 to 44 years age bracket for the primary householder. A total of 75 households (15.7%) fall into this category. Meanwhile, the 15 to 24 years age bracket for the primary householder has the lowest median household income of $0, with 81 households (17.0%) in this group.
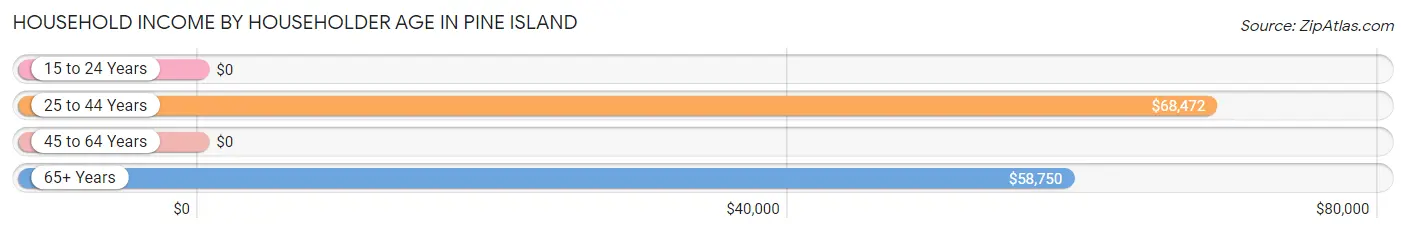
| Income Bracket | # Households | Median Income |
| 15 to 24 Years | 81 (17.0%) | $0 |
| 25 to 44 Years | 75 (15.7%) | $68,472 |
| 45 to 64 Years | 191 (40.0%) | $0 |
| 65+ Years | 130 (27.3%) | $58,750 |
| Total | 477 (100.0%) | $49,784 |
Poverty in Pine Island
Income Below Poverty by Sex and Age in Pine Island
With 19.0% poverty level for males and 10.6% for females among the residents of Pine Island, 18 to 24 year old males and 35 to 44 year old females are the most vulnerable to poverty, with 78 males (80.4%) and 24 females (42.1%) in their respective age groups living below the poverty level.
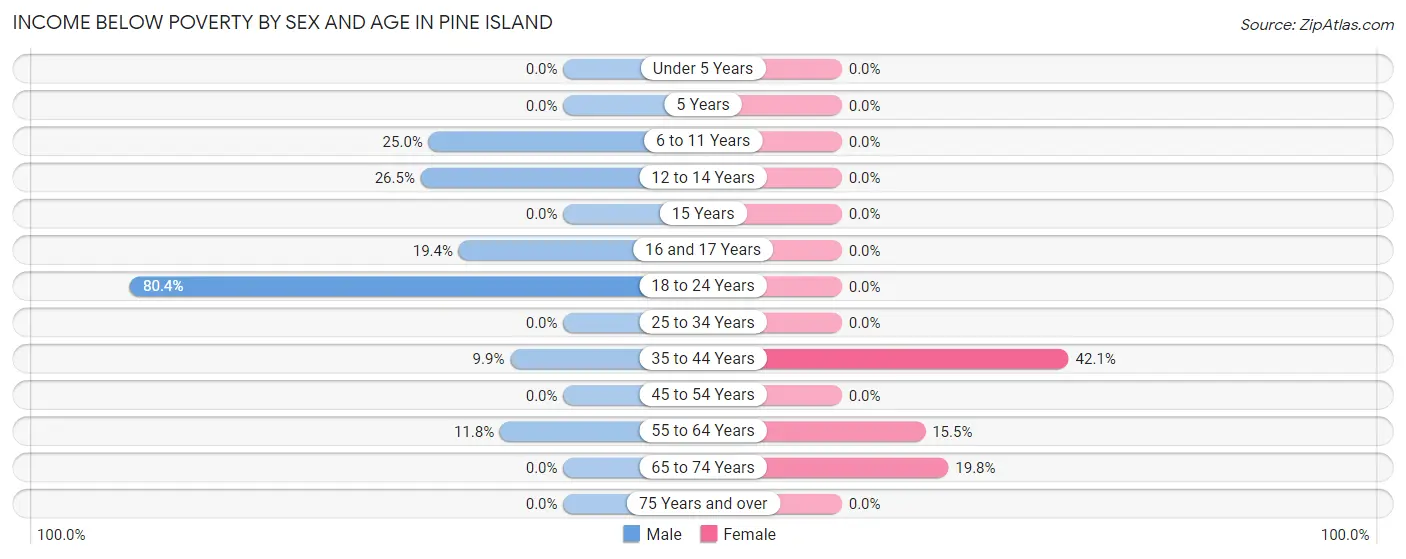
| Age Bracket | Male | Female |
| Under 5 Years | 0 (0.0%) | 0 (0.0%) |
| 5 Years | 0 (0.0%) | 0 (0.0%) |
| 6 to 11 Years | 9 (25.0%) | 0 (0.0%) |
| 12 to 14 Years | 9 (26.5%) | 0 (0.0%) |
| 15 Years | 0 (0.0%) | 0 (0.0%) |
| 16 and 17 Years | 13 (19.4%) | 0 (0.0%) |
| 18 to 24 Years | 78 (80.4%) | 0 (0.0%) |
| 25 to 34 Years | 0 (0.0%) | 0 (0.0%) |
| 35 to 44 Years | 7 (9.9%) | 24 (42.1%) |
| 45 to 54 Years | 0 (0.0%) | 0 (0.0%) |
| 55 to 64 Years | 8 (11.8%) | 22 (15.5%) |
| 65 to 74 Years | 0 (0.0%) | 18 (19.8%) |
| 75 Years and over | 0 (0.0%) | 0 (0.0%) |
| Total | 124 (19.0%) | 64 (10.6%) |
Income Above Poverty by Sex and Age in Pine Island
According to the poverty statistics in Pine Island, males aged under 5 years and females aged under 5 years are the age groups that are most secure financially, with 100.0% of males and 100.0% of females in these age groups living above the poverty line.
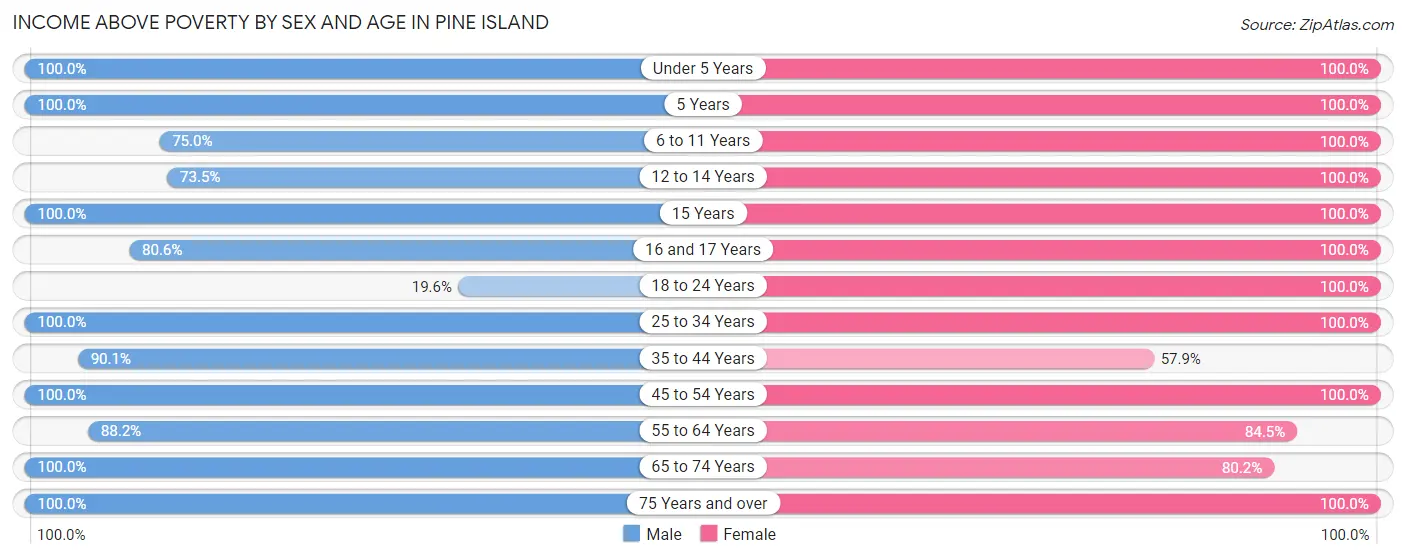
| Age Bracket | Male | Female |
| Under 5 Years | 6 (100.0%) | 24 (100.0%) |
| 5 Years | 14 (100.0%) | 4 (100.0%) |
| 6 to 11 Years | 27 (75.0%) | 24 (100.0%) |
| 12 to 14 Years | 25 (73.5%) | 76 (100.0%) |
| 15 Years | 13 (100.0%) | 41 (100.0%) |
| 16 and 17 Years | 54 (80.6%) | 14 (100.0%) |
| 18 to 24 Years | 19 (19.6%) | 21 (100.0%) |
| 25 to 34 Years | 48 (100.0%) | 40 (100.0%) |
| 35 to 44 Years | 64 (90.1%) | 33 (57.9%) |
| 45 to 54 Years | 88 (100.0%) | 53 (100.0%) |
| 55 to 64 Years | 60 (88.2%) | 120 (84.5%) |
| 65 to 74 Years | 86 (100.0%) | 73 (80.2%) |
| 75 Years and over | 26 (100.0%) | 17 (100.0%) |
| Total | 530 (81.0%) | 540 (89.4%) |
Income Below Poverty Among Married-Couple Families in Pine Island
The poverty statistics for married-couple families in Pine Island show that 2.5% or 5 of the total 199 families live below the poverty line. Families with 3 or 4 children have the highest poverty rate of 27.8%, comprising of 5 families. On the other hand, families with no children have the lowest poverty rate of 0.0%, which includes 0 families.
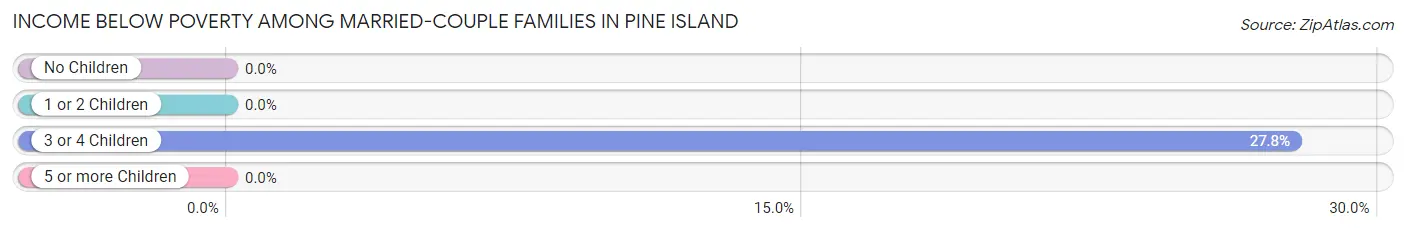
| Children | Above Poverty | Below Poverty |
| No Children | 126 (100.0%) | 0 (0.0%) |
| 1 or 2 Children | 55 (100.0%) | 0 (0.0%) |
| 3 or 4 Children | 13 (72.2%) | 5 (27.8%) |
| 5 or more Children | 0 (0.0%) | 0 (0.0%) |
| Total | 194 (97.5%) | 5 (2.5%) |
Income Below Poverty Among Single-Parent Households in Pine Island
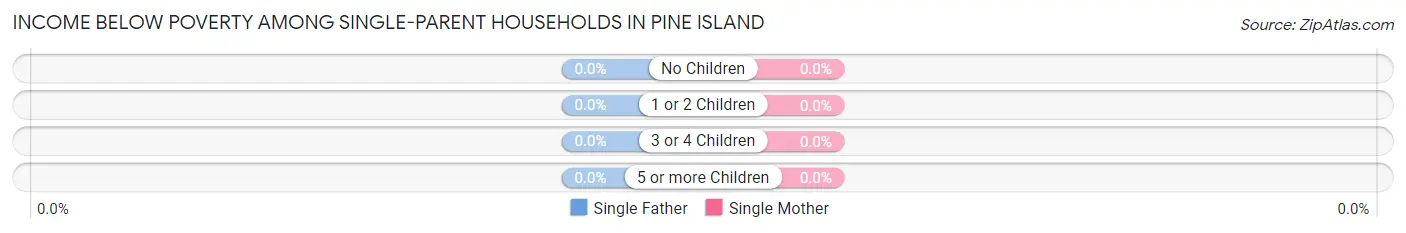
| Children | Single Father | Single Mother |
| No Children | 0 (0.0%) | 0 (0.0%) |
| 1 or 2 Children | 0 (0.0%) | 0 (0.0%) |
| 3 or 4 Children | 0 (0.0%) | 0 (0.0%) |
| 5 or more Children | 0 (0.0%) | 0 (0.0%) |
| Total | 0 (0.0%) | 0 (0.0%) |
Income Below Poverty Among Married-Couple vs Single-Parent Households in Pine Island
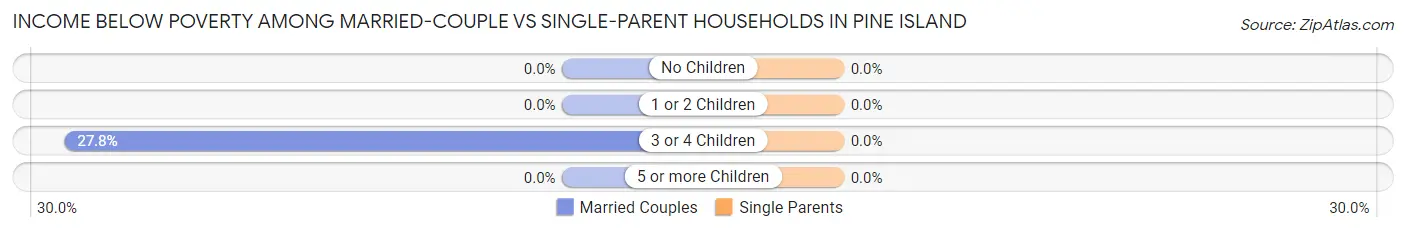
| Children | Married-Couple Families | Single-Parent Households |
| No Children | 0 (0.0%) | 0 (0.0%) |
| 1 or 2 Children | 0 (0.0%) | 0 (0.0%) |
| 3 or 4 Children | 5 (27.8%) | 0 (0.0%) |
| 5 or more Children | 0 (0.0%) | 0 (0.0%) |
| Total | 5 (2.5%) | 0 (0.0%) |
Race in Pine Island
The most populous races in Pine Island are White / Caucasian (865 | 68.8%), Hispanic or Latino (467 | 37.1%), and Some other Race (172 | 13.7%).
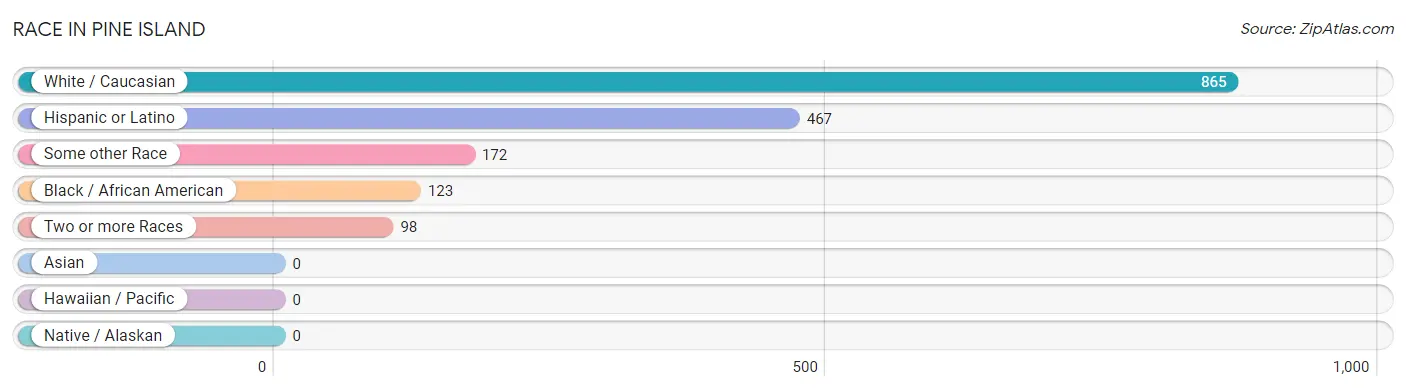
| Race | # Population | % Population |
| Asian | 0 | 0.0% |
| Black / African American | 123 | 9.8% |
| Hawaiian / Pacific | 0 | 0.0% |
| Hispanic or Latino | 467 | 37.1% |
| Native / Alaskan | 0 | 0.0% |
| White / Caucasian | 865 | 68.8% |
| Two or more Races | 98 | 7.8% |
| Some other Race | 172 | 13.7% |
| Total | 1,258 | 100.0% |
Ancestry in Pine Island
The most populous ancestries reported in Pine Island are Mexican (389 | 30.9%), German (146 | 11.6%), American (102 | 8.1%), Irish (68 | 5.4%), and English (66 | 5.2%), together accounting for 61.3% of all Pine Island residents.
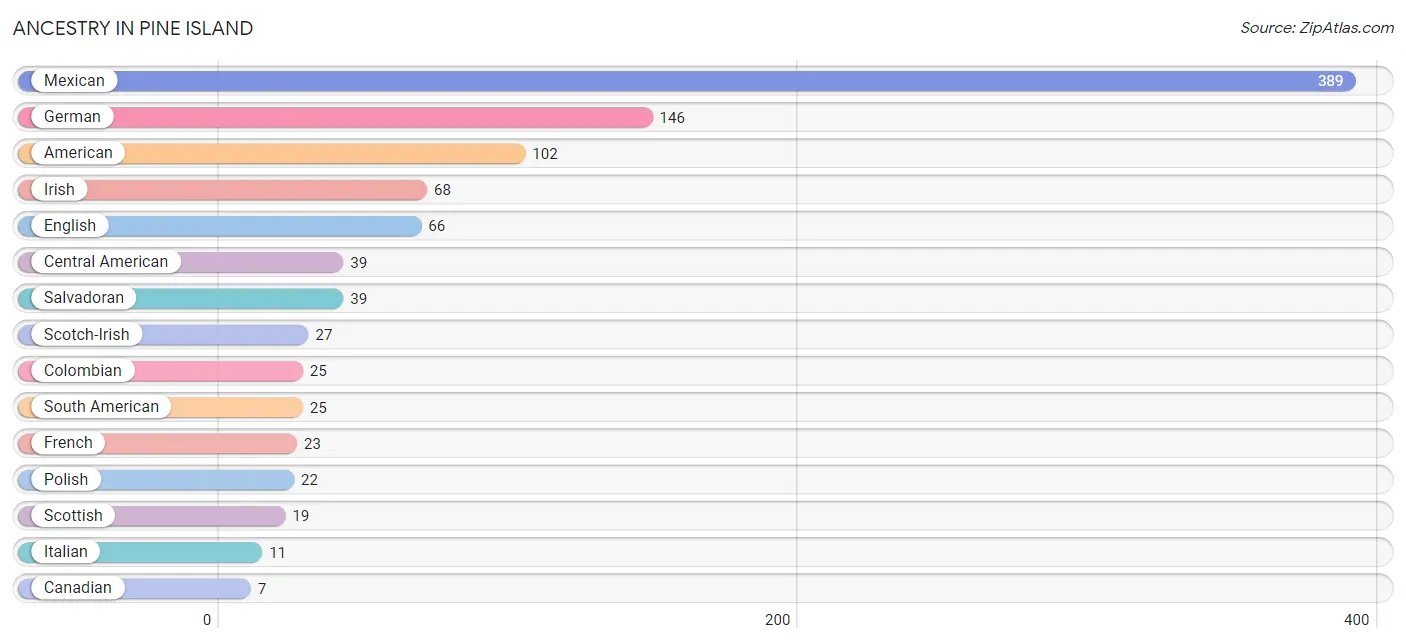
| Ancestry | # Population | % Population |
| American | 102 | 8.1% |
| Armenian | 6 | 0.5% |
| Belgian | 4 | 0.3% |
| Canadian | 7 | 0.6% |
| Central American | 39 | 3.1% |
| Colombian | 25 | 2.0% |
| Czech | 3 | 0.2% |
| Dutch | 5 | 0.4% |
| Eastern European | 4 | 0.3% |
| English | 66 | 5.2% |
| French | 23 | 1.8% |
| French Canadian | 2 | 0.2% |
| German | 146 | 11.6% |
| Hungarian | 6 | 0.5% |
| Iranian | 3 | 0.2% |
| Irish | 68 | 5.4% |
| Italian | 11 | 0.9% |
| Mexican | 389 | 30.9% |
| Polish | 22 | 1.8% |
| Salvadoran | 39 | 3.1% |
| Scotch-Irish | 27 | 2.1% |
| Scottish | 19 | 1.5% |
| South American | 25 | 2.0% |
| Swedish | 3 | 0.2% | View All 24 Rows |
Immigrants in Pine Island
The most numerous immigrant groups reported in Pine Island came from Latin America (199 | 15.8%), Central America (172 | 13.7%), Mexico (133 | 10.6%), El Salvador (39 | 3.1%), and Colombia (25 | 2.0%), together accounting for 45.2% of all Pine Island residents.
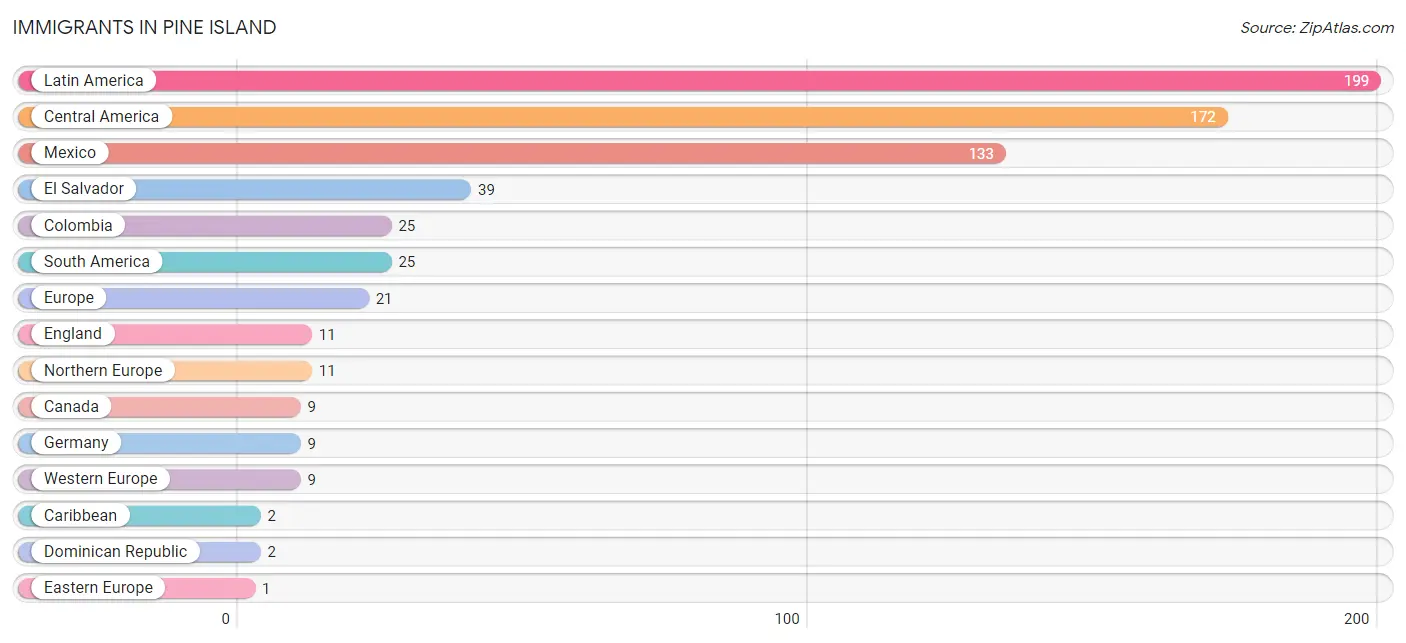
| Immigration Origin | # Population | % Population |
| Canada | 9 | 0.7% |
| Caribbean | 2 | 0.2% |
| Central America | 172 | 13.7% |
| Colombia | 25 | 2.0% |
| Dominican Republic | 2 | 0.2% |
| Eastern Europe | 1 | 0.1% |
| El Salvador | 39 | 3.1% |
| England | 11 | 0.9% |
| Europe | 21 | 1.7% |
| Germany | 9 | 0.7% |
| Hungary | 1 | 0.1% |
| Latin America | 199 | 15.8% |
| Mexico | 133 | 10.6% |
| Northern Europe | 11 | 0.9% |
| South America | 25 | 2.0% |
| Western Europe | 9 | 0.7% | View All 16 Rows |
Sex and Age in Pine Island
Sex and Age in Pine Island
The most populous age groups in Pine Island are 15 to 19 Years (91 | 13.9%) for men and 60 to 64 Years (116 | 19.2%) for women.
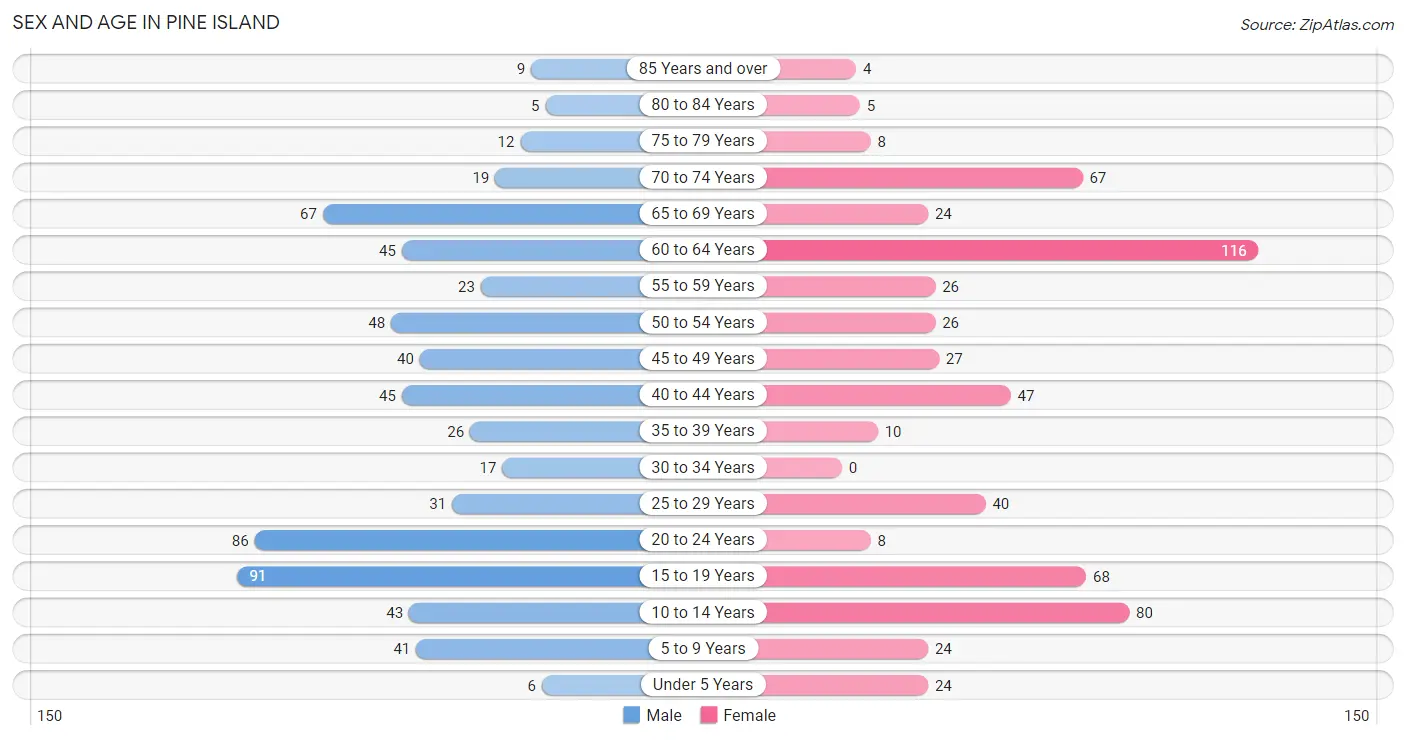
| Age Bracket | Male | Female |
| Under 5 Years | 6 (0.9%) | 24 (4.0%) |
| 5 to 9 Years | 41 (6.3%) | 24 (4.0%) |
| 10 to 14 Years | 43 (6.6%) | 80 (13.3%) |
| 15 to 19 Years | 91 (13.9%) | 68 (11.3%) |
| 20 to 24 Years | 86 (13.2%) | 8 (1.3%) |
| 25 to 29 Years | 31 (4.7%) | 40 (6.6%) |
| 30 to 34 Years | 17 (2.6%) | 0 (0.0%) |
| 35 to 39 Years | 26 (4.0%) | 10 (1.7%) |
| 40 to 44 Years | 45 (6.9%) | 47 (7.8%) |
| 45 to 49 Years | 40 (6.1%) | 27 (4.5%) |
| 50 to 54 Years | 48 (7.3%) | 26 (4.3%) |
| 55 to 59 Years | 23 (3.5%) | 26 (4.3%) |
| 60 to 64 Years | 45 (6.9%) | 116 (19.2%) |
| 65 to 69 Years | 67 (10.2%) | 24 (4.0%) |
| 70 to 74 Years | 19 (2.9%) | 67 (11.1%) |
| 75 to 79 Years | 12 (1.8%) | 8 (1.3%) |
| 80 to 84 Years | 5 (0.8%) | 5 (0.8%) |
| 85 Years and over | 9 (1.4%) | 4 (0.7%) |
| Total | 654 (100.0%) | 604 (100.0%) |
Families and Households in Pine Island
Median Family Size in Pine Island
The median family size in Pine Island is 3.49 persons per family, with single male/father families (64 | 22.9%) accounting for the largest median family size of 4.06 persons per family. On the other hand, single female/mother families (16 | 5.7%) represent the smallest median family size with 2.00 persons per family.
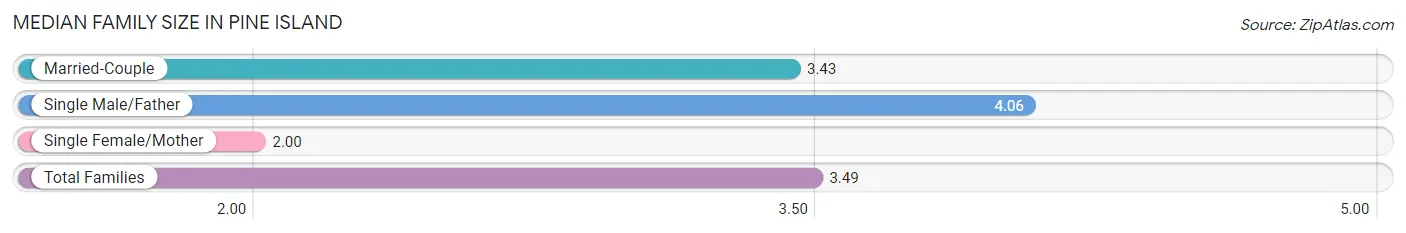
| Family Type | # Families | Family Size |
| Married-Couple | 199 (71.3%) | 3.43 |
| Single Male/Father | 64 (22.9%) | 4.06 |
| Single Female/Mother | 16 (5.7%) | 2.00 |
| Total Families | 279 (100.0%) | 3.49 |
Median Household Size in Pine Island
The median household size in Pine Island is 2.64 persons per household, with single male/father households (64 | 13.4%) accounting for the largest median household size of 4.39 persons per household. non-family households (198 | 41.5%) represent the smallest median household size with 1.32 persons per household.
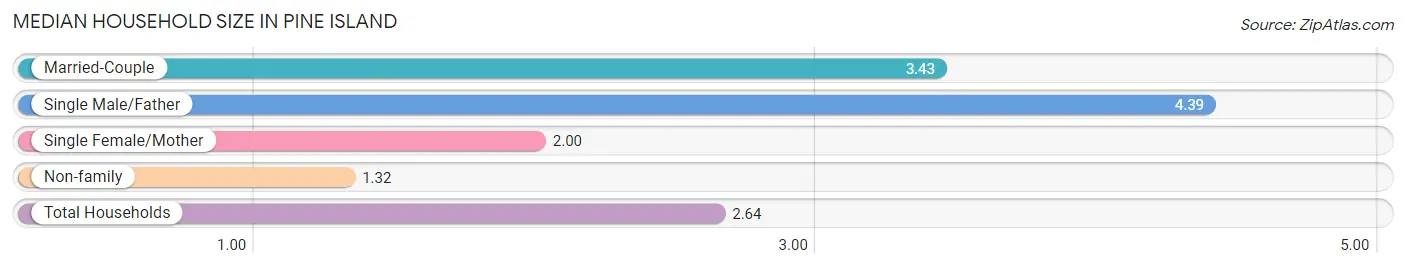
| Household Type | # Households | Household Size |
| Married-Couple | 199 (41.7%) | 3.43 |
| Single Male/Father | 64 (13.4%) | 4.39 |
| Single Female/Mother | 16 (3.4%) | 2.00 |
| Non-family | 198 (41.5%) | 1.32 |
| Total Households | 477 (100.0%) | 2.64 |
Household Size by Marriage Status in Pine Island
Out of a total of 477 households in Pine Island, 279 (58.5%) are family households, while 198 (41.5%) are nonfamily households. The most numerous type of family households are 2-person households, comprising 117, and the most common type of nonfamily households are 2-person households, comprising 118.
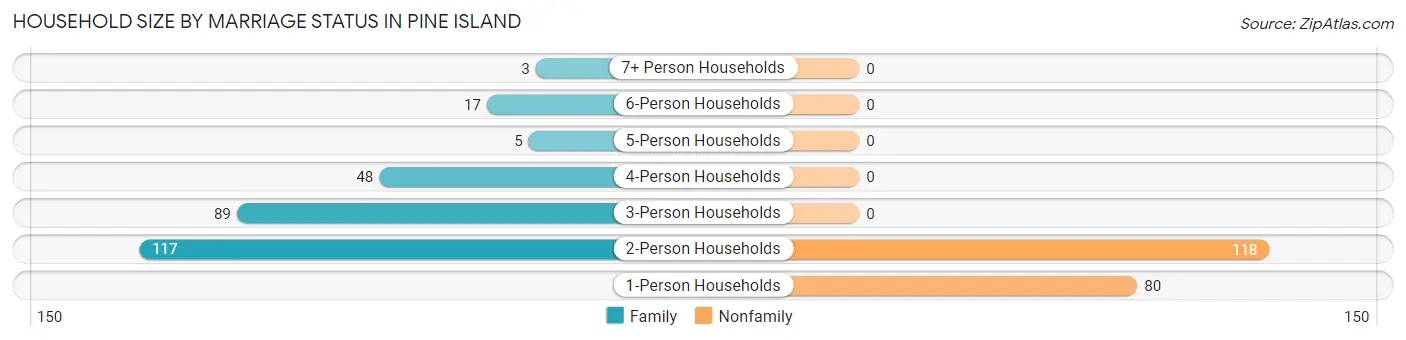
| Household Size | Family Households | Nonfamily Households |
| 1-Person Households | - | 80 (16.8%) |
| 2-Person Households | 117 (24.5%) | 118 (24.7%) |
| 3-Person Households | 89 (18.7%) | 0 (0.0%) |
| 4-Person Households | 48 (10.1%) | 0 (0.0%) |
| 5-Person Households | 5 (1.1%) | 0 (0.0%) |
| 6-Person Households | 17 (3.6%) | 0 (0.0%) |
| 7+ Person Households | 3 (0.6%) | 0 (0.0%) |
| Total | 279 (58.5%) | 198 (41.5%) |
Female Fertility in Pine Island
Fertility by Age in Pine Island
| Age Bracket | Women with Births | Births / 1,000 Women |
| 15 to 19 years | 0 (0.0%) | 0.0 |
| 20 to 34 years | 0 (0.0%) | 0.0 |
| 35 to 50 years | 0 (0.0%) | 0.0 |
| Total | 0 (0.0%) | 0.0 |
Fertility by Age by Marriage Status in Pine Island
| Age Bracket | Married | Unmarried |
| 15 to 19 years | 0 (0.0%) | 0 (0.0%) |
| 20 to 34 years | 0 (0.0%) | 0 (0.0%) |
| 35 to 50 years | 0 (0.0%) | 0 (0.0%) |
| Total | 0 (0.0%) | 0 (0.0%) |
Fertility by Education in Pine Island
| Educational Attainment | Women with Births | Births / 1,000 Women |
| Less than High School | 0 (0.0%) | 0.0 |
| High School Diploma | 0 (0.0%) | 0.0 |
| College or Associate's Degree | 0 (0.0%) | 0.0 |
| Bachelor's Degree | 0 (0.0%) | 0.0 |
| Graduate Degree | 0 (0.0%) | 0.0 |
| Total | 0 (0.0%) | 0.0 |
Fertility by Education by Marriage Status in Pine Island
| Educational Attainment | Married | Unmarried |
| Less than High School | 0 (0.0%) | 0 (0.0%) |
| High School Diploma | 0 (0.0%) | 0 (0.0%) |
| College or Associate's Degree | 0 (0.0%) | 0 (0.0%) |
| Bachelor's Degree | 0 (0.0%) | 0 (0.0%) |
| Graduate Degree | 0 (0.0%) | 0 (0.0%) |
| Total | 0 (0.0%) | 0 (0.0%) |
Employment Characteristics in Pine Island
Employment by Class of Employer in Pine Island
Among the 390 employed individuals in Pine Island, private company employees (218 | 55.9%), self-employed (not incorporated) (56 | 14.4%), and not-for-profit organizations (35 | 9.0%) make up the most common classes of employment.
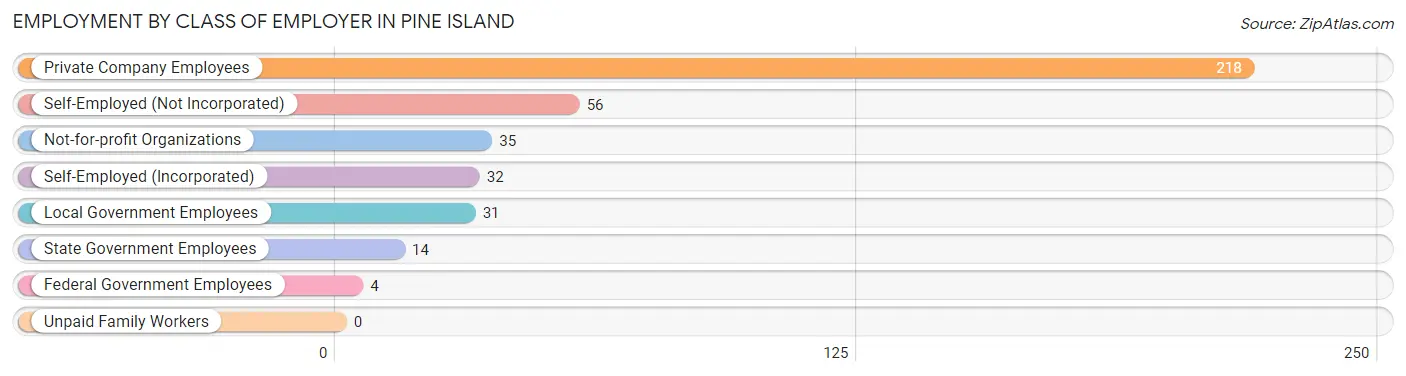
| Employer Class | # Employees | % Employees |
| Private Company Employees | 218 | 55.9% |
| Self-Employed (Incorporated) | 32 | 8.2% |
| Self-Employed (Not Incorporated) | 56 | 14.4% |
| Not-for-profit Organizations | 35 | 9.0% |
| Local Government Employees | 31 | 8.0% |
| State Government Employees | 14 | 3.6% |
| Federal Government Employees | 4 | 1.0% |
| Unpaid Family Workers | 0 | 0.0% |
| Total | 390 | 100.0% |
Employment Status by Age in Pine Island
According to the labor force statistics for Pine Island, out of the total population over 16 years of age (986), 42.0% or 414 individuals are in the labor force, with 5.8% or 24 of them unemployed. The age group with the highest labor force participation rate is 30 to 34 years, with 100.0% or 17 individuals in the labor force. Within the labor force, the 60 to 64 years age range has the highest percentage of unemployed individuals, with 34.5% or 20 of them being unemployed.
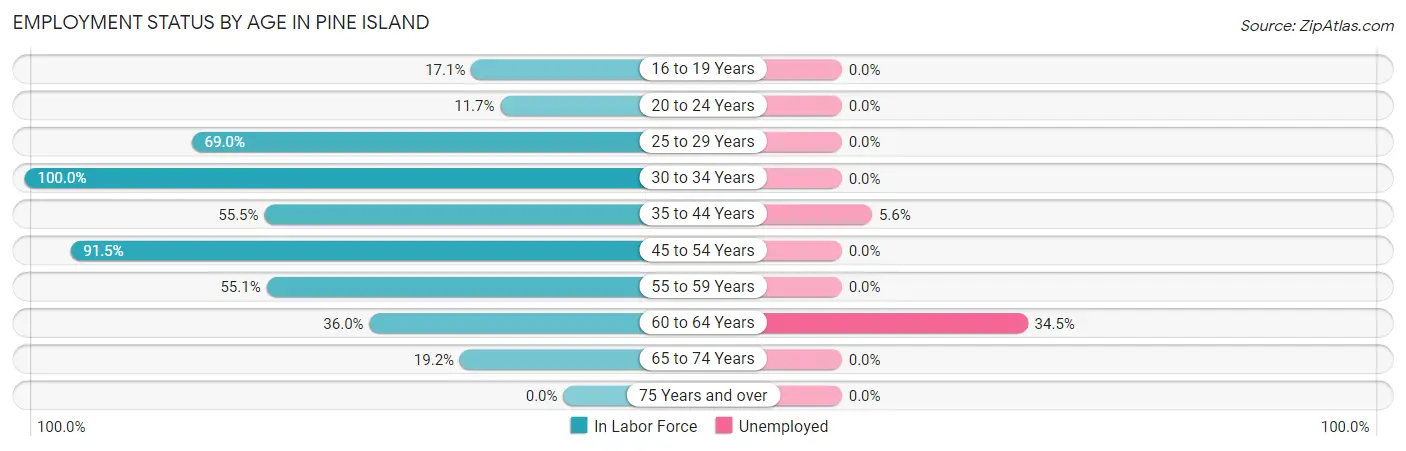
| Age Bracket | In Labor Force | Unemployed |
| 16 to 19 Years | 18 (17.1%) | 0 (0.0%) |
| 20 to 24 Years | 11 (11.7%) | 0 (0.0%) |
| 25 to 29 Years | 49 (69.0%) | 0 (0.0%) |
| 30 to 34 Years | 17 (100.0%) | 0 (0.0%) |
| 35 to 44 Years | 71 (55.5%) | 4 (5.6%) |
| 45 to 54 Years | 129 (91.5%) | 0 (0.0%) |
| 55 to 59 Years | 27 (55.1%) | 0 (0.0%) |
| 60 to 64 Years | 58 (36.0%) | 20 (34.5%) |
| 65 to 74 Years | 34 (19.2%) | 0 (0.0%) |
| 75 Years and over | 0 (0.0%) | 0 (0.0%) |
| Total | 414 (42.0%) | 24 (5.8%) |
Employment Status by Educational Attainment in Pine Island
According to labor force statistics for Pine Island, 61.9% of individuals (351) out of the total population between 25 and 64 years of age (567) are in the labor force, with 6.8% or 24 of them being unemployed. The group with the highest labor force participation rate are those with the educational attainment of bachelor's degree or higher, with 78.5% or 73 individuals in the labor force. Within the labor force, individuals with high school diploma education have the highest percentage of unemployment, with 15.3% or 20 of them being unemployed.
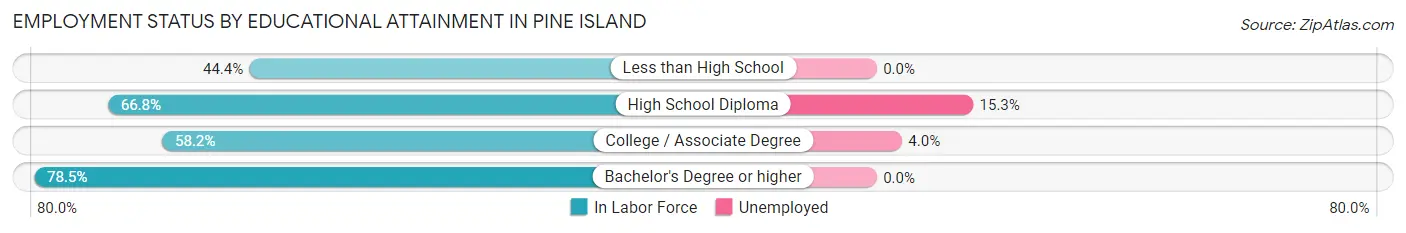
| Educational Attainment | In Labor Force | Unemployed |
| Less than High School | 48 (44.4%) | 0 (0.0%) |
| High School Diploma | 131 (66.8%) | 30 (15.3%) |
| College / Associate Degree | 99 (58.2%) | 7 (4.0%) |
| Bachelor's Degree or higher | 73 (78.5%) | 0 (0.0%) |
| Total | 351 (61.9%) | 39 (6.8%) |
Employment Occupations by Sex in Pine Island
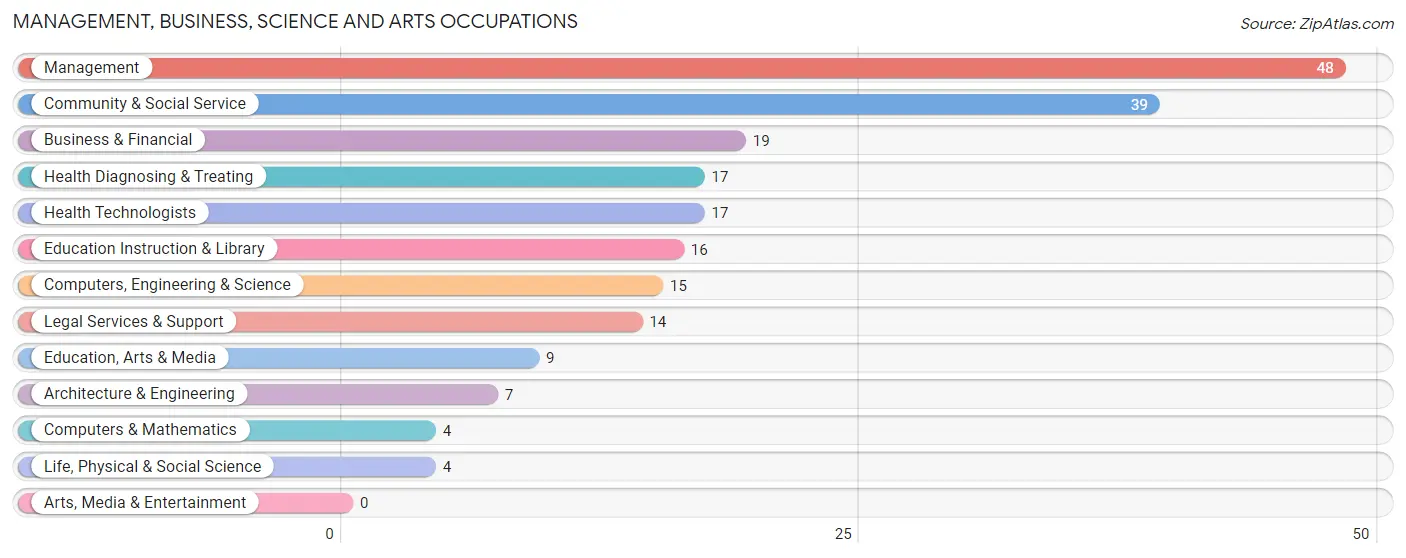
Management, Business, Science and Arts Occupations
The most common Management, Business, Science and Arts occupations in Pine Island are Management (48 | 12.3%), Community & Social Service (39 | 10.0%), Business & Financial (19 | 4.9%), Health Diagnosing & Treating (17 | 4.4%), and Health Technologists (17 | 4.4%).
Management, Business, Science and Arts Occupations by Sex
Within the Management, Business, Science and Arts occupations in Pine Island, the most male-oriented occupations are Computers, Engineering & Science (100.0%), Computers & Mathematics (100.0%), and Architecture & Engineering (100.0%), while the most female-oriented occupations are Education, Arts & Media (100.0%), Education Instruction & Library (100.0%), and Community & Social Service (64.1%).
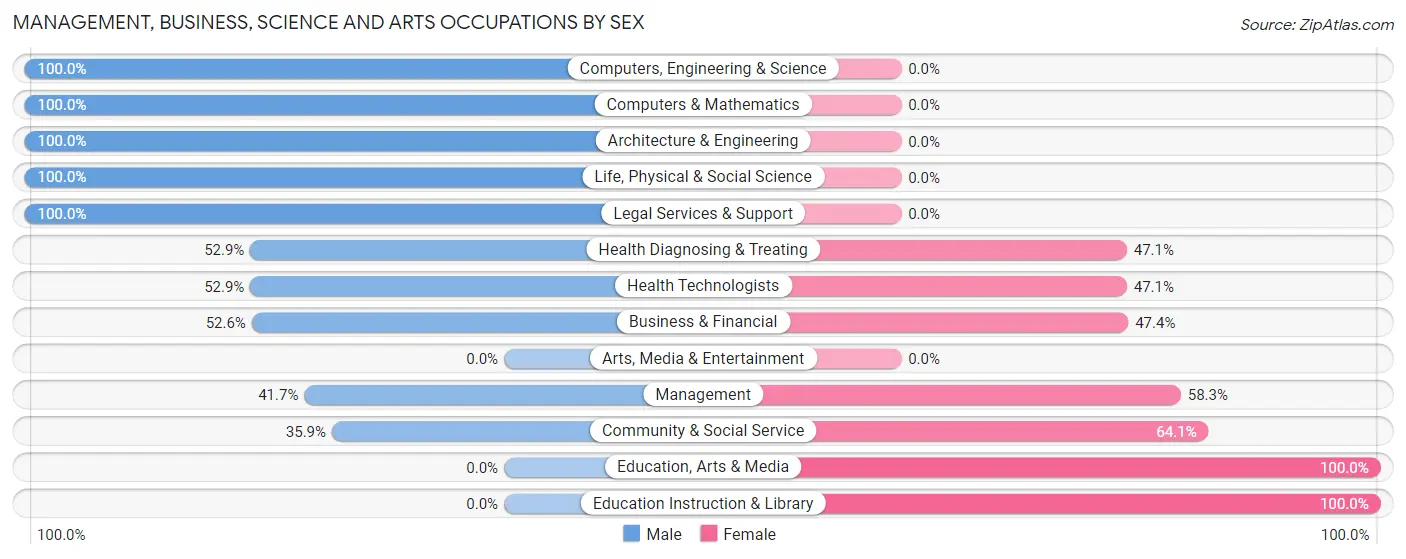
| Occupation | Male | Female |
| Management | 20 (41.7%) | 28 (58.3%) |
| Business & Financial | 10 (52.6%) | 9 (47.4%) |
| Computers, Engineering & Science | 15 (100.0%) | 0 (0.0%) |
| Computers & Mathematics | 4 (100.0%) | 0 (0.0%) |
| Architecture & Engineering | 7 (100.0%) | 0 (0.0%) |
| Life, Physical & Social Science | 4 (100.0%) | 0 (0.0%) |
| Community & Social Service | 14 (35.9%) | 25 (64.1%) |
| Education, Arts & Media | 0 (0.0%) | 9 (100.0%) |
| Legal Services & Support | 14 (100.0%) | 0 (0.0%) |
| Education Instruction & Library | 0 (0.0%) | 16 (100.0%) |
| Arts, Media & Entertainment | 0 (0.0%) | 0 (0.0%) |
| Health Diagnosing & Treating | 9 (52.9%) | 8 (47.1%) |
| Health Technologists | 9 (52.9%) | 8 (47.1%) |
| Total (Category) | 68 (49.3%) | 70 (50.7%) |
| Total (Overall) | 246 (63.1%) | 144 (36.9%) |
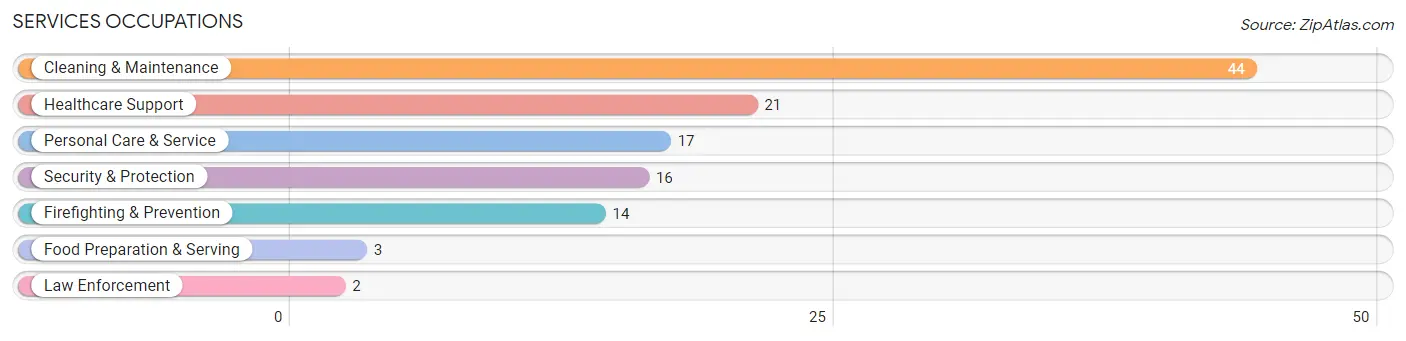
Services Occupations
The most common Services occupations in Pine Island are Cleaning & Maintenance (44 | 11.3%), Healthcare Support (21 | 5.4%), Personal Care & Service (17 | 4.4%), Security & Protection (16 | 4.1%), and Firefighting & Prevention (14 | 3.6%).
Services Occupations by Sex
Within the Services occupations in Pine Island, the most male-oriented occupations are Security & Protection (100.0%), Firefighting & Prevention (100.0%), and Law Enforcement (100.0%), while the most female-oriented occupations are Healthcare Support (100.0%), Food Preparation & Serving (100.0%), and Personal Care & Service (17.6%).
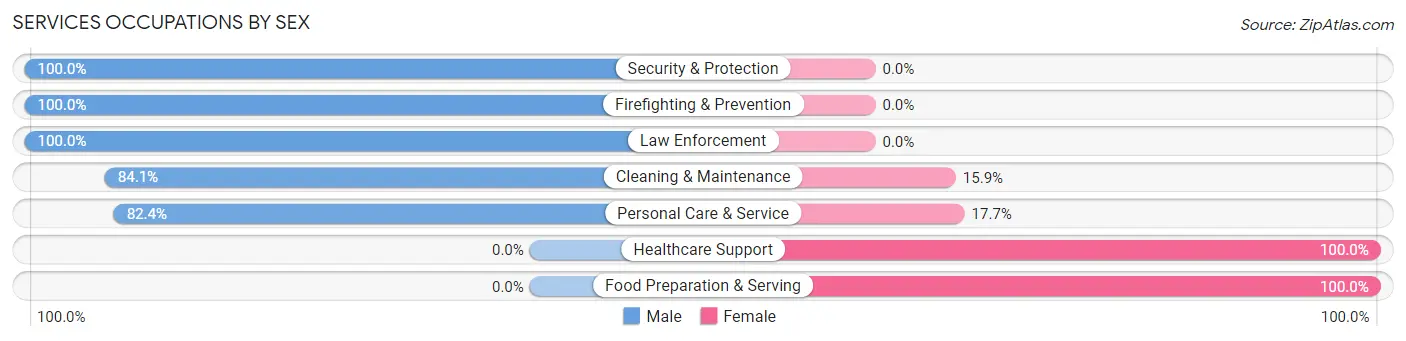
| Occupation | Male | Female |
| Healthcare Support | 0 (0.0%) | 21 (100.0%) |
| Security & Protection | 16 (100.0%) | 0 (0.0%) |
| Firefighting & Prevention | 14 (100.0%) | 0 (0.0%) |
| Law Enforcement | 2 (100.0%) | 0 (0.0%) |
| Food Preparation & Serving | 0 (0.0%) | 3 (100.0%) |
| Cleaning & Maintenance | 37 (84.1%) | 7 (15.9%) |
| Personal Care & Service | 14 (82.4%) | 3 (17.6%) |
| Total (Category) | 67 (66.3%) | 34 (33.7%) |
| Total (Overall) | 246 (63.1%) | 144 (36.9%) |
Sales and Office Occupations
The most common Sales and Office occupations in Pine Island are Sales & Related (36 | 9.2%), and Office & Administration (18 | 4.6%).
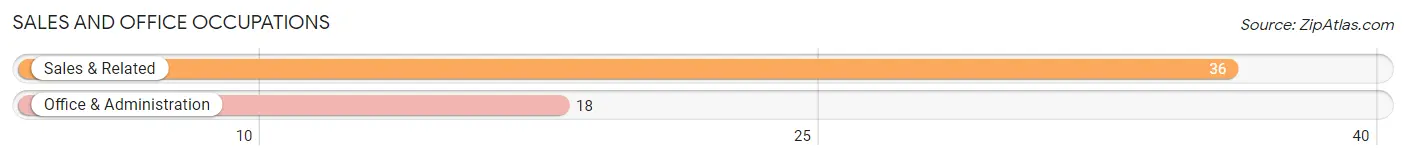
Sales and Office Occupations by Sex
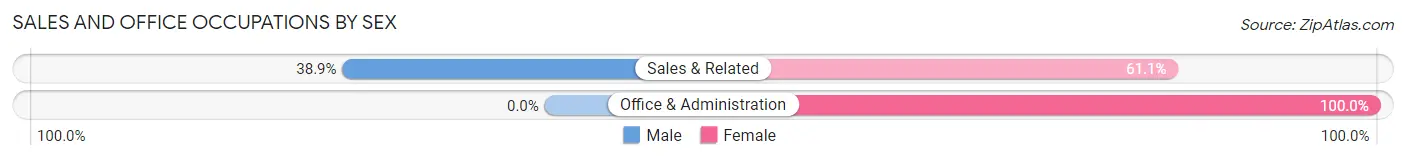
| Occupation | Male | Female |
| Sales & Related | 14 (38.9%) | 22 (61.1%) |
| Office & Administration | 0 (0.0%) | 18 (100.0%) |
| Total (Category) | 14 (25.9%) | 40 (74.1%) |
| Total (Overall) | 246 (63.1%) | 144 (36.9%) |
Natural Resources, Construction and Maintenance Occupations
The most common Natural Resources, Construction and Maintenance occupations in Pine Island are Construction & Extraction (41 | 10.5%), Installation, Maintenance & Repair (15 | 3.8%), and Farming, Fishing & Forestry (7 | 1.8%).
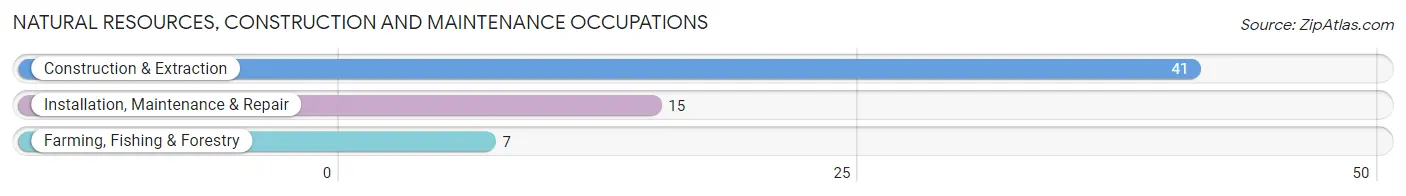
Natural Resources, Construction and Maintenance Occupations by Sex
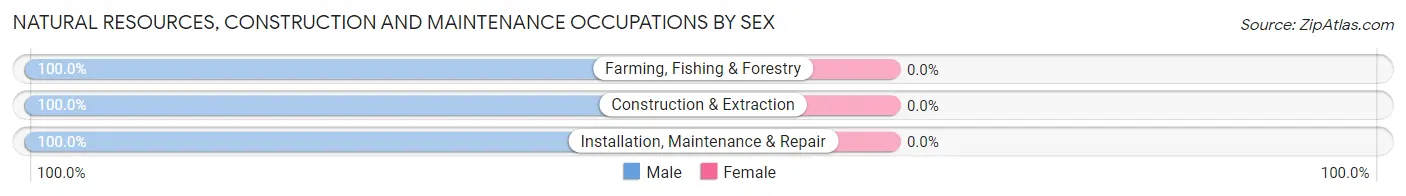
| Occupation | Male | Female |
| Farming, Fishing & Forestry | 7 (100.0%) | 0 (0.0%) |
| Construction & Extraction | 41 (100.0%) | 0 (0.0%) |
| Installation, Maintenance & Repair | 15 (100.0%) | 0 (0.0%) |
| Total (Category) | 63 (100.0%) | 0 (0.0%) |
| Total (Overall) | 246 (63.1%) | 144 (36.9%) |
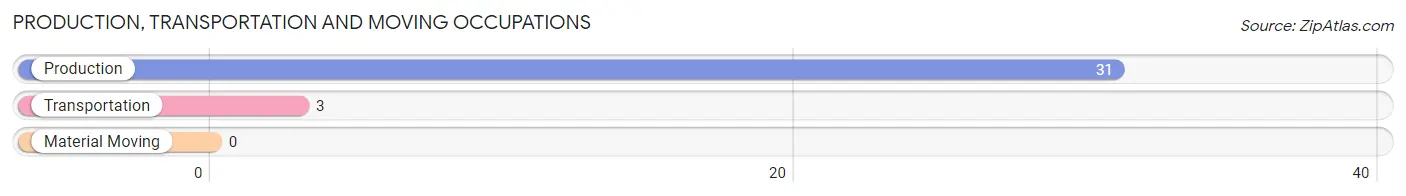
Production, Transportation and Moving Occupations
The most common Production, Transportation and Moving occupations in Pine Island are Production (31 | 8.0%), and Transportation (3 | 0.8%).
Production, Transportation and Moving Occupations by Sex
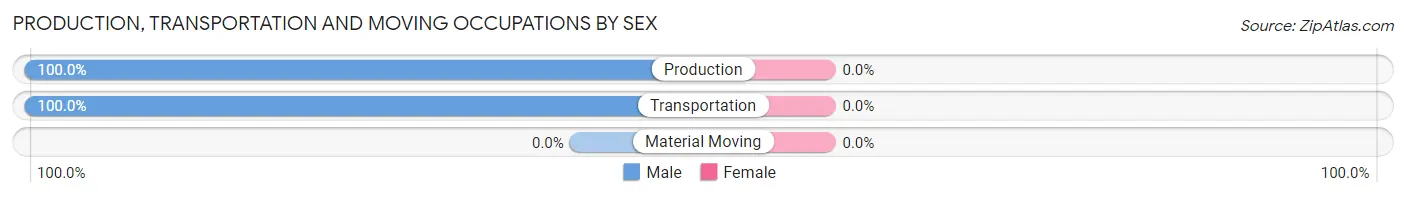
| Occupation | Male | Female |
| Production | 31 (100.0%) | 0 (0.0%) |
| Transportation | 3 (100.0%) | 0 (0.0%) |
| Material Moving | 0 (0.0%) | 0 (0.0%) |
| Total (Category) | 34 (100.0%) | 0 (0.0%) |
| Total (Overall) | 246 (63.1%) | 144 (36.9%) |
Employment Industries by Sex in Pine Island
Employment Industries in Pine Island
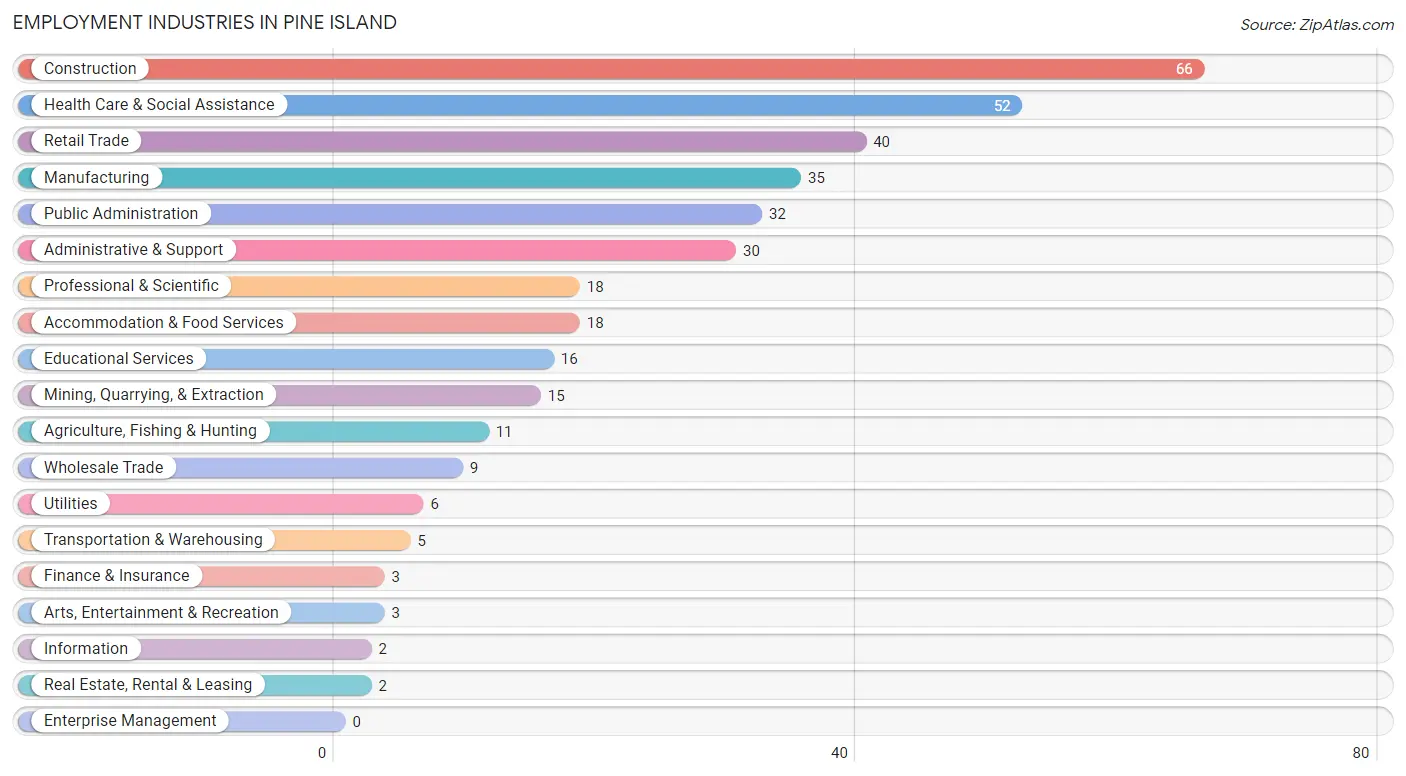
The major employment industries in Pine Island include Construction (66 | 16.9%), Health Care & Social Assistance (52 | 13.3%), Retail Trade (40 | 10.3%), Manufacturing (35 | 9.0%), and Public Administration (32 | 8.2%).
Employment Industries by Sex in Pine Island
The Pine Island industries that see more men than women are Agriculture, Fishing & Hunting (100.0%), Mining, Quarrying, & Extraction (100.0%), and Construction (100.0%), whereas the industries that tend to have a higher number of women are Wholesale Trade (100.0%), Transportation & Warehousing (100.0%), and Information (100.0%).
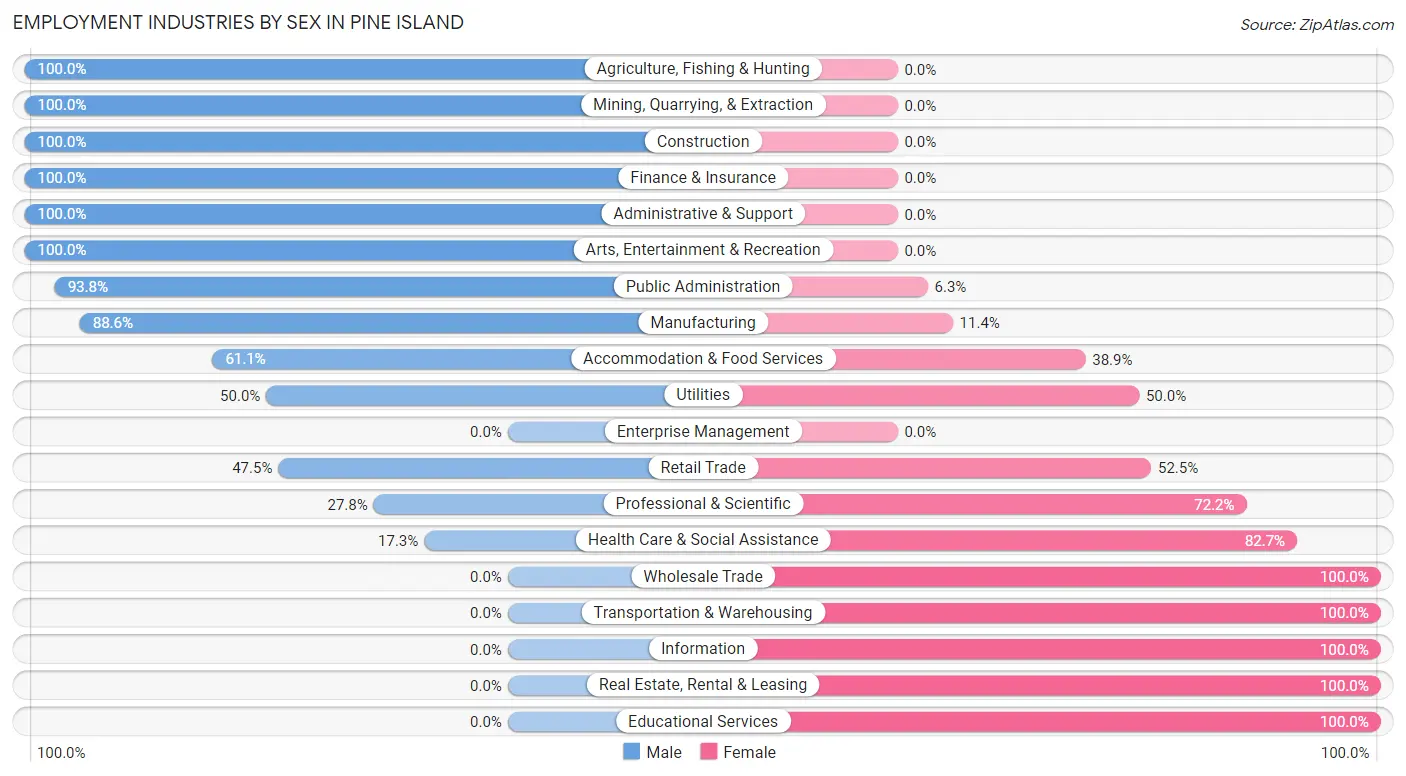
| Industry | Male | Female |
| Agriculture, Fishing & Hunting | 11 (100.0%) | 0 (0.0%) |
| Mining, Quarrying, & Extraction | 15 (100.0%) | 0 (0.0%) |
| Construction | 66 (100.0%) | 0 (0.0%) |
| Manufacturing | 31 (88.6%) | 4 (11.4%) |
| Wholesale Trade | 0 (0.0%) | 9 (100.0%) |
| Retail Trade | 19 (47.5%) | 21 (52.5%) |
| Transportation & Warehousing | 0 (0.0%) | 5 (100.0%) |
| Utilities | 3 (50.0%) | 3 (50.0%) |
| Information | 0 (0.0%) | 2 (100.0%) |
| Finance & Insurance | 3 (100.0%) | 0 (0.0%) |
| Real Estate, Rental & Leasing | 0 (0.0%) | 2 (100.0%) |
| Professional & Scientific | 5 (27.8%) | 13 (72.2%) |
| Enterprise Management | 0 (0.0%) | 0 (0.0%) |
| Administrative & Support | 30 (100.0%) | 0 (0.0%) |
| Educational Services | 0 (0.0%) | 16 (100.0%) |
| Health Care & Social Assistance | 9 (17.3%) | 43 (82.7%) |
| Arts, Entertainment & Recreation | 3 (100.0%) | 0 (0.0%) |
| Accommodation & Food Services | 11 (61.1%) | 7 (38.9%) |
| Public Administration | 30 (93.8%) | 2 (6.2%) |
| Total | 246 (63.1%) | 144 (36.9%) |
Education in Pine Island
School Enrollment in Pine Island
The most common levels of schooling among the 426 students in Pine Island are high school (196 | 46.0%), college / undergraduate (91 | 21.4%), and middle school (58 | 13.6%).
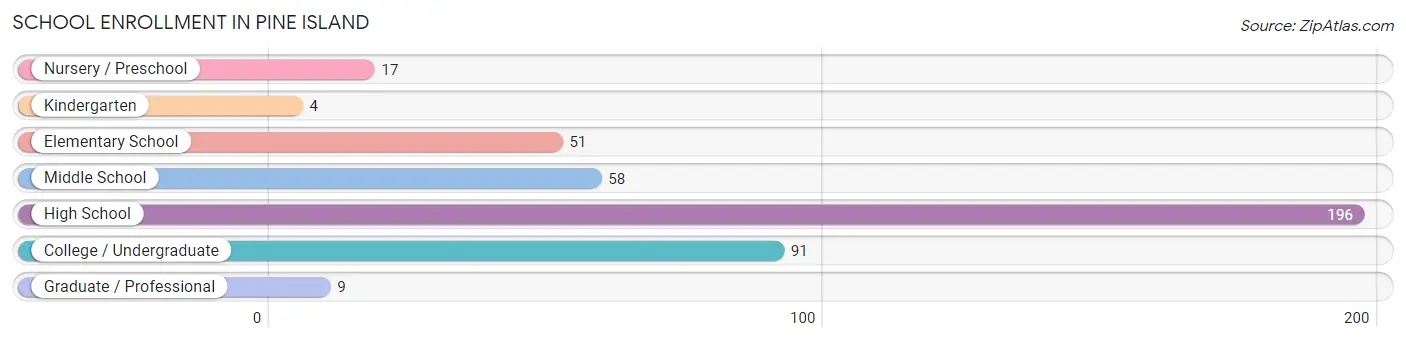
| School Level | # Students | % Students |
| Nursery / Preschool | 17 | 4.0% |
| Kindergarten | 4 | 0.9% |
| Elementary School | 51 | 12.0% |
| Middle School | 58 | 13.6% |
| High School | 196 | 46.0% |
| College / Undergraduate | 91 | 21.4% |
| Graduate / Professional | 9 | 2.1% |
| Total | 426 | 100.0% |
School Enrollment by Age by Funding Source in Pine Island
Out of a total of 426 students who are enrolled in schools in Pine Island, 100 (23.5%) attend a private institution, while the remaining 326 (76.5%) are enrolled in public schools. The age group of 3 to 4 year olds has the highest likelihood of being enrolled in private schools, with 6 (100.0% in the age bracket) enrolled. Conversely, the age group of 10 to 14 year olds has the lowest likelihood of being enrolled in a private school, with 123 (100.0% in the age bracket) attending a public institution.
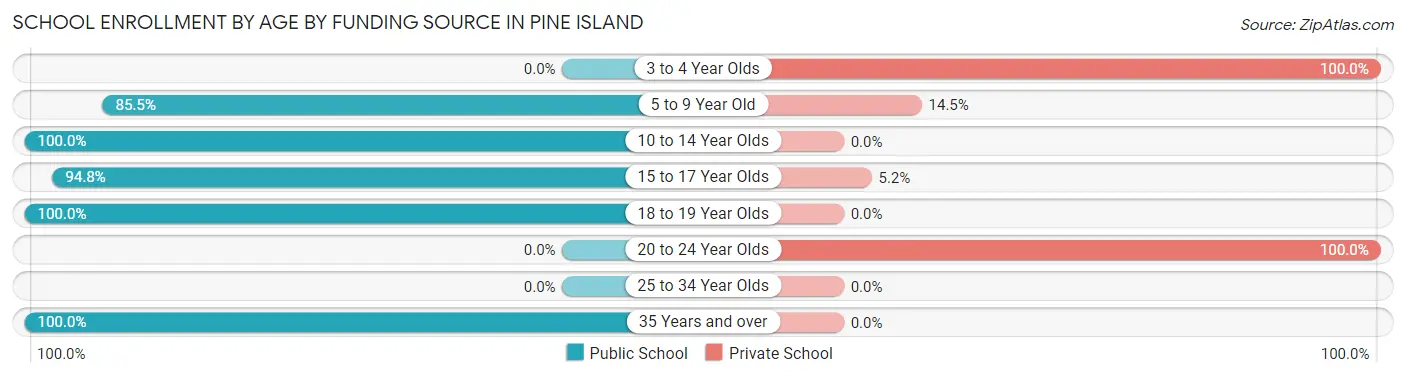
| Age Bracket | Public School | Private School |
| 3 to 4 Year Olds | 0 (0.0%) | 6 (100.0%) |
| 5 to 9 Year Old | 53 (85.5%) | 9 (14.5%) |
| 10 to 14 Year Olds | 123 (100.0%) | 0 (0.0%) |
| 15 to 17 Year Olds | 128 (94.8%) | 7 (5.2%) |
| 18 to 19 Year Olds | 13 (100.0%) | 0 (0.0%) |
| 20 to 24 Year Olds | 0 (0.0%) | 78 (100.0%) |
| 25 to 34 Year Olds | 0 (0.0%) | 0 (0.0%) |
| 35 Years and over | 9 (100.0%) | 0 (0.0%) |
| Total | 326 (76.5%) | 100 (23.5%) |
Educational Attainment by Field of Study in Pine Island
Business (37 | 23.1%), education (32 | 20.0%), physical & health sciences (23 | 14.4%), engineering (21 | 13.1%), and bio, nature & agricultural (16 | 10.0%) are the most common fields of study among 160 individuals in Pine Island who have obtained a bachelor's degree or higher.
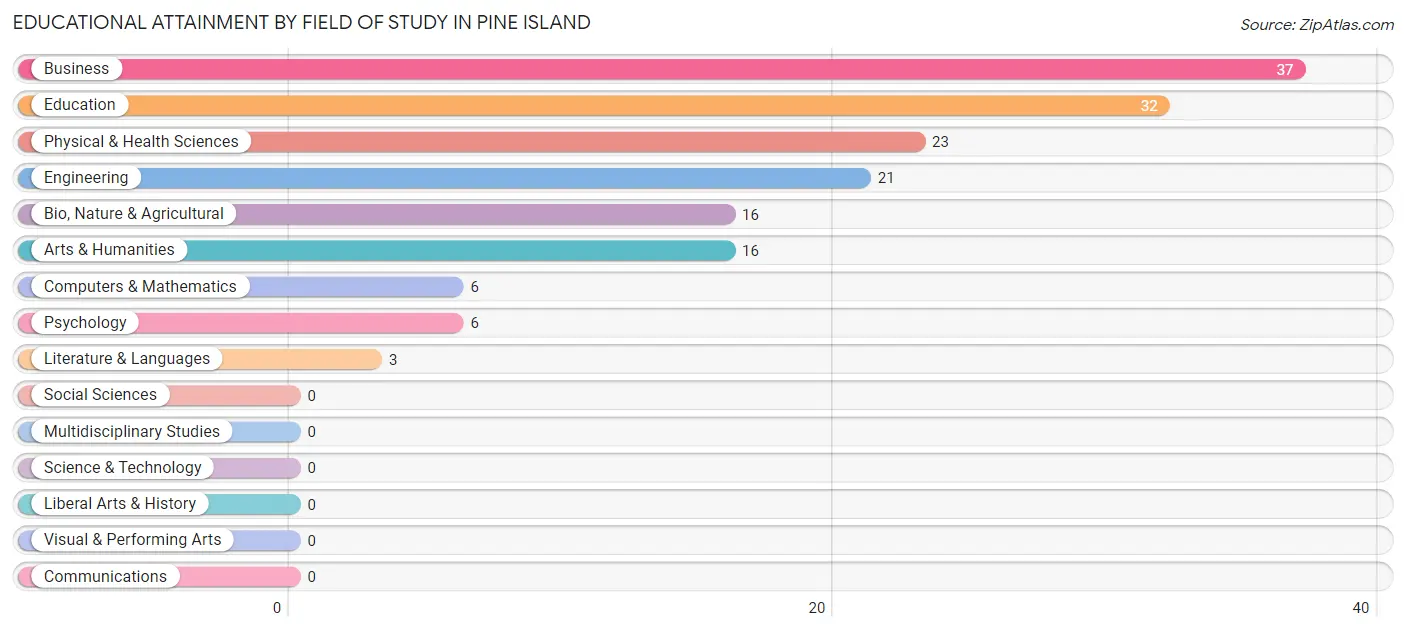
| Field of Study | # Graduates | % Graduates |
| Computers & Mathematics | 6 | 3.7% |
| Bio, Nature & Agricultural | 16 | 10.0% |
| Physical & Health Sciences | 23 | 14.4% |
| Psychology | 6 | 3.7% |
| Social Sciences | 0 | 0.0% |
| Engineering | 21 | 13.1% |
| Multidisciplinary Studies | 0 | 0.0% |
| Science & Technology | 0 | 0.0% |
| Business | 37 | 23.1% |
| Education | 32 | 20.0% |
| Literature & Languages | 3 | 1.9% |
| Liberal Arts & History | 0 | 0.0% |
| Visual & Performing Arts | 0 | 0.0% |
| Communications | 0 | 0.0% |
| Arts & Humanities | 16 | 10.0% |
| Total | 160 | 100.0% |
Transportation & Commute in Pine Island
Vehicle Availability by Sex in Pine Island
The most prevalent vehicle ownership categories in Pine Island are males with 2 vehicles (108, accounting for 43.9%) and females with 2 vehicles (46, making up 75.0%).
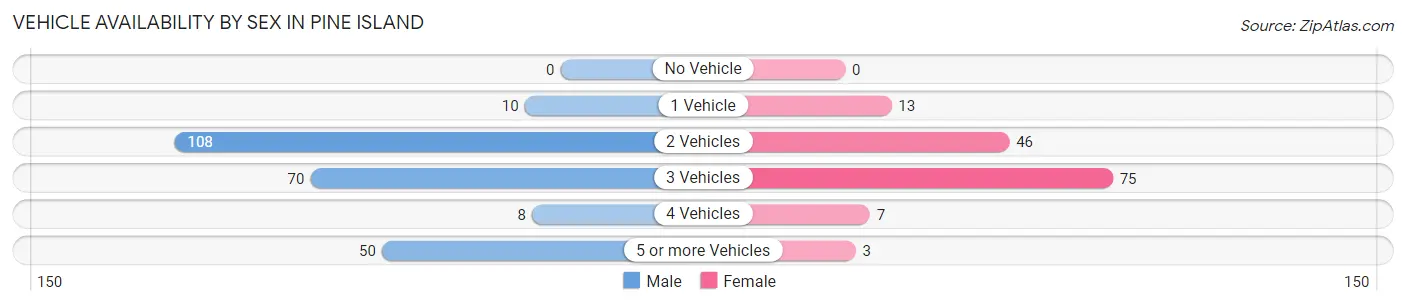
| Vehicles Available | Male | Female |
| No Vehicle | 0 (0.0%) | 0 (0.0%) |
| 1 Vehicle | 10 (4.1%) | 13 (9.0%) |
| 2 Vehicles | 108 (43.9%) | 46 (31.9%) |
| 3 Vehicles | 70 (28.5%) | 75 (52.1%) |
| 4 Vehicles | 8 (3.3%) | 7 (4.9%) |
| 5 or more Vehicles | 50 (20.3%) | 3 (2.1%) |
| Total | 246 (100.0%) | 144 (100.0%) |
Commute Time in Pine Island
The most frequently occuring commute durations in Pine Island are 60 to 89 minutes (84 commuters, 23.7%), 15 to 19 minutes (49 commuters, 13.8%), and 30 to 34 minutes (45 commuters, 12.7%).
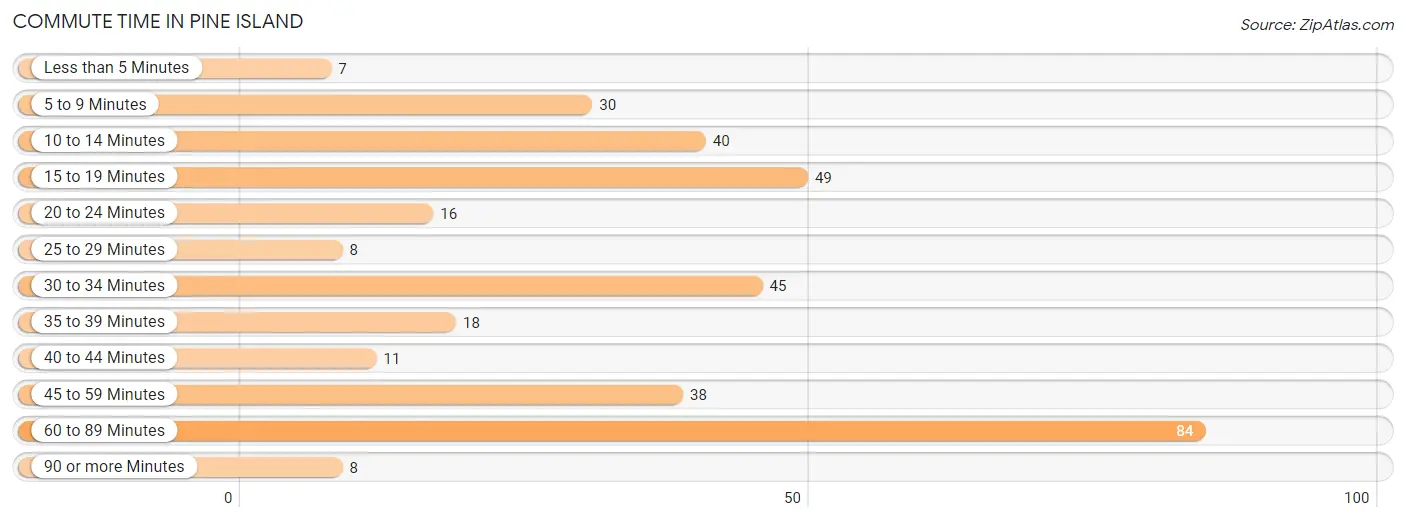
| Commute Time | # Commuters | % Commuters |
| Less than 5 Minutes | 7 | 2.0% |
| 5 to 9 Minutes | 30 | 8.5% |
| 10 to 14 Minutes | 40 | 11.3% |
| 15 to 19 Minutes | 49 | 13.8% |
| 20 to 24 Minutes | 16 | 4.5% |
| 25 to 29 Minutes | 8 | 2.3% |
| 30 to 34 Minutes | 45 | 12.7% |
| 35 to 39 Minutes | 18 | 5.1% |
| 40 to 44 Minutes | 11 | 3.1% |
| 45 to 59 Minutes | 38 | 10.7% |
| 60 to 89 Minutes | 84 | 23.7% |
| 90 or more Minutes | 8 | 2.3% |
Commute Time by Sex in Pine Island
The most common commute times in Pine Island are 60 to 89 minutes (71 commuters, 32.3%) for males and 10 to 14 minutes (29 commuters, 21.6%) for females.
| Commute Time | Male | Female |
| Less than 5 Minutes | 0 (0.0%) | 7 (5.2%) |
| 5 to 9 Minutes | 23 (10.4%) | 7 (5.2%) |
| 10 to 14 Minutes | 11 (5.0%) | 29 (21.6%) |
| 15 to 19 Minutes | 31 (14.1%) | 18 (13.4%) |
| 20 to 24 Minutes | 16 (7.3%) | 0 (0.0%) |
| 25 to 29 Minutes | 0 (0.0%) | 8 (6.0%) |
| 30 to 34 Minutes | 43 (19.6%) | 2 (1.5%) |
| 35 to 39 Minutes | 10 (4.5%) | 8 (6.0%) |
| 40 to 44 Minutes | 3 (1.4%) | 8 (6.0%) |
| 45 to 59 Minutes | 12 (5.4%) | 26 (19.4%) |
| 60 to 89 Minutes | 71 (32.3%) | 13 (9.7%) |
| 90 or more Minutes | 0 (0.0%) | 8 (6.0%) |
Time of Departure to Work by Sex in Pine Island
The most frequent times of departure to work in Pine Island are 6:30 AM to 6:59 AM (44, 20.0%) for males and 8:00 AM to 8:29 AM (48, 35.8%) for females.
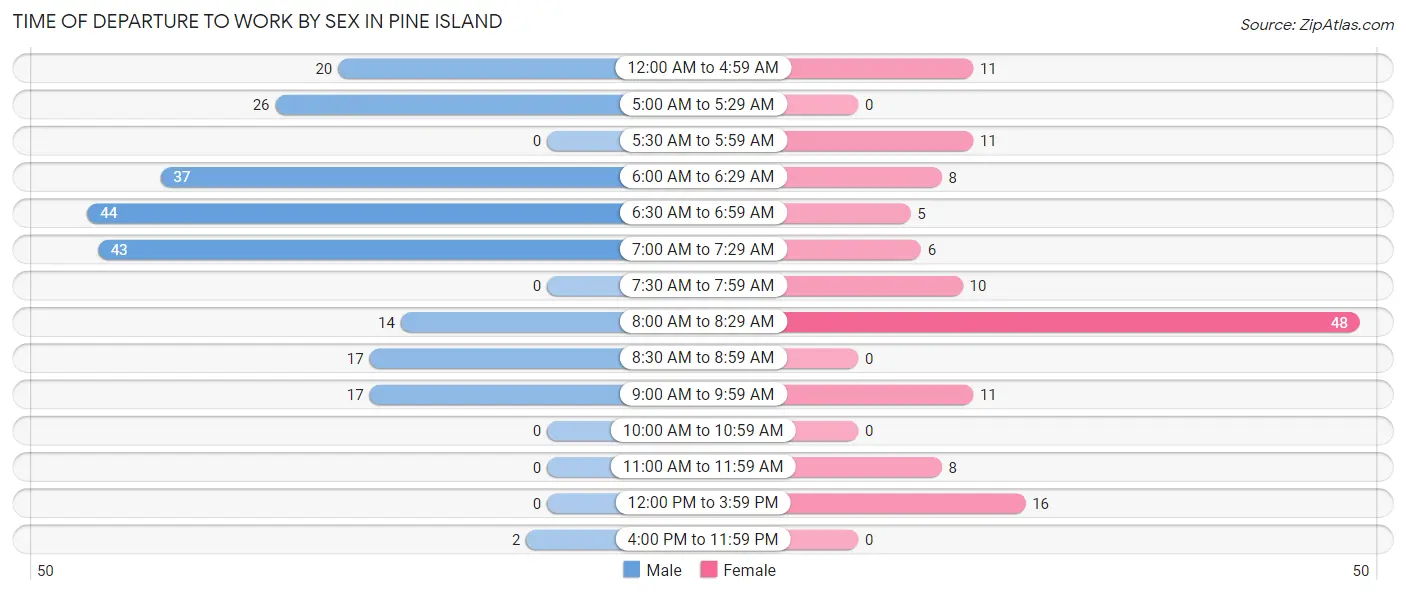
| Time of Departure | Male | Female |
| 12:00 AM to 4:59 AM | 20 (9.1%) | 11 (8.2%) |
| 5:00 AM to 5:29 AM | 26 (11.8%) | 0 (0.0%) |
| 5:30 AM to 5:59 AM | 0 (0.0%) | 11 (8.2%) |
| 6:00 AM to 6:29 AM | 37 (16.8%) | 8 (6.0%) |
| 6:30 AM to 6:59 AM | 44 (20.0%) | 5 (3.7%) |
| 7:00 AM to 7:29 AM | 43 (19.6%) | 6 (4.5%) |
| 7:30 AM to 7:59 AM | 0 (0.0%) | 10 (7.5%) |
| 8:00 AM to 8:29 AM | 14 (6.4%) | 48 (35.8%) |
| 8:30 AM to 8:59 AM | 17 (7.7%) | 0 (0.0%) |
| 9:00 AM to 9:59 AM | 17 (7.7%) | 11 (8.2%) |
| 10:00 AM to 10:59 AM | 0 (0.0%) | 0 (0.0%) |
| 11:00 AM to 11:59 AM | 0 (0.0%) | 8 (6.0%) |
| 12:00 PM to 3:59 PM | 0 (0.0%) | 16 (11.9%) |
| 4:00 PM to 11:59 PM | 2 (0.9%) | 0 (0.0%) |
| Total | 220 (100.0%) | 134 (100.0%) |
Housing Occupancy in Pine Island
Occupancy by Ownership in Pine Island
Of the total 477 dwellings in Pine Island, owner-occupied units account for 407 (85.3%), while renter-occupied units make up 70 (14.7%).
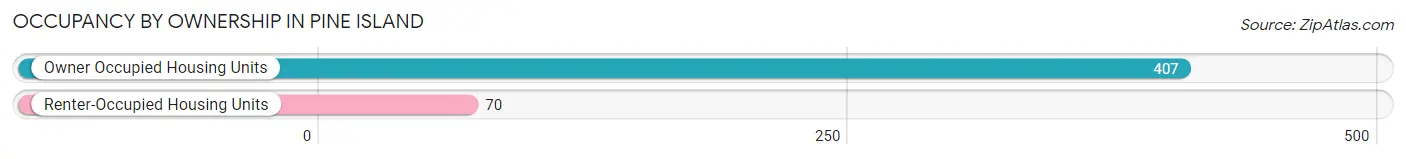
| Occupancy | # Housing Units | % Housing Units |
| Owner Occupied Housing Units | 407 | 85.3% |
| Renter-Occupied Housing Units | 70 | 14.7% |
| Total Occupied Housing Units | 477 | 100.0% |
Occupancy by Household Size in Pine Island
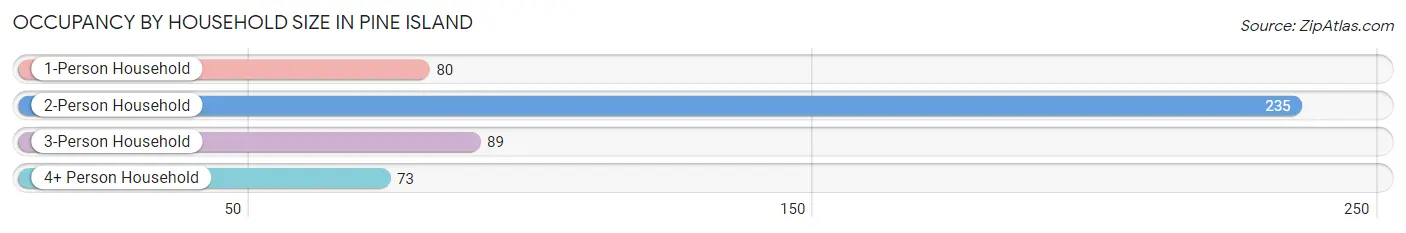
| Household Size | # Housing Units | % Housing Units |
| 1-Person Household | 80 | 16.8% |
| 2-Person Household | 235 | 49.3% |
| 3-Person Household | 89 | 18.7% |
| 4+ Person Household | 73 | 15.3% |
| Total Housing Units | 477 | 100.0% |
Occupancy by Ownership by Household Size in Pine Island
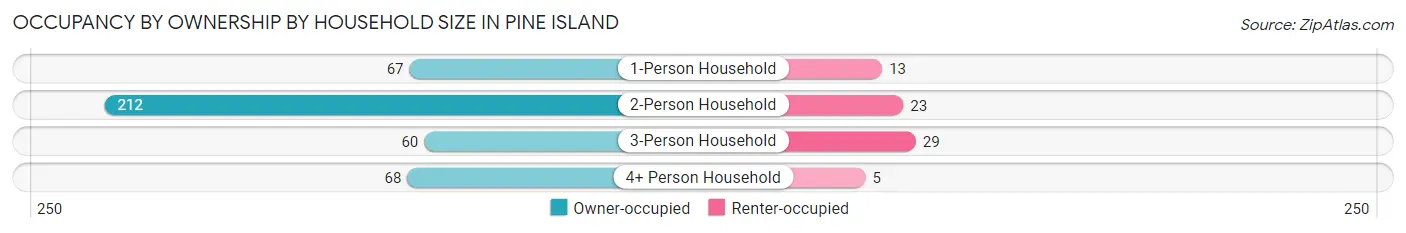
| Household Size | Owner-occupied | Renter-occupied |
| 1-Person Household | 67 (83.8%) | 13 (16.3%) |
| 2-Person Household | 212 (90.2%) | 23 (9.8%) |
| 3-Person Household | 60 (67.4%) | 29 (32.6%) |
| 4+ Person Household | 68 (93.1%) | 5 (6.9%) |
| Total Housing Units | 407 (85.3%) | 70 (14.7%) |
Occupancy by Educational Attainment in Pine Island
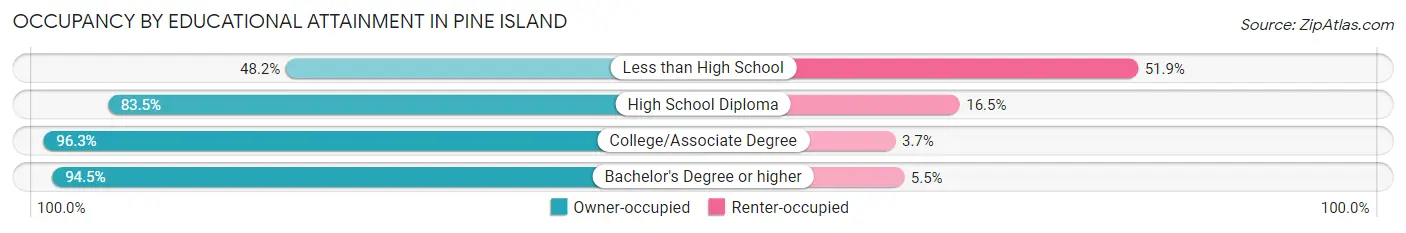
| Household Size | Owner-occupied | Renter-occupied |
| Less than High School | 39 (48.1%) | 42 (51.8%) |
| High School Diploma | 76 (83.5%) | 15 (16.5%) |
| College/Associate Degree | 206 (96.3%) | 8 (3.7%) |
| Bachelor's Degree or higher | 86 (94.5%) | 5 (5.5%) |
Occupancy by Age of Householder in Pine Island
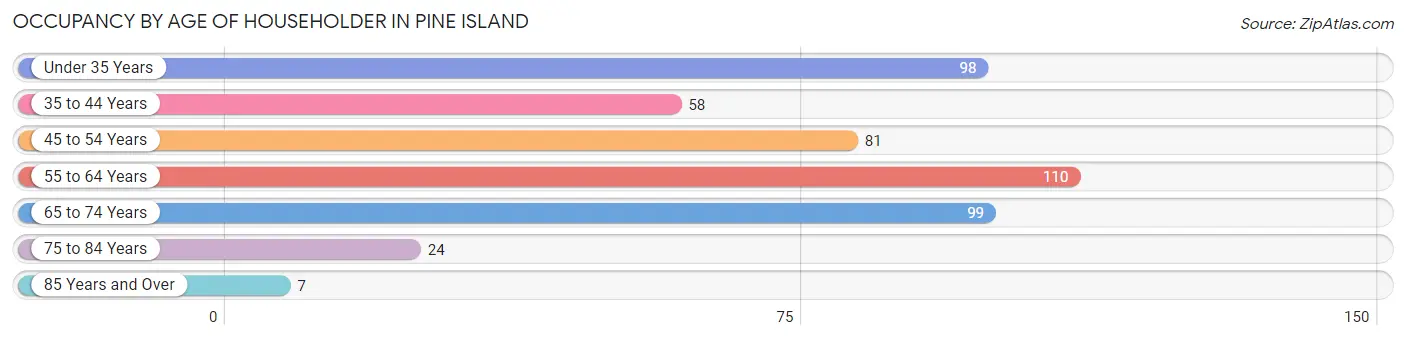
| Age Bracket | # Households | % Households |
| Under 35 Years | 98 | 20.5% |
| 35 to 44 Years | 58 | 12.2% |
| 45 to 54 Years | 81 | 17.0% |
| 55 to 64 Years | 110 | 23.1% |
| 65 to 74 Years | 99 | 20.7% |
| 75 to 84 Years | 24 | 5.0% |
| 85 Years and Over | 7 | 1.5% |
| Total | 477 | 100.0% |
Housing Finances in Pine Island
Median Income by Occupancy in Pine Island
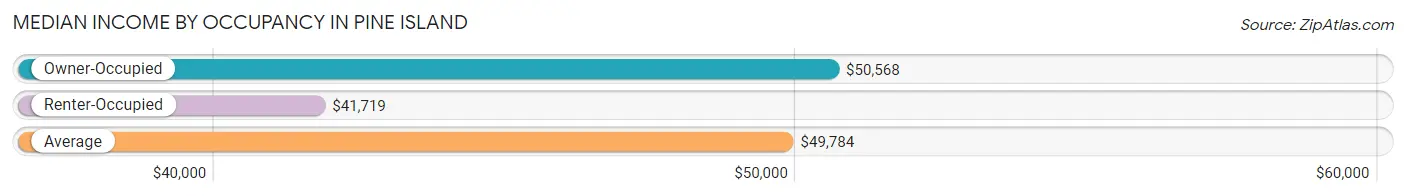
| Occupancy Type | # Households | Median Income |
| Owner-Occupied | 407 (85.3%) | $50,568 |
| Renter-Occupied | 70 (14.7%) | $41,719 |
| Average | 477 (100.0%) | $49,784 |
Occupancy by Householder Income Bracket in Pine Island
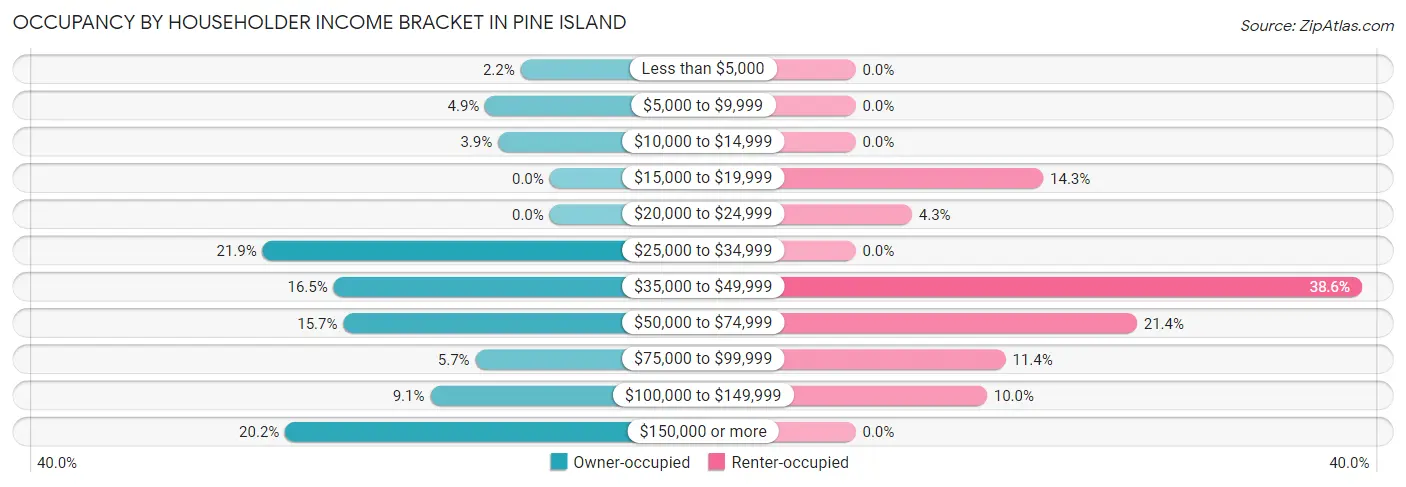
| Income Bracket | Owner-occupied | Renter-occupied |
| Less than $5,000 | 9 (2.2%) | 0 (0.0%) |
| $5,000 to $9,999 | 20 (4.9%) | 0 (0.0%) |
| $10,000 to $14,999 | 16 (3.9%) | 0 (0.0%) |
| $15,000 to $19,999 | 0 (0.0%) | 10 (14.3%) |
| $20,000 to $24,999 | 0 (0.0%) | 3 (4.3%) |
| $25,000 to $34,999 | 89 (21.9%) | 0 (0.0%) |
| $35,000 to $49,999 | 67 (16.5%) | 27 (38.6%) |
| $50,000 to $74,999 | 64 (15.7%) | 15 (21.4%) |
| $75,000 to $99,999 | 23 (5.7%) | 8 (11.4%) |
| $100,000 to $149,999 | 37 (9.1%) | 7 (10.0%) |
| $150,000 or more | 82 (20.2%) | 0 (0.0%) |
| Total | 407 (100.0%) | 70 (100.0%) |
Monthly Housing Cost Tiers in Pine Island
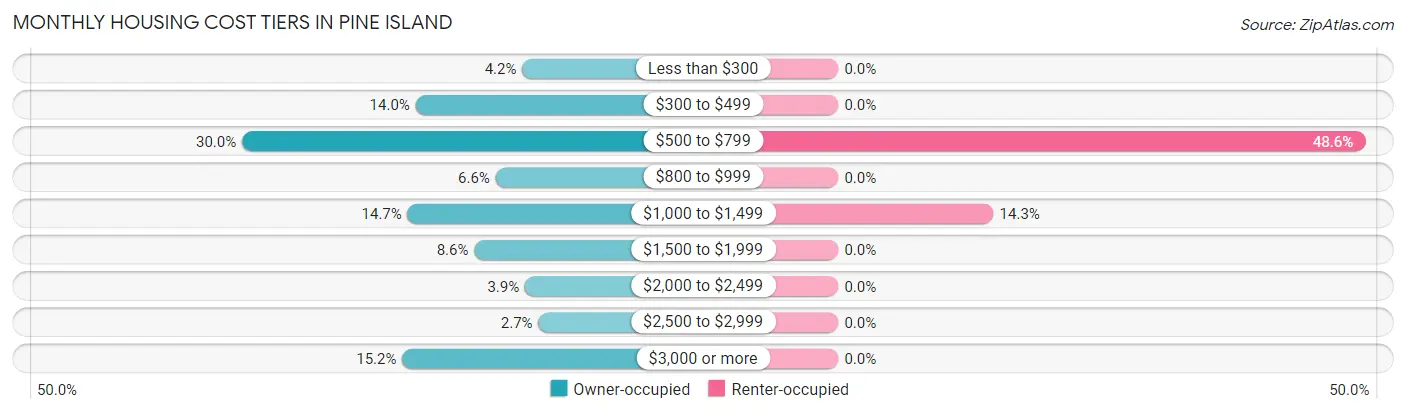
| Monthly Cost | Owner-occupied | Renter-occupied |
| Less than $300 | 17 (4.2%) | 0 (0.0%) |
| $300 to $499 | 57 (14.0%) | 0 (0.0%) |
| $500 to $799 | 122 (30.0%) | 34 (48.6%) |
| $800 to $999 | 27 (6.6%) | 0 (0.0%) |
| $1,000 to $1,499 | 60 (14.7%) | 10 (14.3%) |
| $1,500 to $1,999 | 35 (8.6%) | 0 (0.0%) |
| $2,000 to $2,499 | 16 (3.9%) | 0 (0.0%) |
| $2,500 to $2,999 | 11 (2.7%) | 0 (0.0%) |
| $3,000 or more | 62 (15.2%) | 0 (0.0%) |
| Total | 407 (100.0%) | 70 (100.0%) |
Physical Housing Characteristics in Pine Island
Housing Structures in Pine Island
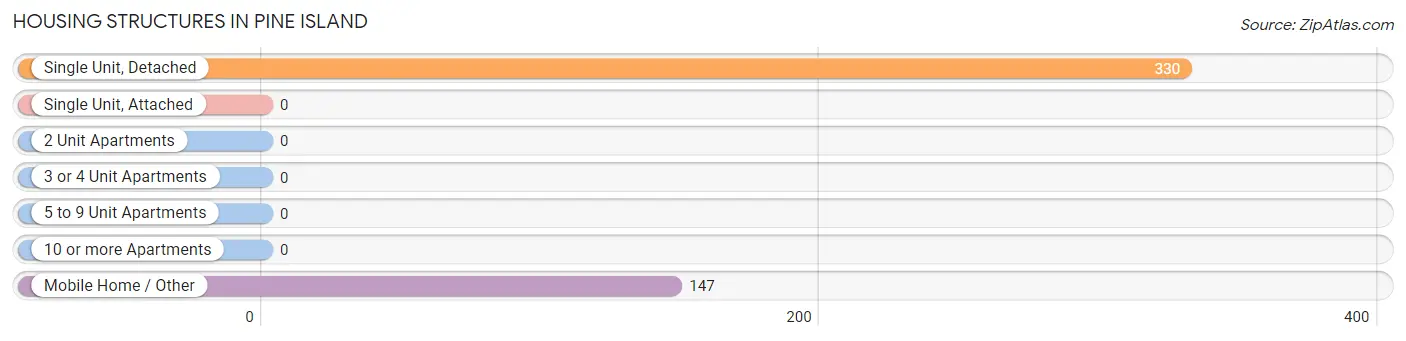
| Structure Type | # Housing Units | % Housing Units |
| Single Unit, Detached | 330 | 69.2% |
| Single Unit, Attached | 0 | 0.0% |
| 2 Unit Apartments | 0 | 0.0% |
| 3 or 4 Unit Apartments | 0 | 0.0% |
| 5 to 9 Unit Apartments | 0 | 0.0% |
| 10 or more Apartments | 0 | 0.0% |
| Mobile Home / Other | 147 | 30.8% |
| Total | 477 | 100.0% |
Housing Structures by Occupancy in Pine Island
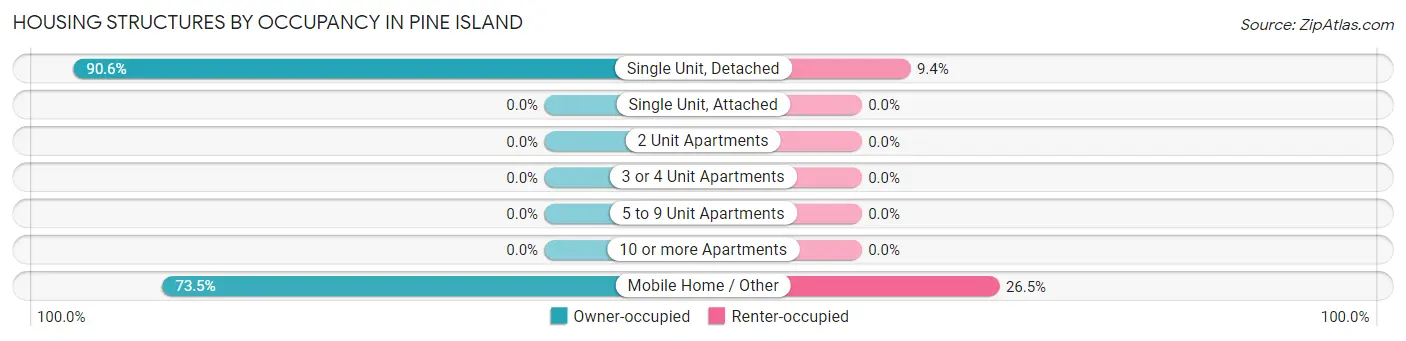
| Structure Type | Owner-occupied | Renter-occupied |
| Single Unit, Detached | 299 (90.6%) | 31 (9.4%) |
| Single Unit, Attached | 0 (0.0%) | 0 (0.0%) |
| 2 Unit Apartments | 0 (0.0%) | 0 (0.0%) |
| 3 or 4 Unit Apartments | 0 (0.0%) | 0 (0.0%) |
| 5 to 9 Unit Apartments | 0 (0.0%) | 0 (0.0%) |
| 10 or more Apartments | 0 (0.0%) | 0 (0.0%) |
| Mobile Home / Other | 108 (73.5%) | 39 (26.5%) |
| Total | 407 (85.3%) | 70 (14.7%) |
Housing Structures by Number of Rooms in Pine Island
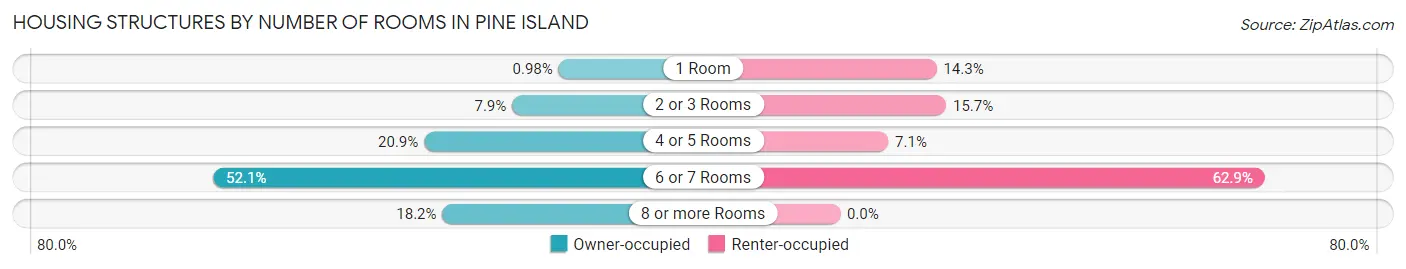
| Number of Rooms | Owner-occupied | Renter-occupied |
| 1 Room | 4 (1.0%) | 10 (14.3%) |
| 2 or 3 Rooms | 32 (7.9%) | 11 (15.7%) |
| 4 or 5 Rooms | 85 (20.9%) | 5 (7.1%) |
| 6 or 7 Rooms | 212 (52.1%) | 44 (62.9%) |
| 8 or more Rooms | 74 (18.2%) | 0 (0.0%) |
| Total | 407 (100.0%) | 70 (100.0%) |
Housing Structure by Heating Type in Pine Island
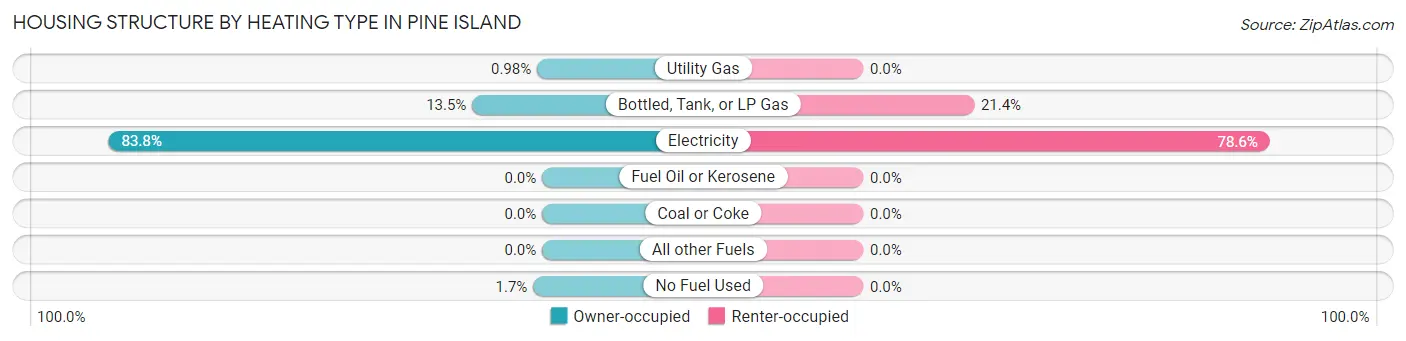
| Heating Type | Owner-occupied | Renter-occupied |
| Utility Gas | 4 (1.0%) | 0 (0.0%) |
| Bottled, Tank, or LP Gas | 55 (13.5%) | 15 (21.4%) |
| Electricity | 341 (83.8%) | 55 (78.6%) |
| Fuel Oil or Kerosene | 0 (0.0%) | 0 (0.0%) |
| Coal or Coke | 0 (0.0%) | 0 (0.0%) |
| All other Fuels | 0 (0.0%) | 0 (0.0%) |
| No Fuel Used | 7 (1.7%) | 0 (0.0%) |
| Total | 407 (100.0%) | 70 (100.0%) |
Household Vehicle Usage in Pine Island
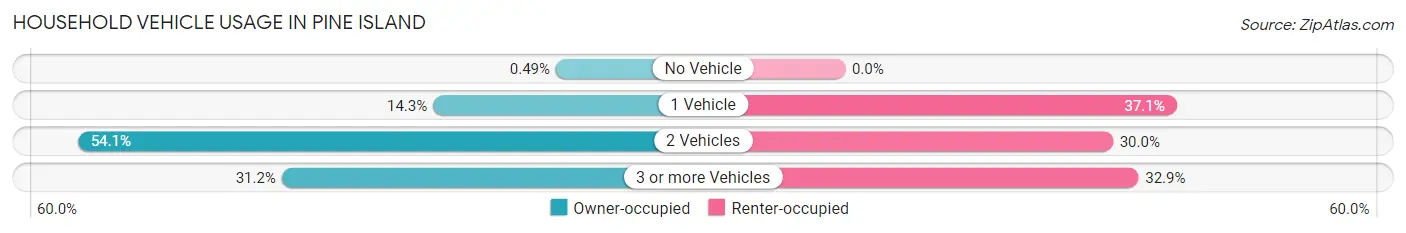
| Vehicles per Household | Owner-occupied | Renter-occupied |
| No Vehicle | 2 (0.5%) | 0 (0.0%) |
| 1 Vehicle | 58 (14.2%) | 26 (37.1%) |
| 2 Vehicles | 220 (54.0%) | 21 (30.0%) |
| 3 or more Vehicles | 127 (31.2%) | 23 (32.9%) |
| Total | 407 (100.0%) | 70 (100.0%) |
Real Estate & Mortgages in Pine Island
Real Estate and Mortgage Overview in Pine Island
| Characteristic | Without Mortgage | With Mortgage |
| Housing Units | 218 | 189 |
| Median Property Value | $329,300 | $460,400 |
| Median Household Income | $38,833 | $69 |
| Monthly Housing Costs | $729 | $58 |
| Real Estate Taxes | $4,217 | $24 |
Property Value by Mortgage Status in Pine Island
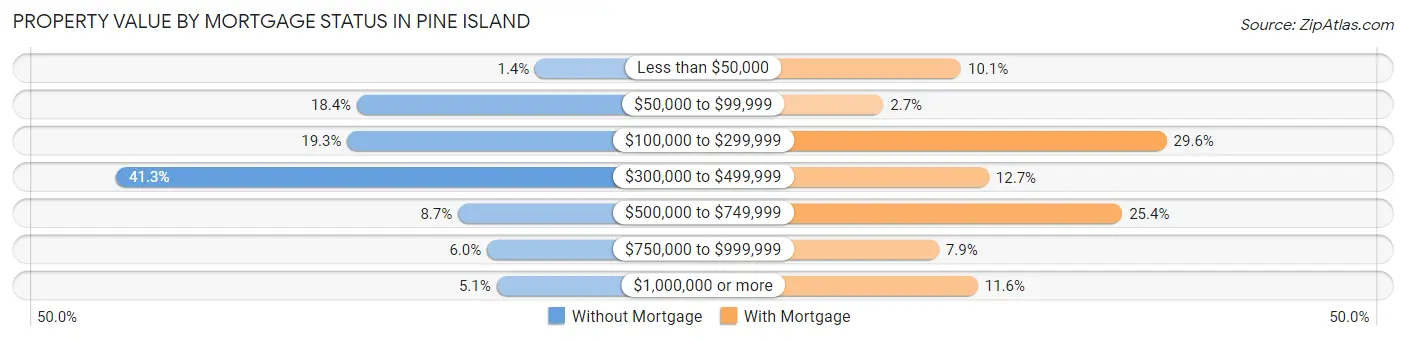
| Property Value | Without Mortgage | With Mortgage |
| Less than $50,000 | 3 (1.4%) | 19 (10.1%) |
| $50,000 to $99,999 | 40 (18.3%) | 5 (2.6%) |
| $100,000 to $299,999 | 42 (19.3%) | 56 (29.6%) |
| $300,000 to $499,999 | 90 (41.3%) | 24 (12.7%) |
| $500,000 to $749,999 | 19 (8.7%) | 48 (25.4%) |
| $750,000 to $999,999 | 13 (6.0%) | 15 (7.9%) |
| $1,000,000 or more | 11 (5.1%) | 22 (11.6%) |
| Total | 218 (100.0%) | 189 (100.0%) |
Household Income by Mortgage Status in Pine Island
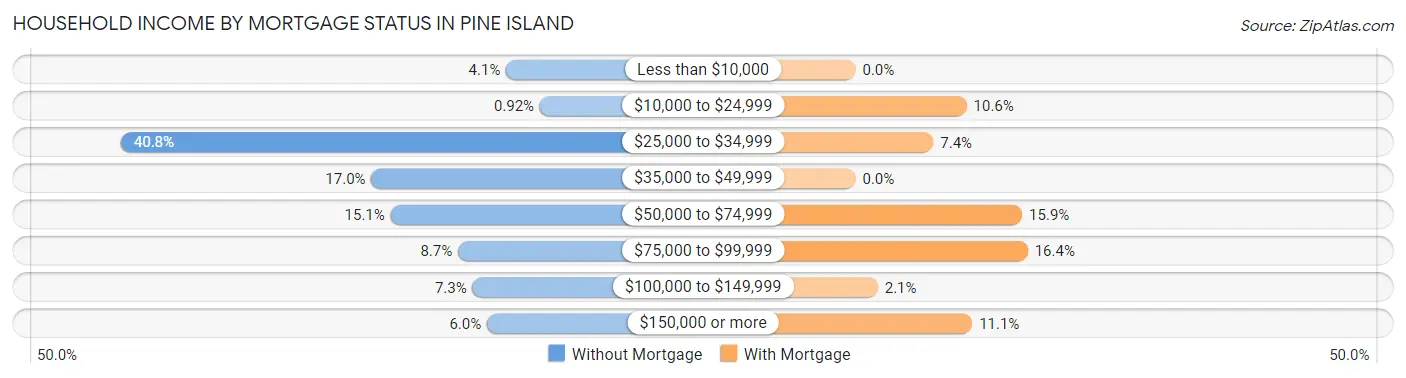
| Household Income | Without Mortgage | With Mortgage |
| Less than $10,000 | 9 (4.1%) | 0 (0.0%) |
| $10,000 to $24,999 | 2 (0.9%) | 20 (10.6%) |
| $25,000 to $34,999 | 89 (40.8%) | 14 (7.4%) |
| $35,000 to $49,999 | 37 (17.0%) | 0 (0.0%) |
| $50,000 to $74,999 | 33 (15.1%) | 30 (15.9%) |
| $75,000 to $99,999 | 19 (8.7%) | 31 (16.4%) |
| $100,000 to $149,999 | 16 (7.3%) | 4 (2.1%) |
| $150,000 or more | 13 (6.0%) | 21 (11.1%) |
| Total | 218 (100.0%) | 189 (100.0%) |
Property Value to Household Income Ratio in Pine Island
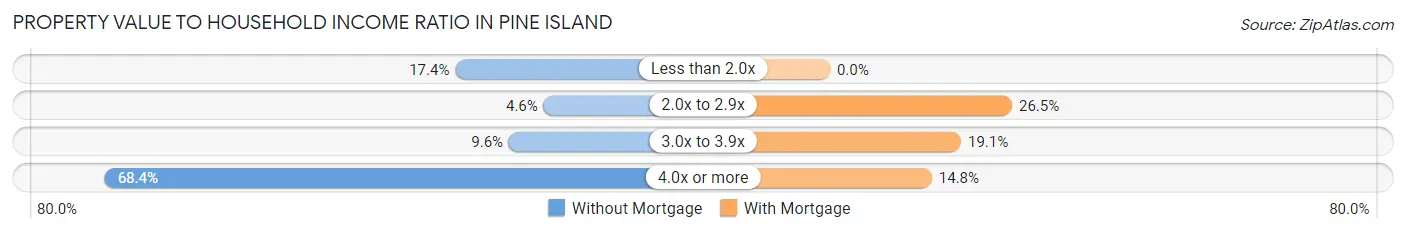
| Value-to-Income Ratio | Without Mortgage | With Mortgage |
| Less than 2.0x | 38 (17.4%) | 0 (0.0%) |
| 2.0x to 2.9x | 10 (4.6%) | 50 (26.5%) |
| 3.0x to 3.9x | 21 (9.6%) | 36 (19.1%) |
| 4.0x or more | 149 (68.3%) | 28 (14.8%) |
| Total | 218 (100.0%) | 189 (100.0%) |
Real Estate Taxes by Mortgage Status in Pine Island
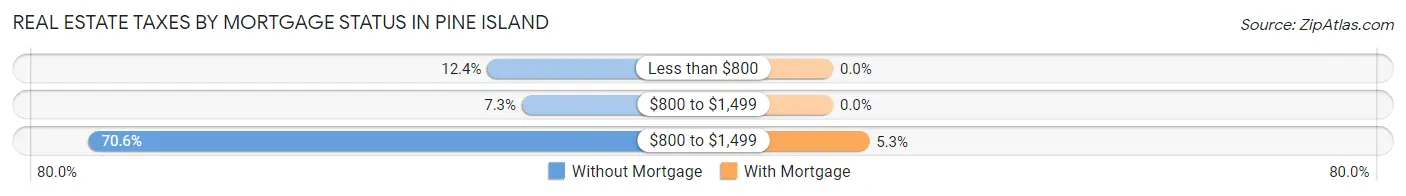
| Property Taxes | Without Mortgage | With Mortgage |
| Less than $800 | 27 (12.4%) | 0 (0.0%) |
| $800 to $1,499 | 16 (7.3%) | 0 (0.0%) |
| $800 to $1,499 | 154 (70.6%) | 10 (5.3%) |
| Total | 218 (100.0%) | 189 (100.0%) |
Health & Disability in Pine Island
Health Insurance Coverage by Age in Pine Island
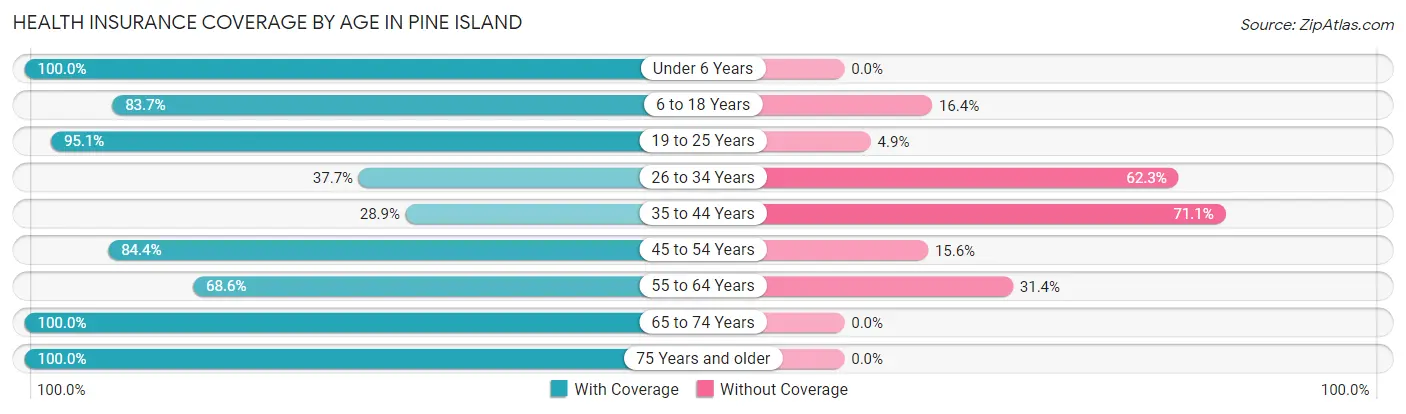
| Age Bracket | With Coverage | Without Coverage |
| Under 6 Years | 48 (100.0%) | 0 (0.0%) |
| 6 to 18 Years | 261 (83.7%) | 51 (16.4%) |
| 19 to 25 Years | 116 (95.1%) | 6 (4.9%) |
| 26 to 34 Years | 29 (37.7%) | 48 (62.3%) |
| 35 to 44 Years | 37 (28.9%) | 91 (71.1%) |
| 45 to 54 Years | 119 (84.4%) | 22 (15.6%) |
| 55 to 64 Years | 144 (68.6%) | 66 (31.4%) |
| 65 to 74 Years | 177 (100.0%) | 0 (0.0%) |
| 75 Years and older | 43 (100.0%) | 0 (0.0%) |
| Total | 974 (77.4%) | 284 (22.6%) |
Health Insurance Coverage by Citizenship Status in Pine Island
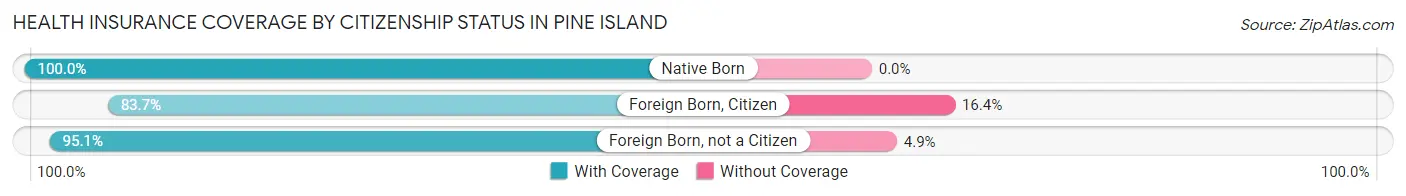
| Citizenship Status | With Coverage | Without Coverage |
| Native Born | 48 (100.0%) | 0 (0.0%) |
| Foreign Born, Citizen | 261 (83.7%) | 51 (16.4%) |
| Foreign Born, not a Citizen | 116 (95.1%) | 6 (4.9%) |
Health Insurance Coverage by Household Income in Pine Island
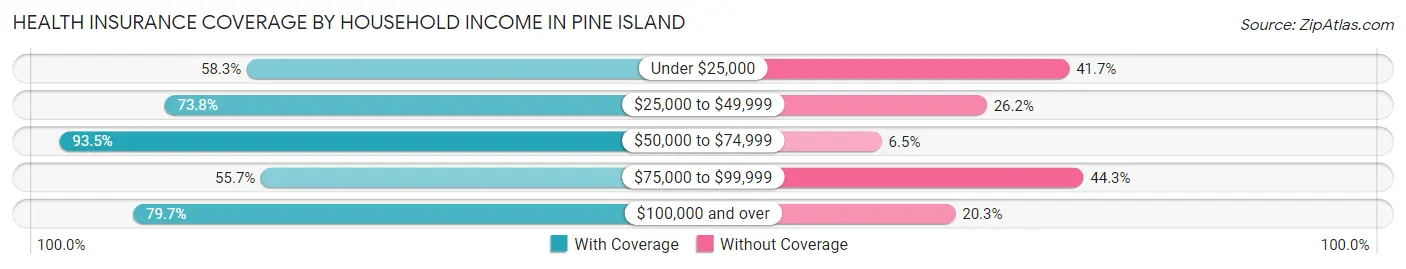
| Household Income | With Coverage | Without Coverage |
| Under $25,000 | 56 (58.3%) | 40 (41.7%) |
| $25,000 to $49,999 | 256 (73.8%) | 91 (26.2%) |
| $50,000 to $74,999 | 229 (93.5%) | 16 (6.5%) |
| $75,000 to $99,999 | 49 (55.7%) | 39 (44.3%) |
| $100,000 and over | 384 (79.7%) | 98 (20.3%) |
Public vs Private Health Insurance Coverage by Age in Pine Island
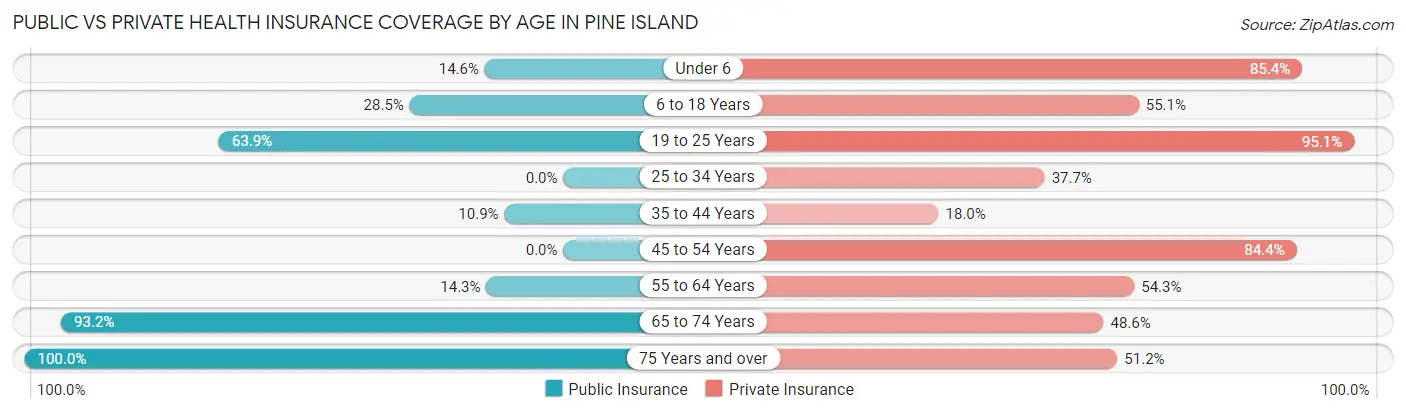
| Age Bracket | Public Insurance | Private Insurance |
| Under 6 | 7 (14.6%) | 41 (85.4%) |
| 6 to 18 Years | 89 (28.5%) | 172 (55.1%) |
| 19 to 25 Years | 78 (63.9%) | 116 (95.1%) |
| 25 to 34 Years | 0 (0.0%) | 29 (37.7%) |
| 35 to 44 Years | 14 (10.9%) | 23 (18.0%) |
| 45 to 54 Years | 0 (0.0%) | 119 (84.4%) |
| 55 to 64 Years | 30 (14.3%) | 114 (54.3%) |
| 65 to 74 Years | 165 (93.2%) | 86 (48.6%) |
| 75 Years and over | 43 (100.0%) | 22 (51.2%) |
| Total | 426 (33.9%) | 722 (57.4%) |
Disability Status by Sex by Age in Pine Island
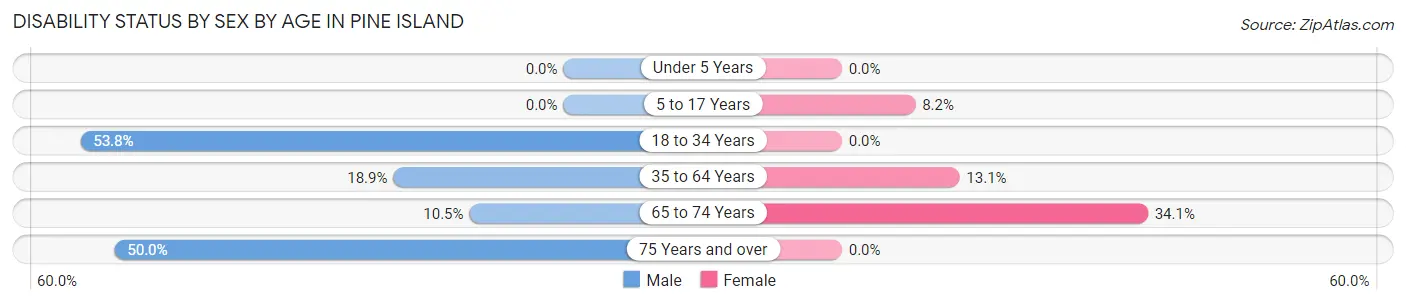
| Age Bracket | Male | Female |
| Under 5 Years | 0 (0.0%) | 0 (0.0%) |
| 5 to 17 Years | 0 (0.0%) | 13 (8.2%) |
| 18 to 34 Years | 78 (53.8%) | 0 (0.0%) |
| 35 to 64 Years | 43 (18.9%) | 33 (13.1%) |
| 65 to 74 Years | 9 (10.5%) | 31 (34.1%) |
| 75 Years and over | 13 (50.0%) | 0 (0.0%) |
Disability Class by Sex by Age in Pine Island
Disability Class: Hearing Difficulty
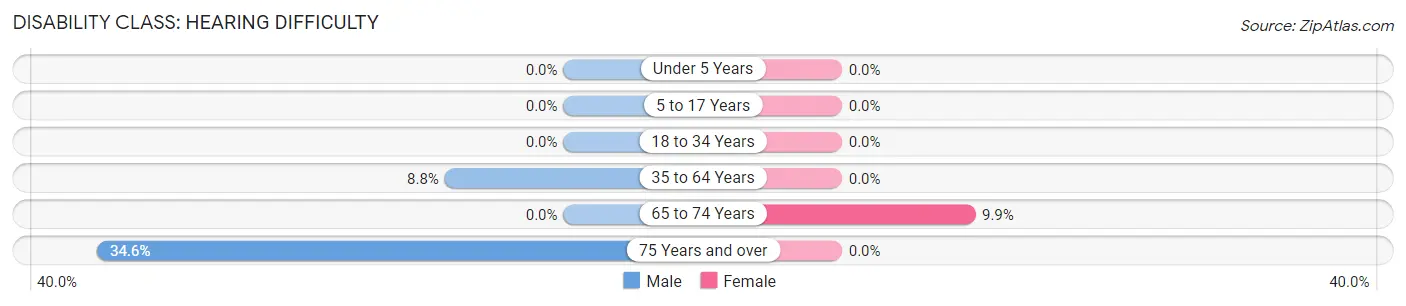
| Age Bracket | Male | Female |
| Under 5 Years | 0 (0.0%) | 0 (0.0%) |
| 5 to 17 Years | 0 (0.0%) | 0 (0.0%) |
| 18 to 34 Years | 0 (0.0%) | 0 (0.0%) |
| 35 to 64 Years | 20 (8.8%) | 0 (0.0%) |
| 65 to 74 Years | 0 (0.0%) | 9 (9.9%) |
| 75 Years and over | 9 (34.6%) | 0 (0.0%) |
Disability Class: Vision Difficulty
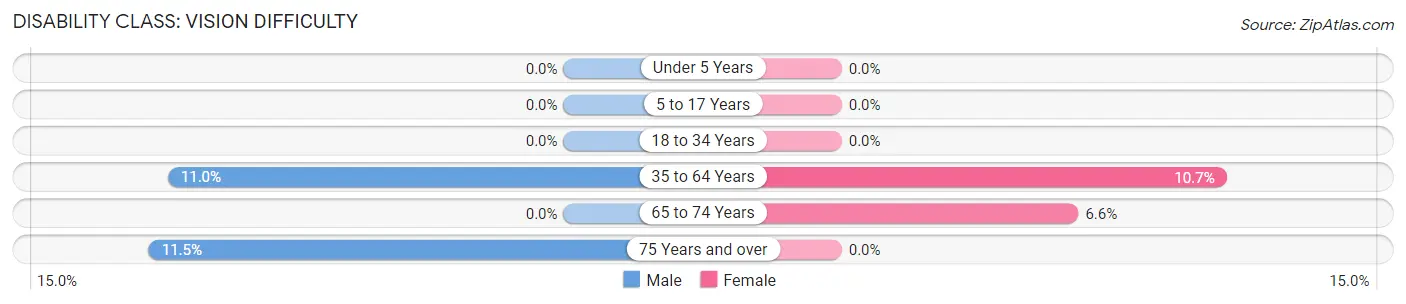
| Age Bracket | Male | Female |
| Under 5 Years | 0 (0.0%) | 0 (0.0%) |
| 5 to 17 Years | 0 (0.0%) | 0 (0.0%) |
| 18 to 34 Years | 0 (0.0%) | 0 (0.0%) |
| 35 to 64 Years | 25 (11.0%) | 27 (10.7%) |
| 65 to 74 Years | 0 (0.0%) | 6 (6.6%) |
| 75 Years and over | 3 (11.5%) | 0 (0.0%) |
Disability Class: Cognitive Difficulty
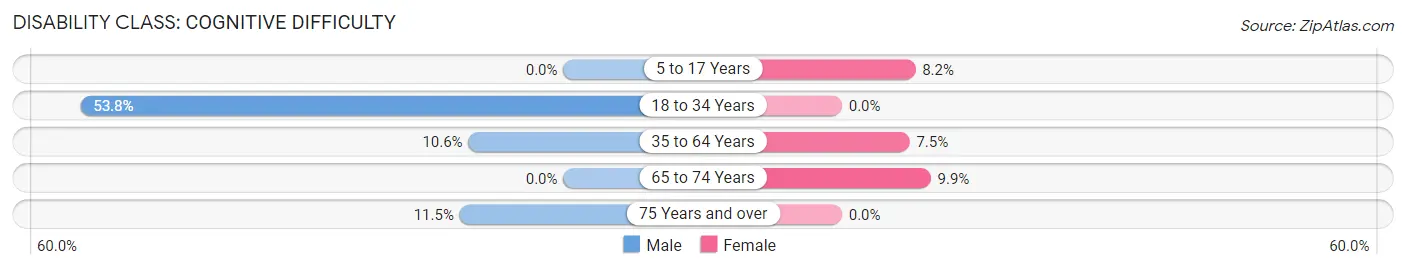
| Age Bracket | Male | Female |
| 5 to 17 Years | 0 (0.0%) | 13 (8.2%) |
| 18 to 34 Years | 78 (53.8%) | 0 (0.0%) |
| 35 to 64 Years | 24 (10.6%) | 19 (7.5%) |
| 65 to 74 Years | 0 (0.0%) | 9 (9.9%) |
| 75 Years and over | 3 (11.5%) | 0 (0.0%) |
Disability Class: Ambulatory Difficulty
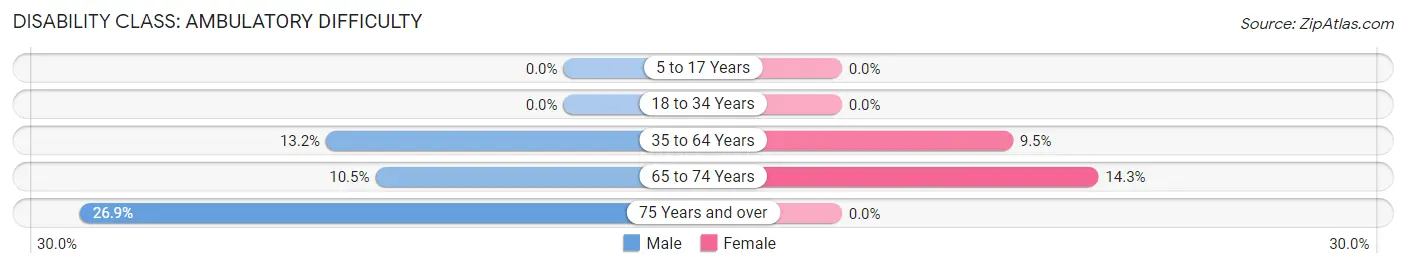
| Age Bracket | Male | Female |
| 5 to 17 Years | 0 (0.0%) | 0 (0.0%) |
| 18 to 34 Years | 0 (0.0%) | 0 (0.0%) |
| 35 to 64 Years | 30 (13.2%) | 24 (9.5%) |
| 65 to 74 Years | 9 (10.5%) | 13 (14.3%) |
| 75 Years and over | 7 (26.9%) | 0 (0.0%) |
Disability Class: Self-Care Difficulty
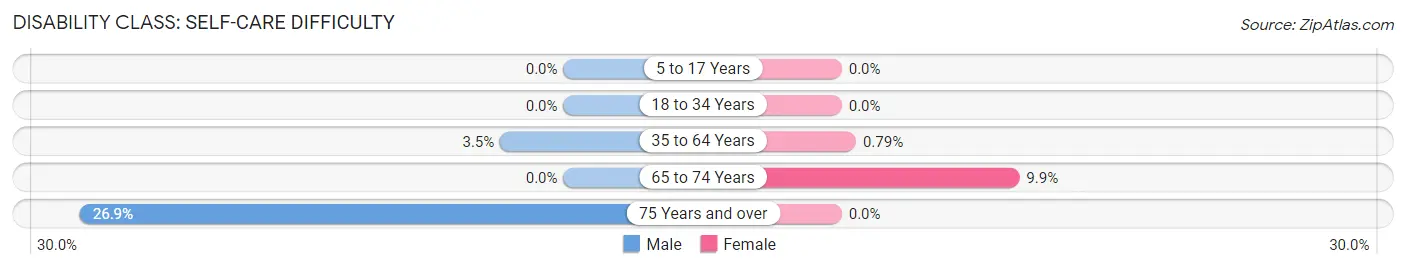
| Age Bracket | Male | Female |
| 5 to 17 Years | 0 (0.0%) | 0 (0.0%) |
| 18 to 34 Years | 0 (0.0%) | 0 (0.0%) |
| 35 to 64 Years | 8 (3.5%) | 2 (0.8%) |
| 65 to 74 Years | 0 (0.0%) | 9 (9.9%) |
| 75 Years and over | 7 (26.9%) | 0 (0.0%) |
Technology Access in Pine Island
Computing Device Access in Pine Island
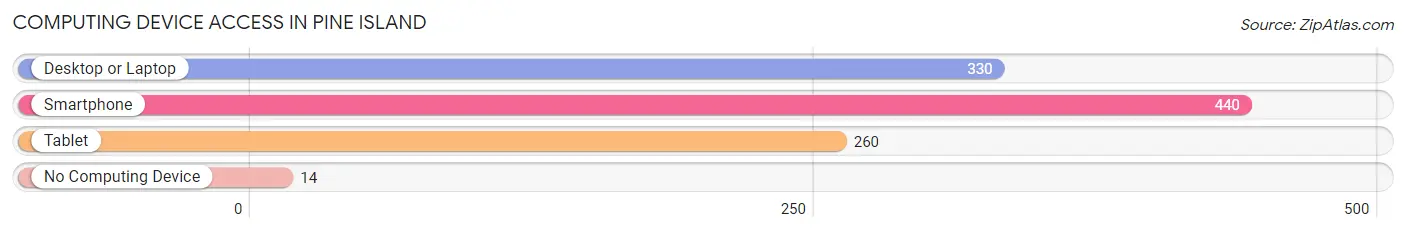
| Device Type | # Households | % Households |
| Desktop or Laptop | 330 | 69.2% |
| Smartphone | 440 | 92.2% |
| Tablet | 260 | 54.5% |
| No Computing Device | 14 | 2.9% |
| Total | 477 | 100.0% |
Internet Access in Pine Island
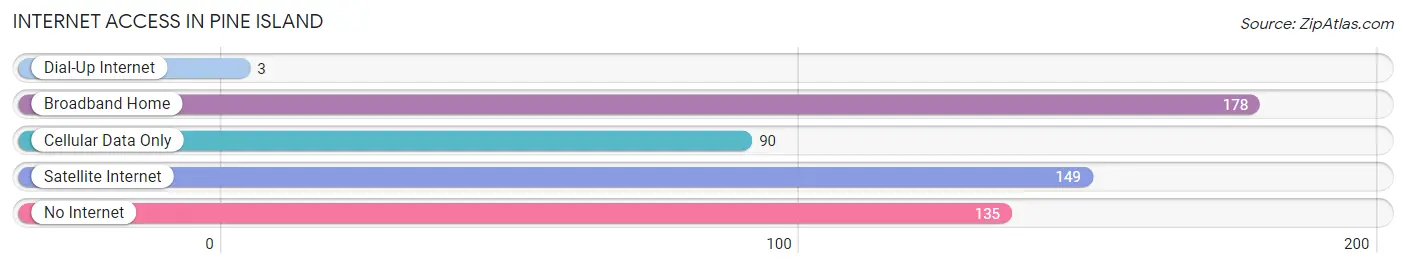
| Internet Type | # Households | % Households |
| Dial-Up Internet | 3 | 0.6% |
| Broadband Home | 178 | 37.3% |
| Cellular Data Only | 90 | 18.9% |
| Satellite Internet | 149 | 31.2% |
| No Internet | 135 | 28.3% |
| Total | 477 | 100.0% |
Pine Island Summary
Pine Island, Texas is a small unincorporated community located in the southeastern corner of Hardin County, Texas. It is situated on the banks of the Neches River, approximately 25 miles east of Beaumont and 25 miles west of Jasper. The population of Pine Island was estimated to be around 200 people in 2020.
History
Pine Island was first settled in the early 1800s by a group of settlers from the nearby town of Beaumont. The settlers were attracted to the area due to its abundance of timber and the Neches River, which provided a convenient means of transportation. The town was originally known as “Piney Point” and was later changed to “Pine Island” in 1845.
The town was officially incorporated in 1848 and was home to a variety of businesses, including a sawmill, a gristmill, a cotton gin, and a general store. The town also had a post office, a school, and a church.
In the late 1800s, the town began to decline due to the depletion of the timber resources and the lack of transportation. The town was eventually abandoned in the early 1900s.
Geography
Pine Island is located in the southeastern corner of Hardin County, Texas. It is situated on the banks of the Neches River, approximately 25 miles east of Beaumont and 25 miles west of Jasper. The town is surrounded by dense pine forests and is home to a variety of wildlife, including deer, wild hogs, and various species of birds.
The climate in Pine Island is humid subtropical, with hot summers and mild winters. The average annual temperature is around 70 degrees Fahrenheit, with an average high of around 90 degrees in the summer and an average low of around 50 degrees in the winter.
Economy
The economy of Pine Island is largely based on agriculture and timber. The town is home to several farms, which produce a variety of crops, including corn, soybeans, and cotton. The timber industry is also an important part of the local economy, with several sawmills located in the area.
In addition to agriculture and timber, Pine Island is also home to a variety of small businesses, including a general store, a gas station, and a restaurant. The town also has a post office and a school.
Demographics
The population of Pine Island was estimated to be around 200 people in 2020. The majority of the population is white, with a small percentage of African Americans and Hispanics. The median household income in Pine Island is around $30,000, and the median home value is around $90,000.
Conclusion
Pine Island, Texas is a small unincorporated community located in the southeastern corner of Hardin County, Texas. It is situated on the banks of the Neches River, approximately 25 miles east of Beaumont and 25 miles west of Jasper. The population of Pine Island was estimated to be around 200 people in 2020. The economy of Pine Island is largely based on agriculture and timber, and the town is home to a variety of small businesses. The majority of the population is white, with a small percentage of African Americans and Hispanics.
Common Questions
What is Per Capita Income in Pine Island?
Per Capita income in Pine Island is $32,176.
What is the Median Family Income in Pine Island?
Median Family Income in Pine Island is $82,625.
What is the Median Household income in Pine Island?
Median Household Income in Pine Island is $49,784.
What is Income or Wage Gap in Pine Island?
Income or Wage Gap in Pine Island is 41.3%.
Women in Pine Island earn 58.7 cents for every dollar earned by a man.
What is Inequality or Gini Index in Pine Island?
Inequality or Gini Index in Pine Island is 0.51.
What is the Total Population of Pine Island?
Total Population of Pine Island is 1,258.
What is the Total Male Population of Pine Island?
Total Male Population of Pine Island is 654.
What is the Total Female Population of Pine Island?
Total Female Population of Pine Island is 604.
What is the Ratio of Males per 100 Females in Pine Island?
There are 108.28 Males per 100 Females in Pine Island.
What is the Ratio of Females per 100 Males in Pine Island?
There are 92.35 Females per 100 Males in Pine Island.
What is the Median Population Age in Pine Island?
Median Population Age in Pine Island is 41.4 Years.
What is the Average Family Size in Pine Island
Average Family Size in Pine Island is 3.5 People.
What is the Average Household Size in Pine Island
Average Household Size in Pine Island is 2.6 People.
How Large is the Labor Force in Pine Island?
There are 414 People in the Labor Forcein in Pine Island.
What is the Percentage of People in the Labor Force in Pine Island?
42.0% of People are in the Labor Force in Pine Island.
What is the Unemployment Rate in Pine Island?
Unemployment Rate in Pine Island is 5.8%.