Zip Codes with the Highest Percentage of Population Employed in Administrative & Support Services in Memphis, TN
RELATED REPORTS & OPTIONS
Administrative & Support Services
Memphis
Compare Zip Codes
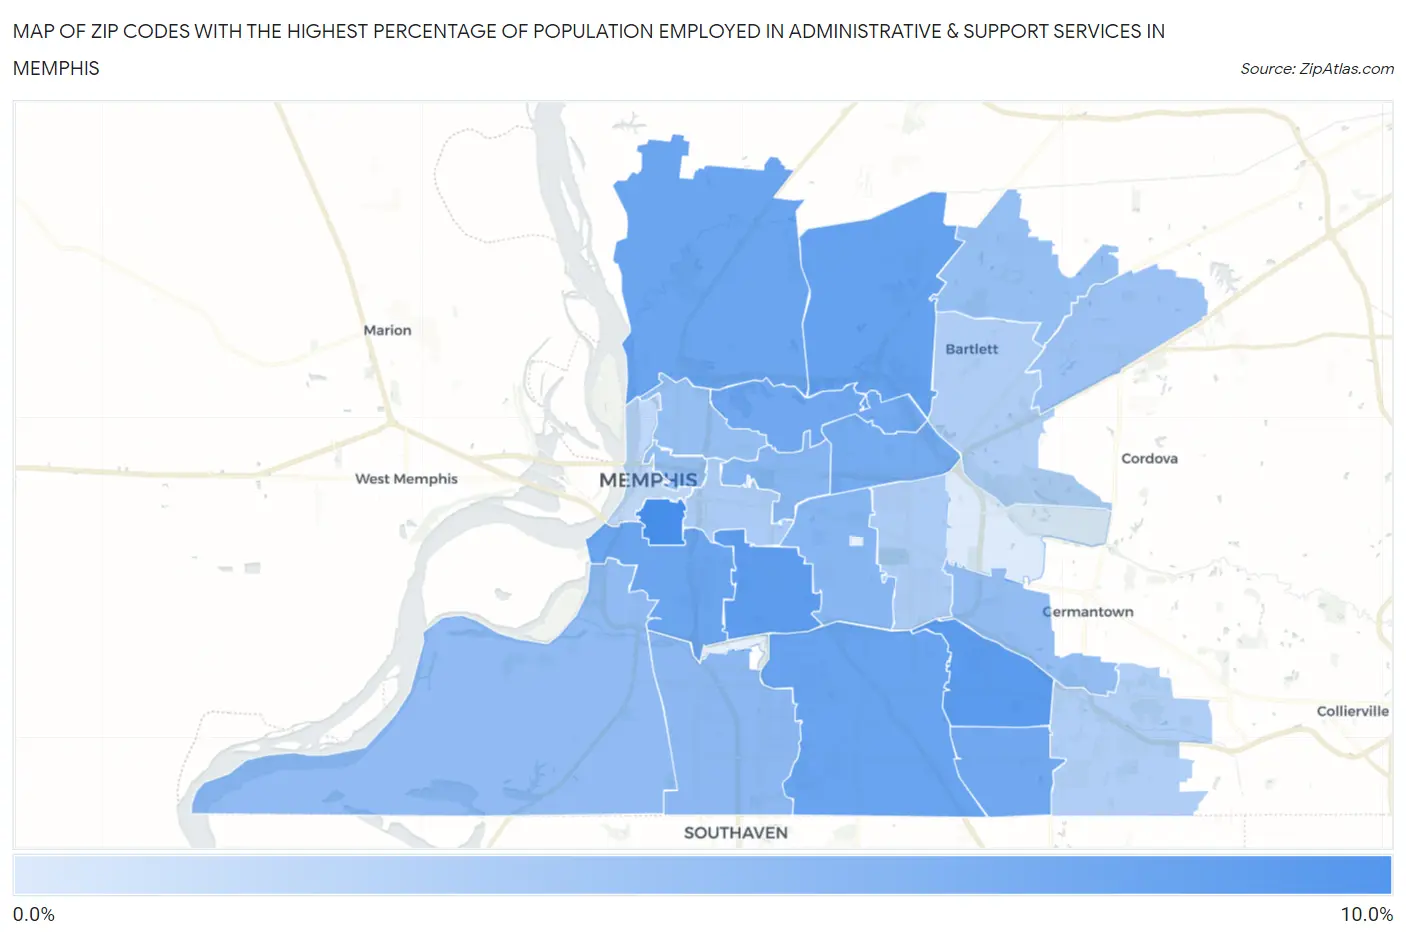
Map of Zip Codes with the Highest Percentage of Population Employed in Administrative & Support Services in Memphis
1.7%
10.0%
Zip Codes with the Highest Percentage of Population Employed in Administrative & Support Services in Memphis, TN
| Zip Code | % Employed | vs State | vs National | |
| 1. | 38126 | 10.0% | 4.4%(+5.61)#23 | 4.1%(+5.81)#1,301 |
| 2. | 38115 | 8.8% | 4.4%(+4.41)#36 | 4.1%(+4.62)#1,807 |
| 3. | 38114 | 8.7% | 4.4%(+4.31)#38 | 4.1%(+4.52)#1,867 |
| 4. | 38128 | 8.3% | 4.4%(+3.97)#44 | 4.1%(+4.18)#2,069 |
| 5. | 38118 | 8.1% | 4.4%(+3.71)#47 | 4.1%(+3.92)#2,221 |
| 6. | 38127 | 7.9% | 4.4%(+3.57)#49 | 4.1%(+3.78)#2,331 |
| 7. | 38106 | 7.8% | 4.4%(+3.49)#51 | 4.1%(+3.69)#2,387 |
| 8. | 38141 | 7.6% | 4.4%(+3.29)#54 | 4.1%(+3.49)#2,560 |
| 9. | 38108 | 7.6% | 4.4%(+3.21)#55 | 4.1%(+3.42)#2,624 |
| 10. | 38122 | 7.3% | 4.4%(+2.97)#59 | 4.1%(+3.17)#2,870 |
| 11. | 38111 | 6.4% | 4.4%(+2.05)#89 | 4.1%(+2.25)#4,078 |
| 12. | 38112 | 6.3% | 4.4%(+1.98)#92 | 4.1%(+2.18)#4,200 |
| 13. | 38116 | 6.1% | 4.4%(+1.75)#99 | 4.1%(+1.95)#4,588 |
| 14. | 38109 | 5.8% | 4.4%(+1.47)#110 | 4.1%(+1.67)#5,110 |
| 15. | 38119 | 5.7% | 4.4%(+1.31)#116 | 4.1%(+1.51)#5,444 |
| 16. | 38107 | 5.6% | 4.4%(+1.30)#118 | 4.1%(+1.50)#5,468 |
| 17. | 38105 | 5.6% | 4.4%(+1.22)#123 | 4.1%(+1.42)#5,651 |
| 18. | 38135 | 5.5% | 4.4%(+1.19)#124 | 4.1%(+1.39)#5,727 |
| 19. | 38133 | 5.3% | 4.4%(+0.947)#134 | 4.1%(+1.15)#6,323 |
| 20. | 38104 | 4.5% | 4.4%(+0.166)#186 | 4.1%(+0.369)#8,663 |
| 21. | 38117 | 4.4% | 4.4%(+0.000)#199 | 4.1%(+0.203)#9,276 |
| 22. | 38134 | 4.2% | 4.4%(-0.124)#207 | 4.1%(+0.079)#9,706 |
| 23. | 38125 | 4.1% | 4.4%(-0.230)#215 | 4.1%(-0.027)#10,149 |
| 24. | 38103 | 3.4% | 4.4%(-0.967)#298 | 4.1%(-0.764)#13,515 |
| 25. | 38120 | 1.7% | 4.4%(-2.60)#445 | 4.1%(-2.40)#21,741 |
1
Common Questions
What are the Top 10 Zip Codes with the Highest Percentage of Population Employed in Administrative & Support Services in Memphis, TN?
Top 10 Zip Codes with the Highest Percentage of Population Employed in Administrative & Support Services in Memphis, TN are:
What zip code has the Highest Percentage of Population Employed in Administrative & Support Services in Memphis, TN?
38126 has the Highest Percentage of Population Employed in Administrative & Support Services in Memphis, TN with 10.0%.
What is the Percentage of Population Employed in Administrative & Support Services in Memphis, TN?
Percentage of Population Employed in Administrative & Support Services in Memphis is 6.2%.
What is the Percentage of Population Employed in Administrative & Support Services in Tennessee?
Percentage of Population Employed in Administrative & Support Services in Tennessee is 4.4%.
What is the Percentage of Population Employed in Administrative & Support Services in the United States?
Percentage of Population Employed in Administrative & Support Services in the United States is 4.1%.