Crab Orchard, TN Map & Demographics
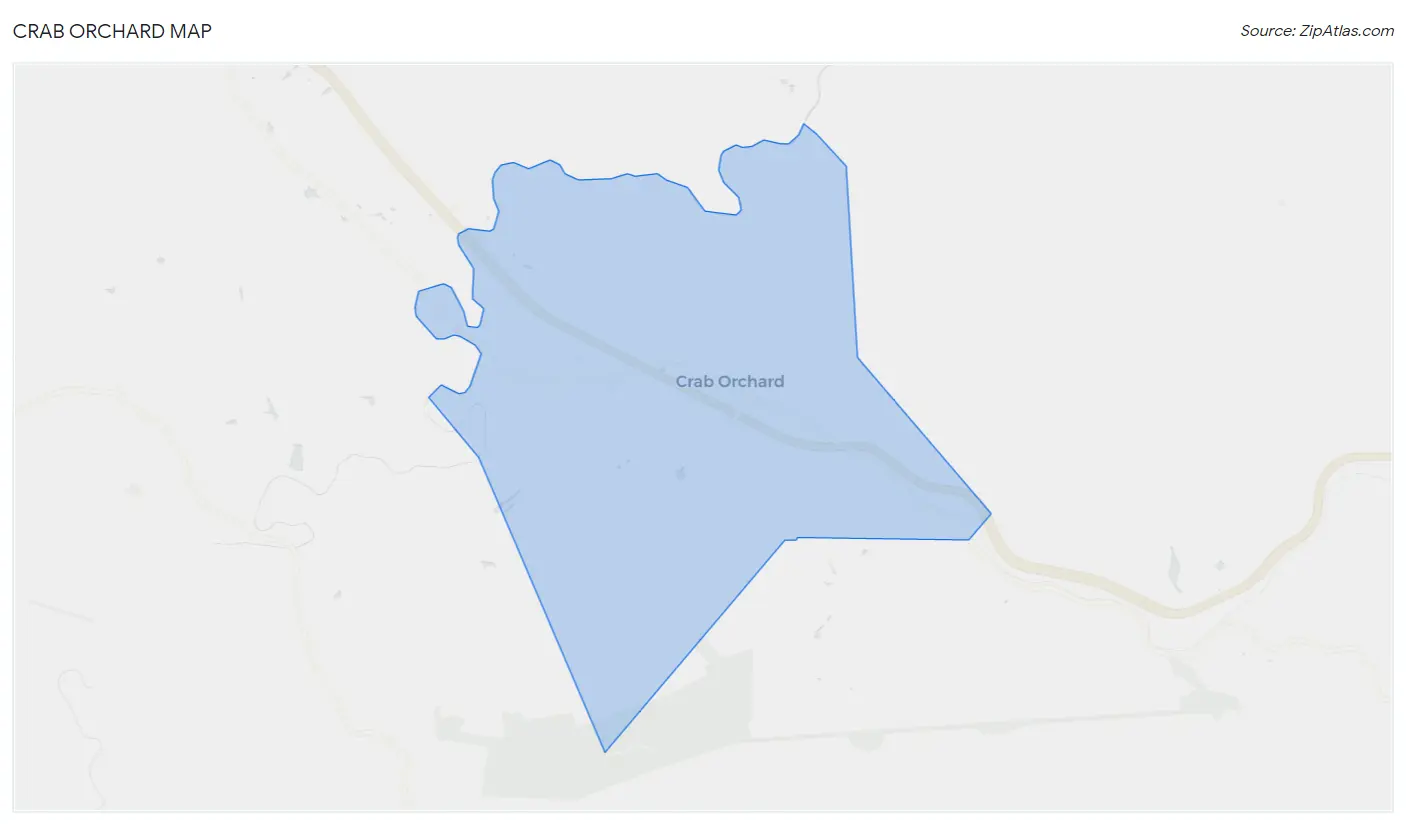
Crab Orchard Map
Crab Orchard Overview
$23,864
PER CAPITA INCOME
$55,825
AVG FAMILY INCOME
$40,987
AVG HOUSEHOLD INCOME
30.1%
WAGE / INCOME GAP [ % ]
69.9¢/ $1
WAGE / INCOME GAP [ $ ]
0.40
INEQUALITY / GINI INDEX
868
TOTAL POPULATION
418
MALE POPULATION
450
FEMALE POPULATION
92.89
MALES / 100 FEMALES
107.66
FEMALES / 100 MALES
42.8
MEDIAN AGE
2.6
AVG FAMILY SIZE
2.2
AVG HOUSEHOLD SIZE
365
LABOR FORCE [ PEOPLE ]
52.9%
PERCENT IN LABOR FORCE
0.8%
UNEMPLOYMENT RATE
Crab Orchard Zip Codes
Crab Orchard Area Codes
Income in Crab Orchard
Income Overview in Crab Orchard
Per Capita Income in Crab Orchard is $23,864, while median incomes of families and households are $55,825 and $40,987 respectively.
| Characteristic | Number | Measure |
| Per Capita Income | 868 | $23,864 |
| Median Family Income | 277 | $55,825 |
| Mean Family Income | 277 | $60,502 |
| Median Household Income | 391 | $40,987 |
| Mean Household Income | 391 | $52,810 |
| Income Deficit | 277 | $0 |
| Wage / Income Gap (%) | 868 | 30.12% |
| Wage / Income Gap ($) | 868 | 69.88¢ per $1 |
| Gini / Inequality Index | 868 | 0.40 |
Earnings by Sex in Crab Orchard
Average Earnings in Crab Orchard are $39,279, $46,250 for men and $32,321 for women, a difference of 30.1%.
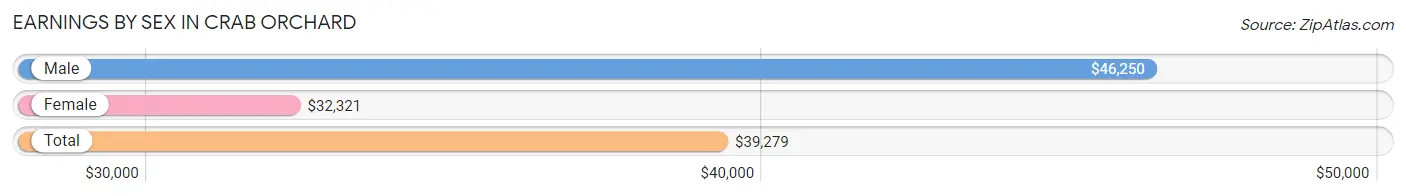
| Sex | Number | Average Earnings |
| Male | 191 (49.3%) | $46,250 |
| Female | 196 (50.6%) | $32,321 |
| Total | 387 (100.0%) | $39,279 |
Earnings by Sex by Income Bracket in Crab Orchard
The most common earnings brackets in Crab Orchard are $55,000 to $64,999 for men (32 | 16.8%) and $40,000 to $44,999 for women (34 | 17.3%).
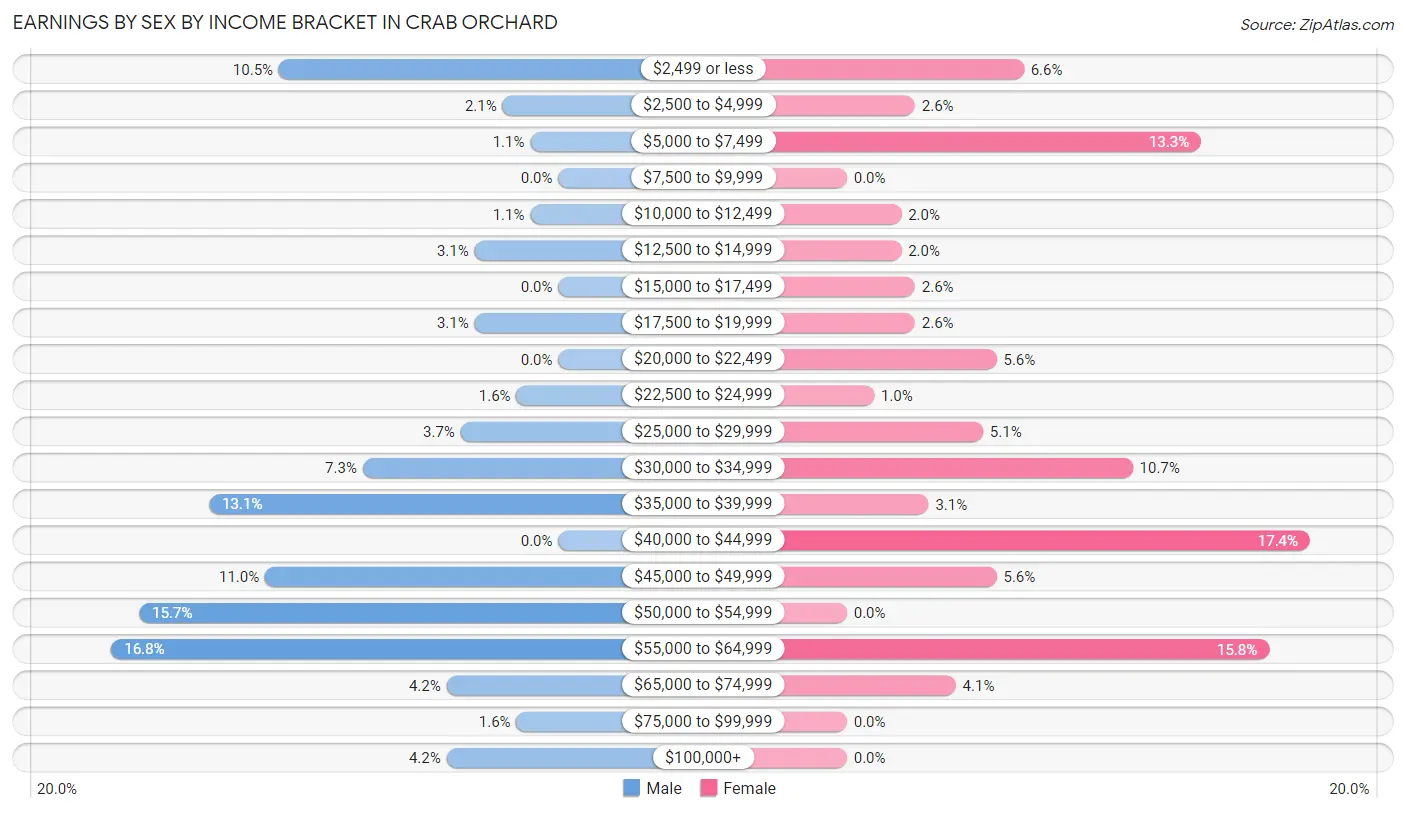
| Income | Male | Female |
| $2,499 or less | 20 (10.5%) | 13 (6.6%) |
| $2,500 to $4,999 | 4 (2.1%) | 5 (2.5%) |
| $5,000 to $7,499 | 2 (1.1%) | 26 (13.3%) |
| $7,500 to $9,999 | 0 (0.0%) | 0 (0.0%) |
| $10,000 to $12,499 | 2 (1.1%) | 4 (2.0%) |
| $12,500 to $14,999 | 6 (3.1%) | 4 (2.0%) |
| $15,000 to $17,499 | 0 (0.0%) | 5 (2.5%) |
| $17,500 to $19,999 | 6 (3.1%) | 5 (2.5%) |
| $20,000 to $22,499 | 0 (0.0%) | 11 (5.6%) |
| $22,500 to $24,999 | 3 (1.6%) | 2 (1.0%) |
| $25,000 to $29,999 | 7 (3.7%) | 10 (5.1%) |
| $30,000 to $34,999 | 14 (7.3%) | 21 (10.7%) |
| $35,000 to $39,999 | 25 (13.1%) | 6 (3.1%) |
| $40,000 to $44,999 | 0 (0.0%) | 34 (17.3%) |
| $45,000 to $49,999 | 21 (11.0%) | 11 (5.6%) |
| $50,000 to $54,999 | 30 (15.7%) | 0 (0.0%) |
| $55,000 to $64,999 | 32 (16.8%) | 31 (15.8%) |
| $65,000 to $74,999 | 8 (4.2%) | 8 (4.1%) |
| $75,000 to $99,999 | 3 (1.6%) | 0 (0.0%) |
| $100,000+ | 8 (4.2%) | 0 (0.0%) |
| Total | 191 (100.0%) | 196 (100.0%) |
Earnings by Sex by Educational Attainment in Crab Orchard
Average earnings in Crab Orchard are $51,000 for men and $40,037 for women, a difference of 21.5%. Men with an educational attainment of high school diploma enjoy the highest average annual earnings of $51,250, while those with less than high school education earn the least with $32,813. Women with an educational attainment of college or associate's degree earn the most with the average annual earnings of $41,375, while those with high school diploma education have the smallest earnings of $31,161.
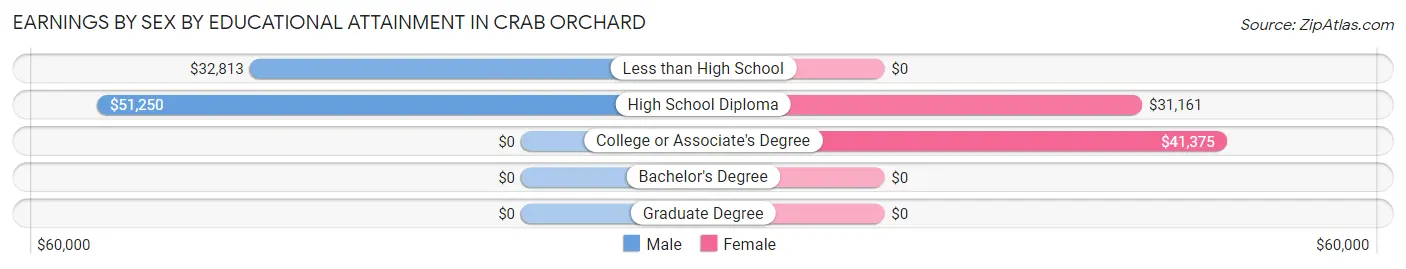
| Educational Attainment | Male Income | Female Income |
| Less than High School | $32,813 | $0 |
| High School Diploma | $51,250 | $31,161 |
| College or Associate's Degree | - | - |
| Bachelor's Degree | - | - |
| Graduate Degree | - | - |
| Total | $51,000 | $40,037 |
Family Income in Crab Orchard
Family Income Brackets in Crab Orchard
According to the Crab Orchard family income data, there are 85 families falling into the $50,000 to $74,999 income range, which is the most common income bracket and makes up 30.7% of all families.
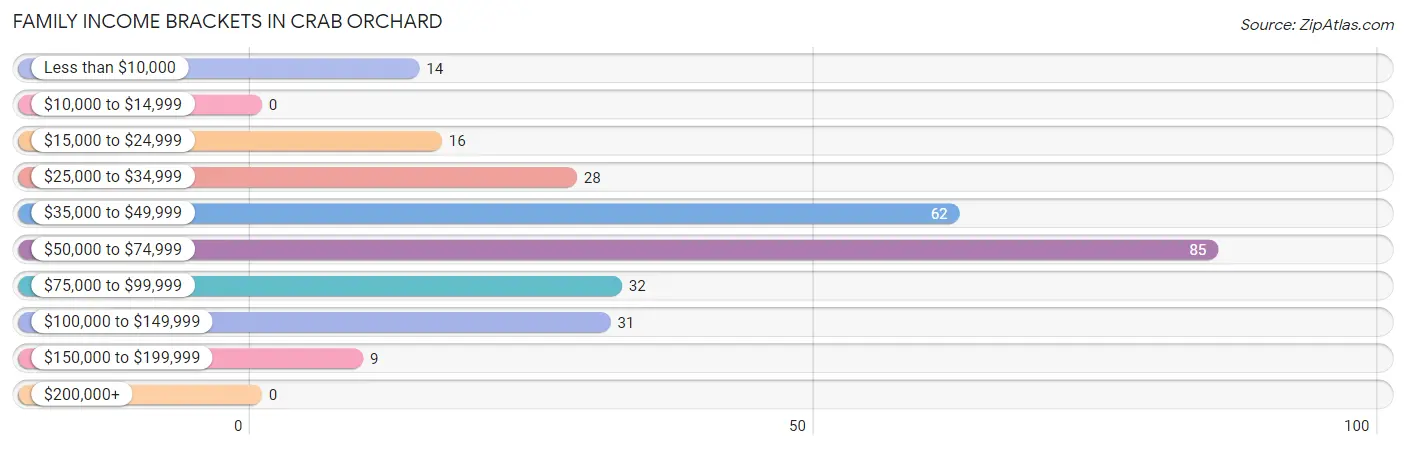
| Income Bracket | # Families | % Families |
| Less than $10,000 | 14 | 5.1% |
| $10,000 to $14,999 | 0 | 0.0% |
| $15,000 to $24,999 | 16 | 5.8% |
| $25,000 to $34,999 | 28 | 10.1% |
| $35,000 to $49,999 | 62 | 22.4% |
| $50,000 to $74,999 | 85 | 30.7% |
| $75,000 to $99,999 | 32 | 11.6% |
| $100,000 to $149,999 | 31 | 11.2% |
| $150,000 to $199,999 | 9 | 3.2% |
| $200,000+ | 0 | 0.0% |
Family Income by Famaliy Size in Crab Orchard
3-person families (46 | 16.6%) account for the highest median family income in Crab Orchard with $70,250 per family, while 2-person families (159 | 57.4%) have the highest median income of $28,138 per family member.
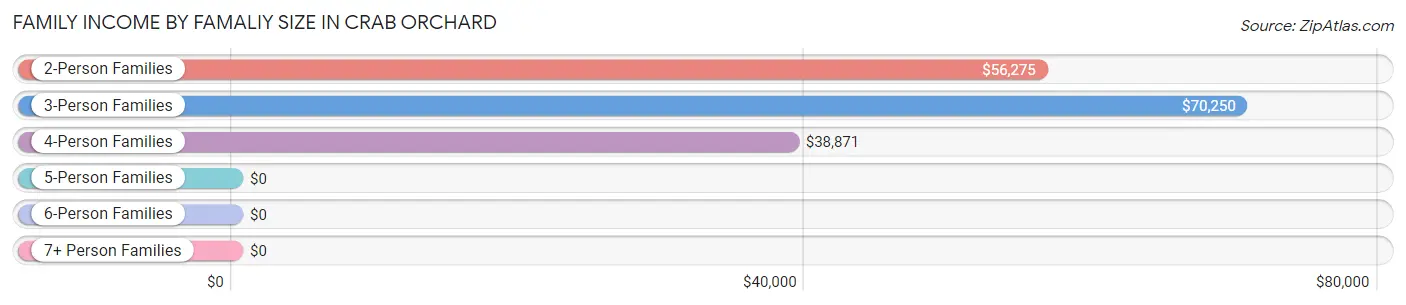
| Income Bracket | # Families | Median Income |
| 2-Person Families | 159 (57.4%) | $56,275 |
| 3-Person Families | 46 (16.6%) | $70,250 |
| 4-Person Families | 58 (20.9%) | $38,871 |
| 5-Person Families | 8 (2.9%) | $0 |
| 6-Person Families | 6 (2.2%) | $0 |
| 7+ Person Families | 0 (0.0%) | $0 |
| Total | 277 (100.0%) | $55,825 |
Family Income by Number of Earners in Crab Orchard
The median family income in Crab Orchard is $55,825, with families comprising 3+ earners (19) having the highest median family income of $128,393, while families with 1 earner (95) have the lowest median family income of $38,785, accounting for 6.9% and 34.3% of families, respectively.
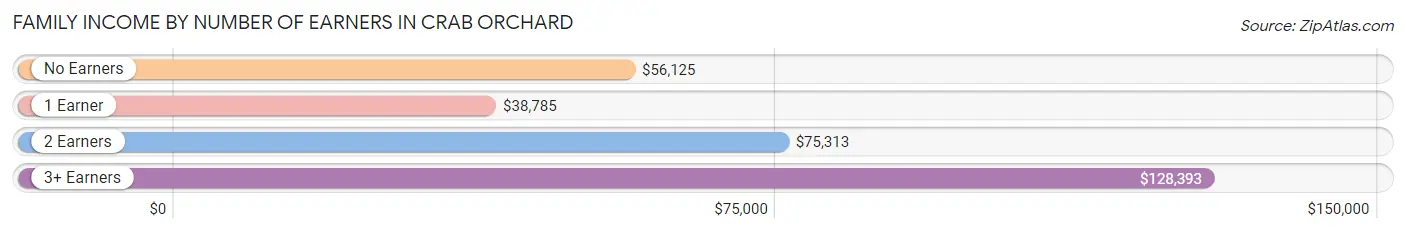
| Number of Earners | # Families | Median Income |
| No Earners | 89 (32.1%) | $56,125 |
| 1 Earner | 95 (34.3%) | $38,785 |
| 2 Earners | 74 (26.7%) | $75,313 |
| 3+ Earners | 19 (6.9%) | $128,393 |
| Total | 277 (100.0%) | $55,825 |
Household Income in Crab Orchard
Household Income Brackets in Crab Orchard
With 90 households falling in the category, the $50,000 to $74,999 income range is the most frequent in Crab Orchard, accounting for 23.0% of all households.
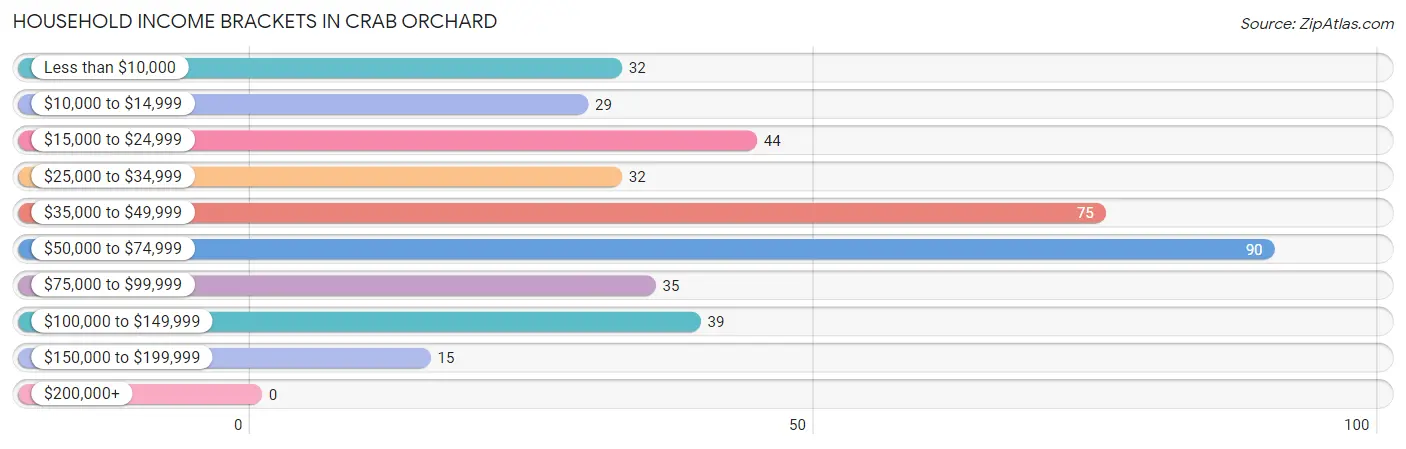
| Income Bracket | # Households | % Households |
| Less than $10,000 | 32 | 8.2% |
| $10,000 to $14,999 | 29 | 7.4% |
| $15,000 to $24,999 | 44 | 11.3% |
| $25,000 to $34,999 | 32 | 8.2% |
| $35,000 to $49,999 | 75 | 19.2% |
| $50,000 to $74,999 | 90 | 23.0% |
| $75,000 to $99,999 | 35 | 9.0% |
| $100,000 to $149,999 | 39 | 10.0% |
| $150,000 to $199,999 | 15 | 3.8% |
| $200,000+ | 0 | 0.0% |
Household Income by Householder Age in Crab Orchard
The median household income in Crab Orchard is $40,987, with the highest median household income of $55,500 found in the 45 to 64 years age bracket for the primary householder. A total of 162 households (41.4%) fall into this category. Meanwhile, the 15 to 24 years age bracket for the primary householder has the lowest median household income of $0, with 24 households (6.1%) in this group.
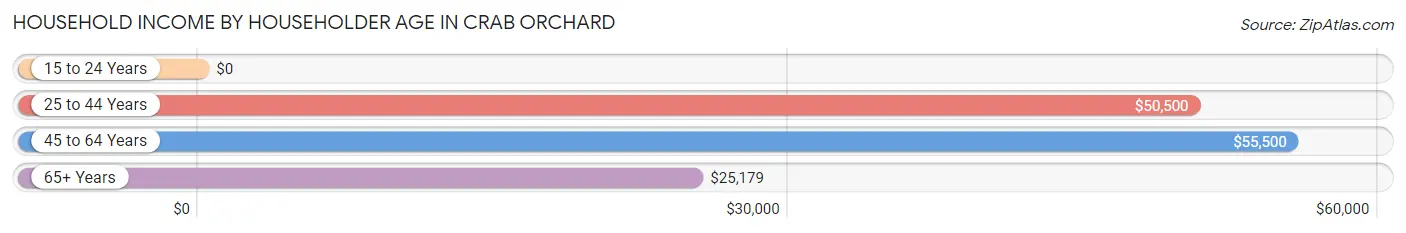
| Income Bracket | # Households | Median Income |
| 15 to 24 Years | 24 (6.1%) | $0 |
| 25 to 44 Years | 118 (30.2%) | $50,500 |
| 45 to 64 Years | 162 (41.4%) | $55,500 |
| 65+ Years | 87 (22.3%) | $25,179 |
| Total | 391 (100.0%) | $40,987 |
Poverty in Crab Orchard
Income Below Poverty by Sex and Age in Crab Orchard
With 18.7% poverty level for males and 18.7% for females among the residents of Crab Orchard, under 5 year old males and 15 year old females are the most vulnerable to poverty, with 16 males (100.0%) and 7 females (100.0%) in their respective age groups living below the poverty level.
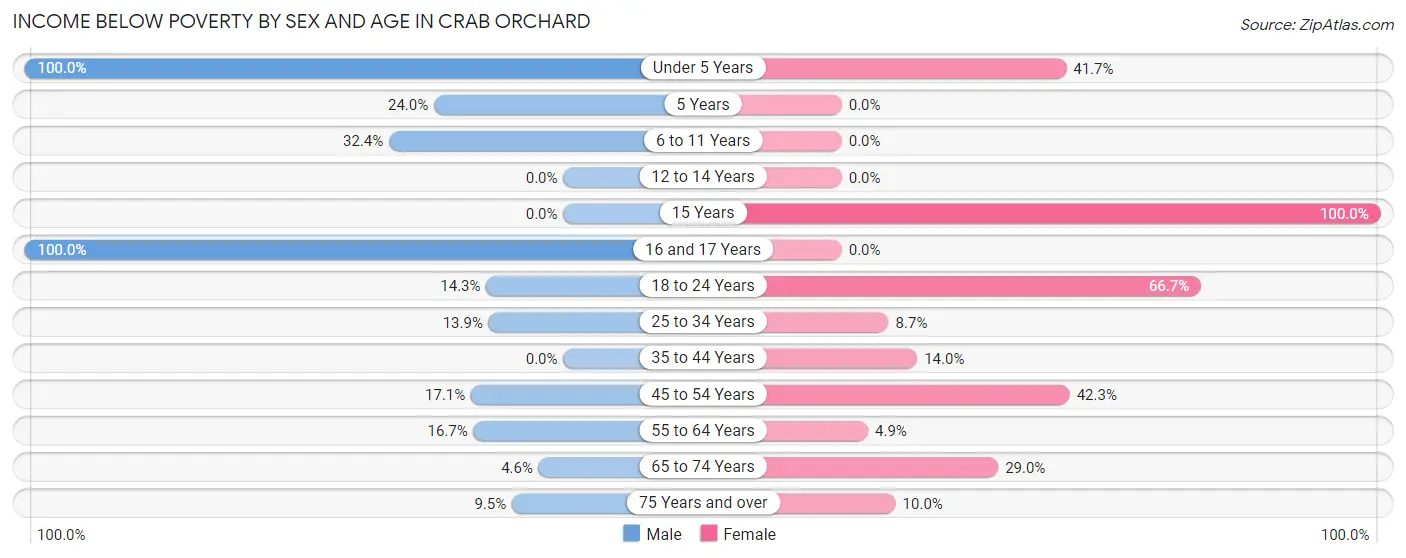
| Age Bracket | Male | Female |
| Under 5 Years | 16 (100.0%) | 5 (41.7%) |
| 5 Years | 12 (24.0%) | 0 (0.0%) |
| 6 to 11 Years | 11 (32.4%) | 0 (0.0%) |
| 12 to 14 Years | 0 (0.0%) | 0 (0.0%) |
| 15 Years | 0 (0.0%) | 7 (100.0%) |
| 16 and 17 Years | 7 (100.0%) | 0 (0.0%) |
| 18 to 24 Years | 4 (14.3%) | 18 (66.7%) |
| 25 to 34 Years | 9 (13.9%) | 6 (8.7%) |
| 35 to 44 Years | 0 (0.0%) | 7 (14.0%) |
| 45 to 54 Years | 6 (17.1%) | 22 (42.3%) |
| 55 to 64 Years | 8 (16.7%) | 6 (4.9%) |
| 65 to 74 Years | 3 (4.5%) | 9 (29.0%) |
| 75 Years and over | 2 (9.5%) | 4 (10.0%) |
| Total | 78 (18.7%) | 84 (18.7%) |
Income Above Poverty by Sex and Age in Crab Orchard
According to the poverty statistics in Crab Orchard, males aged 12 to 14 years and females aged 6 to 11 years are the age groups that are most secure financially, with 100.0% of males and 100.0% of females in these age groups living above the poverty line.
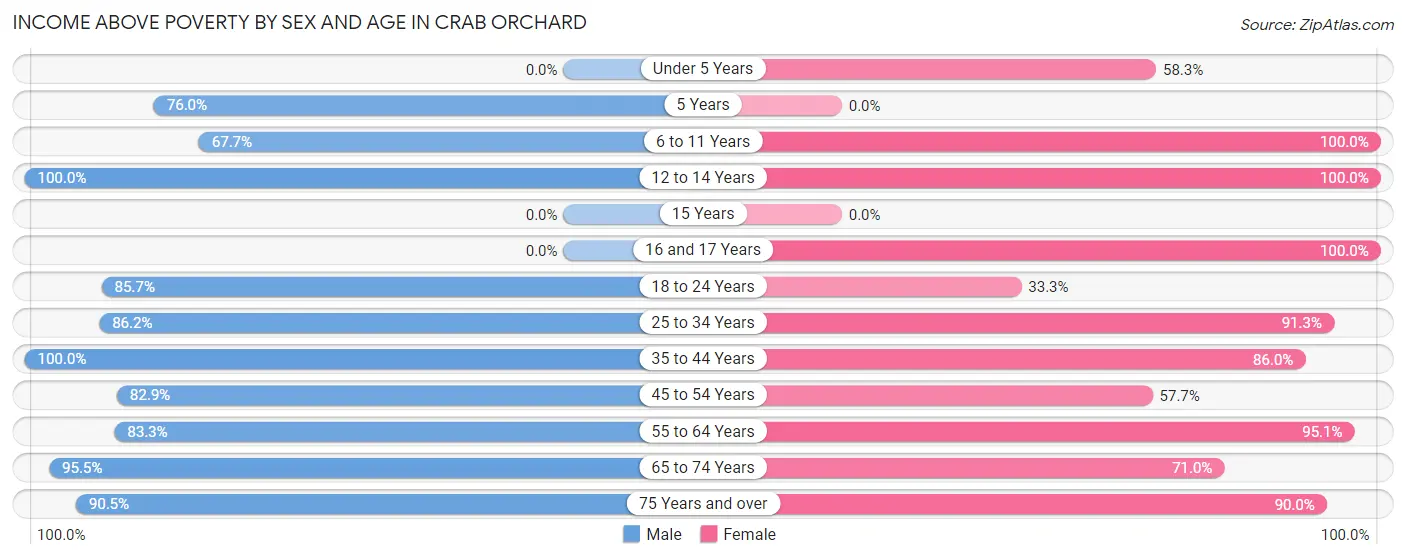
| Age Bracket | Male | Female |
| Under 5 Years | 0 (0.0%) | 7 (58.3%) |
| 5 Years | 38 (76.0%) | 0 (0.0%) |
| 6 to 11 Years | 23 (67.6%) | 25 (100.0%) |
| 12 to 14 Years | 26 (100.0%) | 8 (100.0%) |
| 15 Years | 0 (0.0%) | 0 (0.0%) |
| 16 and 17 Years | 0 (0.0%) | 6 (100.0%) |
| 18 to 24 Years | 24 (85.7%) | 9 (33.3%) |
| 25 to 34 Years | 56 (86.2%) | 63 (91.3%) |
| 35 to 44 Years | 22 (100.0%) | 43 (86.0%) |
| 45 to 54 Years | 29 (82.9%) | 30 (57.7%) |
| 55 to 64 Years | 40 (83.3%) | 117 (95.1%) |
| 65 to 74 Years | 63 (95.5%) | 22 (71.0%) |
| 75 Years and over | 19 (90.5%) | 36 (90.0%) |
| Total | 340 (81.3%) | 366 (81.3%) |
Income Below Poverty Among Married-Couple Families in Crab Orchard
The poverty statistics for married-couple families in Crab Orchard show that 6.7% or 15 of the total 225 families live below the poverty line. Families with 3 or 4 children have the highest poverty rate of 42.9%, comprising of 6 families. On the other hand, families with no children have the lowest poverty rate of 2.7%, which includes 4 families.
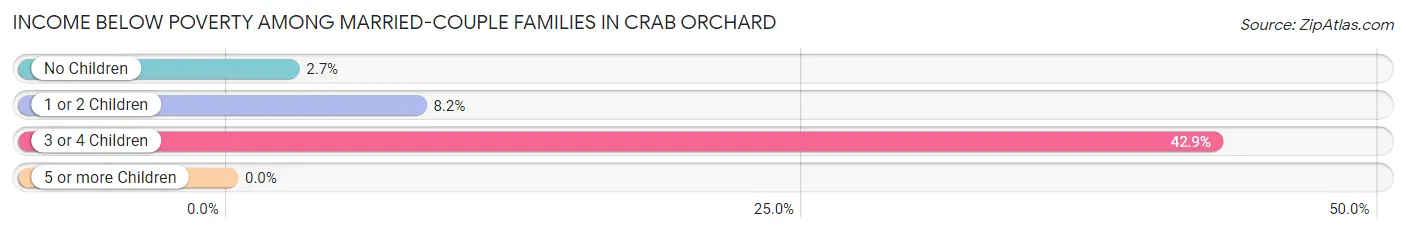
| Children | Above Poverty | Below Poverty |
| No Children | 146 (97.3%) | 4 (2.7%) |
| 1 or 2 Children | 56 (91.8%) | 5 (8.2%) |
| 3 or 4 Children | 8 (57.1%) | 6 (42.9%) |
| 5 or more Children | 0 (0.0%) | 0 (0.0%) |
| Total | 210 (93.3%) | 15 (6.7%) |
Income Below Poverty Among Single-Parent Households in Crab Orchard
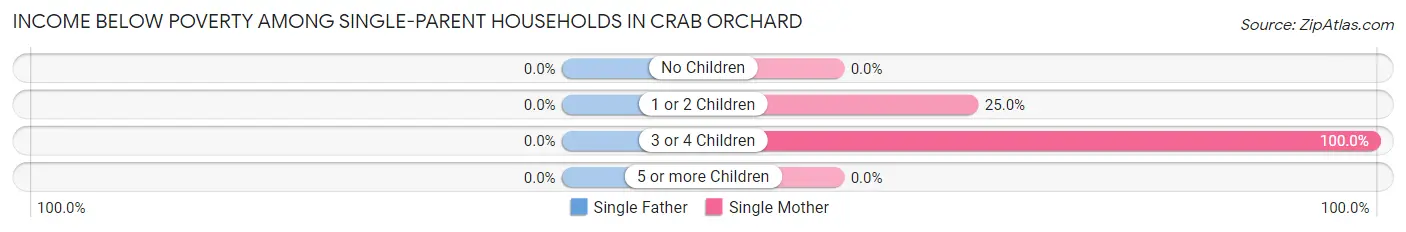
| Children | Single Father | Single Mother |
| No Children | 0 (0.0%) | 0 (0.0%) |
| 1 or 2 Children | 0 (0.0%) | 7 (25.0%) |
| 3 or 4 Children | 0 (0.0%) | 7 (100.0%) |
| 5 or more Children | 0 (0.0%) | 0 (0.0%) |
| Total | 0 (0.0%) | 14 (31.8%) |
Income Below Poverty Among Married-Couple vs Single-Parent Households in Crab Orchard
The poverty data for Crab Orchard shows that 15 of the married-couple family households (6.7%) and 14 of the single-parent households (26.9%) are living below the poverty level. Within the married-couple family households, those with 3 or 4 children have the highest poverty rate, with 6 households (42.9%) falling below the poverty line. Among the single-parent households, those with 3 or 4 children have the highest poverty rate, with 7 household (100.0%) living below poverty.
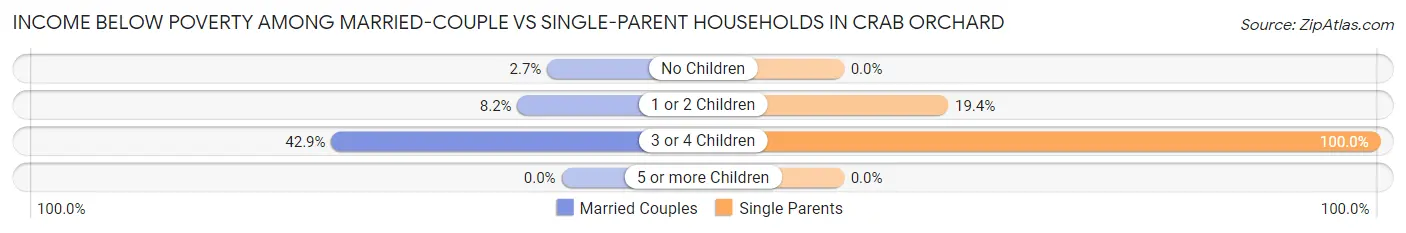
| Children | Married-Couple Families | Single-Parent Households |
| No Children | 4 (2.7%) | 0 (0.0%) |
| 1 or 2 Children | 5 (8.2%) | 7 (19.4%) |
| 3 or 4 Children | 6 (42.9%) | 7 (100.0%) |
| 5 or more Children | 0 (0.0%) | 0 (0.0%) |
| Total | 15 (6.7%) | 14 (26.9%) |
Race in Crab Orchard
The most populous races in Crab Orchard are White / Caucasian (833 | 96.0%), Two or more Races (35 | 4.0%), and Hispanic or Latino (5 | 0.6%).
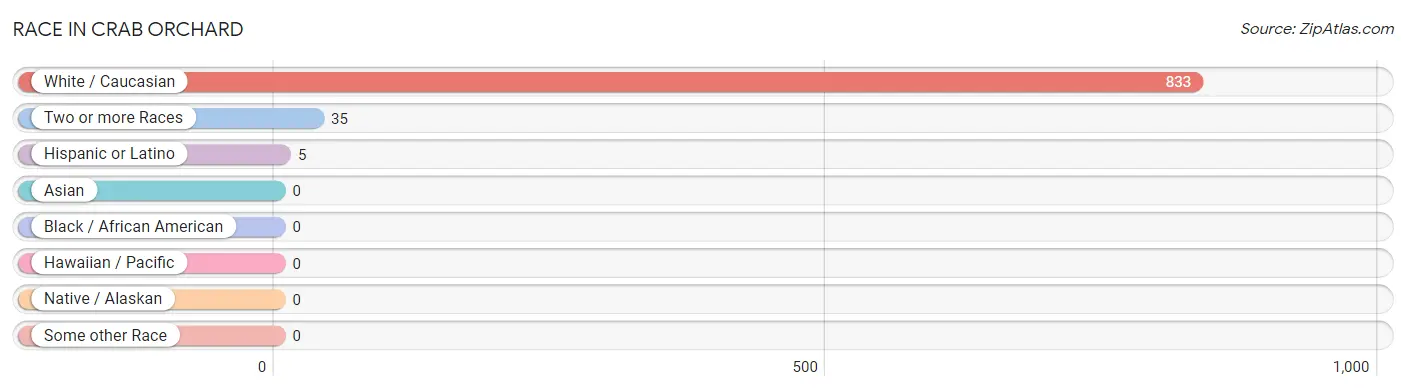
| Race | # Population | % Population |
| Asian | 0 | 0.0% |
| Black / African American | 0 | 0.0% |
| Hawaiian / Pacific | 0 | 0.0% |
| Hispanic or Latino | 5 | 0.6% |
| Native / Alaskan | 0 | 0.0% |
| White / Caucasian | 833 | 96.0% |
| Two or more Races | 35 | 4.0% |
| Some other Race | 0 | 0.0% |
| Total | 868 | 100.0% |
Ancestry in Crab Orchard
The most populous ancestries reported in Crab Orchard are American (136 | 15.7%), English (116 | 13.4%), German (94 | 10.8%), Welsh (91 | 10.5%), and Irish (68 | 7.8%), together accounting for 58.2% of all Crab Orchard residents.
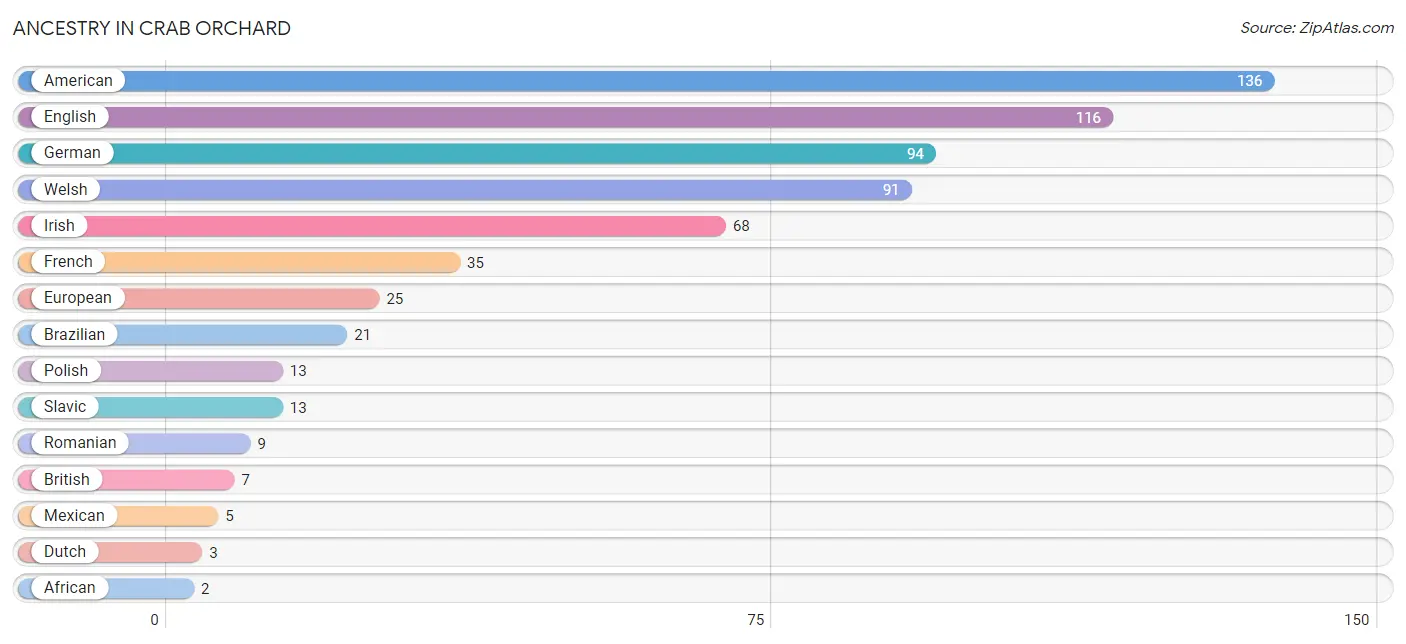
| Ancestry | # Population | % Population |
| African | 2 | 0.2% |
| American | 136 | 15.7% |
| Brazilian | 21 | 2.4% |
| British | 7 | 0.8% |
| Czech | 2 | 0.2% |
| Dutch | 3 | 0.4% |
| English | 116 | 13.4% |
| European | 25 | 2.9% |
| French | 35 | 4.0% |
| German | 94 | 10.8% |
| Irish | 68 | 7.8% |
| Mexican | 5 | 0.6% |
| Polish | 13 | 1.5% |
| Romanian | 9 | 1.0% |
| Slavic | 13 | 1.5% |
| Subsaharan African | 2 | 0.2% |
| Welsh | 91 | 10.5% | View All 17 Rows |
Immigrants in Crab Orchard
The most numerous immigrant groups reported in Crab Orchard came from Latin America (26 | 3.0%), Brazil (21 | 2.4%), South America (21 | 2.4%), Central America (5 | 0.6%), and Mexico (5 | 0.6%), together accounting for 9.0% of all Crab Orchard residents.
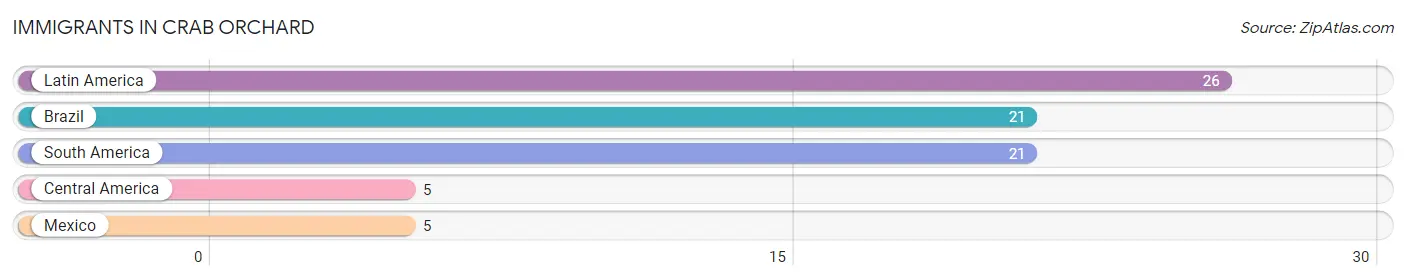
| Immigration Origin | # Population | % Population |
| Brazil | 21 | 2.4% |
| Central America | 5 | 0.6% |
| Latin America | 26 | 3.0% |
| Mexico | 5 | 0.6% |
| South America | 21 | 2.4% | View All 5 Rows |
Sex and Age in Crab Orchard
Sex and Age in Crab Orchard
The most populous age groups in Crab Orchard are 5 to 9 Years (62 | 14.8%) for men and 60 to 64 Years (82 | 18.2%) for women.
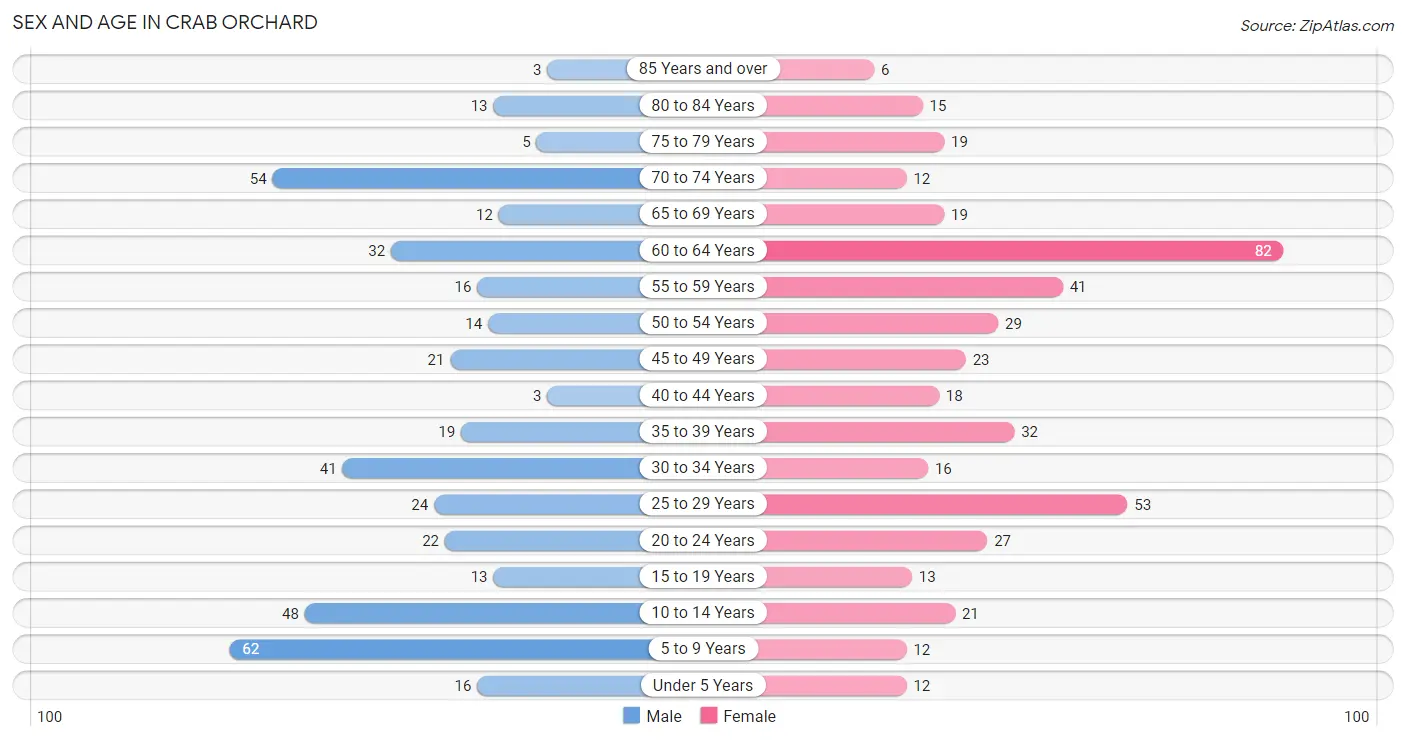
| Age Bracket | Male | Female |
| Under 5 Years | 16 (3.8%) | 12 (2.7%) |
| 5 to 9 Years | 62 (14.8%) | 12 (2.7%) |
| 10 to 14 Years | 48 (11.5%) | 21 (4.7%) |
| 15 to 19 Years | 13 (3.1%) | 13 (2.9%) |
| 20 to 24 Years | 22 (5.3%) | 27 (6.0%) |
| 25 to 29 Years | 24 (5.7%) | 53 (11.8%) |
| 30 to 34 Years | 41 (9.8%) | 16 (3.6%) |
| 35 to 39 Years | 19 (4.5%) | 32 (7.1%) |
| 40 to 44 Years | 3 (0.7%) | 18 (4.0%) |
| 45 to 49 Years | 21 (5.0%) | 23 (5.1%) |
| 50 to 54 Years | 14 (3.4%) | 29 (6.4%) |
| 55 to 59 Years | 16 (3.8%) | 41 (9.1%) |
| 60 to 64 Years | 32 (7.7%) | 82 (18.2%) |
| 65 to 69 Years | 12 (2.9%) | 19 (4.2%) |
| 70 to 74 Years | 54 (12.9%) | 12 (2.7%) |
| 75 to 79 Years | 5 (1.2%) | 19 (4.2%) |
| 80 to 84 Years | 13 (3.1%) | 15 (3.3%) |
| 85 Years and over | 3 (0.7%) | 6 (1.3%) |
| Total | 418 (100.0%) | 450 (100.0%) |
Families and Households in Crab Orchard
Median Family Size in Crab Orchard
The median family size in Crab Orchard is 2.64 persons per family, with married-couple families (225 | 81.2%) accounting for the largest median family size of 2.65 persons per family. On the other hand, single female/mother families (44 | 15.9%) represent the smallest median family size with 2.57 persons per family.
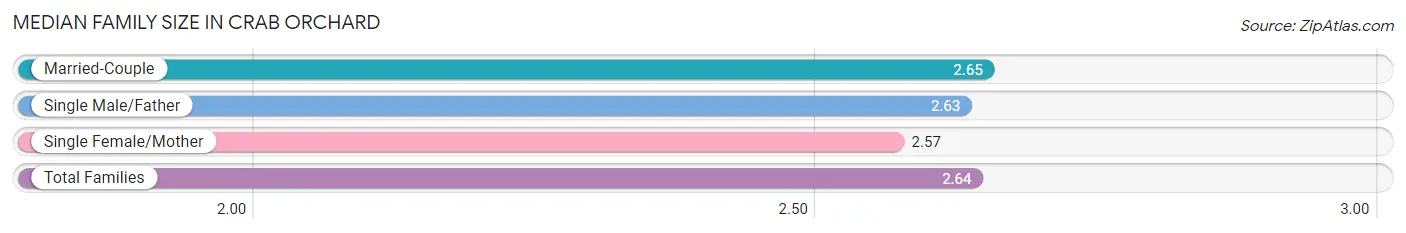
| Family Type | # Families | Family Size |
| Married-Couple | 225 (81.2%) | 2.65 |
| Single Male/Father | 8 (2.9%) | 2.63 |
| Single Female/Mother | 44 (15.9%) | 2.57 |
| Total Families | 277 (100.0%) | 2.64 |
Median Household Size in Crab Orchard
The median household size in Crab Orchard is 2.22 persons per household, with single male/father households (8 | 2.1%) accounting for the largest median household size of 3.38 persons per household. non-family households (114 | 29.2%) represent the smallest median household size with 1.11 persons per household.
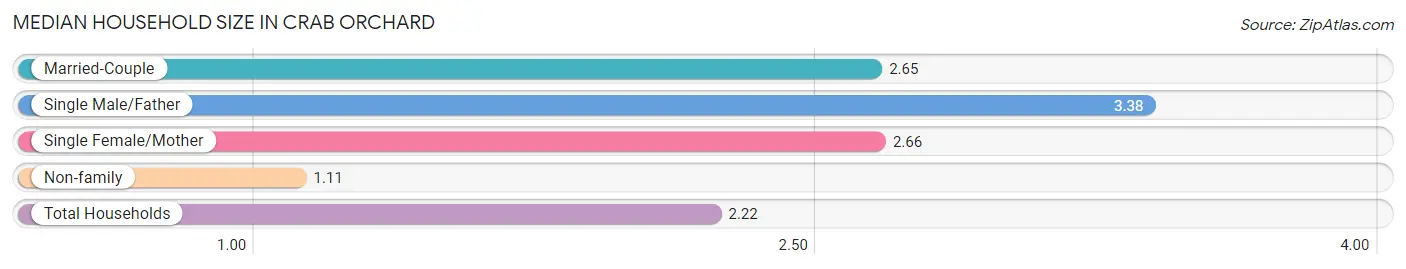
| Household Type | # Households | Household Size |
| Married-Couple | 225 (57.5%) | 2.65 |
| Single Male/Father | 8 (2.1%) | 3.38 |
| Single Female/Mother | 44 (11.3%) | 2.66 |
| Non-family | 114 (29.2%) | 1.11 |
| Total Households | 391 (100.0%) | 2.22 |
Household Size by Marriage Status in Crab Orchard
Out of a total of 391 households in Crab Orchard, 277 (70.8%) are family households, while 114 (29.2%) are nonfamily households. The most numerous type of family households are 2-person households, comprising 156, and the most common type of nonfamily households are 1-person households, comprising 104.
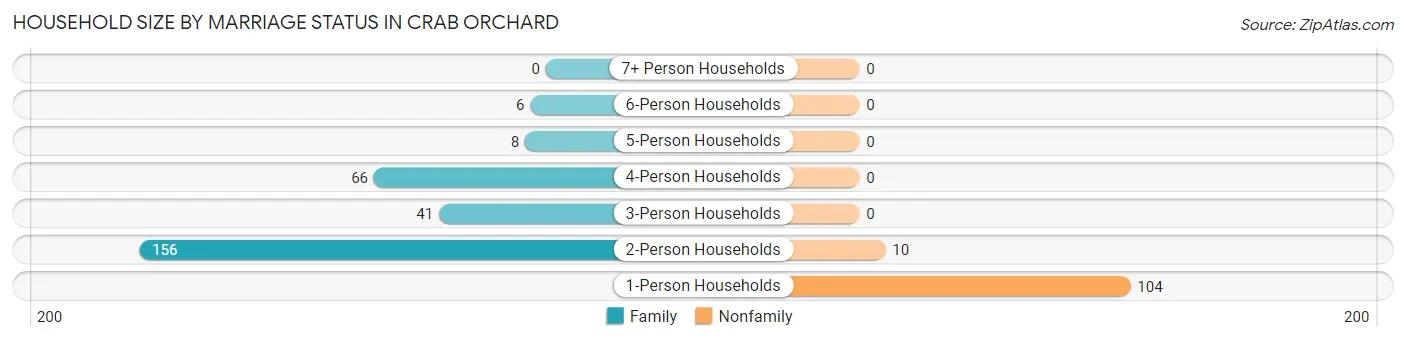
| Household Size | Family Households | Nonfamily Households |
| 1-Person Households | - | 104 (26.6%) |
| 2-Person Households | 156 (39.9%) | 10 (2.6%) |
| 3-Person Households | 41 (10.5%) | 0 (0.0%) |
| 4-Person Households | 66 (16.9%) | 0 (0.0%) |
| 5-Person Households | 8 (2.1%) | 0 (0.0%) |
| 6-Person Households | 6 (1.5%) | 0 (0.0%) |
| 7+ Person Households | 0 (0.0%) | 0 (0.0%) |
| Total | 277 (70.8%) | 114 (29.2%) |
Female Fertility in Crab Orchard
Fertility by Age in Crab Orchard
Average fertility rate in Crab Orchard is 49.0 births per 1,000 women. Women in the age bracket of 20 to 34 years have the highest fertility rate with 94.0 births per 1,000 women. Women in the age bracket of 20 to 34 years acount for 100.0% of all women with births.
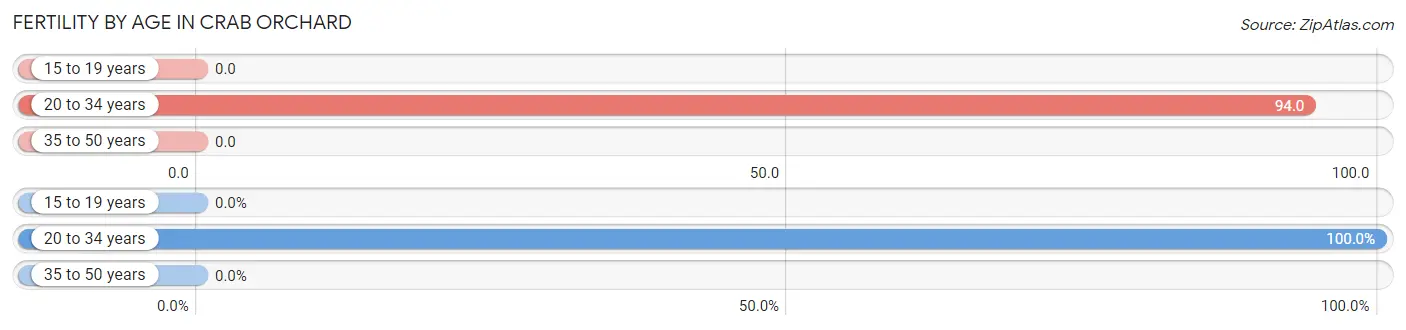
| Age Bracket | Women with Births | Births / 1,000 Women |
| 15 to 19 years | 0 (0.0%) | 0.0 |
| 20 to 34 years | 9 (100.0%) | 94.0 |
| 35 to 50 years | 0 (0.0%) | 0.0 |
| Total | 9 (100.0%) | 49.0 |
Fertility by Age by Marriage Status in Crab Orchard
66.7% of women with births (9) in Crab Orchard are married. The highest percentage of unmarried women with births falls into 20 to 34 years age bracket with 33.3% of them unmarried at the time of birth, while the lowest percentage of unmarried women with births belong to 20 to 34 years age bracket with 33.3% of them unmarried.
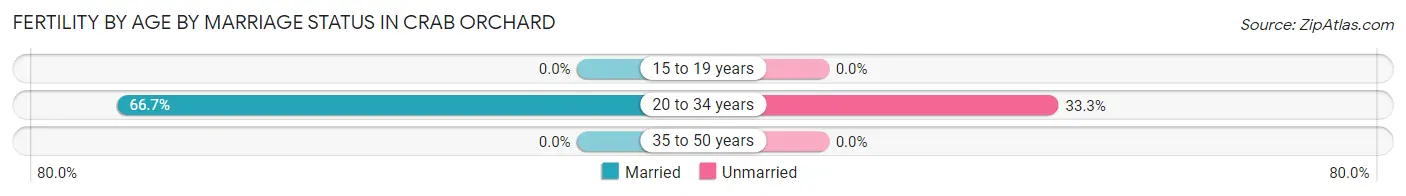
| Age Bracket | Married | Unmarried |
| 15 to 19 years | 0 (0.0%) | 0 (0.0%) |
| 20 to 34 years | 6 (66.7%) | 3 (33.3%) |
| 35 to 50 years | 0 (0.0%) | 0 (0.0%) |
| Total | 6 (66.7%) | 3 (33.3%) |
Fertility by Education in Crab Orchard
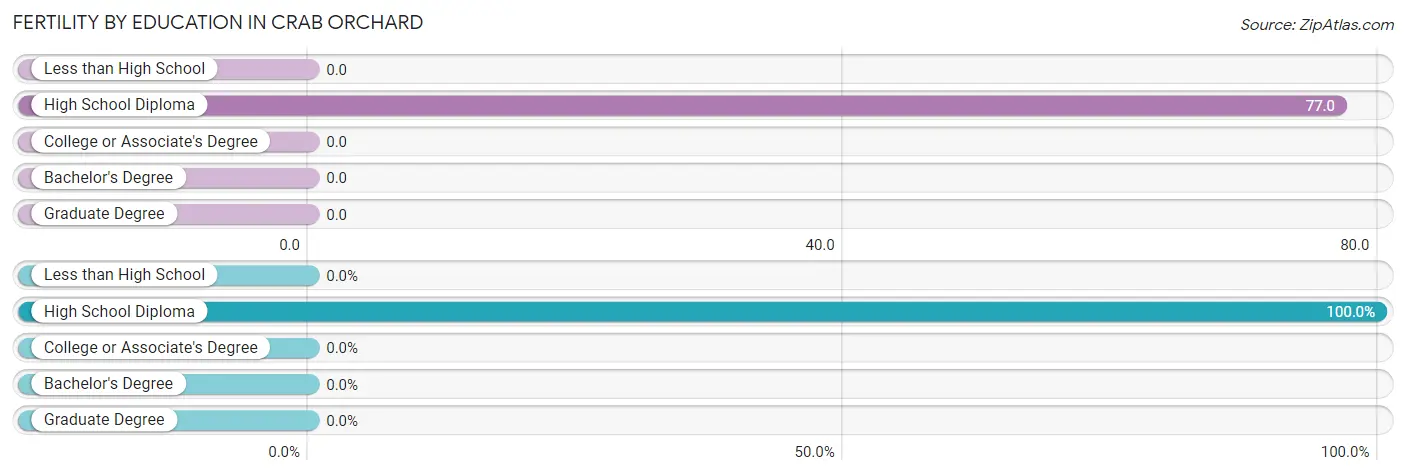
| Educational Attainment | Women with Births | Births / 1,000 Women |
| Less than High School | 0 (0.0%) | 0.0 |
| High School Diploma | 9 (100.0%) | 77.0 |
| College or Associate's Degree | 0 (0.0%) | 0.0 |
| Bachelor's Degree | 0 (0.0%) | 0.0 |
| Graduate Degree | 0 (0.0%) | 0.0 |
| Total | 9 (100.0%) | 49.0 |
Fertility by Education by Marriage Status in Crab Orchard
33.3% of women with births in Crab Orchard are unmarried. Women with the educational attainment of high school diploma are most likely to be married with 66.7% of them married at childbirth, while women with the educational attainment of high school diploma are least likely to be married with 33.3% of them unmarried at childbirth.
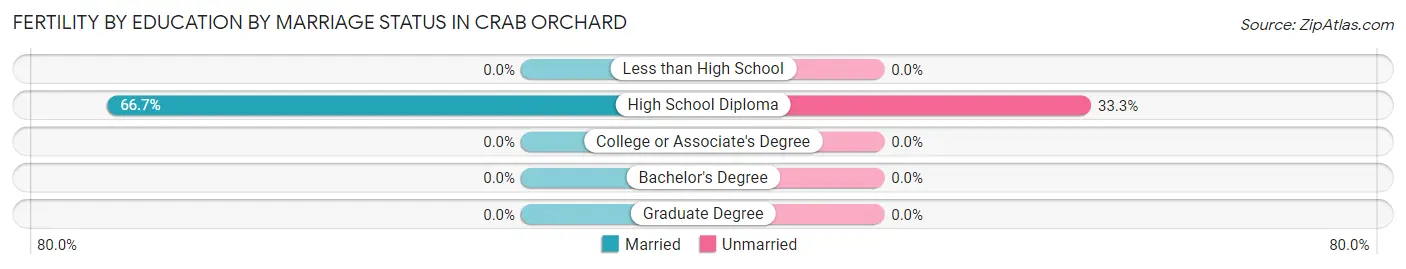
| Educational Attainment | Married | Unmarried |
| Less than High School | 0 (0.0%) | 0 (0.0%) |
| High School Diploma | 6 (66.7%) | 3 (33.3%) |
| College or Associate's Degree | 0 (0.0%) | 0 (0.0%) |
| Bachelor's Degree | 0 (0.0%) | 0 (0.0%) |
| Graduate Degree | 0 (0.0%) | 0 (0.0%) |
| Total | 6 (66.7%) | 3 (33.3%) |
Employment Characteristics in Crab Orchard
Employment by Class of Employer in Crab Orchard
Among the 352 employed individuals in Crab Orchard, private company employees (288 | 81.8%), local government employees (27 | 7.7%), and self-employed (not incorporated) (19 | 5.4%) make up the most common classes of employment.
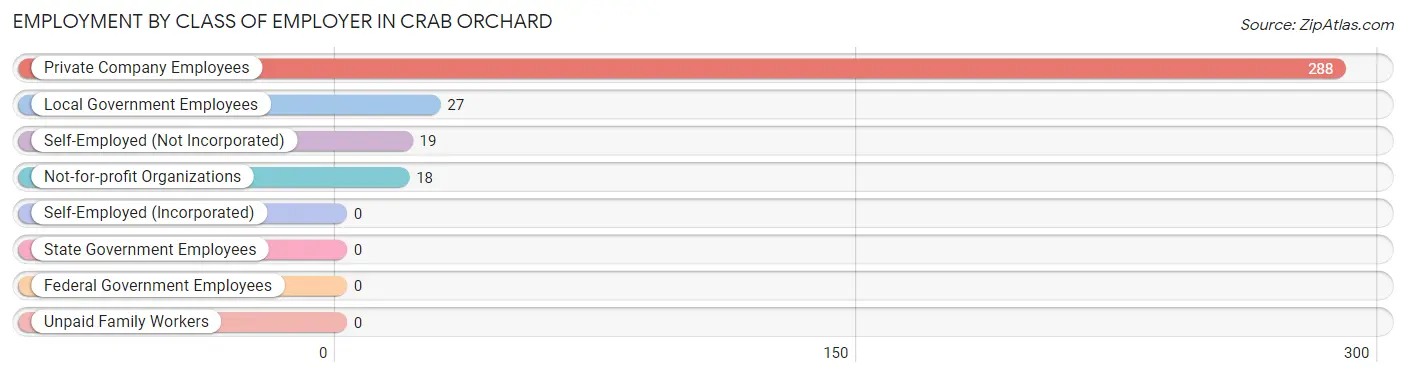
| Employer Class | # Employees | % Employees |
| Private Company Employees | 288 | 81.8% |
| Self-Employed (Incorporated) | 0 | 0.0% |
| Self-Employed (Not Incorporated) | 19 | 5.4% |
| Not-for-profit Organizations | 18 | 5.1% |
| Local Government Employees | 27 | 7.7% |
| State Government Employees | 0 | 0.0% |
| Federal Government Employees | 0 | 0.0% |
| Unpaid Family Workers | 0 | 0.0% |
| Total | 352 | 100.0% |
Employment Status by Age in Crab Orchard
According to the labor force statistics for Crab Orchard, out of the total population over 16 years of age (690), 52.9% or 365 individuals are in the labor force, with 0.8% or 3 of them unemployed. The age group with the highest labor force participation rate is 30 to 34 years, with 100.0% or 57 individuals in the labor force. Within the labor force, the 60 to 64 years age range has the highest percentage of unemployed individuals, with 6.8% or 3 of them being unemployed.
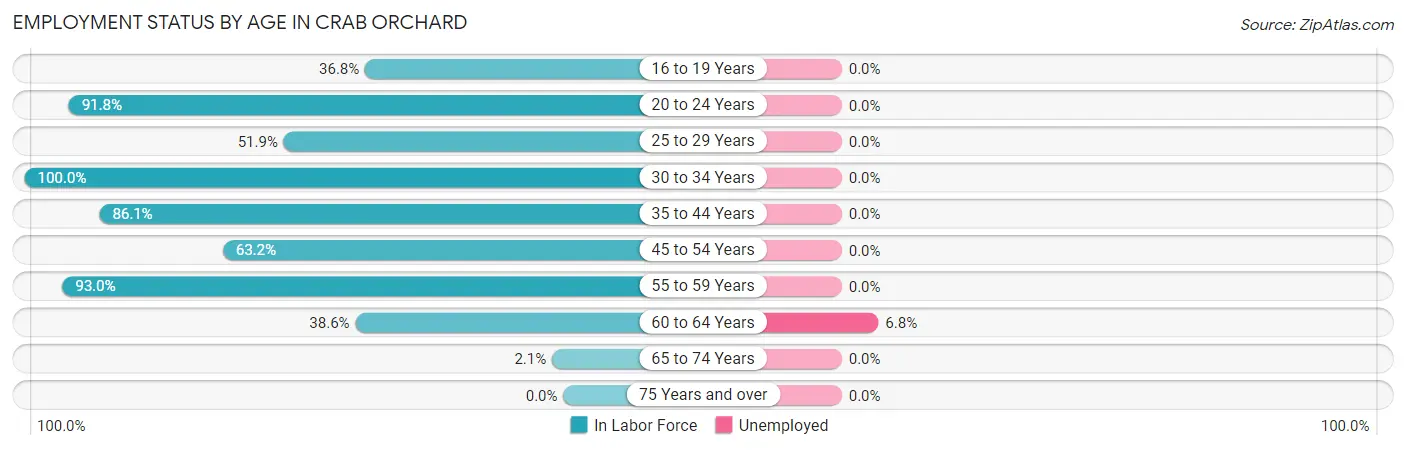
| Age Bracket | In Labor Force | Unemployed |
| 16 to 19 Years | 7 (36.8%) | 0 (0.0%) |
| 20 to 24 Years | 45 (91.8%) | 0 (0.0%) |
| 25 to 29 Years | 40 (51.9%) | 0 (0.0%) |
| 30 to 34 Years | 57 (100.0%) | 0 (0.0%) |
| 35 to 44 Years | 62 (86.1%) | 0 (0.0%) |
| 45 to 54 Years | 55 (63.2%) | 0 (0.0%) |
| 55 to 59 Years | 53 (93.0%) | 0 (0.0%) |
| 60 to 64 Years | 44 (38.6%) | 3 (6.8%) |
| 65 to 74 Years | 2 (2.1%) | 0 (0.0%) |
| 75 Years and over | 0 (0.0%) | 0 (0.0%) |
| Total | 365 (52.9%) | 3 (0.8%) |
Employment Status by Educational Attainment in Crab Orchard
According to labor force statistics for Crab Orchard, 67.0% of individuals (311) out of the total population between 25 and 64 years of age (464) are in the labor force, with 1.0% or 3 of them being unemployed. The group with the highest labor force participation rate are those with the educational attainment of college / associate degree, with 100.0% or 54 individuals in the labor force. Within the labor force, individuals with high school diploma education have the highest percentage of unemployment, with 1.5% or 3 of them being unemployed.
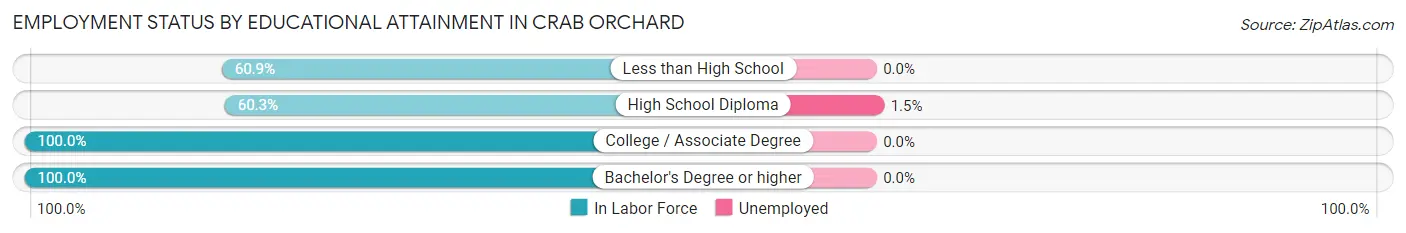
| Educational Attainment | In Labor Force | Unemployed |
| Less than High School | 28 (60.9%) | 0 (0.0%) |
| High School Diploma | 205 (60.3%) | 5 (1.5%) |
| College / Associate Degree | 54 (100.0%) | 0 (0.0%) |
| Bachelor's Degree or higher | 24 (100.0%) | 0 (0.0%) |
| Total | 311 (67.0%) | 5 (1.0%) |
Employment Occupations by Sex in Crab Orchard
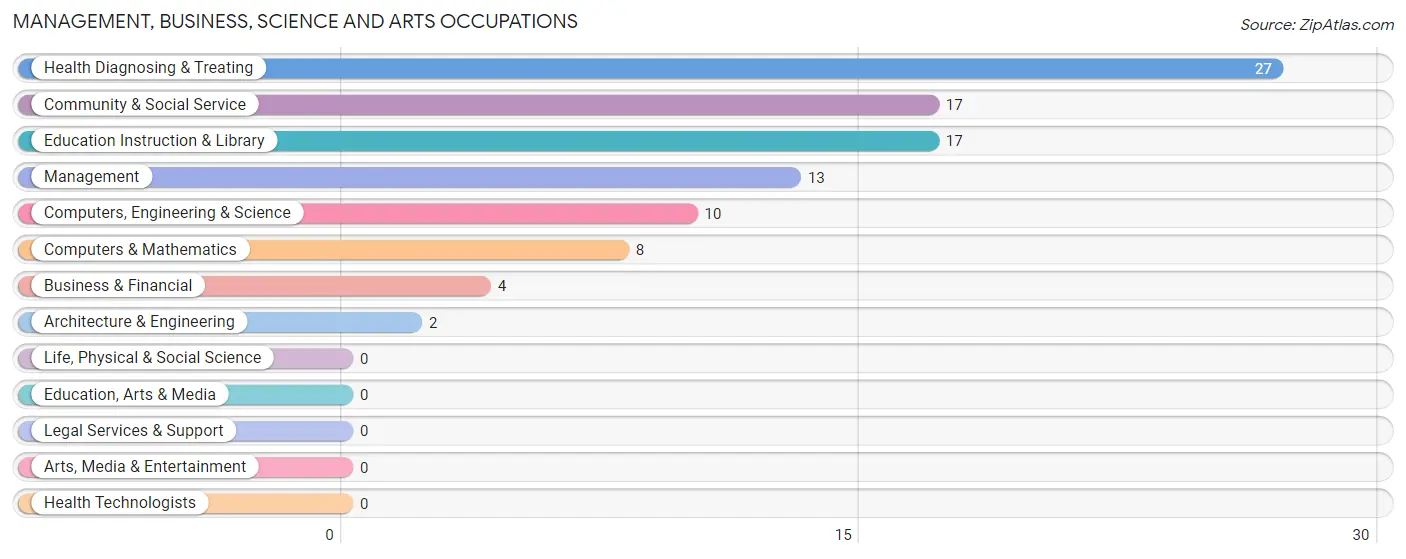
Management, Business, Science and Arts Occupations
The most common Management, Business, Science and Arts occupations in Crab Orchard are Health Diagnosing & Treating (27 | 7.5%), Community & Social Service (17 | 4.7%), Education Instruction & Library (17 | 4.7%), Management (13 | 3.6%), and Computers, Engineering & Science (10 | 2.8%).
Management, Business, Science and Arts Occupations by Sex
Within the Management, Business, Science and Arts occupations in Crab Orchard, the most male-oriented occupations are Computers, Engineering & Science (100.0%), Computers & Mathematics (100.0%), and Architecture & Engineering (100.0%), while the most female-oriented occupations are Business & Financial (100.0%), Community & Social Service (100.0%), and Education Instruction & Library (100.0%).
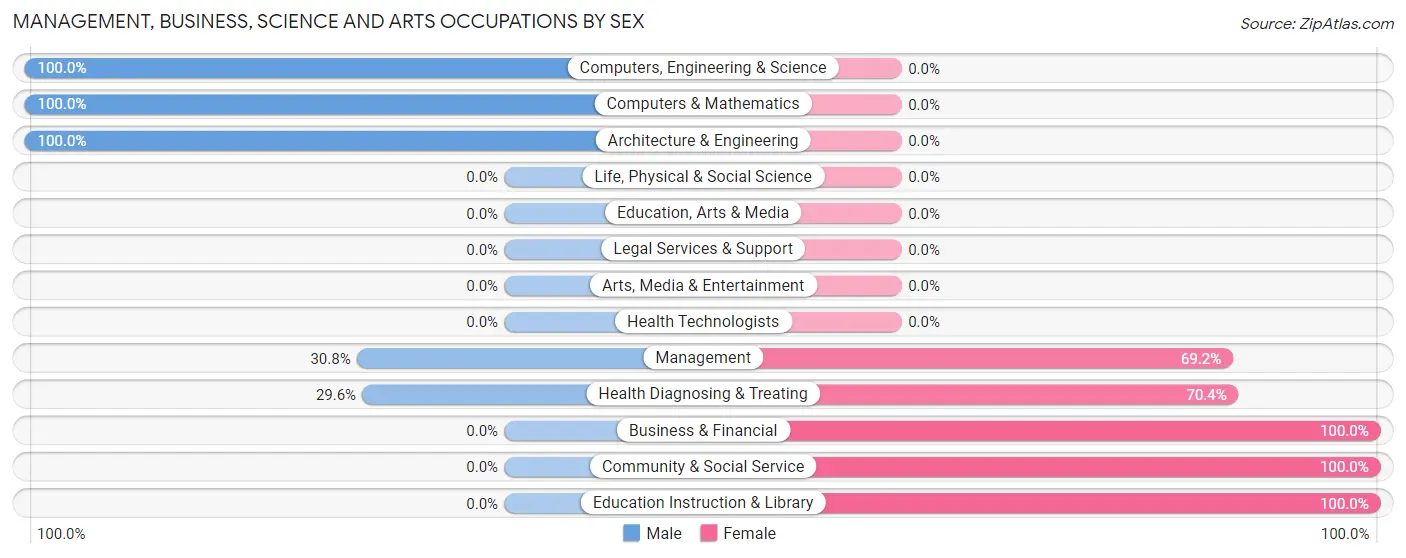
| Occupation | Male | Female |
| Management | 4 (30.8%) | 9 (69.2%) |
| Business & Financial | 0 (0.0%) | 4 (100.0%) |
| Computers, Engineering & Science | 10 (100.0%) | 0 (0.0%) |
| Computers & Mathematics | 8 (100.0%) | 0 (0.0%) |
| Architecture & Engineering | 2 (100.0%) | 0 (0.0%) |
| Life, Physical & Social Science | 0 (0.0%) | 0 (0.0%) |
| Community & Social Service | 0 (0.0%) | 17 (100.0%) |
| Education, Arts & Media | 0 (0.0%) | 0 (0.0%) |
| Legal Services & Support | 0 (0.0%) | 0 (0.0%) |
| Education Instruction & Library | 0 (0.0%) | 17 (100.0%) |
| Arts, Media & Entertainment | 0 (0.0%) | 0 (0.0%) |
| Health Diagnosing & Treating | 8 (29.6%) | 19 (70.4%) |
| Health Technologists | 0 (0.0%) | 0 (0.0%) |
| Total (Category) | 22 (31.0%) | 49 (69.0%) |
| Total (Overall) | 181 (50.0%) | 181 (50.0%) |
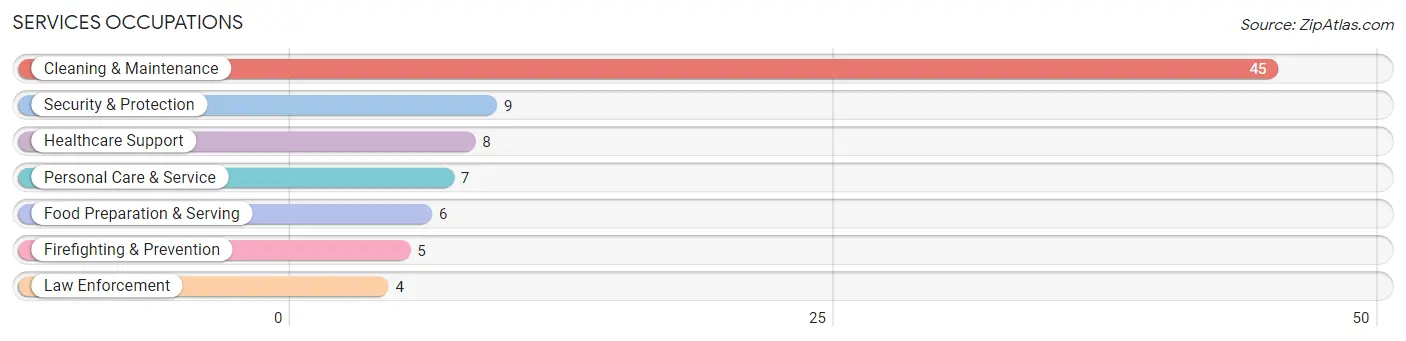
Services Occupations
The most common Services occupations in Crab Orchard are Cleaning & Maintenance (45 | 12.4%), Security & Protection (9 | 2.5%), Healthcare Support (8 | 2.2%), Personal Care & Service (7 | 1.9%), and Food Preparation & Serving (6 | 1.7%).
Services Occupations by Sex
Within the Services occupations in Crab Orchard, the most male-oriented occupations are Security & Protection (100.0%), Firefighting & Prevention (100.0%), and Law Enforcement (100.0%), while the most female-oriented occupations are Healthcare Support (100.0%), Food Preparation & Serving (100.0%), and Personal Care & Service (42.9%).
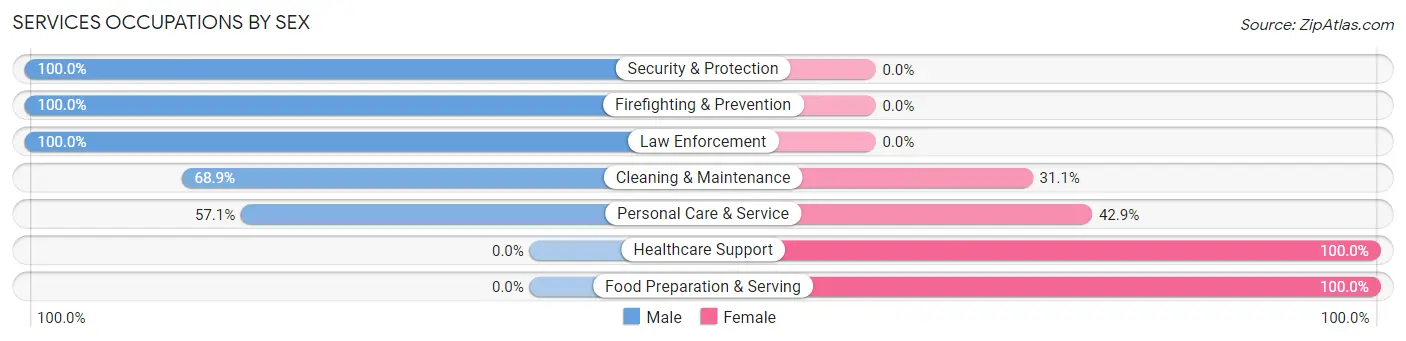
| Occupation | Male | Female |
| Healthcare Support | 0 (0.0%) | 8 (100.0%) |
| Security & Protection | 9 (100.0%) | 0 (0.0%) |
| Firefighting & Prevention | 5 (100.0%) | 0 (0.0%) |
| Law Enforcement | 4 (100.0%) | 0 (0.0%) |
| Food Preparation & Serving | 0 (0.0%) | 6 (100.0%) |
| Cleaning & Maintenance | 31 (68.9%) | 14 (31.1%) |
| Personal Care & Service | 4 (57.1%) | 3 (42.9%) |
| Total (Category) | 44 (58.7%) | 31 (41.3%) |
| Total (Overall) | 181 (50.0%) | 181 (50.0%) |
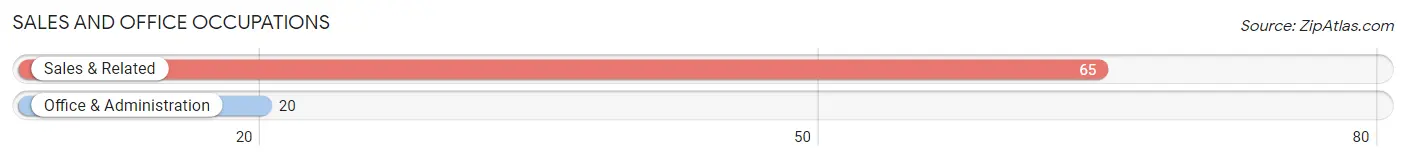
Sales and Office Occupations
The most common Sales and Office occupations in Crab Orchard are Sales & Related (65 | 18.0%), and Office & Administration (20 | 5.5%).
Sales and Office Occupations by Sex
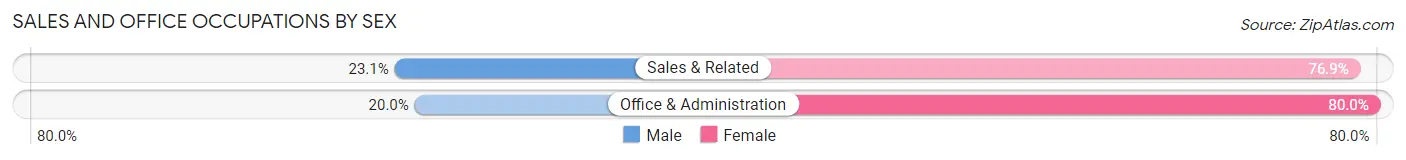
| Occupation | Male | Female |
| Sales & Related | 15 (23.1%) | 50 (76.9%) |
| Office & Administration | 4 (20.0%) | 16 (80.0%) |
| Total (Category) | 19 (22.4%) | 66 (77.6%) |
| Total (Overall) | 181 (50.0%) | 181 (50.0%) |
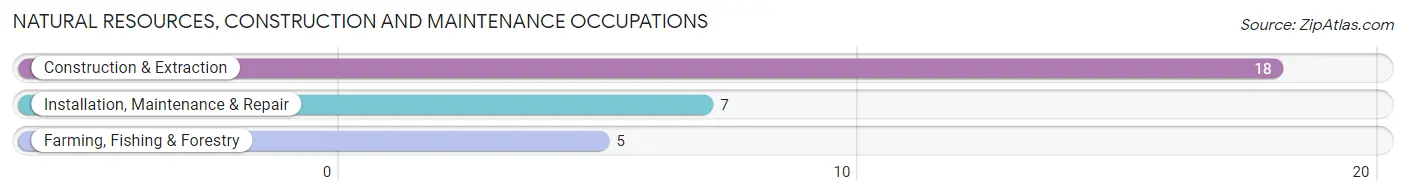
Natural Resources, Construction and Maintenance Occupations
The most common Natural Resources, Construction and Maintenance occupations in Crab Orchard are Construction & Extraction (18 | 5.0%), Installation, Maintenance & Repair (7 | 1.9%), and Farming, Fishing & Forestry (5 | 1.4%).
Natural Resources, Construction and Maintenance Occupations by Sex
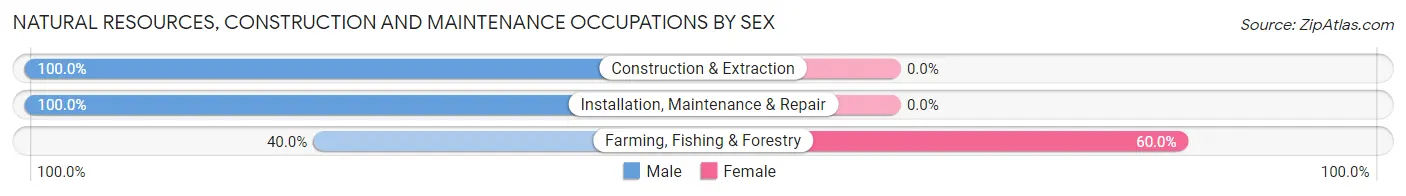
| Occupation | Male | Female |
| Farming, Fishing & Forestry | 2 (40.0%) | 3 (60.0%) |
| Construction & Extraction | 18 (100.0%) | 0 (0.0%) |
| Installation, Maintenance & Repair | 7 (100.0%) | 0 (0.0%) |
| Total (Category) | 27 (90.0%) | 3 (10.0%) |
| Total (Overall) | 181 (50.0%) | 181 (50.0%) |
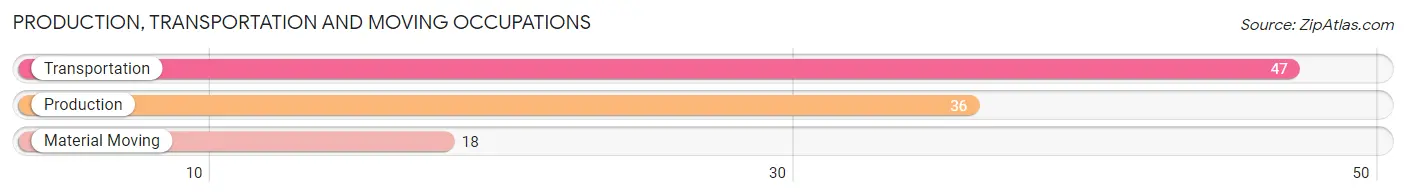
Production, Transportation and Moving Occupations
The most common Production, Transportation and Moving occupations in Crab Orchard are Transportation (47 | 13.0%), Production (36 | 9.9%), and Material Moving (18 | 5.0%).
Production, Transportation and Moving Occupations by Sex
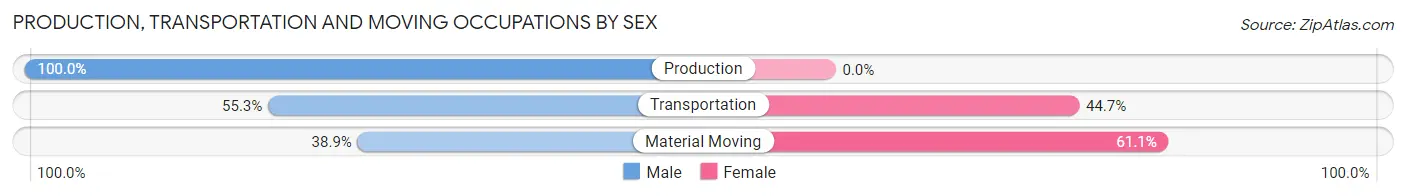
| Occupation | Male | Female |
| Production | 36 (100.0%) | 0 (0.0%) |
| Transportation | 26 (55.3%) | 21 (44.7%) |
| Material Moving | 7 (38.9%) | 11 (61.1%) |
| Total (Category) | 69 (68.3%) | 32 (31.7%) |
| Total (Overall) | 181 (50.0%) | 181 (50.0%) |
Employment Industries by Sex in Crab Orchard
Employment Industries in Crab Orchard
The major employment industries in Crab Orchard include Retail Trade (67 | 18.5%), Transportation & Warehousing (64 | 17.7%), Manufacturing (46 | 12.7%), Health Care & Social Assistance (28 | 7.7%), and Construction (27 | 7.5%).
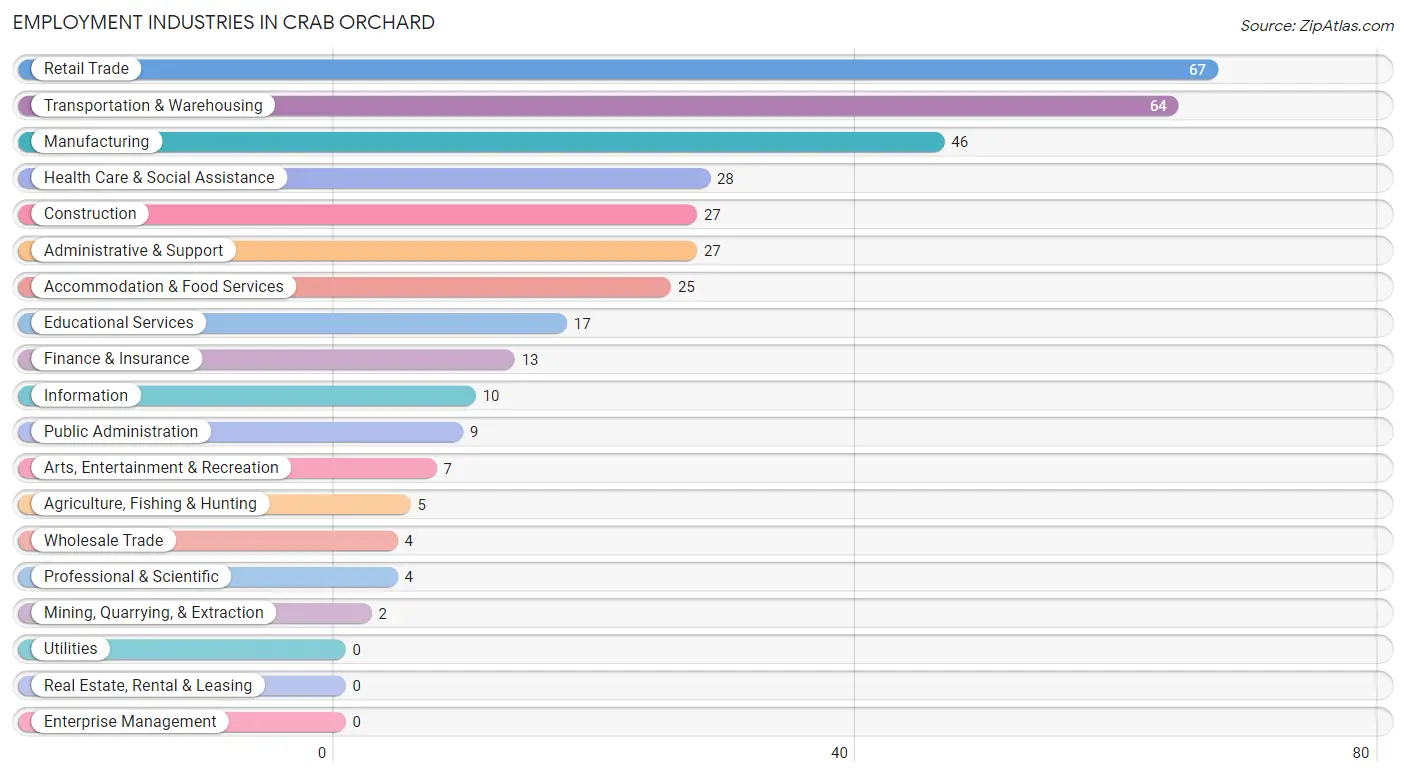
Employment Industries by Sex in Crab Orchard
The Crab Orchard industries that see more men than women are Mining, Quarrying, & Extraction (100.0%), Construction (100.0%), and Information (100.0%), whereas the industries that tend to have a higher number of women are Wholesale Trade (100.0%), Finance & Insurance (100.0%), and Educational Services (100.0%).
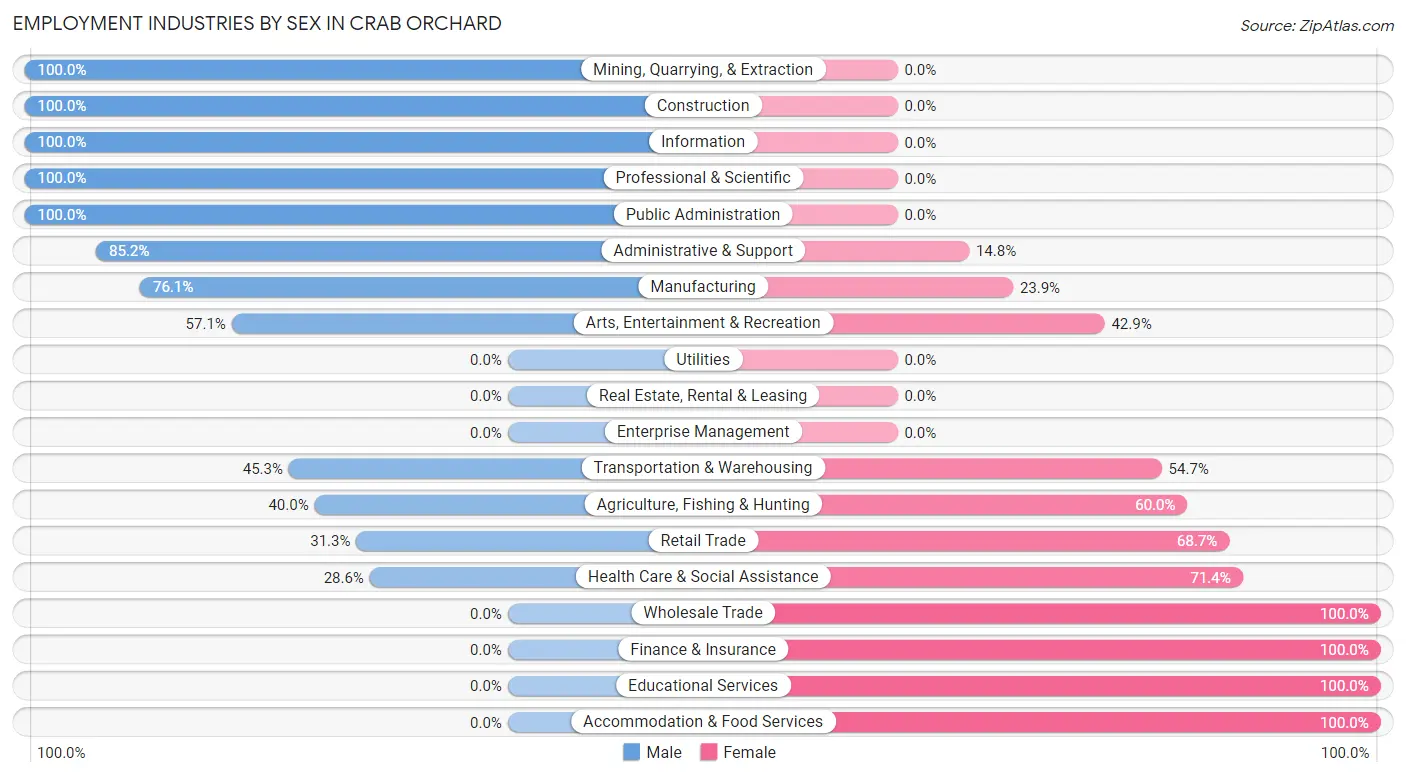
| Industry | Male | Female |
| Agriculture, Fishing & Hunting | 2 (40.0%) | 3 (60.0%) |
| Mining, Quarrying, & Extraction | 2 (100.0%) | 0 (0.0%) |
| Construction | 27 (100.0%) | 0 (0.0%) |
| Manufacturing | 35 (76.1%) | 11 (23.9%) |
| Wholesale Trade | 0 (0.0%) | 4 (100.0%) |
| Retail Trade | 21 (31.3%) | 46 (68.7%) |
| Transportation & Warehousing | 29 (45.3%) | 35 (54.7%) |
| Utilities | 0 (0.0%) | 0 (0.0%) |
| Information | 10 (100.0%) | 0 (0.0%) |
| Finance & Insurance | 0 (0.0%) | 13 (100.0%) |
| Real Estate, Rental & Leasing | 0 (0.0%) | 0 (0.0%) |
| Professional & Scientific | 4 (100.0%) | 0 (0.0%) |
| Enterprise Management | 0 (0.0%) | 0 (0.0%) |
| Administrative & Support | 23 (85.2%) | 4 (14.8%) |
| Educational Services | 0 (0.0%) | 17 (100.0%) |
| Health Care & Social Assistance | 8 (28.6%) | 20 (71.4%) |
| Arts, Entertainment & Recreation | 4 (57.1%) | 3 (42.9%) |
| Accommodation & Food Services | 0 (0.0%) | 25 (100.0%) |
| Public Administration | 9 (100.0%) | 0 (0.0%) |
| Total | 181 (50.0%) | 181 (50.0%) |
Education in Crab Orchard
School Enrollment in Crab Orchard
The most common levels of schooling among the 193 students in Crab Orchard are kindergarten (56 | 29.0%), middle school (44 | 22.8%), and elementary school (37 | 19.2%).
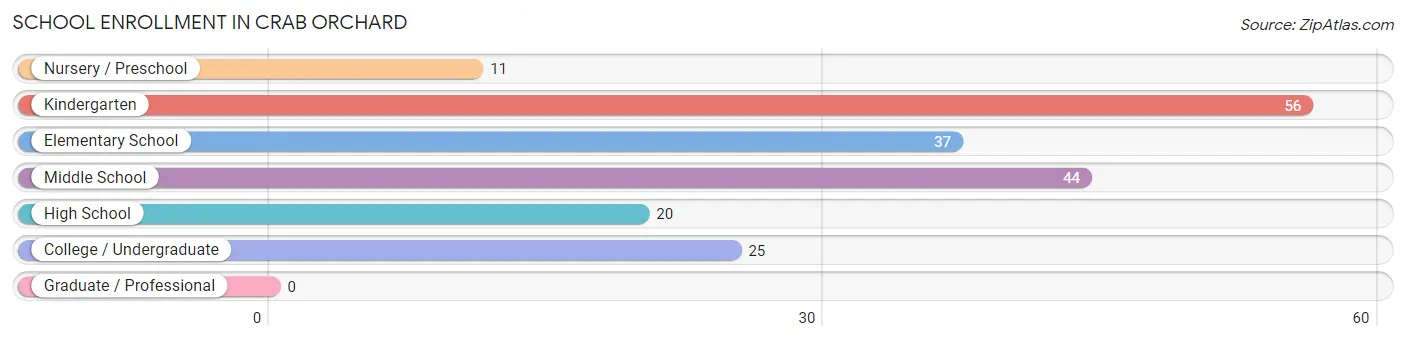
| School Level | # Students | % Students |
| Nursery / Preschool | 11 | 5.7% |
| Kindergarten | 56 | 29.0% |
| Elementary School | 37 | 19.2% |
| Middle School | 44 | 22.8% |
| High School | 20 | 10.4% |
| College / Undergraduate | 25 | 13.0% |
| Graduate / Professional | 0 | 0.0% |
| Total | 193 | 100.0% |
School Enrollment by Age by Funding Source in Crab Orchard
Out of a total of 193 students who are enrolled in schools in Crab Orchard, 11 (5.7%) attend a private institution, while the remaining 182 (94.3%) are enrolled in public schools. The age group of 25 to 34 year olds has the highest likelihood of being enrolled in private schools, with 9 (100.0% in the age bracket) enrolled. Conversely, the age group of 3 to 4 year olds has the lowest likelihood of being enrolled in a private school, with 5 (100.0% in the age bracket) attending a public institution.
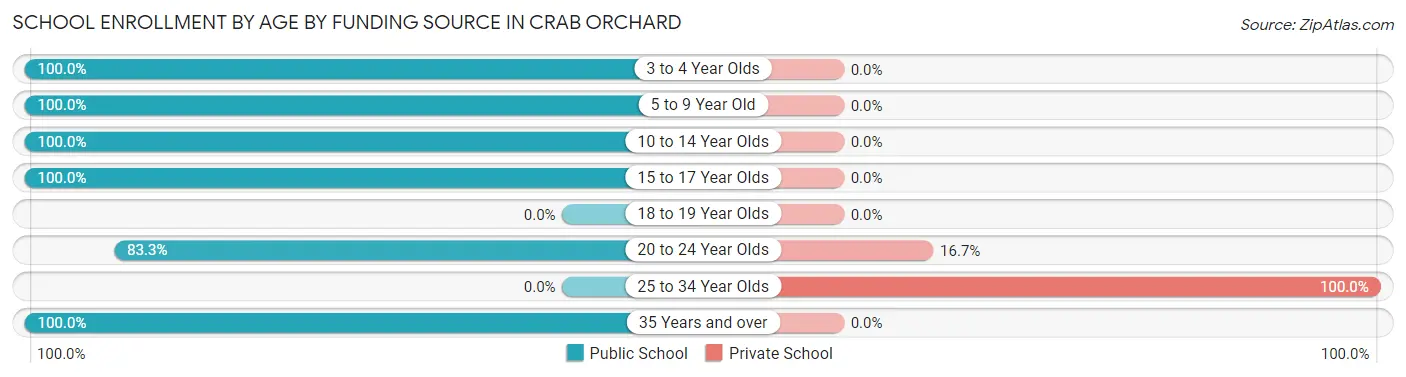
| Age Bracket | Public School | Private School |
| 3 to 4 Year Olds | 5 (100.0%) | 0 (0.0%) |
| 5 to 9 Year Old | 74 (100.0%) | 0 (0.0%) |
| 10 to 14 Year Olds | 69 (100.0%) | 0 (0.0%) |
| 15 to 17 Year Olds | 20 (100.0%) | 0 (0.0%) |
| 18 to 19 Year Olds | 0 (0.0%) | 0 (0.0%) |
| 20 to 24 Year Olds | 10 (83.3%) | 2 (16.7%) |
| 25 to 34 Year Olds | 0 (0.0%) | 9 (100.0%) |
| 35 Years and over | 4 (100.0%) | 0 (0.0%) |
| Total | 182 (94.3%) | 11 (5.7%) |
Educational Attainment by Field of Study in Crab Orchard
Education (16 | 53.3%), bio, nature & agricultural (6 | 20.0%), business (6 | 20.0%), and science & technology (2 | 6.7%) are the most common fields of study among 30 individuals in Crab Orchard who have obtained a bachelor's degree or higher.
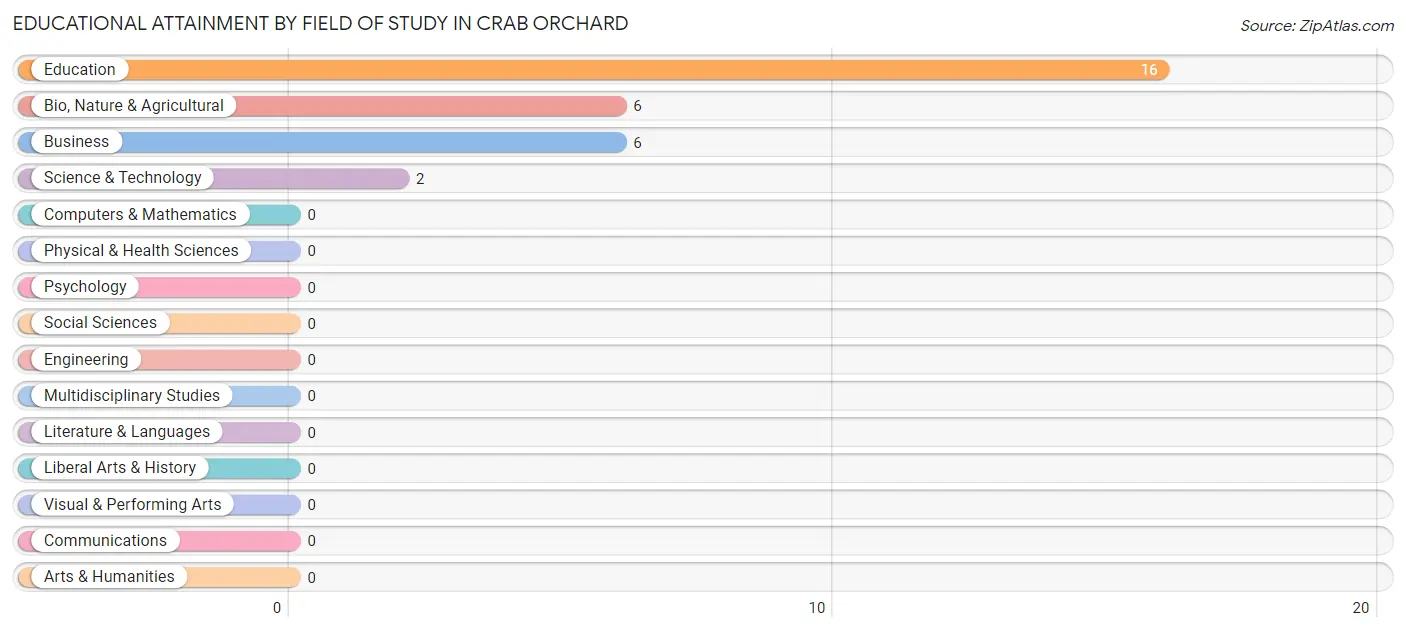
| Field of Study | # Graduates | % Graduates |
| Computers & Mathematics | 0 | 0.0% |
| Bio, Nature & Agricultural | 6 | 20.0% |
| Physical & Health Sciences | 0 | 0.0% |
| Psychology | 0 | 0.0% |
| Social Sciences | 0 | 0.0% |
| Engineering | 0 | 0.0% |
| Multidisciplinary Studies | 0 | 0.0% |
| Science & Technology | 2 | 6.7% |
| Business | 6 | 20.0% |
| Education | 16 | 53.3% |
| Literature & Languages | 0 | 0.0% |
| Liberal Arts & History | 0 | 0.0% |
| Visual & Performing Arts | 0 | 0.0% |
| Communications | 0 | 0.0% |
| Arts & Humanities | 0 | 0.0% |
| Total | 30 | 100.0% |
Transportation & Commute in Crab Orchard
Vehicle Availability by Sex in Crab Orchard
The most prevalent vehicle ownership categories in Crab Orchard are males with 2 vehicles (96, accounting for 56.1%) and females with 2 vehicles (99, making up 53.0%).
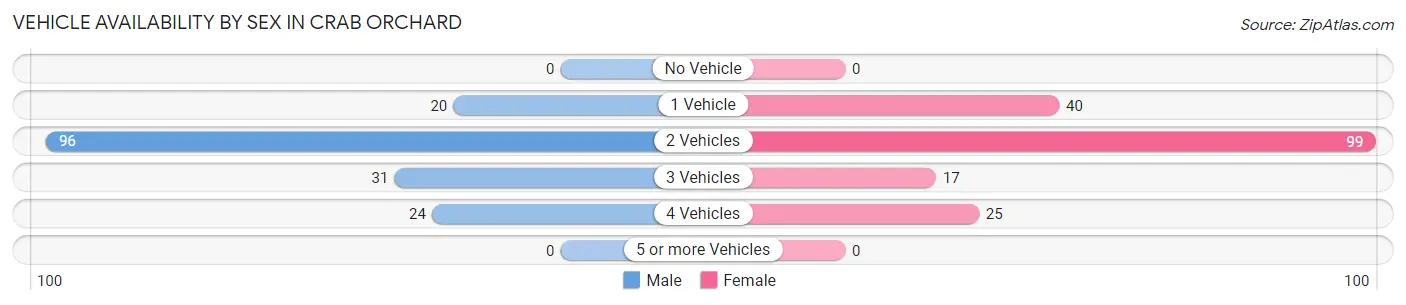
| Vehicles Available | Male | Female |
| No Vehicle | 0 (0.0%) | 0 (0.0%) |
| 1 Vehicle | 20 (11.7%) | 40 (22.1%) |
| 2 Vehicles | 96 (56.1%) | 99 (54.7%) |
| 3 Vehicles | 31 (18.1%) | 17 (9.4%) |
| 4 Vehicles | 24 (14.0%) | 25 (13.8%) |
| 5 or more Vehicles | 0 (0.0%) | 0 (0.0%) |
| Total | 171 (100.0%) | 181 (100.0%) |
Commute Time in Crab Orchard
The most frequently occuring commute durations in Crab Orchard are 20 to 24 minutes (98 commuters, 29.0%), 30 to 34 minutes (54 commuters, 16.0%), and 15 to 19 minutes (52 commuters, 15.4%).
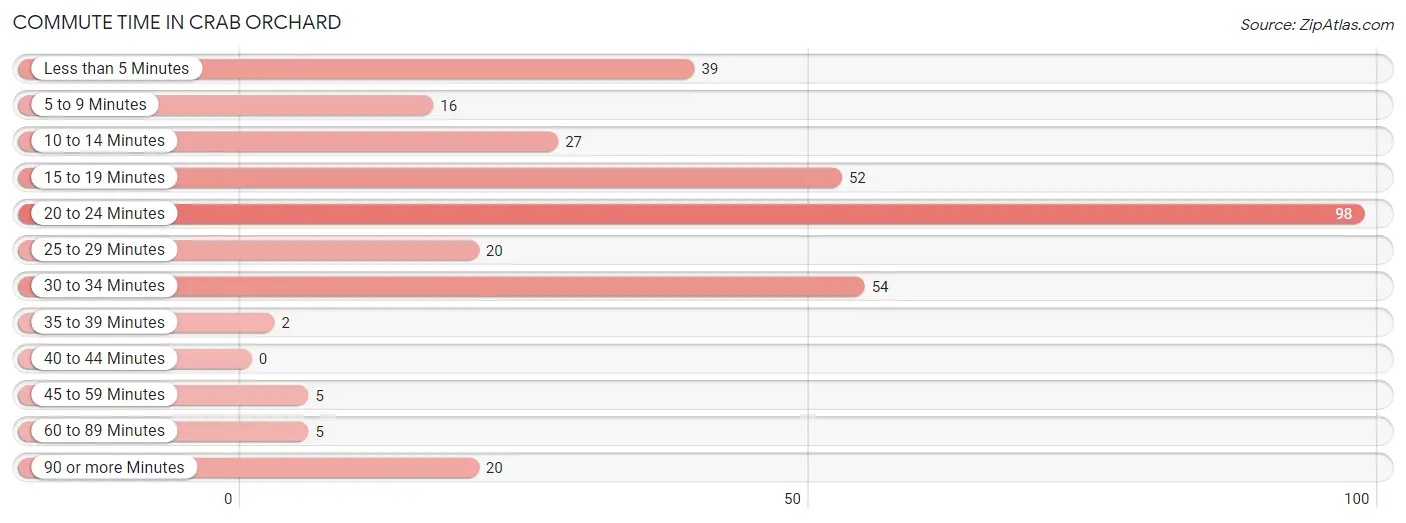
| Commute Time | # Commuters | % Commuters |
| Less than 5 Minutes | 39 | 11.5% |
| 5 to 9 Minutes | 16 | 4.7% |
| 10 to 14 Minutes | 27 | 8.0% |
| 15 to 19 Minutes | 52 | 15.4% |
| 20 to 24 Minutes | 98 | 29.0% |
| 25 to 29 Minutes | 20 | 5.9% |
| 30 to 34 Minutes | 54 | 16.0% |
| 35 to 39 Minutes | 2 | 0.6% |
| 40 to 44 Minutes | 0 | 0.0% |
| 45 to 59 Minutes | 5 | 1.5% |
| 60 to 89 Minutes | 5 | 1.5% |
| 90 or more Minutes | 20 | 5.9% |
Commute Time by Sex in Crab Orchard
The most common commute times in Crab Orchard are 20 to 24 minutes (45 commuters, 28.7%) for males and 20 to 24 minutes (53 commuters, 29.3%) for females.
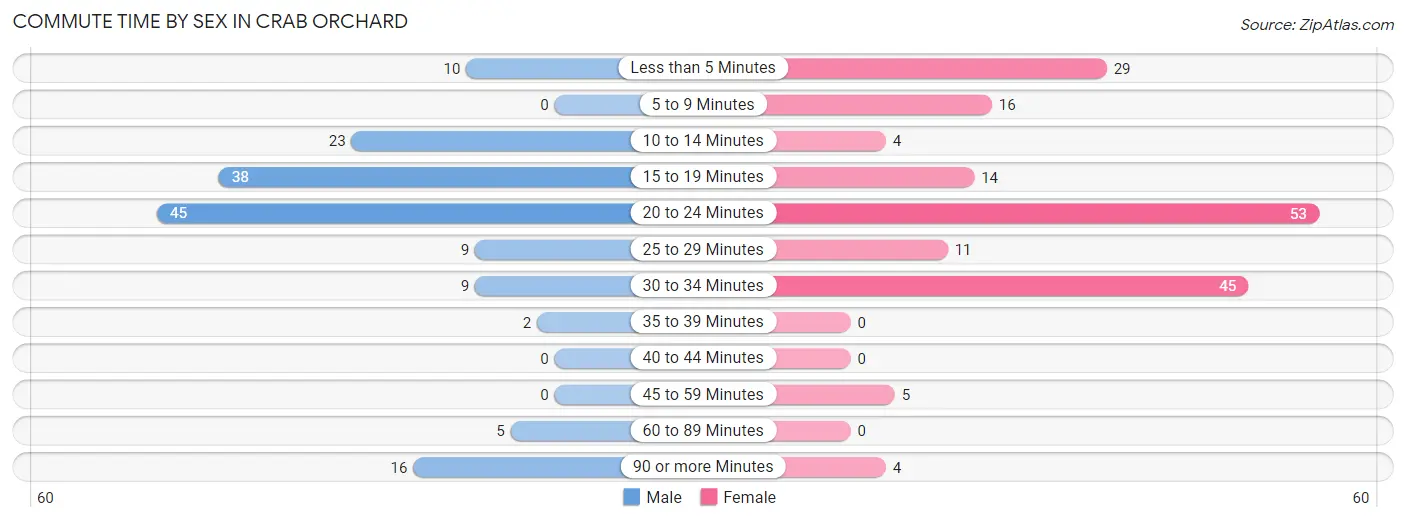
| Commute Time | Male | Female |
| Less than 5 Minutes | 10 (6.4%) | 29 (16.0%) |
| 5 to 9 Minutes | 0 (0.0%) | 16 (8.8%) |
| 10 to 14 Minutes | 23 (14.6%) | 4 (2.2%) |
| 15 to 19 Minutes | 38 (24.2%) | 14 (7.7%) |
| 20 to 24 Minutes | 45 (28.7%) | 53 (29.3%) |
| 25 to 29 Minutes | 9 (5.7%) | 11 (6.1%) |
| 30 to 34 Minutes | 9 (5.7%) | 45 (24.9%) |
| 35 to 39 Minutes | 2 (1.3%) | 0 (0.0%) |
| 40 to 44 Minutes | 0 (0.0%) | 0 (0.0%) |
| 45 to 59 Minutes | 0 (0.0%) | 5 (2.8%) |
| 60 to 89 Minutes | 5 (3.2%) | 0 (0.0%) |
| 90 or more Minutes | 16 (10.2%) | 4 (2.2%) |
Time of Departure to Work by Sex in Crab Orchard
The most frequent times of departure to work in Crab Orchard are 6:00 AM to 6:29 AM (77, 49.0%) for males and 6:30 AM to 6:59 AM (50, 27.6%) for females.
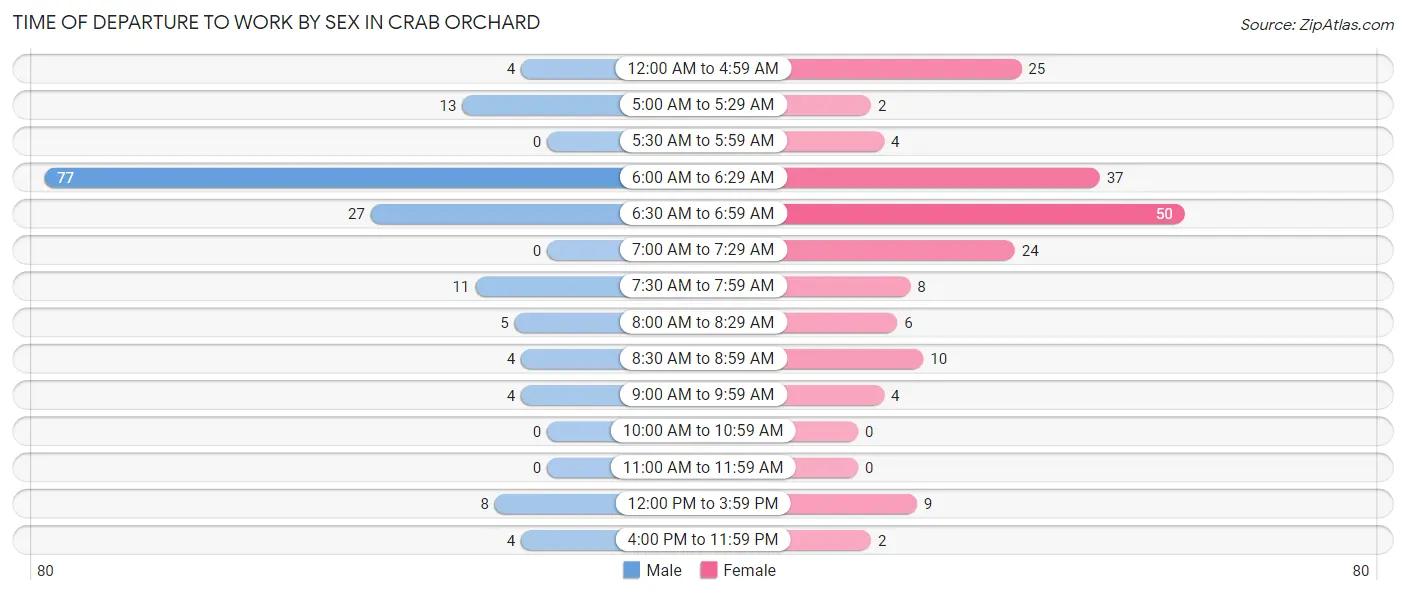
| Time of Departure | Male | Female |
| 12:00 AM to 4:59 AM | 4 (2.5%) | 25 (13.8%) |
| 5:00 AM to 5:29 AM | 13 (8.3%) | 2 (1.1%) |
| 5:30 AM to 5:59 AM | 0 (0.0%) | 4 (2.2%) |
| 6:00 AM to 6:29 AM | 77 (49.0%) | 37 (20.4%) |
| 6:30 AM to 6:59 AM | 27 (17.2%) | 50 (27.6%) |
| 7:00 AM to 7:29 AM | 0 (0.0%) | 24 (13.3%) |
| 7:30 AM to 7:59 AM | 11 (7.0%) | 8 (4.4%) |
| 8:00 AM to 8:29 AM | 5 (3.2%) | 6 (3.3%) |
| 8:30 AM to 8:59 AM | 4 (2.5%) | 10 (5.5%) |
| 9:00 AM to 9:59 AM | 4 (2.5%) | 4 (2.2%) |
| 10:00 AM to 10:59 AM | 0 (0.0%) | 0 (0.0%) |
| 11:00 AM to 11:59 AM | 0 (0.0%) | 0 (0.0%) |
| 12:00 PM to 3:59 PM | 8 (5.1%) | 9 (5.0%) |
| 4:00 PM to 11:59 PM | 4 (2.5%) | 2 (1.1%) |
| Total | 157 (100.0%) | 181 (100.0%) |
Housing Occupancy in Crab Orchard
Occupancy by Ownership in Crab Orchard
Of the total 391 dwellings in Crab Orchard, owner-occupied units account for 332 (84.9%), while renter-occupied units make up 59 (15.1%).
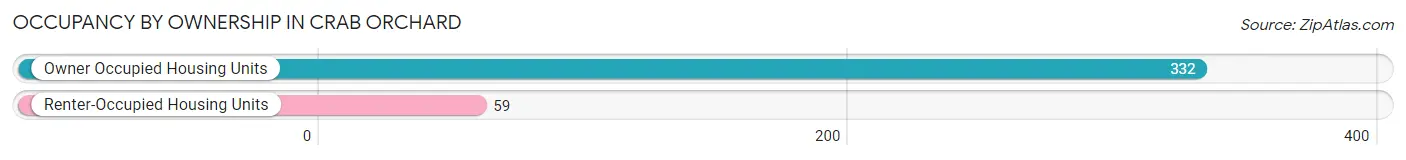
| Occupancy | # Housing Units | % Housing Units |
| Owner Occupied Housing Units | 332 | 84.9% |
| Renter-Occupied Housing Units | 59 | 15.1% |
| Total Occupied Housing Units | 391 | 100.0% |
Occupancy by Household Size in Crab Orchard
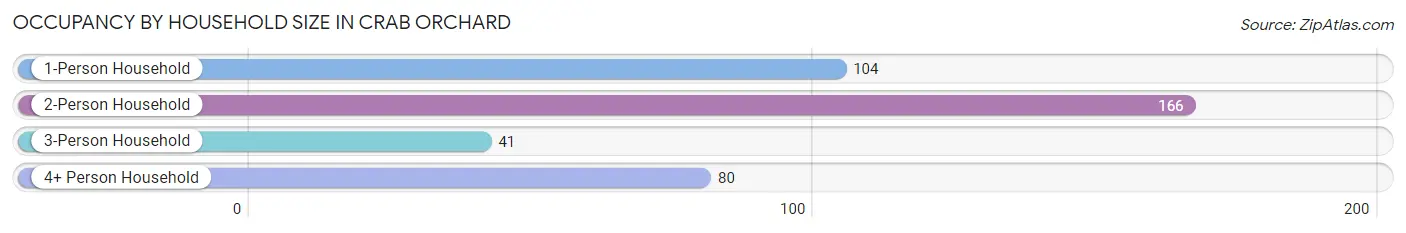
| Household Size | # Housing Units | % Housing Units |
| 1-Person Household | 104 | 26.6% |
| 2-Person Household | 166 | 42.5% |
| 3-Person Household | 41 | 10.5% |
| 4+ Person Household | 80 | 20.5% |
| Total Housing Units | 391 | 100.0% |
Occupancy by Ownership by Household Size in Crab Orchard
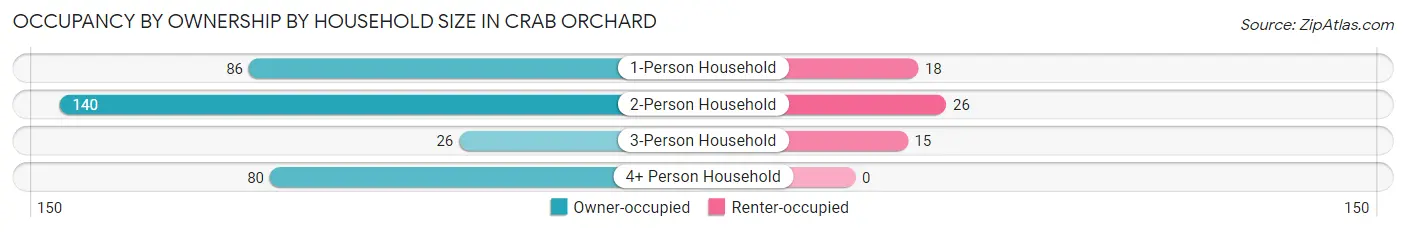
| Household Size | Owner-occupied | Renter-occupied |
| 1-Person Household | 86 (82.7%) | 18 (17.3%) |
| 2-Person Household | 140 (84.3%) | 26 (15.7%) |
| 3-Person Household | 26 (63.4%) | 15 (36.6%) |
| 4+ Person Household | 80 (100.0%) | 0 (0.0%) |
| Total Housing Units | 332 (84.9%) | 59 (15.1%) |
Occupancy by Educational Attainment in Crab Orchard
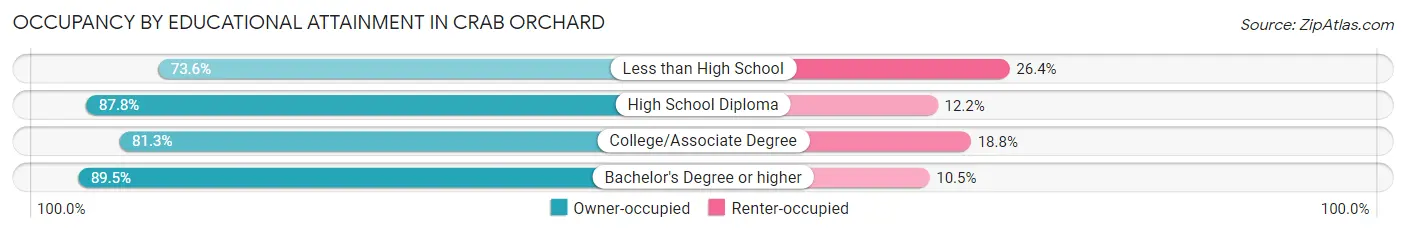
| Household Size | Owner-occupied | Renter-occupied |
| Less than High School | 39 (73.6%) | 14 (26.4%) |
| High School Diploma | 224 (87.8%) | 31 (12.2%) |
| College/Associate Degree | 52 (81.2%) | 12 (18.8%) |
| Bachelor's Degree or higher | 17 (89.5%) | 2 (10.5%) |
Occupancy by Age of Householder in Crab Orchard
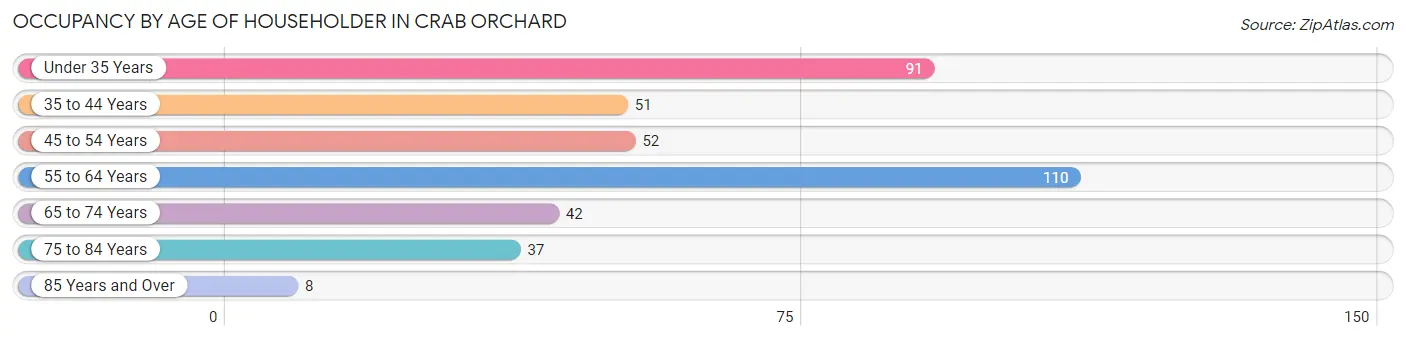
| Age Bracket | # Households | % Households |
| Under 35 Years | 91 | 23.3% |
| 35 to 44 Years | 51 | 13.0% |
| 45 to 54 Years | 52 | 13.3% |
| 55 to 64 Years | 110 | 28.1% |
| 65 to 74 Years | 42 | 10.7% |
| 75 to 84 Years | 37 | 9.5% |
| 85 Years and Over | 8 | 2.1% |
| Total | 391 | 100.0% |
Housing Finances in Crab Orchard
Median Income by Occupancy in Crab Orchard
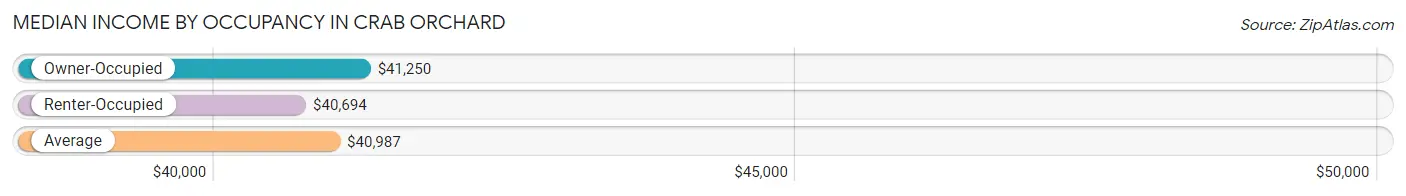
| Occupancy Type | # Households | Median Income |
| Owner-Occupied | 332 (84.9%) | $41,250 |
| Renter-Occupied | 59 (15.1%) | $40,694 |
| Average | 391 (100.0%) | $40,987 |
Occupancy by Householder Income Bracket in Crab Orchard
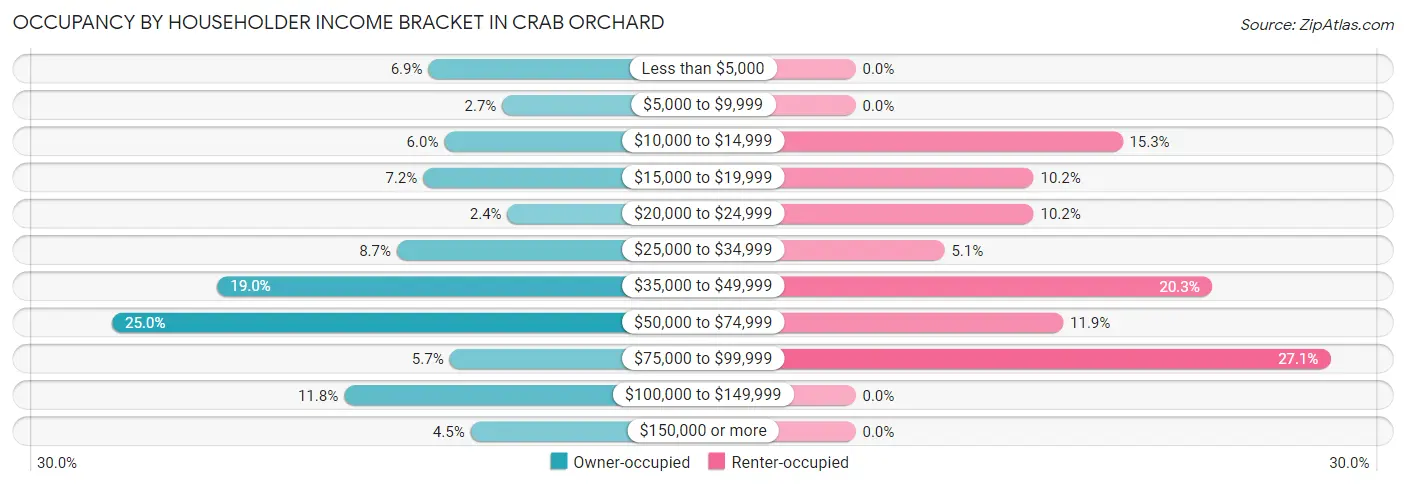
| Income Bracket | Owner-occupied | Renter-occupied |
| Less than $5,000 | 23 (6.9%) | 0 (0.0%) |
| $5,000 to $9,999 | 9 (2.7%) | 0 (0.0%) |
| $10,000 to $14,999 | 20 (6.0%) | 9 (15.2%) |
| $15,000 to $19,999 | 24 (7.2%) | 6 (10.2%) |
| $20,000 to $24,999 | 8 (2.4%) | 6 (10.2%) |
| $25,000 to $34,999 | 29 (8.7%) | 3 (5.1%) |
| $35,000 to $49,999 | 63 (19.0%) | 12 (20.3%) |
| $50,000 to $74,999 | 83 (25.0%) | 7 (11.9%) |
| $75,000 to $99,999 | 19 (5.7%) | 16 (27.1%) |
| $100,000 to $149,999 | 39 (11.7%) | 0 (0.0%) |
| $150,000 or more | 15 (4.5%) | 0 (0.0%) |
| Total | 332 (100.0%) | 59 (100.0%) |
Monthly Housing Cost Tiers in Crab Orchard
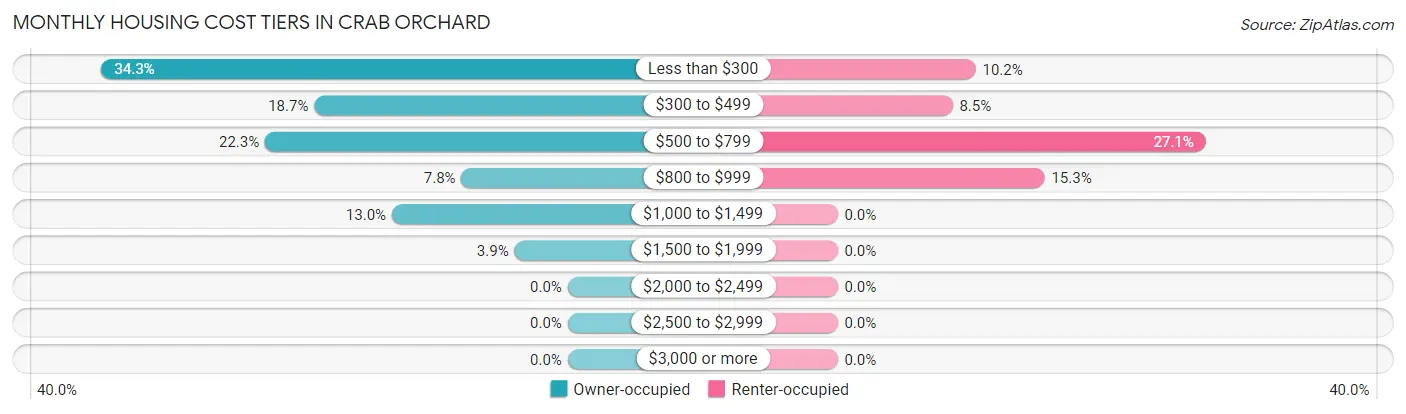
| Monthly Cost | Owner-occupied | Renter-occupied |
| Less than $300 | 114 (34.3%) | 6 (10.2%) |
| $300 to $499 | 62 (18.7%) | 5 (8.5%) |
| $500 to $799 | 74 (22.3%) | 16 (27.1%) |
| $800 to $999 | 26 (7.8%) | 9 (15.2%) |
| $1,000 to $1,499 | 43 (13.0%) | 0 (0.0%) |
| $1,500 to $1,999 | 13 (3.9%) | 0 (0.0%) |
| $2,000 to $2,499 | 0 (0.0%) | 0 (0.0%) |
| $2,500 to $2,999 | 0 (0.0%) | 0 (0.0%) |
| $3,000 or more | 0 (0.0%) | 0 (0.0%) |
| Total | 332 (100.0%) | 59 (100.0%) |
Physical Housing Characteristics in Crab Orchard
Housing Structures in Crab Orchard
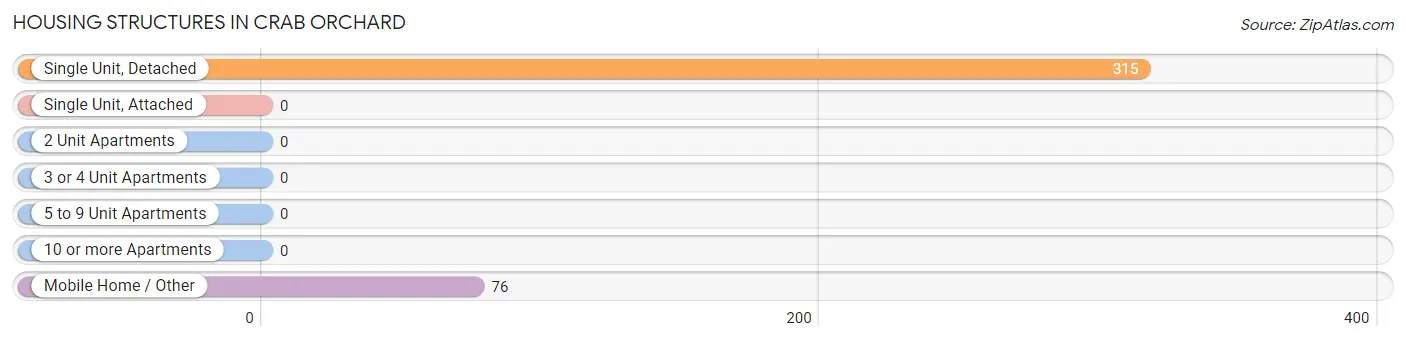
| Structure Type | # Housing Units | % Housing Units |
| Single Unit, Detached | 315 | 80.6% |
| Single Unit, Attached | 0 | 0.0% |
| 2 Unit Apartments | 0 | 0.0% |
| 3 or 4 Unit Apartments | 0 | 0.0% |
| 5 to 9 Unit Apartments | 0 | 0.0% |
| 10 or more Apartments | 0 | 0.0% |
| Mobile Home / Other | 76 | 19.4% |
| Total | 391 | 100.0% |
Housing Structures by Occupancy in Crab Orchard
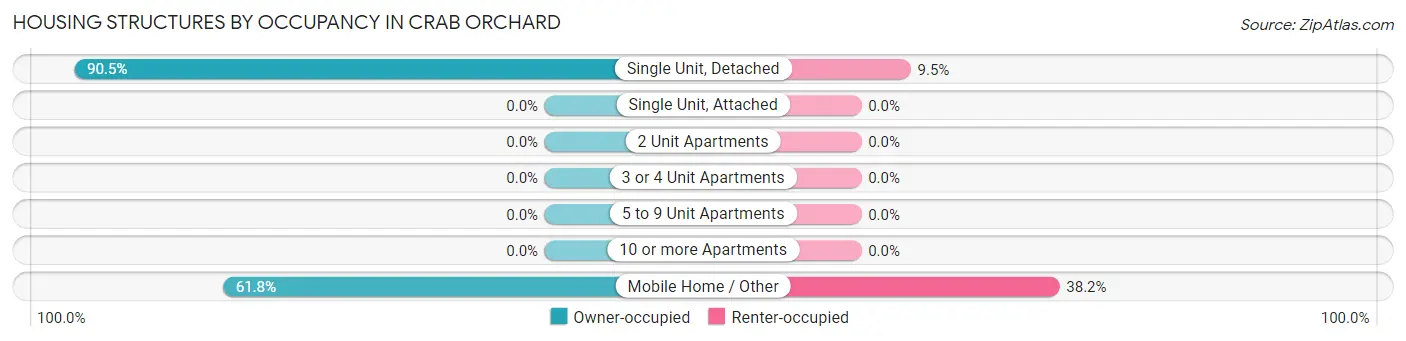
| Structure Type | Owner-occupied | Renter-occupied |
| Single Unit, Detached | 285 (90.5%) | 30 (9.5%) |
| Single Unit, Attached | 0 (0.0%) | 0 (0.0%) |
| 2 Unit Apartments | 0 (0.0%) | 0 (0.0%) |
| 3 or 4 Unit Apartments | 0 (0.0%) | 0 (0.0%) |
| 5 to 9 Unit Apartments | 0 (0.0%) | 0 (0.0%) |
| 10 or more Apartments | 0 (0.0%) | 0 (0.0%) |
| Mobile Home / Other | 47 (61.8%) | 29 (38.2%) |
| Total | 332 (84.9%) | 59 (15.1%) |
Housing Structures by Number of Rooms in Crab Orchard
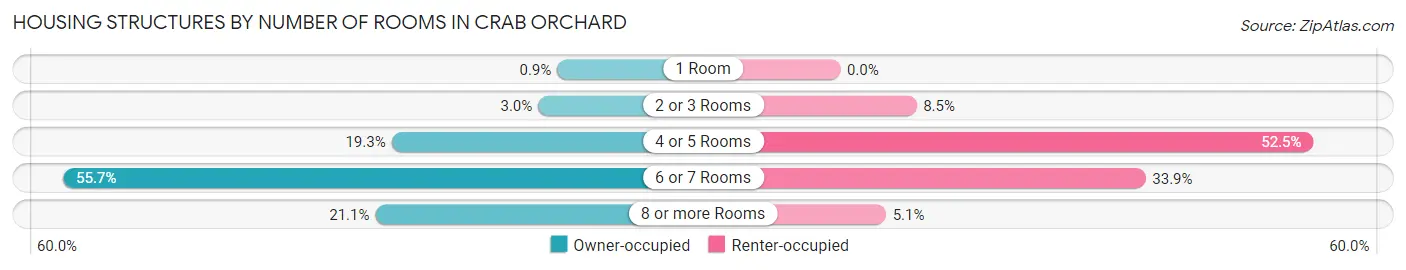
| Number of Rooms | Owner-occupied | Renter-occupied |
| 1 Room | 3 (0.9%) | 0 (0.0%) |
| 2 or 3 Rooms | 10 (3.0%) | 5 (8.5%) |
| 4 or 5 Rooms | 64 (19.3%) | 31 (52.5%) |
| 6 or 7 Rooms | 185 (55.7%) | 20 (33.9%) |
| 8 or more Rooms | 70 (21.1%) | 3 (5.1%) |
| Total | 332 (100.0%) | 59 (100.0%) |
Housing Structure by Heating Type in Crab Orchard
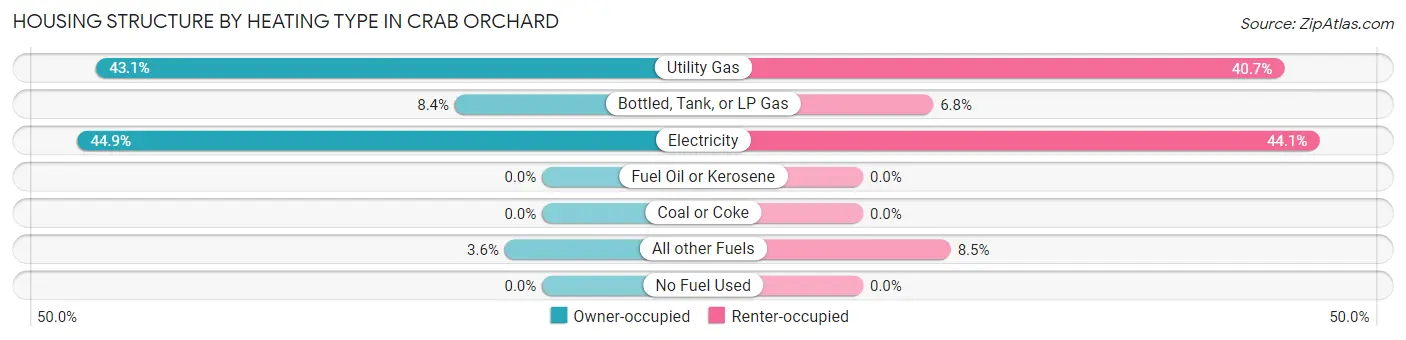
| Heating Type | Owner-occupied | Renter-occupied |
| Utility Gas | 143 (43.1%) | 24 (40.7%) |
| Bottled, Tank, or LP Gas | 28 (8.4%) | 4 (6.8%) |
| Electricity | 149 (44.9%) | 26 (44.1%) |
| Fuel Oil or Kerosene | 0 (0.0%) | 0 (0.0%) |
| Coal or Coke | 0 (0.0%) | 0 (0.0%) |
| All other Fuels | 12 (3.6%) | 5 (8.5%) |
| No Fuel Used | 0 (0.0%) | 0 (0.0%) |
| Total | 332 (100.0%) | 59 (100.0%) |
Household Vehicle Usage in Crab Orchard
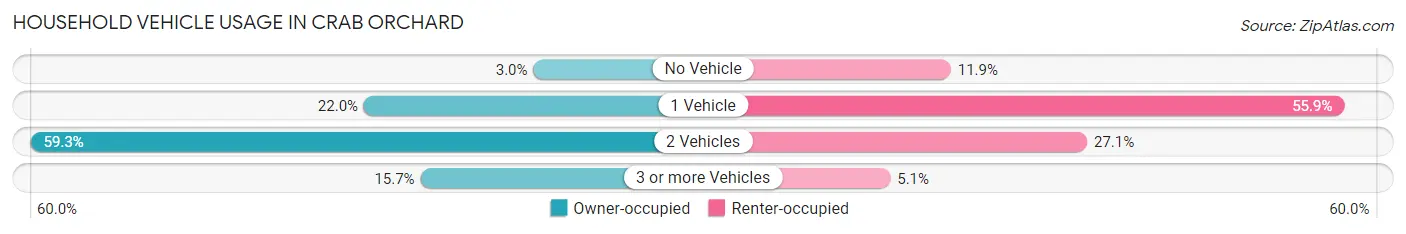
| Vehicles per Household | Owner-occupied | Renter-occupied |
| No Vehicle | 10 (3.0%) | 7 (11.9%) |
| 1 Vehicle | 73 (22.0%) | 33 (55.9%) |
| 2 Vehicles | 197 (59.3%) | 16 (27.1%) |
| 3 or more Vehicles | 52 (15.7%) | 3 (5.1%) |
| Total | 332 (100.0%) | 59 (100.0%) |
Real Estate & Mortgages in Crab Orchard
Real Estate and Mortgage Overview in Crab Orchard
| Characteristic | Without Mortgage | With Mortgage |
| Housing Units | 177 | 155 |
| Median Property Value | $146,900 | $118,100 |
| Median Household Income | $55,025 | $11 |
| Monthly Housing Costs | $284 | $0 |
| Real Estate Taxes | $334 | $18 |
Property Value by Mortgage Status in Crab Orchard
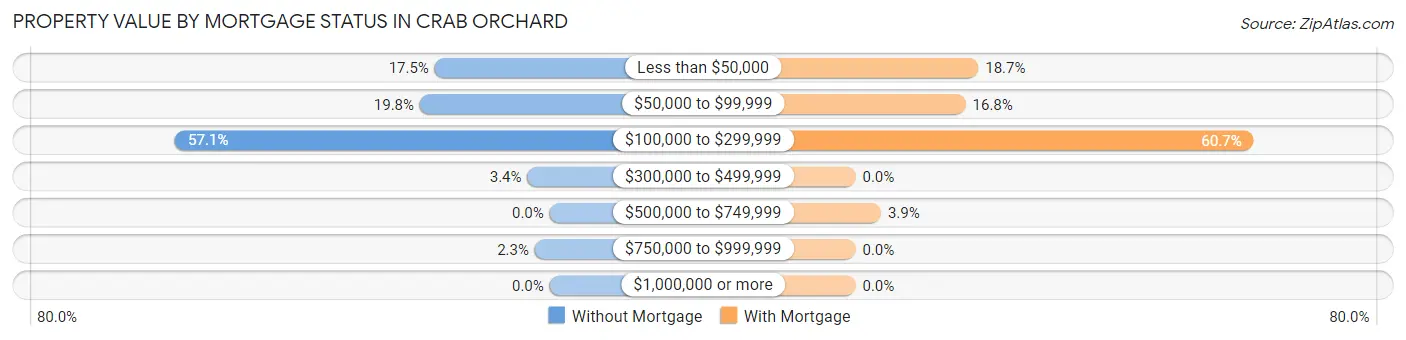
| Property Value | Without Mortgage | With Mortgage |
| Less than $50,000 | 31 (17.5%) | 29 (18.7%) |
| $50,000 to $99,999 | 35 (19.8%) | 26 (16.8%) |
| $100,000 to $299,999 | 101 (57.1%) | 94 (60.7%) |
| $300,000 to $499,999 | 6 (3.4%) | 0 (0.0%) |
| $500,000 to $749,999 | 0 (0.0%) | 6 (3.9%) |
| $750,000 to $999,999 | 4 (2.3%) | 0 (0.0%) |
| $1,000,000 or more | 0 (0.0%) | 0 (0.0%) |
| Total | 177 (100.0%) | 155 (100.0%) |
Household Income by Mortgage Status in Crab Orchard
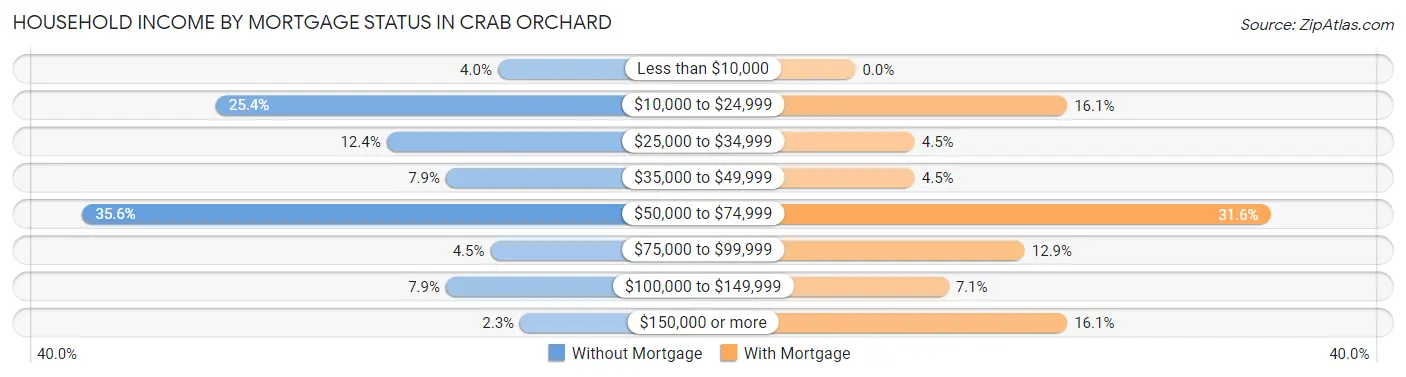
| Household Income | Without Mortgage | With Mortgage |
| Less than $10,000 | 7 (4.0%) | 0 (0.0%) |
| $10,000 to $24,999 | 45 (25.4%) | 25 (16.1%) |
| $25,000 to $34,999 | 22 (12.4%) | 7 (4.5%) |
| $35,000 to $49,999 | 14 (7.9%) | 7 (4.5%) |
| $50,000 to $74,999 | 63 (35.6%) | 49 (31.6%) |
| $75,000 to $99,999 | 8 (4.5%) | 20 (12.9%) |
| $100,000 to $149,999 | 14 (7.9%) | 11 (7.1%) |
| $150,000 or more | 4 (2.3%) | 25 (16.1%) |
| Total | 177 (100.0%) | 155 (100.0%) |
Property Value to Household Income Ratio in Crab Orchard
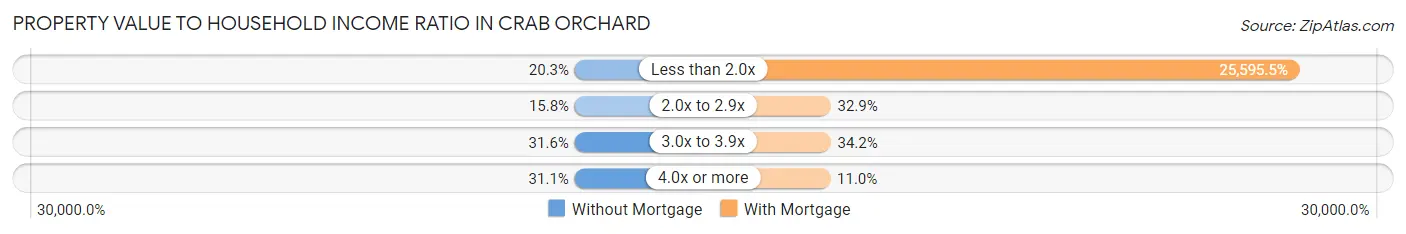
| Value-to-Income Ratio | Without Mortgage | With Mortgage |
| Less than 2.0x | 36 (20.3%) | 39,673 (25,595.5%) |
| 2.0x to 2.9x | 28 (15.8%) | 51 (32.9%) |
| 3.0x to 3.9x | 56 (31.6%) | 53 (34.2%) |
| 4.0x or more | 55 (31.1%) | 17 (11.0%) |
| Total | 177 (100.0%) | 155 (100.0%) |
Real Estate Taxes by Mortgage Status in Crab Orchard
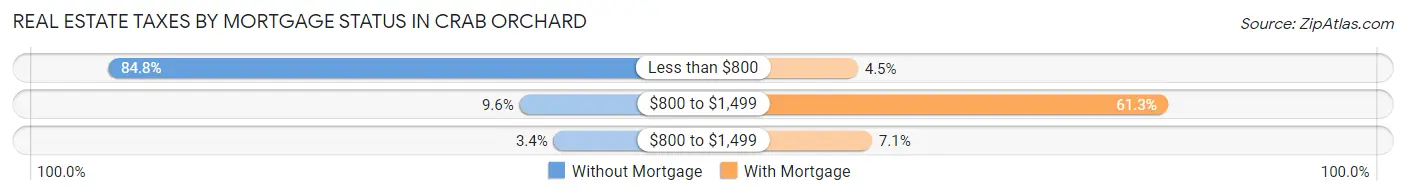
| Property Taxes | Without Mortgage | With Mortgage |
| Less than $800 | 150 (84.8%) | 7 (4.5%) |
| $800 to $1,499 | 17 (9.6%) | 95 (61.3%) |
| $800 to $1,499 | 6 (3.4%) | 11 (7.1%) |
| Total | 177 (100.0%) | 155 (100.0%) |
Health & Disability in Crab Orchard
Health Insurance Coverage by Age in Crab Orchard
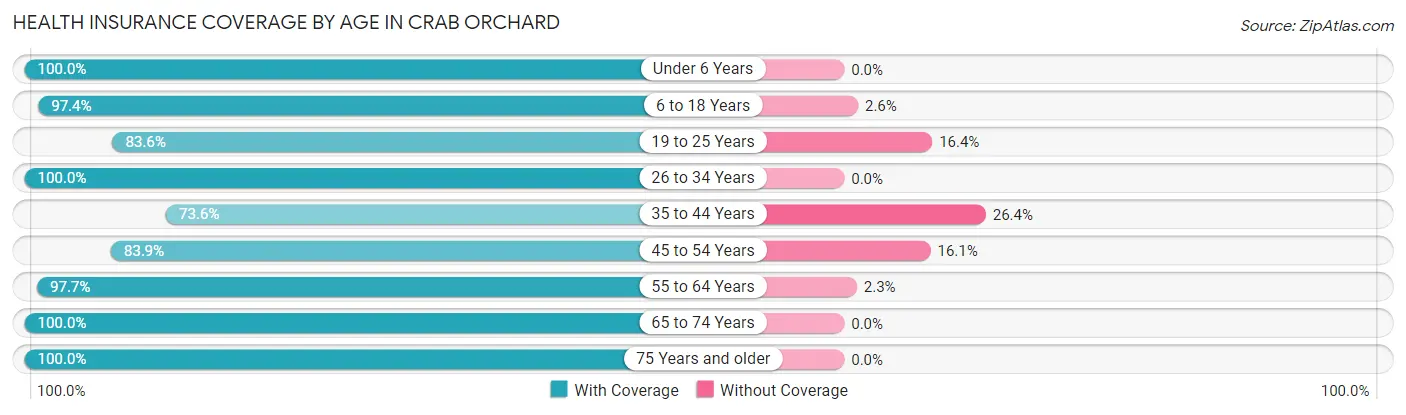
| Age Bracket | With Coverage | Without Coverage |
| Under 6 Years | 78 (100.0%) | 0 (0.0%) |
| 6 to 18 Years | 114 (97.4%) | 3 (2.6%) |
| 19 to 25 Years | 51 (83.6%) | 10 (16.4%) |
| 26 to 34 Years | 124 (100.0%) | 0 (0.0%) |
| 35 to 44 Years | 53 (73.6%) | 19 (26.4%) |
| 45 to 54 Years | 73 (83.9%) | 14 (16.1%) |
| 55 to 64 Years | 167 (97.7%) | 4 (2.3%) |
| 65 to 74 Years | 97 (100.0%) | 0 (0.0%) |
| 75 Years and older | 61 (100.0%) | 0 (0.0%) |
| Total | 818 (94.2%) | 50 (5.8%) |
Health Insurance Coverage by Citizenship Status in Crab Orchard
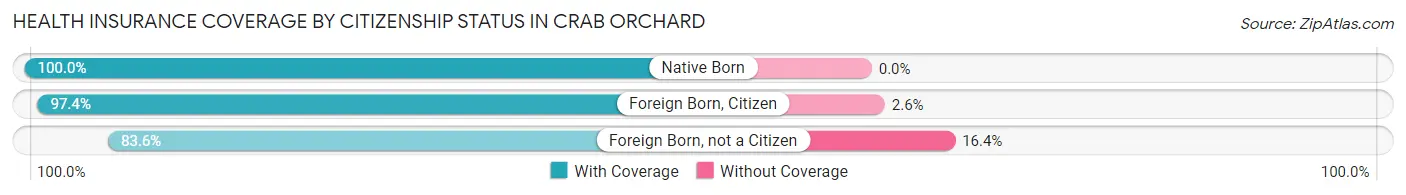
| Citizenship Status | With Coverage | Without Coverage |
| Native Born | 78 (100.0%) | 0 (0.0%) |
| Foreign Born, Citizen | 114 (97.4%) | 3 (2.6%) |
| Foreign Born, not a Citizen | 51 (83.6%) | 10 (16.4%) |
Health Insurance Coverage by Household Income in Crab Orchard
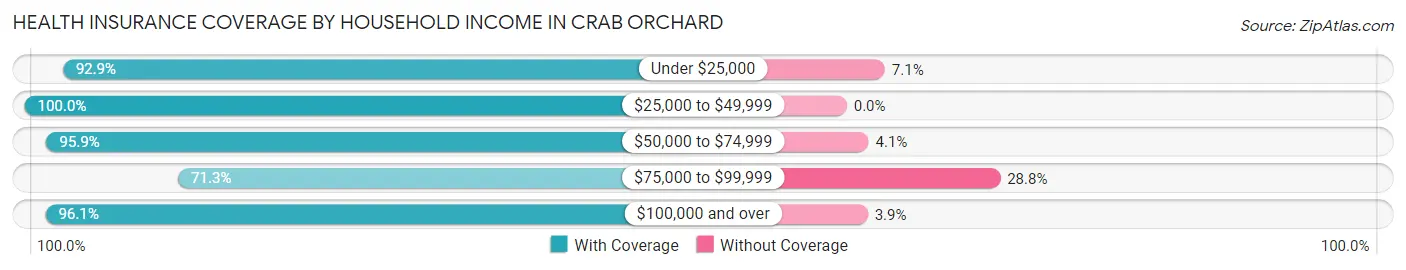
| Household Income | With Coverage | Without Coverage |
| Under $25,000 | 156 (92.9%) | 12 (7.1%) |
| $25,000 to $49,999 | 247 (100.0%) | 0 (0.0%) |
| $50,000 to $74,999 | 211 (95.9%) | 9 (4.1%) |
| $75,000 to $99,999 | 57 (71.3%) | 23 (28.7%) |
| $100,000 and over | 147 (96.1%) | 6 (3.9%) |
Public vs Private Health Insurance Coverage by Age in Crab Orchard
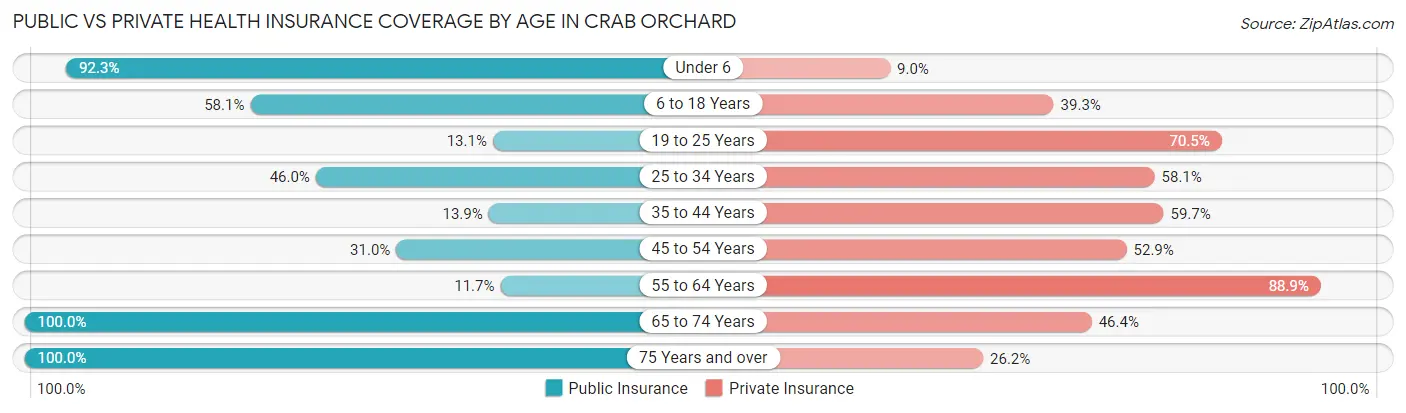
| Age Bracket | Public Insurance | Private Insurance |
| Under 6 | 72 (92.3%) | 7 (9.0%) |
| 6 to 18 Years | 68 (58.1%) | 46 (39.3%) |
| 19 to 25 Years | 8 (13.1%) | 43 (70.5%) |
| 25 to 34 Years | 57 (46.0%) | 72 (58.1%) |
| 35 to 44 Years | 10 (13.9%) | 43 (59.7%) |
| 45 to 54 Years | 27 (31.0%) | 46 (52.9%) |
| 55 to 64 Years | 20 (11.7%) | 152 (88.9%) |
| 65 to 74 Years | 97 (100.0%) | 45 (46.4%) |
| 75 Years and over | 61 (100.0%) | 16 (26.2%) |
| Total | 420 (48.4%) | 470 (54.1%) |
Disability Status by Sex by Age in Crab Orchard
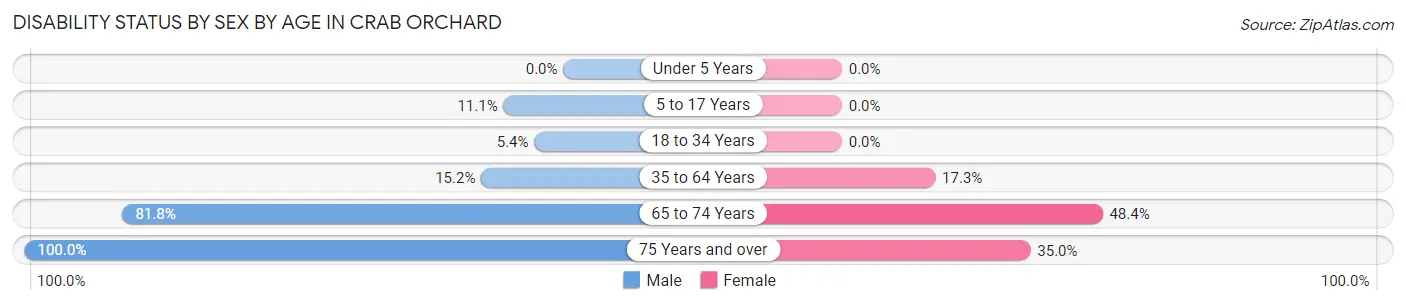
| Age Bracket | Male | Female |
| Under 5 Years | 0 (0.0%) | 0 (0.0%) |
| 5 to 17 Years | 13 (11.1%) | 0 (0.0%) |
| 18 to 34 Years | 5 (5.4%) | 0 (0.0%) |
| 35 to 64 Years | 16 (15.2%) | 39 (17.3%) |
| 65 to 74 Years | 54 (81.8%) | 15 (48.4%) |
| 75 Years and over | 21 (100.0%) | 14 (35.0%) |
Disability Class by Sex by Age in Crab Orchard
Disability Class: Hearing Difficulty
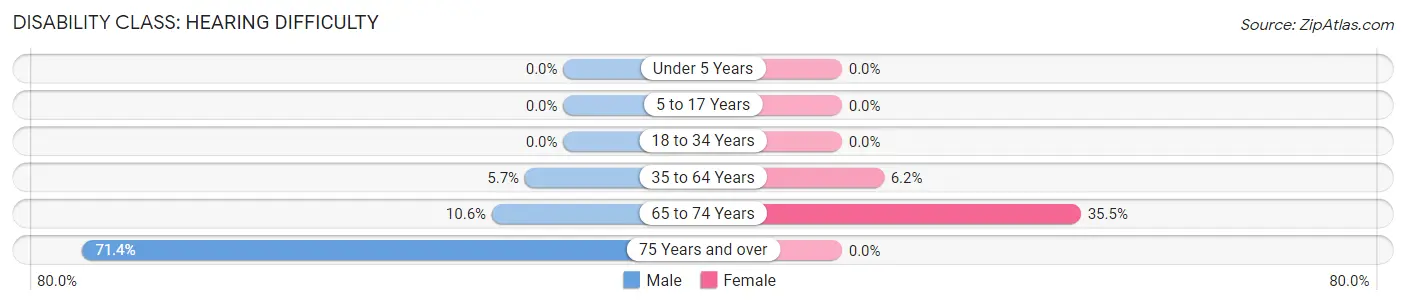
| Age Bracket | Male | Female |
| Under 5 Years | 0 (0.0%) | 0 (0.0%) |
| 5 to 17 Years | 0 (0.0%) | 0 (0.0%) |
| 18 to 34 Years | 0 (0.0%) | 0 (0.0%) |
| 35 to 64 Years | 6 (5.7%) | 14 (6.2%) |
| 65 to 74 Years | 7 (10.6%) | 11 (35.5%) |
| 75 Years and over | 15 (71.4%) | 0 (0.0%) |
Disability Class: Vision Difficulty
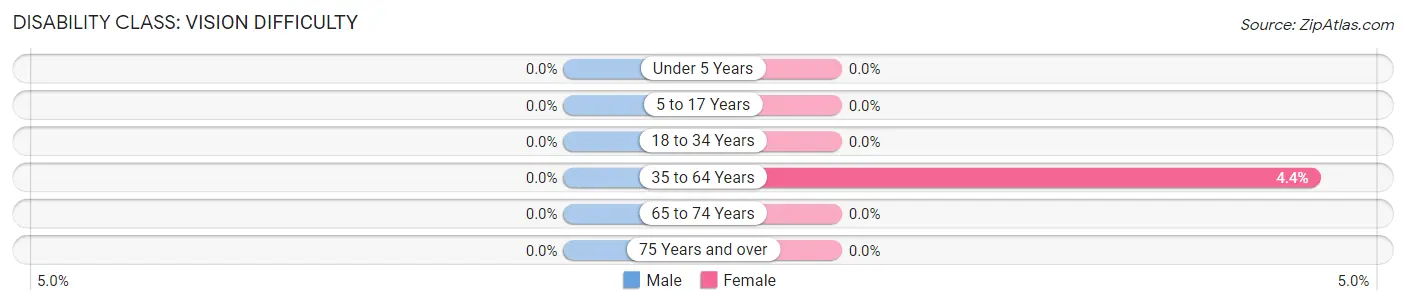
| Age Bracket | Male | Female |
| Under 5 Years | 0 (0.0%) | 0 (0.0%) |
| 5 to 17 Years | 0 (0.0%) | 0 (0.0%) |
| 18 to 34 Years | 0 (0.0%) | 0 (0.0%) |
| 35 to 64 Years | 0 (0.0%) | 10 (4.4%) |
| 65 to 74 Years | 0 (0.0%) | 0 (0.0%) |
| 75 Years and over | 0 (0.0%) | 0 (0.0%) |
Disability Class: Cognitive Difficulty
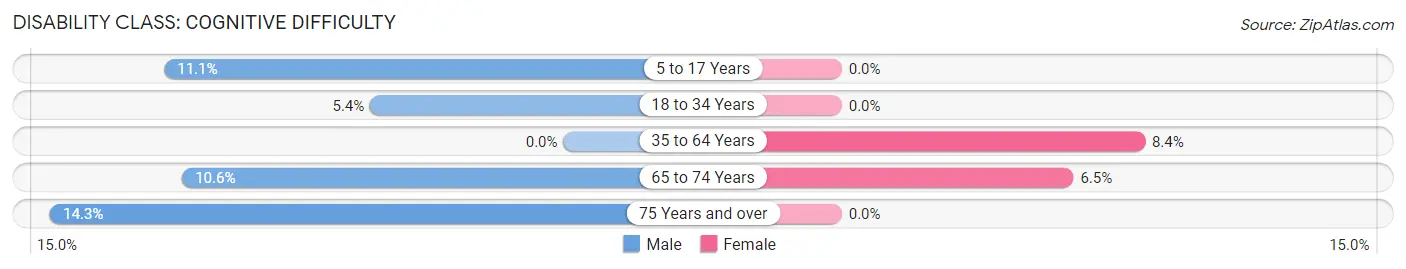
| Age Bracket | Male | Female |
| 5 to 17 Years | 13 (11.1%) | 0 (0.0%) |
| 18 to 34 Years | 5 (5.4%) | 0 (0.0%) |
| 35 to 64 Years | 0 (0.0%) | 19 (8.4%) |
| 65 to 74 Years | 7 (10.6%) | 2 (6.5%) |
| 75 Years and over | 3 (14.3%) | 0 (0.0%) |
Disability Class: Ambulatory Difficulty
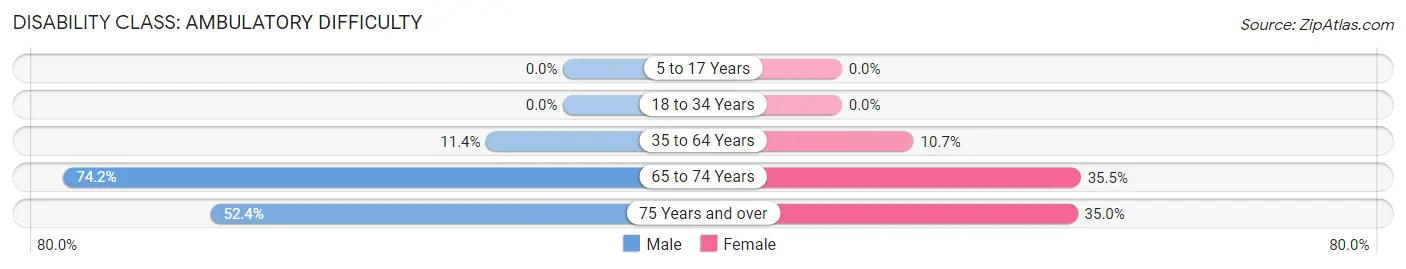
| Age Bracket | Male | Female |
| 5 to 17 Years | 0 (0.0%) | 0 (0.0%) |
| 18 to 34 Years | 0 (0.0%) | 0 (0.0%) |
| 35 to 64 Years | 12 (11.4%) | 24 (10.7%) |
| 65 to 74 Years | 49 (74.2%) | 11 (35.5%) |
| 75 Years and over | 11 (52.4%) | 14 (35.0%) |
Disability Class: Self-Care Difficulty
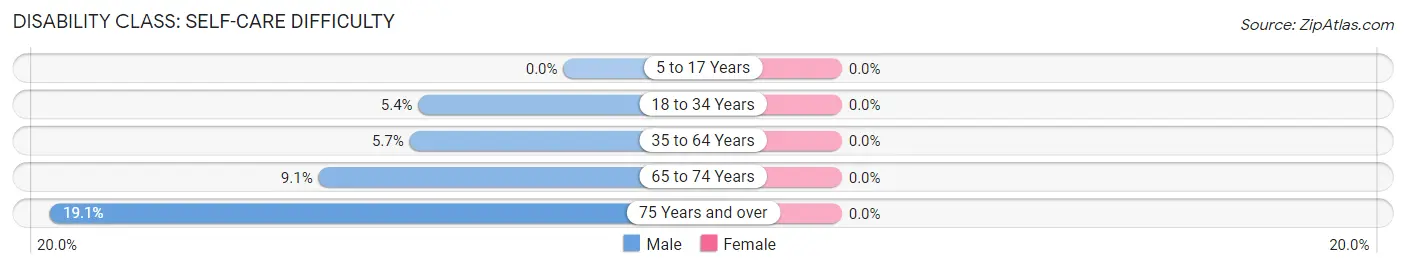
| Age Bracket | Male | Female |
| 5 to 17 Years | 0 (0.0%) | 0 (0.0%) |
| 18 to 34 Years | 5 (5.4%) | 0 (0.0%) |
| 35 to 64 Years | 6 (5.7%) | 0 (0.0%) |
| 65 to 74 Years | 6 (9.1%) | 0 (0.0%) |
| 75 Years and over | 4 (19.1%) | 0 (0.0%) |
Technology Access in Crab Orchard
Computing Device Access in Crab Orchard
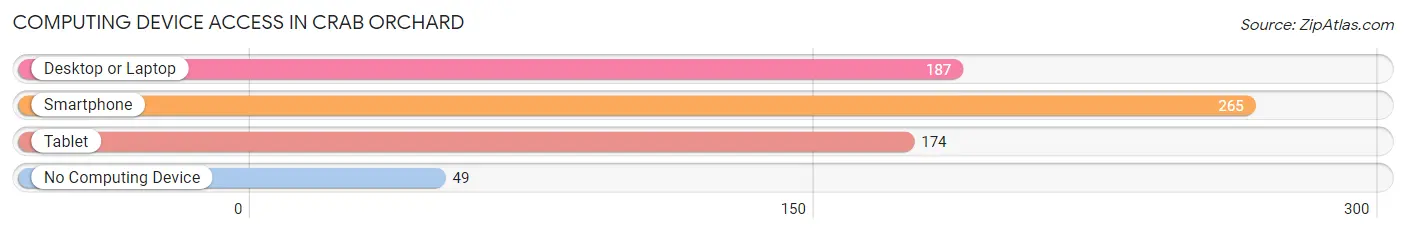
| Device Type | # Households | % Households |
| Desktop or Laptop | 187 | 47.8% |
| Smartphone | 265 | 67.8% |
| Tablet | 174 | 44.5% |
| No Computing Device | 49 | 12.5% |
| Total | 391 | 100.0% |
Internet Access in Crab Orchard
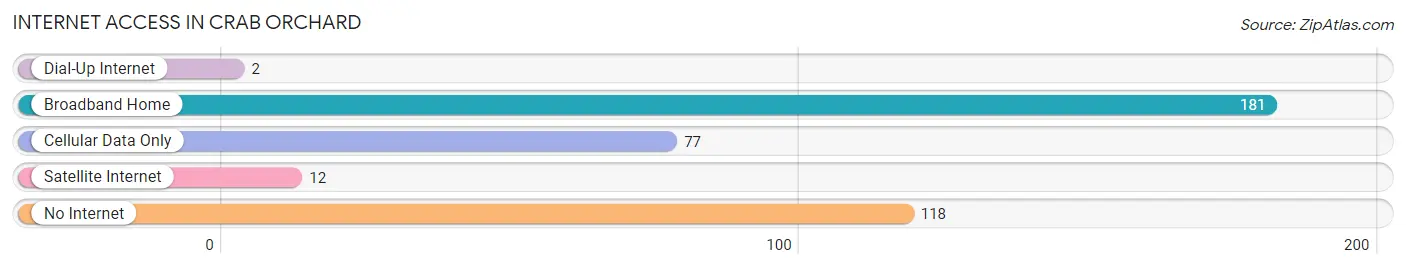
| Internet Type | # Households | % Households |
| Dial-Up Internet | 2 | 0.5% |
| Broadband Home | 181 | 46.3% |
| Cellular Data Only | 77 | 19.7% |
| Satellite Internet | 12 | 3.1% |
| No Internet | 118 | 30.2% |
| Total | 391 | 100.0% |
Crab Orchard Summary
Crab Orchard is a small town located in Cumberland County, Tennessee. It is situated in the foothills of the Cumberland Mountains, approximately 30 miles northwest of Knoxville. The town was founded in 1820 and has a population of approximately 1,000 people.
History
Crab Orchard was founded in 1820 by a group of settlers from North Carolina. The town was named after the nearby Crab Orchard Creek, which was named for the abundance of crabapple trees that grew along its banks. The town was originally a farming community, and the main crops were corn, wheat, and tobacco. In the late 19th century, the town began to grow as a result of the coal mining industry. The coal mines provided jobs for many of the town’s residents, and the town’s population grew to over 1,000 people by the early 20th century.
In the early 20th century, the town began to decline as the coal industry declined. The town’s population decreased to around 500 people by the mid-20th century. In the late 20th century, the town began to experience a resurgence as a result of the tourism industry. The town is now home to several tourist attractions, including the Crab Orchard Museum and the Crab Orchard National Wildlife Refuge.
Geography
Crab Orchard is located in Cumberland County, Tennessee. The town is situated in the foothills of the Cumberland Mountains, approximately 30 miles northwest of Knoxville. The town is located at an elevation of 1,000 feet above sea level. The town is surrounded by rolling hills and forests, and the nearby Crab Orchard Creek provides a scenic backdrop.
Economy
The economy of Crab Orchard is largely based on tourism. The town is home to several tourist attractions, including the Crab Orchard Museum and the Crab Orchard National Wildlife Refuge. The town also has several restaurants, shops, and other businesses that cater to tourists. In addition, the town is home to several small businesses, including a lumber mill, a sawmill, and a furniture factory.
Demographics
As of the 2010 census, the population of Crab Orchard was 1,039. The racial makeup of the town was 97.2% White, 0.9% African American, 0.2% Native American, 0.2% Asian, 0.1% Pacific Islander, 0.4% from other races, and 0.9% from two or more races. The median household income was $30,938, and the median family income was $37,500. The per capita income was $17,845. Approximately 16.2% of the population was below the poverty line.
Common Questions
What is Per Capita Income in Crab Orchard?
Per Capita income in Crab Orchard is $23,864.
What is the Median Family Income in Crab Orchard?
Median Family Income in Crab Orchard is $55,825.
What is the Median Household income in Crab Orchard?
Median Household Income in Crab Orchard is $40,987.
What is Income or Wage Gap in Crab Orchard?
Income or Wage Gap in Crab Orchard is 30.1%.
Women in Crab Orchard earn 69.9 cents for every dollar earned by a man.
What is Inequality or Gini Index in Crab Orchard?
Inequality or Gini Index in Crab Orchard is 0.40.
What is the Total Population of Crab Orchard?
Total Population of Crab Orchard is 868.
What is the Total Male Population of Crab Orchard?
Total Male Population of Crab Orchard is 418.
What is the Total Female Population of Crab Orchard?
Total Female Population of Crab Orchard is 450.
What is the Ratio of Males per 100 Females in Crab Orchard?
There are 92.89 Males per 100 Females in Crab Orchard.
What is the Ratio of Females per 100 Males in Crab Orchard?
There are 107.66 Females per 100 Males in Crab Orchard.
What is the Median Population Age in Crab Orchard?
Median Population Age in Crab Orchard is 42.8 Years.
What is the Average Family Size in Crab Orchard
Average Family Size in Crab Orchard is 2.6 People.
What is the Average Household Size in Crab Orchard
Average Household Size in Crab Orchard is 2.2 People.
How Large is the Labor Force in Crab Orchard?
There are 365 People in the Labor Forcein in Crab Orchard.
What is the Percentage of People in the Labor Force in Crab Orchard?
52.9% of People are in the Labor Force in Crab Orchard.
What is the Unemployment Rate in Crab Orchard?
Unemployment Rate in Crab Orchard is 0.8%.