Mitchellville, TN Map & Demographics
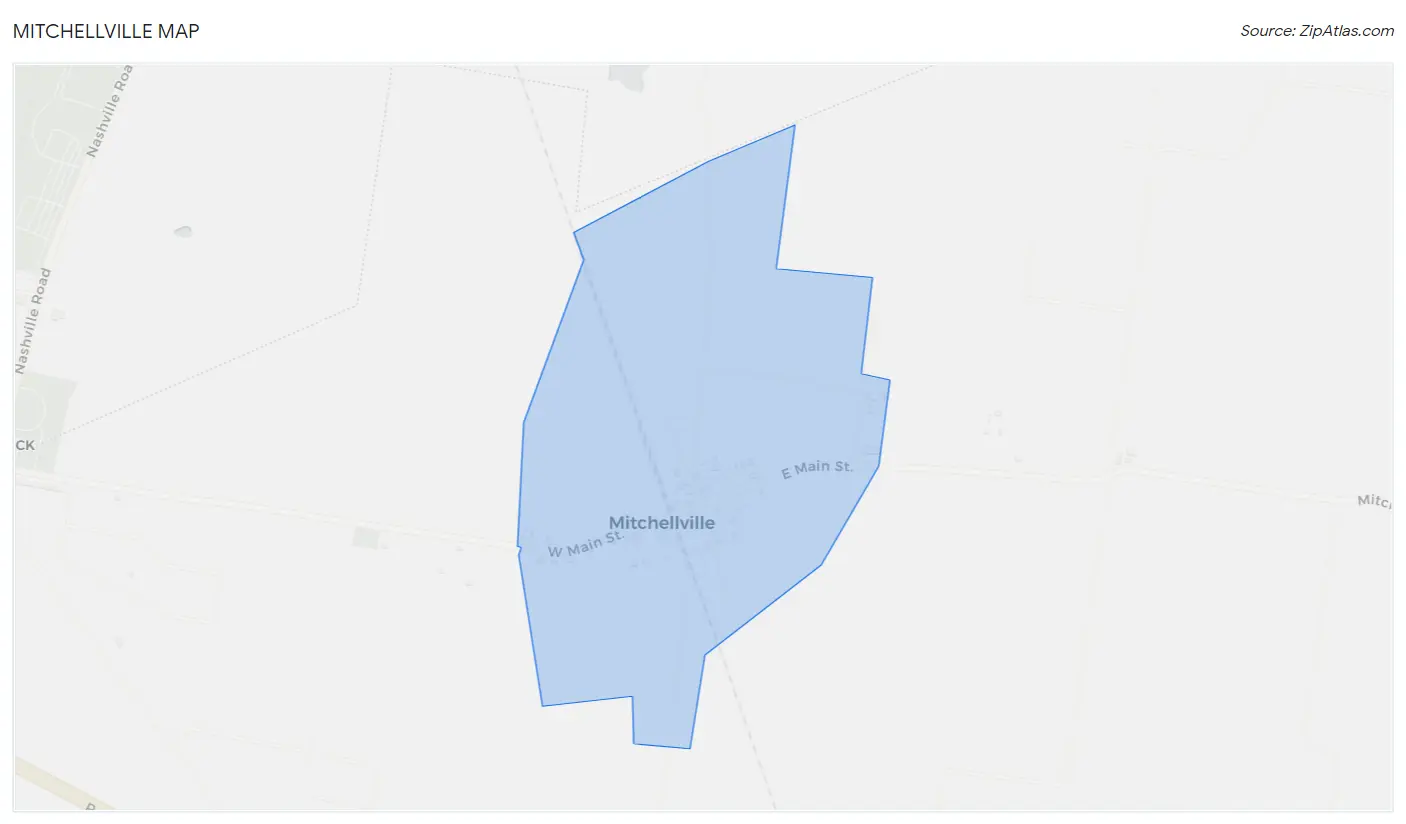
Mitchellville Map
Mitchellville Overview
$19,989
PER CAPITA INCOME
$35,625
AVG FAMILY INCOME
$37,500
AVG HOUSEHOLD INCOME
0.40
INEQUALITY / GINI INDEX
148
TOTAL POPULATION
70
MALE POPULATION
78
FEMALE POPULATION
89.74
MALES / 100 FEMALES
111.43
FEMALES / 100 MALES
38.7
MEDIAN AGE
3.4
AVG FAMILY SIZE
3.0
AVG HOUSEHOLD SIZE
54
LABOR FORCE [ PEOPLE ]
44.3%
PERCENT IN LABOR FORCE
3.7%
UNEMPLOYMENT RATE
Mitchellville Area Codes
Income in Mitchellville
Income Overview in Mitchellville
Per Capita Income in Mitchellville is $19,989, while median incomes of families and households are $35,625 and $37,500 respectively.
| Characteristic | Number | Measure |
| Per Capita Income | 148 | $19,989 |
| Median Family Income | 37 | $35,625 |
| Mean Family Income | 37 | $64,189 |
| Median Household Income | 50 | $37,500 |
| Mean Household Income | 50 | $59,058 |
| Income Deficit | 37 | $0 |
| Wage / Income Gap (%) | 148 | 0.00% |
| Wage / Income Gap ($) | 148 | 100.00¢ per $1 |
| Gini / Inequality Index | 148 | 0.40 |
Earnings by Sex in Mitchellville
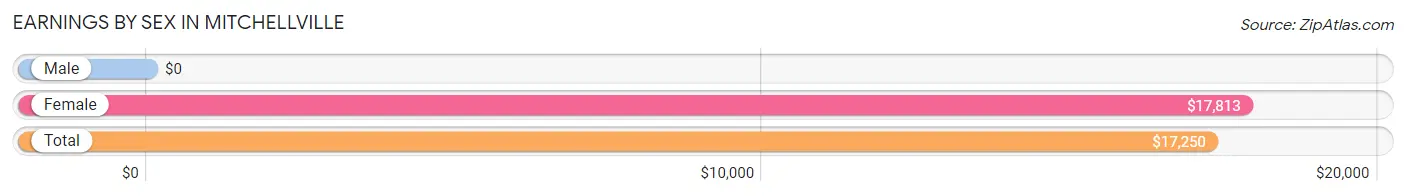
| Sex | Number | Average Earnings |
| Male | 28 (49.1%) | $0 |
| Female | 29 (50.9%) | $17,813 |
| Total | 57 (100.0%) | $17,250 |
Earnings by Sex by Income Bracket in Mitchellville
The most common earnings brackets in Mitchellville are $10,000 to $12,499 for men (5 | 17.9%) and $2,499 or less for women (4 | 13.8%).
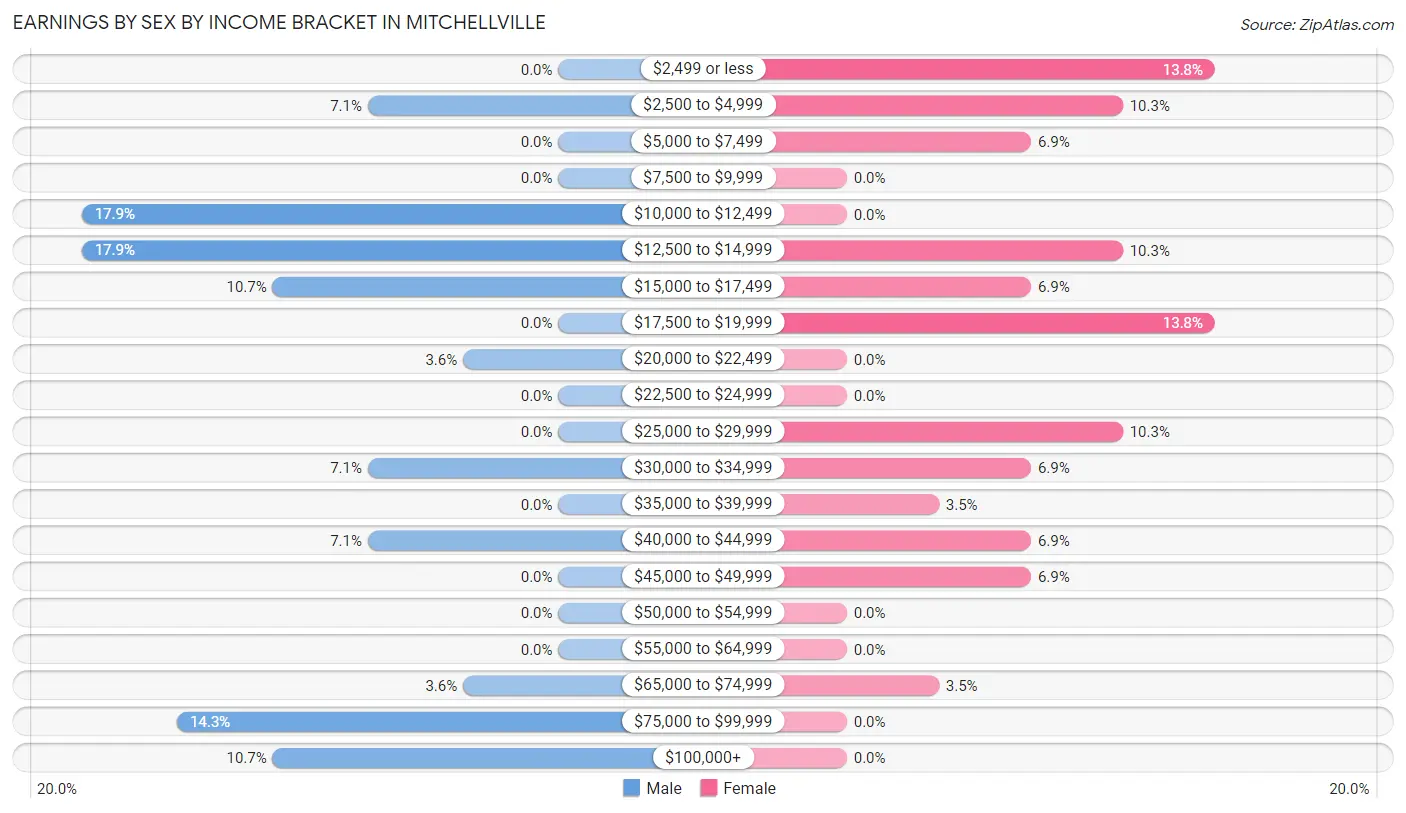
| Income | Male | Female |
| $2,499 or less | 0 (0.0%) | 4 (13.8%) |
| $2,500 to $4,999 | 2 (7.1%) | 3 (10.3%) |
| $5,000 to $7,499 | 0 (0.0%) | 2 (6.9%) |
| $7,500 to $9,999 | 0 (0.0%) | 0 (0.0%) |
| $10,000 to $12,499 | 5 (17.9%) | 0 (0.0%) |
| $12,500 to $14,999 | 5 (17.9%) | 3 (10.3%) |
| $15,000 to $17,499 | 3 (10.7%) | 2 (6.9%) |
| $17,500 to $19,999 | 0 (0.0%) | 4 (13.8%) |
| $20,000 to $22,499 | 1 (3.6%) | 0 (0.0%) |
| $22,500 to $24,999 | 0 (0.0%) | 0 (0.0%) |
| $25,000 to $29,999 | 0 (0.0%) | 3 (10.3%) |
| $30,000 to $34,999 | 2 (7.1%) | 2 (6.9%) |
| $35,000 to $39,999 | 0 (0.0%) | 1 (3.5%) |
| $40,000 to $44,999 | 2 (7.1%) | 2 (6.9%) |
| $45,000 to $49,999 | 0 (0.0%) | 2 (6.9%) |
| $50,000 to $54,999 | 0 (0.0%) | 0 (0.0%) |
| $55,000 to $64,999 | 0 (0.0%) | 0 (0.0%) |
| $65,000 to $74,999 | 1 (3.6%) | 1 (3.5%) |
| $75,000 to $99,999 | 4 (14.3%) | 0 (0.0%) |
| $100,000+ | 3 (10.7%) | 0 (0.0%) |
| Total | 28 (100.0%) | 29 (100.0%) |
Earnings by Sex by Educational Attainment in Mitchellville
| Educational Attainment | Male Income | Female Income |
| Less than High School | - | - |
| High School Diploma | - | - |
| College or Associate's Degree | - | - |
| Bachelor's Degree | - | - |
| Graduate Degree | - | - |
| Total | - | - |
Family Income in Mitchellville
Family Income Brackets in Mitchellville
According to the Mitchellville family income data, there are 10 families falling into the $15,000 to $24,999 income range, which is the most common income bracket and makes up 27.0% of all families.
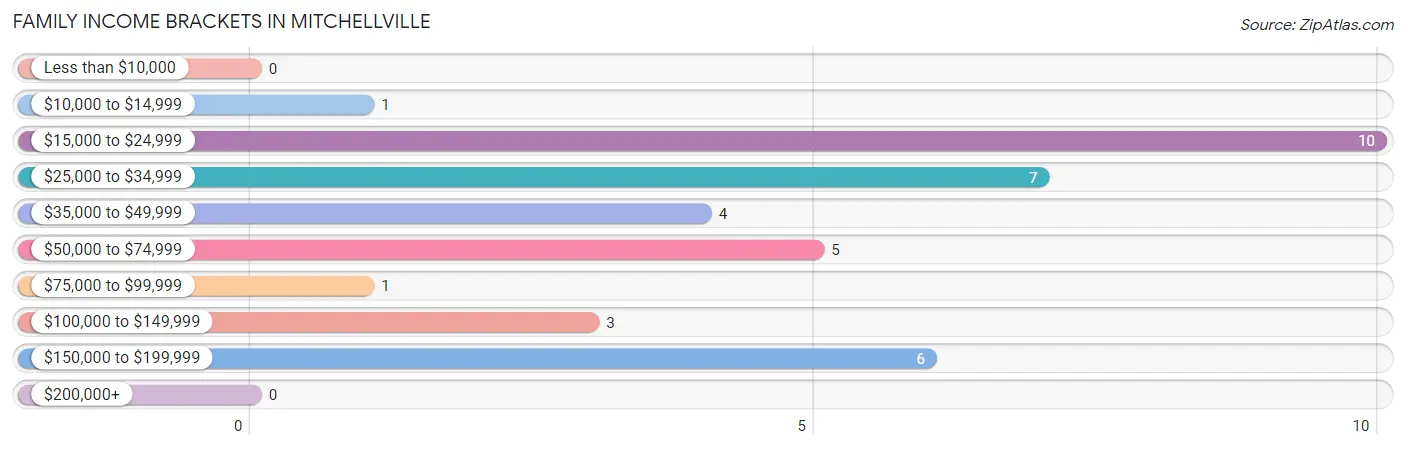
| Income Bracket | # Families | % Families |
| Less than $10,000 | 0 | 0.0% |
| $10,000 to $14,999 | 1 | 2.7% |
| $15,000 to $24,999 | 10 | 27.0% |
| $25,000 to $34,999 | 7 | 18.9% |
| $35,000 to $49,999 | 4 | 10.8% |
| $50,000 to $74,999 | 5 | 13.5% |
| $75,000 to $99,999 | 1 | 2.7% |
| $100,000 to $149,999 | 3 | 8.1% |
| $150,000 to $199,999 | 6 | 16.2% |
| $200,000+ | 0 | 0.0% |
Family Income by Famaliy Size in Mitchellville
2-person families (20 | 54.0%) account for the highest median family income in Mitchellville with $42,500 per family, while 2-person families (20 | 54.0%) have the highest median income of $21,250 per family member.
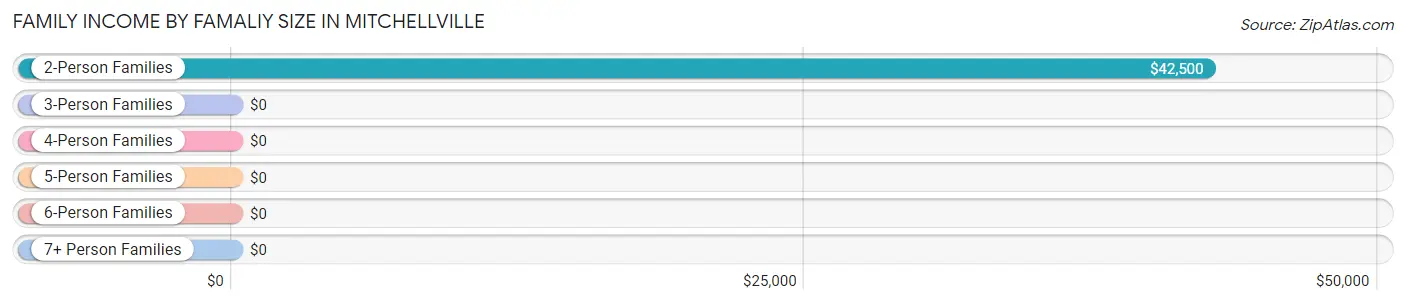
| Income Bracket | # Families | Median Income |
| 2-Person Families | 20 (54.0%) | $42,500 |
| 3-Person Families | 4 (10.8%) | $0 |
| 4-Person Families | 6 (16.2%) | $0 |
| 5-Person Families | 6 (16.2%) | $0 |
| 6-Person Families | 1 (2.7%) | $0 |
| 7+ Person Families | 0 (0.0%) | $0 |
| Total | 37 (100.0%) | $35,625 |
Family Income by Number of Earners in Mitchellville
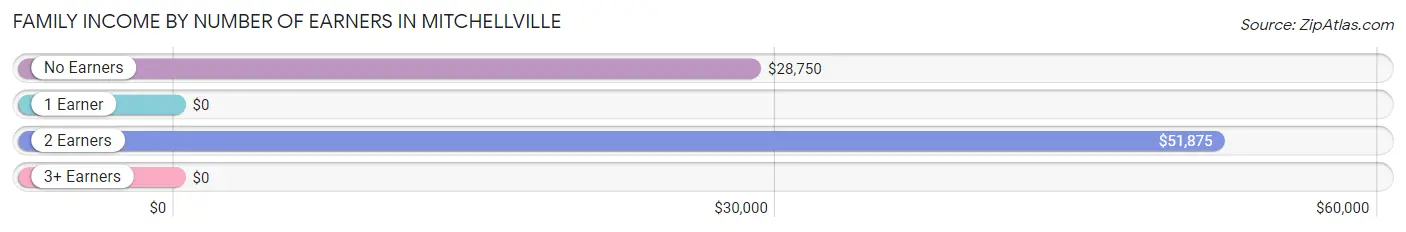
| Number of Earners | # Families | Median Income |
| No Earners | 6 (16.2%) | $28,750 |
| 1 Earner | 18 (48.6%) | $0 |
| 2 Earners | 11 (29.7%) | $51,875 |
| 3+ Earners | 2 (5.4%) | $0 |
| Total | 37 (100.0%) | $35,625 |
Household Income in Mitchellville
Household Income Brackets in Mitchellville
With 13 households falling in the category, the $25,000 to $34,999 income range is the most frequent in Mitchellville, accounting for 26.0% of all households.
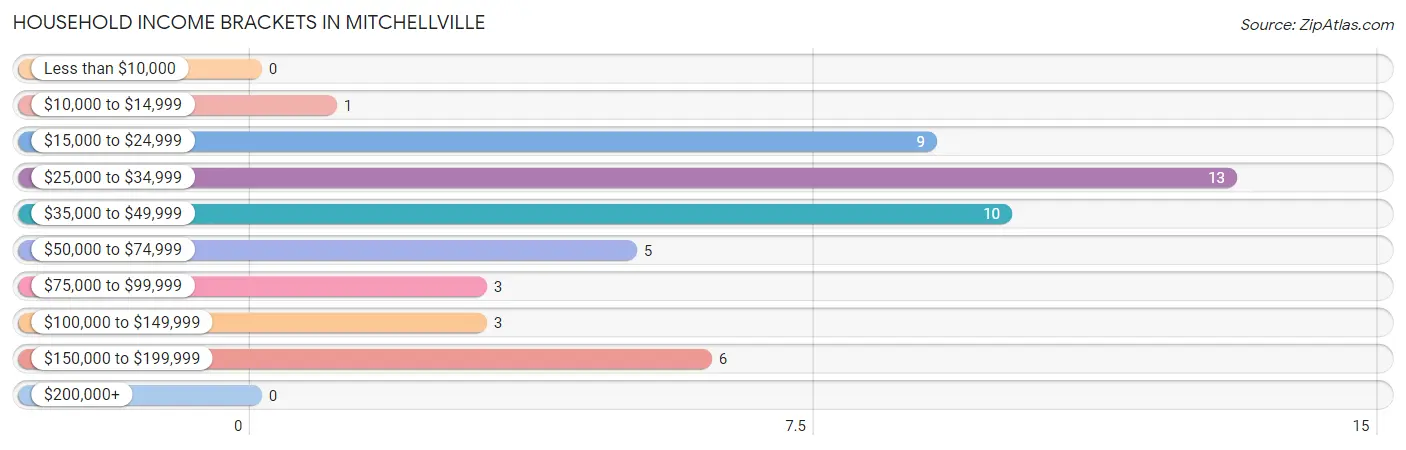
| Income Bracket | # Households | % Households |
| Less than $10,000 | 0 | 0.0% |
| $10,000 to $14,999 | 1 | 2.0% |
| $15,000 to $24,999 | 9 | 18.0% |
| $25,000 to $34,999 | 13 | 26.0% |
| $35,000 to $49,999 | 10 | 20.0% |
| $50,000 to $74,999 | 5 | 10.0% |
| $75,000 to $99,999 | 3 | 6.0% |
| $100,000 to $149,999 | 3 | 6.0% |
| $150,000 to $199,999 | 6 | 12.0% |
| $200,000+ | 0 | 0.0% |
Household Income by Householder Age in Mitchellville
The median household income in Mitchellville is $37,500, with the highest median household income of $43,750 found in the 45 to 64 years age bracket for the primary householder. A total of 12 households (24.0%) fall into this category. Meanwhile, the 15 to 24 years age bracket for the primary householder has the lowest median household income of $0, with 1 households (2.0%) in this group.
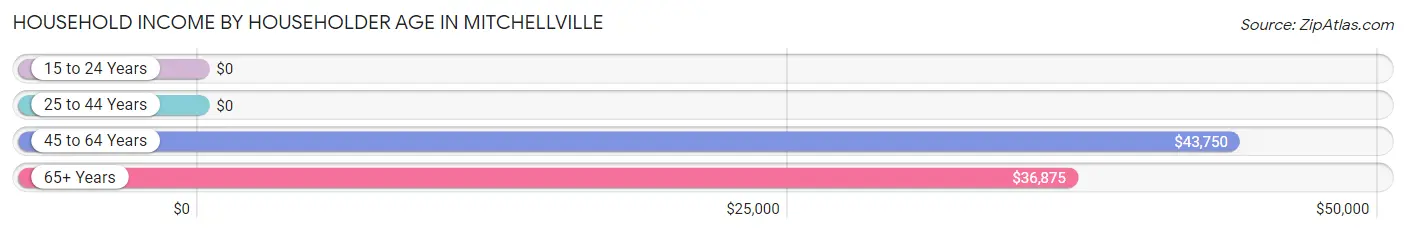
| Income Bracket | # Households | Median Income |
| 15 to 24 Years | 1 (2.0%) | $0 |
| 25 to 44 Years | 12 (24.0%) | $0 |
| 45 to 64 Years | 12 (24.0%) | $43,750 |
| 65+ Years | 25 (50.0%) | $36,875 |
| Total | 50 (100.0%) | $37,500 |
Poverty in Mitchellville
Income Below Poverty by Sex and Age in Mitchellville
With 38.6% poverty level for males and 35.9% for females among the residents of Mitchellville, 12 to 14 year old males and 12 to 14 year old females are the most vulnerable to poverty, with 8 males (100.0%) and 1 females (100.0%) in their respective age groups living below the poverty level.
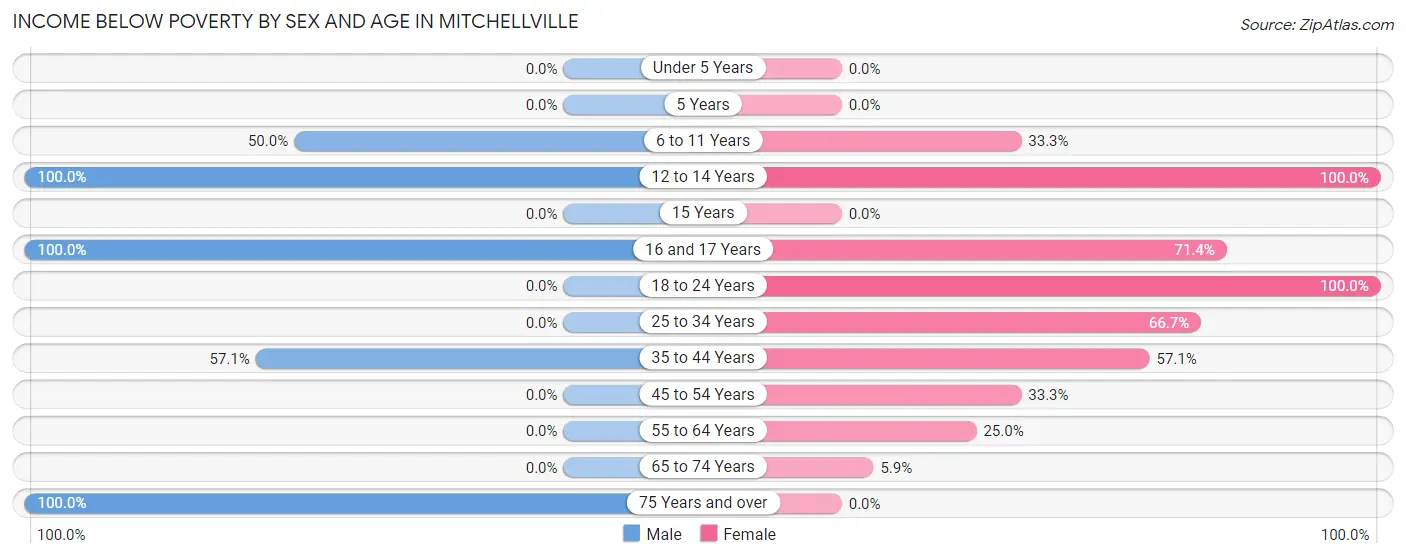
| Age Bracket | Male | Female |
| Under 5 Years | 0 (0.0%) | 0 (0.0%) |
| 5 Years | 0 (0.0%) | 0 (0.0%) |
| 6 to 11 Years | 4 (50.0%) | 1 (33.3%) |
| 12 to 14 Years | 8 (100.0%) | 1 (100.0%) |
| 15 Years | 0 (0.0%) | 0 (0.0%) |
| 16 and 17 Years | 6 (100.0%) | 5 (71.4%) |
| 18 to 24 Years | 0 (0.0%) | 5 (100.0%) |
| 25 to 34 Years | 0 (0.0%) | 8 (66.7%) |
| 35 to 44 Years | 8 (57.1%) | 4 (57.1%) |
| 45 to 54 Years | 0 (0.0%) | 1 (33.3%) |
| 55 to 64 Years | 0 (0.0%) | 2 (25.0%) |
| 65 to 74 Years | 0 (0.0%) | 1 (5.9%) |
| 75 Years and over | 1 (100.0%) | 0 (0.0%) |
| Total | 27 (38.6%) | 28 (35.9%) |
Income Above Poverty by Sex and Age in Mitchellville
According to the poverty statistics in Mitchellville, males aged under 5 years and females aged 5 years are the age groups that are most secure financially, with 100.0% of males and 100.0% of females in these age groups living above the poverty line.
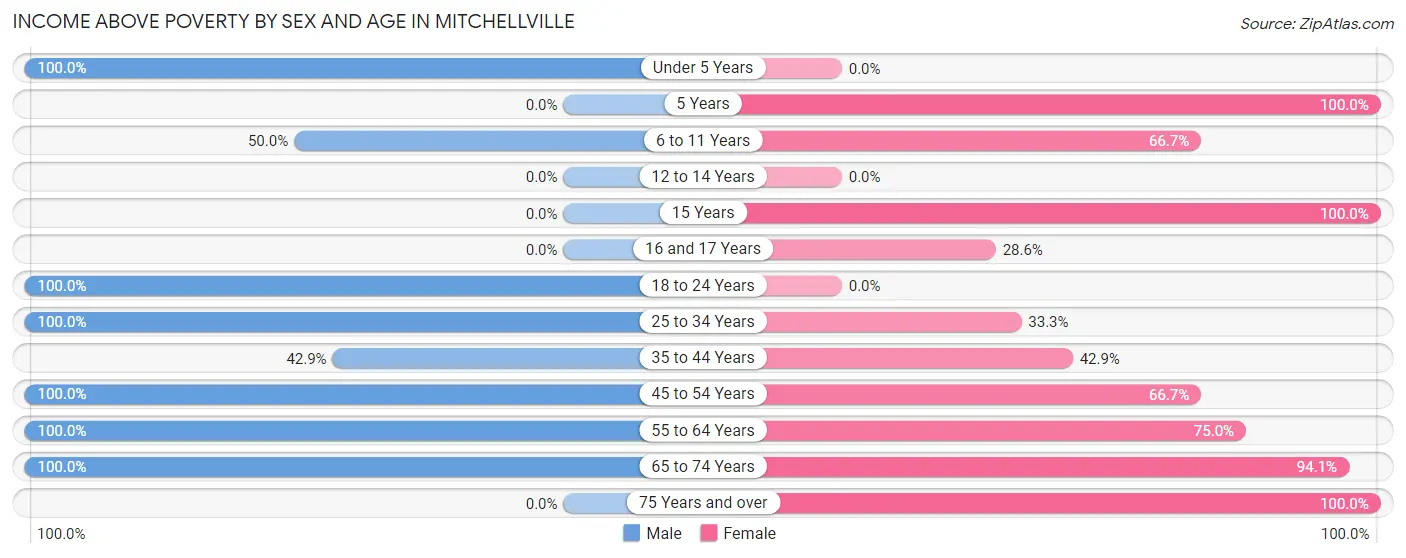
| Age Bracket | Male | Female |
| Under 5 Years | 1 (100.0%) | 0 (0.0%) |
| 5 Years | 0 (0.0%) | 2 (100.0%) |
| 6 to 11 Years | 4 (50.0%) | 2 (66.7%) |
| 12 to 14 Years | 0 (0.0%) | 0 (0.0%) |
| 15 Years | 0 (0.0%) | 3 (100.0%) |
| 16 and 17 Years | 0 (0.0%) | 2 (28.6%) |
| 18 to 24 Years | 1 (100.0%) | 0 (0.0%) |
| 25 to 34 Years | 4 (100.0%) | 4 (33.3%) |
| 35 to 44 Years | 6 (42.9%) | 3 (42.9%) |
| 45 to 54 Years | 4 (100.0%) | 2 (66.7%) |
| 55 to 64 Years | 11 (100.0%) | 6 (75.0%) |
| 65 to 74 Years | 12 (100.0%) | 16 (94.1%) |
| 75 Years and over | 0 (0.0%) | 10 (100.0%) |
| Total | 43 (61.4%) | 50 (64.1%) |
Income Below Poverty Among Married-Couple Families in Mitchellville
The poverty statistics for married-couple families in Mitchellville show that 16.7% or 4 of the total 24 families live below the poverty line. Families with 1 or 2 children have the highest poverty rate of 80.0%, comprising of 4 families. On the other hand, families with no children have the lowest poverty rate of 0.0%, which includes 0 families.
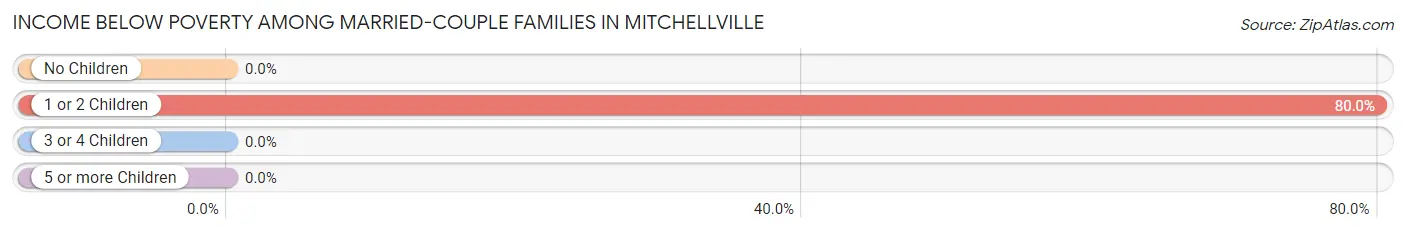
| Children | Above Poverty | Below Poverty |
| No Children | 17 (100.0%) | 0 (0.0%) |
| 1 or 2 Children | 1 (20.0%) | 4 (80.0%) |
| 3 or 4 Children | 2 (100.0%) | 0 (0.0%) |
| 5 or more Children | 0 (0.0%) | 0 (0.0%) |
| Total | 20 (83.3%) | 4 (16.7%) |
Income Below Poverty Among Single-Parent Households in Mitchellville
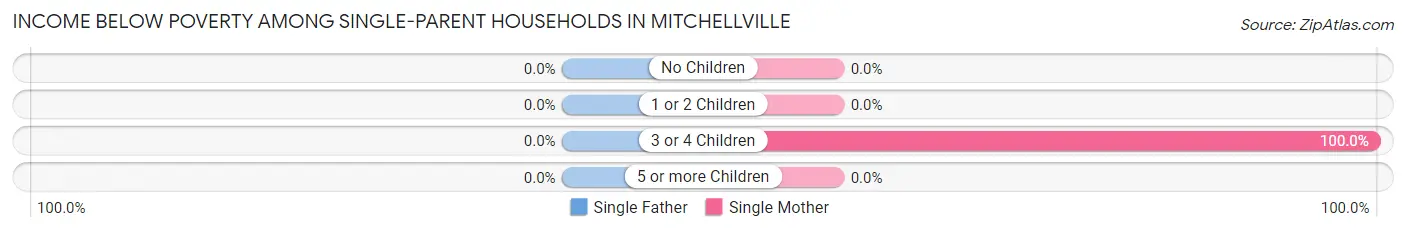
| Children | Single Father | Single Mother |
| No Children | 0 (0.0%) | 0 (0.0%) |
| 1 or 2 Children | 0 (0.0%) | 0 (0.0%) |
| 3 or 4 Children | 0 (0.0%) | 5 (100.0%) |
| 5 or more Children | 0 (0.0%) | 0 (0.0%) |
| Total | 0 (0.0%) | 5 (38.5%) |
Income Below Poverty Among Married-Couple vs Single-Parent Households in Mitchellville
The poverty data for Mitchellville shows that 4 of the married-couple family households (16.7%) and 5 of the single-parent households (38.5%) are living below the poverty level. Within the married-couple family households, those with 1 or 2 children have the highest poverty rate, with 4 households (80.0%) falling below the poverty line. Among the single-parent households, those with 3 or 4 children have the highest poverty rate, with 5 household (100.0%) living below poverty.
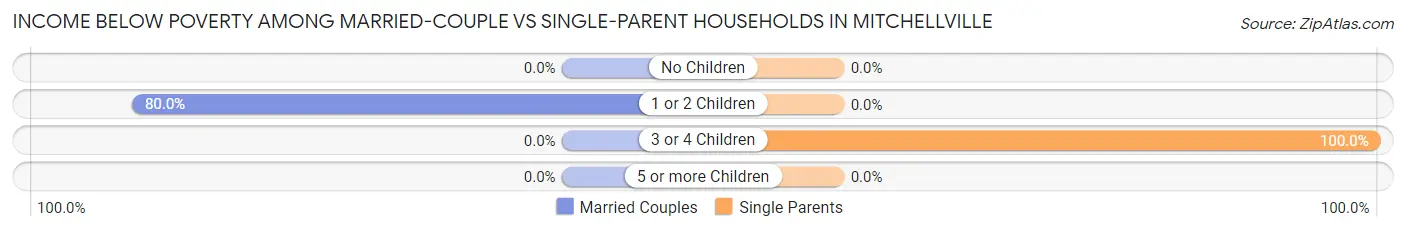
| Children | Married-Couple Families | Single-Parent Households |
| No Children | 0 (0.0%) | 0 (0.0%) |
| 1 or 2 Children | 4 (80.0%) | 0 (0.0%) |
| 3 or 4 Children | 0 (0.0%) | 5 (100.0%) |
| 5 or more Children | 0 (0.0%) | 0 (0.0%) |
| Total | 4 (16.7%) | 5 (38.5%) |
Race in Mitchellville
The most populous races in Mitchellville are White / Caucasian (135 | 91.2%), Hispanic or Latino (12 | 8.1%), and Some other Race (12 | 8.1%).
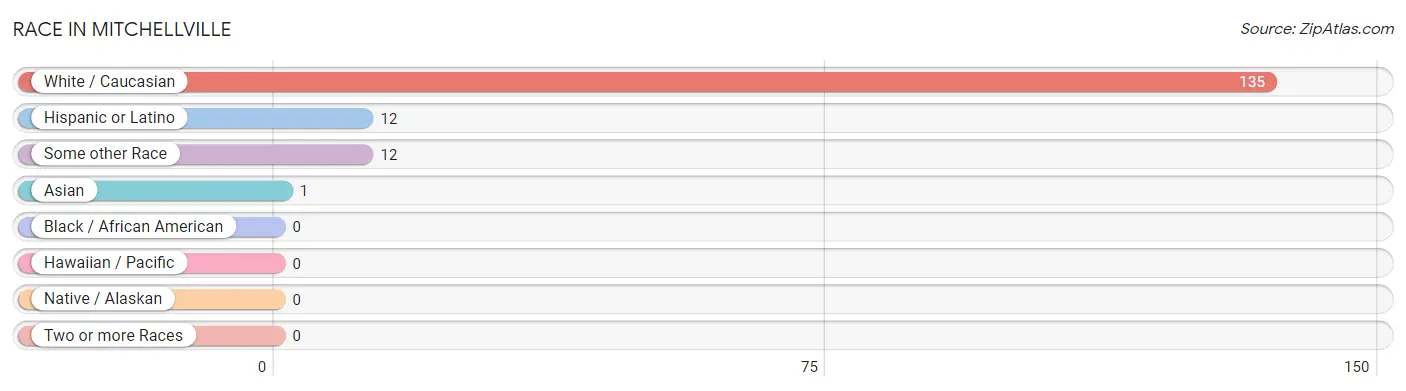
| Race | # Population | % Population |
| Asian | 1 | 0.7% |
| Black / African American | 0 | 0.0% |
| Hawaiian / Pacific | 0 | 0.0% |
| Hispanic or Latino | 12 | 8.1% |
| Native / Alaskan | 0 | 0.0% |
| White / Caucasian | 135 | 91.2% |
| Two or more Races | 0 | 0.0% |
| Some other Race | 12 | 8.1% |
| Total | 148 | 100.0% |
Ancestry in Mitchellville
The most populous ancestries reported in Mitchellville are American (37 | 25.0%), English (17 | 11.5%), Irish (9 | 6.1%), Mexican (7 | 4.7%), and Colombian (5 | 3.4%), together accounting for 50.7% of all Mitchellville residents.
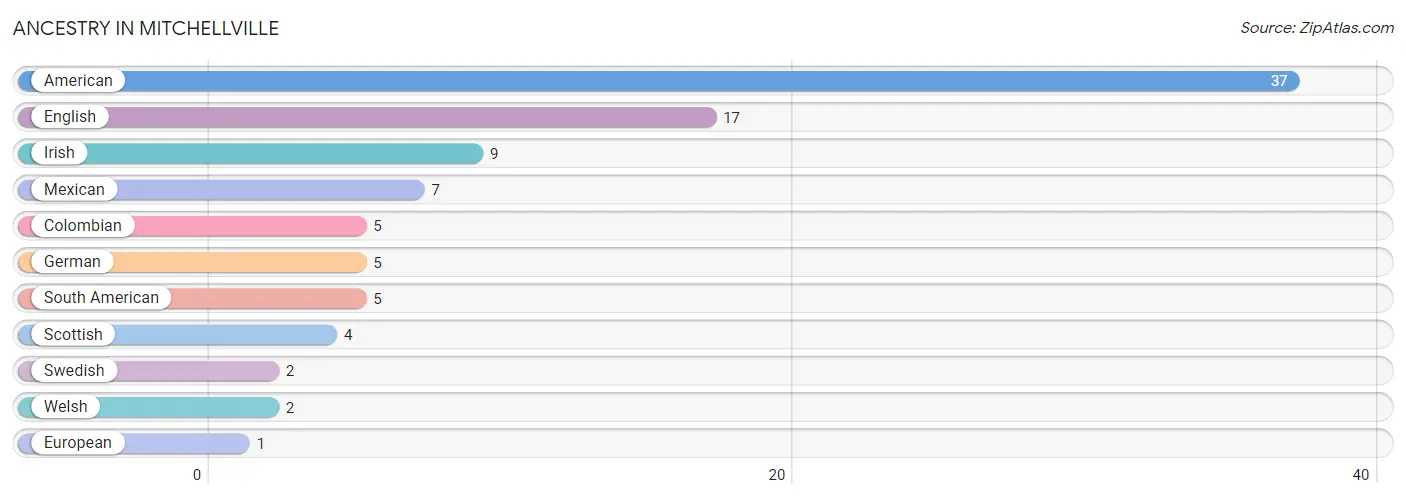
| Ancestry | # Population | % Population |
| American | 37 | 25.0% |
| Colombian | 5 | 3.4% |
| English | 17 | 11.5% |
| European | 1 | 0.7% |
| German | 5 | 3.4% |
| Irish | 9 | 6.1% |
| Mexican | 7 | 4.7% |
| Scottish | 4 | 2.7% |
| South American | 5 | 3.4% |
| Swedish | 2 | 1.3% |
| Welsh | 2 | 1.3% | View All 11 Rows |
Immigrants in Mitchellville
The most numerous immigrant groups reported in Mitchellville came from Latin America (7 | 4.7%), Colombia (5 | 3.4%), South America (5 | 3.4%), Central America (2 | 1.3%), and Mexico (2 | 1.3%), together accounting for 14.2% of all Mitchellville residents.
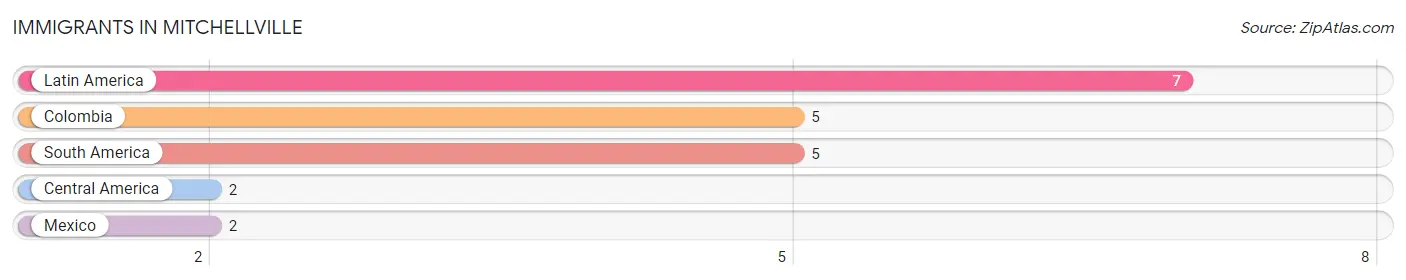
| Immigration Origin | # Population | % Population |
| Central America | 2 | 1.3% |
| Colombia | 5 | 3.4% |
| Latin America | 7 | 4.7% |
| Mexico | 2 | 1.3% |
| South America | 5 | 3.4% | View All 5 Rows |
Sex and Age in Mitchellville
Sex and Age in Mitchellville
The most populous age groups in Mitchellville are 10 to 14 Years (12 | 17.1%) for men and 15 to 19 Years (15 | 19.2%) for women.
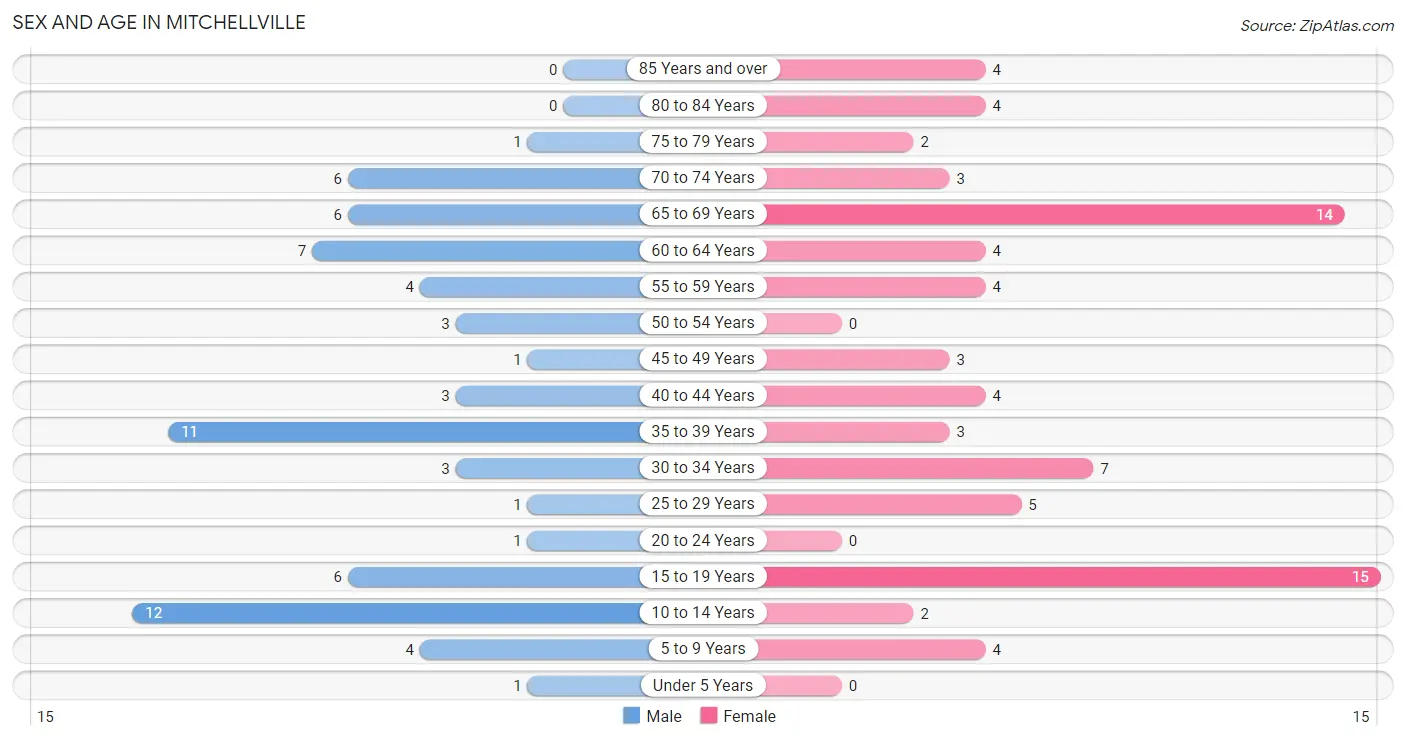
| Age Bracket | Male | Female |
| Under 5 Years | 1 (1.4%) | 0 (0.0%) |
| 5 to 9 Years | 4 (5.7%) | 4 (5.1%) |
| 10 to 14 Years | 12 (17.1%) | 2 (2.6%) |
| 15 to 19 Years | 6 (8.6%) | 15 (19.2%) |
| 20 to 24 Years | 1 (1.4%) | 0 (0.0%) |
| 25 to 29 Years | 1 (1.4%) | 5 (6.4%) |
| 30 to 34 Years | 3 (4.3%) | 7 (9.0%) |
| 35 to 39 Years | 11 (15.7%) | 3 (3.8%) |
| 40 to 44 Years | 3 (4.3%) | 4 (5.1%) |
| 45 to 49 Years | 1 (1.4%) | 3 (3.8%) |
| 50 to 54 Years | 3 (4.3%) | 0 (0.0%) |
| 55 to 59 Years | 4 (5.7%) | 4 (5.1%) |
| 60 to 64 Years | 7 (10.0%) | 4 (5.1%) |
| 65 to 69 Years | 6 (8.6%) | 14 (17.9%) |
| 70 to 74 Years | 6 (8.6%) | 3 (3.8%) |
| 75 to 79 Years | 1 (1.4%) | 2 (2.6%) |
| 80 to 84 Years | 0 (0.0%) | 4 (5.1%) |
| 85 Years and over | 0 (0.0%) | 4 (5.1%) |
| Total | 70 (100.0%) | 78 (100.0%) |
Families and Households in Mitchellville
Median Family Size in Mitchellville
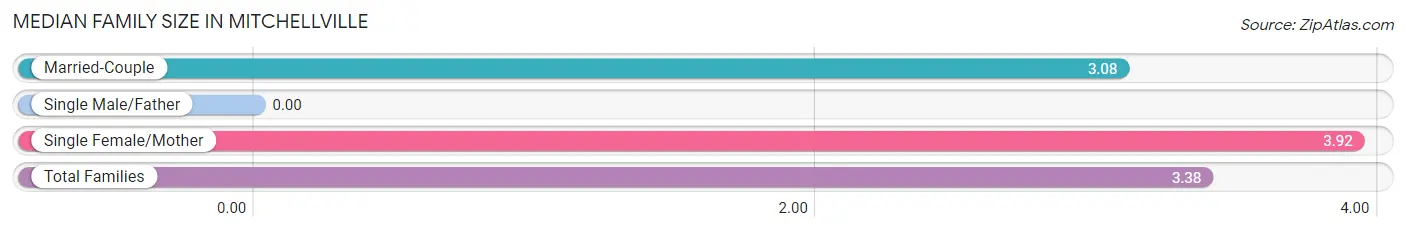
| Family Type | # Families | Family Size |
| Married-Couple | 24 (64.9%) | 3.08 |
| Single Male/Father | 0 (0.0%) | - |
| Single Female/Mother | 13 (35.1%) | 3.92 |
| Total Families | 37 (100.0%) | 3.38 |
Median Household Size in Mitchellville
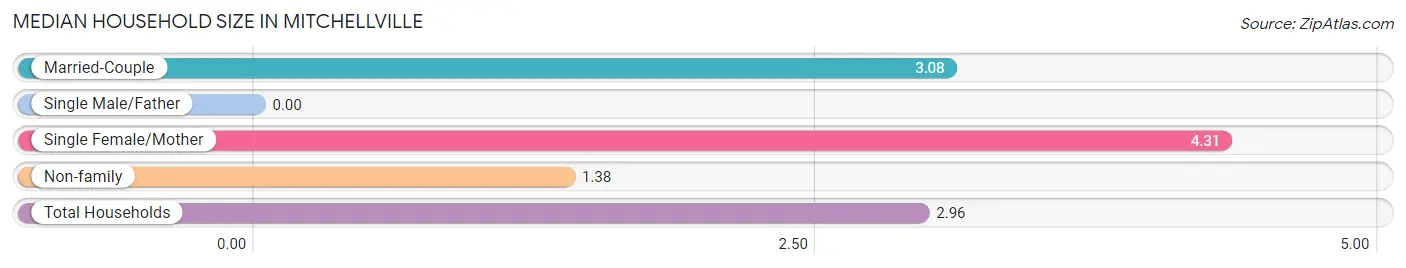
| Household Type | # Households | Household Size |
| Married-Couple | 24 (48.0%) | 3.08 |
| Single Male/Father | 0 (0.0%) | - |
| Single Female/Mother | 13 (26.0%) | 4.31 |
| Non-family | 13 (26.0%) | 1.38 |
| Total Households | 50 (100.0%) | 2.96 |
Household Size by Marriage Status in Mitchellville
Out of a total of 50 households in Mitchellville, 37 (74.0%) are family households, while 13 (26.0%) are nonfamily households. The most numerous type of family households are 2-person households, comprising 20, and the most common type of nonfamily households are 1-person households, comprising 8.
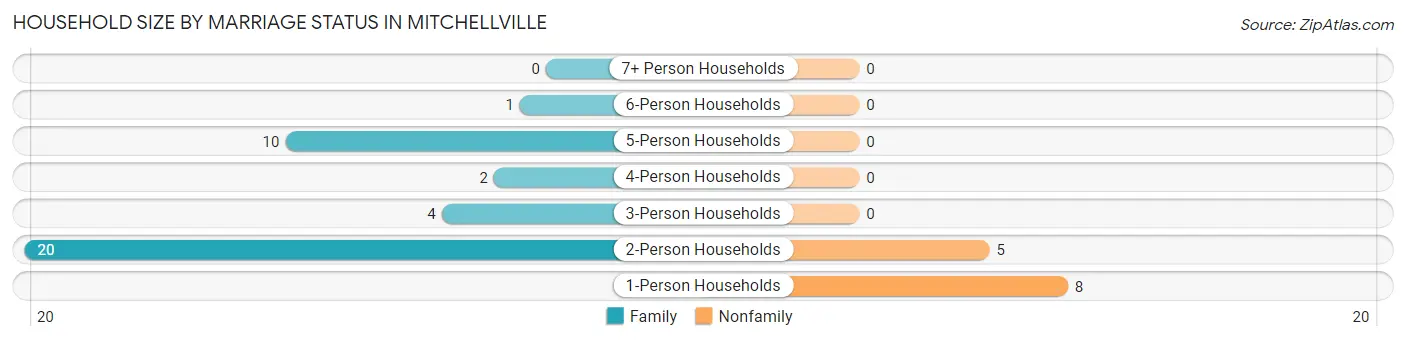
| Household Size | Family Households | Nonfamily Households |
| 1-Person Households | - | 8 (16.0%) |
| 2-Person Households | 20 (40.0%) | 5 (10.0%) |
| 3-Person Households | 4 (8.0%) | 0 (0.0%) |
| 4-Person Households | 2 (4.0%) | 0 (0.0%) |
| 5-Person Households | 10 (20.0%) | 0 (0.0%) |
| 6-Person Households | 1 (2.0%) | 0 (0.0%) |
| 7+ Person Households | 0 (0.0%) | 0 (0.0%) |
| Total | 37 (74.0%) | 13 (26.0%) |
Female Fertility in Mitchellville
Fertility by Age in Mitchellville
Average fertility rate in Mitchellville is 27.0 births per 1,000 women. Women in the age bracket of 20 to 34 years have the highest fertility rate with 83.0 births per 1,000 women. Women in the age bracket of 20 to 34 years acount for 100.0% of all women with births.
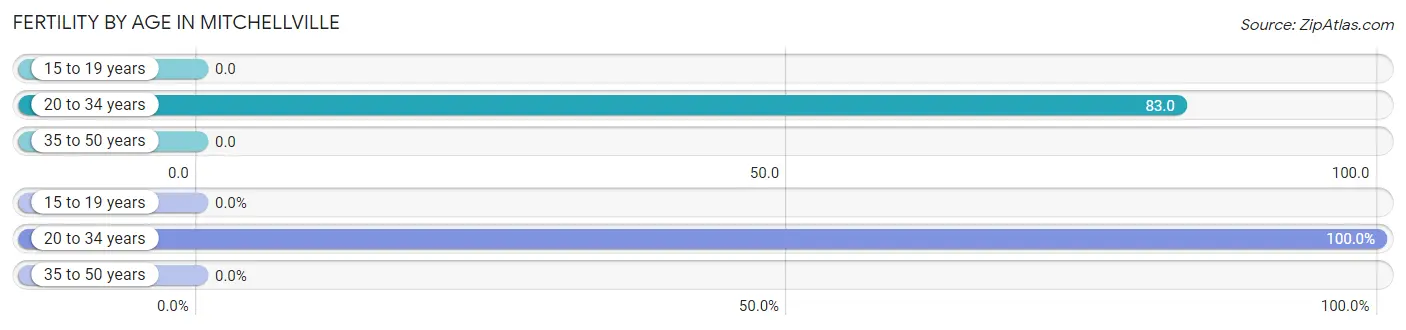
| Age Bracket | Women with Births | Births / 1,000 Women |
| 15 to 19 years | 0 (0.0%) | 0.0 |
| 20 to 34 years | 1 (100.0%) | 83.0 |
| 35 to 50 years | 0 (0.0%) | 0.0 |
| Total | 1 (100.0%) | 27.0 |
Fertility by Age by Marriage Status in Mitchellville
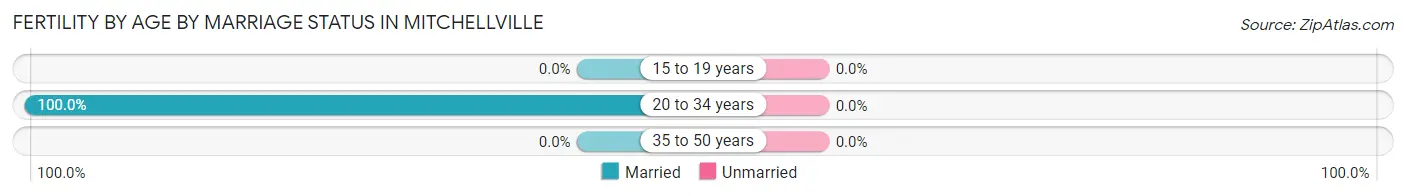
| Age Bracket | Married | Unmarried |
| 15 to 19 years | 0 (0.0%) | 0 (0.0%) |
| 20 to 34 years | 1 (100.0%) | 0 (0.0%) |
| 35 to 50 years | 0 (0.0%) | 0 (0.0%) |
| Total | 1 (100.0%) | 0 (0.0%) |
Fertility by Education in Mitchellville
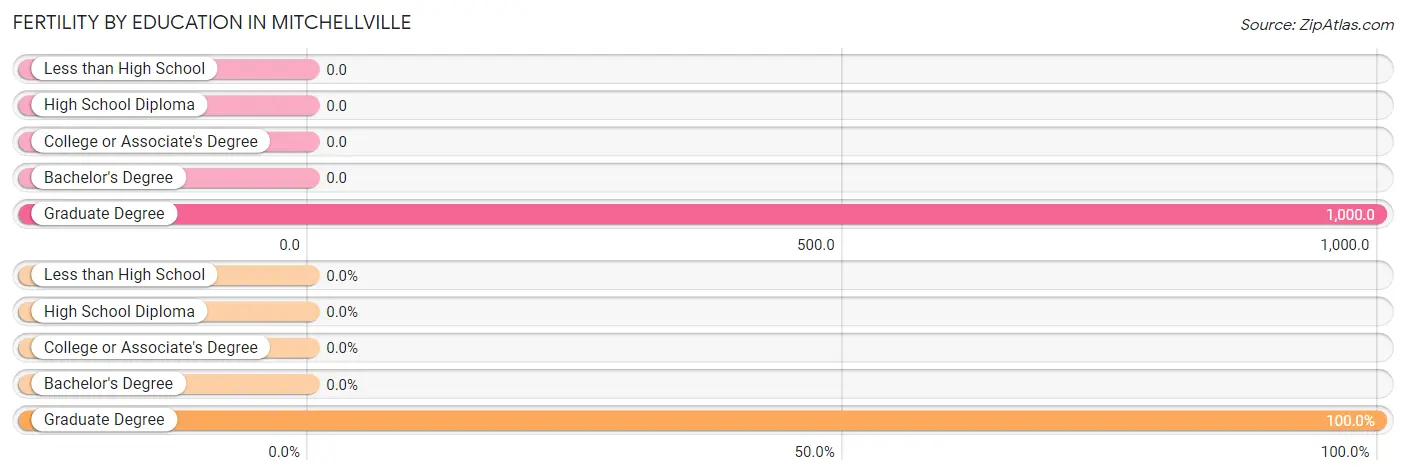
| Educational Attainment | Women with Births | Births / 1,000 Women |
| Less than High School | 0 (0.0%) | 0.0 |
| High School Diploma | 0 (0.0%) | 0.0 |
| College or Associate's Degree | 0 (0.0%) | 0.0 |
| Bachelor's Degree | 0 (0.0%) | 0.0 |
| Graduate Degree | 1 (100.0%) | 1,000.0 |
| Total | 1 (100.0%) | 27.0 |
Fertility by Education by Marriage Status in Mitchellville
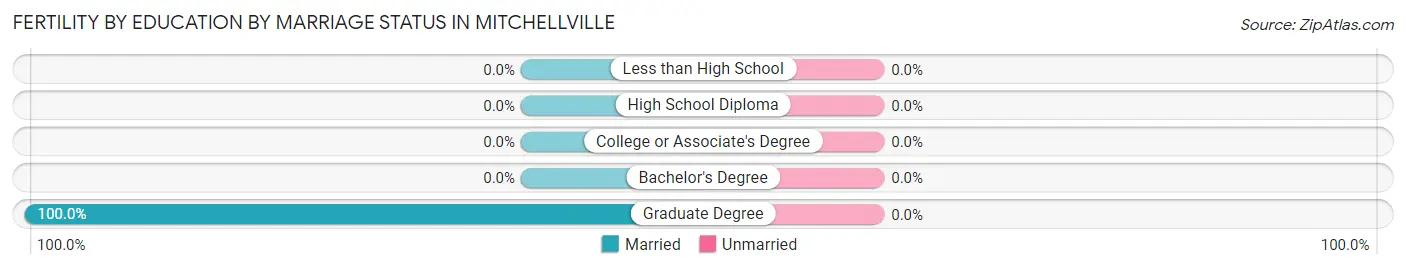
| Educational Attainment | Married | Unmarried |
| Less than High School | 0 (0.0%) | 0 (0.0%) |
| High School Diploma | 0 (0.0%) | 0 (0.0%) |
| College or Associate's Degree | 0 (0.0%) | 0 (0.0%) |
| Bachelor's Degree | 0 (0.0%) | 0 (0.0%) |
| Graduate Degree | 1 (100.0%) | 0 (0.0%) |
| Total | 1 (100.0%) | 0 (0.0%) |
Employment Characteristics in Mitchellville
Employment by Class of Employer in Mitchellville
Among the 50 employed individuals in Mitchellville, private company employees (29 | 58.0%), self-employed (not incorporated) (12 | 24.0%), and not-for-profit organizations (4 | 8.0%) make up the most common classes of employment.
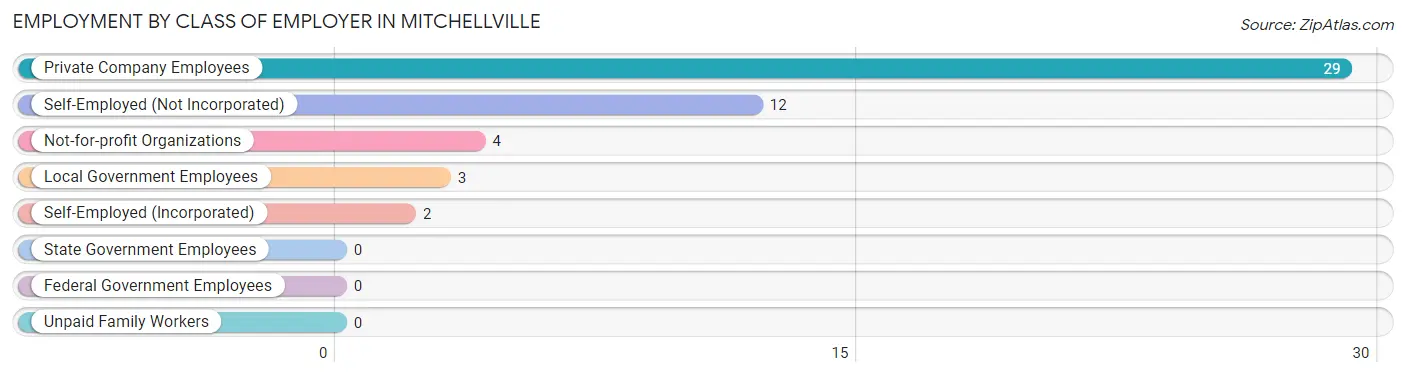
| Employer Class | # Employees | % Employees |
| Private Company Employees | 29 | 58.0% |
| Self-Employed (Incorporated) | 2 | 4.0% |
| Self-Employed (Not Incorporated) | 12 | 24.0% |
| Not-for-profit Organizations | 4 | 8.0% |
| Local Government Employees | 3 | 6.0% |
| State Government Employees | 0 | 0.0% |
| Federal Government Employees | 0 | 0.0% |
| Unpaid Family Workers | 0 | 0.0% |
| Total | 50 | 100.0% |
Employment Status by Age in Mitchellville
According to the labor force statistics for Mitchellville, out of the total population over 16 years of age (122), 44.3% or 54 individuals are in the labor force, with 3.7% or 2 of them unemployed. The age group with the highest labor force participation rate is 20 to 24 years, with 100.0% or 1 individuals in the labor force. Within the labor force, the 20 to 24 years age range has the highest percentage of unemployed individuals, with 100.0% or 1 of them being unemployed.
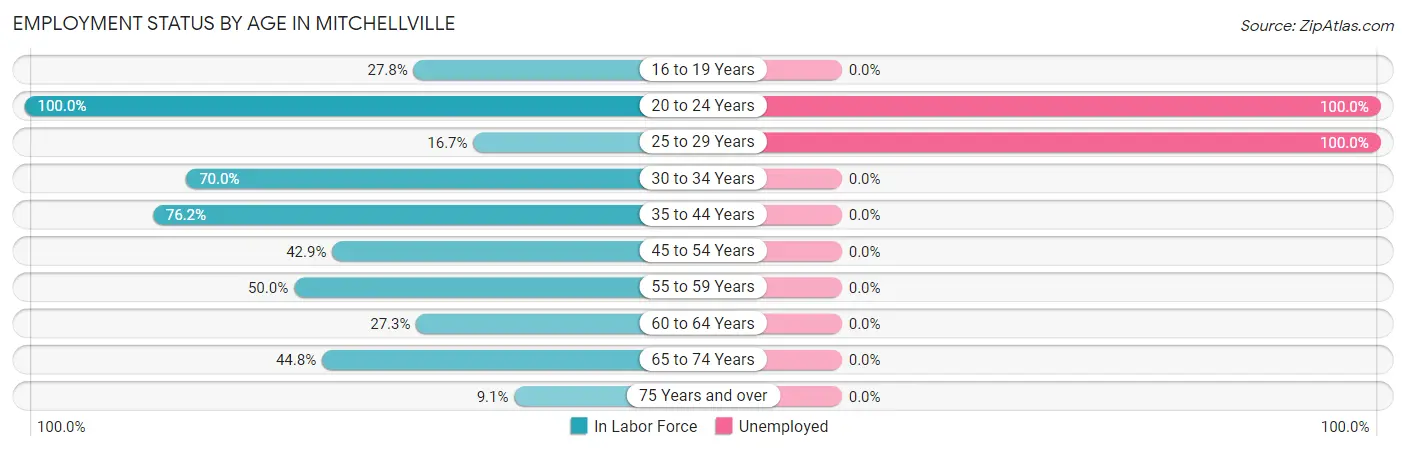
| Age Bracket | In Labor Force | Unemployed |
| 16 to 19 Years | 5 (27.8%) | 0 (0.0%) |
| 20 to 24 Years | 1 (100.0%) | 1 (100.0%) |
| 25 to 29 Years | 1 (16.7%) | 1 (100.0%) |
| 30 to 34 Years | 7 (70.0%) | 0 (0.0%) |
| 35 to 44 Years | 16 (76.2%) | 0 (0.0%) |
| 45 to 54 Years | 3 (42.9%) | 0 (0.0%) |
| 55 to 59 Years | 4 (50.0%) | 0 (0.0%) |
| 60 to 64 Years | 3 (27.3%) | 0 (0.0%) |
| 65 to 74 Years | 13 (44.8%) | 0 (0.0%) |
| 75 Years and over | 1 (9.1%) | 0 (0.0%) |
| Total | 54 (44.3%) | 2 (3.7%) |
Employment Status by Educational Attainment in Mitchellville
According to labor force statistics for Mitchellville, 54.0% of individuals (34) out of the total population between 25 and 64 years of age (63) are in the labor force, with 2.9% or 1 of them being unemployed. The group with the highest labor force participation rate are those with the educational attainment of less than high school, with 100.0% or 7 individuals in the labor force. Within the labor force, individuals with high school diploma education have the highest percentage of unemployment, with 4.2% or 1 of them being unemployed.
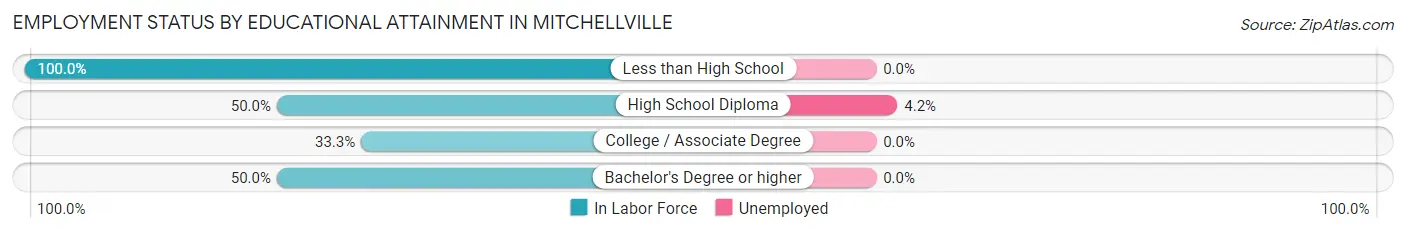
| Educational Attainment | In Labor Force | Unemployed |
| Less than High School | 7 (100.0%) | 0 (0.0%) |
| High School Diploma | 24 (50.0%) | 2 (4.2%) |
| College / Associate Degree | 2 (33.3%) | 0 (0.0%) |
| Bachelor's Degree or higher | 1 (50.0%) | 0 (0.0%) |
| Total | 34 (54.0%) | 2 (2.9%) |
Employment Occupations by Sex in Mitchellville
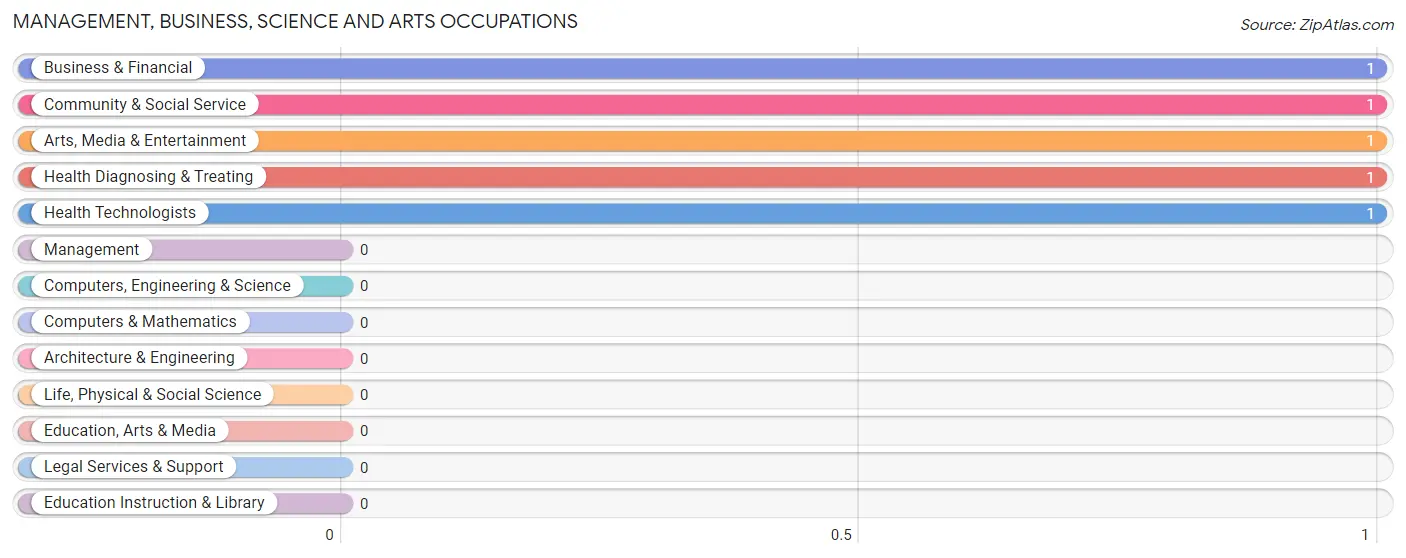
Management, Business, Science and Arts Occupations
The most common Management, Business, Science and Arts occupations in Mitchellville are Business & Financial (1 | 1.9%), Community & Social Service (1 | 1.9%), Arts, Media & Entertainment (1 | 1.9%), Health Diagnosing & Treating (1 | 1.9%), and Health Technologists (1 | 1.9%).
Management, Business, Science and Arts Occupations by Sex
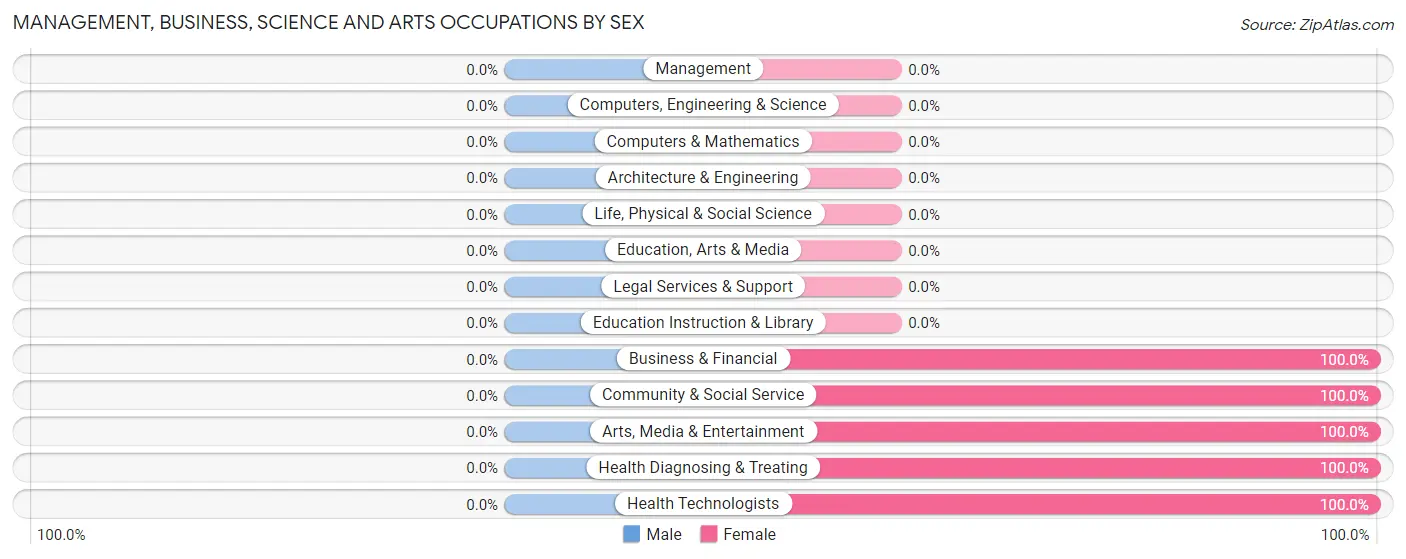
| Occupation | Male | Female |
| Management | 0 (0.0%) | 0 (0.0%) |
| Business & Financial | 0 (0.0%) | 1 (100.0%) |
| Computers, Engineering & Science | 0 (0.0%) | 0 (0.0%) |
| Computers & Mathematics | 0 (0.0%) | 0 (0.0%) |
| Architecture & Engineering | 0 (0.0%) | 0 (0.0%) |
| Life, Physical & Social Science | 0 (0.0%) | 0 (0.0%) |
| Community & Social Service | 0 (0.0%) | 1 (100.0%) |
| Education, Arts & Media | 0 (0.0%) | 0 (0.0%) |
| Legal Services & Support | 0 (0.0%) | 0 (0.0%) |
| Education Instruction & Library | 0 (0.0%) | 0 (0.0%) |
| Arts, Media & Entertainment | 0 (0.0%) | 1 (100.0%) |
| Health Diagnosing & Treating | 0 (0.0%) | 1 (100.0%) |
| Health Technologists | 0 (0.0%) | 1 (100.0%) |
| Total (Category) | 0 (0.0%) | 3 (100.0%) |
| Total (Overall) | 24 (46.2%) | 28 (53.8%) |
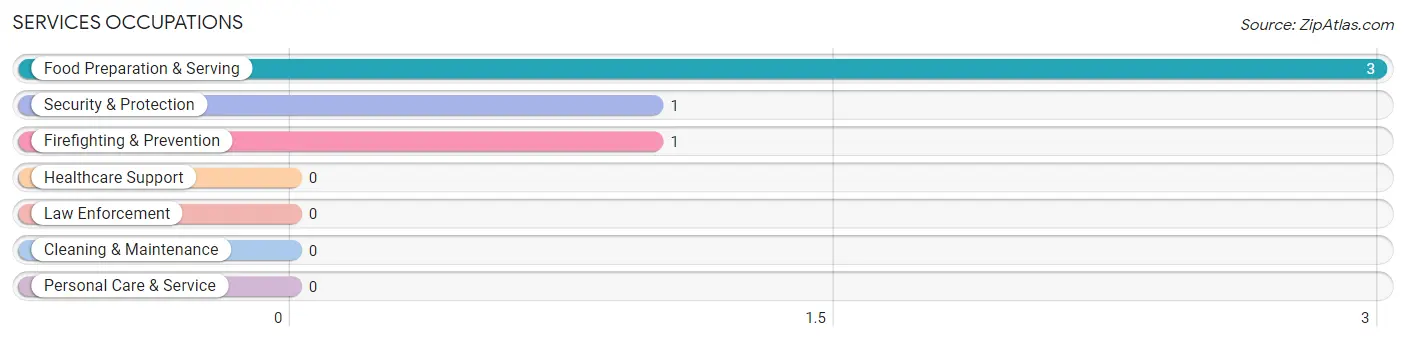
Services Occupations
The most common Services occupations in Mitchellville are Food Preparation & Serving (3 | 5.8%), Security & Protection (1 | 1.9%), and Firefighting & Prevention (1 | 1.9%).
Services Occupations by Sex
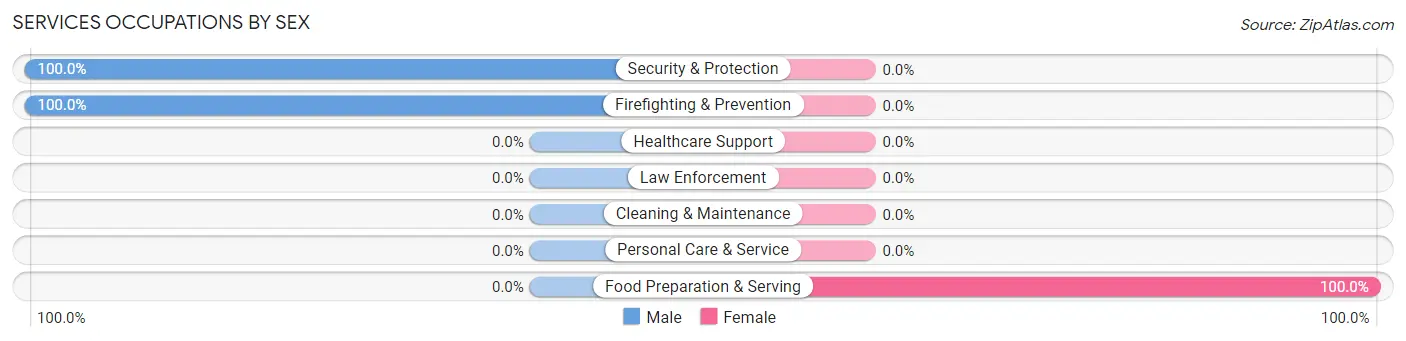
| Occupation | Male | Female |
| Healthcare Support | 0 (0.0%) | 0 (0.0%) |
| Security & Protection | 1 (100.0%) | 0 (0.0%) |
| Firefighting & Prevention | 1 (100.0%) | 0 (0.0%) |
| Law Enforcement | 0 (0.0%) | 0 (0.0%) |
| Food Preparation & Serving | 0 (0.0%) | 3 (100.0%) |
| Cleaning & Maintenance | 0 (0.0%) | 0 (0.0%) |
| Personal Care & Service | 0 (0.0%) | 0 (0.0%) |
| Total (Category) | 1 (25.0%) | 3 (75.0%) |
| Total (Overall) | 24 (46.2%) | 28 (53.8%) |
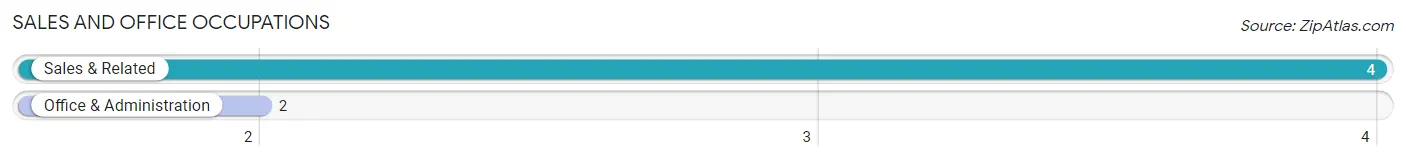
Sales and Office Occupations
The most common Sales and Office occupations in Mitchellville are Sales & Related (4 | 7.7%), and Office & Administration (2 | 3.8%).
Sales and Office Occupations by Sex
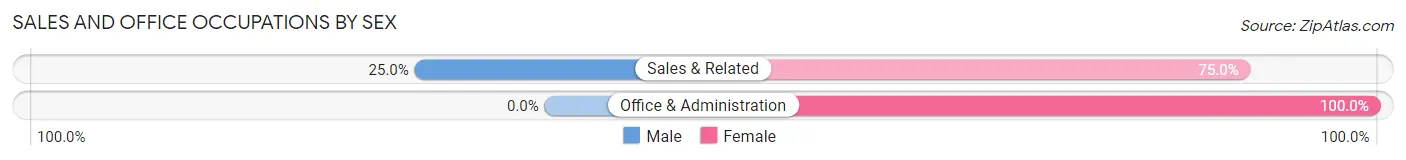
| Occupation | Male | Female |
| Sales & Related | 1 (25.0%) | 3 (75.0%) |
| Office & Administration | 0 (0.0%) | 2 (100.0%) |
| Total (Category) | 1 (16.7%) | 5 (83.3%) |
| Total (Overall) | 24 (46.2%) | 28 (53.8%) |
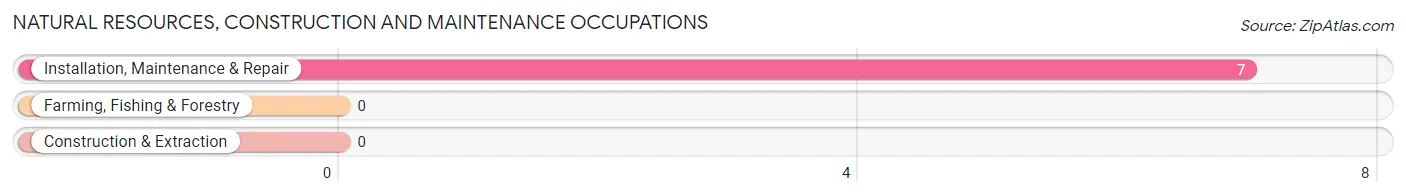
Natural Resources, Construction and Maintenance Occupations
The most common Natural Resources, Construction and Maintenance occupations in Mitchellville are , and Installation, Maintenance & Repair (7 | 13.5%).
Natural Resources, Construction and Maintenance Occupations by Sex
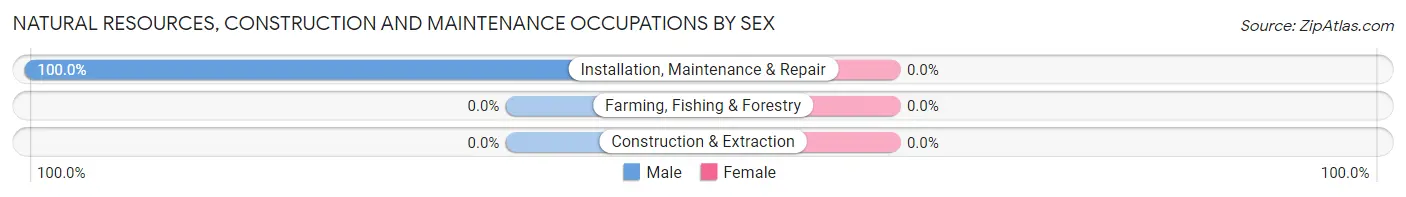
| Occupation | Male | Female |
| Farming, Fishing & Forestry | 0 (0.0%) | 0 (0.0%) |
| Construction & Extraction | 0 (0.0%) | 0 (0.0%) |
| Installation, Maintenance & Repair | 7 (100.0%) | 0 (0.0%) |
| Total (Category) | 7 (100.0%) | 0 (0.0%) |
| Total (Overall) | 24 (46.2%) | 28 (53.8%) |
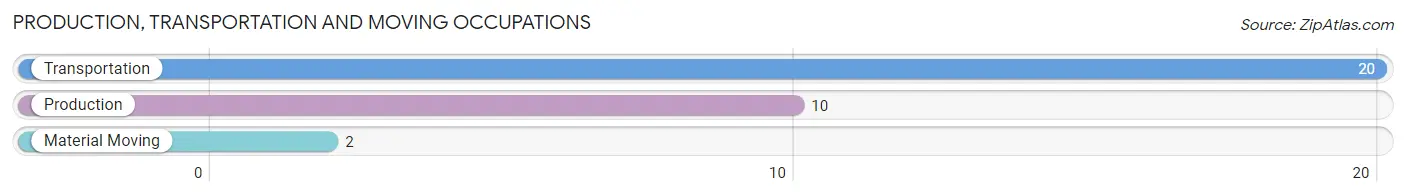
Production, Transportation and Moving Occupations
The most common Production, Transportation and Moving occupations in Mitchellville are Transportation (20 | 38.5%), Production (10 | 19.2%), and Material Moving (2 | 3.8%).
Production, Transportation and Moving Occupations by Sex
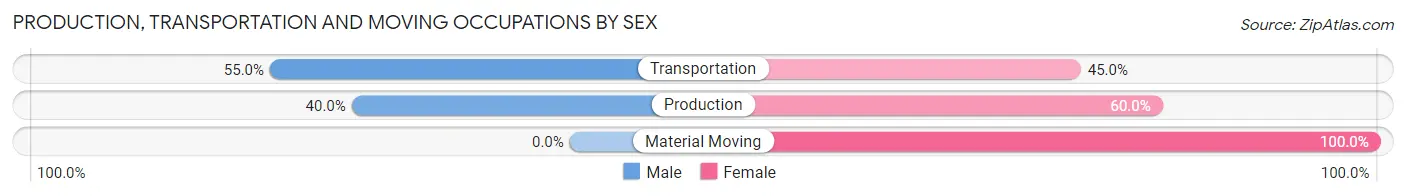
| Occupation | Male | Female |
| Production | 4 (40.0%) | 6 (60.0%) |
| Transportation | 11 (55.0%) | 9 (45.0%) |
| Material Moving | 0 (0.0%) | 2 (100.0%) |
| Total (Category) | 15 (46.9%) | 17 (53.1%) |
| Total (Overall) | 24 (46.2%) | 28 (53.8%) |
Employment Industries by Sex in Mitchellville
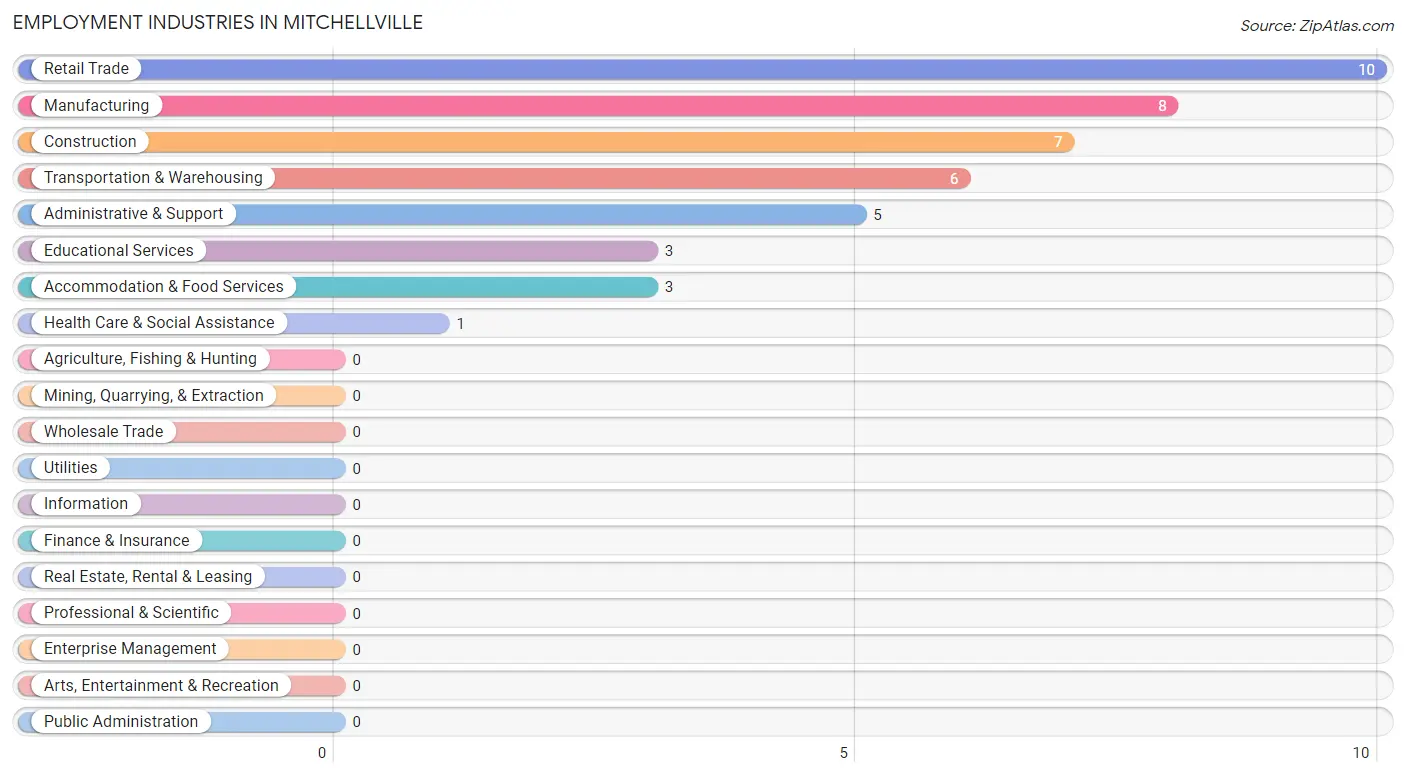
Employment Industries in Mitchellville
The major employment industries in Mitchellville include Retail Trade (10 | 19.2%), Manufacturing (8 | 15.4%), Construction (7 | 13.5%), Transportation & Warehousing (6 | 11.5%), and Administrative & Support (5 | 9.6%).
Employment Industries by Sex in Mitchellville
The Mitchellville industries that see more men than women are Construction (100.0%), Administrative & Support (80.0%), and Transportation & Warehousing (50.0%), whereas the industries that tend to have a higher number of women are Educational Services (100.0%), Health Care & Social Assistance (100.0%), and Accommodation & Food Services (100.0%).
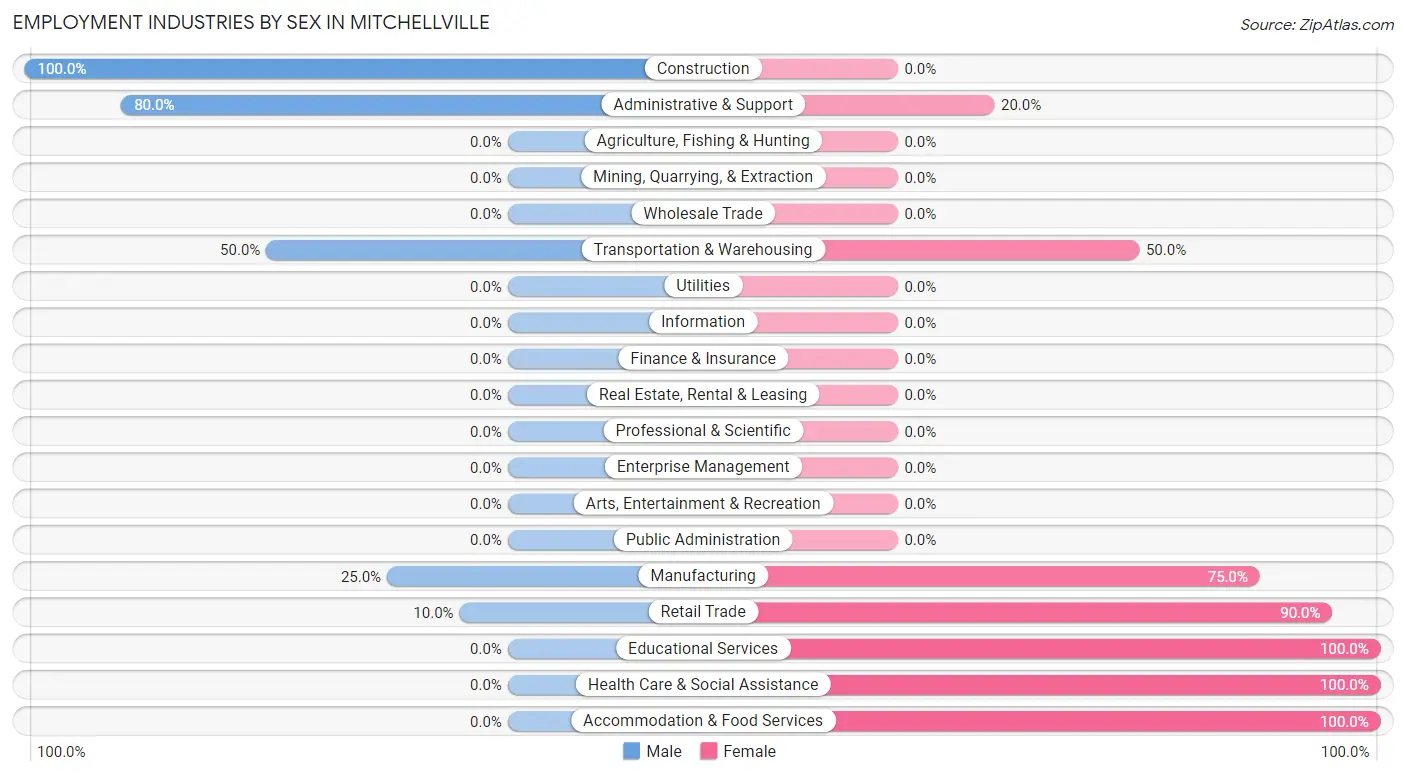
| Industry | Male | Female |
| Agriculture, Fishing & Hunting | 0 (0.0%) | 0 (0.0%) |
| Mining, Quarrying, & Extraction | 0 (0.0%) | 0 (0.0%) |
| Construction | 7 (100.0%) | 0 (0.0%) |
| Manufacturing | 2 (25.0%) | 6 (75.0%) |
| Wholesale Trade | 0 (0.0%) | 0 (0.0%) |
| Retail Trade | 1 (10.0%) | 9 (90.0%) |
| Transportation & Warehousing | 3 (50.0%) | 3 (50.0%) |
| Utilities | 0 (0.0%) | 0 (0.0%) |
| Information | 0 (0.0%) | 0 (0.0%) |
| Finance & Insurance | 0 (0.0%) | 0 (0.0%) |
| Real Estate, Rental & Leasing | 0 (0.0%) | 0 (0.0%) |
| Professional & Scientific | 0 (0.0%) | 0 (0.0%) |
| Enterprise Management | 0 (0.0%) | 0 (0.0%) |
| Administrative & Support | 4 (80.0%) | 1 (20.0%) |
| Educational Services | 0 (0.0%) | 3 (100.0%) |
| Health Care & Social Assistance | 0 (0.0%) | 1 (100.0%) |
| Arts, Entertainment & Recreation | 0 (0.0%) | 0 (0.0%) |
| Accommodation & Food Services | 0 (0.0%) | 3 (100.0%) |
| Public Administration | 0 (0.0%) | 0 (0.0%) |
| Total | 24 (46.2%) | 28 (53.8%) |
Education in Mitchellville
School Enrollment in Mitchellville
The most common levels of schooling among the 42 students in Mitchellville are high school (25 | 59.5%), middle school (10 | 23.8%), and elementary school (6 | 14.3%).
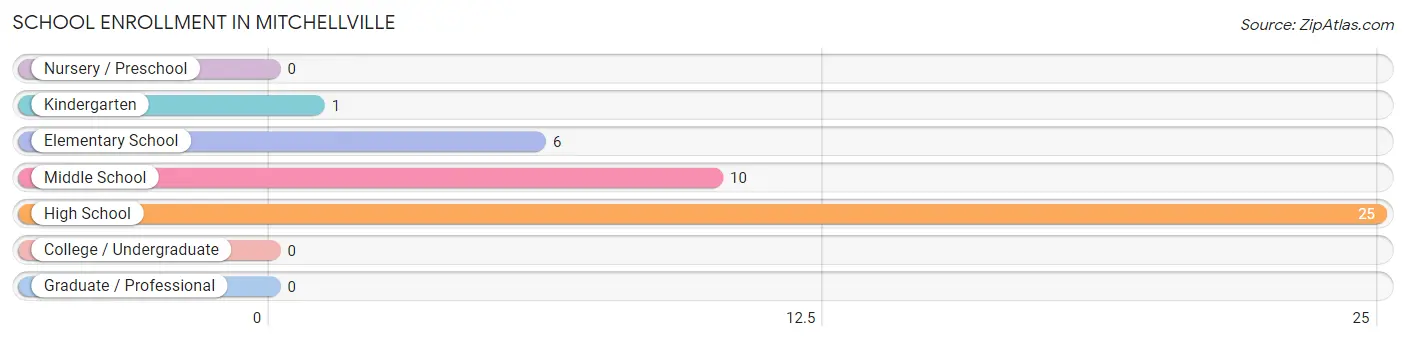
| School Level | # Students | % Students |
| Nursery / Preschool | 0 | 0.0% |
| Kindergarten | 1 | 2.4% |
| Elementary School | 6 | 14.3% |
| Middle School | 10 | 23.8% |
| High School | 25 | 59.5% |
| College / Undergraduate | 0 | 0.0% |
| Graduate / Professional | 0 | 0.0% |
| Total | 42 | 100.0% |
School Enrollment by Age by Funding Source in Mitchellville
Out of a total of 42 students who are enrolled in schools in Mitchellville, 4 (9.5%) attend a private institution, while the remaining 38 (90.5%) are enrolled in public schools. The age group of 5 to 9 year old has the highest likelihood of being enrolled in private schools, with 2 (28.6% in the age bracket) enrolled. Conversely, the age group of 10 to 14 year olds has the lowest likelihood of being enrolled in a private school, with 14 (100.0% in the age bracket) attending a public institution.
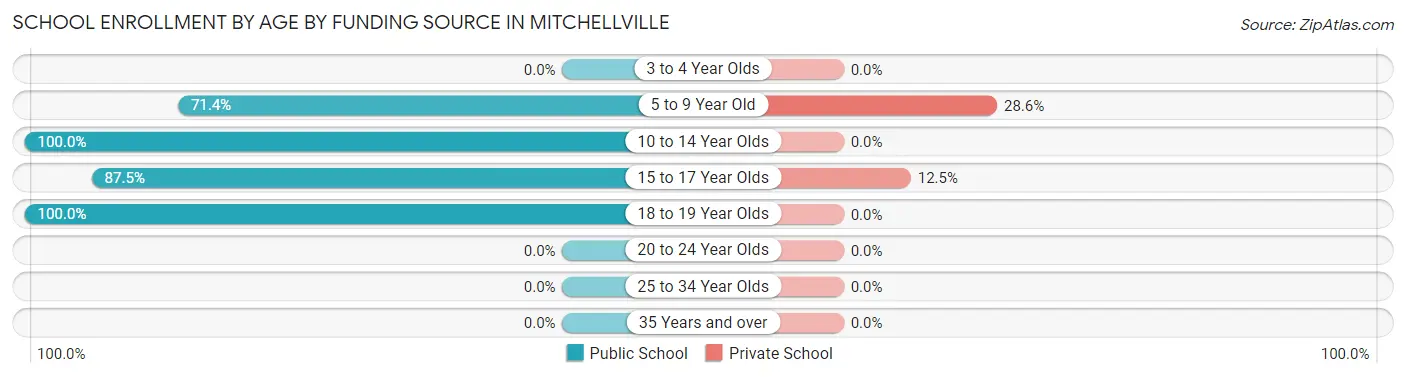
| Age Bracket | Public School | Private School |
| 3 to 4 Year Olds | 0 (0.0%) | 0 (0.0%) |
| 5 to 9 Year Old | 5 (71.4%) | 2 (28.6%) |
| 10 to 14 Year Olds | 14 (100.0%) | 0 (0.0%) |
| 15 to 17 Year Olds | 14 (87.5%) | 2 (12.5%) |
| 18 to 19 Year Olds | 5 (100.0%) | 0 (0.0%) |
| 20 to 24 Year Olds | 0 (0.0%) | 0 (0.0%) |
| 25 to 34 Year Olds | 0 (0.0%) | 0 (0.0%) |
| 35 Years and over | 0 (0.0%) | 0 (0.0%) |
| Total | 38 (90.5%) | 4 (9.5%) |
Educational Attainment by Field of Study in Mitchellville
Social sciences (1 | 33.3%), liberal arts & history (1 | 33.3%), and arts & humanities (1 | 33.3%) are the most common fields of study among 3 individuals in Mitchellville who have obtained a bachelor's degree or higher.
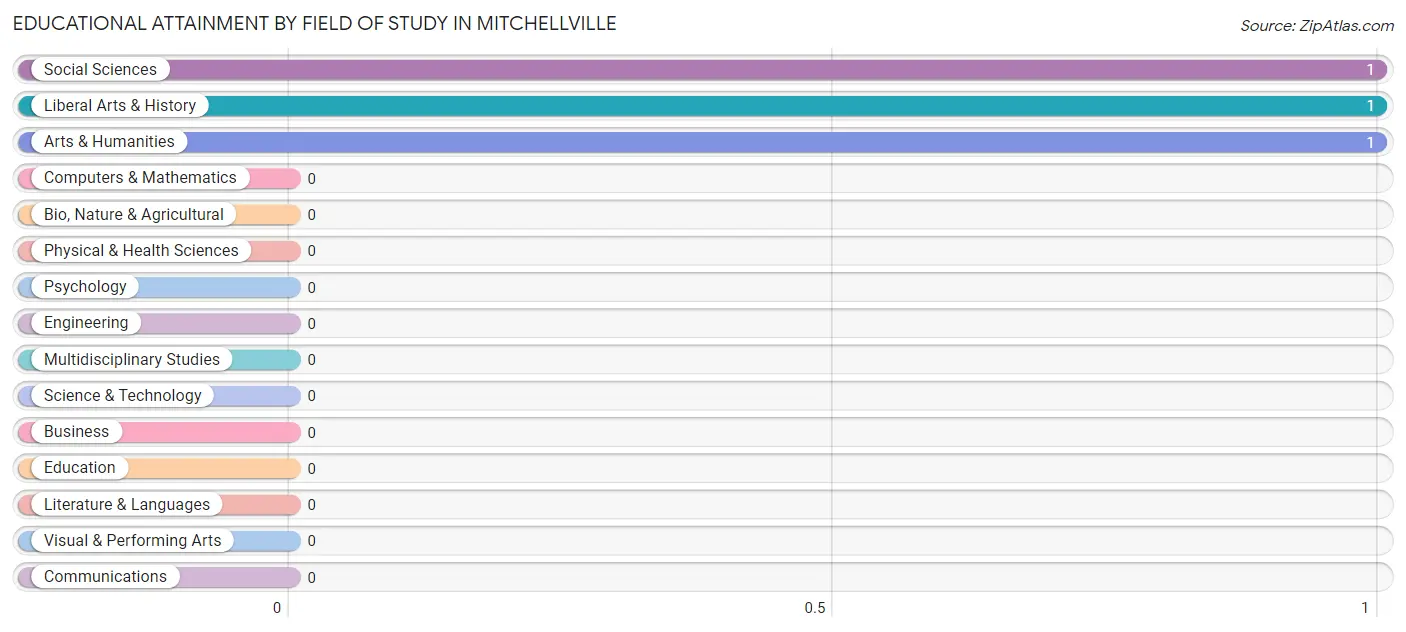
| Field of Study | # Graduates | % Graduates |
| Computers & Mathematics | 0 | 0.0% |
| Bio, Nature & Agricultural | 0 | 0.0% |
| Physical & Health Sciences | 0 | 0.0% |
| Psychology | 0 | 0.0% |
| Social Sciences | 1 | 33.3% |
| Engineering | 0 | 0.0% |
| Multidisciplinary Studies | 0 | 0.0% |
| Science & Technology | 0 | 0.0% |
| Business | 0 | 0.0% |
| Education | 0 | 0.0% |
| Literature & Languages | 0 | 0.0% |
| Liberal Arts & History | 1 | 33.3% |
| Visual & Performing Arts | 0 | 0.0% |
| Communications | 0 | 0.0% |
| Arts & Humanities | 1 | 33.3% |
| Total | 3 | 100.0% |
Transportation & Commute in Mitchellville
Vehicle Availability by Sex in Mitchellville
The most prevalent vehicle ownership categories in Mitchellville are males with 2 vehicles (11, accounting for 45.8%) and females with 2 vehicles (11, making up 42.3%).
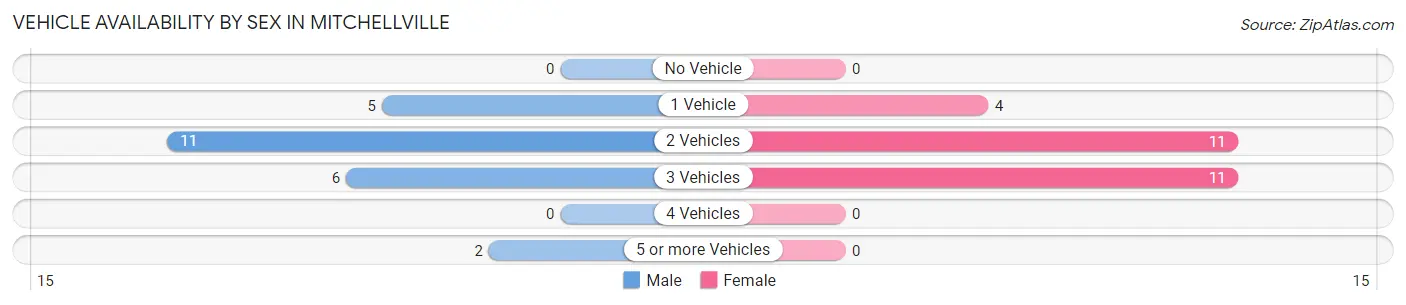
| Vehicles Available | Male | Female |
| No Vehicle | 0 (0.0%) | 0 (0.0%) |
| 1 Vehicle | 5 (20.8%) | 4 (15.4%) |
| 2 Vehicles | 11 (45.8%) | 11 (42.3%) |
| 3 Vehicles | 6 (25.0%) | 11 (42.3%) |
| 4 Vehicles | 0 (0.0%) | 0 (0.0%) |
| 5 or more Vehicles | 2 (8.3%) | 0 (0.0%) |
| Total | 24 (100.0%) | 26 (100.0%) |
Commute Time in Mitchellville
The most frequently occuring commute durations in Mitchellville are 15 to 19 minutes (16 commuters, 33.3%), 30 to 34 minutes (14 commuters, 29.2%), and 20 to 24 minutes (9 commuters, 18.8%).
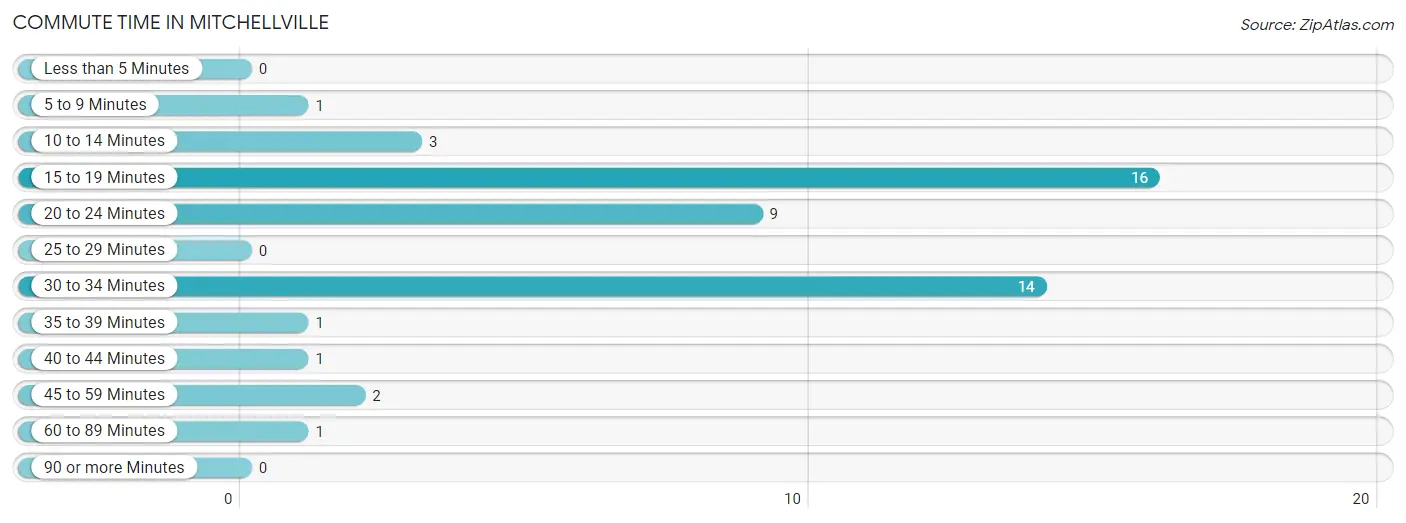
| Commute Time | # Commuters | % Commuters |
| Less than 5 Minutes | 0 | 0.0% |
| 5 to 9 Minutes | 1 | 2.1% |
| 10 to 14 Minutes | 3 | 6.2% |
| 15 to 19 Minutes | 16 | 33.3% |
| 20 to 24 Minutes | 9 | 18.8% |
| 25 to 29 Minutes | 0 | 0.0% |
| 30 to 34 Minutes | 14 | 29.2% |
| 35 to 39 Minutes | 1 | 2.1% |
| 40 to 44 Minutes | 1 | 2.1% |
| 45 to 59 Minutes | 2 | 4.2% |
| 60 to 89 Minutes | 1 | 2.1% |
| 90 or more Minutes | 0 | 0.0% |
Commute Time by Sex in Mitchellville
The most common commute times in Mitchellville are 15 to 19 minutes (13 commuters, 59.1%) for males and 30 to 34 minutes (9 commuters, 34.6%) for females.
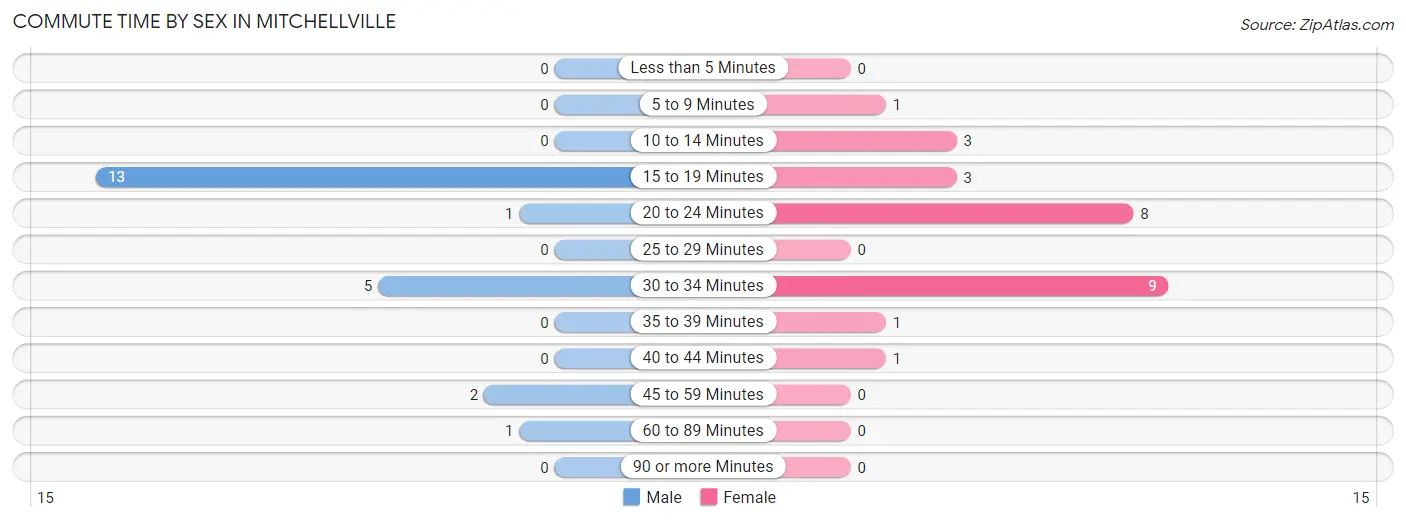
| Commute Time | Male | Female |
| Less than 5 Minutes | 0 (0.0%) | 0 (0.0%) |
| 5 to 9 Minutes | 0 (0.0%) | 1 (3.8%) |
| 10 to 14 Minutes | 0 (0.0%) | 3 (11.5%) |
| 15 to 19 Minutes | 13 (59.1%) | 3 (11.5%) |
| 20 to 24 Minutes | 1 (4.5%) | 8 (30.8%) |
| 25 to 29 Minutes | 0 (0.0%) | 0 (0.0%) |
| 30 to 34 Minutes | 5 (22.7%) | 9 (34.6%) |
| 35 to 39 Minutes | 0 (0.0%) | 1 (3.8%) |
| 40 to 44 Minutes | 0 (0.0%) | 1 (3.8%) |
| 45 to 59 Minutes | 2 (9.1%) | 0 (0.0%) |
| 60 to 89 Minutes | 1 (4.5%) | 0 (0.0%) |
| 90 or more Minutes | 0 (0.0%) | 0 (0.0%) |
Time of Departure to Work by Sex in Mitchellville
The most frequent times of departure to work in Mitchellville are 7:00 AM to 7:29 AM (6, 27.3%) for males and 7:00 AM to 7:29 AM (10, 38.5%) for females.
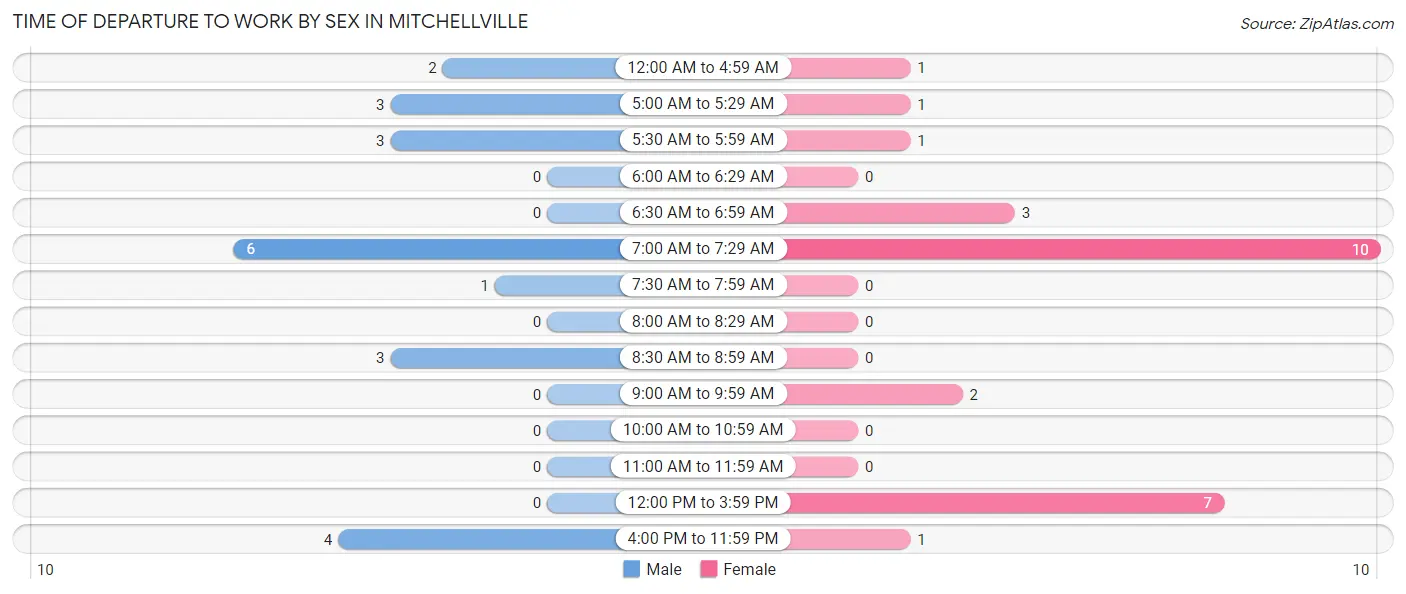
| Time of Departure | Male | Female |
| 12:00 AM to 4:59 AM | 2 (9.1%) | 1 (3.8%) |
| 5:00 AM to 5:29 AM | 3 (13.6%) | 1 (3.8%) |
| 5:30 AM to 5:59 AM | 3 (13.6%) | 1 (3.8%) |
| 6:00 AM to 6:29 AM | 0 (0.0%) | 0 (0.0%) |
| 6:30 AM to 6:59 AM | 0 (0.0%) | 3 (11.5%) |
| 7:00 AM to 7:29 AM | 6 (27.3%) | 10 (38.5%) |
| 7:30 AM to 7:59 AM | 1 (4.5%) | 0 (0.0%) |
| 8:00 AM to 8:29 AM | 0 (0.0%) | 0 (0.0%) |
| 8:30 AM to 8:59 AM | 3 (13.6%) | 0 (0.0%) |
| 9:00 AM to 9:59 AM | 0 (0.0%) | 2 (7.7%) |
| 10:00 AM to 10:59 AM | 0 (0.0%) | 0 (0.0%) |
| 11:00 AM to 11:59 AM | 0 (0.0%) | 0 (0.0%) |
| 12:00 PM to 3:59 PM | 0 (0.0%) | 7 (26.9%) |
| 4:00 PM to 11:59 PM | 4 (18.2%) | 1 (3.8%) |
| Total | 22 (100.0%) | 26 (100.0%) |
Housing Occupancy in Mitchellville
Occupancy by Ownership in Mitchellville
Of the total 50 dwellings in Mitchellville, owner-occupied units account for 35 (70.0%), while renter-occupied units make up 15 (30.0%).
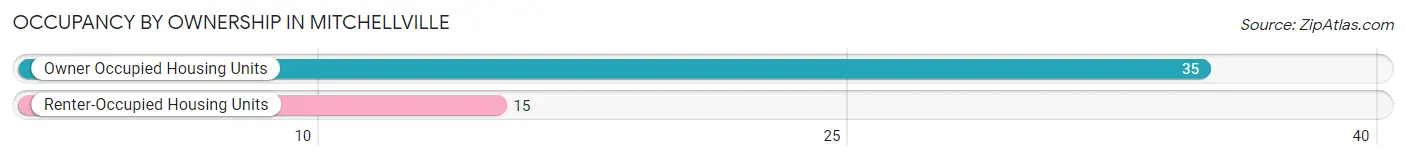
| Occupancy | # Housing Units | % Housing Units |
| Owner Occupied Housing Units | 35 | 70.0% |
| Renter-Occupied Housing Units | 15 | 30.0% |
| Total Occupied Housing Units | 50 | 100.0% |
Occupancy by Household Size in Mitchellville
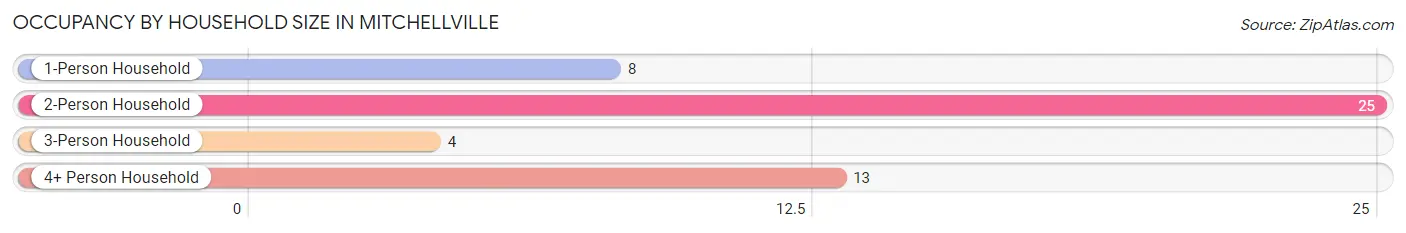
| Household Size | # Housing Units | % Housing Units |
| 1-Person Household | 8 | 16.0% |
| 2-Person Household | 25 | 50.0% |
| 3-Person Household | 4 | 8.0% |
| 4+ Person Household | 13 | 26.0% |
| Total Housing Units | 50 | 100.0% |
Occupancy by Ownership by Household Size in Mitchellville
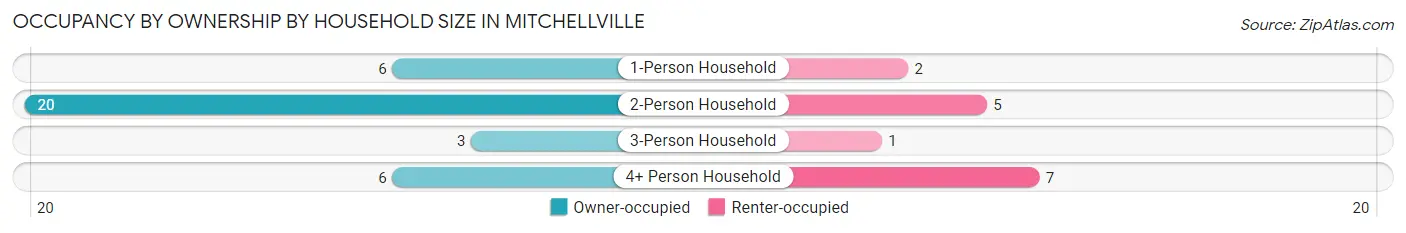
| Household Size | Owner-occupied | Renter-occupied |
| 1-Person Household | 6 (75.0%) | 2 (25.0%) |
| 2-Person Household | 20 (80.0%) | 5 (20.0%) |
| 3-Person Household | 3 (75.0%) | 1 (25.0%) |
| 4+ Person Household | 6 (46.2%) | 7 (53.8%) |
| Total Housing Units | 35 (70.0%) | 15 (30.0%) |
Occupancy by Educational Attainment in Mitchellville
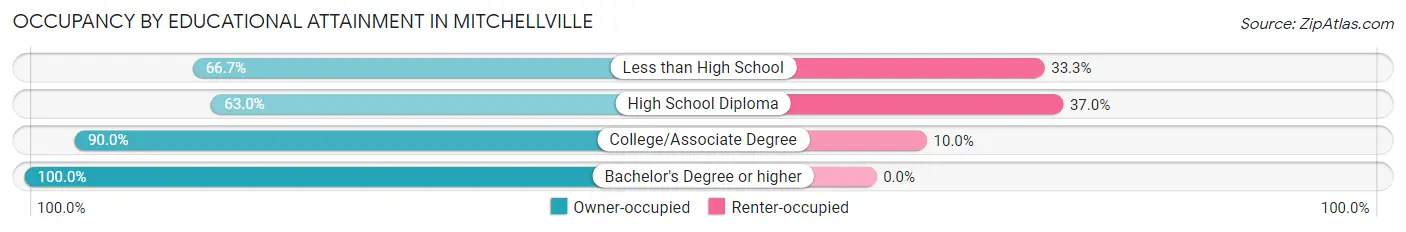
| Household Size | Owner-occupied | Renter-occupied |
| Less than High School | 8 (66.7%) | 4 (33.3%) |
| High School Diploma | 17 (63.0%) | 10 (37.0%) |
| College/Associate Degree | 9 (90.0%) | 1 (10.0%) |
| Bachelor's Degree or higher | 1 (100.0%) | 0 (0.0%) |
Occupancy by Age of Householder in Mitchellville
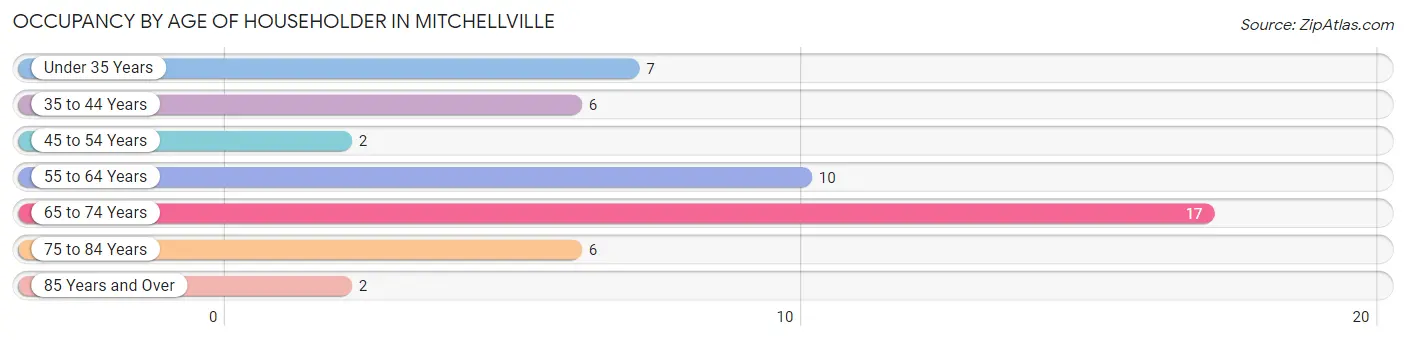
| Age Bracket | # Households | % Households |
| Under 35 Years | 7 | 14.0% |
| 35 to 44 Years | 6 | 12.0% |
| 45 to 54 Years | 2 | 4.0% |
| 55 to 64 Years | 10 | 20.0% |
| 65 to 74 Years | 17 | 34.0% |
| 75 to 84 Years | 6 | 12.0% |
| 85 Years and Over | 2 | 4.0% |
| Total | 50 | 100.0% |
Housing Finances in Mitchellville
Median Income by Occupancy in Mitchellville
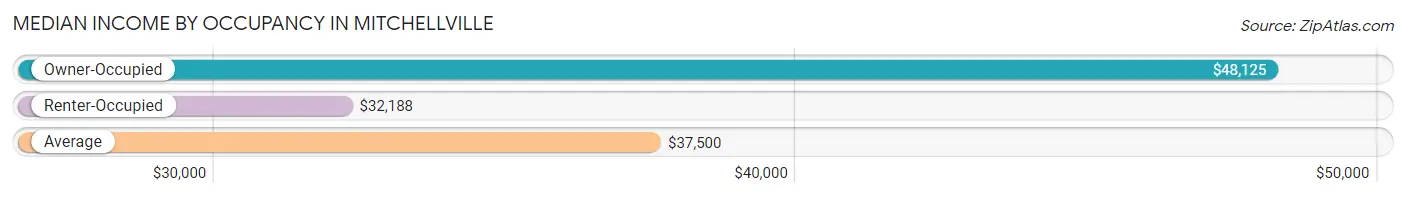
| Occupancy Type | # Households | Median Income |
| Owner-Occupied | 35 (70.0%) | $48,125 |
| Renter-Occupied | 15 (30.0%) | $32,188 |
| Average | 50 (100.0%) | $37,500 |
Occupancy by Householder Income Bracket in Mitchellville
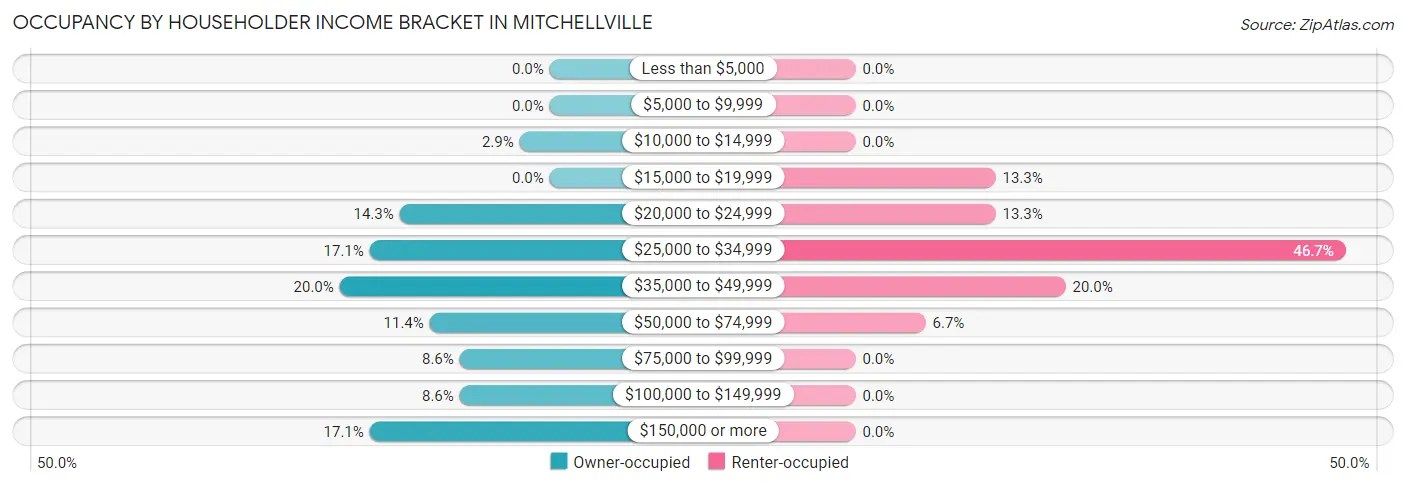
| Income Bracket | Owner-occupied | Renter-occupied |
| Less than $5,000 | 0 (0.0%) | 0 (0.0%) |
| $5,000 to $9,999 | 0 (0.0%) | 0 (0.0%) |
| $10,000 to $14,999 | 1 (2.9%) | 0 (0.0%) |
| $15,000 to $19,999 | 0 (0.0%) | 2 (13.3%) |
| $20,000 to $24,999 | 5 (14.3%) | 2 (13.3%) |
| $25,000 to $34,999 | 6 (17.1%) | 7 (46.7%) |
| $35,000 to $49,999 | 7 (20.0%) | 3 (20.0%) |
| $50,000 to $74,999 | 4 (11.4%) | 1 (6.7%) |
| $75,000 to $99,999 | 3 (8.6%) | 0 (0.0%) |
| $100,000 to $149,999 | 3 (8.6%) | 0 (0.0%) |
| $150,000 or more | 6 (17.1%) | 0 (0.0%) |
| Total | 35 (100.0%) | 15 (100.0%) |
Monthly Housing Cost Tiers in Mitchellville
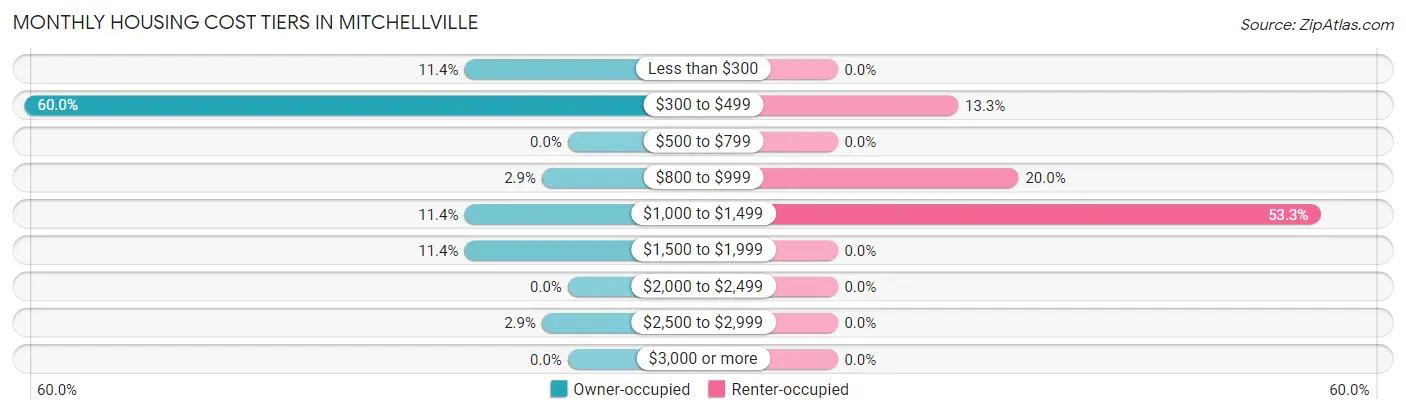
| Monthly Cost | Owner-occupied | Renter-occupied |
| Less than $300 | 4 (11.4%) | 0 (0.0%) |
| $300 to $499 | 21 (60.0%) | 2 (13.3%) |
| $500 to $799 | 0 (0.0%) | 0 (0.0%) |
| $800 to $999 | 1 (2.9%) | 3 (20.0%) |
| $1,000 to $1,499 | 4 (11.4%) | 8 (53.3%) |
| $1,500 to $1,999 | 4 (11.4%) | 0 (0.0%) |
| $2,000 to $2,499 | 0 (0.0%) | 0 (0.0%) |
| $2,500 to $2,999 | 1 (2.9%) | 0 (0.0%) |
| $3,000 or more | 0 (0.0%) | 0 (0.0%) |
| Total | 35 (100.0%) | 15 (100.0%) |
Physical Housing Characteristics in Mitchellville
Housing Structures in Mitchellville
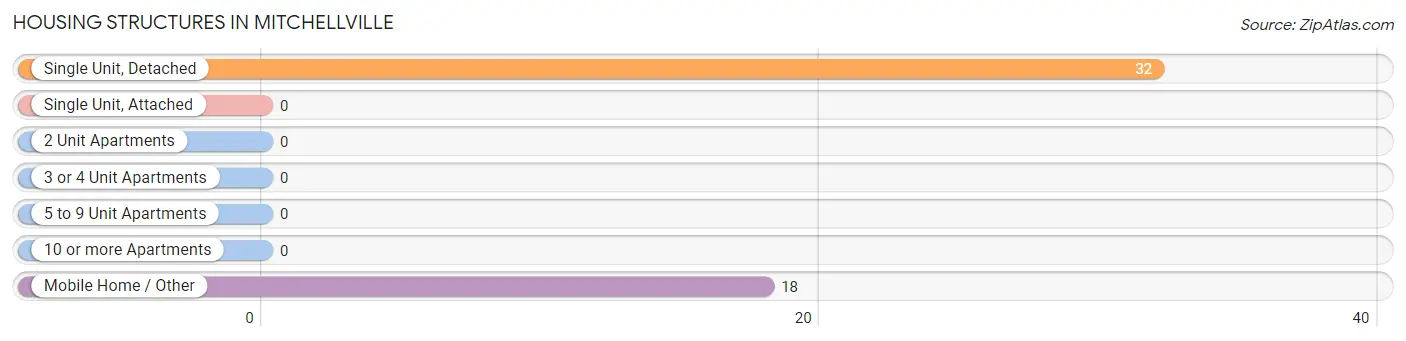
| Structure Type | # Housing Units | % Housing Units |
| Single Unit, Detached | 32 | 64.0% |
| Single Unit, Attached | 0 | 0.0% |
| 2 Unit Apartments | 0 | 0.0% |
| 3 or 4 Unit Apartments | 0 | 0.0% |
| 5 to 9 Unit Apartments | 0 | 0.0% |
| 10 or more Apartments | 0 | 0.0% |
| Mobile Home / Other | 18 | 36.0% |
| Total | 50 | 100.0% |
Housing Structures by Occupancy in Mitchellville
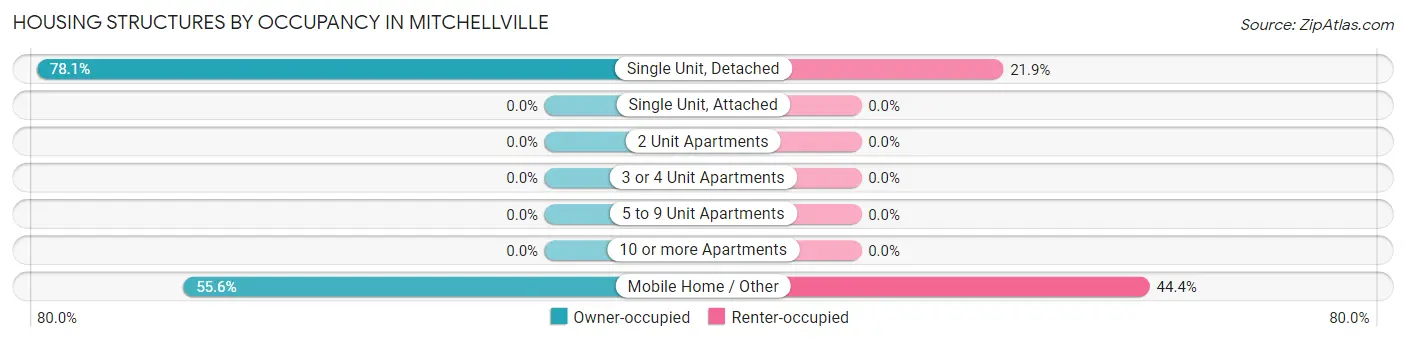
| Structure Type | Owner-occupied | Renter-occupied |
| Single Unit, Detached | 25 (78.1%) | 7 (21.9%) |
| Single Unit, Attached | 0 (0.0%) | 0 (0.0%) |
| 2 Unit Apartments | 0 (0.0%) | 0 (0.0%) |
| 3 or 4 Unit Apartments | 0 (0.0%) | 0 (0.0%) |
| 5 to 9 Unit Apartments | 0 (0.0%) | 0 (0.0%) |
| 10 or more Apartments | 0 (0.0%) | 0 (0.0%) |
| Mobile Home / Other | 10 (55.6%) | 8 (44.4%) |
| Total | 35 (70.0%) | 15 (30.0%) |
Housing Structures by Number of Rooms in Mitchellville
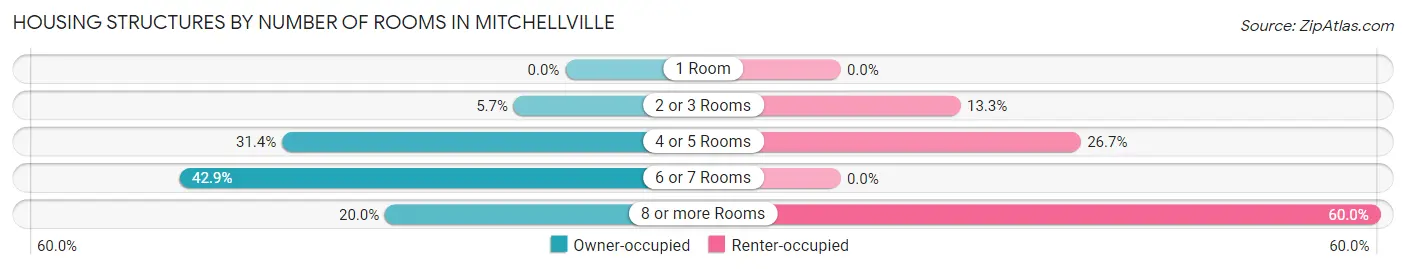
| Number of Rooms | Owner-occupied | Renter-occupied |
| 1 Room | 0 (0.0%) | 0 (0.0%) |
| 2 or 3 Rooms | 2 (5.7%) | 2 (13.3%) |
| 4 or 5 Rooms | 11 (31.4%) | 4 (26.7%) |
| 6 or 7 Rooms | 15 (42.9%) | 0 (0.0%) |
| 8 or more Rooms | 7 (20.0%) | 9 (60.0%) |
| Total | 35 (100.0%) | 15 (100.0%) |
Housing Structure by Heating Type in Mitchellville
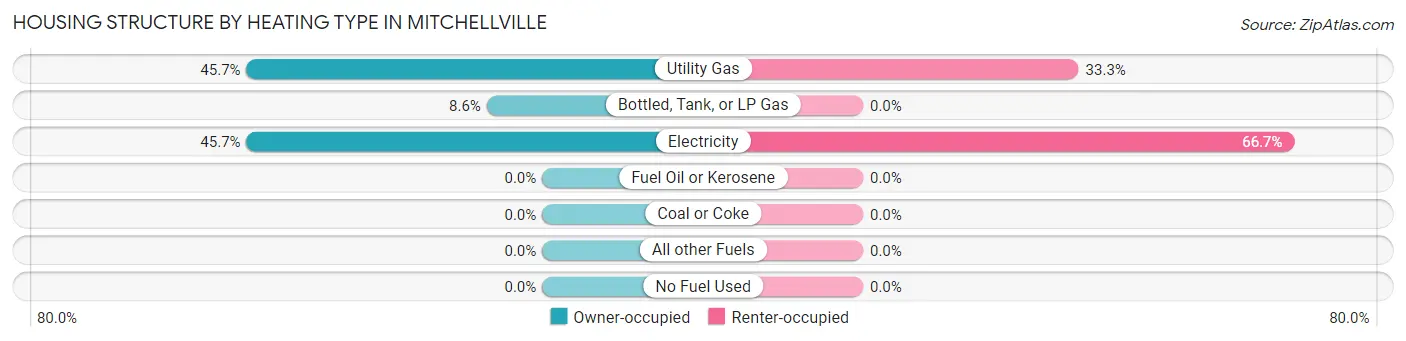
| Heating Type | Owner-occupied | Renter-occupied |
| Utility Gas | 16 (45.7%) | 5 (33.3%) |
| Bottled, Tank, or LP Gas | 3 (8.6%) | 0 (0.0%) |
| Electricity | 16 (45.7%) | 10 (66.7%) |
| Fuel Oil or Kerosene | 0 (0.0%) | 0 (0.0%) |
| Coal or Coke | 0 (0.0%) | 0 (0.0%) |
| All other Fuels | 0 (0.0%) | 0 (0.0%) |
| No Fuel Used | 0 (0.0%) | 0 (0.0%) |
| Total | 35 (100.0%) | 15 (100.0%) |
Household Vehicle Usage in Mitchellville
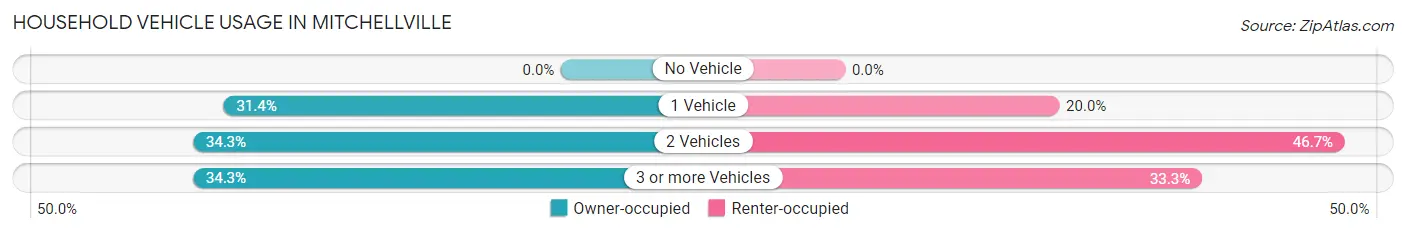
| Vehicles per Household | Owner-occupied | Renter-occupied |
| No Vehicle | 0 (0.0%) | 0 (0.0%) |
| 1 Vehicle | 11 (31.4%) | 3 (20.0%) |
| 2 Vehicles | 12 (34.3%) | 7 (46.7%) |
| 3 or more Vehicles | 12 (34.3%) | 5 (33.3%) |
| Total | 35 (100.0%) | 15 (100.0%) |
Real Estate & Mortgages in Mitchellville
Real Estate and Mortgage Overview in Mitchellville
| Characteristic | Without Mortgage | With Mortgage |
| Housing Units | 27 | 8 |
| Median Property Value | $115,600 | $158,300 |
| Median Household Income | $41,875 | $4 |
| Monthly Housing Costs | $439 | $0 |
| Real Estate Taxes | $467 | $3 |
Property Value by Mortgage Status in Mitchellville
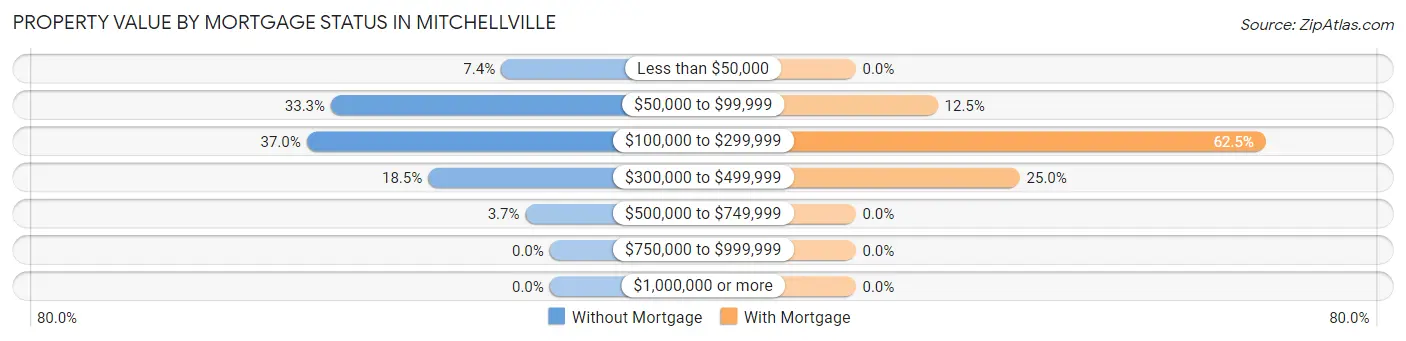
| Property Value | Without Mortgage | With Mortgage |
| Less than $50,000 | 2 (7.4%) | 0 (0.0%) |
| $50,000 to $99,999 | 9 (33.3%) | 1 (12.5%) |
| $100,000 to $299,999 | 10 (37.0%) | 5 (62.5%) |
| $300,000 to $499,999 | 5 (18.5%) | 2 (25.0%) |
| $500,000 to $749,999 | 1 (3.7%) | 0 (0.0%) |
| $750,000 to $999,999 | 0 (0.0%) | 0 (0.0%) |
| $1,000,000 or more | 0 (0.0%) | 0 (0.0%) |
| Total | 27 (100.0%) | 8 (100.0%) |
Household Income by Mortgage Status in Mitchellville
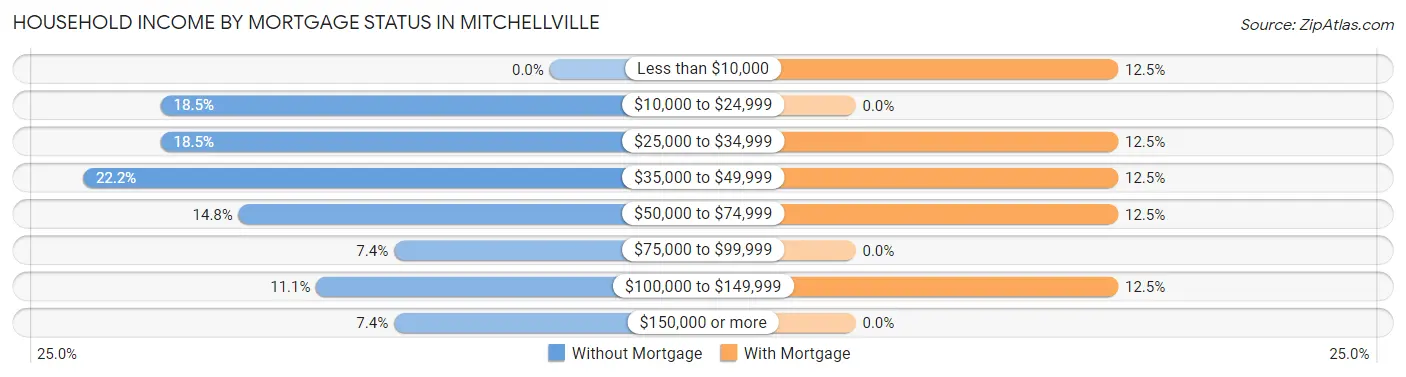
| Household Income | Without Mortgage | With Mortgage |
| Less than $10,000 | 0 (0.0%) | 1 (12.5%) |
| $10,000 to $24,999 | 5 (18.5%) | 0 (0.0%) |
| $25,000 to $34,999 | 5 (18.5%) | 1 (12.5%) |
| $35,000 to $49,999 | 6 (22.2%) | 1 (12.5%) |
| $50,000 to $74,999 | 4 (14.8%) | 1 (12.5%) |
| $75,000 to $99,999 | 2 (7.4%) | 0 (0.0%) |
| $100,000 to $149,999 | 3 (11.1%) | 1 (12.5%) |
| $150,000 or more | 2 (7.4%) | 0 (0.0%) |
| Total | 27 (100.0%) | 8 (100.0%) |
Property Value to Household Income Ratio in Mitchellville
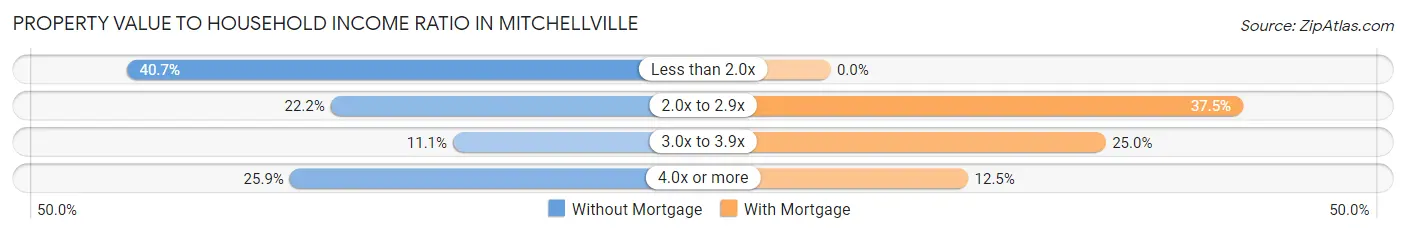
| Value-to-Income Ratio | Without Mortgage | With Mortgage |
| Less than 2.0x | 11 (40.7%) | 0 (0.0%) |
| 2.0x to 2.9x | 6 (22.2%) | 3 (37.5%) |
| 3.0x to 3.9x | 3 (11.1%) | 2 (25.0%) |
| 4.0x or more | 7 (25.9%) | 1 (12.5%) |
| Total | 27 (100.0%) | 8 (100.0%) |
Real Estate Taxes by Mortgage Status in Mitchellville
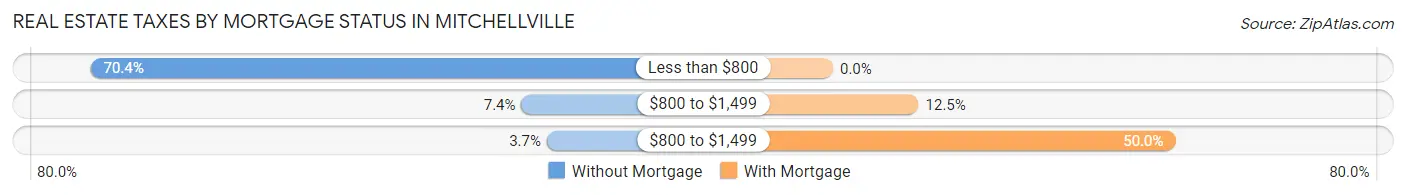
| Property Taxes | Without Mortgage | With Mortgage |
| Less than $800 | 19 (70.4%) | 0 (0.0%) |
| $800 to $1,499 | 2 (7.4%) | 1 (12.5%) |
| $800 to $1,499 | 1 (3.7%) | 4 (50.0%) |
| Total | 27 (100.0%) | 8 (100.0%) |
Health & Disability in Mitchellville
Health Insurance Coverage by Age in Mitchellville
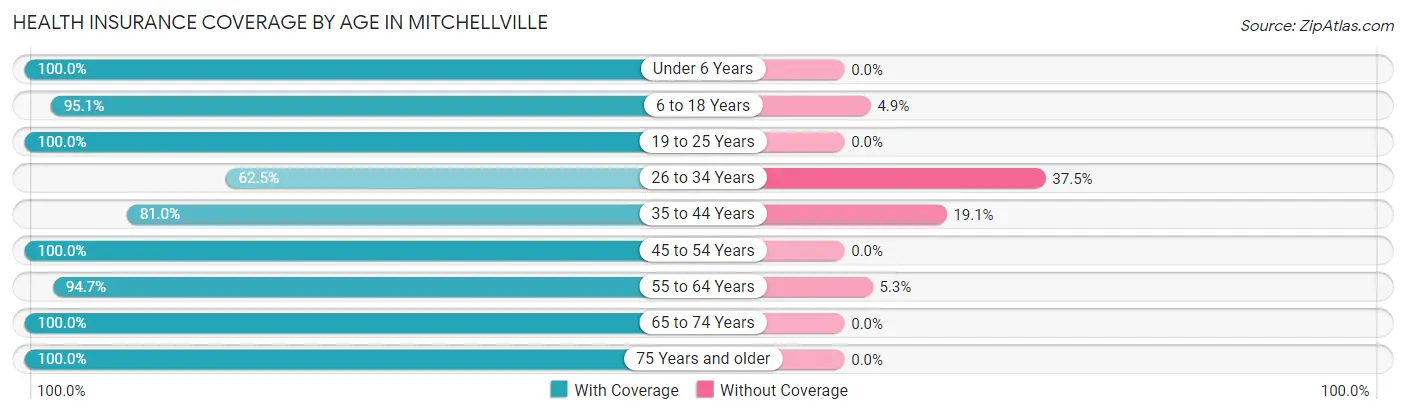
| Age Bracket | With Coverage | Without Coverage |
| Under 6 Years | 3 (100.0%) | 0 (0.0%) |
| 6 to 18 Years | 39 (95.1%) | 2 (4.9%) |
| 19 to 25 Years | 1 (100.0%) | 0 (0.0%) |
| 26 to 34 Years | 10 (62.5%) | 6 (37.5%) |
| 35 to 44 Years | 17 (80.9%) | 4 (19.1%) |
| 45 to 54 Years | 7 (100.0%) | 0 (0.0%) |
| 55 to 64 Years | 18 (94.7%) | 1 (5.3%) |
| 65 to 74 Years | 29 (100.0%) | 0 (0.0%) |
| 75 Years and older | 11 (100.0%) | 0 (0.0%) |
| Total | 135 (91.2%) | 13 (8.8%) |
Health Insurance Coverage by Citizenship Status in Mitchellville
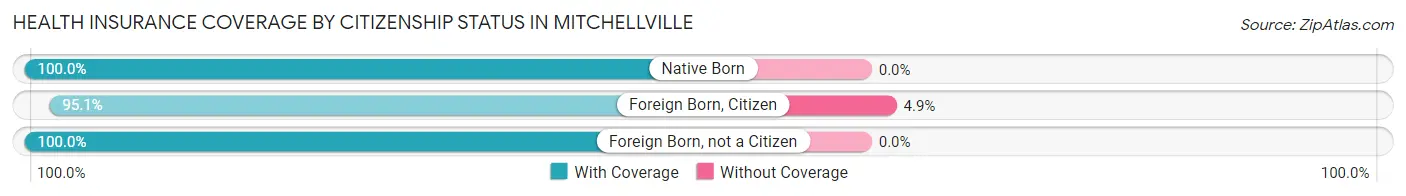
| Citizenship Status | With Coverage | Without Coverage |
| Native Born | 3 (100.0%) | 0 (0.0%) |
| Foreign Born, Citizen | 39 (95.1%) | 2 (4.9%) |
| Foreign Born, not a Citizen | 1 (100.0%) | 0 (0.0%) |
Health Insurance Coverage by Household Income in Mitchellville
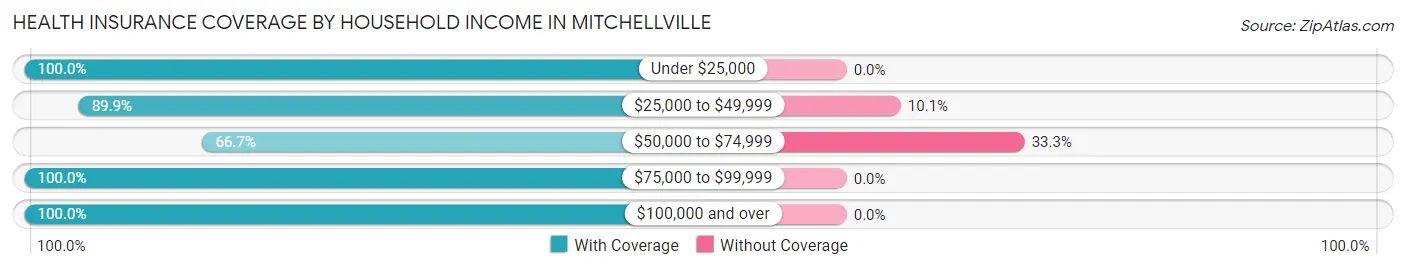
| Household Income | With Coverage | Without Coverage |
| Under $25,000 | 28 (100.0%) | 0 (0.0%) |
| $25,000 to $49,999 | 62 (89.9%) | 7 (10.1%) |
| $50,000 to $74,999 | 12 (66.7%) | 6 (33.3%) |
| $75,000 to $99,999 | 5 (100.0%) | 0 (0.0%) |
| $100,000 and over | 28 (100.0%) | 0 (0.0%) |
Public vs Private Health Insurance Coverage by Age in Mitchellville
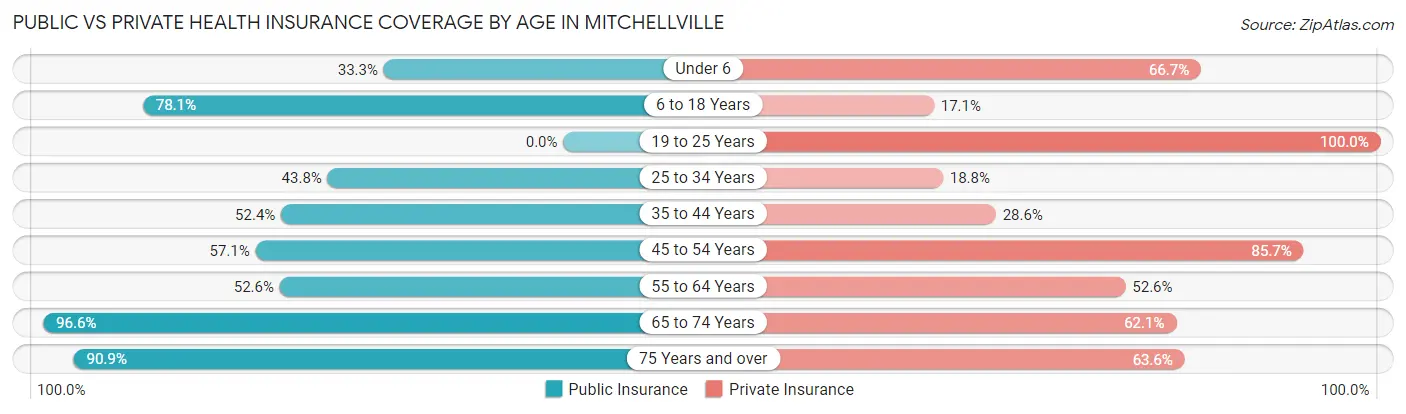
| Age Bracket | Public Insurance | Private Insurance |
| Under 6 | 1 (33.3%) | 2 (66.7%) |
| 6 to 18 Years | 32 (78.0%) | 7 (17.1%) |
| 19 to 25 Years | 0 (0.0%) | 1 (100.0%) |
| 25 to 34 Years | 7 (43.8%) | 3 (18.8%) |
| 35 to 44 Years | 11 (52.4%) | 6 (28.6%) |
| 45 to 54 Years | 4 (57.1%) | 6 (85.7%) |
| 55 to 64 Years | 10 (52.6%) | 10 (52.6%) |
| 65 to 74 Years | 28 (96.6%) | 18 (62.1%) |
| 75 Years and over | 10 (90.9%) | 7 (63.6%) |
| Total | 103 (69.6%) | 60 (40.5%) |
Disability Status by Sex by Age in Mitchellville
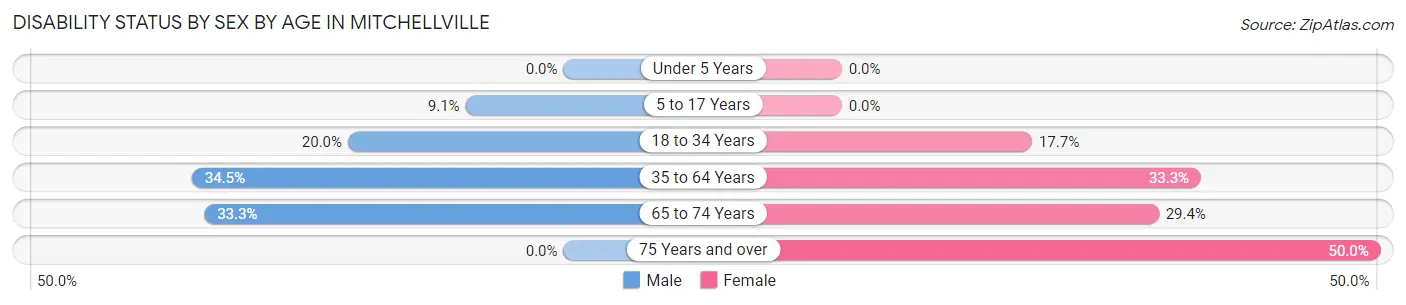
| Age Bracket | Male | Female |
| Under 5 Years | 0 (0.0%) | 0 (0.0%) |
| 5 to 17 Years | 2 (9.1%) | 0 (0.0%) |
| 18 to 34 Years | 1 (20.0%) | 3 (17.6%) |
| 35 to 64 Years | 10 (34.5%) | 6 (33.3%) |
| 65 to 74 Years | 4 (33.3%) | 5 (29.4%) |
| 75 Years and over | 0 (0.0%) | 5 (50.0%) |
Disability Class by Sex by Age in Mitchellville
Disability Class: Hearing Difficulty
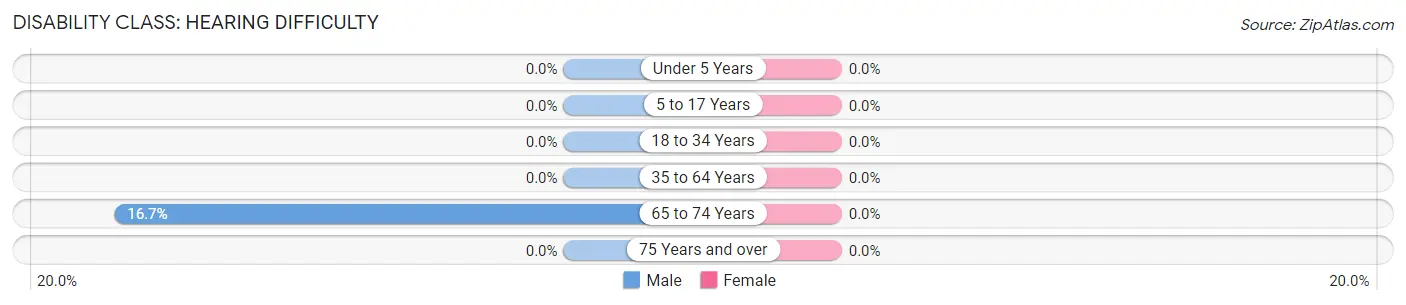
| Age Bracket | Male | Female |
| Under 5 Years | 0 (0.0%) | 0 (0.0%) |
| 5 to 17 Years | 0 (0.0%) | 0 (0.0%) |
| 18 to 34 Years | 0 (0.0%) | 0 (0.0%) |
| 35 to 64 Years | 0 (0.0%) | 0 (0.0%) |
| 65 to 74 Years | 2 (16.7%) | 0 (0.0%) |
| 75 Years and over | 0 (0.0%) | 0 (0.0%) |
Disability Class: Vision Difficulty
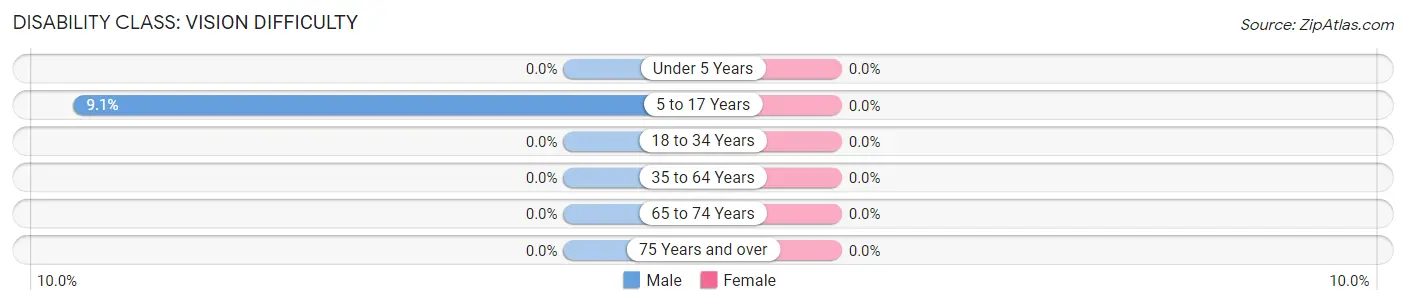
| Age Bracket | Male | Female |
| Under 5 Years | 0 (0.0%) | 0 (0.0%) |
| 5 to 17 Years | 2 (9.1%) | 0 (0.0%) |
| 18 to 34 Years | 0 (0.0%) | 0 (0.0%) |
| 35 to 64 Years | 0 (0.0%) | 0 (0.0%) |
| 65 to 74 Years | 0 (0.0%) | 0 (0.0%) |
| 75 Years and over | 0 (0.0%) | 0 (0.0%) |
Disability Class: Cognitive Difficulty
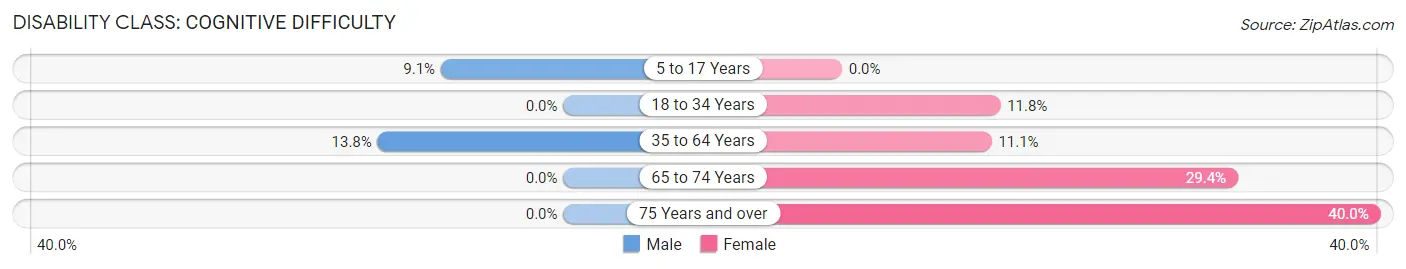
| Age Bracket | Male | Female |
| 5 to 17 Years | 2 (9.1%) | 0 (0.0%) |
| 18 to 34 Years | 0 (0.0%) | 2 (11.8%) |
| 35 to 64 Years | 4 (13.8%) | 2 (11.1%) |
| 65 to 74 Years | 0 (0.0%) | 5 (29.4%) |
| 75 Years and over | 0 (0.0%) | 4 (40.0%) |
Disability Class: Ambulatory Difficulty
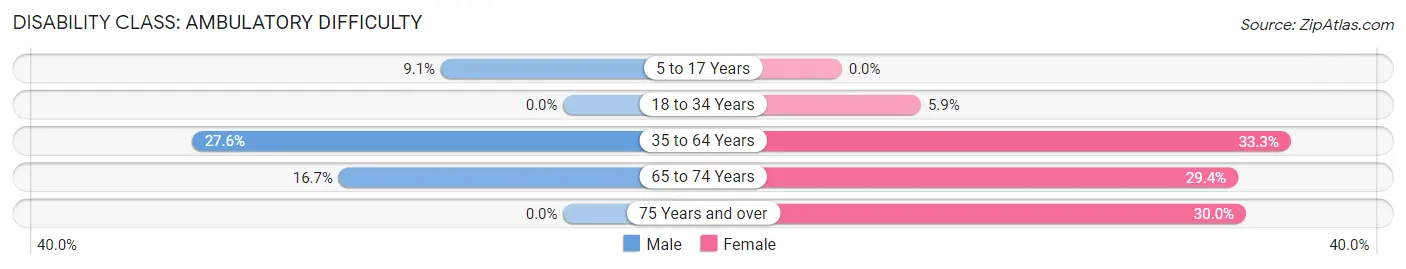
| Age Bracket | Male | Female |
| 5 to 17 Years | 2 (9.1%) | 0 (0.0%) |
| 18 to 34 Years | 0 (0.0%) | 1 (5.9%) |
| 35 to 64 Years | 8 (27.6%) | 6 (33.3%) |
| 65 to 74 Years | 2 (16.7%) | 5 (29.4%) |
| 75 Years and over | 0 (0.0%) | 3 (30.0%) |
Disability Class: Self-Care Difficulty
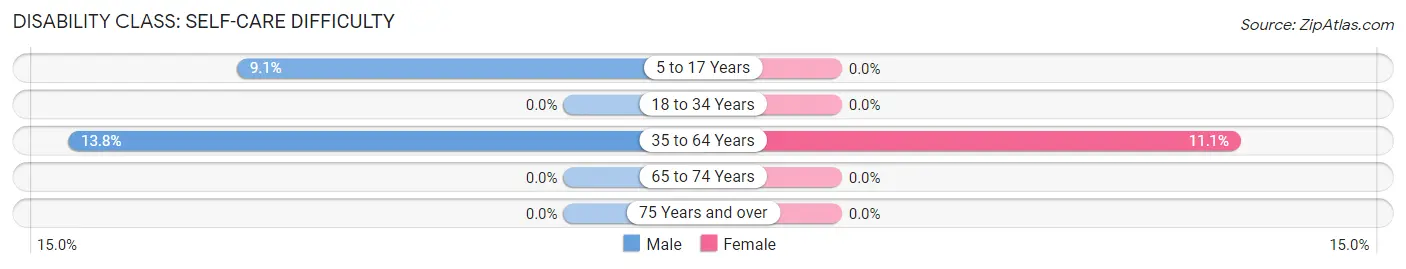
| Age Bracket | Male | Female |
| 5 to 17 Years | 2 (9.1%) | 0 (0.0%) |
| 18 to 34 Years | 0 (0.0%) | 0 (0.0%) |
| 35 to 64 Years | 4 (13.8%) | 2 (11.1%) |
| 65 to 74 Years | 0 (0.0%) | 0 (0.0%) |
| 75 Years and over | 0 (0.0%) | 0 (0.0%) |
Technology Access in Mitchellville
Computing Device Access in Mitchellville
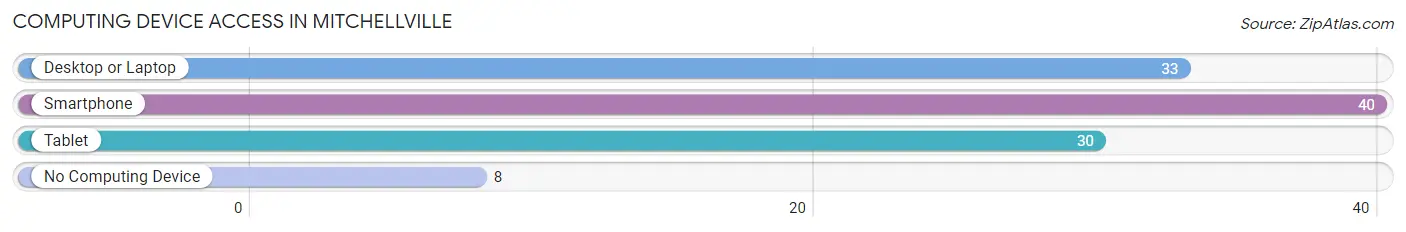
| Device Type | # Households | % Households |
| Desktop or Laptop | 33 | 66.0% |
| Smartphone | 40 | 80.0% |
| Tablet | 30 | 60.0% |
| No Computing Device | 8 | 16.0% |
| Total | 50 | 100.0% |
Internet Access in Mitchellville
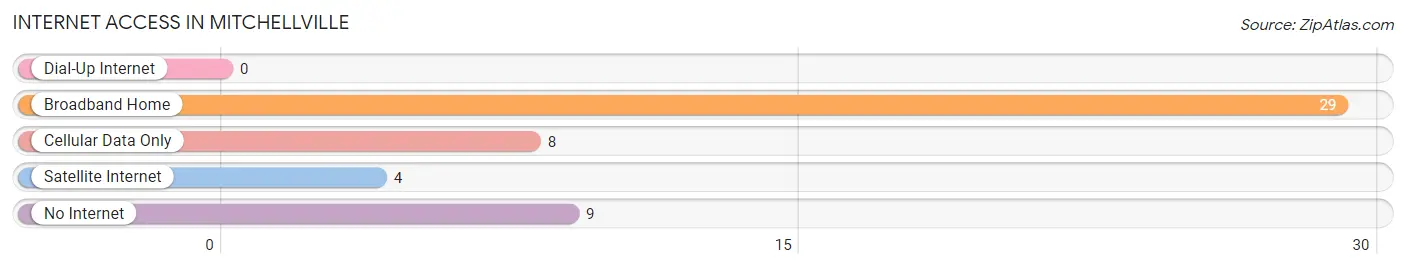
| Internet Type | # Households | % Households |
| Dial-Up Internet | 0 | 0.0% |
| Broadband Home | 29 | 58.0% |
| Cellular Data Only | 8 | 16.0% |
| Satellite Internet | 4 | 8.0% |
| No Internet | 9 | 18.0% |
| Total | 50 | 100.0% |
Mitchellville Summary
Mitchellville is a small town located in the state of Tennessee, in the United States of America. It is situated in the western part of the state, in the foothills of the Appalachian Mountains. The town is located in the county of Dickson, and is part of the Nashville metropolitan area. The population of Mitchellville was estimated to be 1,845 in the year 2020.
History
The town of Mitchellville was founded in 1820 by William Mitchell, a Revolutionary War veteran. The town was named after him, and it was the first settlement in the area. The town was originally a farming community, and it was known for its production of tobacco, corn, and other crops. The town was also known for its iron ore deposits, which were mined and used to make tools and weapons.
In the late 19th century, the town began to grow and develop. The railroad was built through the town, and it became a major transportation hub. The town also became a popular tourist destination, as it was close to the Great Smoky Mountains National Park.
In the early 20th century, the town began to decline. The railroad was abandoned, and the iron ore deposits were depleted. The town was also hit hard by the Great Depression, and many of the businesses in the town closed.
Geography
Mitchellville is located in the western part of Tennessee, in the foothills of the Appalachian Mountains. The town is situated in the county of Dickson, and is part of the Nashville metropolitan area. The town is located at an elevation of 890 feet above sea level.
The town is located in a hilly area, and the terrain is mostly forested. The town is surrounded by the Great Smoky Mountains National Park, and the town is located near the banks of the Cumberland River.
Economy
The economy of Mitchellville is largely based on tourism. The town is located near the Great Smoky Mountains National Park, and it is a popular destination for tourists. The town also has a number of small businesses, including restaurants, shops, and other services.
The town is also home to a number of manufacturing companies, including a furniture factory and a paper mill. The town is also home to a number of farms, which produce corn, tobacco, and other crops.
Demographics
The population of Mitchellville was estimated to be 1,845 in the year 2020. The town has a population that is mostly white, with a small percentage of African Americans and other minorities. The median age of the population is 44.7 years, and the median household income is $41,945.
Conclusion
Mitchellville is a small town located in the state of Tennessee, in the United States of America. The town was founded in 1820 by William Mitchell, and it was the first settlement in the area. The town is located in the western part of the state, in the foothills of the Appalachian Mountains. The population of Mitchellville was estimated to be 1,845 in the year 2020. The economy of Mitchellville is largely based on tourism, and the town is home to a number of small businesses and manufacturing companies. The town has a population that is mostly white, with a small percentage of African Americans and other minorities.
Common Questions
What is Per Capita Income in Mitchellville?
Per Capita income in Mitchellville is $19,989.
What is the Median Family Income in Mitchellville?
Median Family Income in Mitchellville is $35,625.
What is the Median Household income in Mitchellville?
Median Household Income in Mitchellville is $37,500.
What is Inequality or Gini Index in Mitchellville?
Inequality or Gini Index in Mitchellville is 0.40.
What is the Total Population of Mitchellville?
Total Population of Mitchellville is 148.
What is the Total Male Population of Mitchellville?
Total Male Population of Mitchellville is 70.
What is the Total Female Population of Mitchellville?
Total Female Population of Mitchellville is 78.
What is the Ratio of Males per 100 Females in Mitchellville?
There are 89.74 Males per 100 Females in Mitchellville.
What is the Ratio of Females per 100 Males in Mitchellville?
There are 111.43 Females per 100 Males in Mitchellville.
What is the Median Population Age in Mitchellville?
Median Population Age in Mitchellville is 38.7 Years.
What is the Average Family Size in Mitchellville
Average Family Size in Mitchellville is 3.4 People.
What is the Average Household Size in Mitchellville
Average Household Size in Mitchellville is 3.0 People.
How Large is the Labor Force in Mitchellville?
There are 54 People in the Labor Forcein in Mitchellville.
What is the Percentage of People in the Labor Force in Mitchellville?
44.3% of People are in the Labor Force in Mitchellville.
What is the Unemployment Rate in Mitchellville?
Unemployment Rate in Mitchellville is 3.7%.