Zip Codes with the Highest Percentage of Population Employed in Administrative & Support Services in Cookeville, TN
RELATED REPORTS & OPTIONS
Administrative & Support Services
Cookeville
Compare Zip Codes
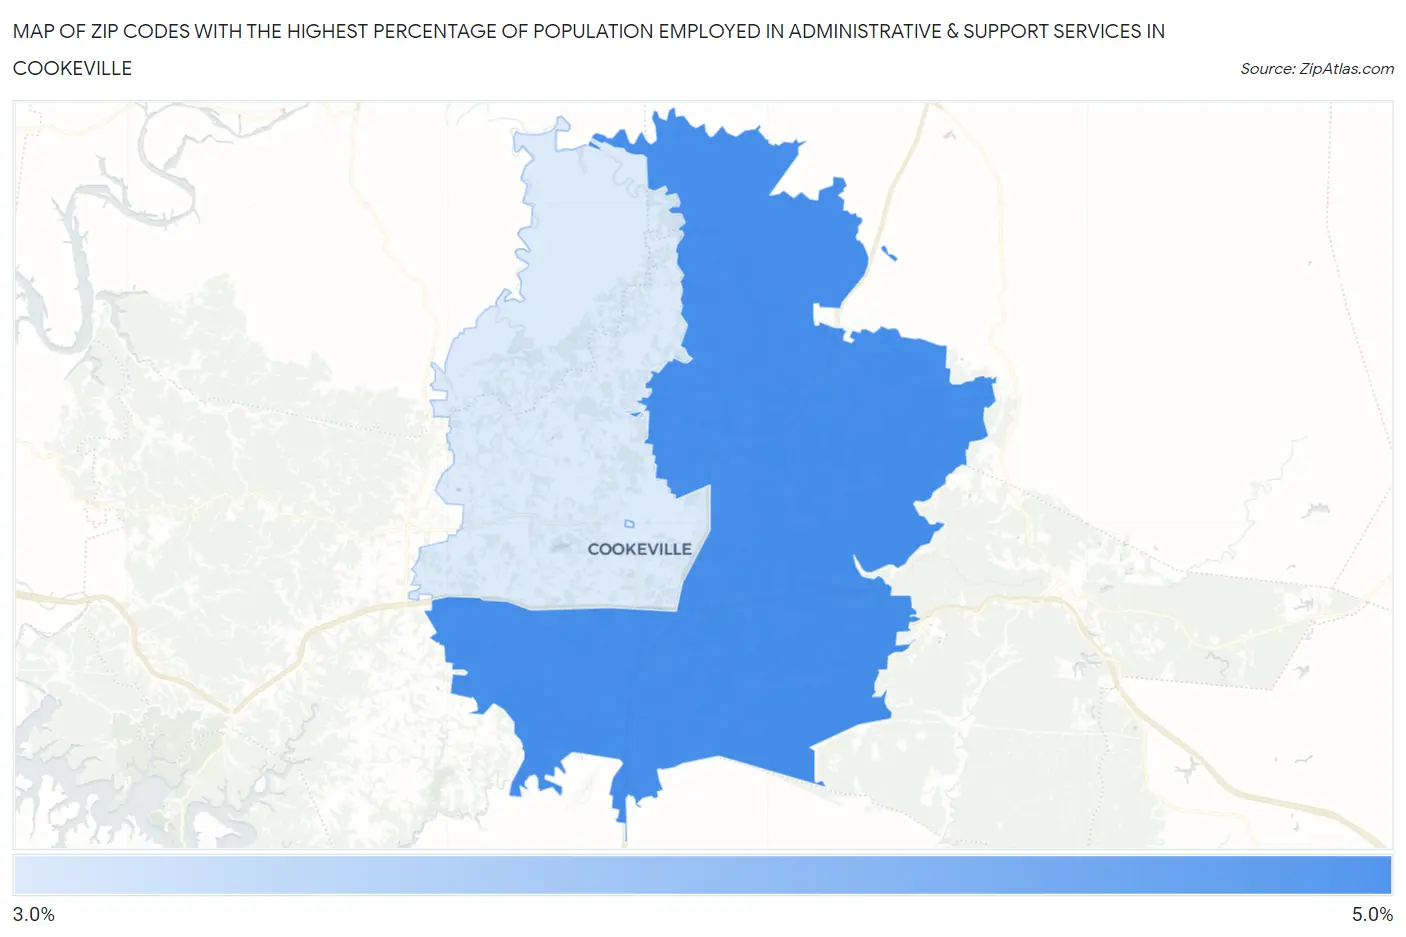
Map of Zip Codes with the Highest Percentage of Population Employed in Administrative & Support Services in Cookeville
3.3%
4.7%
Zip Codes with the Highest Percentage of Population Employed in Administrative & Support Services in Cookeville, TN
| Zip Code | % Employed | vs State | vs National | |
| 1. | 38506 | 4.7% | 4.4%(+0.334)#163 | 4.1%(+0.537)#8,075 |
| 2. | 38501 | 3.3% | 4.4%(-1.05)#302 | 4.1%(-0.849)#13,932 |
1
Common Questions
What are the Top Zip Codes with the Highest Percentage of Population Employed in Administrative & Support Services in Cookeville, TN?
Top Zip Codes with the Highest Percentage of Population Employed in Administrative & Support Services in Cookeville, TN are:
What zip code has the Highest Percentage of Population Employed in Administrative & Support Services in Cookeville, TN?
38506 has the Highest Percentage of Population Employed in Administrative & Support Services in Cookeville, TN with 4.7%.
What is the Percentage of Population Employed in Administrative & Support Services in Cookeville, TN?
Percentage of Population Employed in Administrative & Support Services in Cookeville is 3.1%.
What is the Percentage of Population Employed in Administrative & Support Services in Tennessee?
Percentage of Population Employed in Administrative & Support Services in Tennessee is 4.4%.
What is the Percentage of Population Employed in Administrative & Support Services in the United States?
Percentage of Population Employed in Administrative & Support Services in the United States is 4.1%.