Zip Codes with the Highest Percentage of Population Employed in Administrative & Support Services in Jackson, TN
RELATED REPORTS & OPTIONS
Administrative & Support Services
Jackson
Compare Zip Codes
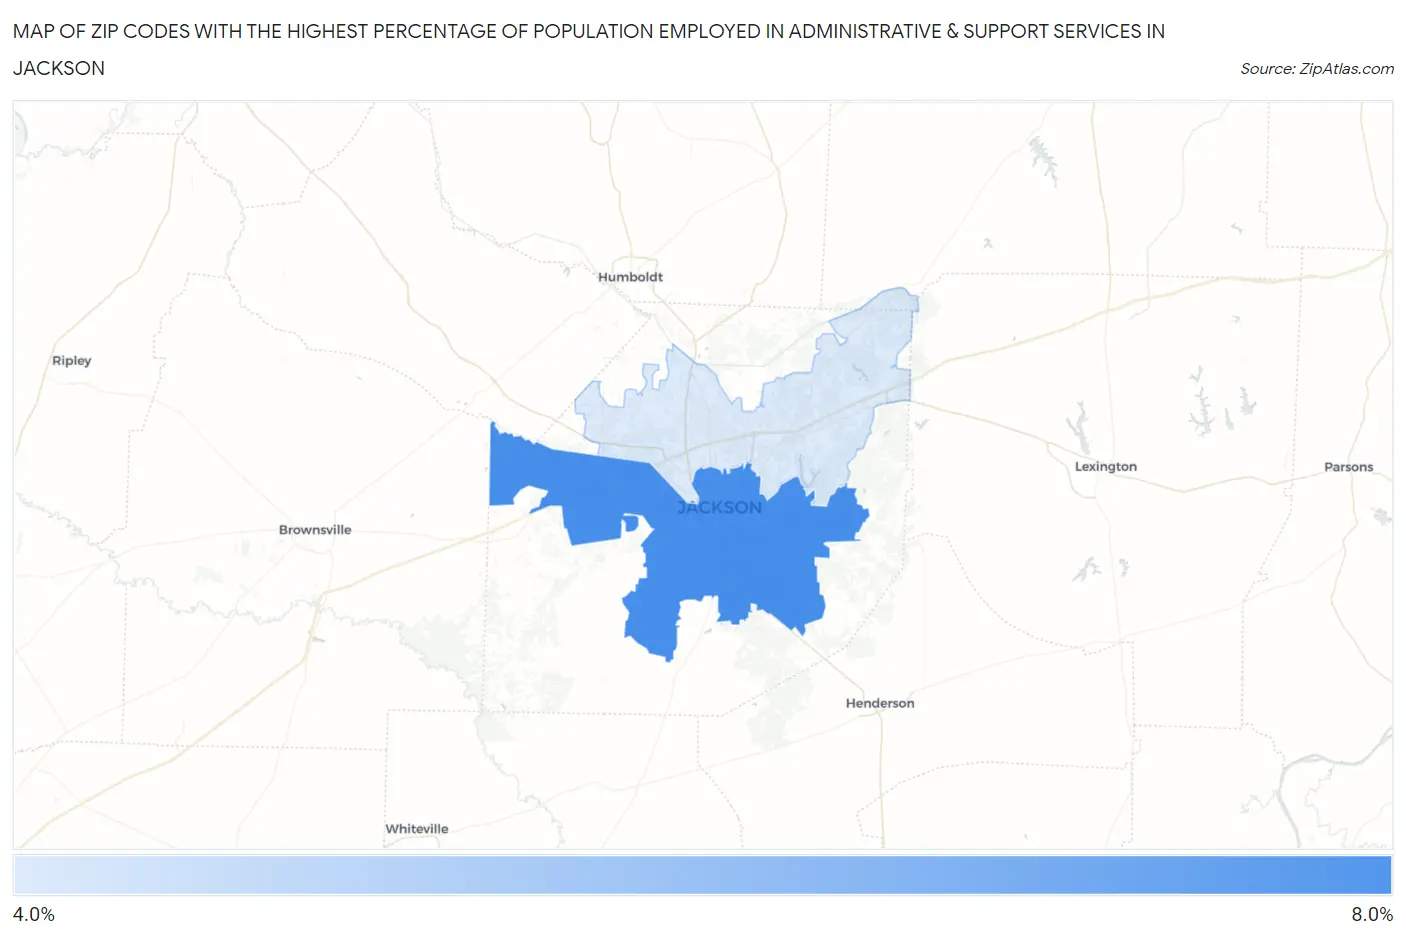
Map of Zip Codes with the Highest Percentage of Population Employed in Administrative & Support Services in Jackson
4.4%
7.7%
Zip Codes with the Highest Percentage of Population Employed in Administrative & Support Services in Jackson, TN
| Zip Code | % Employed | vs State | vs National | |
| 1. | 38301 | 7.7% | 4.4%(+3.32)#52 | 4.1%(+3.53)#2,530 |
| 2. | 38305 | 4.4% | 4.4%(+0.060)#195 | 4.1%(+0.263)#9,024 |
1
Common Questions
What are the Top Zip Codes with the Highest Percentage of Population Employed in Administrative & Support Services in Jackson, TN?
Top Zip Codes with the Highest Percentage of Population Employed in Administrative & Support Services in Jackson, TN are:
What zip code has the Highest Percentage of Population Employed in Administrative & Support Services in Jackson, TN?
38301 has the Highest Percentage of Population Employed in Administrative & Support Services in Jackson, TN with 7.7%.
What is the Percentage of Population Employed in Administrative & Support Services in Jackson, TN?
Percentage of Population Employed in Administrative & Support Services in Jackson is 5.5%.
What is the Percentage of Population Employed in Administrative & Support Services in Tennessee?
Percentage of Population Employed in Administrative & Support Services in Tennessee is 4.4%.
What is the Percentage of Population Employed in Administrative & Support Services in the United States?
Percentage of Population Employed in Administrative & Support Services in the United States is 4.1%.