Zip Codes with the Highest Percentage of Population Employed in Administrative & Support Services in Nashville, TN
RELATED REPORTS & OPTIONS
Administrative & Support Services
Nashville
Compare Zip Codes
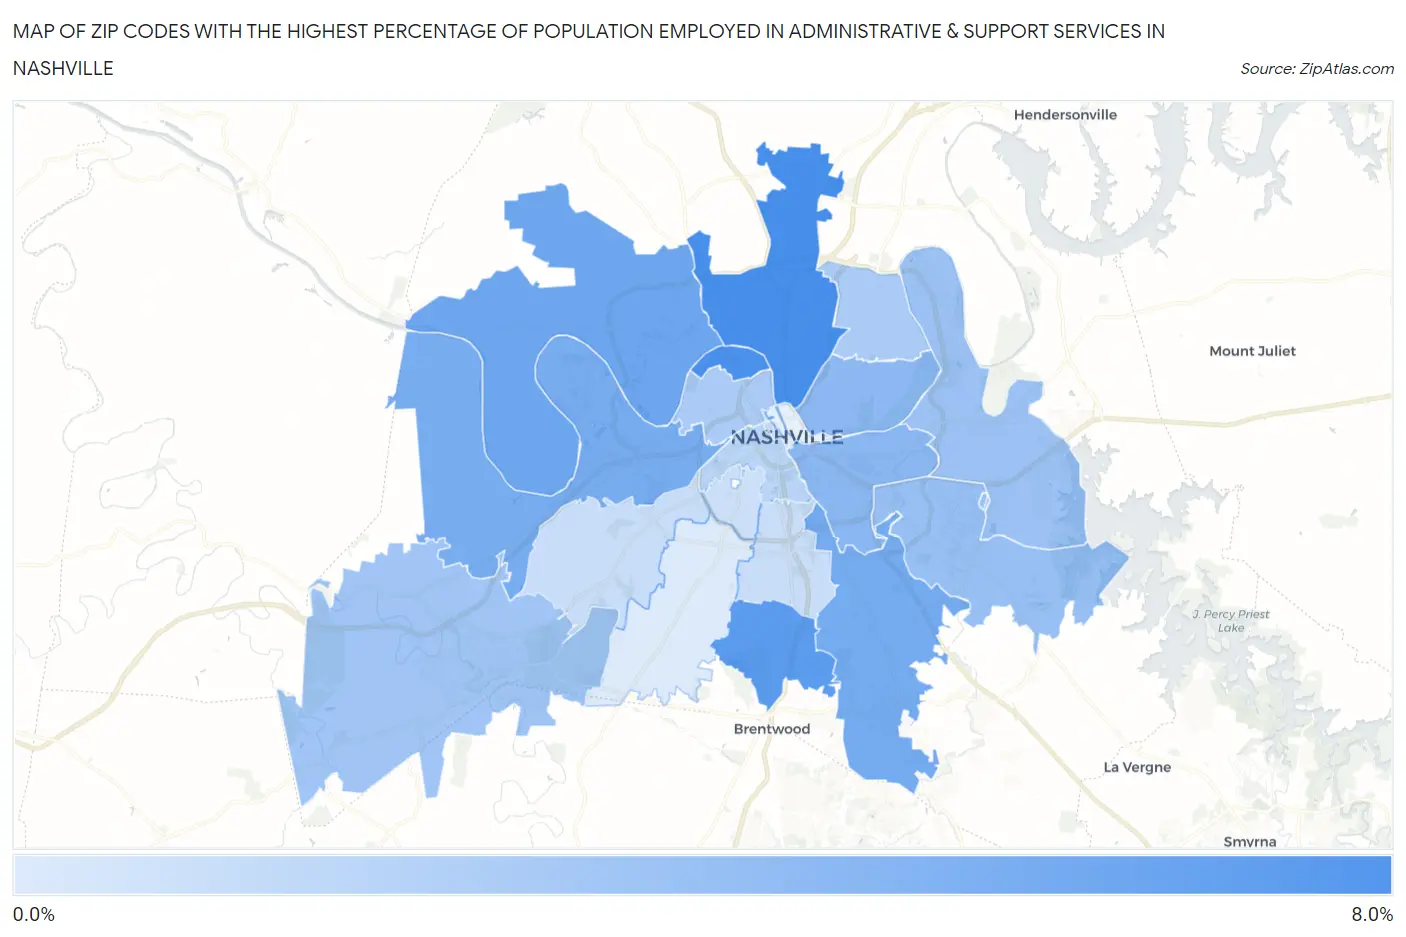
Map of Zip Codes with the Highest Percentage of Population Employed in Administrative & Support Services in Nashville
1.3%
7.2%
Zip Codes with the Highest Percentage of Population Employed in Administrative & Support Services in Nashville, TN
| Zip Code | % Employed | vs State | vs National | |
| 1. | 37207 | 7.2% | 4.4%(+2.90)#65 | 4.1%(+3.10)#2,939 |
| 2. | 37228 | 7.1% | 4.4%(+2.74)#70 | 4.1%(+2.94)#3,115 |
| 3. | 37220 | 6.5% | 4.4%(+2.14)#87 | 4.1%(+2.34)#3,914 |
| 4. | 37218 | 5.6% | 4.4%(+1.27)#120 | 4.1%(+1.47)#5,555 |
| 5. | 37211 | 5.3% | 4.4%(+0.987)#133 | 4.1%(+1.19)#6,224 |
| 6. | 37209 | 5.3% | 4.4%(+0.908)#135 | 4.1%(+1.11)#6,442 |
| 7. | 37210 | 4.5% | 4.4%(+0.163)#188 | 4.1%(+0.366)#8,673 |
| 8. | 37206 | 4.4% | 4.4%(+0.066)#192 | 4.1%(+0.269)#9,000 |
| 9. | 37217 | 4.0% | 4.4%(-0.327)#228 | 4.1%(-0.124)#10,588 |
| 10. | 37214 | 3.8% | 4.4%(-0.560)#250 | 4.1%(-0.358)#11,568 |
| 11. | 37221 | 3.6% | 4.4%(-0.754)#274 | 4.1%(-0.551)#12,481 |
| 12. | 37208 | 3.2% | 4.4%(-1.13)#315 | 4.1%(-0.925)#14,356 |
| 13. | 37216 | 3.2% | 4.4%(-1.14)#318 | 4.1%(-0.932)#14,384 |
| 14. | 37203 | 2.7% | 4.4%(-1.69)#377 | 4.1%(-1.49)#17,275 |
| 15. | 37205 | 2.1% | 4.4%(-2.25)#421 | 4.1%(-2.05)#20,127 |
| 16. | 37204 | 2.0% | 4.4%(-2.31)#426 | 4.1%(-2.10)#20,391 |
| 17. | 37212 | 1.9% | 4.4%(-2.48)#437 | 4.1%(-2.28)#21,202 |
| 18. | 37219 | 1.9% | 4.4%(-2.49)#438 | 4.1%(-2.29)#21,240 |
| 19. | 37215 | 1.3% | 4.4%(-3.07)#483 | 4.1%(-2.87)#23,591 |
1
Common Questions
What are the Top 10 Zip Codes with the Highest Percentage of Population Employed in Administrative & Support Services in Nashville, TN?
Top 10 Zip Codes with the Highest Percentage of Population Employed in Administrative & Support Services in Nashville, TN are:
What zip code has the Highest Percentage of Population Employed in Administrative & Support Services in Nashville, TN?
37207 has the Highest Percentage of Population Employed in Administrative & Support Services in Nashville, TN with 7.2%.
What is the Percentage of Population Employed in Administrative & Support Services in Nashville, TN?
Percentage of Population Employed in Administrative & Support Services in Nashville is 4.4%.
What is the Percentage of Population Employed in Administrative & Support Services in Tennessee?
Percentage of Population Employed in Administrative & Support Services in Tennessee is 4.4%.
What is the Percentage of Population Employed in Administrative & Support Services in the United States?
Percentage of Population Employed in Administrative & Support Services in the United States is 4.1%.