Zip Codes with the Highest Percentage of Population Employed in Administrative & Support Services in Morristown, TN
RELATED REPORTS & OPTIONS
Administrative & Support Services
Morristown
Compare Zip Codes
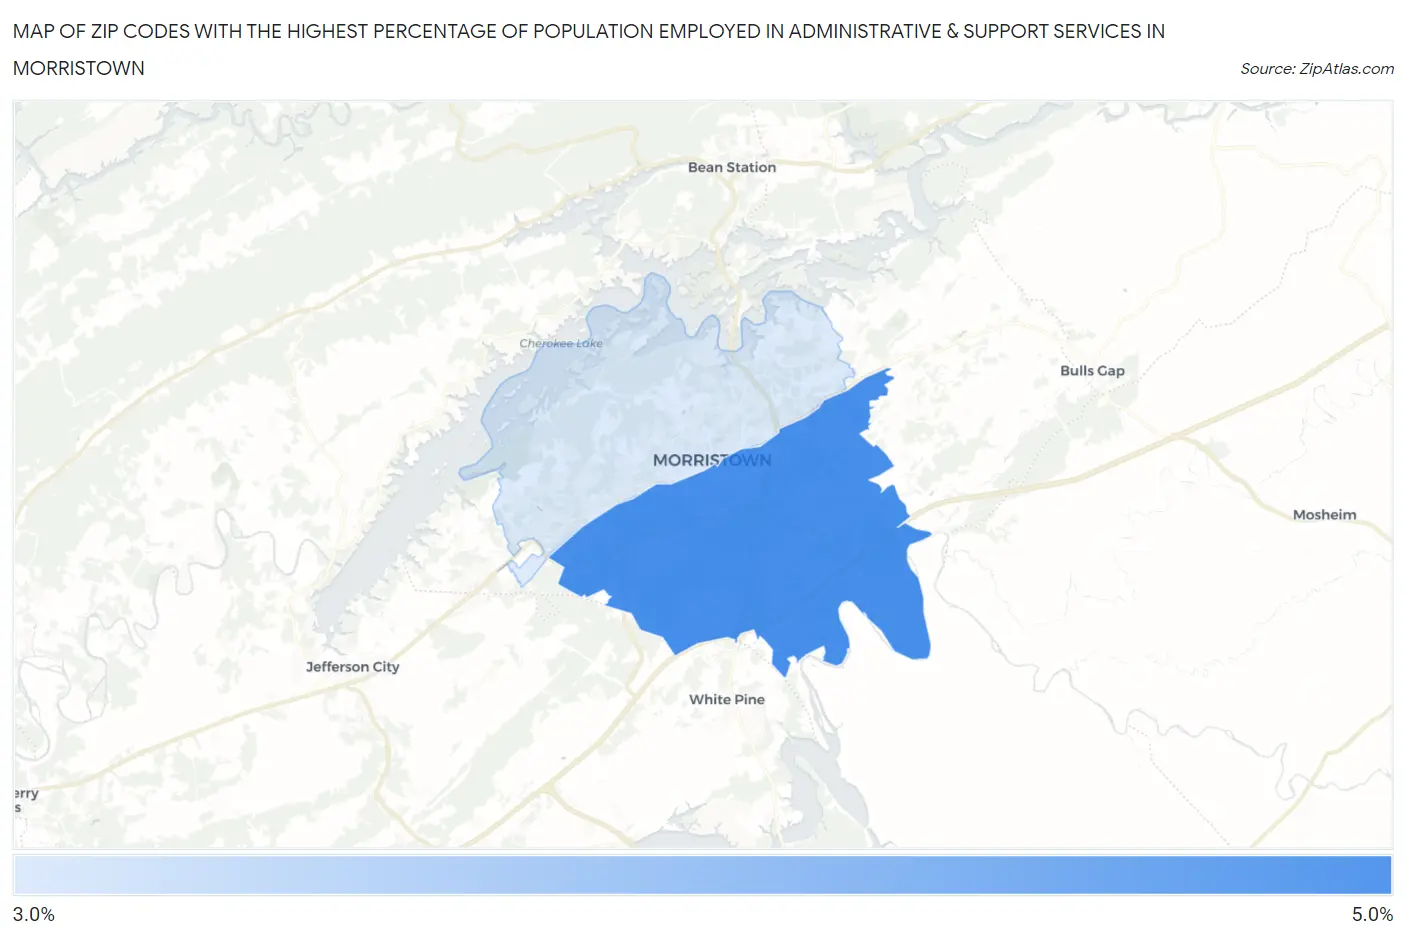
Map of Zip Codes with the Highest Percentage of Population Employed in Administrative & Support Services in Morristown
3.3%
4.4%
Zip Codes with the Highest Percentage of Population Employed in Administrative & Support Services in Morristown, TN
| Zip Code | % Employed | vs State | vs National | |
| 1. | 37813 | 4.4% | 4.4%(+0.077)#190 | 4.1%(+0.280)#8,953 |
| 2. | 37814 | 3.3% | 4.4%(-1.08)#307 | 4.1%(-0.878)#14,096 |
1
Common Questions
What are the Top Zip Codes with the Highest Percentage of Population Employed in Administrative & Support Services in Morristown, TN?
Top Zip Codes with the Highest Percentage of Population Employed in Administrative & Support Services in Morristown, TN are:
What zip code has the Highest Percentage of Population Employed in Administrative & Support Services in Morristown, TN?
37813 has the Highest Percentage of Population Employed in Administrative & Support Services in Morristown, TN with 4.4%.
What is the Percentage of Population Employed in Administrative & Support Services in Morristown, TN?
Percentage of Population Employed in Administrative & Support Services in Morristown is 3.0%.
What is the Percentage of Population Employed in Administrative & Support Services in Tennessee?
Percentage of Population Employed in Administrative & Support Services in Tennessee is 4.4%.
What is the Percentage of Population Employed in Administrative & Support Services in the United States?
Percentage of Population Employed in Administrative & Support Services in the United States is 4.1%.