New Deal, TN Map & Demographics
New Deal Map
New Deal Overview
$31,341
PER CAPITA INCOME
$83,362
AVG FAMILY INCOME
$82,629
AVG HOUSEHOLD INCOME
46.0%
WAGE / INCOME GAP [ % ]
54.0¢/ $1
WAGE / INCOME GAP [ $ ]
0.32
INEQUALITY / GINI INDEX
263
TOTAL POPULATION
146
MALE POPULATION
117
FEMALE POPULATION
124.79
MALES / 100 FEMALES
80.14
FEMALES / 100 MALES
52.0
MEDIAN AGE
2.7
AVG FAMILY SIZE
2.5
AVG HOUSEHOLD SIZE
108
LABOR FORCE [ PEOPLE ]
48.0%
PERCENT IN LABOR FORCE
Income in New Deal
Income Overview in New Deal
Per Capita Income in New Deal is $31,341, while median incomes of families and households are $83,362 and $82,629 respectively.
| Characteristic | Number | Measure |
| Per Capita Income | 263 | $31,341 |
| Median Family Income | 86 | $83,362 |
| Mean Family Income | 86 | $84,558 |
| Median Household Income | 103 | $82,629 |
| Mean Household Income | 103 | $77,979 |
| Income Deficit | 86 | $0 |
| Wage / Income Gap (%) | 263 | 45.96% |
| Wage / Income Gap ($) | 263 | 54.04¢ per $1 |
| Gini / Inequality Index | 263 | 0.32 |
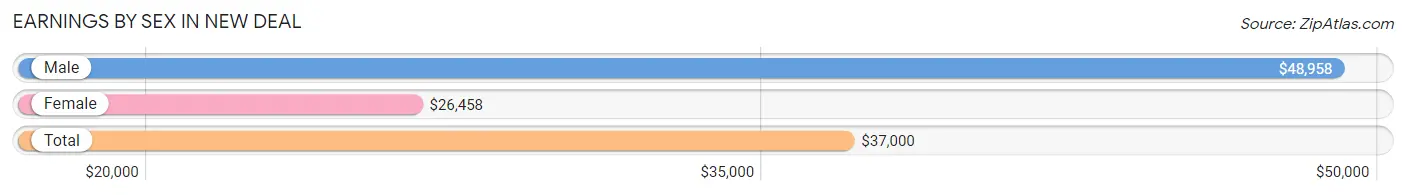
Earnings by Sex in New Deal
Average Earnings in New Deal are $37,000, $48,958 for men and $26,458 for women, a difference of 46.0%.
| Sex | Number | Average Earnings |
| Male | 59 (49.2%) | $48,958 |
| Female | 61 (50.8%) | $26,458 |
| Total | 120 (100.0%) | $37,000 |
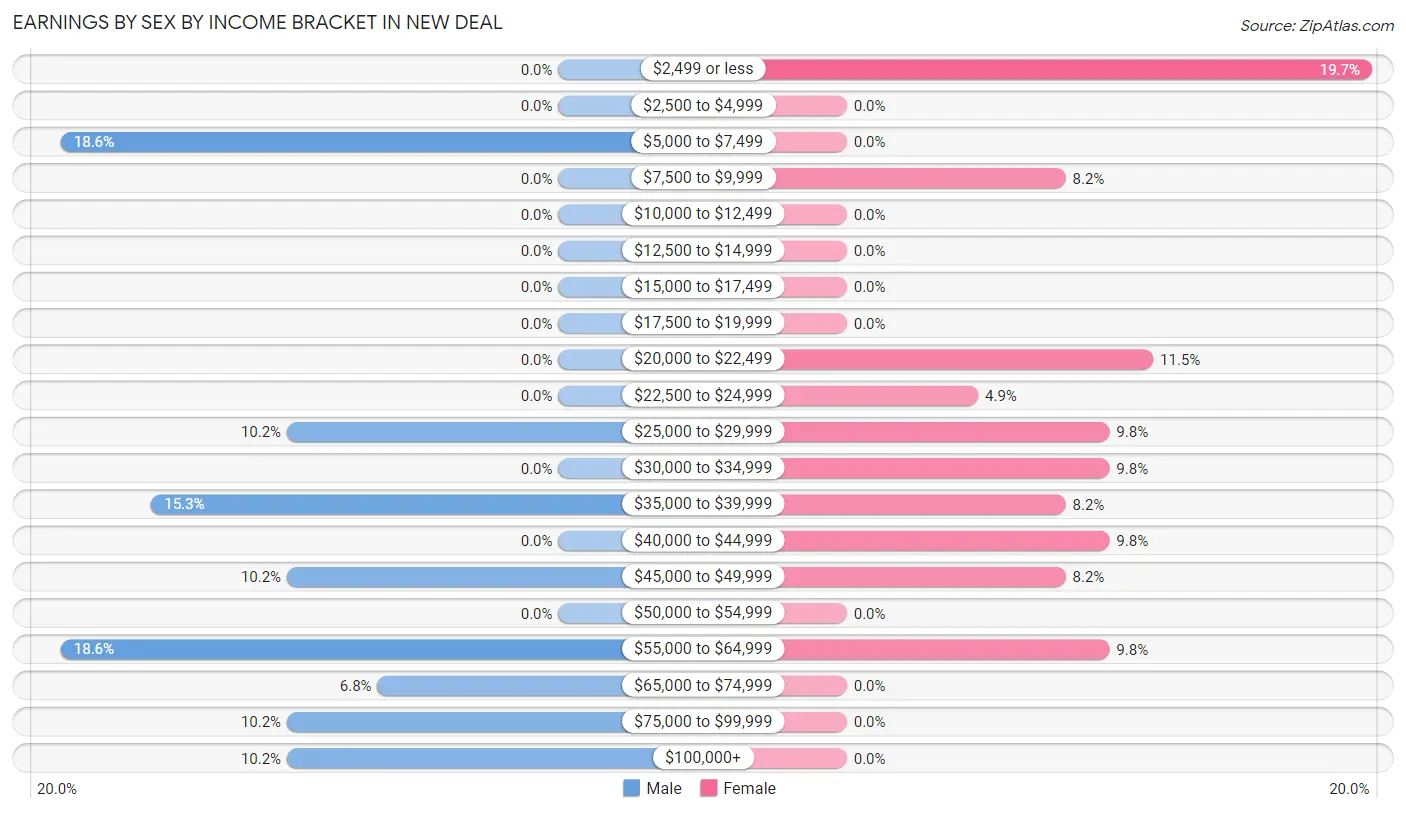
Earnings by Sex by Income Bracket in New Deal
The most common earnings brackets in New Deal are $5,000 to $7,499 for men (11 | 18.6%) and $2,499 or less for women (12 | 19.7%).
| Income | Male | Female |
| $2,499 or less | 0 (0.0%) | 12 (19.7%) |
| $2,500 to $4,999 | 0 (0.0%) | 0 (0.0%) |
| $5,000 to $7,499 | 11 (18.6%) | 0 (0.0%) |
| $7,500 to $9,999 | 0 (0.0%) | 5 (8.2%) |
| $10,000 to $12,499 | 0 (0.0%) | 0 (0.0%) |
| $12,500 to $14,999 | 0 (0.0%) | 0 (0.0%) |
| $15,000 to $17,499 | 0 (0.0%) | 0 (0.0%) |
| $17,500 to $19,999 | 0 (0.0%) | 0 (0.0%) |
| $20,000 to $22,499 | 0 (0.0%) | 7 (11.5%) |
| $22,500 to $24,999 | 0 (0.0%) | 3 (4.9%) |
| $25,000 to $29,999 | 6 (10.2%) | 6 (9.8%) |
| $30,000 to $34,999 | 0 (0.0%) | 6 (9.8%) |
| $35,000 to $39,999 | 9 (15.2%) | 5 (8.2%) |
| $40,000 to $44,999 | 0 (0.0%) | 6 (9.8%) |
| $45,000 to $49,999 | 6 (10.2%) | 5 (8.2%) |
| $50,000 to $54,999 | 0 (0.0%) | 0 (0.0%) |
| $55,000 to $64,999 | 11 (18.6%) | 6 (9.8%) |
| $65,000 to $74,999 | 4 (6.8%) | 0 (0.0%) |
| $75,000 to $99,999 | 6 (10.2%) | 0 (0.0%) |
| $100,000+ | 6 (10.2%) | 0 (0.0%) |
| Total | 59 (100.0%) | 61 (100.0%) |
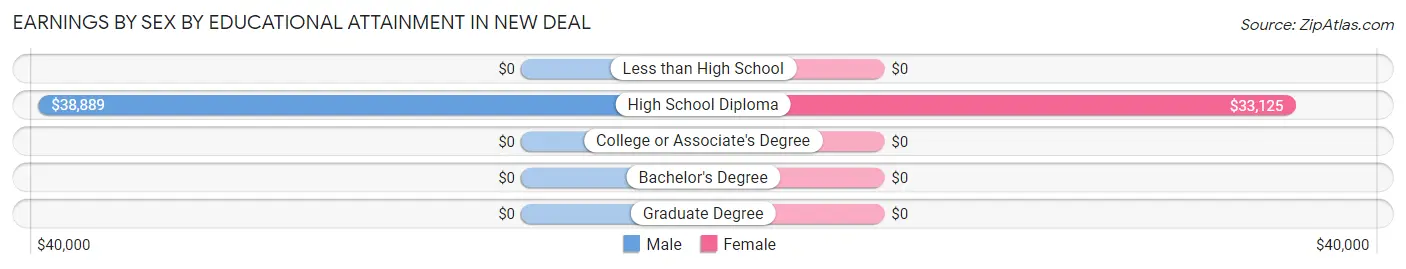
Earnings by Sex by Educational Attainment in New Deal
Average earnings in New Deal are $55,208 for men and $32,917 for women, a difference of 40.4%. Men with an educational attainment of high school diploma enjoy the highest average annual earnings of $38,889, while those with high school diploma education earn the least with $38,889. Women with an educational attainment of high school diploma earn the most with the average annual earnings of $33,125, while those with high school diploma education have the smallest earnings of $33,125.
| Educational Attainment | Male Income | Female Income |
| Less than High School | - | - |
| High School Diploma | $38,889 | $33,125 |
| College or Associate's Degree | - | - |
| Bachelor's Degree | - | - |
| Graduate Degree | - | - |
| Total | $55,208 | $32,917 |
Family Income in New Deal
Family Income Brackets in New Deal
According to the New Deal family income data, there are 41 families falling into the $75,000 to $99,999 income range, which is the most common income bracket and makes up 47.7% of all families.
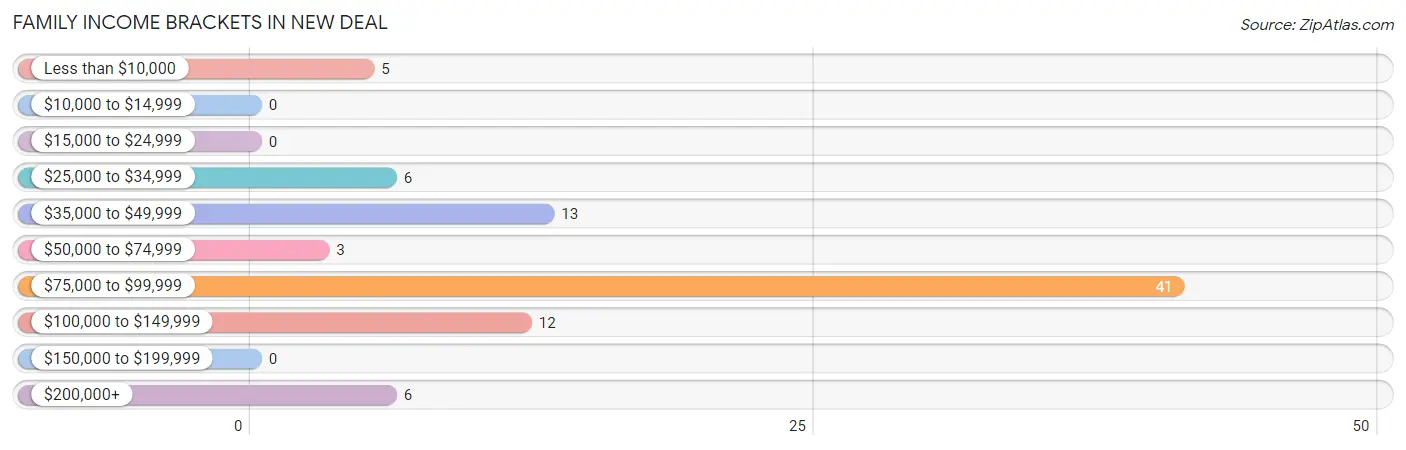
| Income Bracket | # Families | % Families |
| Less than $10,000 | 5 | 5.8% |
| $10,000 to $14,999 | 0 | 0.0% |
| $15,000 to $24,999 | 0 | 0.0% |
| $25,000 to $34,999 | 6 | 7.0% |
| $35,000 to $49,999 | 13 | 15.1% |
| $50,000 to $74,999 | 3 | 3.5% |
| $75,000 to $99,999 | 41 | 47.7% |
| $100,000 to $149,999 | 12 | 14.0% |
| $150,000 to $199,999 | 0 | 0.0% |
| $200,000+ | 6 | 7.0% |
Family Income by Famaliy Size in New Deal
2-person families (48 | 55.8%) account for the highest median family income in New Deal with $83,043 per family, while 2-person families (48 | 55.8%) have the highest median income of $41,522 per family member.
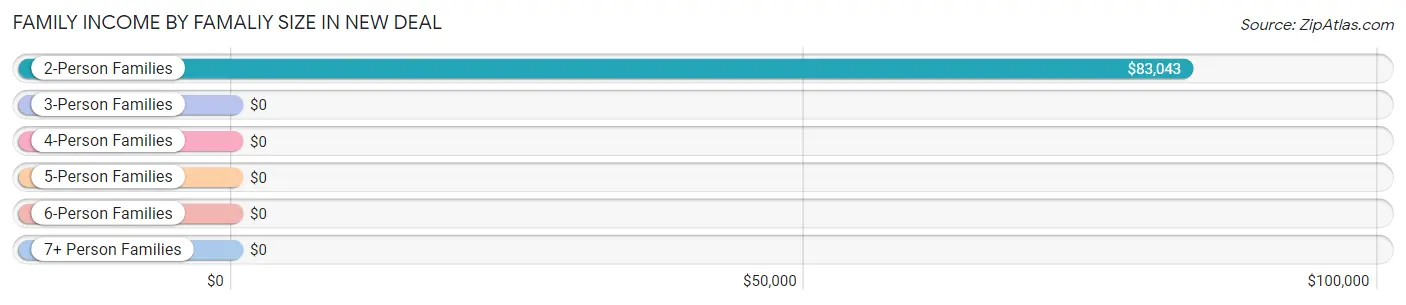
| Income Bracket | # Families | Median Income |
| 2-Person Families | 48 (55.8%) | $83,043 |
| 3-Person Families | 20 (23.3%) | $0 |
| 4-Person Families | 12 (14.0%) | $0 |
| 5-Person Families | 6 (7.0%) | $0 |
| 6-Person Families | 0 (0.0%) | $0 |
| 7+ Person Families | 0 (0.0%) | $0 |
| Total | 86 (100.0%) | $83,362 |
Family Income by Number of Earners in New Deal
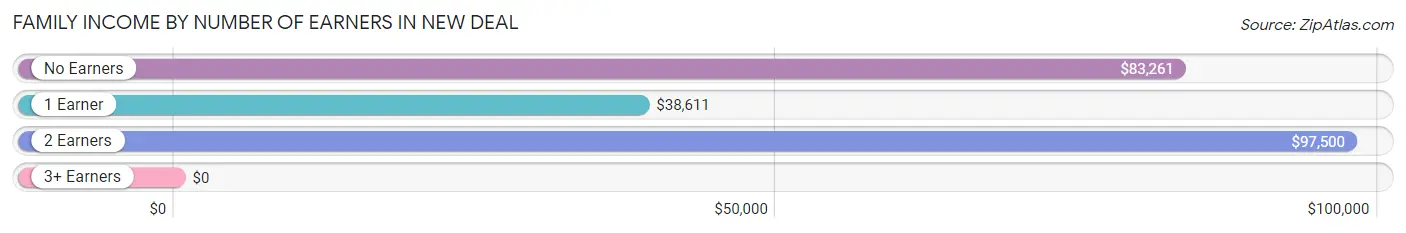
| Number of Earners | # Families | Median Income |
| No Earners | 32 (37.2%) | $83,261 |
| 1 Earner | 18 (20.9%) | $38,611 |
| 2 Earners | 24 (27.9%) | $97,500 |
| 3+ Earners | 12 (14.0%) | $0 |
| Total | 86 (100.0%) | $83,362 |
Household Income in New Deal
Household Income Brackets in New Deal
With 41 households falling in the category, the $75,000 to $99,999 income range is the most frequent in New Deal, accounting for 39.8% of all households.
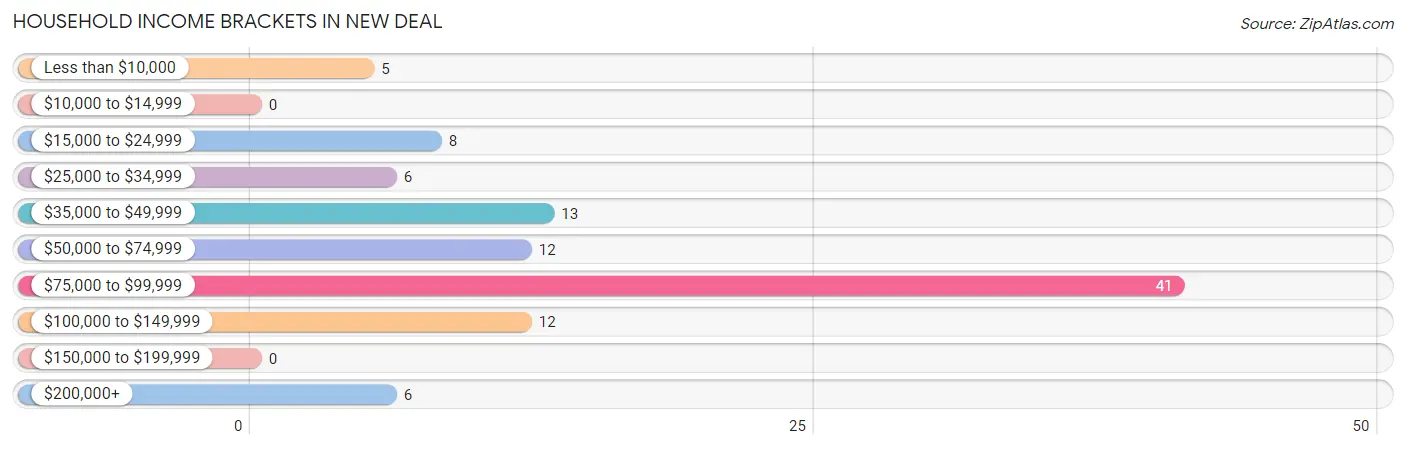
| Income Bracket | # Households | % Households |
| Less than $10,000 | 5 | 4.9% |
| $10,000 to $14,999 | 0 | 0.0% |
| $15,000 to $24,999 | 8 | 7.8% |
| $25,000 to $34,999 | 6 | 5.8% |
| $35,000 to $49,999 | 13 | 12.6% |
| $50,000 to $74,999 | 12 | 11.7% |
| $75,000 to $99,999 | 41 | 39.8% |
| $100,000 to $149,999 | 12 | 11.7% |
| $150,000 to $199,999 | 0 | 0.0% |
| $200,000+ | 6 | 5.8% |
Household Income by Householder Age in New Deal
The median household income in New Deal is $82,629, with the highest median household income of $95,833 found in the 45 to 64 years age bracket for the primary householder. A total of 44 households (42.7%) fall into this category.
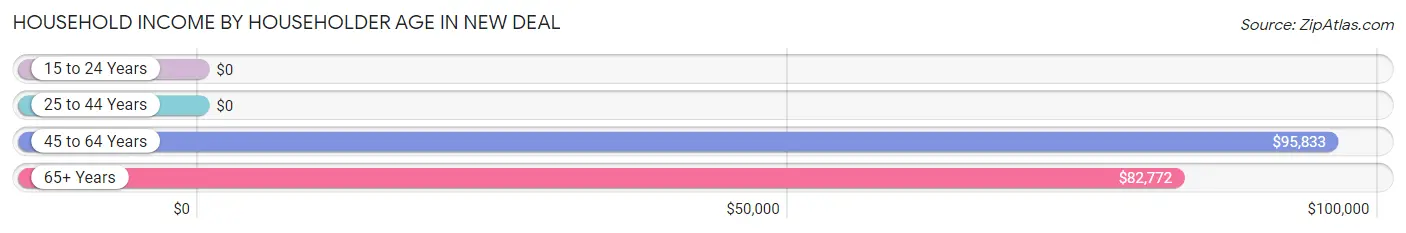
| Income Bracket | # Households | Median Income |
| 15 to 24 Years | 0 (0.0%) | $0 |
| 25 to 44 Years | 18 (17.5%) | $0 |
| 45 to 64 Years | 44 (42.7%) | $95,833 |
| 65+ Years | 41 (39.8%) | $82,772 |
| Total | 103 (100.0%) | $82,629 |
Poverty in New Deal
Income Below Poverty by Sex and Age in New Deal
With 12.1% poverty level for males and 5.1% for females among the residents of New Deal, 6 to 11 year old males and 25 to 34 year old females are the most vulnerable to poverty, with 12 males (100.0%) and 6 females (100.0%) in their respective age groups living below the poverty level.
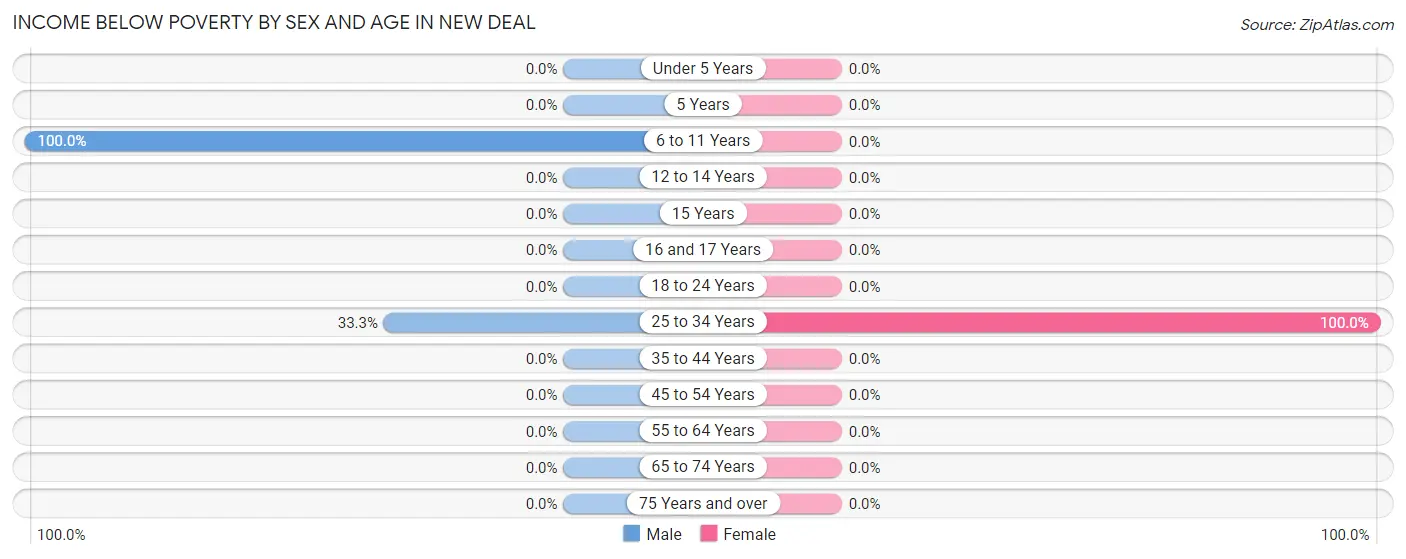
| Age Bracket | Male | Female |
| Under 5 Years | 0 (0.0%) | 0 (0.0%) |
| 5 Years | 0 (0.0%) | 0 (0.0%) |
| 6 to 11 Years | 12 (100.0%) | 0 (0.0%) |
| 12 to 14 Years | 0 (0.0%) | 0 (0.0%) |
| 15 Years | 0 (0.0%) | 0 (0.0%) |
| 16 and 17 Years | 0 (0.0%) | 0 (0.0%) |
| 18 to 24 Years | 0 (0.0%) | 0 (0.0%) |
| 25 to 34 Years | 5 (33.3%) | 6 (100.0%) |
| 35 to 44 Years | 0 (0.0%) | 0 (0.0%) |
| 45 to 54 Years | 0 (0.0%) | 0 (0.0%) |
| 55 to 64 Years | 0 (0.0%) | 0 (0.0%) |
| 65 to 74 Years | 0 (0.0%) | 0 (0.0%) |
| 75 Years and over | 0 (0.0%) | 0 (0.0%) |
| Total | 17 (12.1%) | 6 (5.1%) |
Income Above Poverty by Sex and Age in New Deal
According to the poverty statistics in New Deal, males aged under 5 years and females aged 18 to 24 years are the age groups that are most secure financially, with 100.0% of males and 100.0% of females in these age groups living above the poverty line.
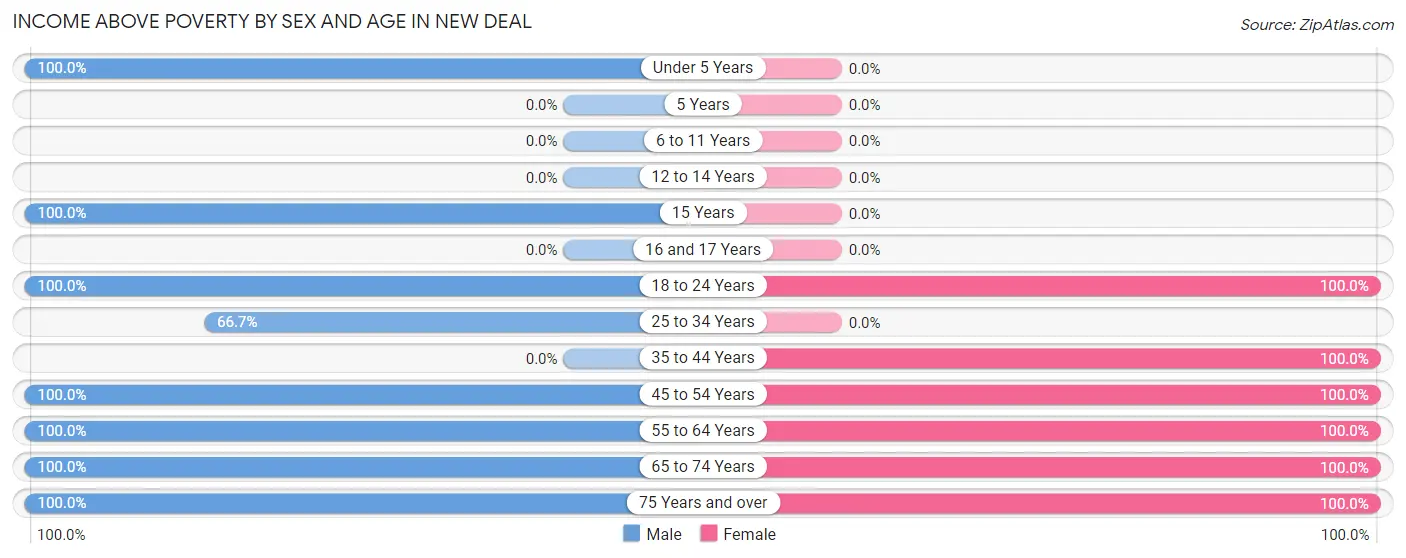
| Age Bracket | Male | Female |
| Under 5 Years | 12 (100.0%) | 0 (0.0%) |
| 5 Years | 0 (0.0%) | 0 (0.0%) |
| 6 to 11 Years | 0 (0.0%) | 0 (0.0%) |
| 12 to 14 Years | 0 (0.0%) | 0 (0.0%) |
| 15 Years | 14 (100.0%) | 0 (0.0%) |
| 16 and 17 Years | 0 (0.0%) | 0 (0.0%) |
| 18 to 24 Years | 6 (100.0%) | 17 (100.0%) |
| 25 to 34 Years | 10 (66.7%) | 0 (0.0%) |
| 35 to 44 Years | 0 (0.0%) | 3 (100.0%) |
| 45 to 54 Years | 27 (100.0%) | 31 (100.0%) |
| 55 to 64 Years | 17 (100.0%) | 6 (100.0%) |
| 65 to 74 Years | 9 (100.0%) | 48 (100.0%) |
| 75 Years and over | 29 (100.0%) | 6 (100.0%) |
| Total | 124 (87.9%) | 111 (94.9%) |
Income Below Poverty Among Married-Couple Families in New Deal
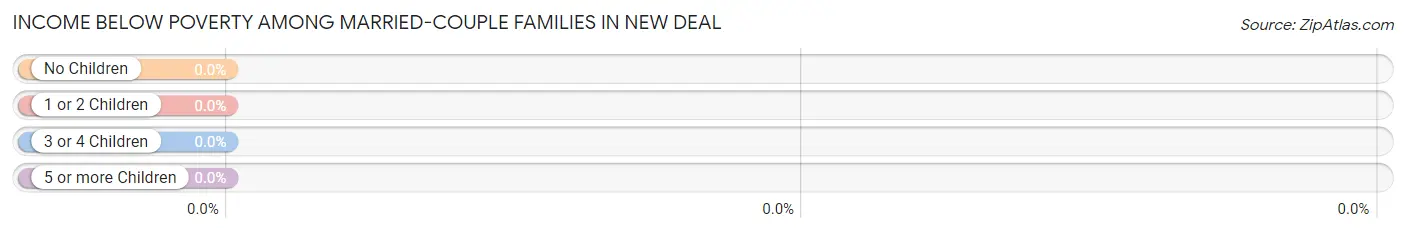
| Children | Above Poverty | Below Poverty |
| No Children | 60 (100.0%) | 0 (0.0%) |
| 1 or 2 Children | 21 (100.0%) | 0 (0.0%) |
| 3 or 4 Children | 0 (0.0%) | 0 (0.0%) |
| 5 or more Children | 0 (0.0%) | 0 (0.0%) |
| Total | 81 (100.0%) | 0 (0.0%) |
Income Below Poverty Among Single-Parent Households in New Deal
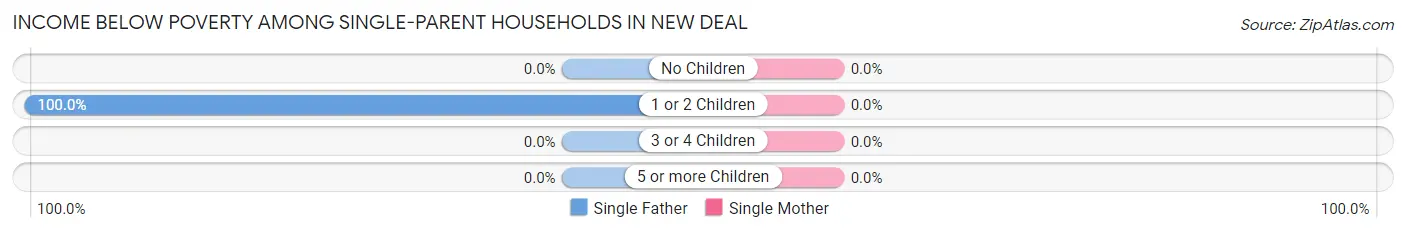
| Children | Single Father | Single Mother |
| No Children | 0 (0.0%) | 0 (0.0%) |
| 1 or 2 Children | 5 (100.0%) | 0 (0.0%) |
| 3 or 4 Children | 0 (0.0%) | 0 (0.0%) |
| 5 or more Children | 0 (0.0%) | 0 (0.0%) |
| Total | 5 (100.0%) | 0 (0.0%) |
Income Below Poverty Among Married-Couple vs Single-Parent Households in New Deal
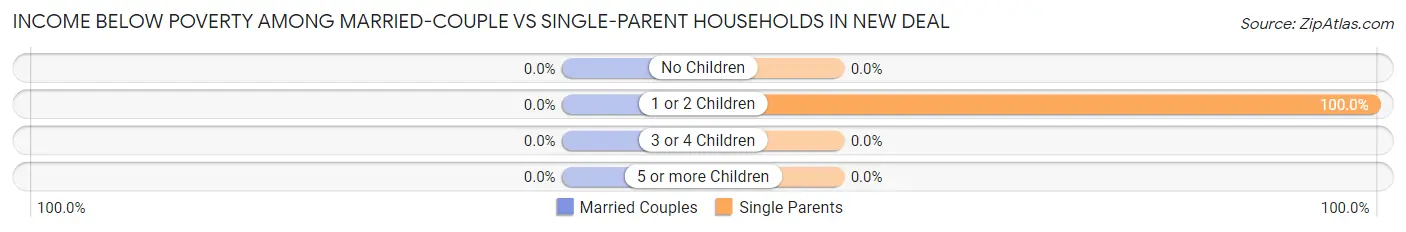
| Children | Married-Couple Families | Single-Parent Households |
| No Children | 0 (0.0%) | 0 (0.0%) |
| 1 or 2 Children | 0 (0.0%) | 5 (100.0%) |
| 3 or 4 Children | 0 (0.0%) | 0 (0.0%) |
| 5 or more Children | 0 (0.0%) | 0 (0.0%) |
| Total | 0 (0.0%) | 5 (100.0%) |
Race in New Deal
The most populous races in New Deal are White / Caucasian (259 | 98.5%), and Two or more Races (4 | 1.5%).
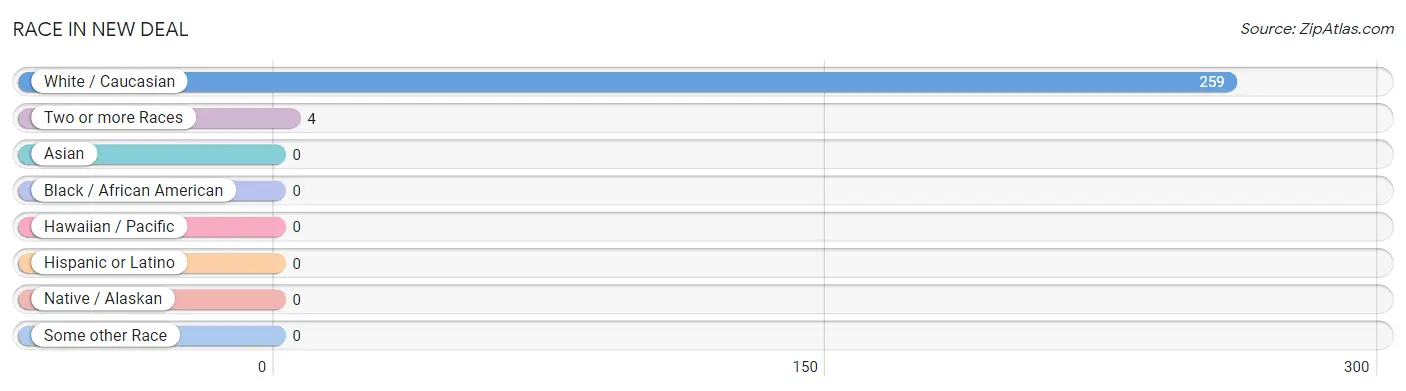
| Race | # Population | % Population |
| Asian | 0 | 0.0% |
| Black / African American | 0 | 0.0% |
| Hawaiian / Pacific | 0 | 0.0% |
| Hispanic or Latino | 0 | 0.0% |
| Native / Alaskan | 0 | 0.0% |
| White / Caucasian | 259 | 98.5% |
| Two or more Races | 4 | 1.5% |
| Some other Race | 0 | 0.0% |
| Total | 263 | 100.0% |
Ancestry in New Deal
The most populous ancestries reported in New Deal are American (73 | 27.8%), English (36 | 13.7%), Irish (23 | 8.7%), German (22 | 8.4%), and Scottish (12 | 4.6%), together accounting for 63.1% of all New Deal residents.
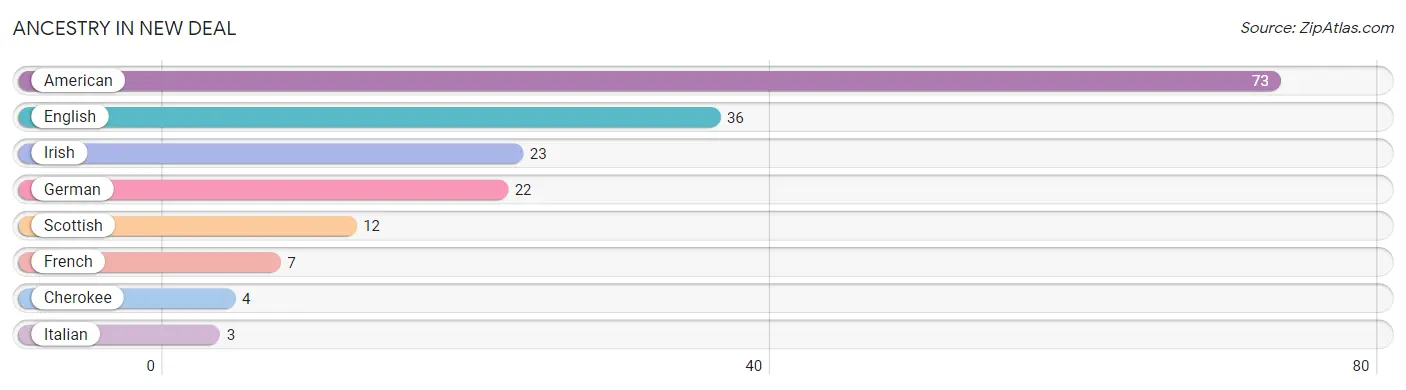
| Ancestry | # Population | % Population |
| American | 73 | 27.8% |
| Cherokee | 4 | 1.5% |
| English | 36 | 13.7% |
| French | 7 | 2.7% |
| German | 22 | 8.4% |
| Irish | 23 | 8.7% |
| Italian | 3 | 1.1% |
| Scottish | 12 | 4.6% | View All 8 Rows |
Immigrants in New Deal

| Immigration Origin | # Population | % Population | View All 0 Rows |
Sex and Age in New Deal
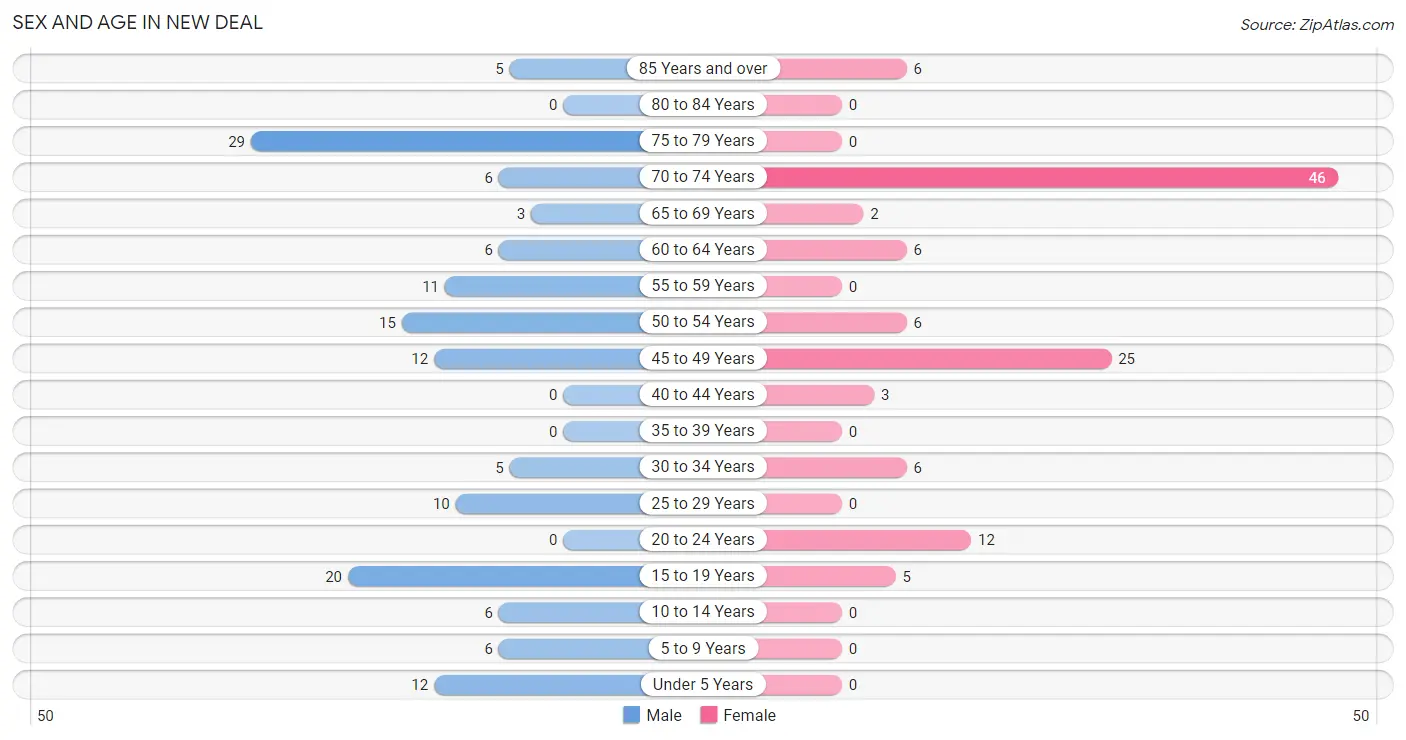
Sex and Age in New Deal
The most populous age groups in New Deal are 75 to 79 Years (29 | 19.9%) for men and 70 to 74 Years (46 | 39.3%) for women.
| Age Bracket | Male | Female |
| Under 5 Years | 12 (8.2%) | 0 (0.0%) |
| 5 to 9 Years | 6 (4.1%) | 0 (0.0%) |
| 10 to 14 Years | 6 (4.1%) | 0 (0.0%) |
| 15 to 19 Years | 20 (13.7%) | 5 (4.3%) |
| 20 to 24 Years | 0 (0.0%) | 12 (10.3%) |
| 25 to 29 Years | 10 (6.9%) | 0 (0.0%) |
| 30 to 34 Years | 5 (3.4%) | 6 (5.1%) |
| 35 to 39 Years | 0 (0.0%) | 0 (0.0%) |
| 40 to 44 Years | 0 (0.0%) | 3 (2.6%) |
| 45 to 49 Years | 12 (8.2%) | 25 (21.4%) |
| 50 to 54 Years | 15 (10.3%) | 6 (5.1%) |
| 55 to 59 Years | 11 (7.5%) | 0 (0.0%) |
| 60 to 64 Years | 6 (4.1%) | 6 (5.1%) |
| 65 to 69 Years | 3 (2.1%) | 2 (1.7%) |
| 70 to 74 Years | 6 (4.1%) | 46 (39.3%) |
| 75 to 79 Years | 29 (19.9%) | 0 (0.0%) |
| 80 to 84 Years | 0 (0.0%) | 0 (0.0%) |
| 85 Years and over | 5 (3.4%) | 6 (5.1%) |
| Total | 146 (100.0%) | 117 (100.0%) |
Families and Households in New Deal
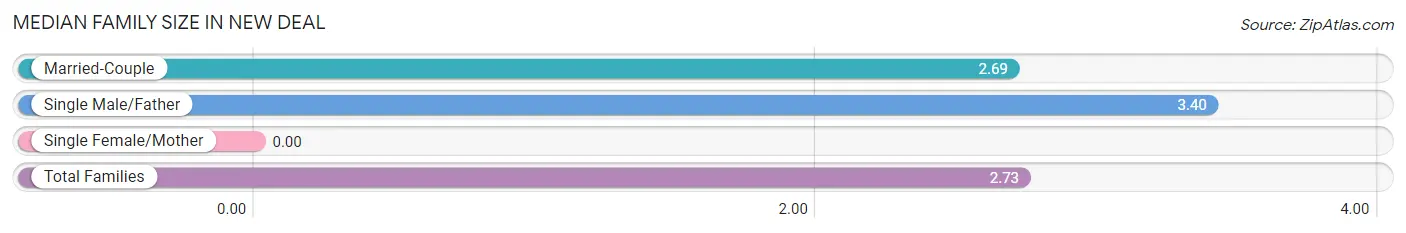
Median Family Size in New Deal
| Family Type | # Families | Family Size |
| Married-Couple | 81 (94.2%) | 2.69 |
| Single Male/Father | 5 (5.8%) | 3.40 |
| Single Female/Mother | 0 (0.0%) | - |
| Total Families | 86 (100.0%) | 2.73 |
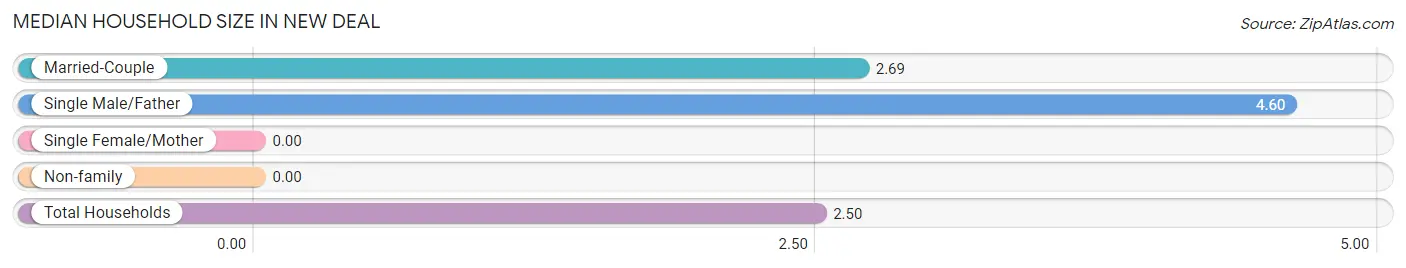
Median Household Size in New Deal
| Household Type | # Households | Household Size |
| Married-Couple | 81 (78.6%) | 2.69 |
| Single Male/Father | 5 (4.9%) | 4.60 |
| Single Female/Mother | 0 (0.0%) | - |
| Non-family | 17 (16.5%) | - |
| Total Households | 103 (100.0%) | 2.50 |
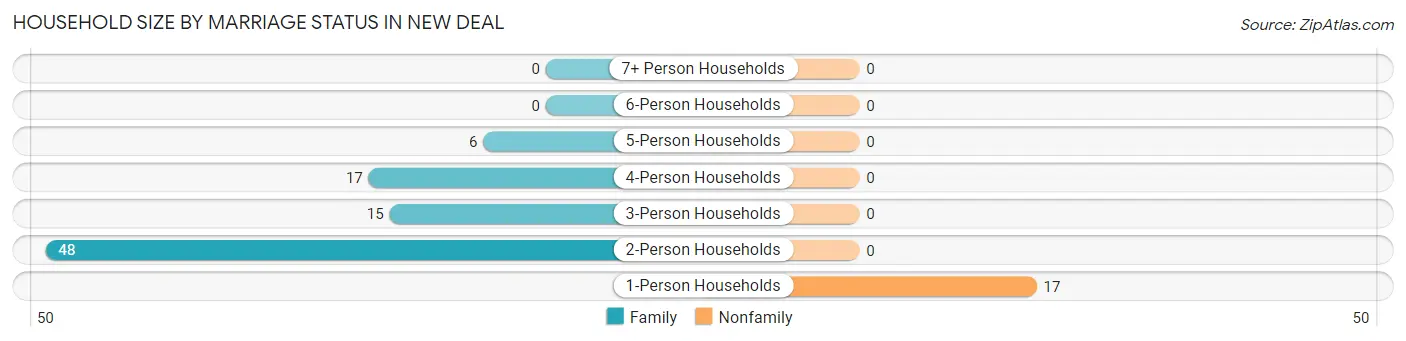
Household Size by Marriage Status in New Deal
Out of a total of 103 households in New Deal, 86 (83.5%) are family households, while 17 (16.5%) are nonfamily households. The most numerous type of family households are 2-person households, comprising 48, and the most common type of nonfamily households are 1-person households, comprising 17.
| Household Size | Family Households | Nonfamily Households |
| 1-Person Households | - | 17 (16.5%) |
| 2-Person Households | 48 (46.6%) | 0 (0.0%) |
| 3-Person Households | 15 (14.6%) | 0 (0.0%) |
| 4-Person Households | 17 (16.5%) | 0 (0.0%) |
| 5-Person Households | 6 (5.8%) | 0 (0.0%) |
| 6-Person Households | 0 (0.0%) | 0 (0.0%) |
| 7+ Person Households | 0 (0.0%) | 0 (0.0%) |
| Total | 86 (83.5%) | 17 (16.5%) |
Female Fertility in New Deal
Fertility by Age in New Deal
Average fertility rate in New Deal is 98.0 births per 1,000 women. Women in the age bracket of 20 to 34 years have the highest fertility rate with 278.0 births per 1,000 women. Women in the age bracket of 20 to 34 years acount for 100.0% of all women with births.
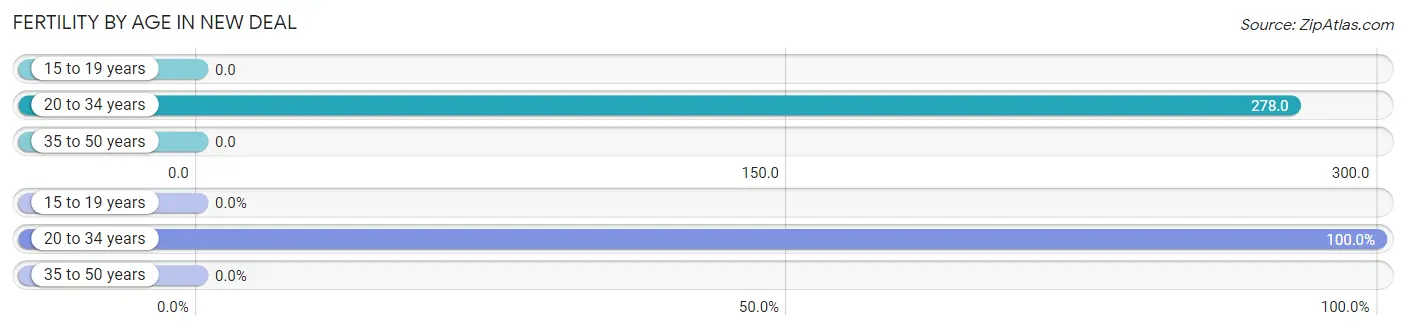
| Age Bracket | Women with Births | Births / 1,000 Women |
| 15 to 19 years | 0 (0.0%) | 0.0 |
| 20 to 34 years | 5 (100.0%) | 278.0 |
| 35 to 50 years | 0 (0.0%) | 0.0 |
| Total | 5 (100.0%) | 98.0 |
Fertility by Age by Marriage Status in New Deal
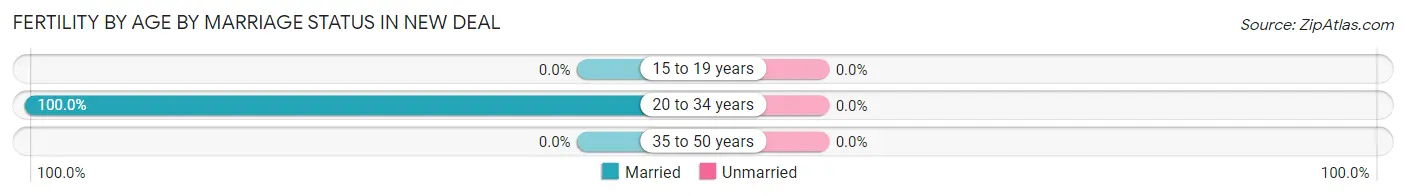
| Age Bracket | Married | Unmarried |
| 15 to 19 years | 0 (0.0%) | 0 (0.0%) |
| 20 to 34 years | 5 (100.0%) | 0 (0.0%) |
| 35 to 50 years | 0 (0.0%) | 0 (0.0%) |
| Total | 5 (100.0%) | 0 (0.0%) |
Fertility by Education in New Deal
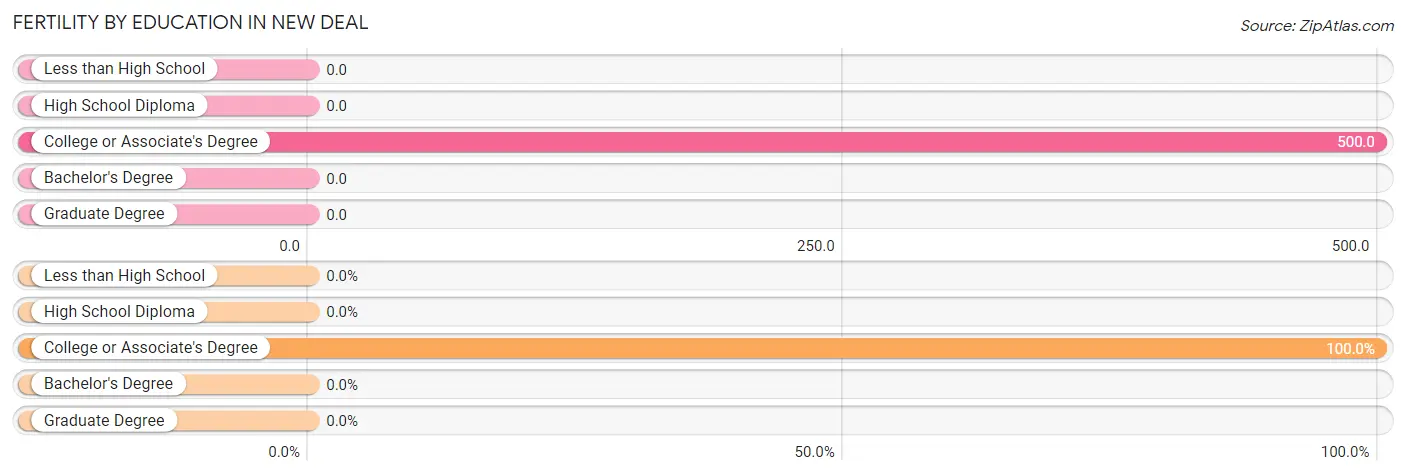
| Educational Attainment | Women with Births | Births / 1,000 Women |
| Less than High School | 0 (0.0%) | 0.0 |
| High School Diploma | 0 (0.0%) | 0.0 |
| College or Associate's Degree | 5 (100.0%) | 500.0 |
| Bachelor's Degree | 0 (0.0%) | 0.0 |
| Graduate Degree | 0 (0.0%) | 0.0 |
| Total | 5 (100.0%) | 98.0 |
Fertility by Education by Marriage Status in New Deal
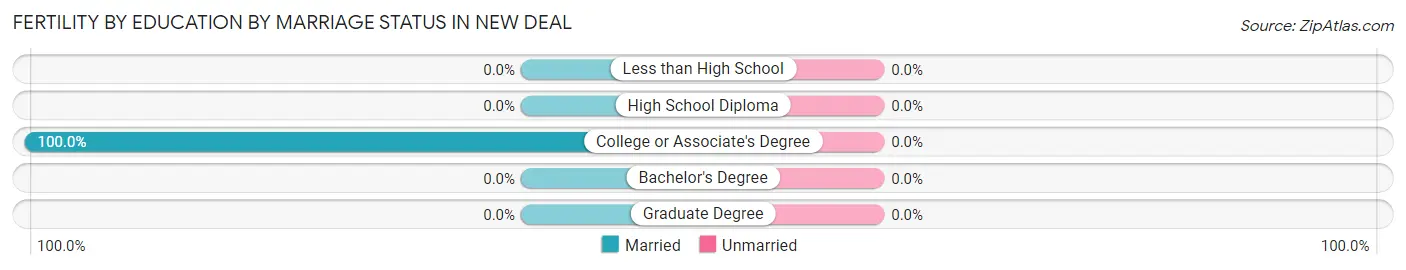
| Educational Attainment | Married | Unmarried |
| Less than High School | 0 (0.0%) | 0 (0.0%) |
| High School Diploma | 0 (0.0%) | 0 (0.0%) |
| College or Associate's Degree | 5 (100.0%) | 0 (0.0%) |
| Bachelor's Degree | 0 (0.0%) | 0 (0.0%) |
| Graduate Degree | 0 (0.0%) | 0 (0.0%) |
| Total | 5 (100.0%) | 0 (0.0%) |
Employment Characteristics in New Deal
Employment by Class of Employer in New Deal
Among the 108 employed individuals in New Deal, private company employees (88 | 81.5%), not-for-profit organizations (9 | 8.3%), and self-employed (not incorporated) (6 | 5.6%) make up the most common classes of employment.
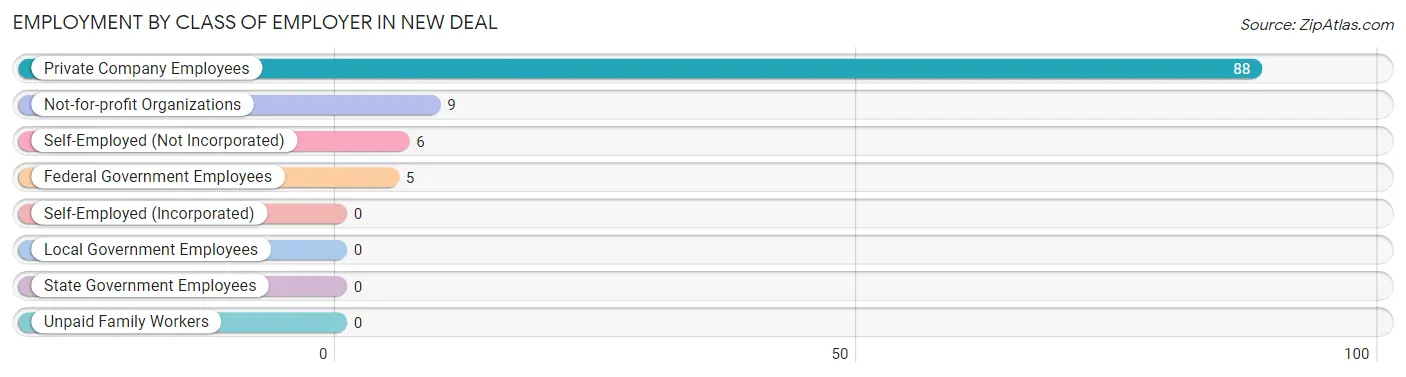
| Employer Class | # Employees | % Employees |
| Private Company Employees | 88 | 81.5% |
| Self-Employed (Incorporated) | 0 | 0.0% |
| Self-Employed (Not Incorporated) | 6 | 5.6% |
| Not-for-profit Organizations | 9 | 8.3% |
| Local Government Employees | 0 | 0.0% |
| State Government Employees | 0 | 0.0% |
| Federal Government Employees | 5 | 4.6% |
| Unpaid Family Workers | 0 | 0.0% |
| Total | 108 | 100.0% |
Employment Status by Age in New Deal
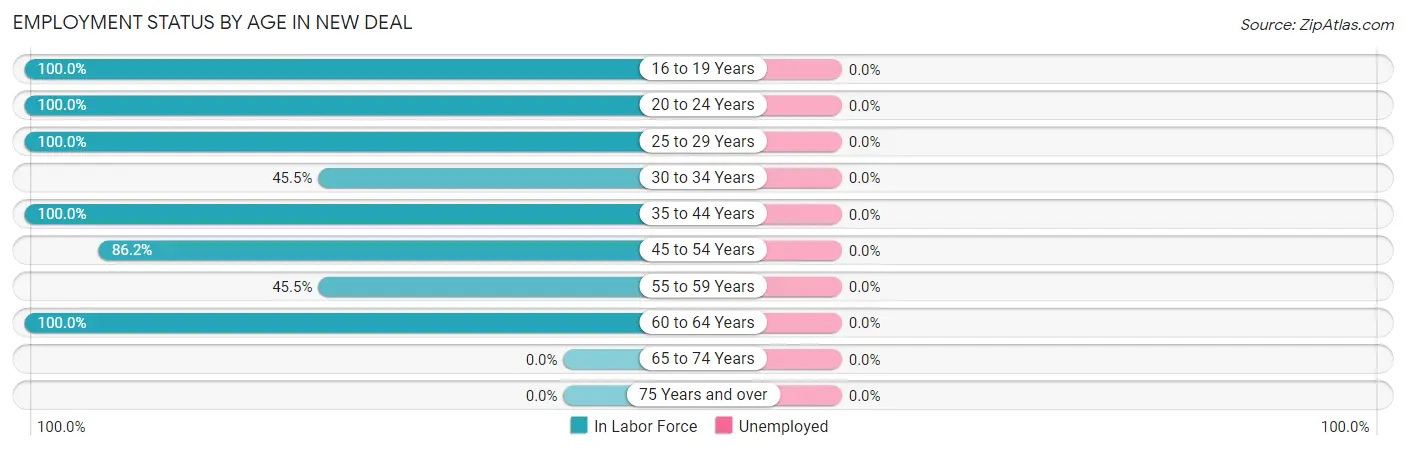
| Age Bracket | In Labor Force | Unemployed |
| 16 to 19 Years | 11 (100.0%) | 0 (0.0%) |
| 20 to 24 Years | 12 (100.0%) | 0 (0.0%) |
| 25 to 29 Years | 10 (100.0%) | 0 (0.0%) |
| 30 to 34 Years | 5 (45.5%) | 0 (0.0%) |
| 35 to 44 Years | 3 (100.0%) | 0 (0.0%) |
| 45 to 54 Years | 50 (86.2%) | 0 (0.0%) |
| 55 to 59 Years | 5 (45.5%) | 0 (0.0%) |
| 60 to 64 Years | 12 (100.0%) | 0 (0.0%) |
| 65 to 74 Years | 0 (0.0%) | 0 (0.0%) |
| 75 Years and over | 0 (0.0%) | 0 (0.0%) |
| Total | 108 (48.0%) | 0 (0.0%) |
Employment Status by Educational Attainment in New Deal
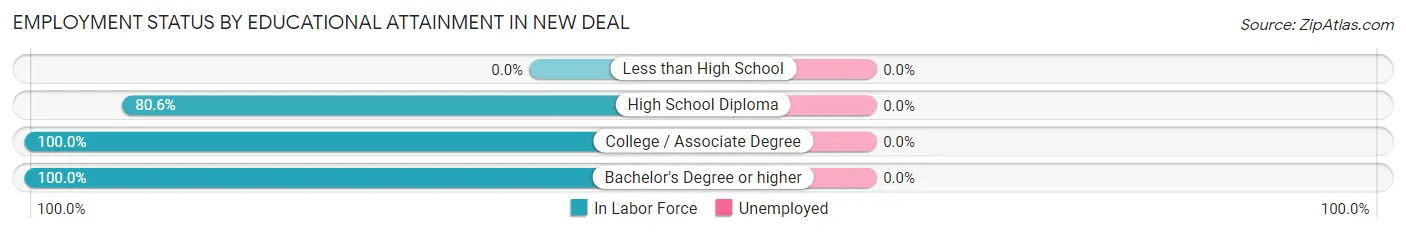
| Educational Attainment | In Labor Force | Unemployed |
| Less than High School | 0 (0.0%) | 0 (0.0%) |
| High School Diploma | 58 (80.6%) | 0 (0.0%) |
| College / Associate Degree | 5 (100.0%) | 0 (0.0%) |
| Bachelor's Degree or higher | 22 (100.0%) | 0 (0.0%) |
| Total | 85 (81.0%) | 0 (0.0%) |
Employment Occupations by Sex in New Deal
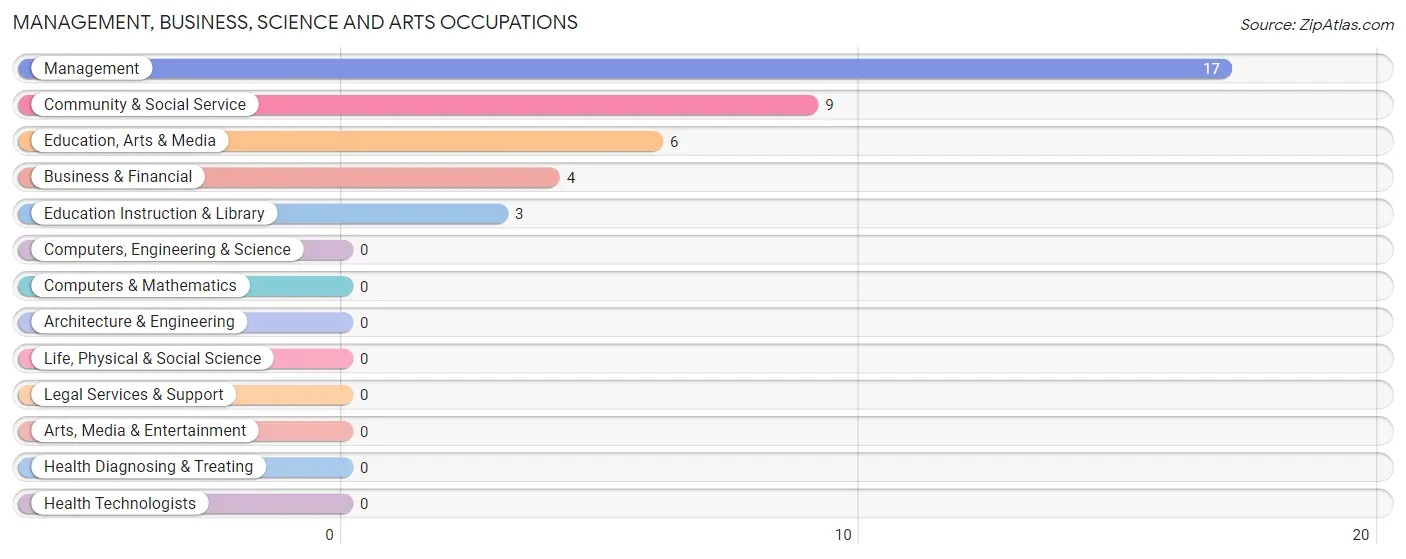
Management, Business, Science and Arts Occupations
The most common Management, Business, Science and Arts occupations in New Deal are Management (17 | 15.7%), Community & Social Service (9 | 8.3%), Education, Arts & Media (6 | 5.6%), Business & Financial (4 | 3.7%), and Education Instruction & Library (3 | 2.8%).
Management, Business, Science and Arts Occupations by Sex
Within the Management, Business, Science and Arts occupations in New Deal, the most male-oriented occupations are Business & Financial (100.0%), and Management (70.6%), while the most female-oriented occupations are Community & Social Service (100.0%), Education, Arts & Media (100.0%), and Education Instruction & Library (100.0%).
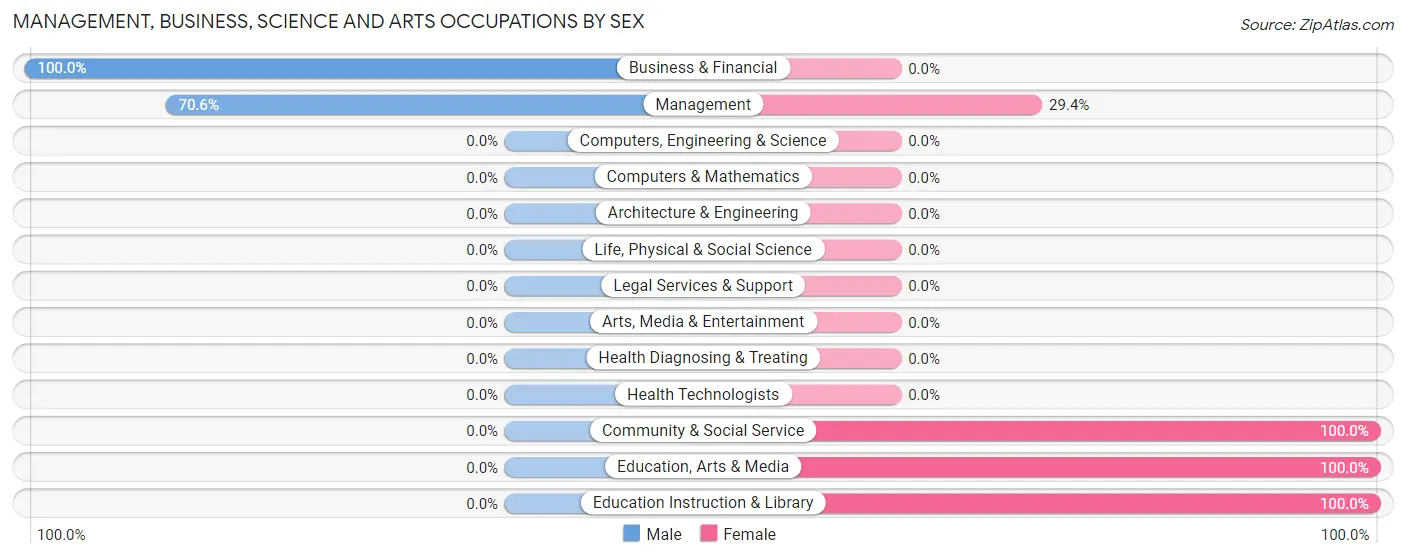
| Occupation | Male | Female |
| Management | 12 (70.6%) | 5 (29.4%) |
| Business & Financial | 4 (100.0%) | 0 (0.0%) |
| Computers, Engineering & Science | 0 (0.0%) | 0 (0.0%) |
| Computers & Mathematics | 0 (0.0%) | 0 (0.0%) |
| Architecture & Engineering | 0 (0.0%) | 0 (0.0%) |
| Life, Physical & Social Science | 0 (0.0%) | 0 (0.0%) |
| Community & Social Service | 0 (0.0%) | 9 (100.0%) |
| Education, Arts & Media | 0 (0.0%) | 6 (100.0%) |
| Legal Services & Support | 0 (0.0%) | 0 (0.0%) |
| Education Instruction & Library | 0 (0.0%) | 3 (100.0%) |
| Arts, Media & Entertainment | 0 (0.0%) | 0 (0.0%) |
| Health Diagnosing & Treating | 0 (0.0%) | 0 (0.0%) |
| Health Technologists | 0 (0.0%) | 0 (0.0%) |
| Total (Category) | 16 (53.3%) | 14 (46.7%) |
| Total (Overall) | 59 (54.6%) | 49 (45.4%) |
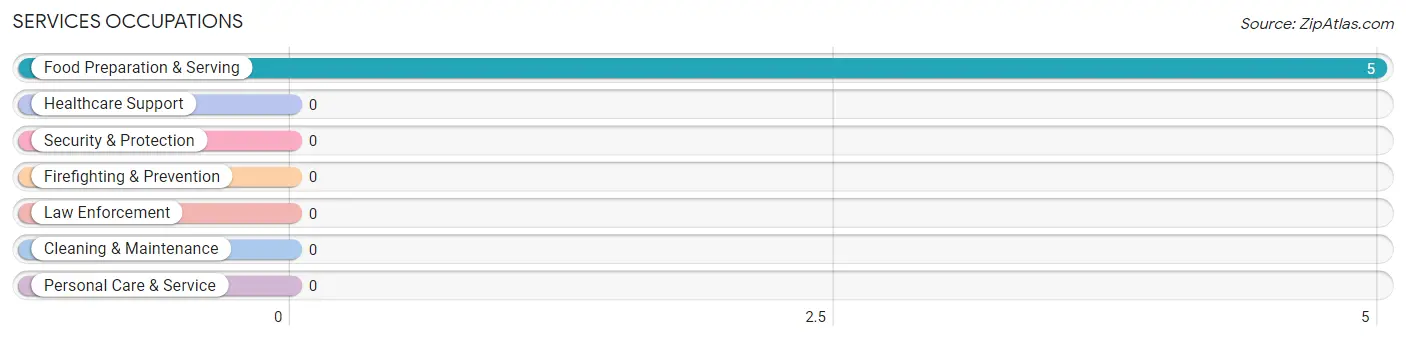
Services Occupations
The most common Services occupations in New Deal are , and Food Preparation & Serving (5 | 4.6%).
Services Occupations by Sex
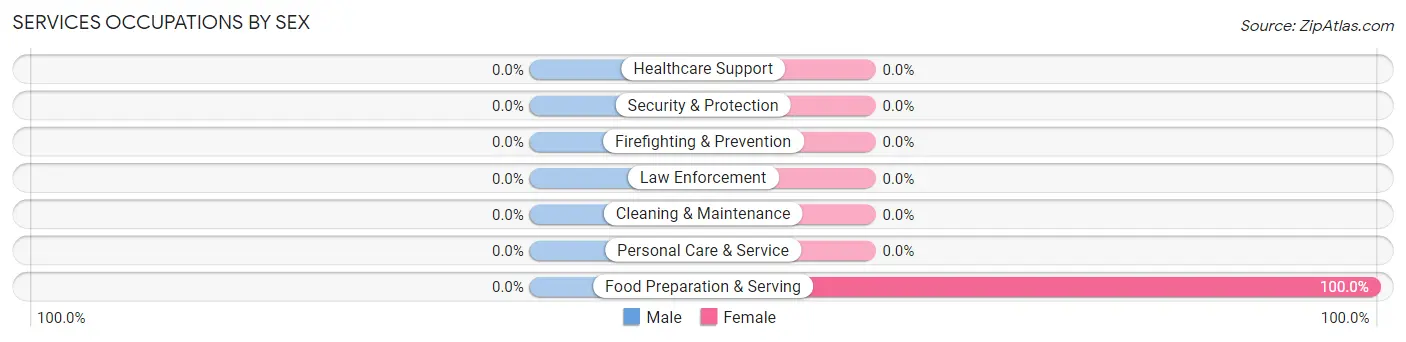
| Occupation | Male | Female |
| Healthcare Support | 0 (0.0%) | 0 (0.0%) |
| Security & Protection | 0 (0.0%) | 0 (0.0%) |
| Firefighting & Prevention | 0 (0.0%) | 0 (0.0%) |
| Law Enforcement | 0 (0.0%) | 0 (0.0%) |
| Food Preparation & Serving | 0 (0.0%) | 5 (100.0%) |
| Cleaning & Maintenance | 0 (0.0%) | 0 (0.0%) |
| Personal Care & Service | 0 (0.0%) | 0 (0.0%) |
| Total (Category) | 0 (0.0%) | 5 (100.0%) |
| Total (Overall) | 59 (54.6%) | 49 (45.4%) |
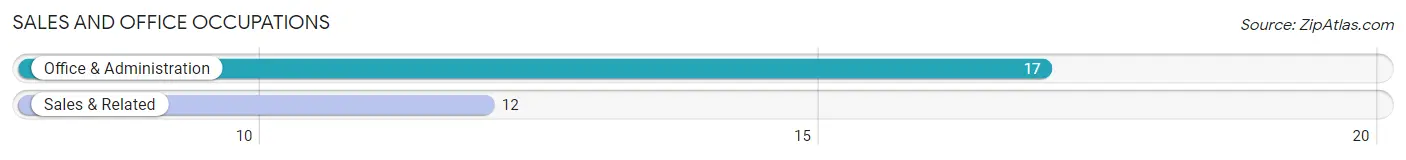
Sales and Office Occupations
The most common Sales and Office occupations in New Deal are Office & Administration (17 | 15.7%), and Sales & Related (12 | 11.1%).
Sales and Office Occupations by Sex
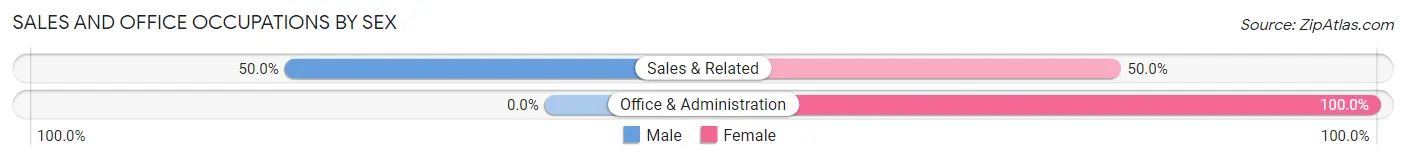
| Occupation | Male | Female |
| Sales & Related | 6 (50.0%) | 6 (50.0%) |
| Office & Administration | 0 (0.0%) | 17 (100.0%) |
| Total (Category) | 6 (20.7%) | 23 (79.3%) |
| Total (Overall) | 59 (54.6%) | 49 (45.4%) |
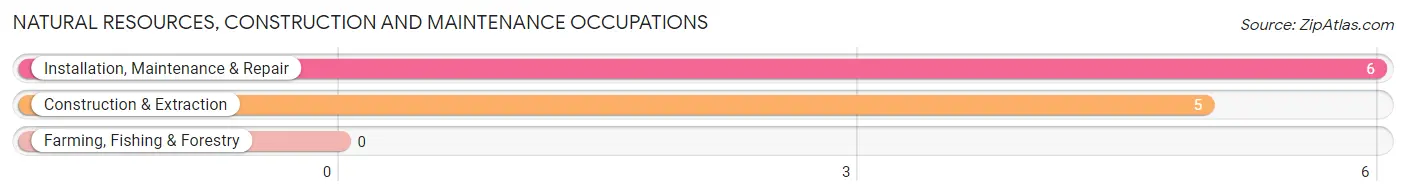
Natural Resources, Construction and Maintenance Occupations
The most common Natural Resources, Construction and Maintenance occupations in New Deal are Installation, Maintenance & Repair (6 | 5.6%), and Construction & Extraction (5 | 4.6%).
Natural Resources, Construction and Maintenance Occupations by Sex
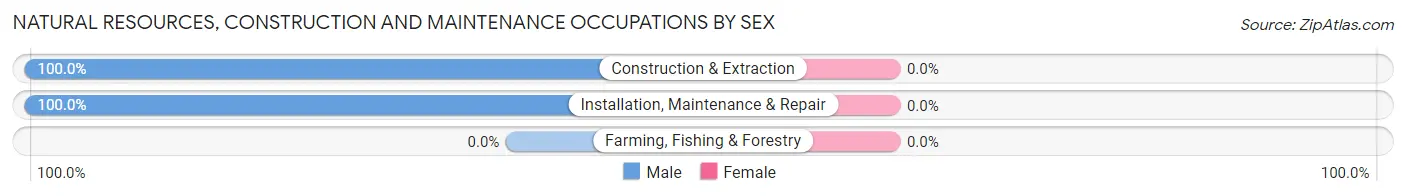
| Occupation | Male | Female |
| Farming, Fishing & Forestry | 0 (0.0%) | 0 (0.0%) |
| Construction & Extraction | 5 (100.0%) | 0 (0.0%) |
| Installation, Maintenance & Repair | 6 (100.0%) | 0 (0.0%) |
| Total (Category) | 11 (100.0%) | 0 (0.0%) |
| Total (Overall) | 59 (54.6%) | 49 (45.4%) |
Production, Transportation and Moving Occupations
The most common Production, Transportation and Moving occupations in New Deal are Production (27 | 25.0%), and Transportation (6 | 5.6%).
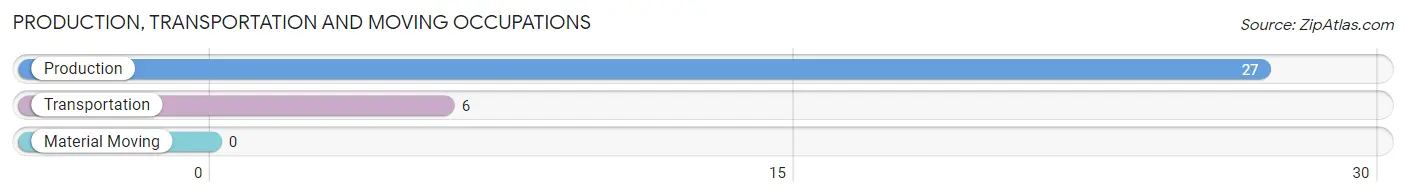
Production, Transportation and Moving Occupations by Sex
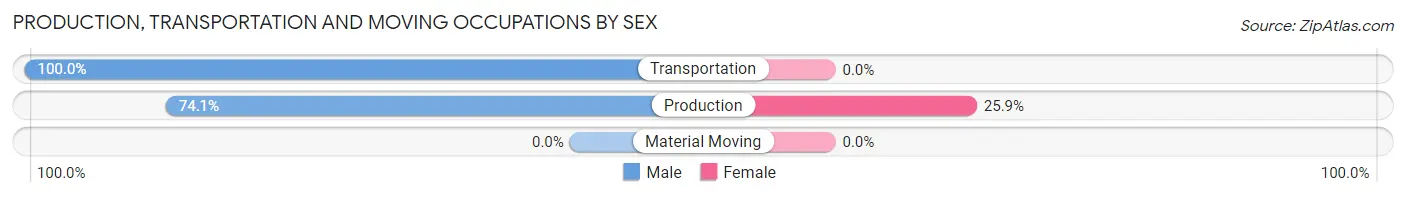
| Occupation | Male | Female |
| Production | 20 (74.1%) | 7 (25.9%) |
| Transportation | 6 (100.0%) | 0 (0.0%) |
| Material Moving | 0 (0.0%) | 0 (0.0%) |
| Total (Category) | 26 (78.8%) | 7 (21.2%) |
| Total (Overall) | 59 (54.6%) | 49 (45.4%) |
Employment Industries by Sex in New Deal
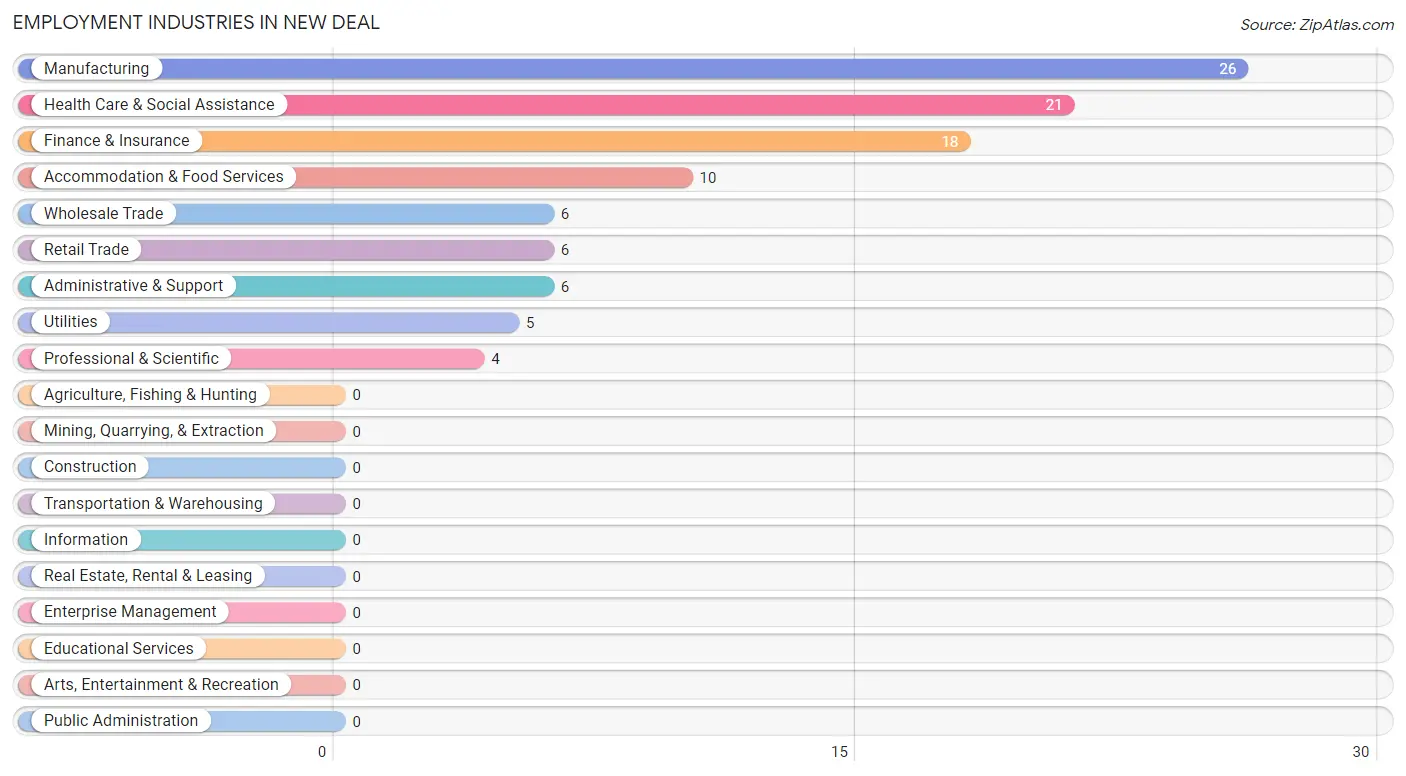
Employment Industries in New Deal
The major employment industries in New Deal include Manufacturing (26 | 24.1%), Health Care & Social Assistance (21 | 19.4%), Finance & Insurance (18 | 16.7%), Accommodation & Food Services (10 | 9.3%), and Wholesale Trade (6 | 5.6%).
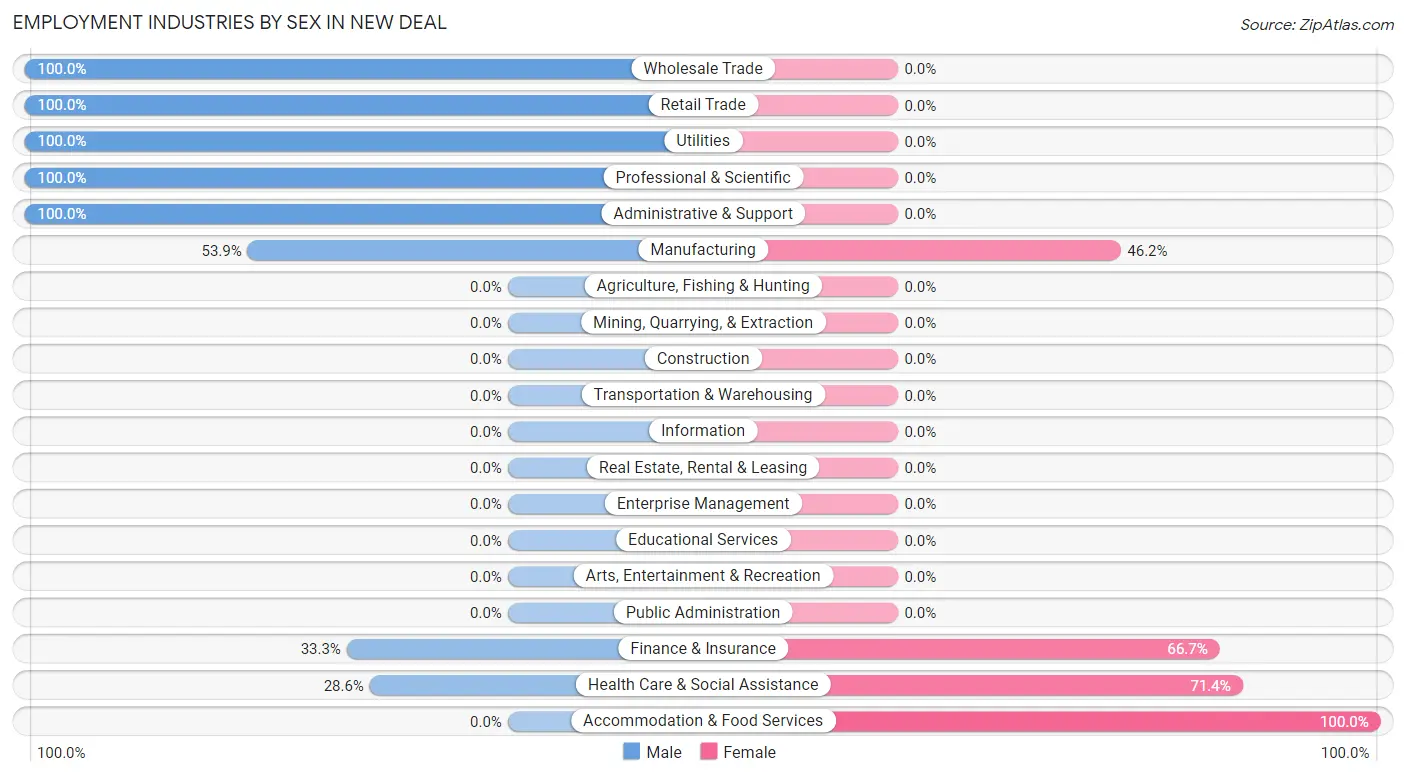
Employment Industries by Sex in New Deal
The New Deal industries that see more men than women are Wholesale Trade (100.0%), Retail Trade (100.0%), and Utilities (100.0%), whereas the industries that tend to have a higher number of women are Accommodation & Food Services (100.0%), Health Care & Social Assistance (71.4%), and Finance & Insurance (66.7%).
| Industry | Male | Female |
| Agriculture, Fishing & Hunting | 0 (0.0%) | 0 (0.0%) |
| Mining, Quarrying, & Extraction | 0 (0.0%) | 0 (0.0%) |
| Construction | 0 (0.0%) | 0 (0.0%) |
| Manufacturing | 14 (53.8%) | 12 (46.2%) |
| Wholesale Trade | 6 (100.0%) | 0 (0.0%) |
| Retail Trade | 6 (100.0%) | 0 (0.0%) |
| Transportation & Warehousing | 0 (0.0%) | 0 (0.0%) |
| Utilities | 5 (100.0%) | 0 (0.0%) |
| Information | 0 (0.0%) | 0 (0.0%) |
| Finance & Insurance | 6 (33.3%) | 12 (66.7%) |
| Real Estate, Rental & Leasing | 0 (0.0%) | 0 (0.0%) |
| Professional & Scientific | 4 (100.0%) | 0 (0.0%) |
| Enterprise Management | 0 (0.0%) | 0 (0.0%) |
| Administrative & Support | 6 (100.0%) | 0 (0.0%) |
| Educational Services | 0 (0.0%) | 0 (0.0%) |
| Health Care & Social Assistance | 6 (28.6%) | 15 (71.4%) |
| Arts, Entertainment & Recreation | 0 (0.0%) | 0 (0.0%) |
| Accommodation & Food Services | 0 (0.0%) | 10 (100.0%) |
| Public Administration | 0 (0.0%) | 0 (0.0%) |
| Total | 59 (54.6%) | 49 (45.4%) |
Education in New Deal
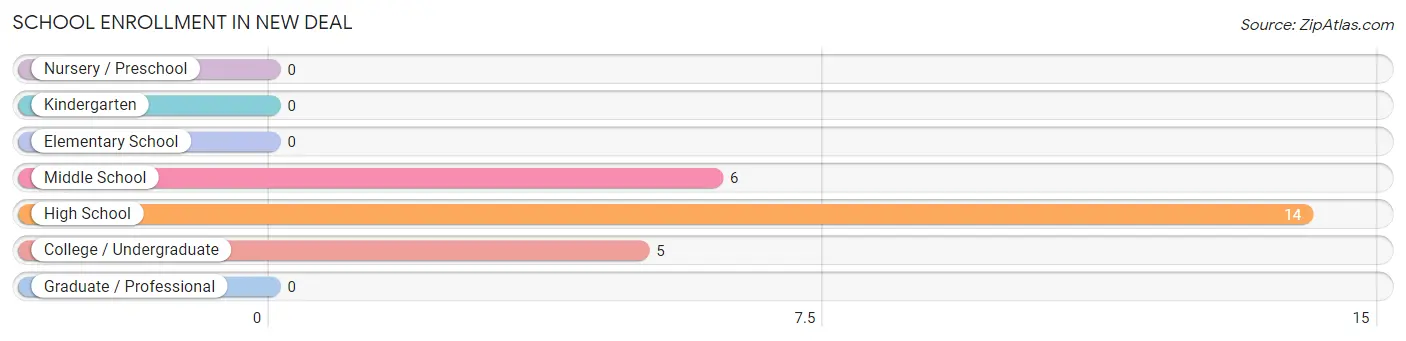
School Enrollment in New Deal
The most common levels of schooling among the 25 students in New Deal are high school (14 | 56.0%), middle school (6 | 24.0%), and college / undergraduate (5 | 20.0%).
| School Level | # Students | % Students |
| Nursery / Preschool | 0 | 0.0% |
| Kindergarten | 0 | 0.0% |
| Elementary School | 0 | 0.0% |
| Middle School | 6 | 24.0% |
| High School | 14 | 56.0% |
| College / Undergraduate | 5 | 20.0% |
| Graduate / Professional | 0 | 0.0% |
| Total | 25 | 100.0% |
School Enrollment by Age by Funding Source in New Deal
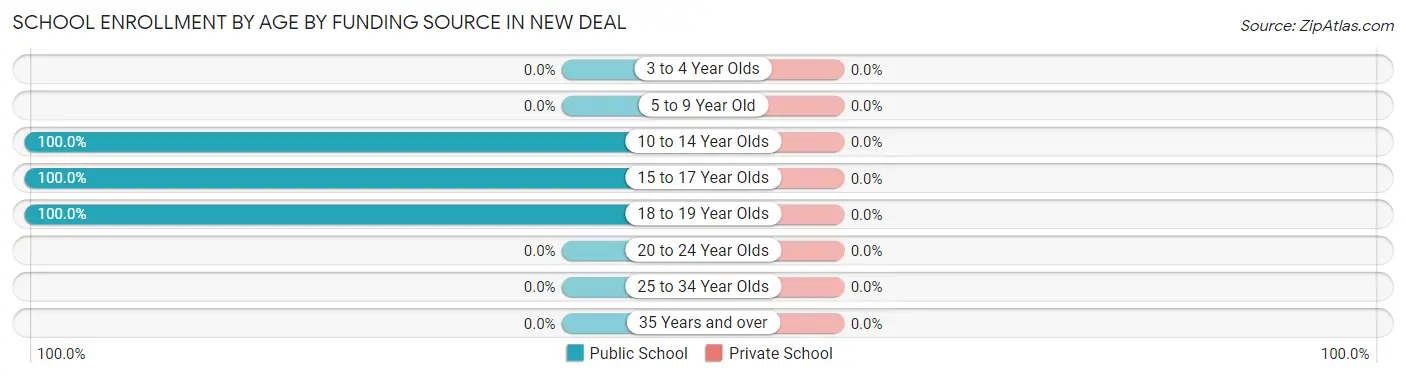
| Age Bracket | Public School | Private School |
| 3 to 4 Year Olds | 0 (0.0%) | 0 (0.0%) |
| 5 to 9 Year Old | 0 (0.0%) | 0 (0.0%) |
| 10 to 14 Year Olds | 6 (100.0%) | 0 (0.0%) |
| 15 to 17 Year Olds | 14 (100.0%) | 0 (0.0%) |
| 18 to 19 Year Olds | 5 (100.0%) | 0 (0.0%) |
| 20 to 24 Year Olds | 0 (0.0%) | 0 (0.0%) |
| 25 to 34 Year Olds | 0 (0.0%) | 0 (0.0%) |
| 35 Years and over | 0 (0.0%) | 0 (0.0%) |
| Total | 25 (100.0%) | 0 (0.0%) |
Educational Attainment by Field of Study in New Deal
Computers & mathematics (6 | 27.3%), science & technology (6 | 27.3%), arts & humanities (6 | 27.3%), and business (4 | 18.2%) are the most common fields of study among 22 individuals in New Deal who have obtained a bachelor's degree or higher.
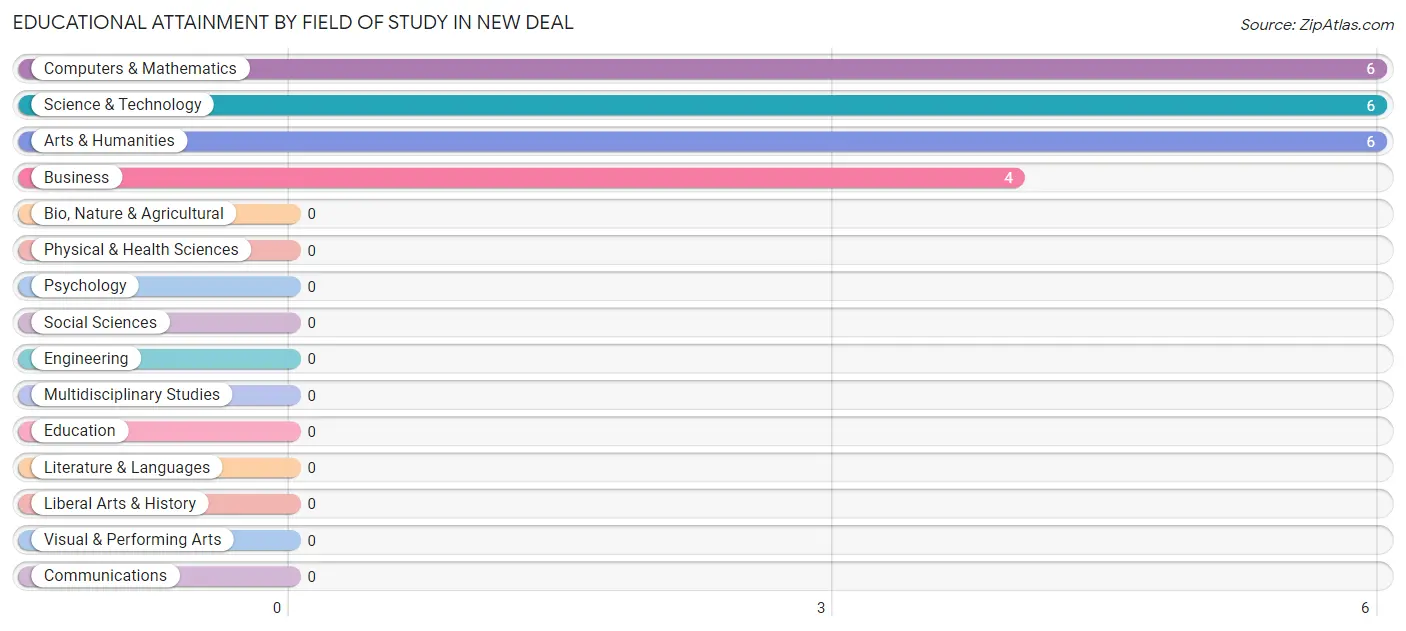
| Field of Study | # Graduates | % Graduates |
| Computers & Mathematics | 6 | 27.3% |
| Bio, Nature & Agricultural | 0 | 0.0% |
| Physical & Health Sciences | 0 | 0.0% |
| Psychology | 0 | 0.0% |
| Social Sciences | 0 | 0.0% |
| Engineering | 0 | 0.0% |
| Multidisciplinary Studies | 0 | 0.0% |
| Science & Technology | 6 | 27.3% |
| Business | 4 | 18.2% |
| Education | 0 | 0.0% |
| Literature & Languages | 0 | 0.0% |
| Liberal Arts & History | 0 | 0.0% |
| Visual & Performing Arts | 0 | 0.0% |
| Communications | 0 | 0.0% |
| Arts & Humanities | 6 | 27.3% |
| Total | 22 | 100.0% |
Transportation & Commute in New Deal
Vehicle Availability by Sex in New Deal
The most prevalent vehicle ownership categories in New Deal are males with 3 vehicles (29, accounting for 49.1%) and females with 3 vehicles (17, making up 59.2%).
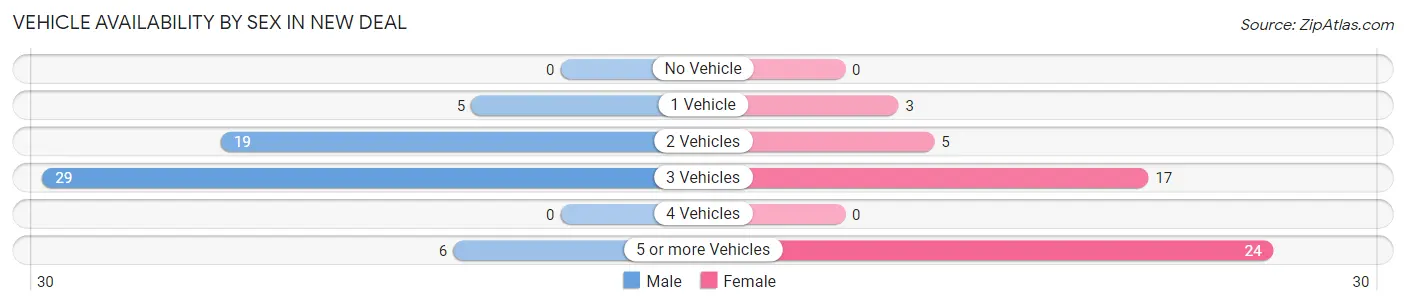
| Vehicles Available | Male | Female |
| No Vehicle | 0 (0.0%) | 0 (0.0%) |
| 1 Vehicle | 5 (8.5%) | 3 (6.1%) |
| 2 Vehicles | 19 (32.2%) | 5 (10.2%) |
| 3 Vehicles | 29 (49.1%) | 17 (34.7%) |
| 4 Vehicles | 0 (0.0%) | 0 (0.0%) |
| 5 or more Vehicles | 6 (10.2%) | 24 (49.0%) |
| Total | 59 (100.0%) | 49 (100.0%) |
Commute Time in New Deal
The most frequently occuring commute durations in New Deal are 10 to 14 minutes (33 commuters, 35.5%), 40 to 44 minutes (22 commuters, 23.7%), and 45 to 59 minutes (12 commuters, 12.9%).
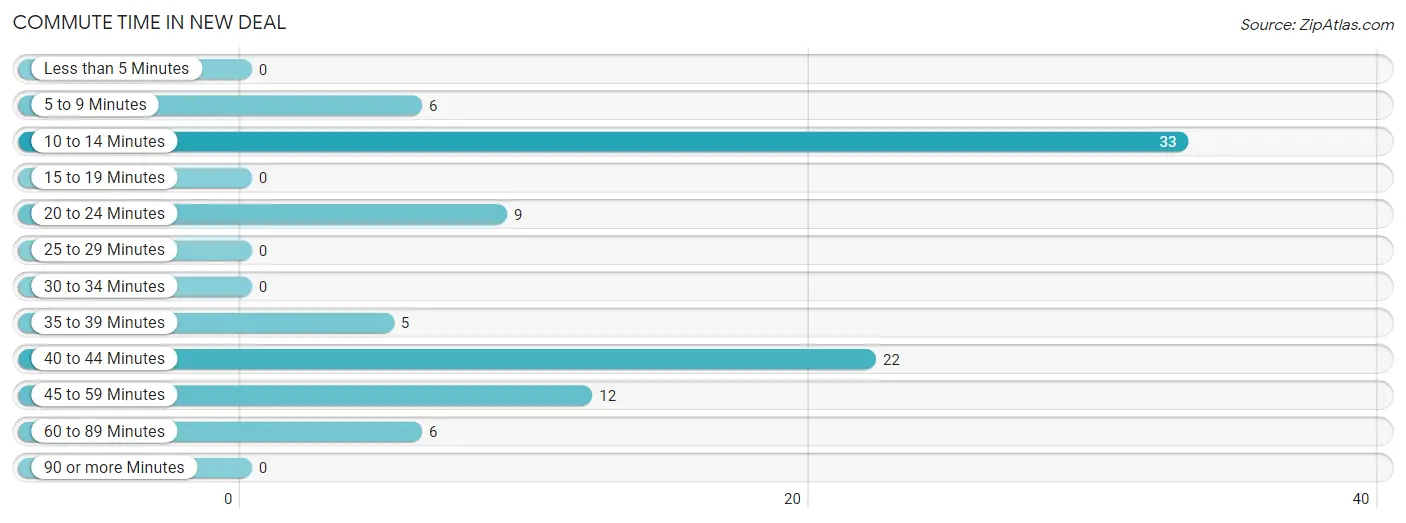
| Commute Time | # Commuters | % Commuters |
| Less than 5 Minutes | 0 | 0.0% |
| 5 to 9 Minutes | 6 | 6.5% |
| 10 to 14 Minutes | 33 | 35.5% |
| 15 to 19 Minutes | 0 | 0.0% |
| 20 to 24 Minutes | 9 | 9.7% |
| 25 to 29 Minutes | 0 | 0.0% |
| 30 to 34 Minutes | 0 | 0.0% |
| 35 to 39 Minutes | 5 | 5.4% |
| 40 to 44 Minutes | 22 | 23.7% |
| 45 to 59 Minutes | 12 | 12.9% |
| 60 to 89 Minutes | 6 | 6.5% |
| 90 or more Minutes | 0 | 0.0% |
Commute Time by Sex in New Deal
The most common commute times in New Deal are 40 to 44 minutes (16 commuters, 32.7%) for males and 10 to 14 minutes (33 commuters, 75.0%) for females.
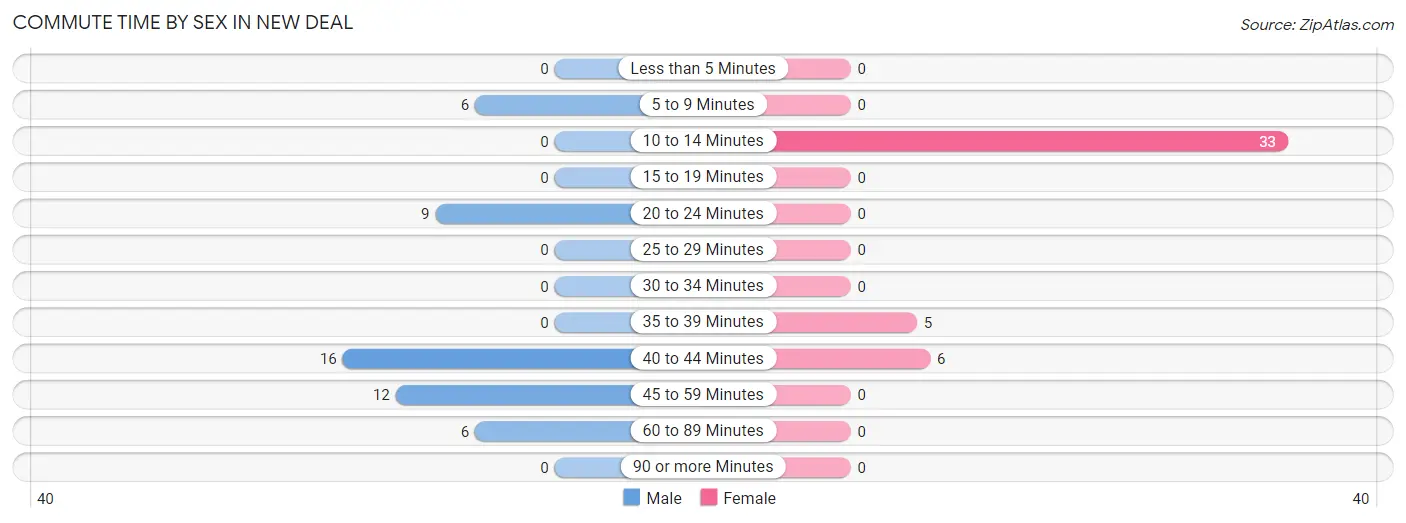
| Commute Time | Male | Female |
| Less than 5 Minutes | 0 (0.0%) | 0 (0.0%) |
| 5 to 9 Minutes | 6 (12.2%) | 0 (0.0%) |
| 10 to 14 Minutes | 0 (0.0%) | 33 (75.0%) |
| 15 to 19 Minutes | 0 (0.0%) | 0 (0.0%) |
| 20 to 24 Minutes | 9 (18.4%) | 0 (0.0%) |
| 25 to 29 Minutes | 0 (0.0%) | 0 (0.0%) |
| 30 to 34 Minutes | 0 (0.0%) | 0 (0.0%) |
| 35 to 39 Minutes | 0 (0.0%) | 5 (11.4%) |
| 40 to 44 Minutes | 16 (32.7%) | 6 (13.6%) |
| 45 to 59 Minutes | 12 (24.5%) | 0 (0.0%) |
| 60 to 89 Minutes | 6 (12.2%) | 0 (0.0%) |
| 90 or more Minutes | 0 (0.0%) | 0 (0.0%) |
Time of Departure to Work by Sex in New Deal
The most frequent times of departure to work in New Deal are 5:00 AM to 5:29 AM (17, 34.7%) for males and 7:30 AM to 7:59 AM (14, 31.8%) for females.
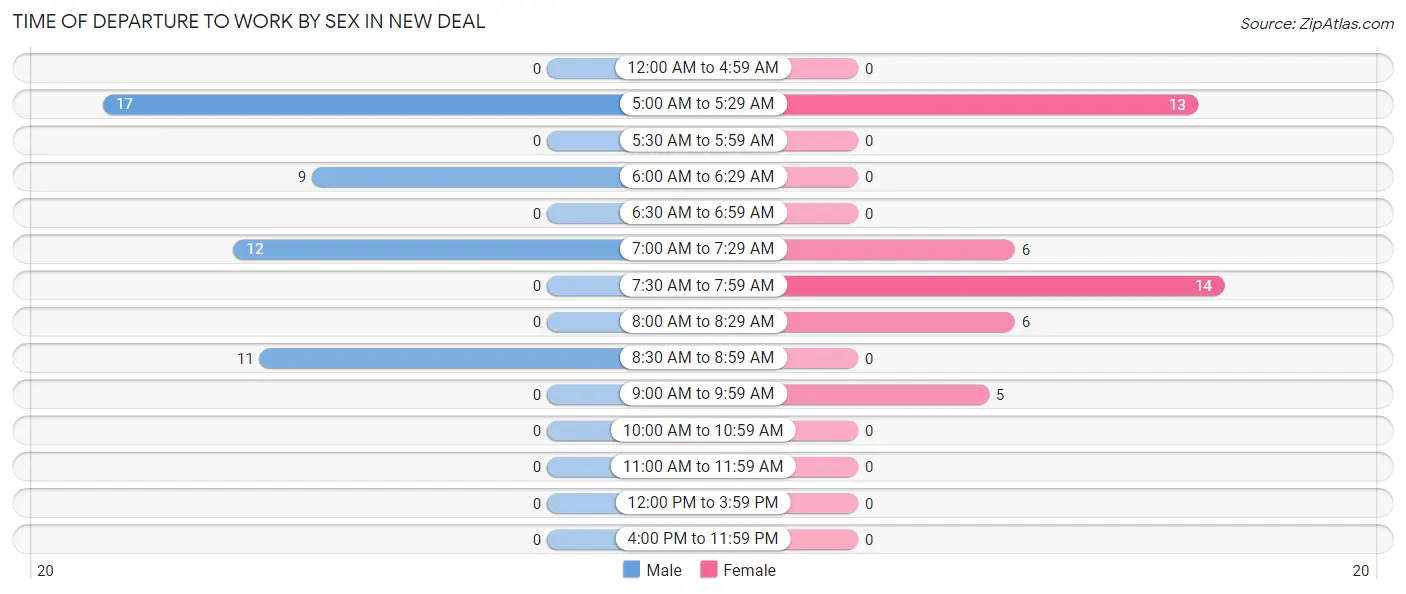
| Time of Departure | Male | Female |
| 12:00 AM to 4:59 AM | 0 (0.0%) | 0 (0.0%) |
| 5:00 AM to 5:29 AM | 17 (34.7%) | 13 (29.5%) |
| 5:30 AM to 5:59 AM | 0 (0.0%) | 0 (0.0%) |
| 6:00 AM to 6:29 AM | 9 (18.4%) | 0 (0.0%) |
| 6:30 AM to 6:59 AM | 0 (0.0%) | 0 (0.0%) |
| 7:00 AM to 7:29 AM | 12 (24.5%) | 6 (13.6%) |
| 7:30 AM to 7:59 AM | 0 (0.0%) | 14 (31.8%) |
| 8:00 AM to 8:29 AM | 0 (0.0%) | 6 (13.6%) |
| 8:30 AM to 8:59 AM | 11 (22.5%) | 0 (0.0%) |
| 9:00 AM to 9:59 AM | 0 (0.0%) | 5 (11.4%) |
| 10:00 AM to 10:59 AM | 0 (0.0%) | 0 (0.0%) |
| 11:00 AM to 11:59 AM | 0 (0.0%) | 0 (0.0%) |
| 12:00 PM to 3:59 PM | 0 (0.0%) | 0 (0.0%) |
| 4:00 PM to 11:59 PM | 0 (0.0%) | 0 (0.0%) |
| Total | 49 (100.0%) | 44 (100.0%) |
Housing Occupancy in New Deal
Occupancy by Ownership in New Deal
Of the total 103 dwellings in New Deal, owner-occupied units account for 92 (89.3%), while renter-occupied units make up 11 (10.7%).
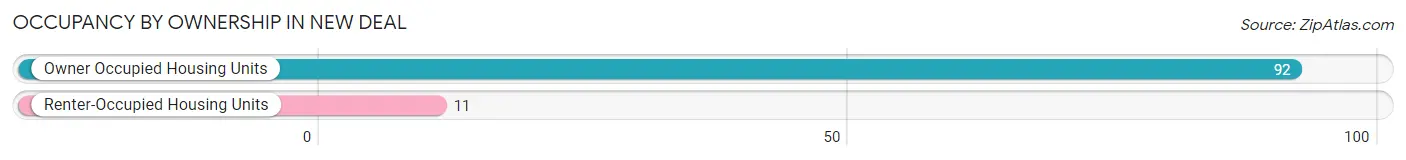
| Occupancy | # Housing Units | % Housing Units |
| Owner Occupied Housing Units | 92 | 89.3% |
| Renter-Occupied Housing Units | 11 | 10.7% |
| Total Occupied Housing Units | 103 | 100.0% |
Occupancy by Household Size in New Deal
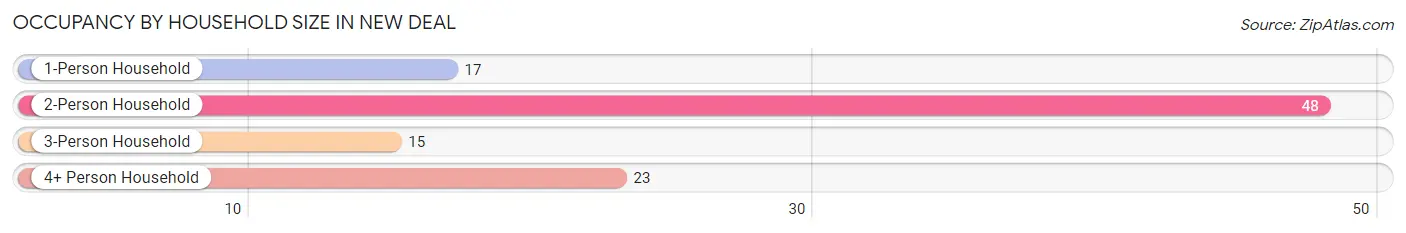
| Household Size | # Housing Units | % Housing Units |
| 1-Person Household | 17 | 16.5% |
| 2-Person Household | 48 | 46.6% |
| 3-Person Household | 15 | 14.6% |
| 4+ Person Household | 23 | 22.3% |
| Total Housing Units | 103 | 100.0% |
Occupancy by Ownership by Household Size in New Deal
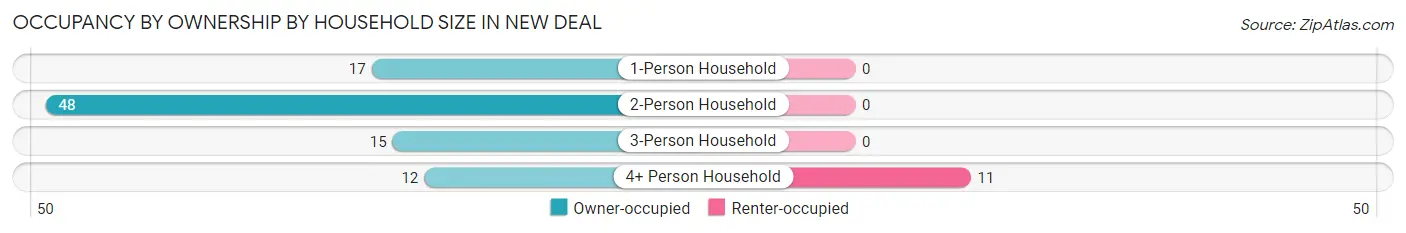
| Household Size | Owner-occupied | Renter-occupied |
| 1-Person Household | 17 (100.0%) | 0 (0.0%) |
| 2-Person Household | 48 (100.0%) | 0 (0.0%) |
| 3-Person Household | 15 (100.0%) | 0 (0.0%) |
| 4+ Person Household | 12 (52.2%) | 11 (47.8%) |
| Total Housing Units | 92 (89.3%) | 11 (10.7%) |
Occupancy by Educational Attainment in New Deal
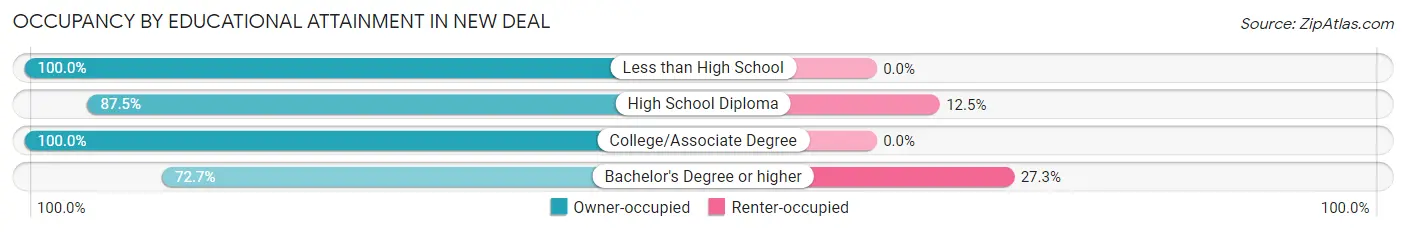
| Household Size | Owner-occupied | Renter-occupied |
| Less than High School | 6 (100.0%) | 0 (0.0%) |
| High School Diploma | 35 (87.5%) | 5 (12.5%) |
| College/Associate Degree | 35 (100.0%) | 0 (0.0%) |
| Bachelor's Degree or higher | 16 (72.7%) | 6 (27.3%) |
Occupancy by Age of Householder in New Deal
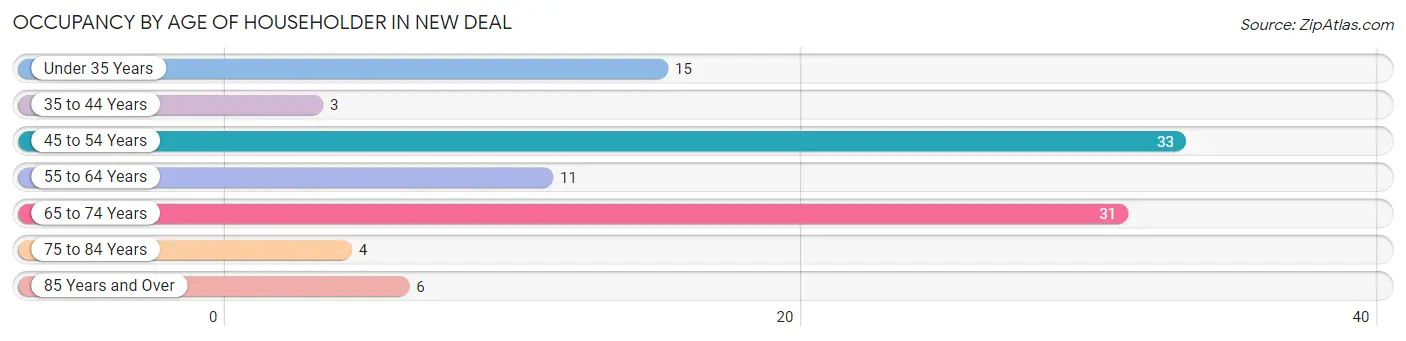
| Age Bracket | # Households | % Households |
| Under 35 Years | 15 | 14.6% |
| 35 to 44 Years | 3 | 2.9% |
| 45 to 54 Years | 33 | 32.0% |
| 55 to 64 Years | 11 | 10.7% |
| 65 to 74 Years | 31 | 30.1% |
| 75 to 84 Years | 4 | 3.9% |
| 85 Years and Over | 6 | 5.8% |
| Total | 103 | 100.0% |
Housing Finances in New Deal
Median Income by Occupancy in New Deal
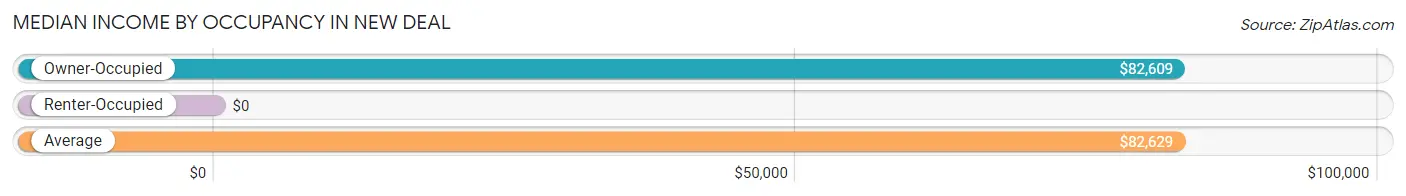
| Occupancy Type | # Households | Median Income |
| Owner-Occupied | 92 (89.3%) | $82,609 |
| Renter-Occupied | 11 (10.7%) | $0 |
| Average | 103 (100.0%) | $82,629 |
Occupancy by Householder Income Bracket in New Deal
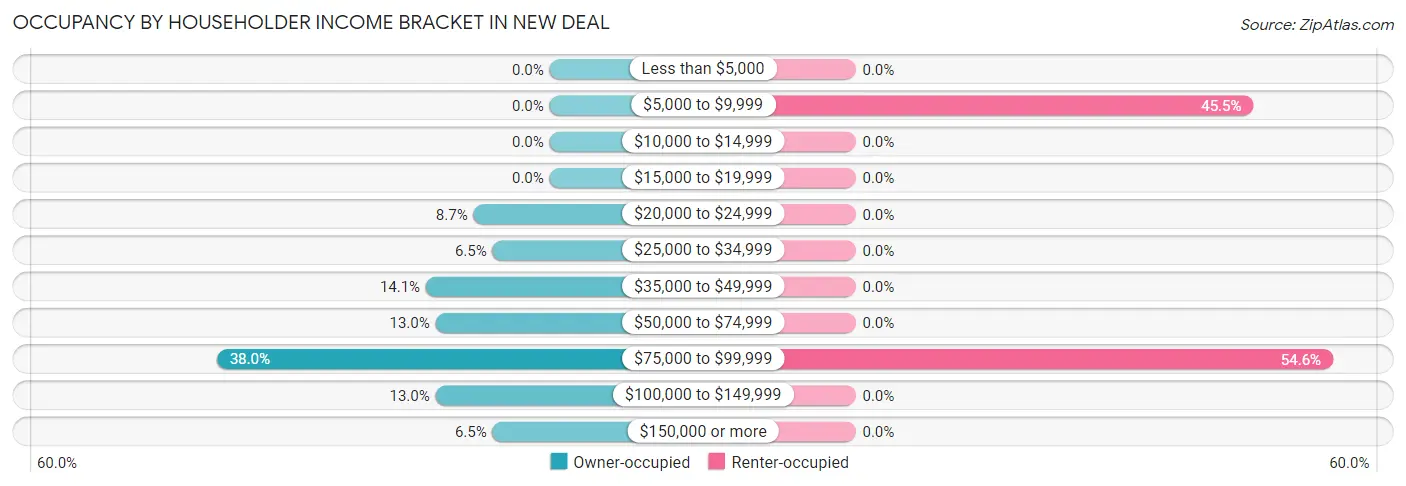
| Income Bracket | Owner-occupied | Renter-occupied |
| Less than $5,000 | 0 (0.0%) | 0 (0.0%) |
| $5,000 to $9,999 | 0 (0.0%) | 5 (45.5%) |
| $10,000 to $14,999 | 0 (0.0%) | 0 (0.0%) |
| $15,000 to $19,999 | 0 (0.0%) | 0 (0.0%) |
| $20,000 to $24,999 | 8 (8.7%) | 0 (0.0%) |
| $25,000 to $34,999 | 6 (6.5%) | 0 (0.0%) |
| $35,000 to $49,999 | 13 (14.1%) | 0 (0.0%) |
| $50,000 to $74,999 | 12 (13.0%) | 0 (0.0%) |
| $75,000 to $99,999 | 35 (38.0%) | 6 (54.5%) |
| $100,000 to $149,999 | 12 (13.0%) | 0 (0.0%) |
| $150,000 or more | 6 (6.5%) | 0 (0.0%) |
| Total | 92 (100.0%) | 11 (100.0%) |
Monthly Housing Cost Tiers in New Deal
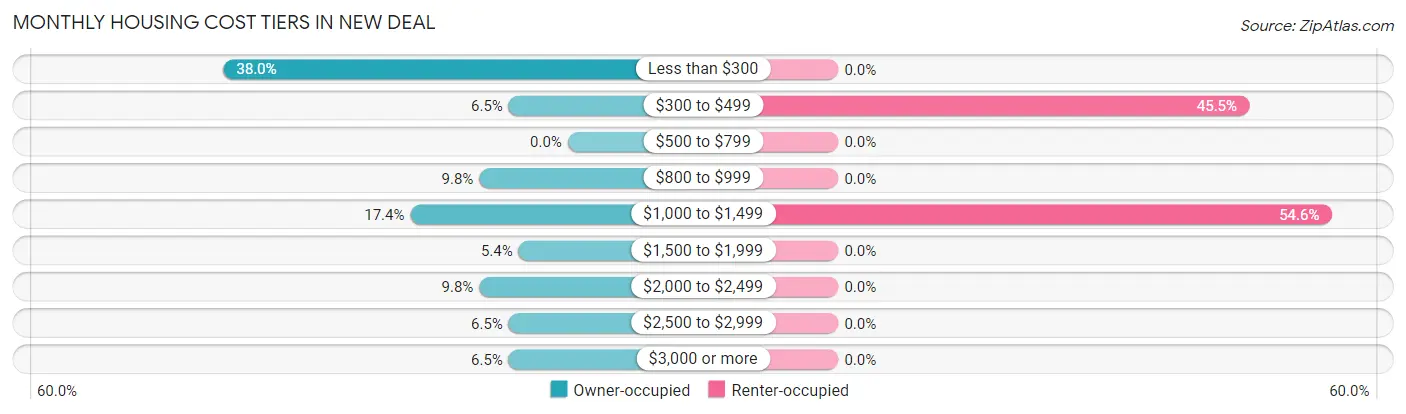
| Monthly Cost | Owner-occupied | Renter-occupied |
| Less than $300 | 35 (38.0%) | 0 (0.0%) |
| $300 to $499 | 6 (6.5%) | 5 (45.5%) |
| $500 to $799 | 0 (0.0%) | 0 (0.0%) |
| $800 to $999 | 9 (9.8%) | 0 (0.0%) |
| $1,000 to $1,499 | 16 (17.4%) | 6 (54.5%) |
| $1,500 to $1,999 | 5 (5.4%) | 0 (0.0%) |
| $2,000 to $2,499 | 9 (9.8%) | 0 (0.0%) |
| $2,500 to $2,999 | 6 (6.5%) | 0 (0.0%) |
| $3,000 or more | 6 (6.5%) | 0 (0.0%) |
| Total | 92 (100.0%) | 11 (100.0%) |
Physical Housing Characteristics in New Deal
Housing Structures in New Deal
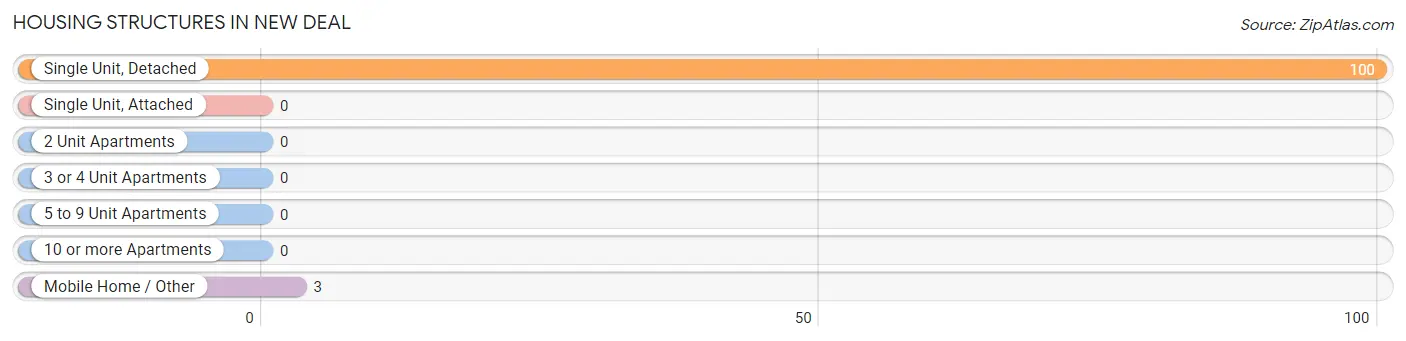
| Structure Type | # Housing Units | % Housing Units |
| Single Unit, Detached | 100 | 97.1% |
| Single Unit, Attached | 0 | 0.0% |
| 2 Unit Apartments | 0 | 0.0% |
| 3 or 4 Unit Apartments | 0 | 0.0% |
| 5 to 9 Unit Apartments | 0 | 0.0% |
| 10 or more Apartments | 0 | 0.0% |
| Mobile Home / Other | 3 | 2.9% |
| Total | 103 | 100.0% |
Housing Structures by Occupancy in New Deal
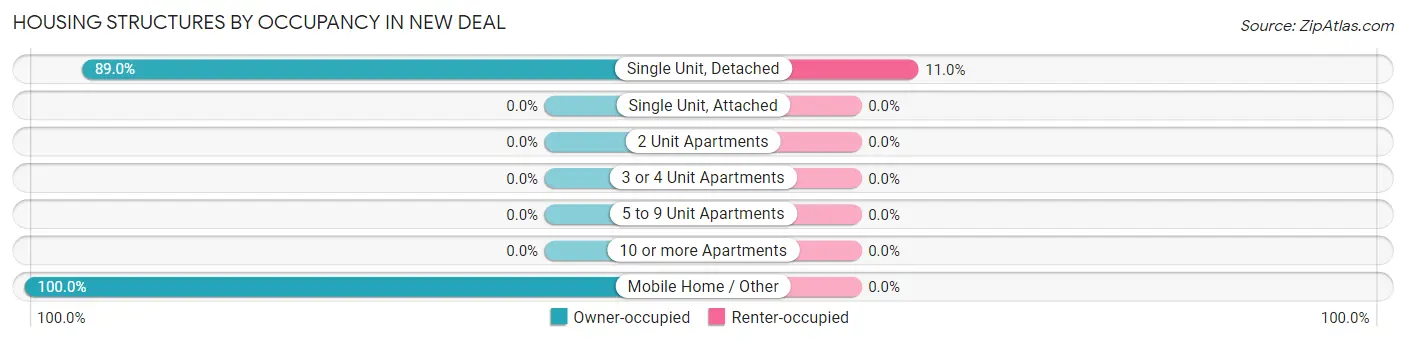
| Structure Type | Owner-occupied | Renter-occupied |
| Single Unit, Detached | 89 (89.0%) | 11 (11.0%) |
| Single Unit, Attached | 0 (0.0%) | 0 (0.0%) |
| 2 Unit Apartments | 0 (0.0%) | 0 (0.0%) |
| 3 or 4 Unit Apartments | 0 (0.0%) | 0 (0.0%) |
| 5 to 9 Unit Apartments | 0 (0.0%) | 0 (0.0%) |
| 10 or more Apartments | 0 (0.0%) | 0 (0.0%) |
| Mobile Home / Other | 3 (100.0%) | 0 (0.0%) |
| Total | 92 (89.3%) | 11 (10.7%) |
Housing Structures by Number of Rooms in New Deal
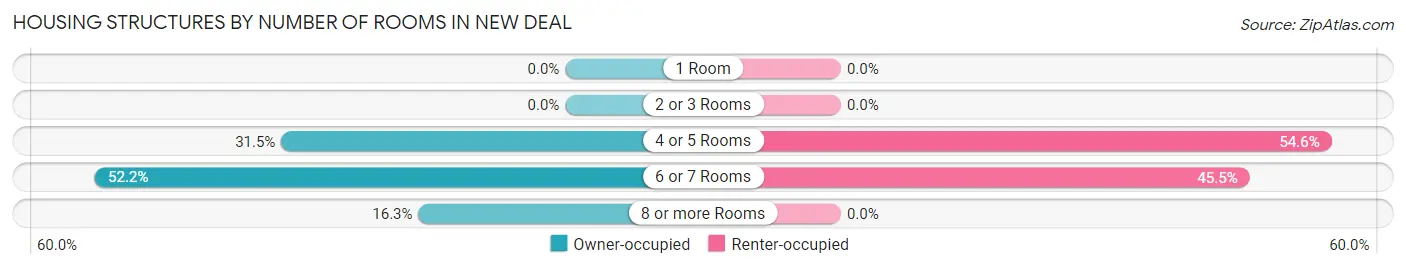
| Number of Rooms | Owner-occupied | Renter-occupied |
| 1 Room | 0 (0.0%) | 0 (0.0%) |
| 2 or 3 Rooms | 0 (0.0%) | 0 (0.0%) |
| 4 or 5 Rooms | 29 (31.5%) | 6 (54.5%) |
| 6 or 7 Rooms | 48 (52.2%) | 5 (45.5%) |
| 8 or more Rooms | 15 (16.3%) | 0 (0.0%) |
| Total | 92 (100.0%) | 11 (100.0%) |
Housing Structure by Heating Type in New Deal
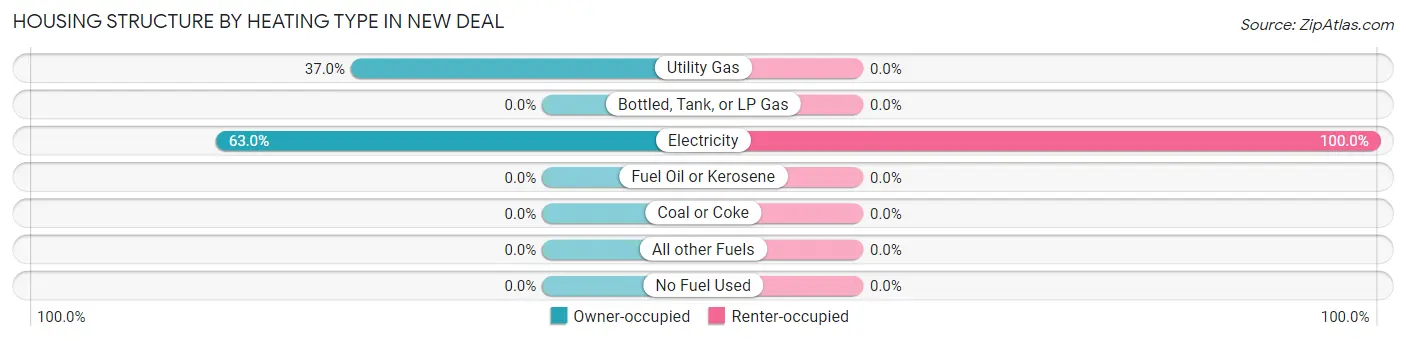
| Heating Type | Owner-occupied | Renter-occupied |
| Utility Gas | 34 (37.0%) | 0 (0.0%) |
| Bottled, Tank, or LP Gas | 0 (0.0%) | 0 (0.0%) |
| Electricity | 58 (63.0%) | 11 (100.0%) |
| Fuel Oil or Kerosene | 0 (0.0%) | 0 (0.0%) |
| Coal or Coke | 0 (0.0%) | 0 (0.0%) |
| All other Fuels | 0 (0.0%) | 0 (0.0%) |
| No Fuel Used | 0 (0.0%) | 0 (0.0%) |
| Total | 92 (100.0%) | 11 (100.0%) |
Household Vehicle Usage in New Deal
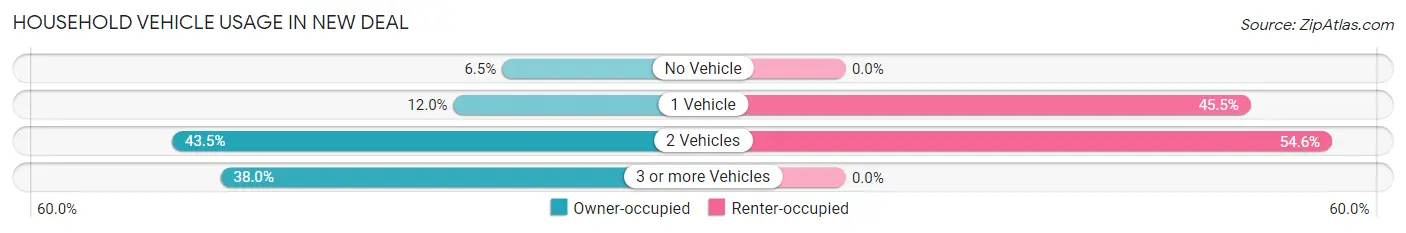
| Vehicles per Household | Owner-occupied | Renter-occupied |
| No Vehicle | 6 (6.5%) | 0 (0.0%) |
| 1 Vehicle | 11 (12.0%) | 5 (45.5%) |
| 2 Vehicles | 40 (43.5%) | 6 (54.5%) |
| 3 or more Vehicles | 35 (38.0%) | 0 (0.0%) |
| Total | 92 (100.0%) | 11 (100.0%) |
Real Estate & Mortgages in New Deal
Real Estate and Mortgage Overview in New Deal
| Characteristic | Without Mortgage | With Mortgage |
| Housing Units | 41 | 51 |
| Median Property Value | $223,100 | $279,500 |
| Median Household Income | - | - |
| Monthly Housing Costs | $277 | $6 |
| Real Estate Taxes | $876 | $0 |
Property Value by Mortgage Status in New Deal
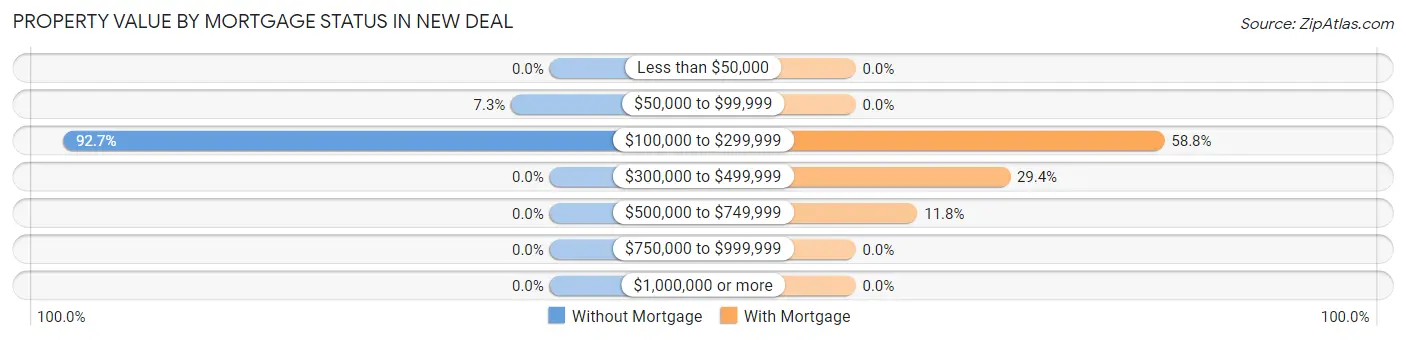
| Property Value | Without Mortgage | With Mortgage |
| Less than $50,000 | 0 (0.0%) | 0 (0.0%) |
| $50,000 to $99,999 | 3 (7.3%) | 0 (0.0%) |
| $100,000 to $299,999 | 38 (92.7%) | 30 (58.8%) |
| $300,000 to $499,999 | 0 (0.0%) | 15 (29.4%) |
| $500,000 to $749,999 | 0 (0.0%) | 6 (11.8%) |
| $750,000 to $999,999 | 0 (0.0%) | 0 (0.0%) |
| $1,000,000 or more | 0 (0.0%) | 0 (0.0%) |
| Total | 41 (100.0%) | 51 (100.0%) |
Household Income by Mortgage Status in New Deal
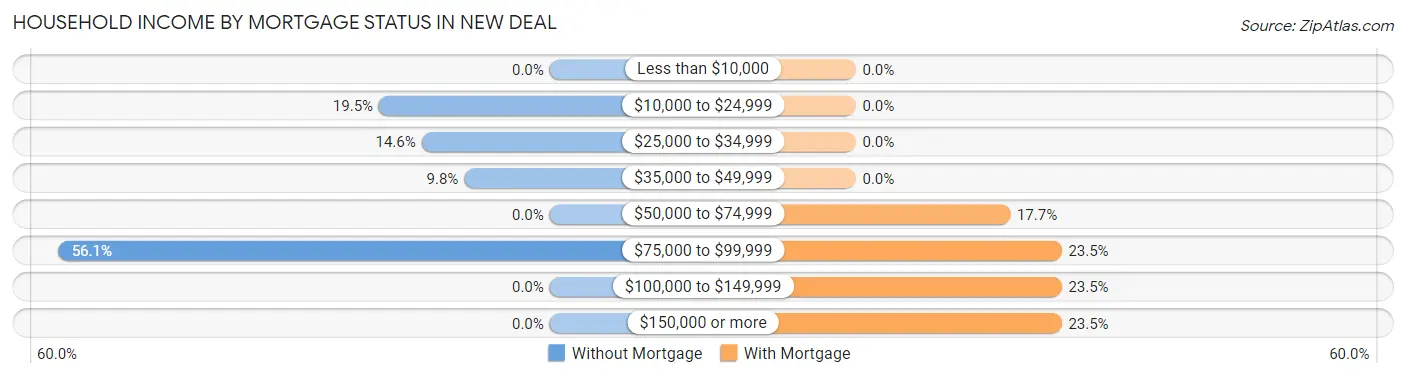
| Household Income | Without Mortgage | With Mortgage |
| Less than $10,000 | 0 (0.0%) | 0 (0.0%) |
| $10,000 to $24,999 | 8 (19.5%) | 0 (0.0%) |
| $25,000 to $34,999 | 6 (14.6%) | 0 (0.0%) |
| $35,000 to $49,999 | 4 (9.8%) | 0 (0.0%) |
| $50,000 to $74,999 | 0 (0.0%) | 9 (17.6%) |
| $75,000 to $99,999 | 23 (56.1%) | 12 (23.5%) |
| $100,000 to $149,999 | 0 (0.0%) | 12 (23.5%) |
| $150,000 or more | 0 (0.0%) | 12 (23.5%) |
| Total | 41 (100.0%) | 51 (100.0%) |
Property Value to Household Income Ratio in New Deal
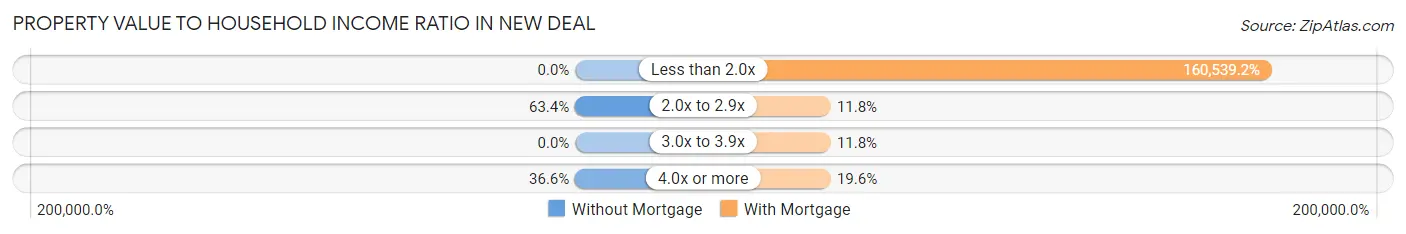
| Value-to-Income Ratio | Without Mortgage | With Mortgage |
| Less than 2.0x | 0 (0.0%) | 81,875 (160,539.2%) |
| 2.0x to 2.9x | 26 (63.4%) | 6 (11.8%) |
| 3.0x to 3.9x | 0 (0.0%) | 6 (11.8%) |
| 4.0x or more | 15 (36.6%) | 10 (19.6%) |
| Total | 41 (100.0%) | 51 (100.0%) |
Real Estate Taxes by Mortgage Status in New Deal
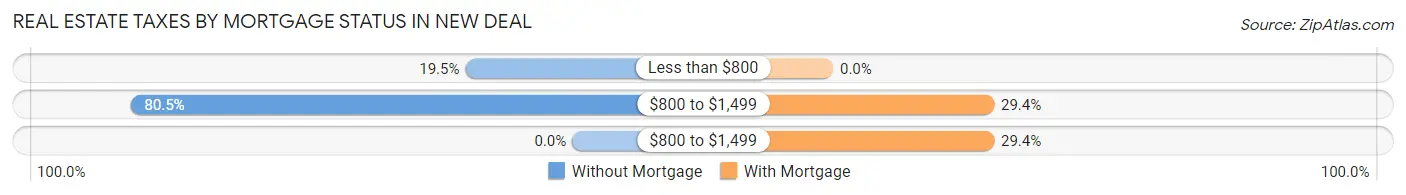
| Property Taxes | Without Mortgage | With Mortgage |
| Less than $800 | 8 (19.5%) | 0 (0.0%) |
| $800 to $1,499 | 33 (80.5%) | 15 (29.4%) |
| $800 to $1,499 | 0 (0.0%) | 15 (29.4%) |
| Total | 41 (100.0%) | 51 (100.0%) |
Health & Disability in New Deal
Health Insurance Coverage by Age in New Deal
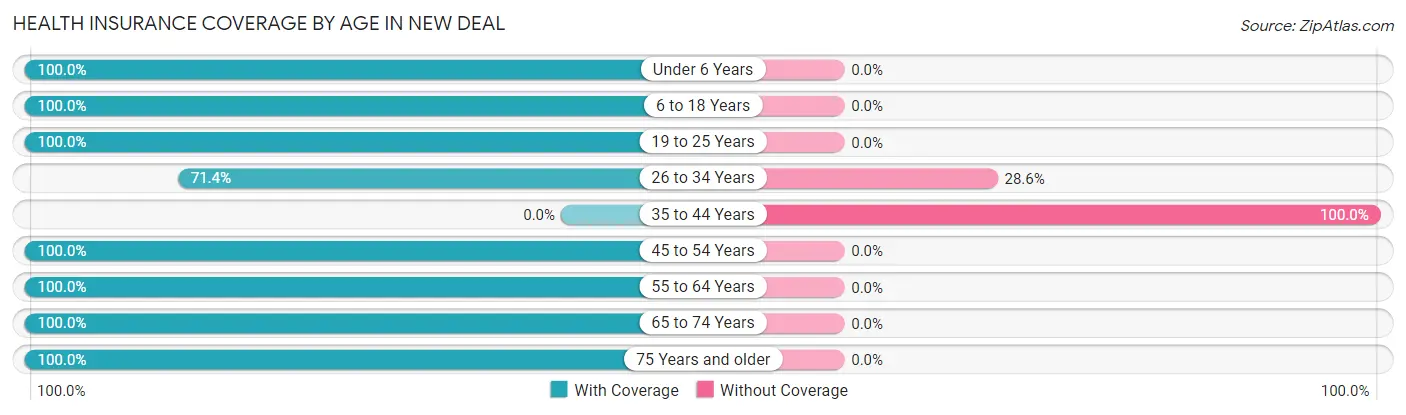
| Age Bracket | With Coverage | Without Coverage |
| Under 6 Years | 12 (100.0%) | 0 (0.0%) |
| 6 to 18 Years | 26 (100.0%) | 0 (0.0%) |
| 19 to 25 Years | 23 (100.0%) | 0 (0.0%) |
| 26 to 34 Years | 15 (71.4%) | 6 (28.6%) |
| 35 to 44 Years | 0 (0.0%) | 3 (100.0%) |
| 45 to 54 Years | 58 (100.0%) | 0 (0.0%) |
| 55 to 64 Years | 23 (100.0%) | 0 (0.0%) |
| 65 to 74 Years | 57 (100.0%) | 0 (0.0%) |
| 75 Years and older | 35 (100.0%) | 0 (0.0%) |
| Total | 249 (96.5%) | 9 (3.5%) |
Health Insurance Coverage by Citizenship Status in New Deal
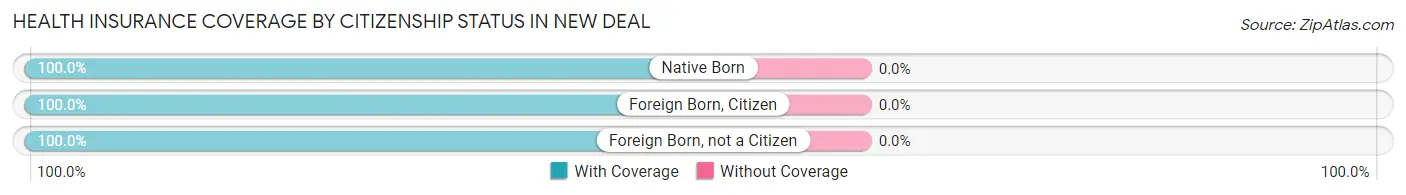
| Citizenship Status | With Coverage | Without Coverage |
| Native Born | 12 (100.0%) | 0 (0.0%) |
| Foreign Born, Citizen | 26 (100.0%) | 0 (0.0%) |
| Foreign Born, not a Citizen | 23 (100.0%) | 0 (0.0%) |
Health Insurance Coverage by Household Income in New Deal
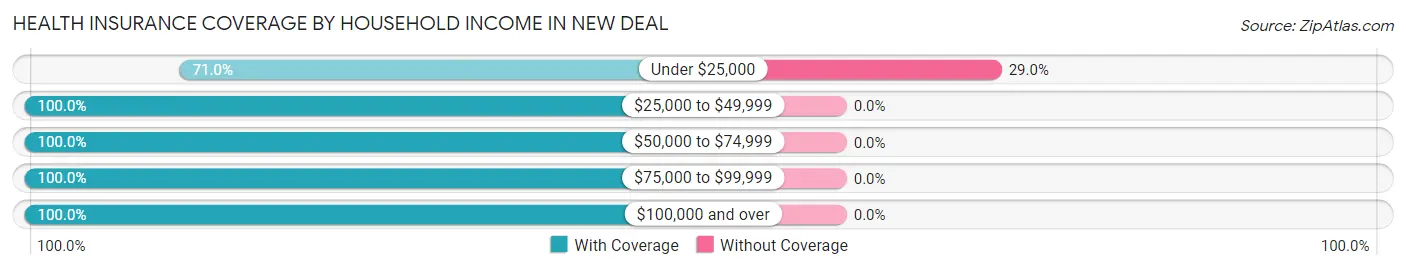
| Household Income | With Coverage | Without Coverage |
| Under $25,000 | 22 (71.0%) | 9 (29.0%) |
| $25,000 to $49,999 | 48 (100.0%) | 0 (0.0%) |
| $50,000 to $74,999 | 14 (100.0%) | 0 (0.0%) |
| $75,000 to $99,999 | 100 (100.0%) | 0 (0.0%) |
| $100,000 and over | 65 (100.0%) | 0 (0.0%) |
Public vs Private Health Insurance Coverage by Age in New Deal
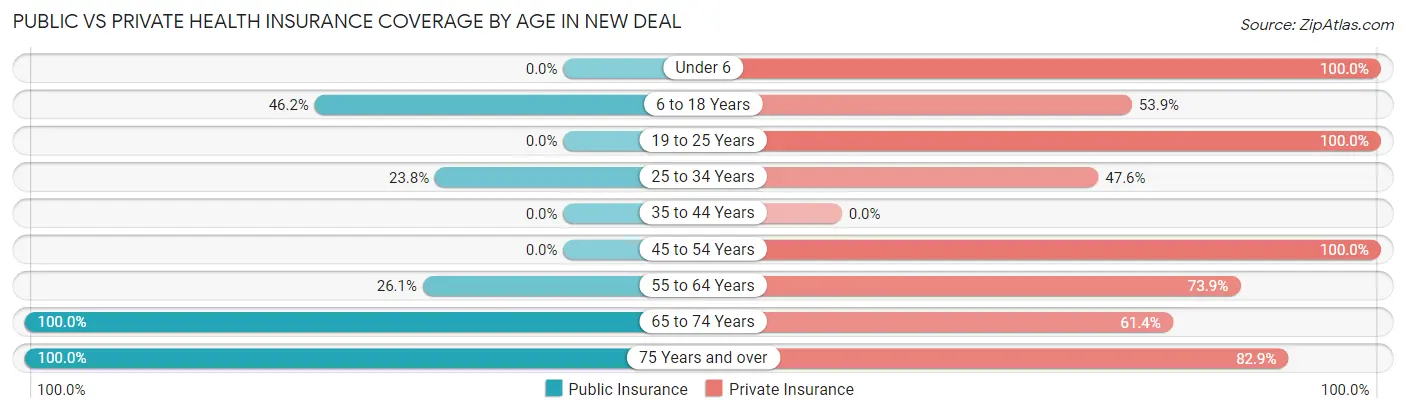
| Age Bracket | Public Insurance | Private Insurance |
| Under 6 | 0 (0.0%) | 12 (100.0%) |
| 6 to 18 Years | 12 (46.2%) | 14 (53.8%) |
| 19 to 25 Years | 0 (0.0%) | 23 (100.0%) |
| 25 to 34 Years | 5 (23.8%) | 10 (47.6%) |
| 35 to 44 Years | 0 (0.0%) | 0 (0.0%) |
| 45 to 54 Years | 0 (0.0%) | 58 (100.0%) |
| 55 to 64 Years | 6 (26.1%) | 17 (73.9%) |
| 65 to 74 Years | 57 (100.0%) | 35 (61.4%) |
| 75 Years and over | 35 (100.0%) | 29 (82.9%) |
| Total | 115 (44.6%) | 198 (76.7%) |
Disability Status by Sex by Age in New Deal
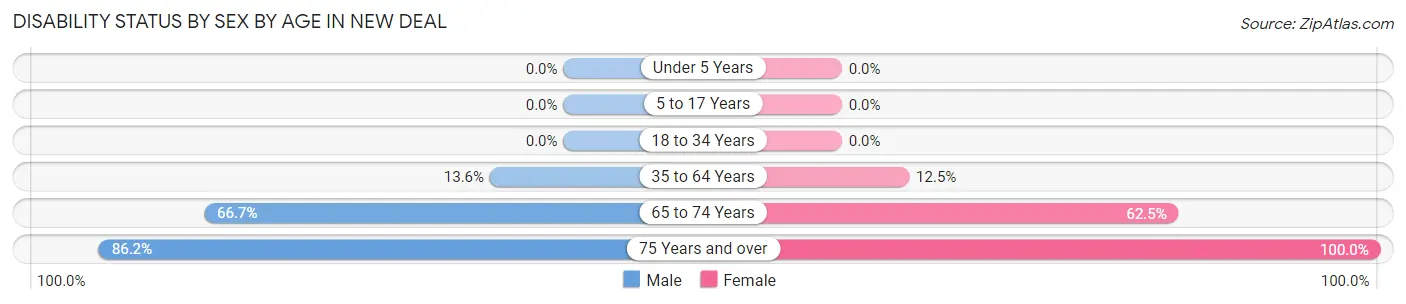
| Age Bracket | Male | Female |
| Under 5 Years | 0 (0.0%) | 0 (0.0%) |
| 5 to 17 Years | 0 (0.0%) | 0 (0.0%) |
| 18 to 34 Years | 0 (0.0%) | 0 (0.0%) |
| 35 to 64 Years | 6 (13.6%) | 5 (12.5%) |
| 65 to 74 Years | 6 (66.7%) | 30 (62.5%) |
| 75 Years and over | 25 (86.2%) | 6 (100.0%) |
Disability Class by Sex by Age in New Deal
Disability Class: Hearing Difficulty
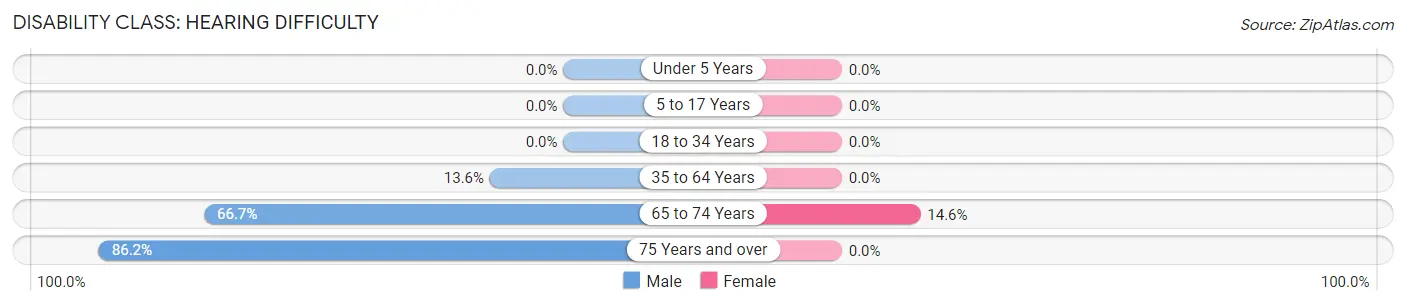
| Age Bracket | Male | Female |
| Under 5 Years | 0 (0.0%) | 0 (0.0%) |
| 5 to 17 Years | 0 (0.0%) | 0 (0.0%) |
| 18 to 34 Years | 0 (0.0%) | 0 (0.0%) |
| 35 to 64 Years | 6 (13.6%) | 0 (0.0%) |
| 65 to 74 Years | 6 (66.7%) | 7 (14.6%) |
| 75 Years and over | 25 (86.2%) | 0 (0.0%) |
Disability Class: Vision Difficulty
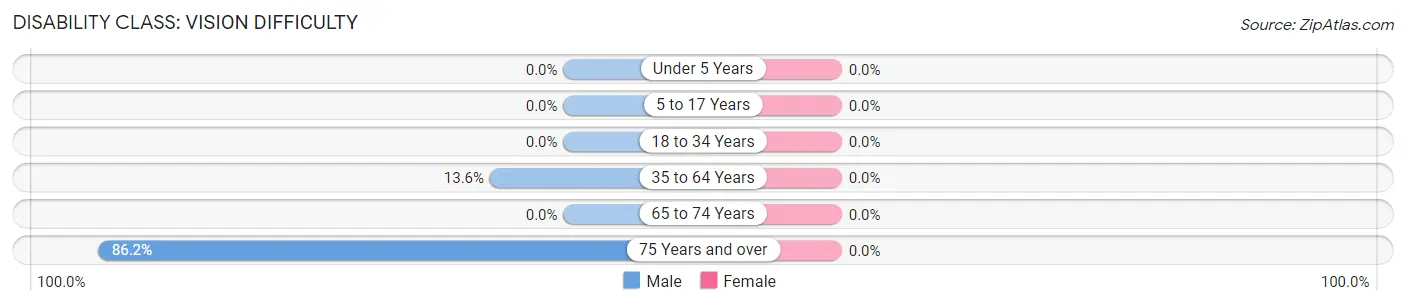
| Age Bracket | Male | Female |
| Under 5 Years | 0 (0.0%) | 0 (0.0%) |
| 5 to 17 Years | 0 (0.0%) | 0 (0.0%) |
| 18 to 34 Years | 0 (0.0%) | 0 (0.0%) |
| 35 to 64 Years | 6 (13.6%) | 0 (0.0%) |
| 65 to 74 Years | 0 (0.0%) | 0 (0.0%) |
| 75 Years and over | 25 (86.2%) | 0 (0.0%) |
Disability Class: Cognitive Difficulty
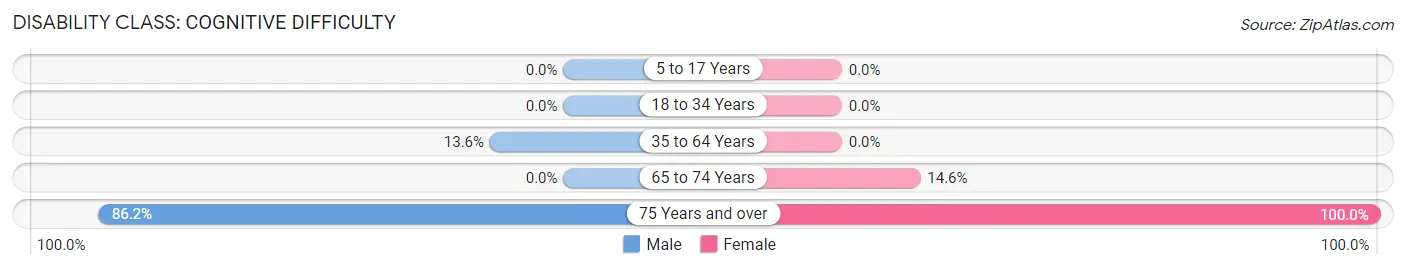
| Age Bracket | Male | Female |
| 5 to 17 Years | 0 (0.0%) | 0 (0.0%) |
| 18 to 34 Years | 0 (0.0%) | 0 (0.0%) |
| 35 to 64 Years | 6 (13.6%) | 0 (0.0%) |
| 65 to 74 Years | 0 (0.0%) | 7 (14.6%) |
| 75 Years and over | 25 (86.2%) | 6 (100.0%) |
Disability Class: Ambulatory Difficulty
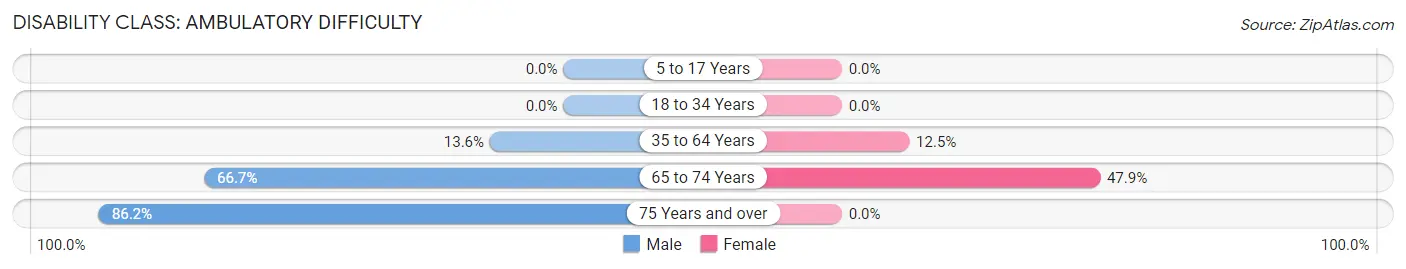
| Age Bracket | Male | Female |
| 5 to 17 Years | 0 (0.0%) | 0 (0.0%) |
| 18 to 34 Years | 0 (0.0%) | 0 (0.0%) |
| 35 to 64 Years | 6 (13.6%) | 5 (12.5%) |
| 65 to 74 Years | 6 (66.7%) | 23 (47.9%) |
| 75 Years and over | 25 (86.2%) | 0 (0.0%) |
Disability Class: Self-Care Difficulty
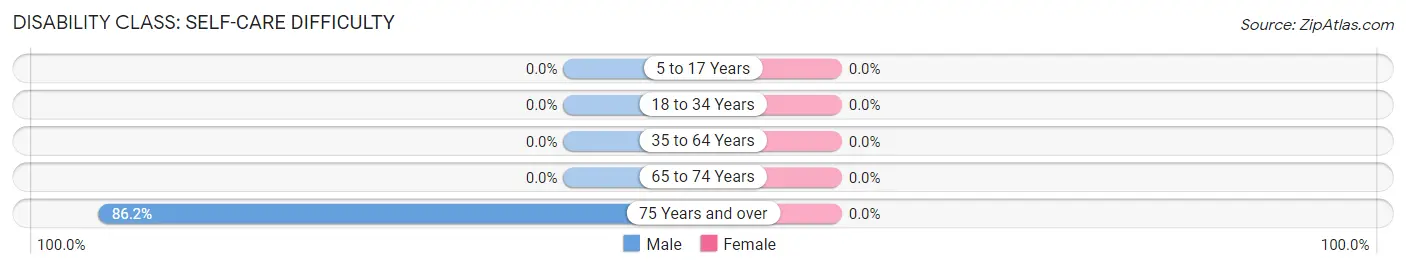
| Age Bracket | Male | Female |
| 5 to 17 Years | 0 (0.0%) | 0 (0.0%) |
| 18 to 34 Years | 0 (0.0%) | 0 (0.0%) |
| 35 to 64 Years | 0 (0.0%) | 0 (0.0%) |
| 65 to 74 Years | 0 (0.0%) | 0 (0.0%) |
| 75 Years and over | 25 (86.2%) | 0 (0.0%) |
Technology Access in New Deal
Computing Device Access in New Deal
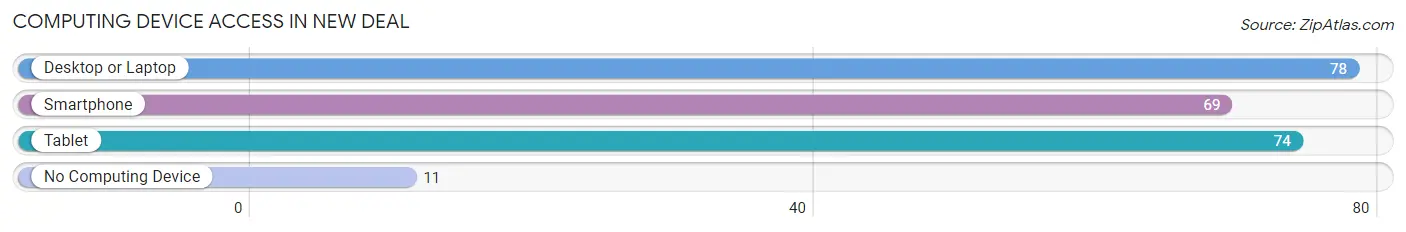
| Device Type | # Households | % Households |
| Desktop or Laptop | 78 | 75.7% |
| Smartphone | 69 | 67.0% |
| Tablet | 74 | 71.8% |
| No Computing Device | 11 | 10.7% |
| Total | 103 | 100.0% |
Internet Access in New Deal
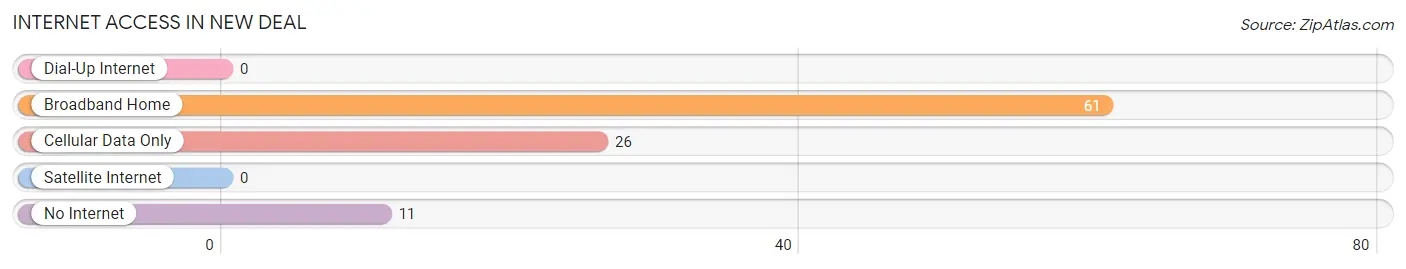
| Internet Type | # Households | % Households |
| Dial-Up Internet | 0 | 0.0% |
| Broadband Home | 61 | 59.2% |
| Cellular Data Only | 26 | 25.2% |
| Satellite Internet | 0 | 0.0% |
| No Internet | 11 | 10.7% |
| Total | 103 | 100.0% |
New Deal Summary
New Deal, Tennessee is a small town located in the southeastern part of the state, in the foothills of the Appalachian Mountains. It is situated in the Sequatchie Valley, a narrow valley that runs through the Cumberland Plateau. The town was founded in the late 1800s and has a population of just over 1,000 people.
New Deal is located in Bledsoe County, which is part of the Chattanooga Metropolitan Statistical Area. The town is situated along the Sequatchie River, which is a tributary of the Tennessee River. The town is surrounded by rolling hills and forests, and is home to a variety of wildlife.
The economy of New Deal is largely based on agriculture and forestry. The town is home to several farms, which produce a variety of crops, including corn, soybeans, and hay. The town is also home to several sawmills, which produce lumber for the local market. In addition, the town is home to several small businesses, including a grocery store, a hardware store, and a few restaurants.
The demographics of New Deal are largely rural and white. The town is home to a large number of families, with the median household income being just over $30,000. The town is also home to a large number of retirees, with the median age being just over 50.
New Deal is served by the Sequatchie County School System, which consists of two elementary schools, one middle school, and one high school. The town is also home to a number of churches, including the First Baptist Church of New Deal, the New Deal United Methodist Church, and the New Deal Presbyterian Church.
New Deal is a small town with a rich history and a strong sense of community. The town is home to a variety of businesses and organizations, and is a great place to live and work. The town is also home to a variety of recreational activities, including fishing, hunting, and camping. The town is also home to a number of festivals and events, including the annual New Deal Festival, which is held each year in the fall.
Common Questions
What is Per Capita Income in New Deal?
Per Capita income in New Deal is $31,341.
What is the Median Family Income in New Deal?
Median Family Income in New Deal is $83,362.
What is the Median Household income in New Deal?
Median Household Income in New Deal is $82,629.
What is Income or Wage Gap in New Deal?
Income or Wage Gap in New Deal is 46.0%.
Women in New Deal earn 54.0 cents for every dollar earned by a man.
What is Inequality or Gini Index in New Deal?
Inequality or Gini Index in New Deal is 0.32.
What is the Total Population of New Deal?
Total Population of New Deal is 263.
What is the Total Male Population of New Deal?
Total Male Population of New Deal is 146.
What is the Total Female Population of New Deal?
Total Female Population of New Deal is 117.
What is the Ratio of Males per 100 Females in New Deal?
There are 124.79 Males per 100 Females in New Deal.
What is the Ratio of Females per 100 Males in New Deal?
There are 80.14 Females per 100 Males in New Deal.
What is the Median Population Age in New Deal?
Median Population Age in New Deal is 52.0 Years.
What is the Average Family Size in New Deal
Average Family Size in New Deal is 2.7 People.
What is the Average Household Size in New Deal
Average Household Size in New Deal is 2.5 People.
How Large is the Labor Force in New Deal?
There are 108 People in the Labor Forcein in New Deal.
What is the Percentage of People in the Labor Force in New Deal?
48.0% of People are in the Labor Force in New Deal.