Dunlap, TN Map & Demographics
Dunlap Map
Dunlap Overview
$17,685
PER CAPITA INCOME
$44,045
AVG FAMILY INCOME
$42,188
AVG HOUSEHOLD INCOME
22.9%
WAGE / INCOME GAP [ % ]
77.1¢/ $1
WAGE / INCOME GAP [ $ ]
0.37
INEQUALITY / GINI INDEX
5,443
TOTAL POPULATION
2,946
MALE POPULATION
2,497
FEMALE POPULATION
117.98
MALES / 100 FEMALES
84.76
FEMALES / 100 MALES
37.1
MEDIAN AGE
3.2
AVG FAMILY SIZE
2.7
AVG HOUSEHOLD SIZE
2,024
LABOR FORCE [ PEOPLE ]
47.5%
PERCENT IN LABOR FORCE
4.3%
UNEMPLOYMENT RATE
Dunlap Zip Codes
Dunlap Area Codes
Income in Dunlap
Income Overview in Dunlap
Per Capita Income in Dunlap is $17,685, while median incomes of families and households are $44,045 and $42,188 respectively.
| Characteristic | Number | Measure |
| Per Capita Income | 5,443 | $17,685 |
| Median Family Income | 1,362 | $44,045 |
| Mean Family Income | 1,362 | $49,015 |
| Median Household Income | 1,928 | $42,188 |
| Mean Household Income | 1,928 | $45,554 |
| Income Deficit | 1,362 | $0 |
| Wage / Income Gap (%) | 5,443 | 22.95% |
| Wage / Income Gap ($) | 5,443 | 77.05¢ per $1 |
| Gini / Inequality Index | 5,443 | 0.37 |
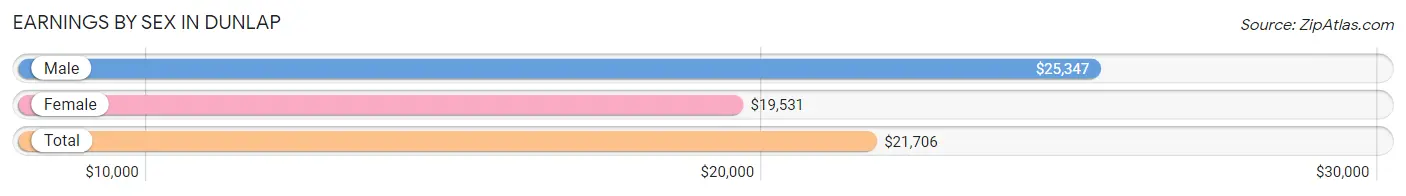
Earnings by Sex in Dunlap
Average Earnings in Dunlap are $21,706, $25,347 for men and $19,531 for women, a difference of 23.0%.
| Sex | Number | Average Earnings |
| Male | 1,314 (59.6%) | $25,347 |
| Female | 890 (40.4%) | $19,531 |
| Total | 2,204 (100.0%) | $21,706 |
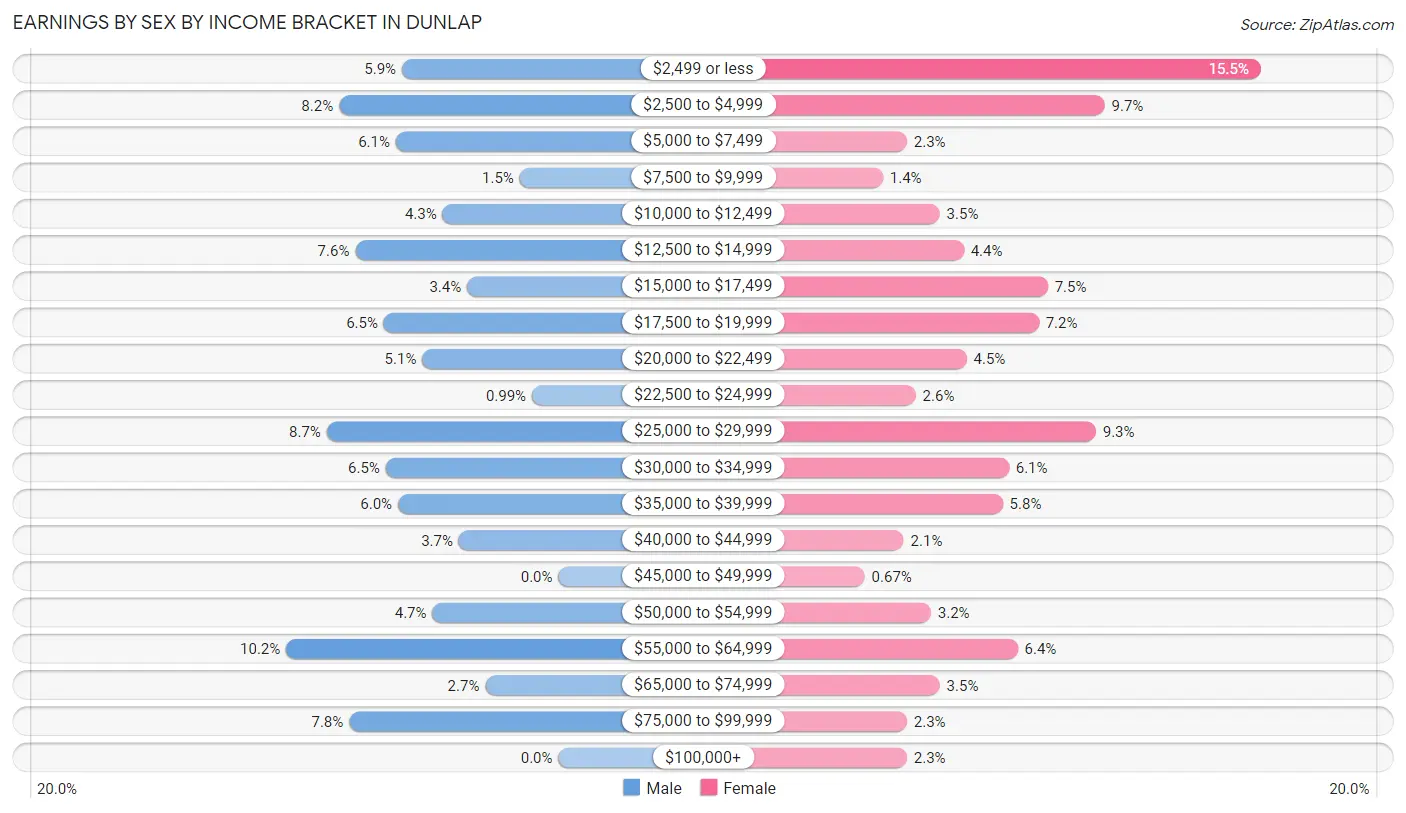
Earnings by Sex by Income Bracket in Dunlap
The most common earnings brackets in Dunlap are $55,000 to $64,999 for men (134 | 10.2%) and $2,499 or less for women (138 | 15.5%).
| Income | Male | Female |
| $2,499 or less | 77 (5.9%) | 138 (15.5%) |
| $2,500 to $4,999 | 108 (8.2%) | 86 (9.7%) |
| $5,000 to $7,499 | 80 (6.1%) | 20 (2.2%) |
| $7,500 to $9,999 | 19 (1.5%) | 12 (1.3%) |
| $10,000 to $12,499 | 57 (4.3%) | 31 (3.5%) |
| $12,500 to $14,999 | 100 (7.6%) | 39 (4.4%) |
| $15,000 to $17,499 | 45 (3.4%) | 67 (7.5%) |
| $17,500 to $19,999 | 86 (6.5%) | 64 (7.2%) |
| $20,000 to $22,499 | 67 (5.1%) | 40 (4.5%) |
| $22,500 to $24,999 | 13 (1.0%) | 23 (2.6%) |
| $25,000 to $29,999 | 114 (8.7%) | 83 (9.3%) |
| $30,000 to $34,999 | 85 (6.5%) | 54 (6.1%) |
| $35,000 to $39,999 | 79 (6.0%) | 52 (5.8%) |
| $40,000 to $44,999 | 49 (3.7%) | 19 (2.1%) |
| $45,000 to $49,999 | 0 (0.0%) | 6 (0.7%) |
| $50,000 to $54,999 | 62 (4.7%) | 28 (3.2%) |
| $55,000 to $64,999 | 134 (10.2%) | 57 (6.4%) |
| $65,000 to $74,999 | 36 (2.7%) | 31 (3.5%) |
| $75,000 to $99,999 | 103 (7.8%) | 20 (2.2%) |
| $100,000+ | 0 (0.0%) | 20 (2.2%) |
| Total | 1,314 (100.0%) | 890 (100.0%) |
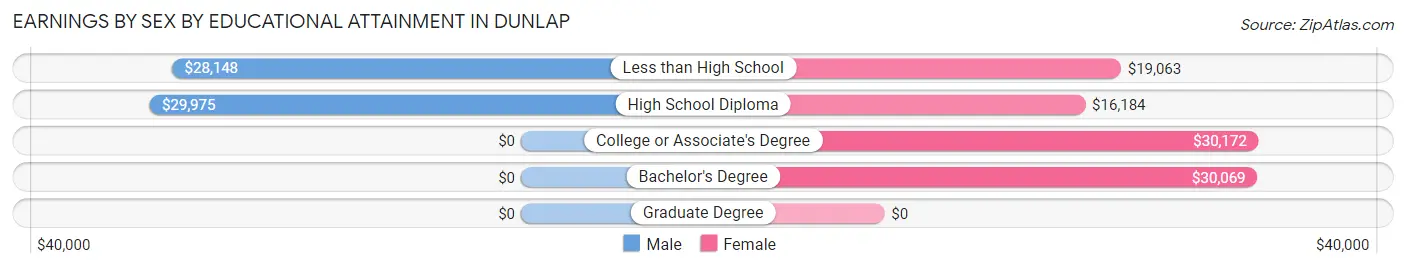
Earnings by Sex by Educational Attainment in Dunlap
Average earnings in Dunlap are $30,500 for men and $19,668 for women, a difference of 35.5%. Men with an educational attainment of high school diploma enjoy the highest average annual earnings of $29,975, while those with less than high school education earn the least with $28,148. Women with an educational attainment of college or associate's degree earn the most with the average annual earnings of $30,172, while those with high school diploma education have the smallest earnings of $16,184.
| Educational Attainment | Male Income | Female Income |
| Less than High School | $28,148 | $19,063 |
| High School Diploma | $29,975 | $16,184 |
| College or Associate's Degree | - | - |
| Bachelor's Degree | - | - |
| Graduate Degree | - | - |
| Total | $30,500 | $19,668 |
Family Income in Dunlap
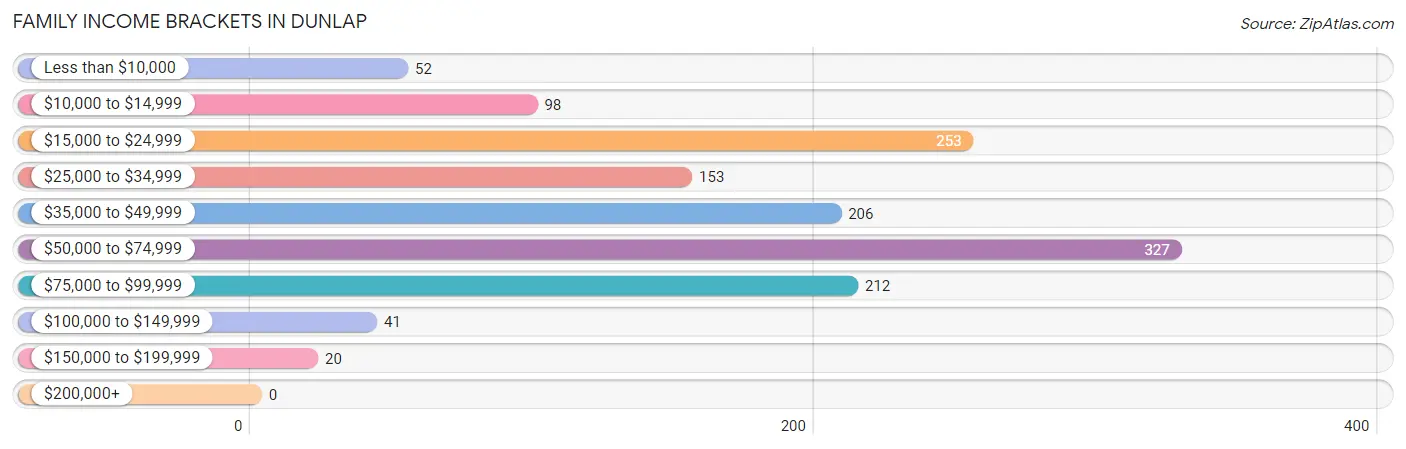
Family Income Brackets in Dunlap
According to the Dunlap family income data, there are 327 families falling into the $50,000 to $74,999 income range, which is the most common income bracket and makes up 24.0% of all families.
| Income Bracket | # Families | % Families |
| Less than $10,000 | 52 | 3.8% |
| $10,000 to $14,999 | 98 | 7.2% |
| $15,000 to $24,999 | 253 | 18.6% |
| $25,000 to $34,999 | 153 | 11.2% |
| $35,000 to $49,999 | 206 | 15.1% |
| $50,000 to $74,999 | 327 | 24.0% |
| $75,000 to $99,999 | 212 | 15.6% |
| $100,000 to $149,999 | 41 | 3.0% |
| $150,000 to $199,999 | 20 | 1.5% |
| $200,000+ | 0 | 0.0% |
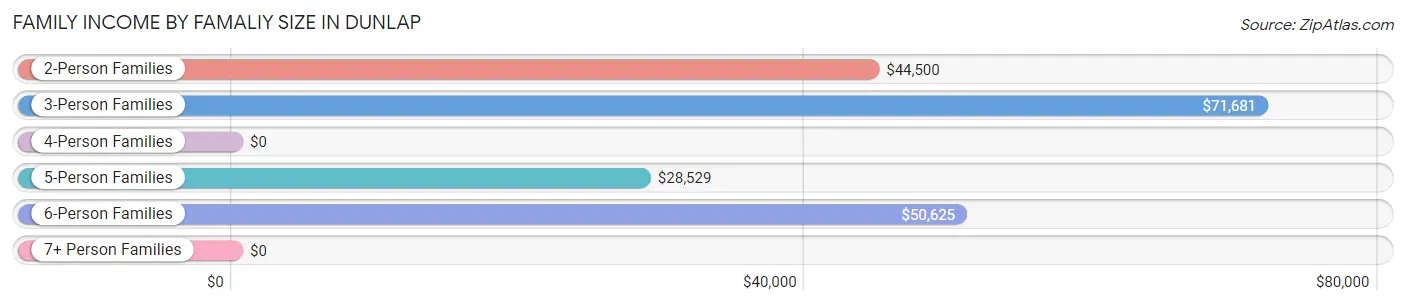
Family Income by Famaliy Size in Dunlap
3-person families (341 | 25.0%) account for the highest median family income in Dunlap with $71,681 per family, while 3-person families (341 | 25.0%) have the highest median income of $23,894 per family member.
| Income Bracket | # Families | Median Income |
| 2-Person Families | 644 (47.3%) | $44,500 |
| 3-Person Families | 341 (25.0%) | $71,681 |
| 4-Person Families | 177 (13.0%) | $0 |
| 5-Person Families | 170 (12.5%) | $28,529 |
| 6-Person Families | 30 (2.2%) | $50,625 |
| 7+ Person Families | 0 (0.0%) | $0 |
| Total | 1,362 (100.0%) | $44,045 |
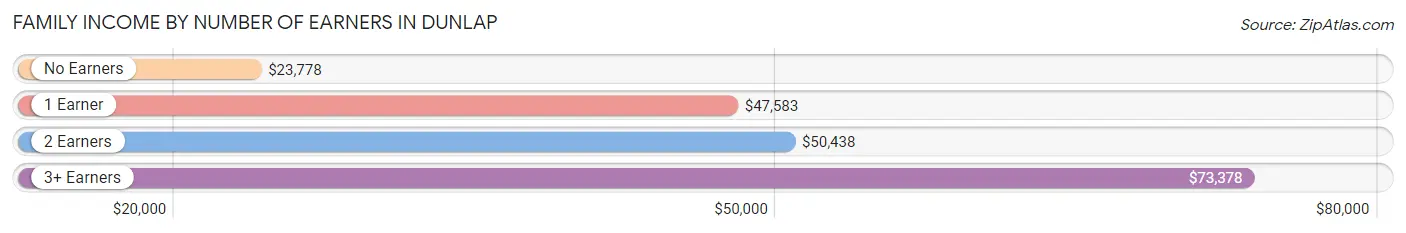
Family Income by Number of Earners in Dunlap
The median family income in Dunlap is $44,045, with families comprising 3+ earners (84) having the highest median family income of $73,378, while families with no earners (392) have the lowest median family income of $23,778, accounting for 6.2% and 28.8% of families, respectively.
| Number of Earners | # Families | Median Income |
| No Earners | 392 (28.8%) | $23,778 |
| 1 Earner | 475 (34.9%) | $47,583 |
| 2 Earners | 411 (30.2%) | $50,438 |
| 3+ Earners | 84 (6.2%) | $73,378 |
| Total | 1,362 (100.0%) | $44,045 |
Household Income in Dunlap
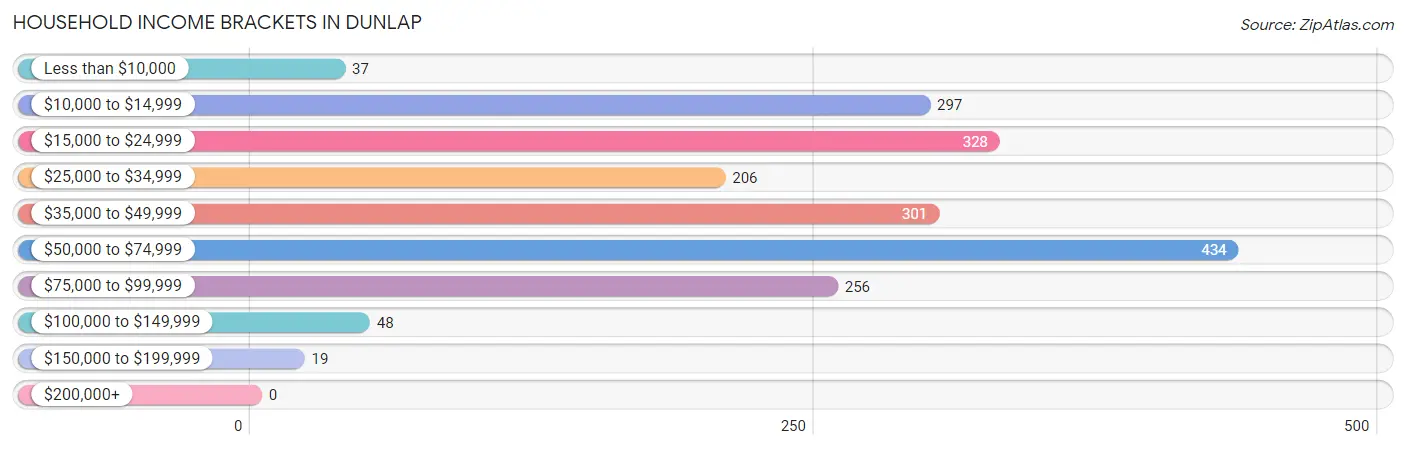
Household Income Brackets in Dunlap
With 434 households falling in the category, the $50,000 to $74,999 income range is the most frequent in Dunlap, accounting for 22.5% of all households.
| Income Bracket | # Households | % Households |
| Less than $10,000 | 37 | 1.9% |
| $10,000 to $14,999 | 297 | 15.4% |
| $15,000 to $24,999 | 328 | 17.0% |
| $25,000 to $34,999 | 206 | 10.7% |
| $35,000 to $49,999 | 301 | 15.6% |
| $50,000 to $74,999 | 434 | 22.5% |
| $75,000 to $99,999 | 256 | 13.3% |
| $100,000 to $149,999 | 48 | 2.5% |
| $150,000 to $199,999 | 19 | 1.0% |
| $200,000+ | 0 | 0.0% |
Household Income by Householder Age in Dunlap
The median household income in Dunlap is $42,188, with the highest median household income of $64,965 found in the 45 to 64 years age bracket for the primary householder. A total of 655 households (34.0%) fall into this category. Meanwhile, the 15 to 24 years age bracket for the primary householder has the lowest median household income of $0, with 76 households (3.9%) in this group.
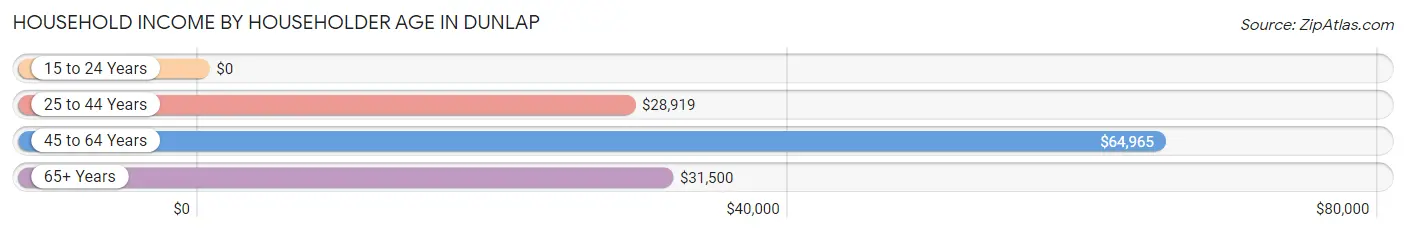
| Income Bracket | # Households | Median Income |
| 15 to 24 Years | 76 (3.9%) | $0 |
| 25 to 44 Years | 555 (28.8%) | $28,919 |
| 45 to 64 Years | 655 (34.0%) | $64,965 |
| 65+ Years | 642 (33.3%) | $31,500 |
| Total | 1,928 (100.0%) | $42,188 |
Poverty in Dunlap
Income Below Poverty by Sex and Age in Dunlap
With 31.8% poverty level for males and 35.3% for females among the residents of Dunlap, 5 year old males and 18 to 24 year old females are the most vulnerable to poverty, with 24 males (100.0%) and 176 females (79.6%) in their respective age groups living below the poverty level.
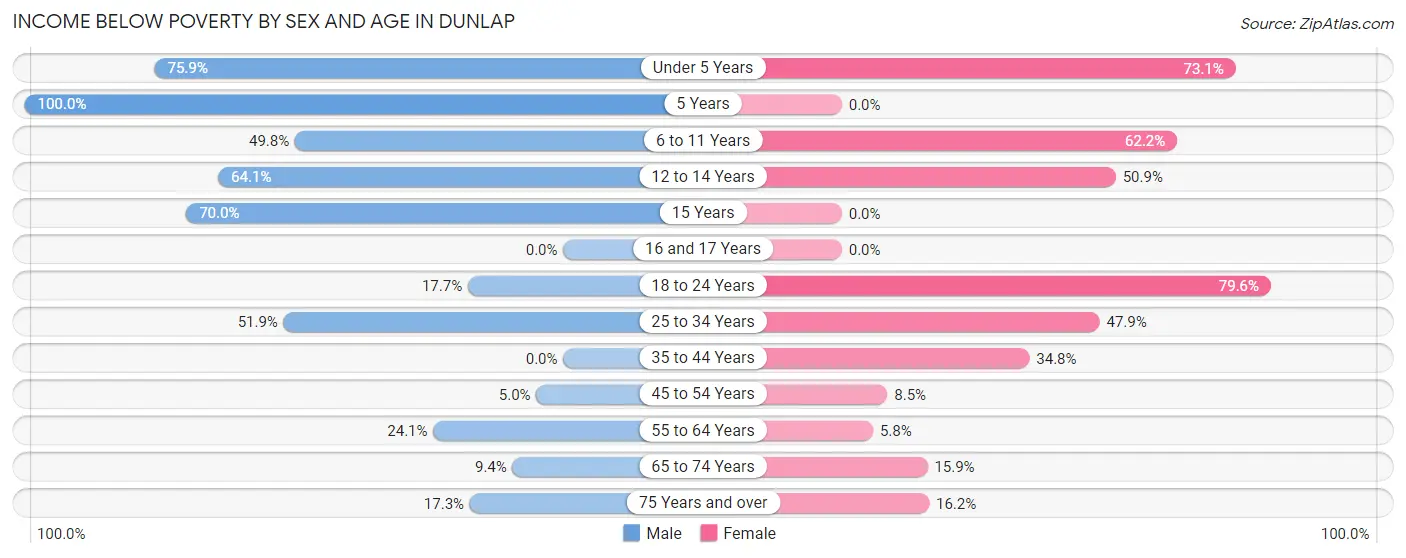
| Age Bracket | Male | Female |
| Under 5 Years | 195 (75.9%) | 106 (73.1%) |
| 5 Years | 24 (100.0%) | 0 (0.0%) |
| 6 to 11 Years | 123 (49.8%) | 117 (62.2%) |
| 12 to 14 Years | 66 (64.1%) | 60 (50.8%) |
| 15 Years | 42 (70.0%) | 0 (0.0%) |
| 16 and 17 Years | 0 (0.0%) | 0 (0.0%) |
| 18 to 24 Years | 54 (17.7%) | 176 (79.6%) |
| 25 to 34 Years | 244 (51.9%) | 178 (47.8%) |
| 35 to 44 Years | 0 (0.0%) | 86 (34.8%) |
| 45 to 54 Years | 14 (5.0%) | 24 (8.5%) |
| 55 to 64 Years | 83 (24.1%) | 15 (5.8%) |
| 65 to 74 Years | 18 (9.4%) | 38 (15.9%) |
| 75 Years and over | 30 (17.3%) | 46 (16.2%) |
| Total | 893 (31.8%) | 846 (35.3%) |
Income Above Poverty by Sex and Age in Dunlap
According to the poverty statistics in Dunlap, males aged 16 and 17 years and females aged 15 years are the age groups that are most secure financially, with 100.0% of males and 100.0% of females in these age groups living above the poverty line.
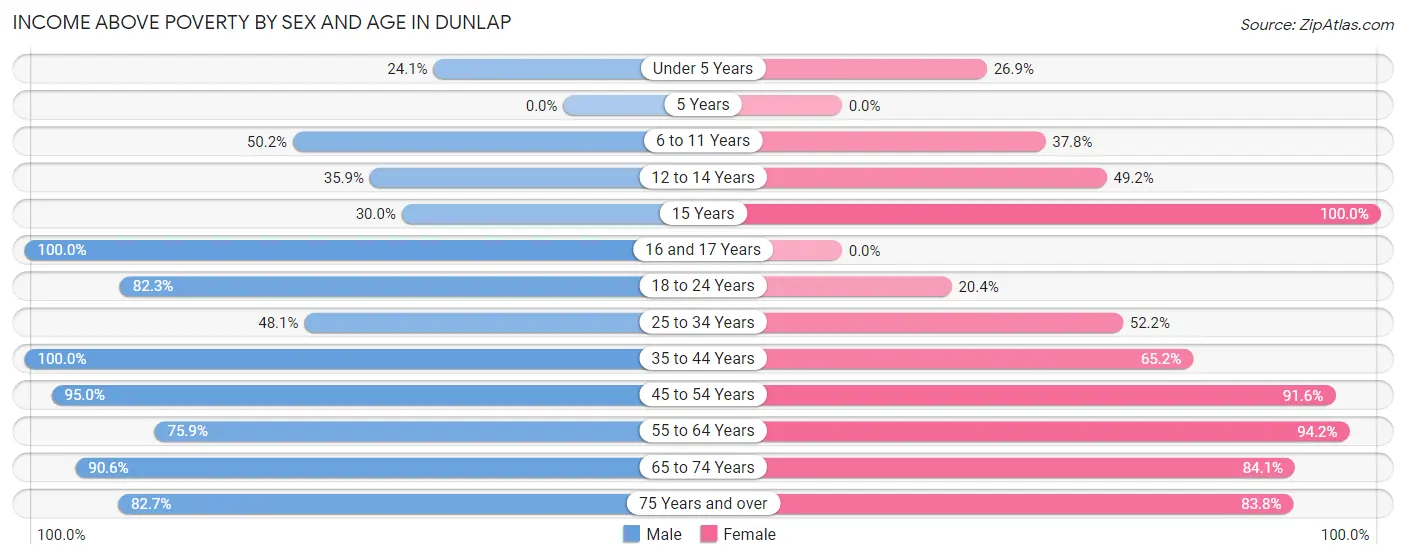
| Age Bracket | Male | Female |
| Under 5 Years | 62 (24.1%) | 39 (26.9%) |
| 5 Years | 0 (0.0%) | 0 (0.0%) |
| 6 to 11 Years | 124 (50.2%) | 71 (37.8%) |
| 12 to 14 Years | 37 (35.9%) | 58 (49.1%) |
| 15 Years | 18 (30.0%) | 41 (100.0%) |
| 16 and 17 Years | 90 (100.0%) | 0 (0.0%) |
| 18 to 24 Years | 251 (82.3%) | 45 (20.4%) |
| 25 to 34 Years | 226 (48.1%) | 194 (52.1%) |
| 35 to 44 Years | 264 (100.0%) | 161 (65.2%) |
| 45 to 54 Years | 266 (95.0%) | 260 (91.5%) |
| 55 to 64 Years | 261 (75.9%) | 244 (94.2%) |
| 65 to 74 Years | 173 (90.6%) | 201 (84.1%) |
| 75 Years and over | 143 (82.7%) | 238 (83.8%) |
| Total | 1,915 (68.2%) | 1,552 (64.7%) |
Income Below Poverty Among Married-Couple Families in Dunlap
The poverty statistics for married-couple families in Dunlap show that 11.8% or 100 of the total 844 families live below the poverty line. Families with 3 or 4 children have the highest poverty rate of 79.7%, comprising of 55 families. On the other hand, families with no children have the lowest poverty rate of 0.0%, which includes 0 families.
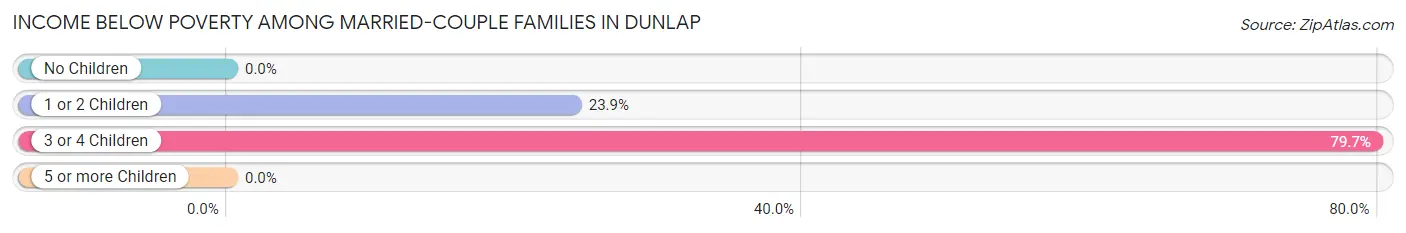
| Children | Above Poverty | Below Poverty |
| No Children | 587 (100.0%) | 0 (0.0%) |
| 1 or 2 Children | 143 (76.1%) | 45 (23.9%) |
| 3 or 4 Children | 14 (20.3%) | 55 (79.7%) |
| 5 or more Children | 0 (0.0%) | 0 (0.0%) |
| Total | 744 (88.1%) | 100 (11.8%) |
Income Below Poverty Among Single-Parent Households in Dunlap
According to the poverty data in Dunlap, 54.6% or 101 single-father households and 59.5% or 198 single-mother households are living below the poverty line. Among single-father households, those with no children have the highest poverty rate, with 37 households (100.0%) experiencing poverty. Likewise, among single-mother households, those with 3 or 4 children have the highest poverty rate, with 62 households (91.2%) falling below the poverty line.
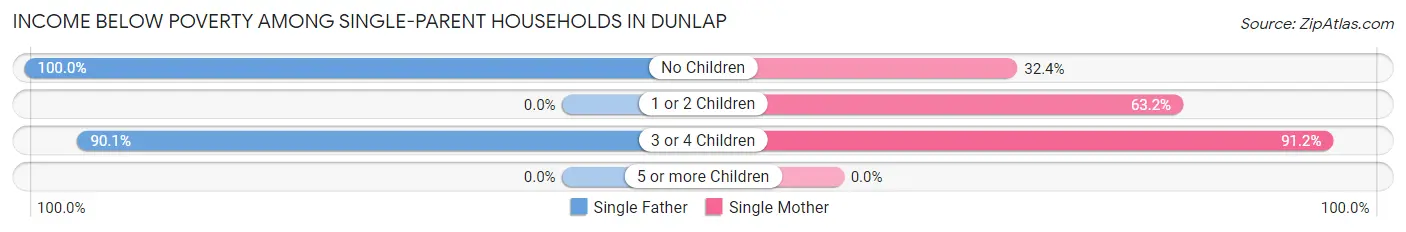
| Children | Single Father | Single Mother |
| No Children | 37 (100.0%) | 33 (32.4%) |
| 1 or 2 Children | 0 (0.0%) | 103 (63.2%) |
| 3 or 4 Children | 64 (90.1%) | 62 (91.2%) |
| 5 or more Children | 0 (0.0%) | 0 (0.0%) |
| Total | 101 (54.6%) | 198 (59.5%) |
Income Below Poverty Among Married-Couple vs Single-Parent Households in Dunlap
The poverty data for Dunlap shows that 100 of the married-couple family households (11.8%) and 299 of the single-parent households (57.7%) are living below the poverty level. Within the married-couple family households, those with 3 or 4 children have the highest poverty rate, with 55 households (79.7%) falling below the poverty line. Among the single-parent households, those with 3 or 4 children have the highest poverty rate, with 126 household (90.6%) living below poverty.
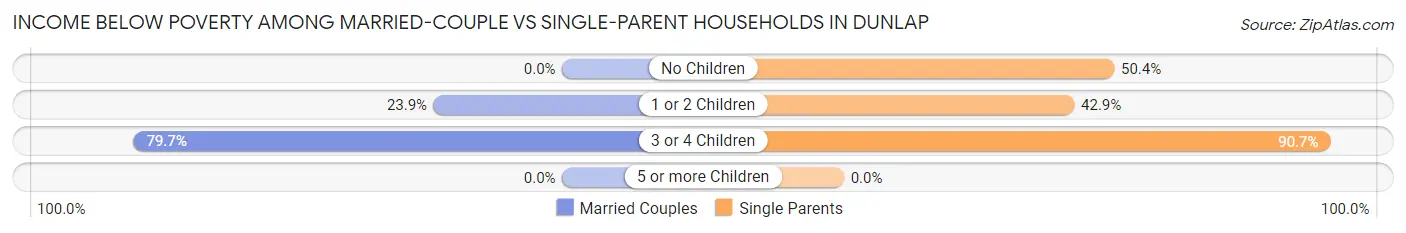
| Children | Married-Couple Families | Single-Parent Households |
| No Children | 0 (0.0%) | 70 (50.4%) |
| 1 or 2 Children | 45 (23.9%) | 103 (42.9%) |
| 3 or 4 Children | 55 (79.7%) | 126 (90.6%) |
| 5 or more Children | 0 (0.0%) | 0 (0.0%) |
| Total | 100 (11.8%) | 299 (57.7%) |
Race in Dunlap
The most populous races in Dunlap are White / Caucasian (4,938 | 90.7%), Hispanic or Latino (541 | 9.9%), and Some other Race (302 | 5.6%).
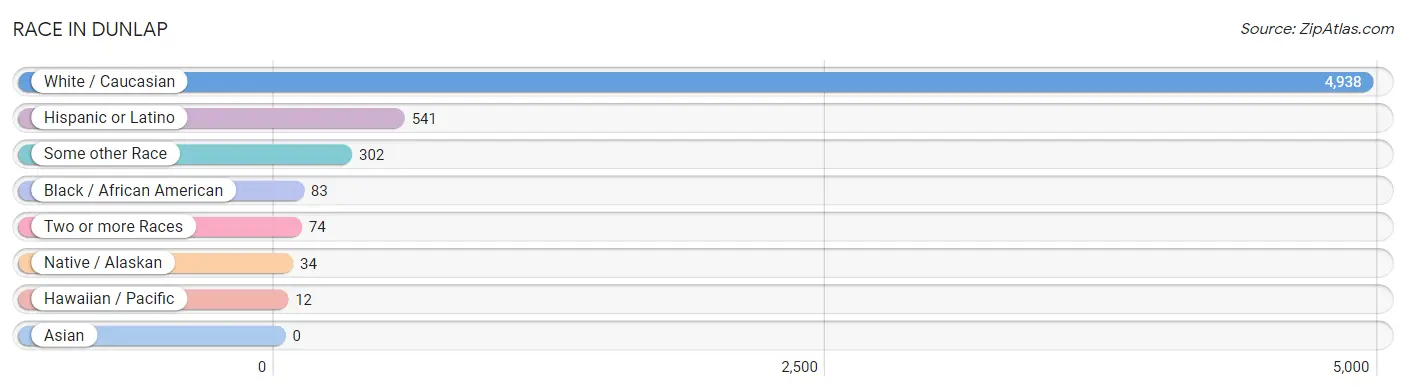
| Race | # Population | % Population |
| Asian | 0 | 0.0% |
| Black / African American | 83 | 1.5% |
| Hawaiian / Pacific | 12 | 0.2% |
| Hispanic or Latino | 541 | 9.9% |
| Native / Alaskan | 34 | 0.6% |
| White / Caucasian | 4,938 | 90.7% |
| Two or more Races | 74 | 1.4% |
| Some other Race | 302 | 5.6% |
| Total | 5,443 | 100.0% |
Ancestry in Dunlap
The most populous ancestries reported in Dunlap are American (976 | 17.9%), English (390 | 7.2%), German (326 | 6.0%), Central American (264 | 4.9%), and Guatemalan (264 | 4.9%), together accounting for 40.8% of all Dunlap residents.
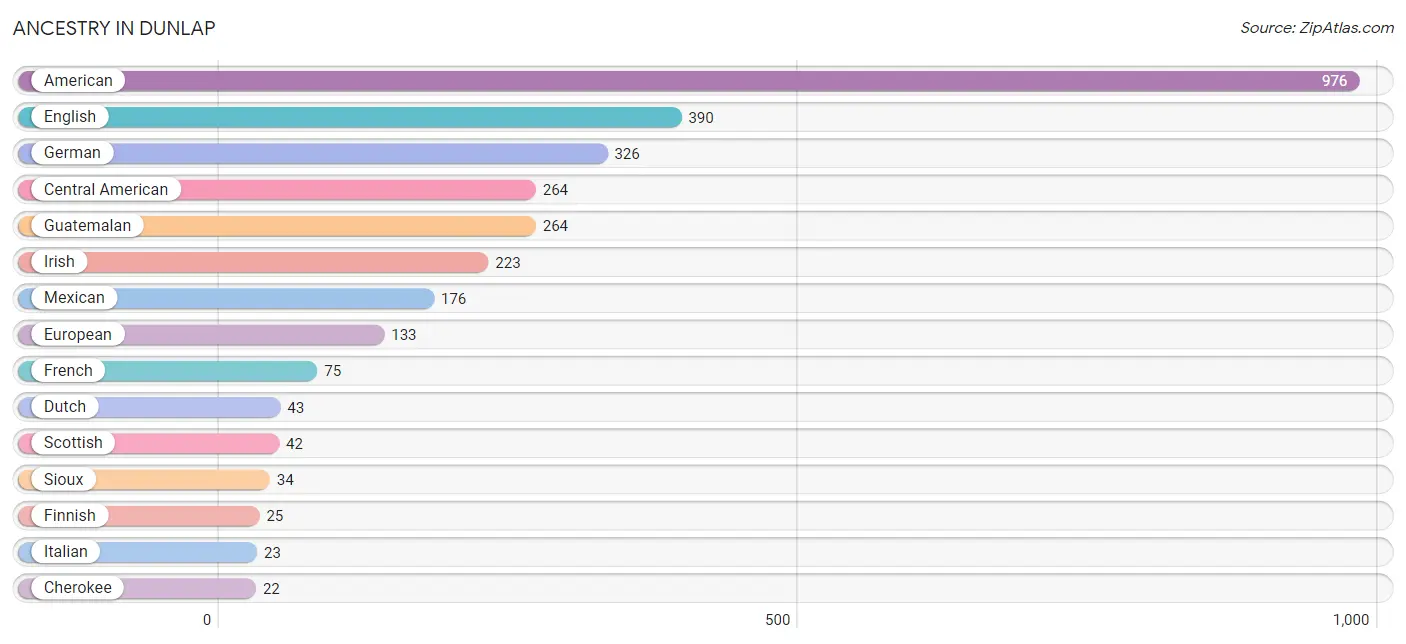
| Ancestry | # Population | % Population |
| American | 976 | 17.9% |
| Apache | 17 | 0.3% |
| Canadian | 17 | 0.3% |
| Central American | 264 | 4.9% |
| Cherokee | 22 | 0.4% |
| Dutch | 43 | 0.8% |
| English | 390 | 7.2% |
| European | 133 | 2.4% |
| Finnish | 25 | 0.5% |
| French | 75 | 1.4% |
| German | 326 | 6.0% |
| Guatemalan | 264 | 4.9% |
| Irish | 223 | 4.1% |
| Italian | 23 | 0.4% |
| Mexican | 176 | 3.2% |
| Polish | 18 | 0.3% |
| Puerto Rican | 14 | 0.3% |
| Samoan | 12 | 0.2% |
| Scandinavian | 12 | 0.2% |
| Scotch-Irish | 14 | 0.3% |
| Scottish | 42 | 0.8% |
| Sioux | 34 | 0.6% |
| Welsh | 7 | 0.1% | View All 23 Rows |
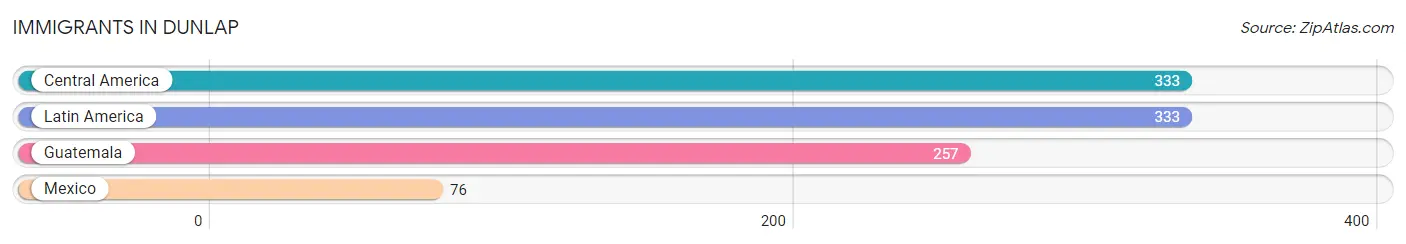
Immigrants in Dunlap
The most numerous immigrant groups reported in Dunlap came from Central America (333 | 6.1%), Latin America (333 | 6.1%), Guatemala (257 | 4.7%), and Mexico (76 | 1.4%), together accounting for 18.4% of all Dunlap residents.
| Immigration Origin | # Population | % Population |
| Central America | 333 | 6.1% |
| Guatemala | 257 | 4.7% |
| Latin America | 333 | 6.1% |
| Mexico | 76 | 1.4% | View All 4 Rows |
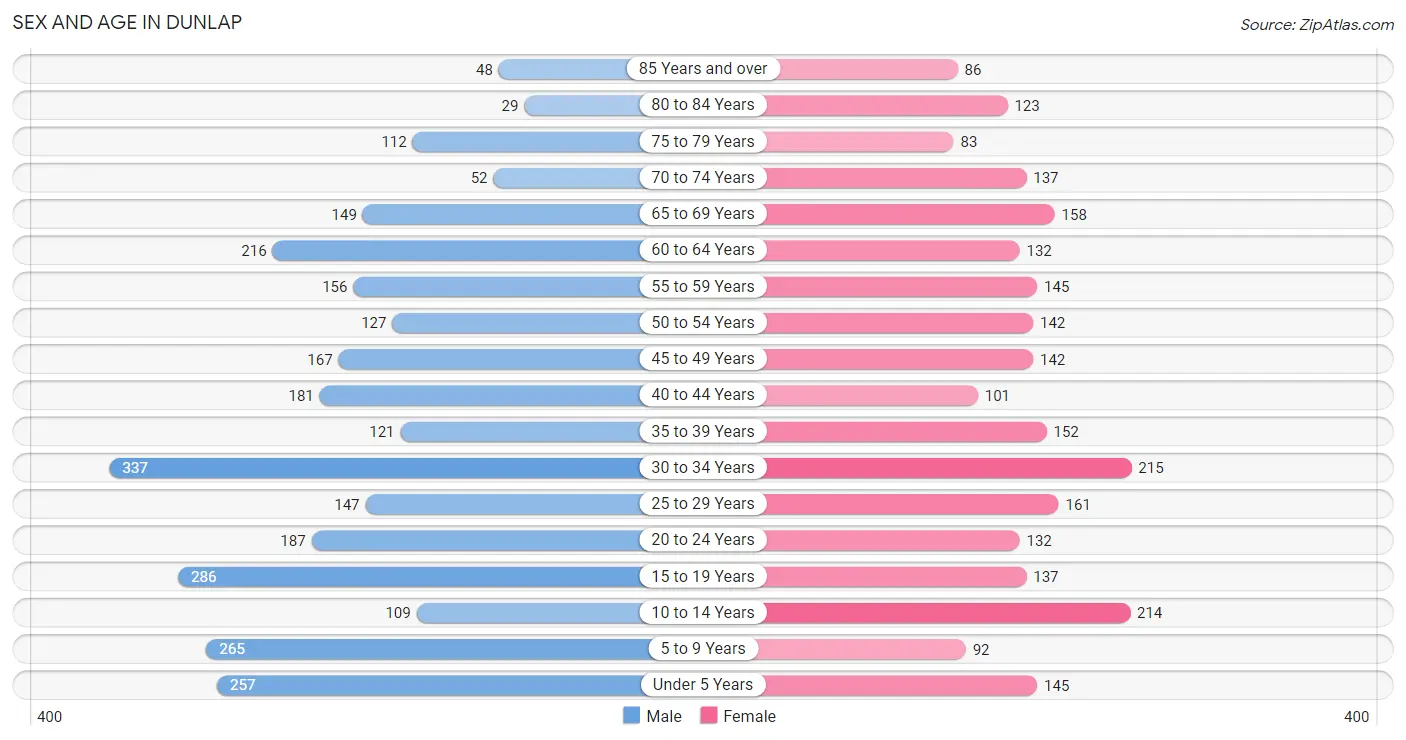
Sex and Age in Dunlap
Sex and Age in Dunlap
The most populous age groups in Dunlap are 30 to 34 Years (337 | 11.4%) for men and 30 to 34 Years (215 | 8.6%) for women.
| Age Bracket | Male | Female |
| Under 5 Years | 257 (8.7%) | 145 (5.8%) |
| 5 to 9 Years | 265 (9.0%) | 92 (3.7%) |
| 10 to 14 Years | 109 (3.7%) | 214 (8.6%) |
| 15 to 19 Years | 286 (9.7%) | 137 (5.5%) |
| 20 to 24 Years | 187 (6.4%) | 132 (5.3%) |
| 25 to 29 Years | 147 (5.0%) | 161 (6.5%) |
| 30 to 34 Years | 337 (11.4%) | 215 (8.6%) |
| 35 to 39 Years | 121 (4.1%) | 152 (6.1%) |
| 40 to 44 Years | 181 (6.1%) | 101 (4.0%) |
| 45 to 49 Years | 167 (5.7%) | 142 (5.7%) |
| 50 to 54 Years | 127 (4.3%) | 142 (5.7%) |
| 55 to 59 Years | 156 (5.3%) | 145 (5.8%) |
| 60 to 64 Years | 216 (7.3%) | 132 (5.3%) |
| 65 to 69 Years | 149 (5.1%) | 158 (6.3%) |
| 70 to 74 Years | 52 (1.8%) | 137 (5.5%) |
| 75 to 79 Years | 112 (3.8%) | 83 (3.3%) |
| 80 to 84 Years | 29 (1.0%) | 123 (4.9%) |
| 85 Years and over | 48 (1.6%) | 86 (3.4%) |
| Total | 2,946 (100.0%) | 2,497 (100.0%) |
Families and Households in Dunlap
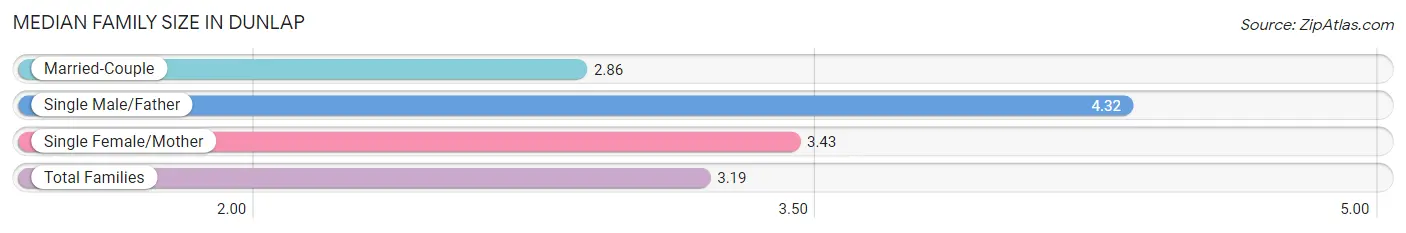
Median Family Size in Dunlap
The median family size in Dunlap is 3.19 persons per family, with single male/father families (185 | 13.6%) accounting for the largest median family size of 4.32 persons per family. On the other hand, married-couple families (844 | 62.0%) represent the smallest median family size with 2.86 persons per family.
| Family Type | # Families | Family Size |
| Married-Couple | 844 (62.0%) | 2.86 |
| Single Male/Father | 185 (13.6%) | 4.32 |
| Single Female/Mother | 333 (24.4%) | 3.43 |
| Total Families | 1,362 (100.0%) | 3.19 |
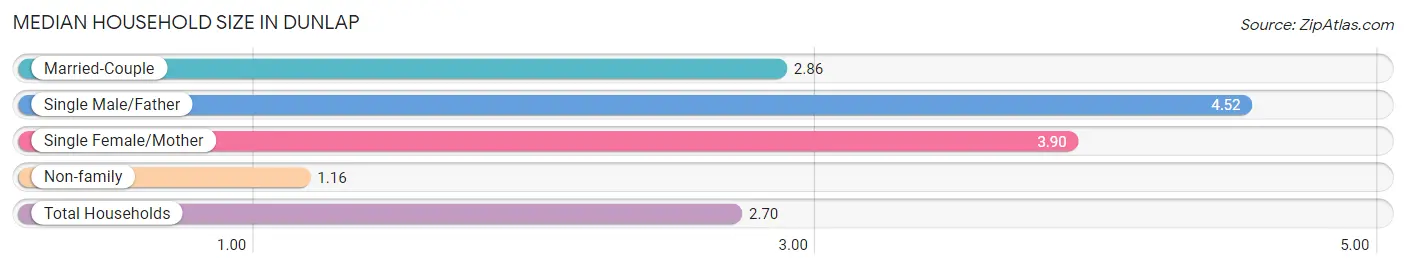
Median Household Size in Dunlap
The median household size in Dunlap is 2.70 persons per household, with single male/father households (185 | 9.6%) accounting for the largest median household size of 4.52 persons per household. non-family households (566 | 29.4%) represent the smallest median household size with 1.16 persons per household.
| Household Type | # Households | Household Size |
| Married-Couple | 844 (43.8%) | 2.86 |
| Single Male/Father | 185 (9.6%) | 4.52 |
| Single Female/Mother | 333 (17.3%) | 3.90 |
| Non-family | 566 (29.4%) | 1.16 |
| Total Households | 1,928 (100.0%) | 2.70 |
Household Size by Marriage Status in Dunlap
Out of a total of 1,928 households in Dunlap, 1,362 (70.6%) are family households, while 566 (29.4%) are nonfamily households. The most numerous type of family households are 2-person households, comprising 589, and the most common type of nonfamily households are 1-person households, comprising 472.
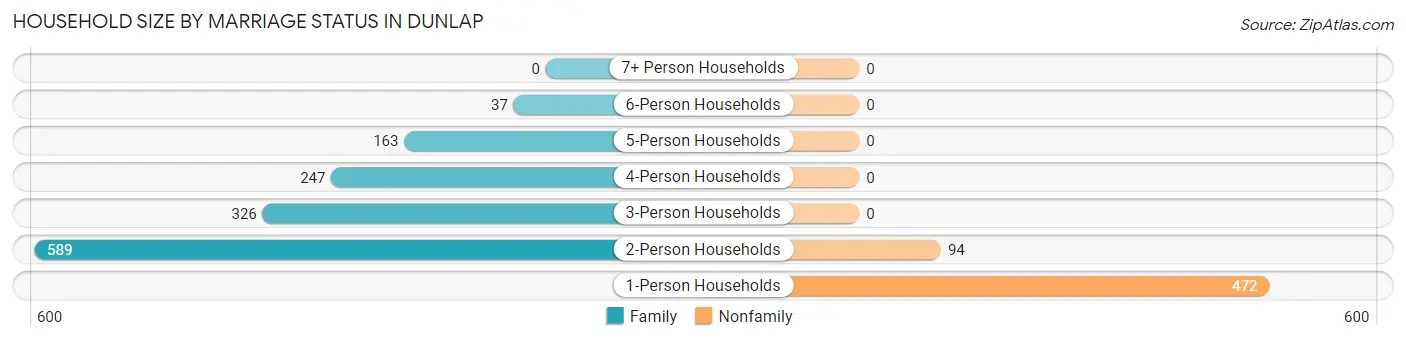
| Household Size | Family Households | Nonfamily Households |
| 1-Person Households | - | 472 (24.5%) |
| 2-Person Households | 589 (30.5%) | 94 (4.9%) |
| 3-Person Households | 326 (16.9%) | 0 (0.0%) |
| 4-Person Households | 247 (12.8%) | 0 (0.0%) |
| 5-Person Households | 163 (8.5%) | 0 (0.0%) |
| 6-Person Households | 37 (1.9%) | 0 (0.0%) |
| 7+ Person Households | 0 (0.0%) | 0 (0.0%) |
| Total | 1,362 (70.6%) | 566 (29.4%) |
Female Fertility in Dunlap
Fertility by Age in Dunlap
Average fertility rate in Dunlap is 47.0 births per 1,000 women. Women in the age bracket of 20 to 34 years have the highest fertility rate with 98.0 births per 1,000 women. Women in the age bracket of 20 to 34 years acount for 100.0% of all women with births.
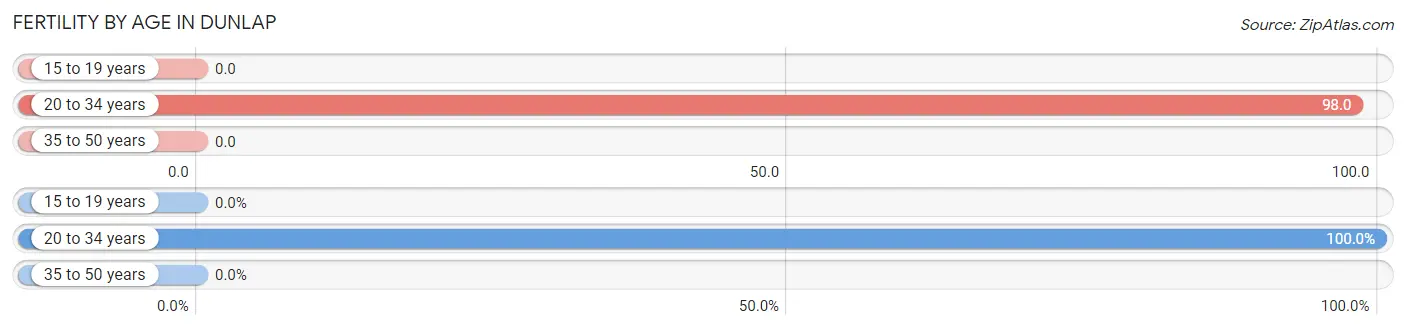
| Age Bracket | Women with Births | Births / 1,000 Women |
| 15 to 19 years | 0 (0.0%) | 0.0 |
| 20 to 34 years | 50 (100.0%) | 98.0 |
| 35 to 50 years | 0 (0.0%) | 0.0 |
| Total | 50 (100.0%) | 47.0 |
Fertility by Age by Marriage Status in Dunlap
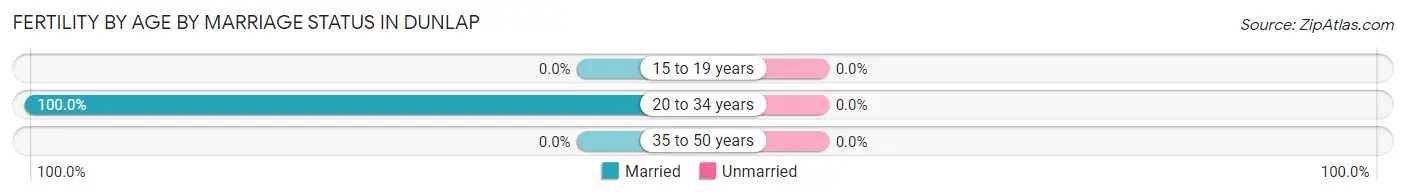
| Age Bracket | Married | Unmarried |
| 15 to 19 years | 0 (0.0%) | 0 (0.0%) |
| 20 to 34 years | 50 (100.0%) | 0 (0.0%) |
| 35 to 50 years | 0 (0.0%) | 0 (0.0%) |
| Total | 50 (100.0%) | 0 (0.0%) |
Fertility by Education in Dunlap
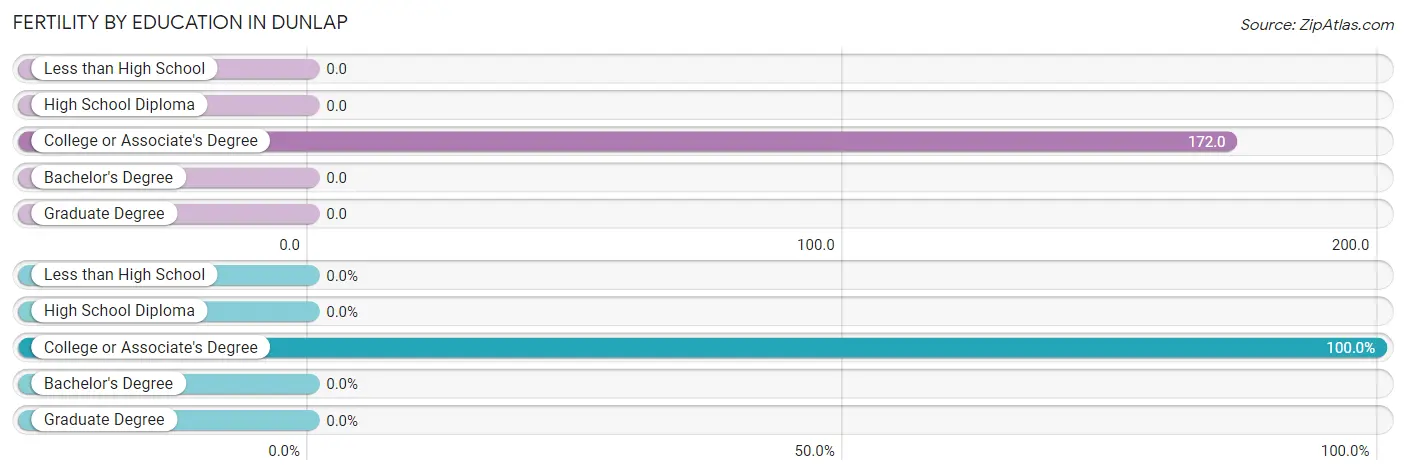
| Educational Attainment | Women with Births | Births / 1,000 Women |
| Less than High School | 0 (0.0%) | 0.0 |
| High School Diploma | 0 (0.0%) | 0.0 |
| College or Associate's Degree | 50 (100.0%) | 172.0 |
| Bachelor's Degree | 0 (0.0%) | 0.0 |
| Graduate Degree | 0 (0.0%) | 0.0 |
| Total | 50 (100.0%) | 47.0 |
Fertility by Education by Marriage Status in Dunlap
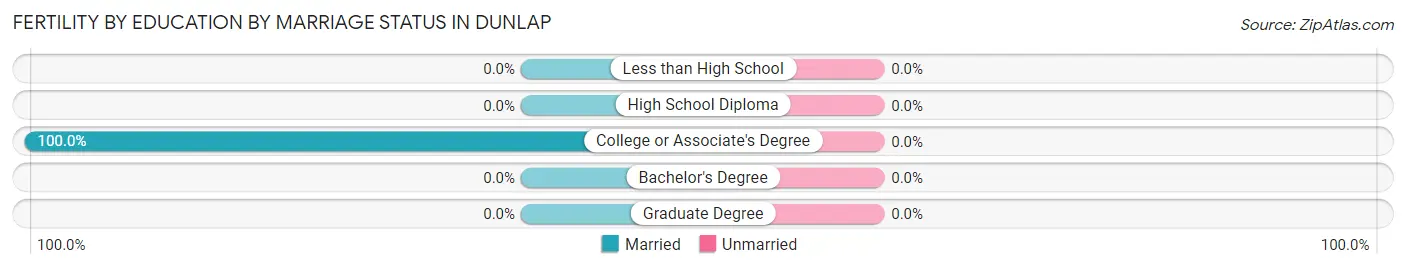
| Educational Attainment | Married | Unmarried |
| Less than High School | 0 (0.0%) | 0 (0.0%) |
| High School Diploma | 0 (0.0%) | 0 (0.0%) |
| College or Associate's Degree | 50 (100.0%) | 0 (0.0%) |
| Bachelor's Degree | 0 (0.0%) | 0 (0.0%) |
| Graduate Degree | 0 (0.0%) | 0 (0.0%) |
| Total | 50 (100.0%) | 0 (0.0%) |
Employment Characteristics in Dunlap
Employment by Class of Employer in Dunlap
Among the 1,887 employed individuals in Dunlap, private company employees (1,386 | 73.5%), local government employees (241 | 12.8%), and not-for-profit organizations (113 | 6.0%) make up the most common classes of employment.
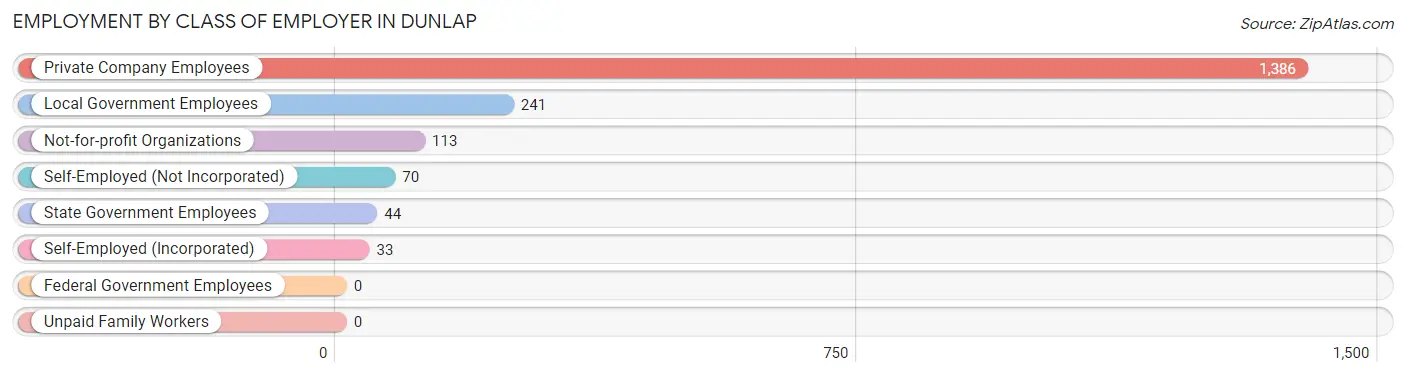
| Employer Class | # Employees | % Employees |
| Private Company Employees | 1,386 | 73.5% |
| Self-Employed (Incorporated) | 33 | 1.8% |
| Self-Employed (Not Incorporated) | 70 | 3.7% |
| Not-for-profit Organizations | 113 | 6.0% |
| Local Government Employees | 241 | 12.8% |
| State Government Employees | 44 | 2.3% |
| Federal Government Employees | 0 | 0.0% |
| Unpaid Family Workers | 0 | 0.0% |
| Total | 1,887 | 100.0% |
Employment Status by Age in Dunlap
According to the labor force statistics for Dunlap, out of the total population over 16 years of age (4,260), 47.5% or 2,024 individuals are in the labor force, with 4.3% or 87 of them unemployed. The age group with the highest labor force participation rate is 25 to 29 years, with 81.2% or 250 individuals in the labor force. Within the labor force, the 16 to 19 years age range has the highest percentage of unemployed individuals, with 18.2% or 27 of them being unemployed.
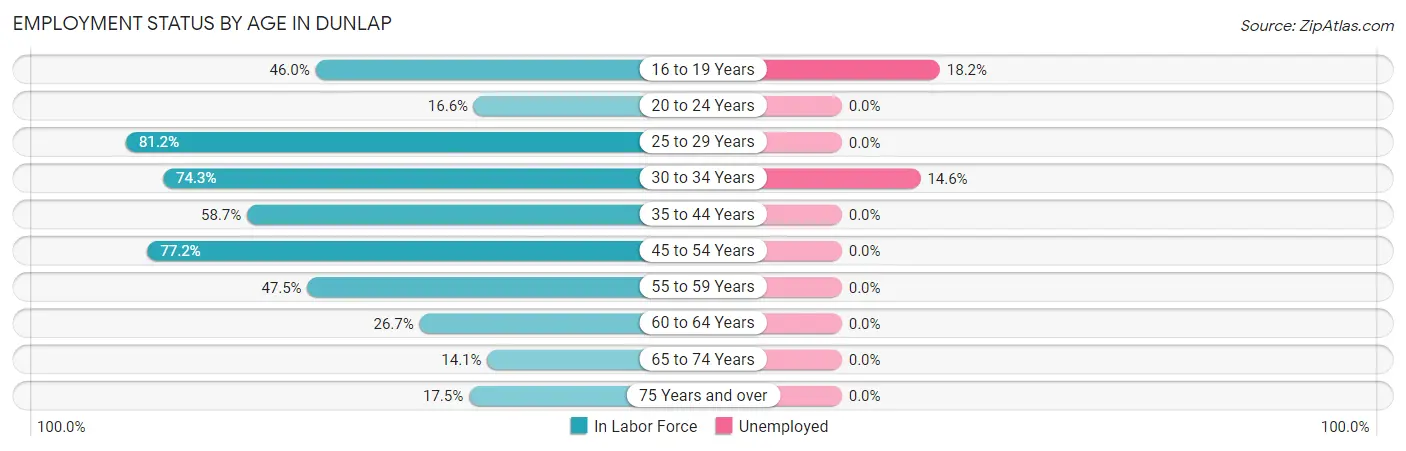
| Age Bracket | In Labor Force | Unemployed |
| 16 to 19 Years | 148 (46.0%) | 27 (18.2%) |
| 20 to 24 Years | 53 (16.6%) | 0 (0.0%) |
| 25 to 29 Years | 250 (81.2%) | 0 (0.0%) |
| 30 to 34 Years | 410 (74.3%) | 60 (14.6%) |
| 35 to 44 Years | 326 (58.7%) | 0 (0.0%) |
| 45 to 54 Years | 446 (77.2%) | 0 (0.0%) |
| 55 to 59 Years | 143 (47.5%) | 0 (0.0%) |
| 60 to 64 Years | 93 (26.7%) | 0 (0.0%) |
| 65 to 74 Years | 70 (14.1%) | 0 (0.0%) |
| 75 Years and over | 84 (17.5%) | 0 (0.0%) |
| Total | 2,024 (47.5%) | 87 (4.3%) |
Employment Status by Educational Attainment in Dunlap
According to labor force statistics for Dunlap, 63.1% of individuals (1,667) out of the total population between 25 and 64 years of age (2,642) are in the labor force, with 3.6% or 60 of them being unemployed. The group with the highest labor force participation rate are those with the educational attainment of college / associate degree, with 74.9% or 492 individuals in the labor force. Within the labor force, individuals with less than high school education have the highest percentage of unemployment, with 12.9% or 23 of them being unemployed.
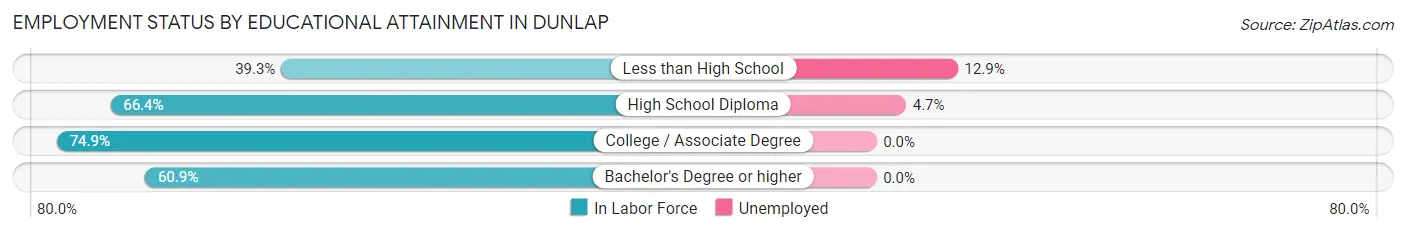
| Educational Attainment | In Labor Force | Unemployed |
| Less than High School | 178 (39.3%) | 58 (12.9%) |
| High School Diploma | 789 (66.4%) | 56 (4.7%) |
| College / Associate Degree | 492 (74.9%) | 0 (0.0%) |
| Bachelor's Degree or higher | 209 (60.9%) | 0 (0.0%) |
| Total | 1,667 (63.1%) | 95 (3.6%) |
Employment Occupations by Sex in Dunlap
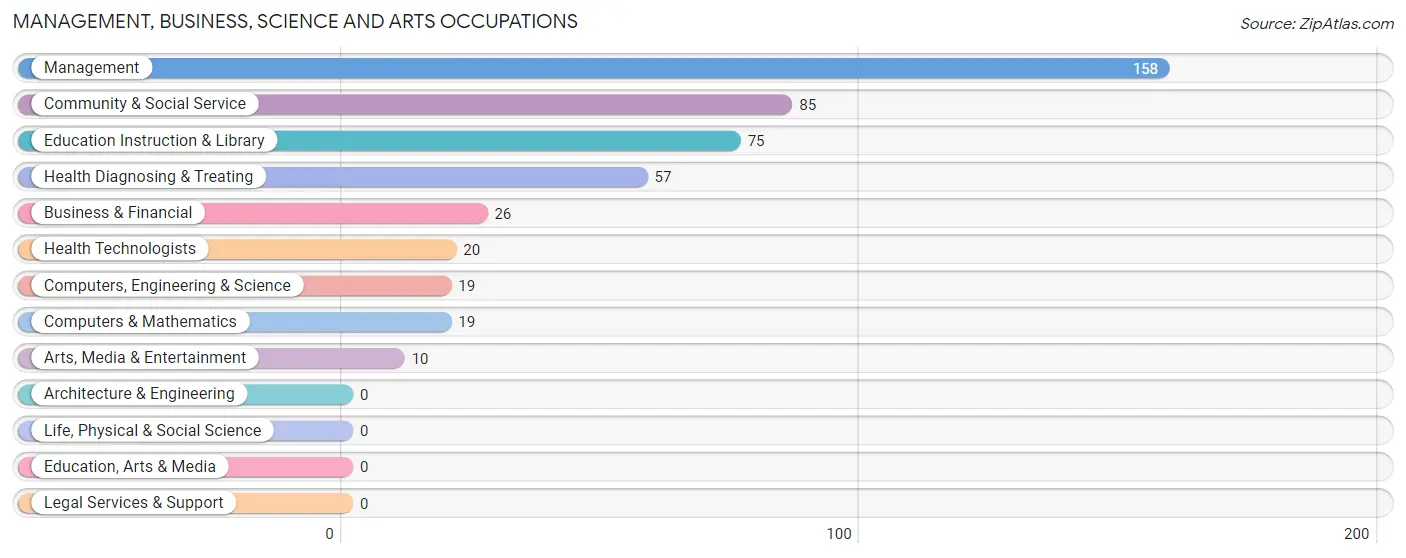
Management, Business, Science and Arts Occupations
The most common Management, Business, Science and Arts occupations in Dunlap are Management (158 | 8.2%), Community & Social Service (85 | 4.4%), Education Instruction & Library (75 | 3.9%), Health Diagnosing & Treating (57 | 2.9%), and Business & Financial (26 | 1.3%).
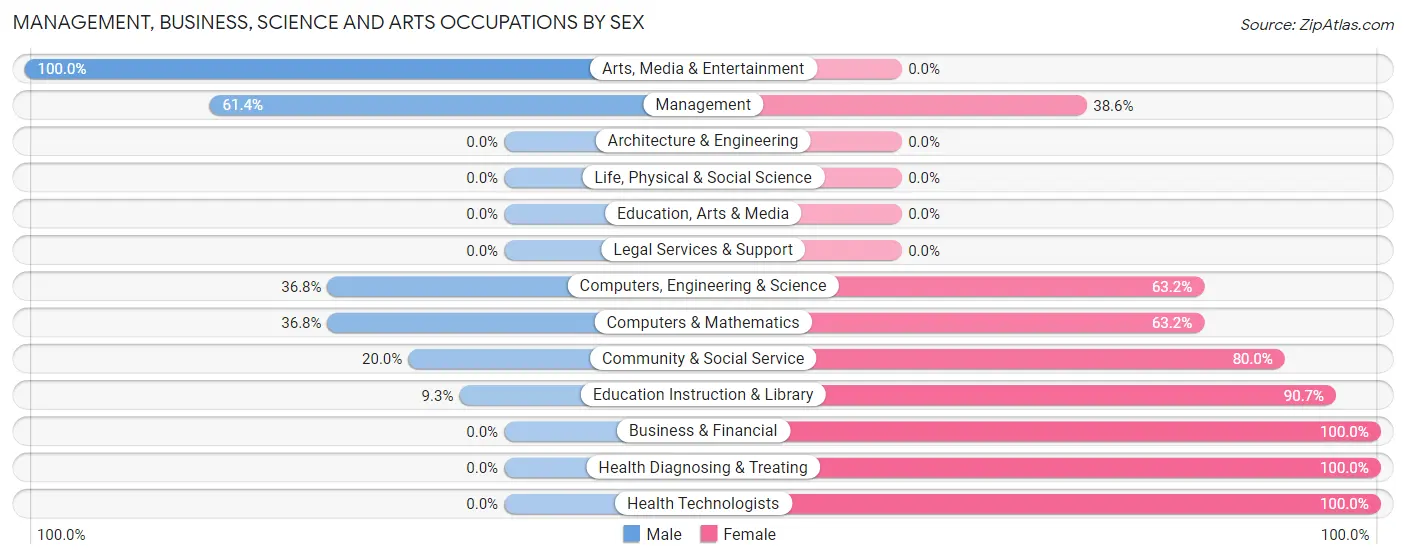
Management, Business, Science and Arts Occupations by Sex
Within the Management, Business, Science and Arts occupations in Dunlap, the most male-oriented occupations are Arts, Media & Entertainment (100.0%), Management (61.4%), and Computers, Engineering & Science (36.8%), while the most female-oriented occupations are Business & Financial (100.0%), Health Diagnosing & Treating (100.0%), and Health Technologists (100.0%).
| Occupation | Male | Female |
| Management | 97 (61.4%) | 61 (38.6%) |
| Business & Financial | 0 (0.0%) | 26 (100.0%) |
| Computers, Engineering & Science | 7 (36.8%) | 12 (63.2%) |
| Computers & Mathematics | 7 (36.8%) | 12 (63.2%) |
| Architecture & Engineering | 0 (0.0%) | 0 (0.0%) |
| Life, Physical & Social Science | 0 (0.0%) | 0 (0.0%) |
| Community & Social Service | 17 (20.0%) | 68 (80.0%) |
| Education, Arts & Media | 0 (0.0%) | 0 (0.0%) |
| Legal Services & Support | 0 (0.0%) | 0 (0.0%) |
| Education Instruction & Library | 7 (9.3%) | 68 (90.7%) |
| Arts, Media & Entertainment | 10 (100.0%) | 0 (0.0%) |
| Health Diagnosing & Treating | 0 (0.0%) | 57 (100.0%) |
| Health Technologists | 0 (0.0%) | 20 (100.0%) |
| Total (Category) | 121 (35.1%) | 224 (64.9%) |
| Total (Overall) | 1,178 (60.9%) | 758 (39.2%) |
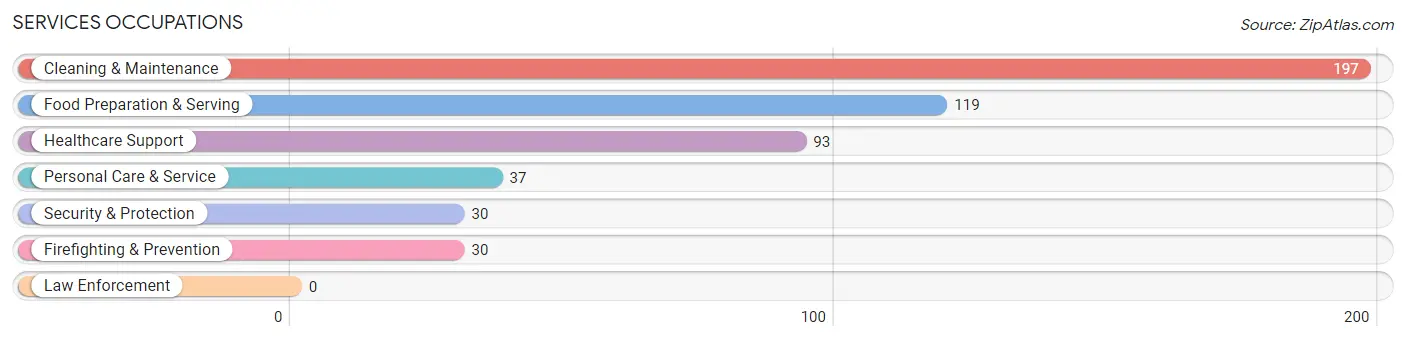
Services Occupations
The most common Services occupations in Dunlap are Cleaning & Maintenance (197 | 10.2%), Food Preparation & Serving (119 | 6.1%), Healthcare Support (93 | 4.8%), Personal Care & Service (37 | 1.9%), and Security & Protection (30 | 1.5%).
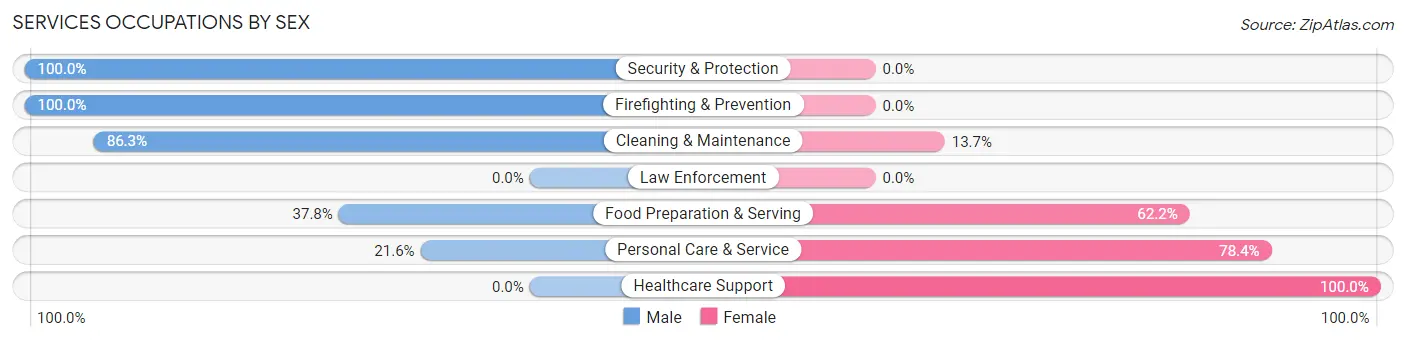
Services Occupations by Sex
Within the Services occupations in Dunlap, the most male-oriented occupations are Security & Protection (100.0%), Firefighting & Prevention (100.0%), and Cleaning & Maintenance (86.3%), while the most female-oriented occupations are Healthcare Support (100.0%), Personal Care & Service (78.4%), and Food Preparation & Serving (62.2%).
| Occupation | Male | Female |
| Healthcare Support | 0 (0.0%) | 93 (100.0%) |
| Security & Protection | 30 (100.0%) | 0 (0.0%) |
| Firefighting & Prevention | 30 (100.0%) | 0 (0.0%) |
| Law Enforcement | 0 (0.0%) | 0 (0.0%) |
| Food Preparation & Serving | 45 (37.8%) | 74 (62.2%) |
| Cleaning & Maintenance | 170 (86.3%) | 27 (13.7%) |
| Personal Care & Service | 8 (21.6%) | 29 (78.4%) |
| Total (Category) | 253 (53.1%) | 223 (46.9%) |
| Total (Overall) | 1,178 (60.9%) | 758 (39.2%) |
Sales and Office Occupations
The most common Sales and Office occupations in Dunlap are Sales & Related (134 | 6.9%), and Office & Administration (113 | 5.8%).
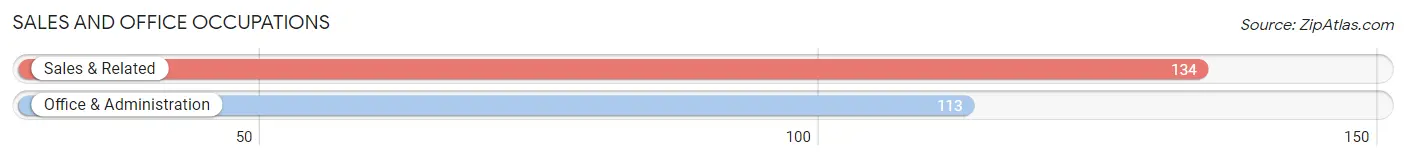
Sales and Office Occupations by Sex
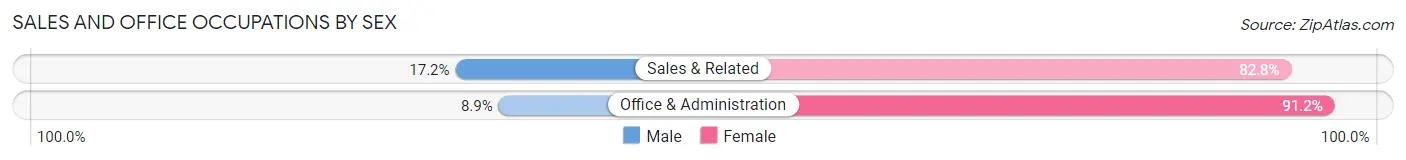
| Occupation | Male | Female |
| Sales & Related | 23 (17.2%) | 111 (82.8%) |
| Office & Administration | 10 (8.8%) | 103 (91.1%) |
| Total (Category) | 33 (13.4%) | 214 (86.6%) |
| Total (Overall) | 1,178 (60.9%) | 758 (39.2%) |
Natural Resources, Construction and Maintenance Occupations
The most common Natural Resources, Construction and Maintenance occupations in Dunlap are Construction & Extraction (421 | 21.7%), and Installation, Maintenance & Repair (42 | 2.2%).
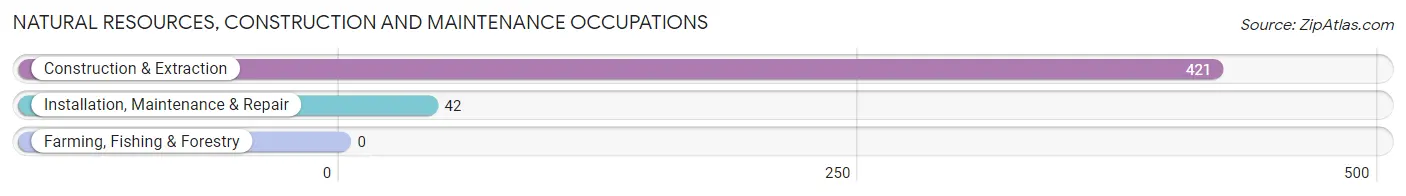
Natural Resources, Construction and Maintenance Occupations by Sex
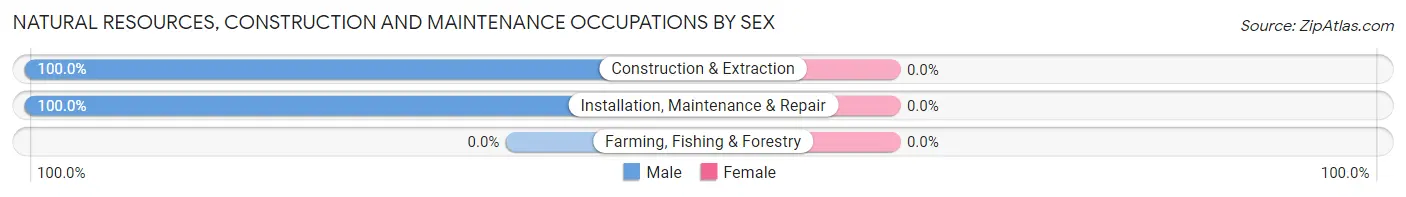
| Occupation | Male | Female |
| Farming, Fishing & Forestry | 0 (0.0%) | 0 (0.0%) |
| Construction & Extraction | 421 (100.0%) | 0 (0.0%) |
| Installation, Maintenance & Repair | 42 (100.0%) | 0 (0.0%) |
| Total (Category) | 463 (100.0%) | 0 (0.0%) |
| Total (Overall) | 1,178 (60.9%) | 758 (39.2%) |
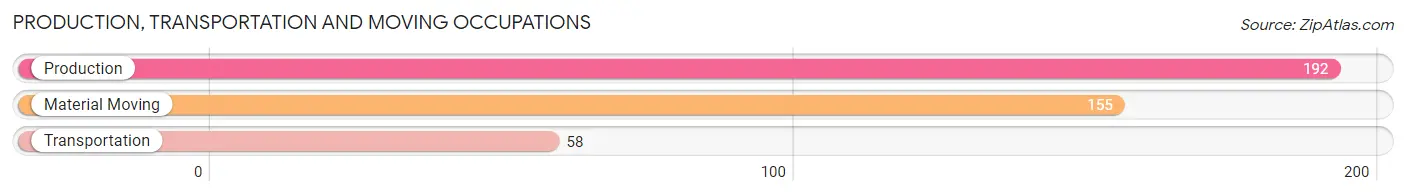
Production, Transportation and Moving Occupations
The most common Production, Transportation and Moving occupations in Dunlap are Production (192 | 9.9%), Material Moving (155 | 8.0%), and Transportation (58 | 3.0%).
Production, Transportation and Moving Occupations by Sex
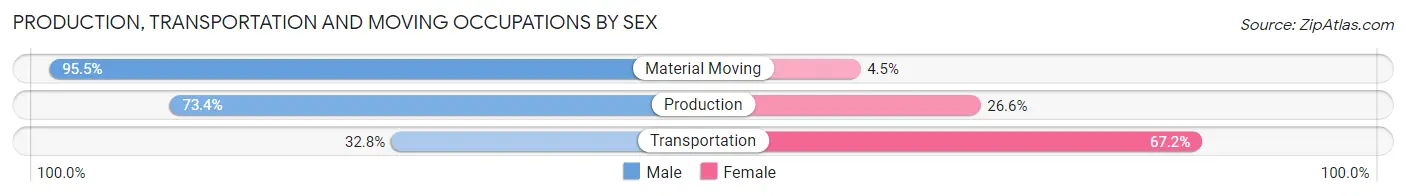
| Occupation | Male | Female |
| Production | 141 (73.4%) | 51 (26.6%) |
| Transportation | 19 (32.8%) | 39 (67.2%) |
| Material Moving | 148 (95.5%) | 7 (4.5%) |
| Total (Category) | 308 (76.0%) | 97 (23.9%) |
| Total (Overall) | 1,178 (60.9%) | 758 (39.2%) |
Employment Industries by Sex in Dunlap
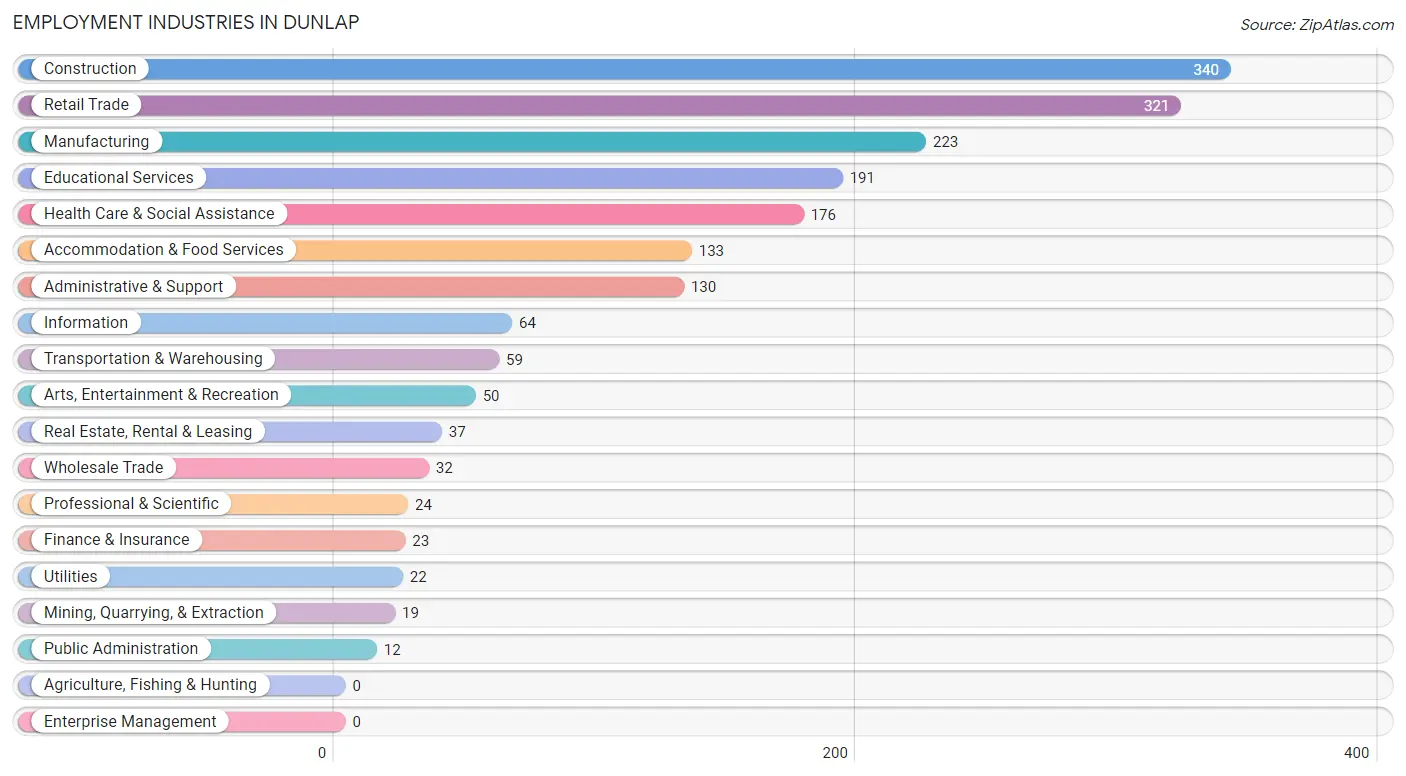
Employment Industries in Dunlap
The major employment industries in Dunlap include Construction (340 | 17.6%), Retail Trade (321 | 16.6%), Manufacturing (223 | 11.5%), Educational Services (191 | 9.9%), and Health Care & Social Assistance (176 | 9.1%).
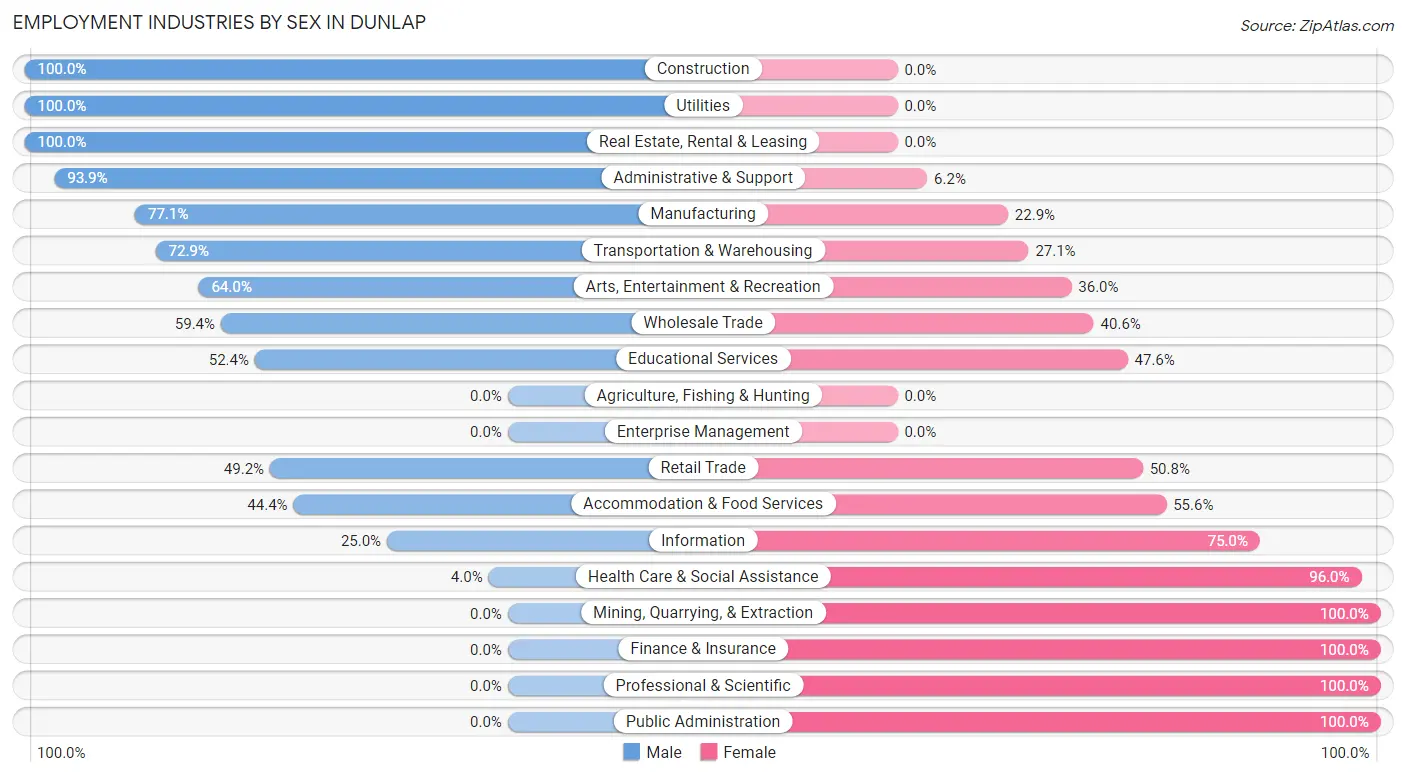
Employment Industries by Sex in Dunlap
The Dunlap industries that see more men than women are Construction (100.0%), Utilities (100.0%), and Real Estate, Rental & Leasing (100.0%), whereas the industries that tend to have a higher number of women are Mining, Quarrying, & Extraction (100.0%), Finance & Insurance (100.0%), and Professional & Scientific (100.0%).
| Industry | Male | Female |
| Agriculture, Fishing & Hunting | 0 (0.0%) | 0 (0.0%) |
| Mining, Quarrying, & Extraction | 0 (0.0%) | 19 (100.0%) |
| Construction | 340 (100.0%) | 0 (0.0%) |
| Manufacturing | 172 (77.1%) | 51 (22.9%) |
| Wholesale Trade | 19 (59.4%) | 13 (40.6%) |
| Retail Trade | 158 (49.2%) | 163 (50.8%) |
| Transportation & Warehousing | 43 (72.9%) | 16 (27.1%) |
| Utilities | 22 (100.0%) | 0 (0.0%) |
| Information | 16 (25.0%) | 48 (75.0%) |
| Finance & Insurance | 0 (0.0%) | 23 (100.0%) |
| Real Estate, Rental & Leasing | 37 (100.0%) | 0 (0.0%) |
| Professional & Scientific | 0 (0.0%) | 24 (100.0%) |
| Enterprise Management | 0 (0.0%) | 0 (0.0%) |
| Administrative & Support | 122 (93.9%) | 8 (6.1%) |
| Educational Services | 100 (52.4%) | 91 (47.6%) |
| Health Care & Social Assistance | 7 (4.0%) | 169 (96.0%) |
| Arts, Entertainment & Recreation | 32 (64.0%) | 18 (36.0%) |
| Accommodation & Food Services | 59 (44.4%) | 74 (55.6%) |
| Public Administration | 0 (0.0%) | 12 (100.0%) |
| Total | 1,178 (60.9%) | 758 (39.2%) |
Education in Dunlap
School Enrollment in Dunlap
The most common levels of schooling among the 949 students in Dunlap are middle school (322 | 33.9%), high school (208 | 21.9%), and elementary school (173 | 18.2%).
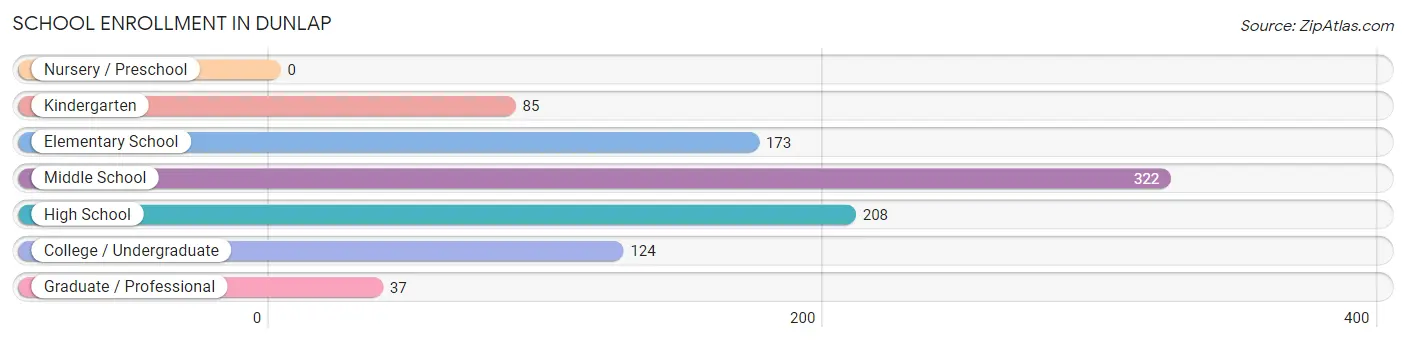
| School Level | # Students | % Students |
| Nursery / Preschool | 0 | 0.0% |
| Kindergarten | 85 | 9.0% |
| Elementary School | 173 | 18.2% |
| Middle School | 322 | 33.9% |
| High School | 208 | 21.9% |
| College / Undergraduate | 124 | 13.1% |
| Graduate / Professional | 37 | 3.9% |
| Total | 949 | 100.0% |
School Enrollment by Age by Funding Source in Dunlap
Out of a total of 949 students who are enrolled in schools in Dunlap, 135 (14.2%) attend a private institution, while the remaining 814 (85.8%) are enrolled in public schools. The age group of 35 years and over has the highest likelihood of being enrolled in private schools, with 51 (92.7% in the age bracket) enrolled. Conversely, the age group of 5 to 9 year old has the lowest likelihood of being enrolled in a private school, with 228 (100.0% in the age bracket) attending a public institution.
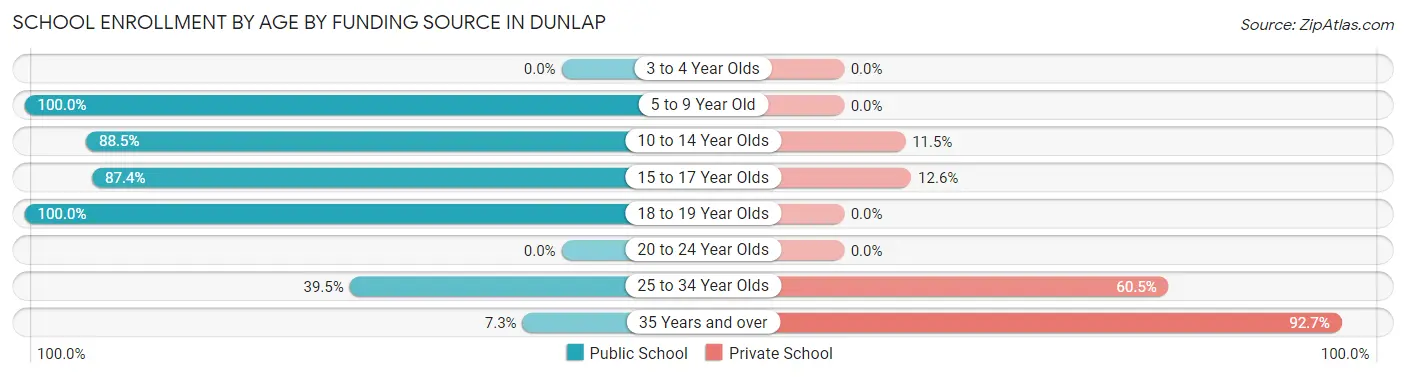
| Age Bracket | Public School | Private School |
| 3 to 4 Year Olds | 0 (0.0%) | 0 (0.0%) |
| 5 to 9 Year Old | 228 (100.0%) | 0 (0.0%) |
| 10 to 14 Year Olds | 286 (88.5%) | 37 (11.5%) |
| 15 to 17 Year Olds | 167 (87.4%) | 24 (12.6%) |
| 18 to 19 Year Olds | 114 (100.0%) | 0 (0.0%) |
| 20 to 24 Year Olds | 0 (0.0%) | 0 (0.0%) |
| 25 to 34 Year Olds | 15 (39.5%) | 23 (60.5%) |
| 35 Years and over | 4 (7.3%) | 51 (92.7%) |
| Total | 814 (85.8%) | 135 (14.2%) |
Educational Attainment by Field of Study in Dunlap
Liberal arts & history (114 | 21.8%), science & technology (63 | 12.0%), engineering (59 | 11.3%), education (43 | 8.2%), and arts & humanities (42 | 8.0%) are the most common fields of study among 523 individuals in Dunlap who have obtained a bachelor's degree or higher.
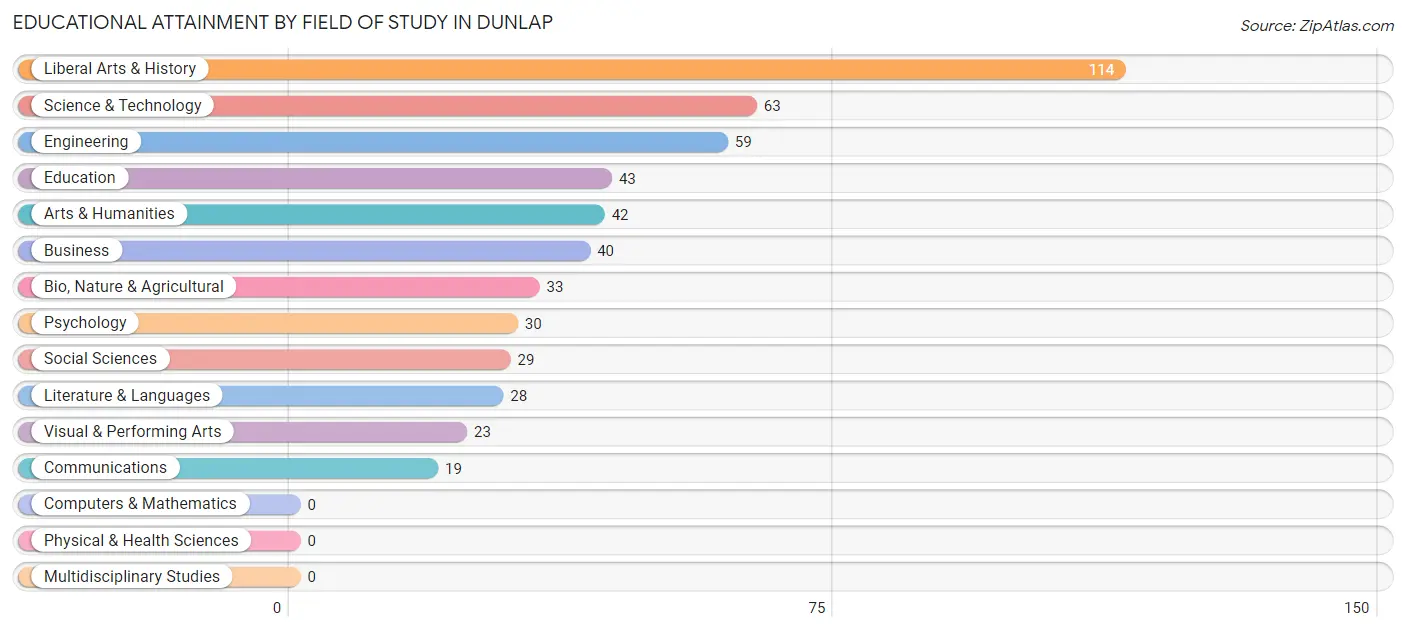
| Field of Study | # Graduates | % Graduates |
| Computers & Mathematics | 0 | 0.0% |
| Bio, Nature & Agricultural | 33 | 6.3% |
| Physical & Health Sciences | 0 | 0.0% |
| Psychology | 30 | 5.7% |
| Social Sciences | 29 | 5.5% |
| Engineering | 59 | 11.3% |
| Multidisciplinary Studies | 0 | 0.0% |
| Science & Technology | 63 | 12.0% |
| Business | 40 | 7.6% |
| Education | 43 | 8.2% |
| Literature & Languages | 28 | 5.3% |
| Liberal Arts & History | 114 | 21.8% |
| Visual & Performing Arts | 23 | 4.4% |
| Communications | 19 | 3.6% |
| Arts & Humanities | 42 | 8.0% |
| Total | 523 | 100.0% |
Transportation & Commute in Dunlap
Vehicle Availability by Sex in Dunlap
The most prevalent vehicle ownership categories in Dunlap are males with 2 vehicles (567, accounting for 49.5%) and females with 2 vehicles (272, making up 76.4%).
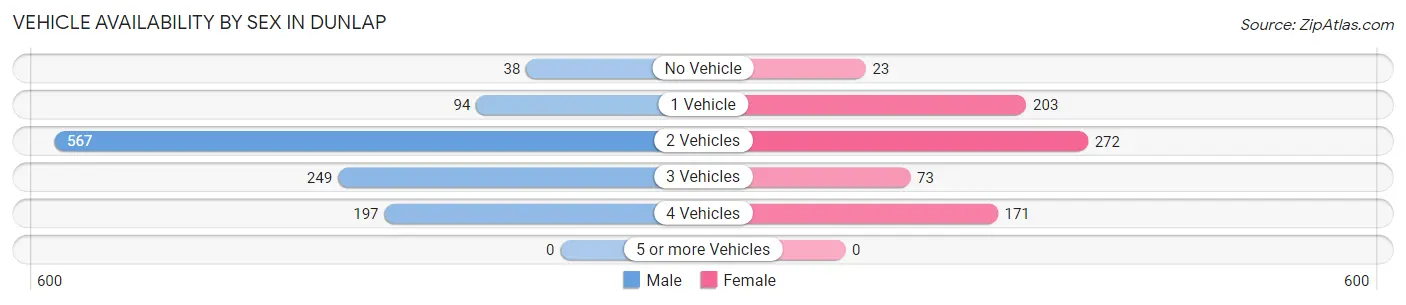
| Vehicles Available | Male | Female |
| No Vehicle | 38 (3.3%) | 23 (3.1%) |
| 1 Vehicle | 94 (8.2%) | 203 (27.4%) |
| 2 Vehicles | 567 (49.5%) | 272 (36.7%) |
| 3 Vehicles | 249 (21.7%) | 73 (9.8%) |
| 4 Vehicles | 197 (17.2%) | 171 (23.1%) |
| 5 or more Vehicles | 0 (0.0%) | 0 (0.0%) |
| Total | 1,145 (100.0%) | 742 (100.0%) |
Commute Time in Dunlap
The most frequently occuring commute durations in Dunlap are 5 to 9 minutes (454 commuters, 25.6%), 45 to 59 minutes (257 commuters, 14.5%), and 10 to 14 minutes (209 commuters, 11.8%).
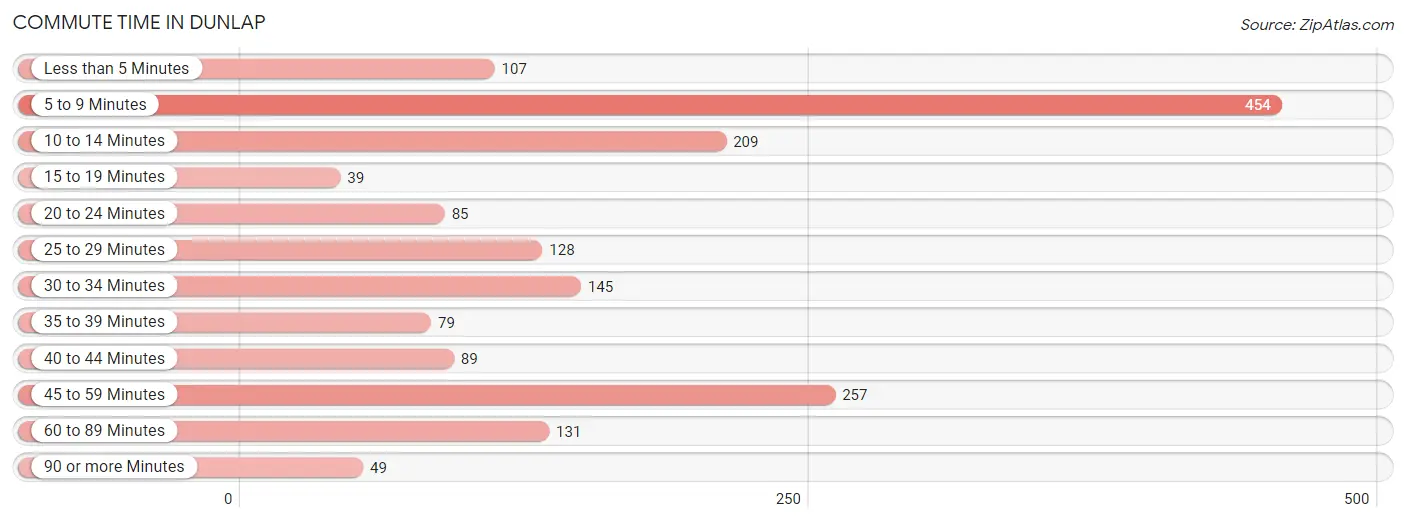
| Commute Time | # Commuters | % Commuters |
| Less than 5 Minutes | 107 | 6.0% |
| 5 to 9 Minutes | 454 | 25.6% |
| 10 to 14 Minutes | 209 | 11.8% |
| 15 to 19 Minutes | 39 | 2.2% |
| 20 to 24 Minutes | 85 | 4.8% |
| 25 to 29 Minutes | 128 | 7.2% |
| 30 to 34 Minutes | 145 | 8.2% |
| 35 to 39 Minutes | 79 | 4.5% |
| 40 to 44 Minutes | 89 | 5.0% |
| 45 to 59 Minutes | 257 | 14.5% |
| 60 to 89 Minutes | 131 | 7.4% |
| 90 or more Minutes | 49 | 2.8% |
Commute Time by Sex in Dunlap
The most common commute times in Dunlap are 45 to 59 minutes (238 commuters, 21.0%) for males and 5 to 9 minutes (239 commuters, 37.4%) for females.
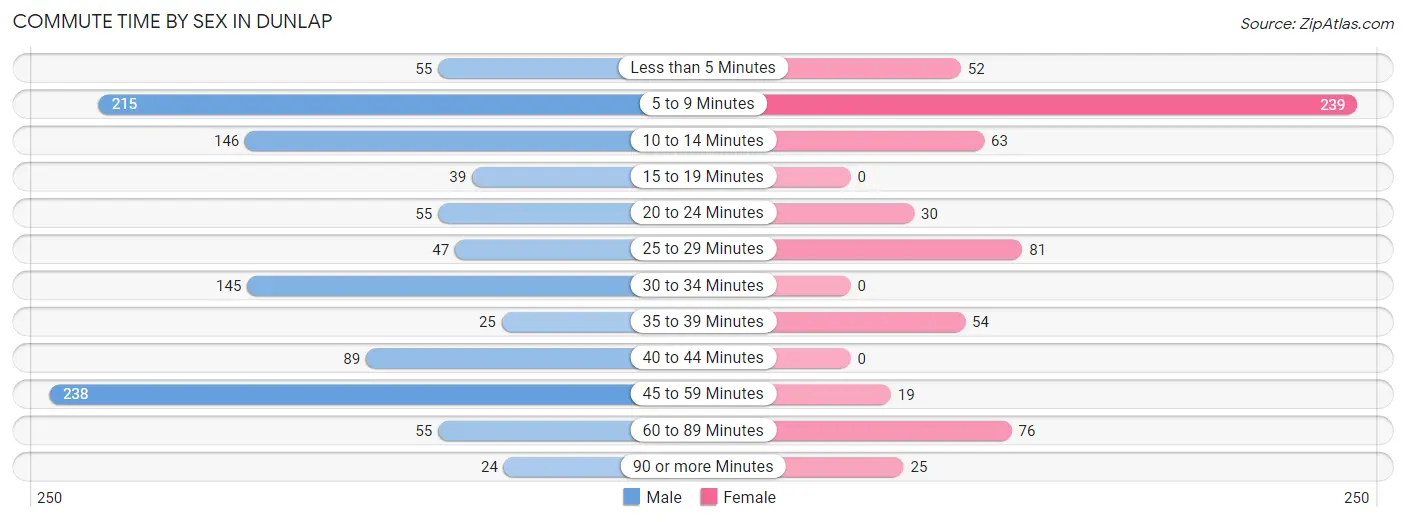
| Commute Time | Male | Female |
| Less than 5 Minutes | 55 (4.9%) | 52 (8.1%) |
| 5 to 9 Minutes | 215 (19.0%) | 239 (37.4%) |
| 10 to 14 Minutes | 146 (12.9%) | 63 (9.9%) |
| 15 to 19 Minutes | 39 (3.4%) | 0 (0.0%) |
| 20 to 24 Minutes | 55 (4.9%) | 30 (4.7%) |
| 25 to 29 Minutes | 47 (4.2%) | 81 (12.7%) |
| 30 to 34 Minutes | 145 (12.8%) | 0 (0.0%) |
| 35 to 39 Minutes | 25 (2.2%) | 54 (8.5%) |
| 40 to 44 Minutes | 89 (7.9%) | 0 (0.0%) |
| 45 to 59 Minutes | 238 (21.0%) | 19 (3.0%) |
| 60 to 89 Minutes | 55 (4.9%) | 76 (11.9%) |
| 90 or more Minutes | 24 (2.1%) | 25 (3.9%) |
Time of Departure to Work by Sex in Dunlap
The most frequent times of departure to work in Dunlap are 12:00 AM to 4:59 AM (182, 16.1%) for males and 7:00 AM to 7:29 AM (184, 28.8%) for females.
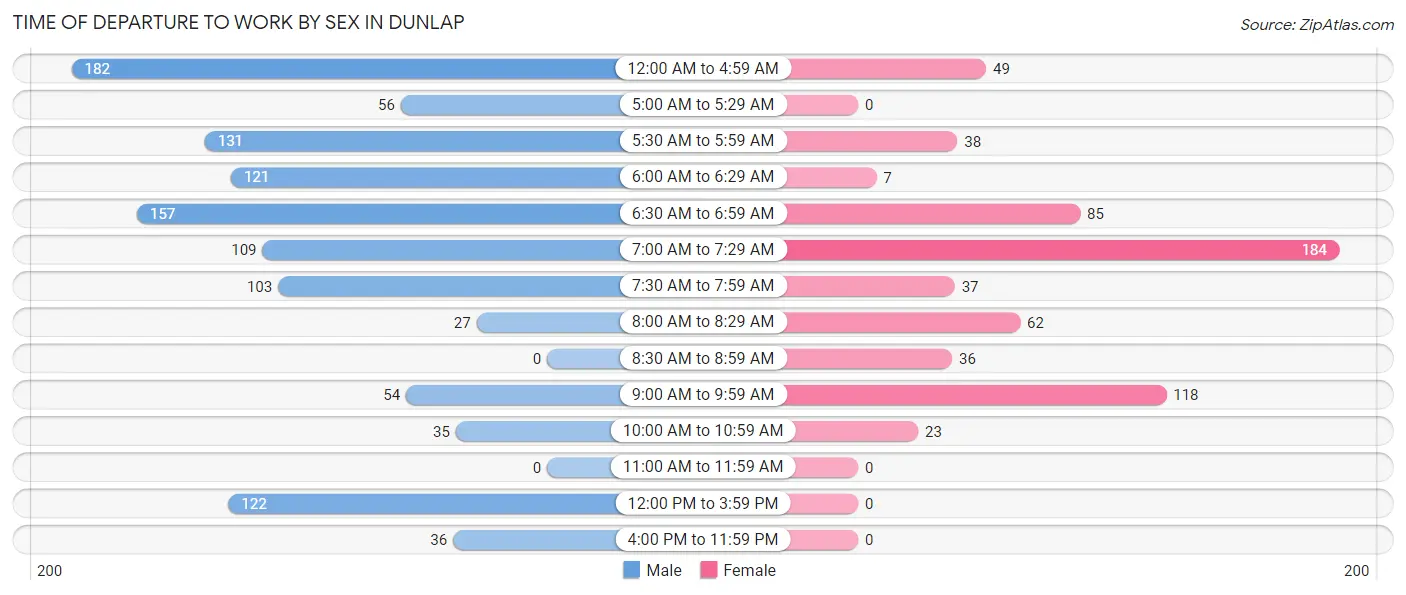
| Time of Departure | Male | Female |
| 12:00 AM to 4:59 AM | 182 (16.1%) | 49 (7.7%) |
| 5:00 AM to 5:29 AM | 56 (4.9%) | 0 (0.0%) |
| 5:30 AM to 5:59 AM | 131 (11.6%) | 38 (5.9%) |
| 6:00 AM to 6:29 AM | 121 (10.7%) | 7 (1.1%) |
| 6:30 AM to 6:59 AM | 157 (13.9%) | 85 (13.3%) |
| 7:00 AM to 7:29 AM | 109 (9.6%) | 184 (28.8%) |
| 7:30 AM to 7:59 AM | 103 (9.1%) | 37 (5.8%) |
| 8:00 AM to 8:29 AM | 27 (2.4%) | 62 (9.7%) |
| 8:30 AM to 8:59 AM | 0 (0.0%) | 36 (5.6%) |
| 9:00 AM to 9:59 AM | 54 (4.8%) | 118 (18.5%) |
| 10:00 AM to 10:59 AM | 35 (3.1%) | 23 (3.6%) |
| 11:00 AM to 11:59 AM | 0 (0.0%) | 0 (0.0%) |
| 12:00 PM to 3:59 PM | 122 (10.8%) | 0 (0.0%) |
| 4:00 PM to 11:59 PM | 36 (3.2%) | 0 (0.0%) |
| Total | 1,133 (100.0%) | 639 (100.0%) |
Housing Occupancy in Dunlap
Occupancy by Ownership in Dunlap
Of the total 1,928 dwellings in Dunlap, owner-occupied units account for 1,163 (60.3%), while renter-occupied units make up 765 (39.7%).
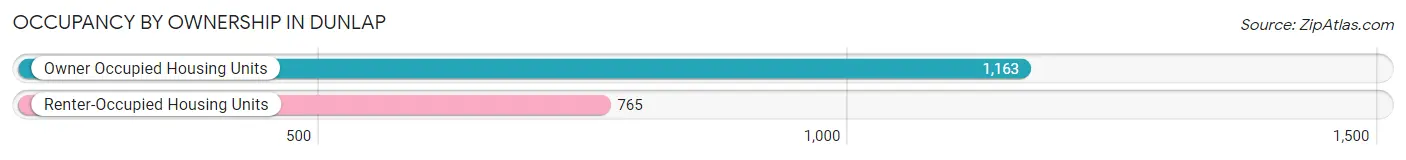
| Occupancy | # Housing Units | % Housing Units |
| Owner Occupied Housing Units | 1,163 | 60.3% |
| Renter-Occupied Housing Units | 765 | 39.7% |
| Total Occupied Housing Units | 1,928 | 100.0% |
Occupancy by Household Size in Dunlap
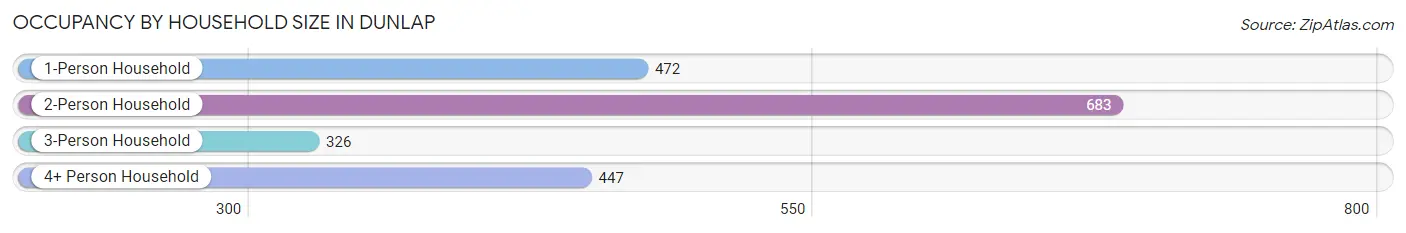
| Household Size | # Housing Units | % Housing Units |
| 1-Person Household | 472 | 24.5% |
| 2-Person Household | 683 | 35.4% |
| 3-Person Household | 326 | 16.9% |
| 4+ Person Household | 447 | 23.2% |
| Total Housing Units | 1,928 | 100.0% |
Occupancy by Ownership by Household Size in Dunlap
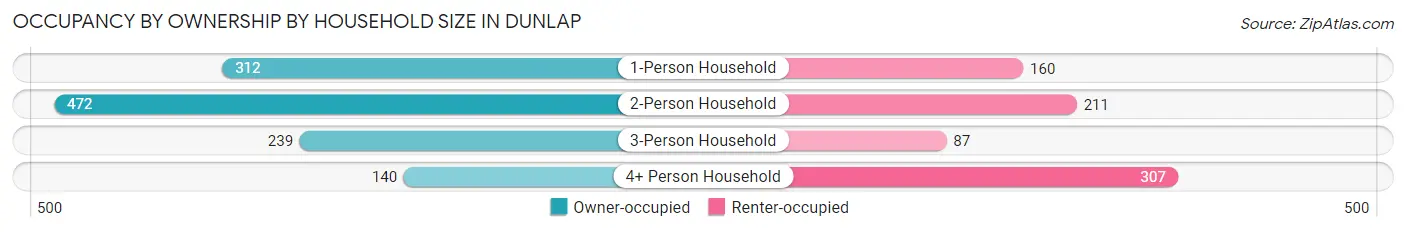
| Household Size | Owner-occupied | Renter-occupied |
| 1-Person Household | 312 (66.1%) | 160 (33.9%) |
| 2-Person Household | 472 (69.1%) | 211 (30.9%) |
| 3-Person Household | 239 (73.3%) | 87 (26.7%) |
| 4+ Person Household | 140 (31.3%) | 307 (68.7%) |
| Total Housing Units | 1,163 (60.3%) | 765 (39.7%) |
Occupancy by Educational Attainment in Dunlap
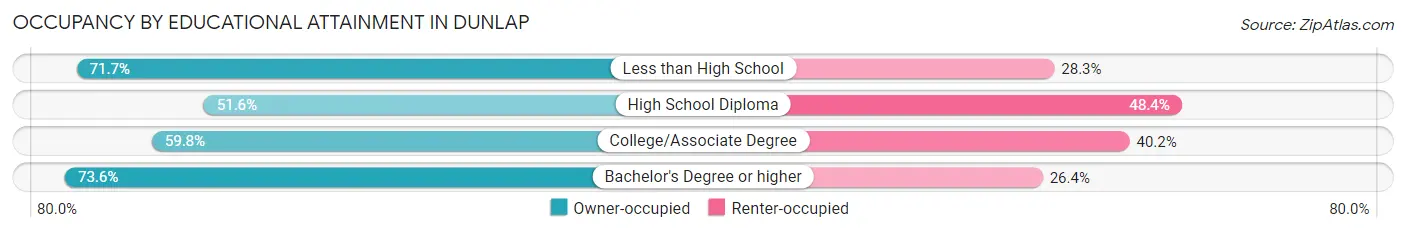
| Household Size | Owner-occupied | Renter-occupied |
| Less than High School | 297 (71.7%) | 117 (28.3%) |
| High School Diploma | 413 (51.6%) | 388 (48.4%) |
| College/Associate Degree | 311 (59.8%) | 209 (40.2%) |
| Bachelor's Degree or higher | 142 (73.6%) | 51 (26.4%) |
Occupancy by Age of Householder in Dunlap
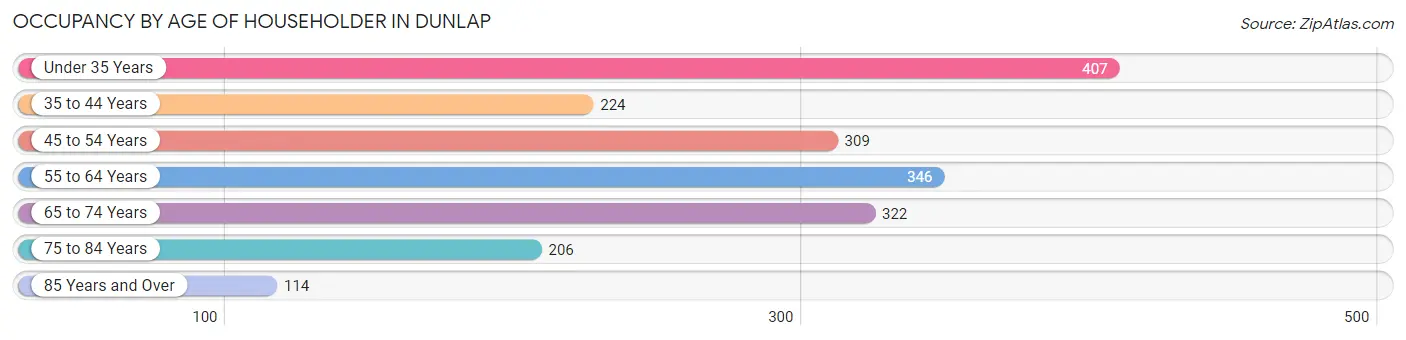
| Age Bracket | # Households | % Households |
| Under 35 Years | 407 | 21.1% |
| 35 to 44 Years | 224 | 11.6% |
| 45 to 54 Years | 309 | 16.0% |
| 55 to 64 Years | 346 | 17.9% |
| 65 to 74 Years | 322 | 16.7% |
| 75 to 84 Years | 206 | 10.7% |
| 85 Years and Over | 114 | 5.9% |
| Total | 1,928 | 100.0% |
Housing Finances in Dunlap
Median Income by Occupancy in Dunlap
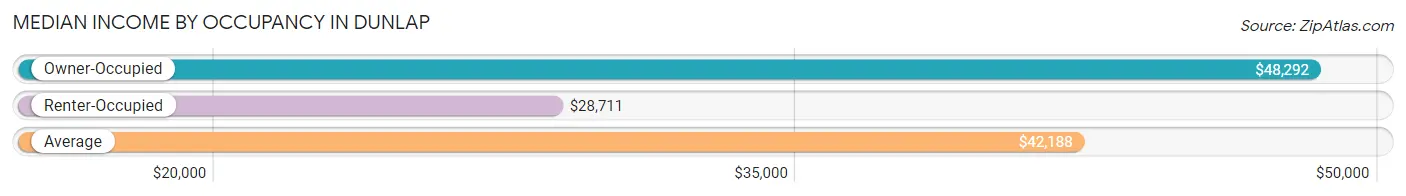
| Occupancy Type | # Households | Median Income |
| Owner-Occupied | 1,163 (60.3%) | $48,292 |
| Renter-Occupied | 765 (39.7%) | $28,711 |
| Average | 1,928 (100.0%) | $42,188 |
Occupancy by Householder Income Bracket in Dunlap
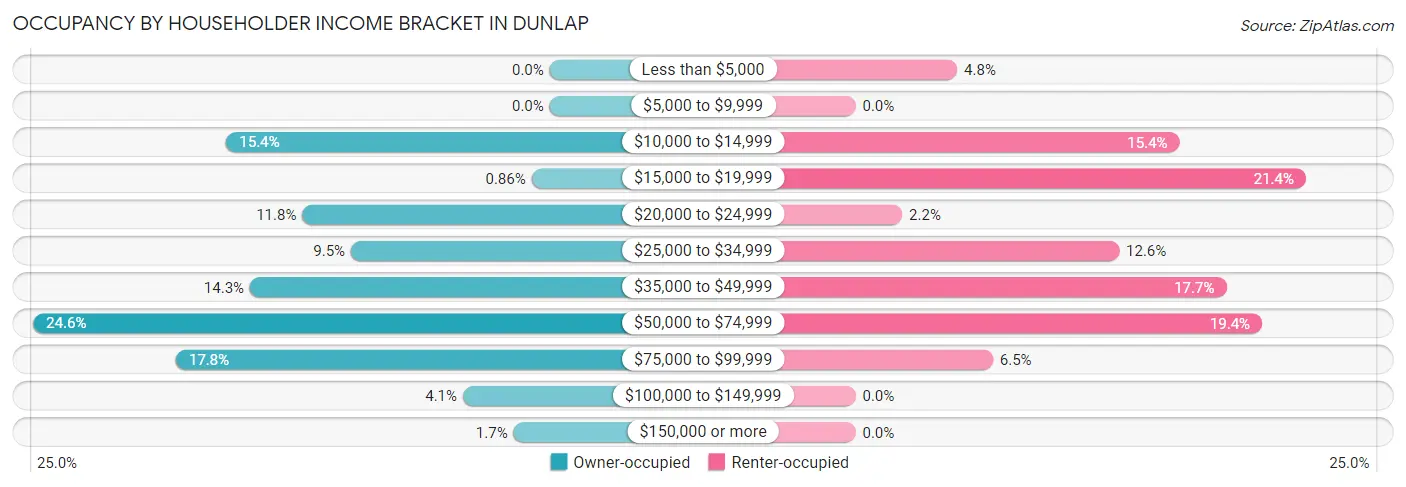
| Income Bracket | Owner-occupied | Renter-occupied |
| Less than $5,000 | 0 (0.0%) | 37 (4.8%) |
| $5,000 to $9,999 | 0 (0.0%) | 0 (0.0%) |
| $10,000 to $14,999 | 179 (15.4%) | 118 (15.4%) |
| $15,000 to $19,999 | 10 (0.9%) | 164 (21.4%) |
| $20,000 to $24,999 | 137 (11.8%) | 17 (2.2%) |
| $25,000 to $34,999 | 110 (9.5%) | 96 (12.6%) |
| $35,000 to $49,999 | 166 (14.3%) | 135 (17.6%) |
| $50,000 to $74,999 | 286 (24.6%) | 148 (19.4%) |
| $75,000 to $99,999 | 207 (17.8%) | 50 (6.5%) |
| $100,000 to $149,999 | 48 (4.1%) | 0 (0.0%) |
| $150,000 or more | 20 (1.7%) | 0 (0.0%) |
| Total | 1,163 (100.0%) | 765 (100.0%) |
Monthly Housing Cost Tiers in Dunlap
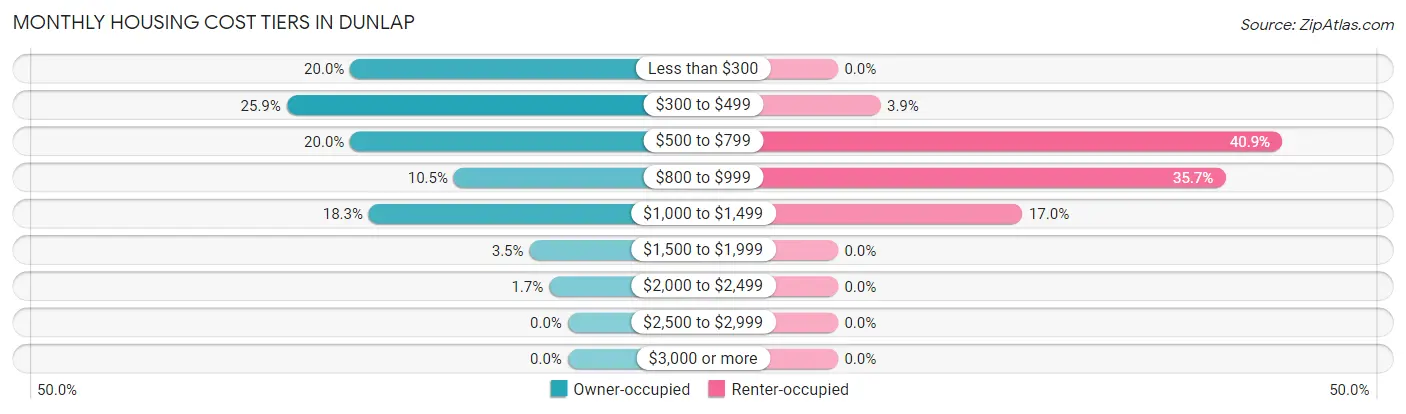
| Monthly Cost | Owner-occupied | Renter-occupied |
| Less than $300 | 233 (20.0%) | 0 (0.0%) |
| $300 to $499 | 301 (25.9%) | 30 (3.9%) |
| $500 to $799 | 233 (20.0%) | 313 (40.9%) |
| $800 to $999 | 122 (10.5%) | 273 (35.7%) |
| $1,000 to $1,499 | 213 (18.3%) | 130 (17.0%) |
| $1,500 to $1,999 | 41 (3.5%) | 0 (0.0%) |
| $2,000 to $2,499 | 20 (1.7%) | 0 (0.0%) |
| $2,500 to $2,999 | 0 (0.0%) | 0 (0.0%) |
| $3,000 or more | 0 (0.0%) | 0 (0.0%) |
| Total | 1,163 (100.0%) | 765 (100.0%) |
Physical Housing Characteristics in Dunlap
Housing Structures in Dunlap
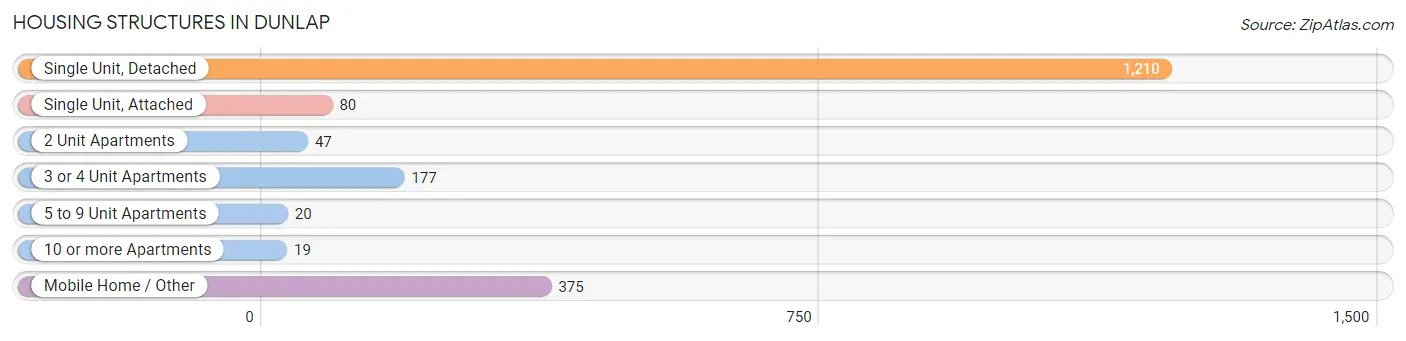
| Structure Type | # Housing Units | % Housing Units |
| Single Unit, Detached | 1,210 | 62.8% |
| Single Unit, Attached | 80 | 4.2% |
| 2 Unit Apartments | 47 | 2.4% |
| 3 or 4 Unit Apartments | 177 | 9.2% |
| 5 to 9 Unit Apartments | 20 | 1.0% |
| 10 or more Apartments | 19 | 1.0% |
| Mobile Home / Other | 375 | 19.5% |
| Total | 1,928 | 100.0% |
Housing Structures by Occupancy in Dunlap
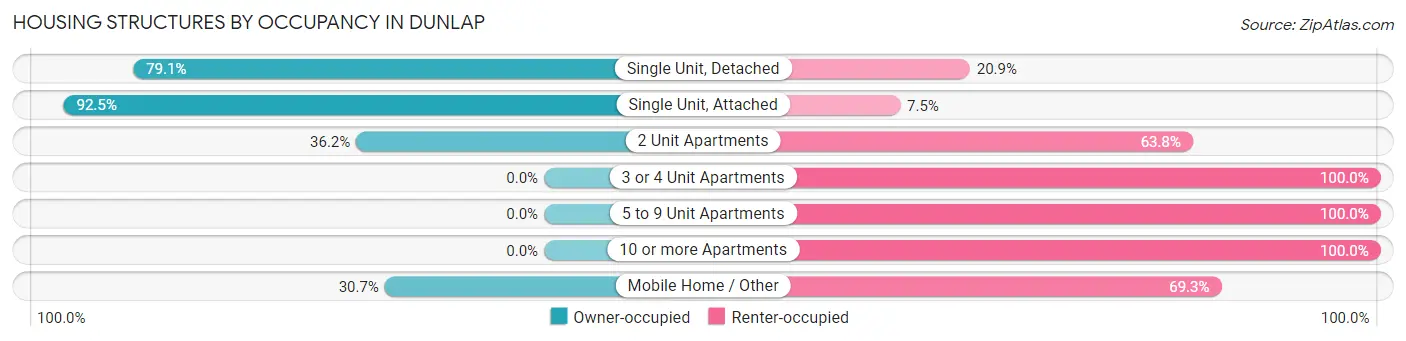
| Structure Type | Owner-occupied | Renter-occupied |
| Single Unit, Detached | 957 (79.1%) | 253 (20.9%) |
| Single Unit, Attached | 74 (92.5%) | 6 (7.5%) |
| 2 Unit Apartments | 17 (36.2%) | 30 (63.8%) |
| 3 or 4 Unit Apartments | 0 (0.0%) | 177 (100.0%) |
| 5 to 9 Unit Apartments | 0 (0.0%) | 20 (100.0%) |
| 10 or more Apartments | 0 (0.0%) | 19 (100.0%) |
| Mobile Home / Other | 115 (30.7%) | 260 (69.3%) |
| Total | 1,163 (60.3%) | 765 (39.7%) |
Housing Structures by Number of Rooms in Dunlap
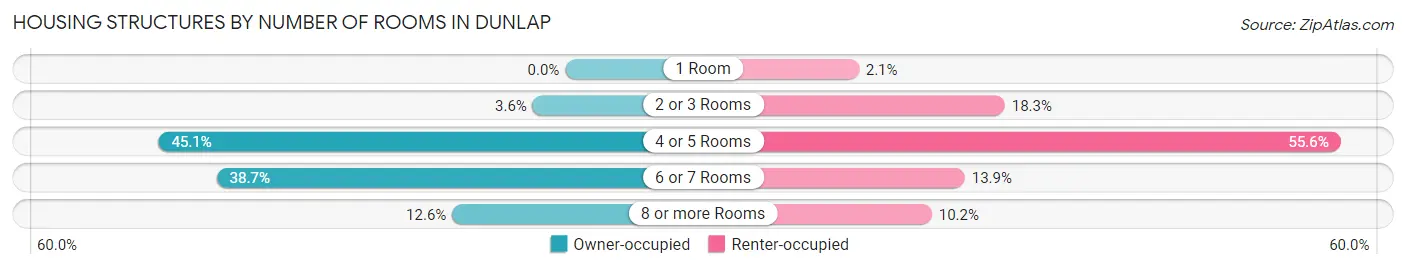
| Number of Rooms | Owner-occupied | Renter-occupied |
| 1 Room | 0 (0.0%) | 16 (2.1%) |
| 2 or 3 Rooms | 42 (3.6%) | 140 (18.3%) |
| 4 or 5 Rooms | 525 (45.1%) | 425 (55.6%) |
| 6 or 7 Rooms | 450 (38.7%) | 106 (13.9%) |
| 8 or more Rooms | 146 (12.6%) | 78 (10.2%) |
| Total | 1,163 (100.0%) | 765 (100.0%) |
Housing Structure by Heating Type in Dunlap
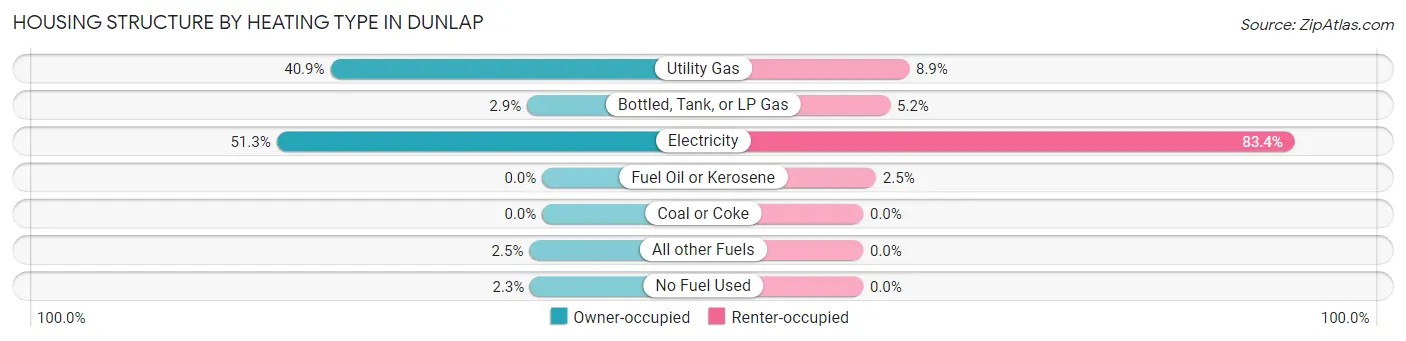
| Heating Type | Owner-occupied | Renter-occupied |
| Utility Gas | 476 (40.9%) | 68 (8.9%) |
| Bottled, Tank, or LP Gas | 34 (2.9%) | 40 (5.2%) |
| Electricity | 597 (51.3%) | 638 (83.4%) |
| Fuel Oil or Kerosene | 0 (0.0%) | 19 (2.5%) |
| Coal or Coke | 0 (0.0%) | 0 (0.0%) |
| All other Fuels | 29 (2.5%) | 0 (0.0%) |
| No Fuel Used | 27 (2.3%) | 0 (0.0%) |
| Total | 1,163 (100.0%) | 765 (100.0%) |
Household Vehicle Usage in Dunlap
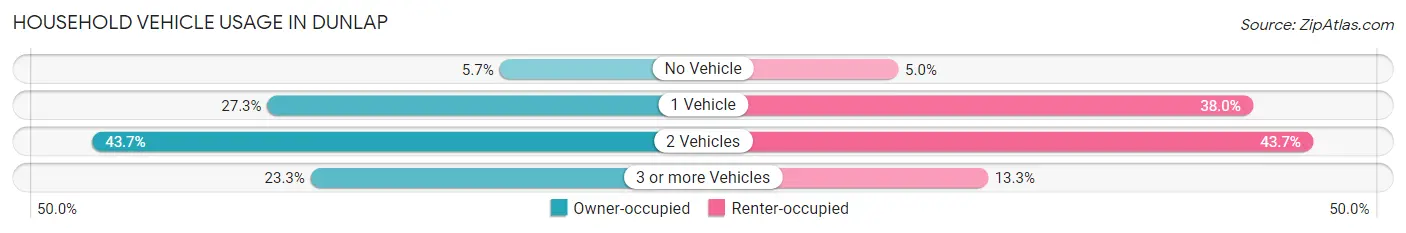
| Vehicles per Household | Owner-occupied | Renter-occupied |
| No Vehicle | 66 (5.7%) | 38 (5.0%) |
| 1 Vehicle | 318 (27.3%) | 291 (38.0%) |
| 2 Vehicles | 508 (43.7%) | 334 (43.7%) |
| 3 or more Vehicles | 271 (23.3%) | 102 (13.3%) |
| Total | 1,163 (100.0%) | 765 (100.0%) |
Real Estate & Mortgages in Dunlap
Real Estate and Mortgage Overview in Dunlap
| Characteristic | Without Mortgage | With Mortgage |
| Housing Units | 653 | 510 |
| Median Property Value | $139,600 | $121,300 |
| Median Household Income | $38,281 | $20 |
| Monthly Housing Costs | $360 | $0 |
| Real Estate Taxes | $805 | $11 |
Property Value by Mortgage Status in Dunlap
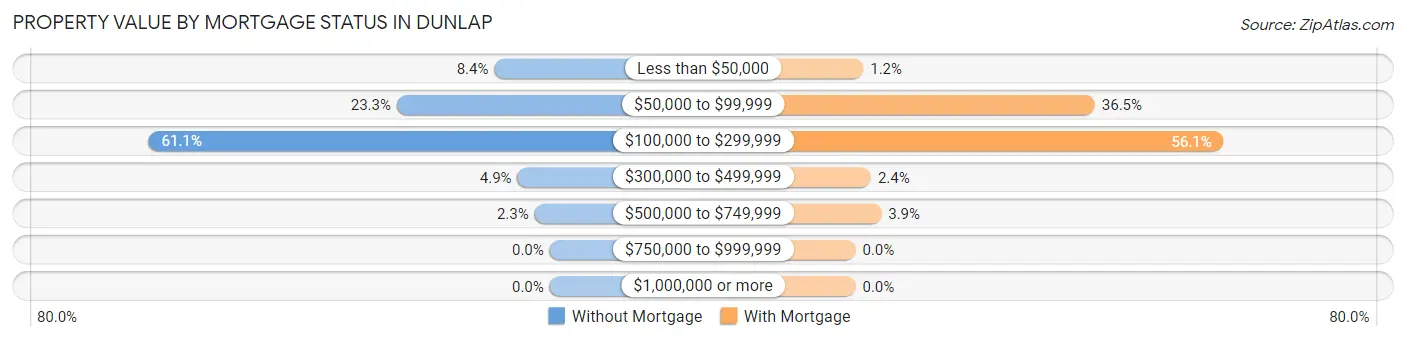
| Property Value | Without Mortgage | With Mortgage |
| Less than $50,000 | 55 (8.4%) | 6 (1.2%) |
| $50,000 to $99,999 | 152 (23.3%) | 186 (36.5%) |
| $100,000 to $299,999 | 399 (61.1%) | 286 (56.1%) |
| $300,000 to $499,999 | 32 (4.9%) | 12 (2.4%) |
| $500,000 to $749,999 | 15 (2.3%) | 20 (3.9%) |
| $750,000 to $999,999 | 0 (0.0%) | 0 (0.0%) |
| $1,000,000 or more | 0 (0.0%) | 0 (0.0%) |
| Total | 653 (100.0%) | 510 (100.0%) |
Household Income by Mortgage Status in Dunlap
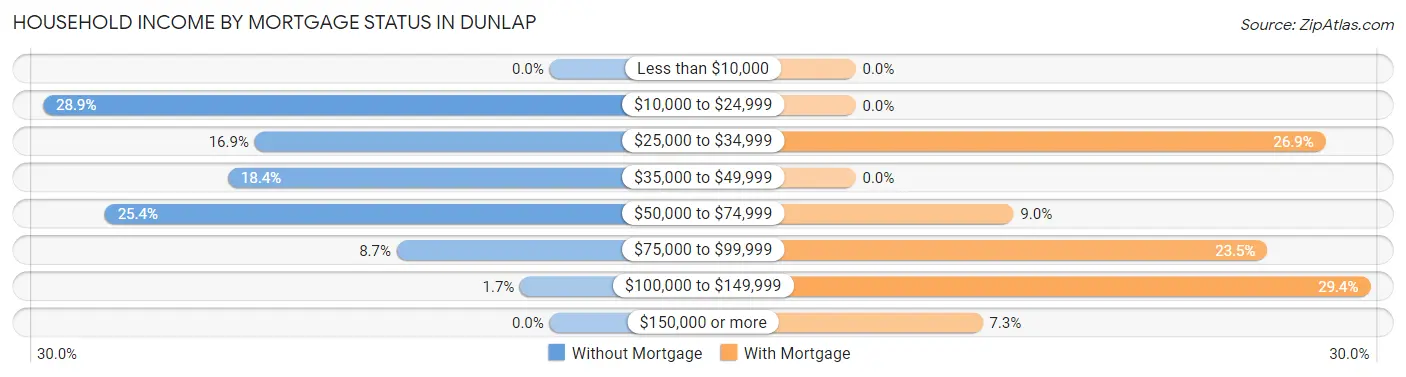
| Household Income | Without Mortgage | With Mortgage |
| Less than $10,000 | 0 (0.0%) | 0 (0.0%) |
| $10,000 to $24,999 | 189 (28.9%) | 0 (0.0%) |
| $25,000 to $34,999 | 110 (16.9%) | 137 (26.9%) |
| $35,000 to $49,999 | 120 (18.4%) | 0 (0.0%) |
| $50,000 to $74,999 | 166 (25.4%) | 46 (9.0%) |
| $75,000 to $99,999 | 57 (8.7%) | 120 (23.5%) |
| $100,000 to $149,999 | 11 (1.7%) | 150 (29.4%) |
| $150,000 or more | 0 (0.0%) | 37 (7.2%) |
| Total | 653 (100.0%) | 510 (100.0%) |
Property Value to Household Income Ratio in Dunlap
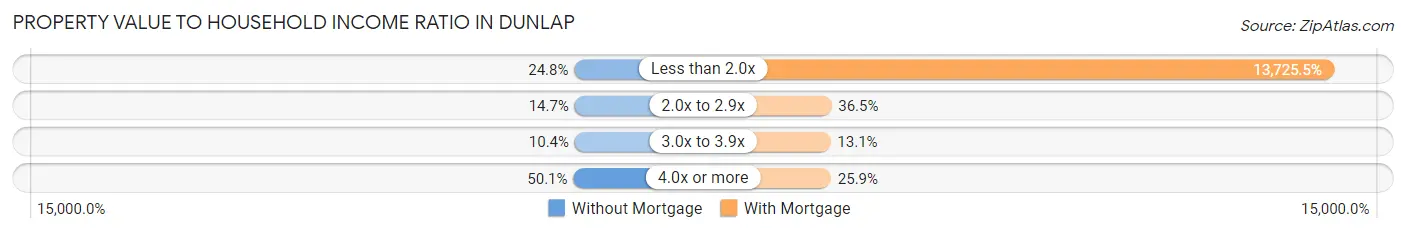
| Value-to-Income Ratio | Without Mortgage | With Mortgage |
| Less than 2.0x | 162 (24.8%) | 70,000 (13,725.5%) |
| 2.0x to 2.9x | 96 (14.7%) | 186 (36.5%) |
| 3.0x to 3.9x | 68 (10.4%) | 67 (13.1%) |
| 4.0x or more | 327 (50.1%) | 132 (25.9%) |
| Total | 653 (100.0%) | 510 (100.0%) |
Real Estate Taxes by Mortgage Status in Dunlap
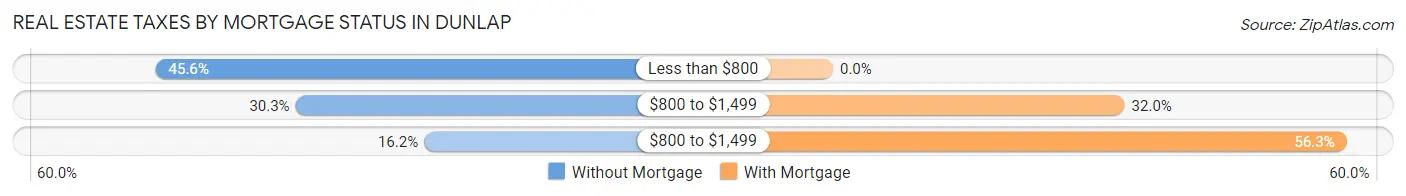
| Property Taxes | Without Mortgage | With Mortgage |
| Less than $800 | 298 (45.6%) | 0 (0.0%) |
| $800 to $1,499 | 198 (30.3%) | 163 (32.0%) |
| $800 to $1,499 | 106 (16.2%) | 287 (56.3%) |
| Total | 653 (100.0%) | 510 (100.0%) |
Health & Disability in Dunlap
Health Insurance Coverage by Age in Dunlap
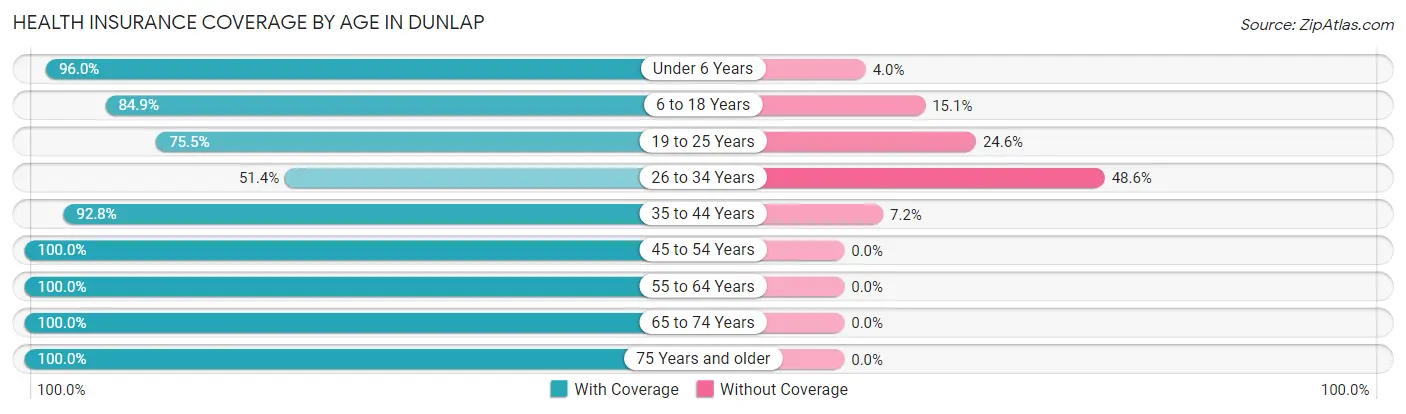
| Age Bracket | With Coverage | Without Coverage |
| Under 6 Years | 409 (96.0%) | 17 (4.0%) |
| 6 to 18 Years | 844 (84.9%) | 150 (15.1%) |
| 19 to 25 Years | 292 (75.4%) | 95 (24.5%) |
| 26 to 34 Years | 429 (51.4%) | 405 (48.6%) |
| 35 to 44 Years | 474 (92.8%) | 37 (7.2%) |
| 45 to 54 Years | 564 (100.0%) | 0 (0.0%) |
| 55 to 64 Years | 603 (100.0%) | 0 (0.0%) |
| 65 to 74 Years | 430 (100.0%) | 0 (0.0%) |
| 75 Years and older | 457 (100.0%) | 0 (0.0%) |
| Total | 4,502 (86.5%) | 704 (13.5%) |
Health Insurance Coverage by Citizenship Status in Dunlap
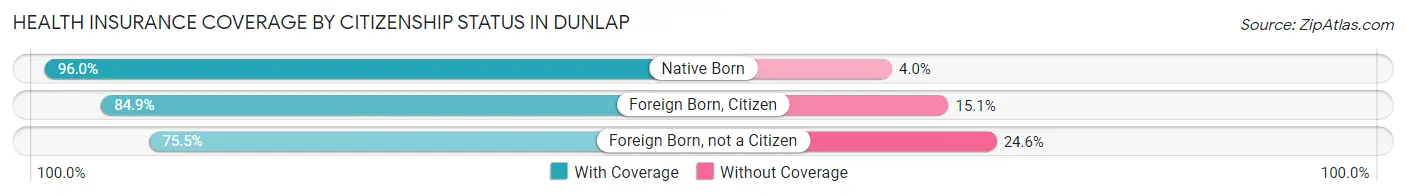
| Citizenship Status | With Coverage | Without Coverage |
| Native Born | 409 (96.0%) | 17 (4.0%) |
| Foreign Born, Citizen | 844 (84.9%) | 150 (15.1%) |
| Foreign Born, not a Citizen | 292 (75.4%) | 95 (24.5%) |
Health Insurance Coverage by Household Income in Dunlap
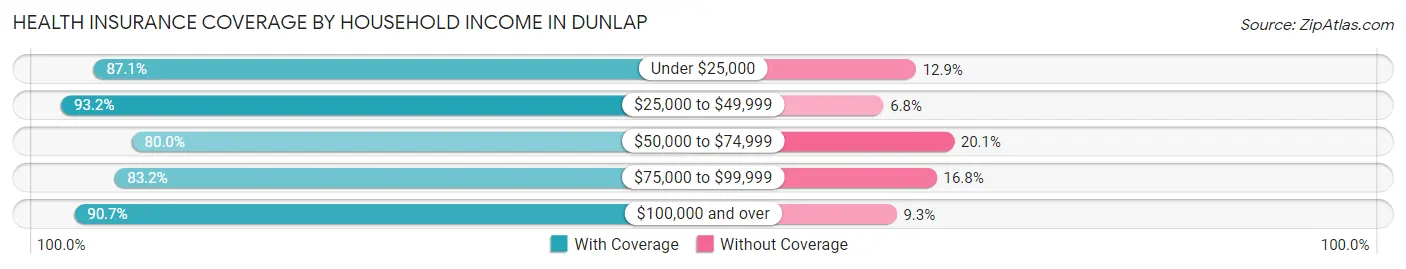
| Household Income | With Coverage | Without Coverage |
| Under $25,000 | 1,349 (87.1%) | 200 (12.9%) |
| $25,000 to $49,999 | 1,240 (93.2%) | 91 (6.8%) |
| $50,000 to $74,999 | 1,013 (79.9%) | 254 (20.1%) |
| $75,000 to $99,999 | 673 (83.2%) | 136 (16.8%) |
| $100,000 and over | 224 (90.7%) | 23 (9.3%) |
Public vs Private Health Insurance Coverage by Age in Dunlap
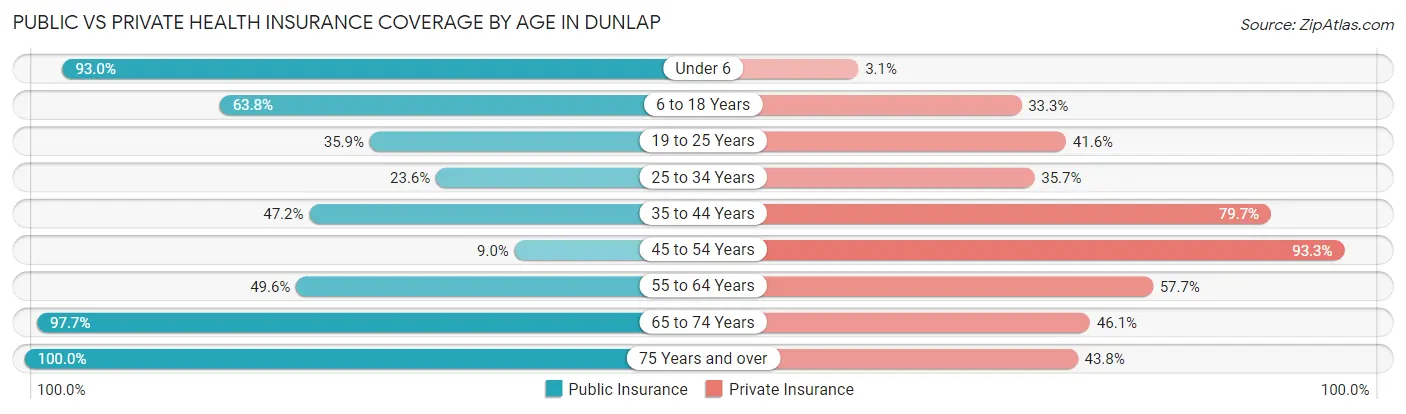
| Age Bracket | Public Insurance | Private Insurance |
| Under 6 | 396 (93.0%) | 13 (3.0%) |
| 6 to 18 Years | 634 (63.8%) | 331 (33.3%) |
| 19 to 25 Years | 139 (35.9%) | 161 (41.6%) |
| 25 to 34 Years | 197 (23.6%) | 298 (35.7%) |
| 35 to 44 Years | 241 (47.2%) | 407 (79.6%) |
| 45 to 54 Years | 51 (9.0%) | 526 (93.3%) |
| 55 to 64 Years | 299 (49.6%) | 348 (57.7%) |
| 65 to 74 Years | 420 (97.7%) | 198 (46.1%) |
| 75 Years and over | 457 (100.0%) | 200 (43.8%) |
| Total | 2,834 (54.4%) | 2,482 (47.7%) |
Disability Status by Sex by Age in Dunlap
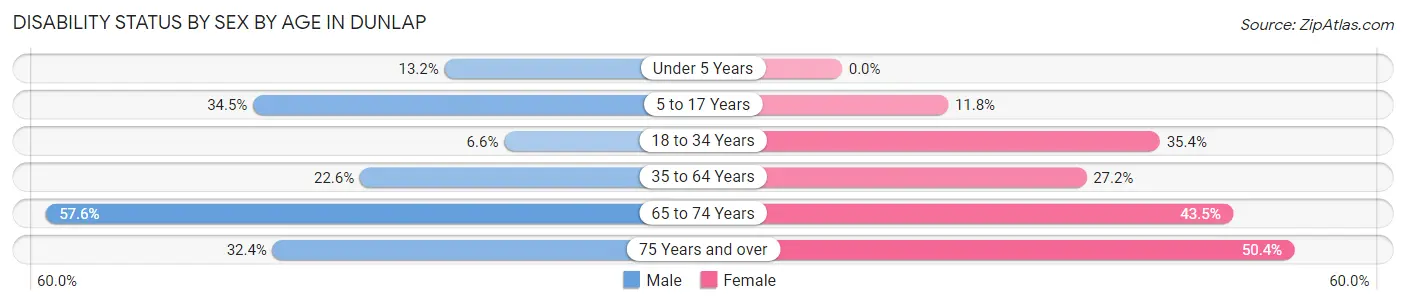
| Age Bracket | Male | Female |
| Under 5 Years | 34 (13.2%) | 0 (0.0%) |
| 5 to 17 Years | 181 (34.5%) | 41 (11.8%) |
| 18 to 34 Years | 51 (6.6%) | 210 (35.4%) |
| 35 to 64 Years | 201 (22.6%) | 215 (27.2%) |
| 65 to 74 Years | 110 (57.6%) | 104 (43.5%) |
| 75 Years and over | 56 (32.4%) | 143 (50.3%) |
Disability Class by Sex by Age in Dunlap
Disability Class: Hearing Difficulty
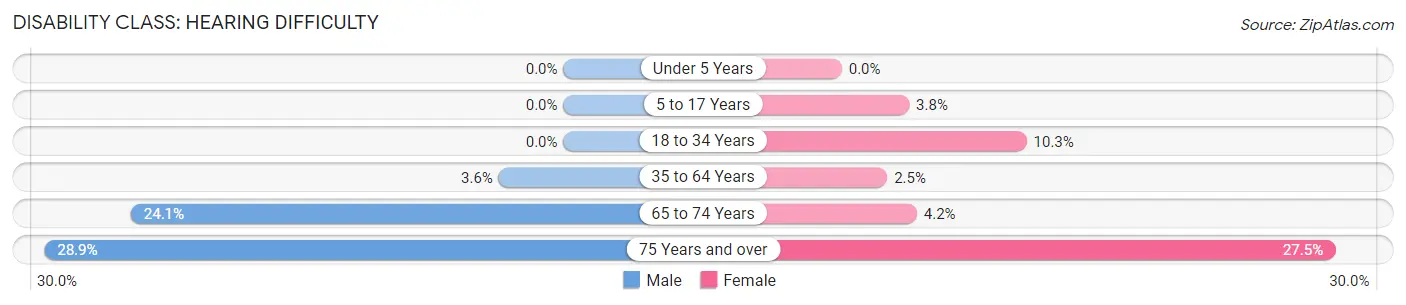
| Age Bracket | Male | Female |
| Under 5 Years | 0 (0.0%) | 0 (0.0%) |
| 5 to 17 Years | 0 (0.0%) | 13 (3.7%) |
| 18 to 34 Years | 0 (0.0%) | 61 (10.3%) |
| 35 to 64 Years | 32 (3.6%) | 20 (2.5%) |
| 65 to 74 Years | 46 (24.1%) | 10 (4.2%) |
| 75 Years and over | 50 (28.9%) | 78 (27.5%) |
Disability Class: Vision Difficulty
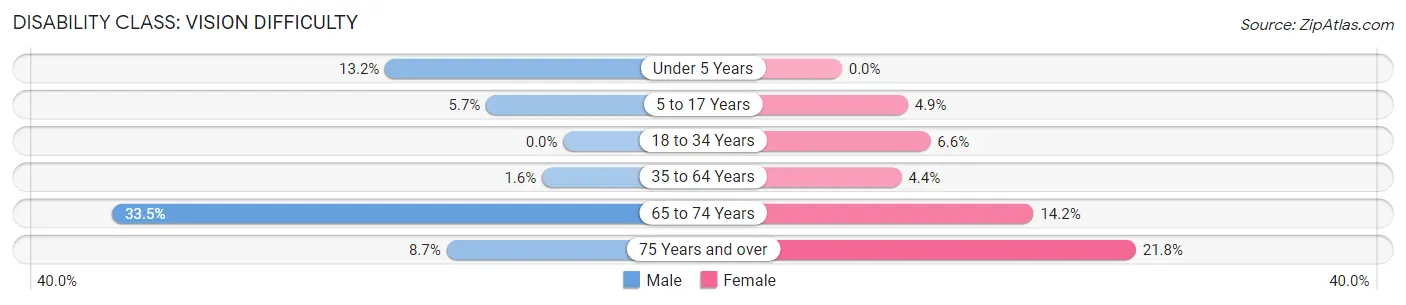
| Age Bracket | Male | Female |
| Under 5 Years | 34 (13.2%) | 0 (0.0%) |
| 5 to 17 Years | 30 (5.7%) | 17 (4.9%) |
| 18 to 34 Years | 0 (0.0%) | 39 (6.6%) |
| 35 to 64 Years | 14 (1.6%) | 35 (4.4%) |
| 65 to 74 Years | 64 (33.5%) | 34 (14.2%) |
| 75 Years and over | 15 (8.7%) | 62 (21.8%) |
Disability Class: Cognitive Difficulty
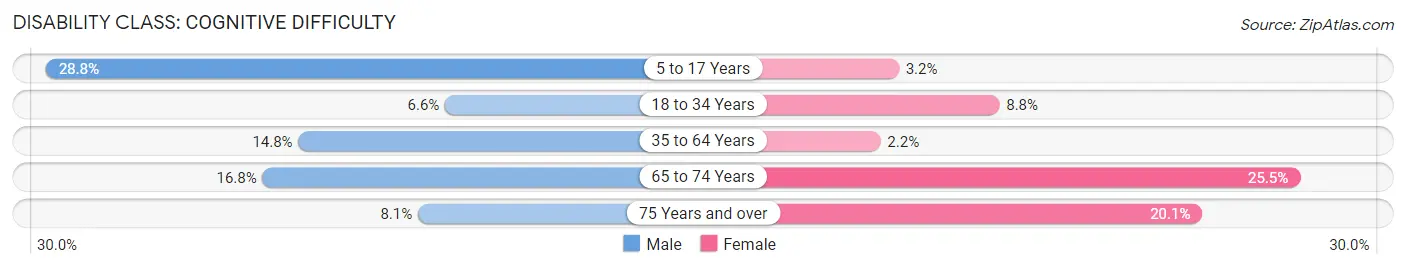
| Age Bracket | Male | Female |
| 5 to 17 Years | 151 (28.8%) | 11 (3.2%) |
| 18 to 34 Years | 51 (6.6%) | 52 (8.8%) |
| 35 to 64 Years | 131 (14.7%) | 17 (2.1%) |
| 65 to 74 Years | 32 (16.8%) | 61 (25.5%) |
| 75 Years and over | 14 (8.1%) | 57 (20.1%) |
Disability Class: Ambulatory Difficulty
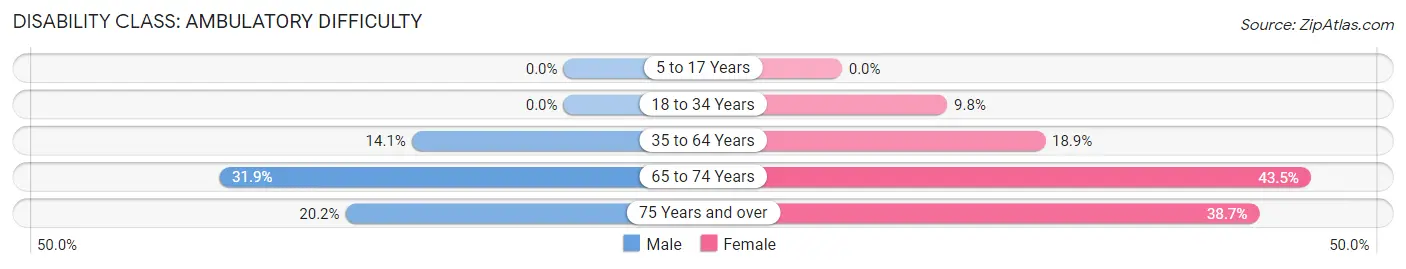
| Age Bracket | Male | Female |
| 5 to 17 Years | 0 (0.0%) | 0 (0.0%) |
| 18 to 34 Years | 0 (0.0%) | 58 (9.8%) |
| 35 to 64 Years | 125 (14.1%) | 149 (18.9%) |
| 65 to 74 Years | 61 (31.9%) | 104 (43.5%) |
| 75 Years and over | 35 (20.2%) | 110 (38.7%) |
Disability Class: Self-Care Difficulty
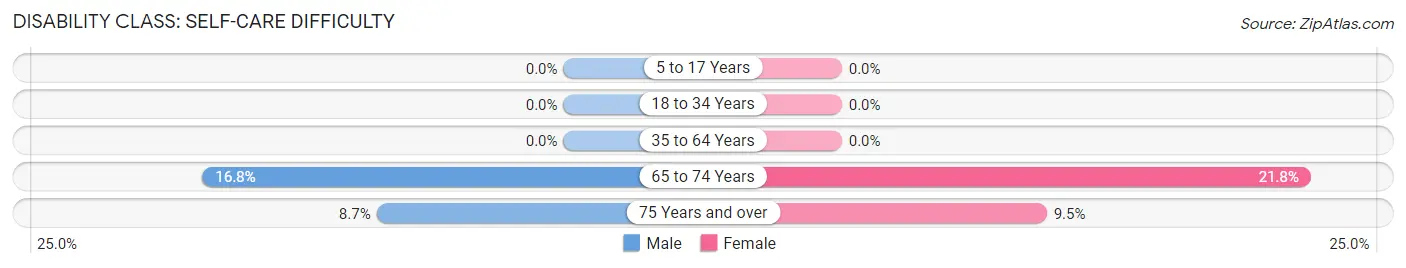
| Age Bracket | Male | Female |
| 5 to 17 Years | 0 (0.0%) | 0 (0.0%) |
| 18 to 34 Years | 0 (0.0%) | 0 (0.0%) |
| 35 to 64 Years | 0 (0.0%) | 0 (0.0%) |
| 65 to 74 Years | 32 (16.8%) | 52 (21.8%) |
| 75 Years and over | 15 (8.7%) | 27 (9.5%) |
Technology Access in Dunlap
Computing Device Access in Dunlap
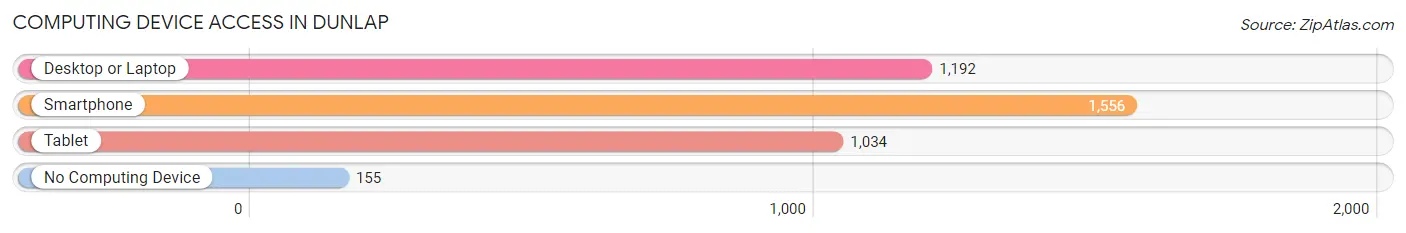
| Device Type | # Households | % Households |
| Desktop or Laptop | 1,192 | 61.8% |
| Smartphone | 1,556 | 80.7% |
| Tablet | 1,034 | 53.6% |
| No Computing Device | 155 | 8.0% |
| Total | 1,928 | 100.0% |
Internet Access in Dunlap
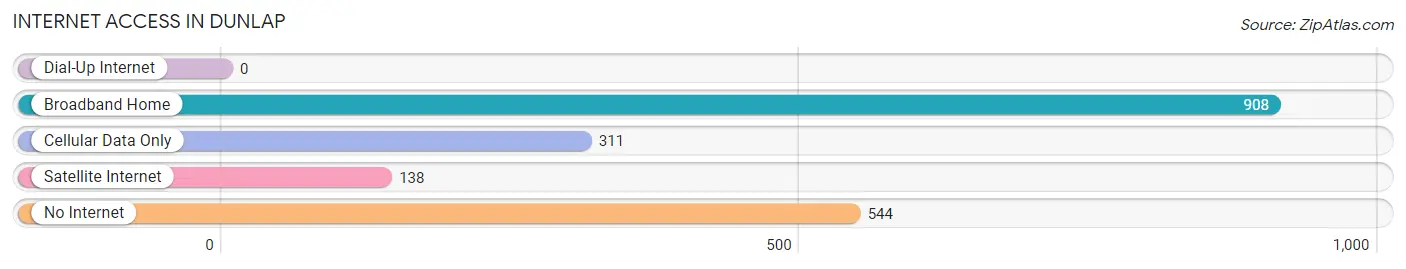
| Internet Type | # Households | % Households |
| Dial-Up Internet | 0 | 0.0% |
| Broadband Home | 908 | 47.1% |
| Cellular Data Only | 311 | 16.1% |
| Satellite Internet | 138 | 7.2% |
| No Internet | 544 | 28.2% |
| Total | 1,928 | 100.0% |
Dunlap Summary
Dunlap, Tennessee is a small town located in Sequatchie County, Tennessee. It is situated in the foothills of the Cumberland Plateau, approximately 25 miles northwest of Chattanooga. The town was founded in 1854 and has a population of approximately 5,000 people.
History
The area that is now Dunlap was originally inhabited by the Cherokee Indians. The first white settlers arrived in the area in the early 1800s. The town was founded in 1854 and was named after the first postmaster, William Dunlap. The town was incorporated in 1872.
In the late 1800s, Dunlap was a thriving agricultural community. The town was known for its production of tobacco, corn, and cotton. The town also had a thriving timber industry.
In the early 1900s, Dunlap began to experience a period of growth and development. The town was connected to the rest of the state by the Tennessee Valley Railroad in 1906. This allowed for the transportation of goods and services to and from the town.
In the mid-1900s, Dunlap experienced a period of decline. The town’s economy was heavily reliant on the timber industry, which began to decline in the 1950s. The town also experienced a population decline as people moved away in search of better economic opportunities.
Geography
Dunlap is located in Sequatchie County, Tennessee. It is situated in the foothills of the Cumberland Plateau, approximately 25 miles northwest of Chattanooga. The town is located at the intersection of US Highway 127 and State Highway 28.
The town is surrounded by rolling hills and forests. The Sequatchie River runs through the town and is a popular spot for fishing and boating. The town is also home to several parks and recreational areas, including Dunlap City Park and Dunlap Lake.
Economy
The economy of Dunlap is largely based on agriculture and tourism. The town is home to several farms that produce tobacco, corn, and cotton. The town is also home to several small businesses, including restaurants, shops, and service providers.
The town is also a popular tourist destination. The town is home to several attractions, including the Sequatchie Valley Railroad Museum, the Dunlap City Park, and the Dunlap Lake. The town also hosts several festivals and events throughout the year, including the Dunlap Days Festival and the Sequatchie Valley Music Festival.
Demographics
As of the 2010 census, the population of Dunlap was 5,000. The town is predominantly white, with approximately 95% of the population identifying as white. The town also has a small Hispanic population, with approximately 2% of the population identifying as Hispanic.
The median household income in Dunlap is $37,000. The median home value is $90,000. The town has a poverty rate of approximately 15%. The town also has a high rate of unemployment, with approximately 10% of the population unemployed.
Conclusion
Dunlap, Tennessee is a small town located in Sequatchie County, Tennessee. The town was founded in 1854 and has a population of approximately 5,000 people. The town’s economy is largely based on agriculture and tourism. The town is predominantly white, with a small Hispanic population. The median household income in Dunlap is $37,000 and the median home value is $90,000. The town has a high rate of unemployment, with approximately 10% of the population unemployed.
Common Questions
What is Per Capita Income in Dunlap?
Per Capita income in Dunlap is $17,685.
What is the Median Family Income in Dunlap?
Median Family Income in Dunlap is $44,045.
What is the Median Household income in Dunlap?
Median Household Income in Dunlap is $42,188.
What is Income or Wage Gap in Dunlap?
Income or Wage Gap in Dunlap is 22.9%.
Women in Dunlap earn 77.1 cents for every dollar earned by a man.
What is Inequality or Gini Index in Dunlap?
Inequality or Gini Index in Dunlap is 0.37.
What is the Total Population of Dunlap?
Total Population of Dunlap is 5,443.
What is the Total Male Population of Dunlap?
Total Male Population of Dunlap is 2,946.
What is the Total Female Population of Dunlap?
Total Female Population of Dunlap is 2,497.
What is the Ratio of Males per 100 Females in Dunlap?
There are 117.98 Males per 100 Females in Dunlap.
What is the Ratio of Females per 100 Males in Dunlap?
There are 84.76 Females per 100 Males in Dunlap.
What is the Median Population Age in Dunlap?
Median Population Age in Dunlap is 37.1 Years.
What is the Average Family Size in Dunlap
Average Family Size in Dunlap is 3.2 People.
What is the Average Household Size in Dunlap
Average Household Size in Dunlap is 2.7 People.
How Large is the Labor Force in Dunlap?
There are 2,024 People in the Labor Forcein in Dunlap.
What is the Percentage of People in the Labor Force in Dunlap?
47.5% of People are in the Labor Force in Dunlap.
What is the Unemployment Rate in Dunlap?
Unemployment Rate in Dunlap is 4.3%.