Merlin, OR Map & Demographics
Merlin Map
Merlin Overview
$34,532
PER CAPITA INCOME
$69,145
AVG FAMILY INCOME
$65,670
AVG HOUSEHOLD INCOME
20.8%
WAGE / INCOME GAP [ % ]
79.2¢/ $1
WAGE / INCOME GAP [ $ ]
0.47
INEQUALITY / GINI INDEX
1,814
TOTAL POPULATION
872
MALE POPULATION
942
FEMALE POPULATION
92.57
MALES / 100 FEMALES
108.03
FEMALES / 100 MALES
52.0
MEDIAN AGE
2.9
AVG FAMILY SIZE
2.6
AVG HOUSEHOLD SIZE
892
LABOR FORCE [ PEOPLE ]
55.6%
PERCENT IN LABOR FORCE
10.9%
UNEMPLOYMENT RATE
Merlin Zip Codes
Merlin Area Codes
Income in Merlin
Income Overview in Merlin
Per Capita Income in Merlin is $34,532, while median incomes of families and households are $69,145 and $65,670 respectively.
| Characteristic | Number | Measure |
| Per Capita Income | 1,814 | $34,532 |
| Median Family Income | 543 | $69,145 |
| Mean Family Income | 543 | $99,268 |
| Median Household Income | 695 | $65,670 |
| Mean Household Income | 695 | $89,115 |
| Income Deficit | 543 | $0 |
| Wage / Income Gap (%) | 1,814 | 20.75% |
| Wage / Income Gap ($) | 1,814 | 79.25¢ per $1 |
| Gini / Inequality Index | 1,814 | 0.47 |
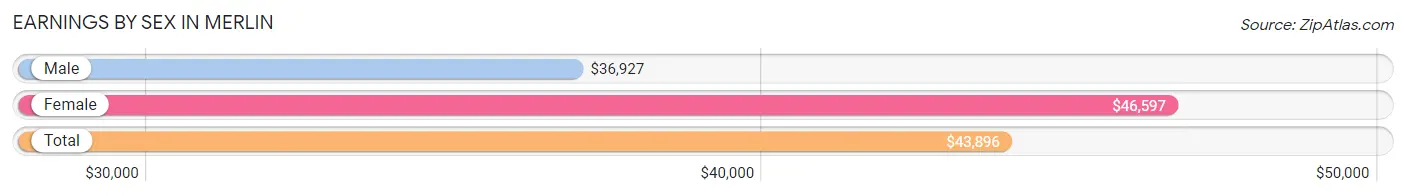
Earnings by Sex in Merlin
Average Earnings in Merlin are $43,896, $36,927 for men and $46,597 for women, a difference of 20.7%.
| Sex | Number | Average Earnings |
| Male | 394 (47.5%) | $36,927 |
| Female | 435 (52.5%) | $46,597 |
| Total | 829 (100.0%) | $43,896 |
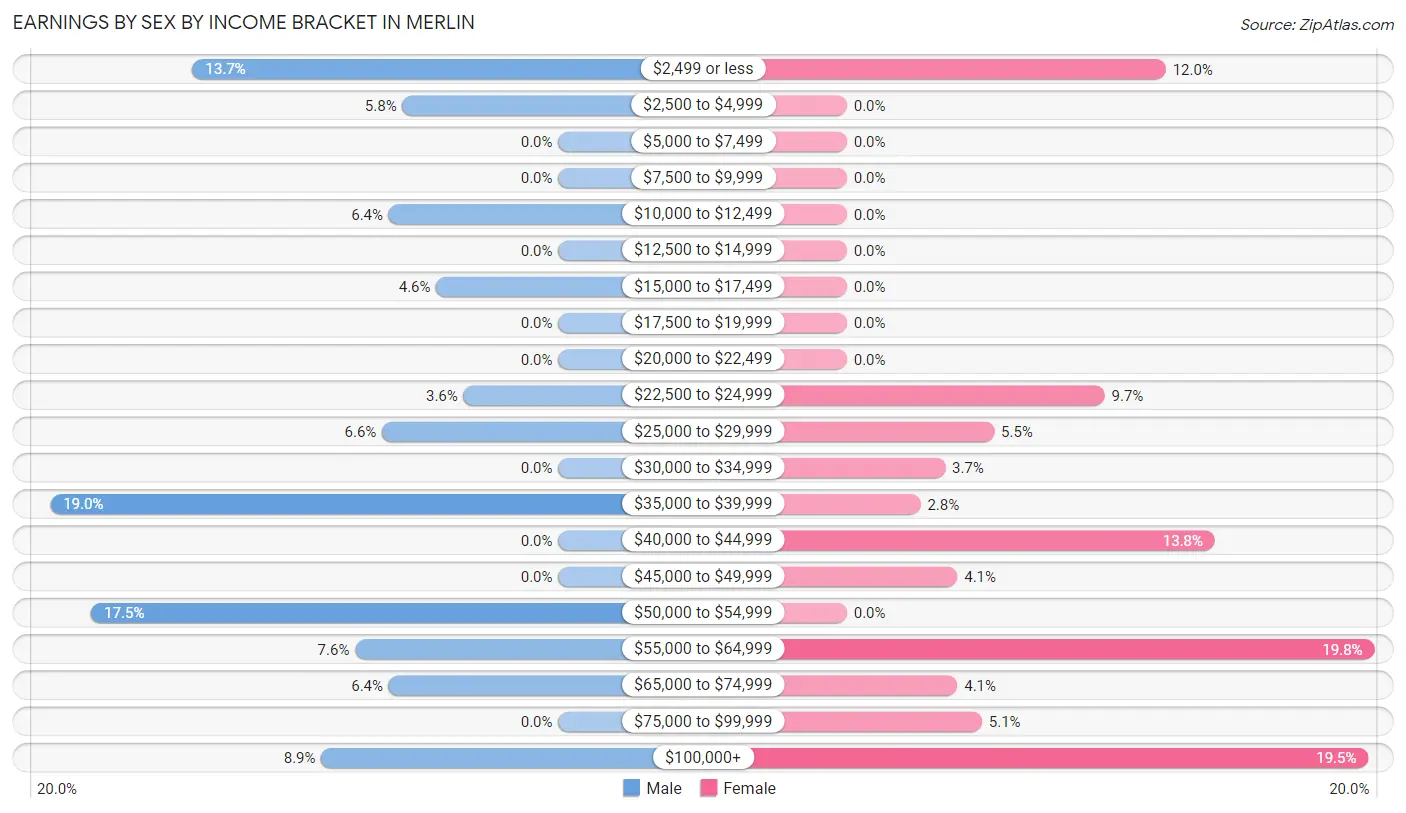
Earnings by Sex by Income Bracket in Merlin
The most common earnings brackets in Merlin are $35,000 to $39,999 for men (75 | 19.0%) and $55,000 to $64,999 for women (86 | 19.8%).
| Income | Male | Female |
| $2,499 or less | 54 (13.7%) | 52 (11.9%) |
| $2,500 to $4,999 | 23 (5.8%) | 0 (0.0%) |
| $5,000 to $7,499 | 0 (0.0%) | 0 (0.0%) |
| $7,500 to $9,999 | 0 (0.0%) | 0 (0.0%) |
| $10,000 to $12,499 | 25 (6.4%) | 0 (0.0%) |
| $12,500 to $14,999 | 0 (0.0%) | 0 (0.0%) |
| $15,000 to $17,499 | 18 (4.6%) | 0 (0.0%) |
| $17,500 to $19,999 | 0 (0.0%) | 0 (0.0%) |
| $20,000 to $22,499 | 0 (0.0%) | 0 (0.0%) |
| $22,500 to $24,999 | 14 (3.5%) | 42 (9.7%) |
| $25,000 to $29,999 | 26 (6.6%) | 24 (5.5%) |
| $30,000 to $34,999 | 0 (0.0%) | 16 (3.7%) |
| $35,000 to $39,999 | 75 (19.0%) | 12 (2.8%) |
| $40,000 to $44,999 | 0 (0.0%) | 60 (13.8%) |
| $45,000 to $49,999 | 0 (0.0%) | 18 (4.1%) |
| $50,000 to $54,999 | 69 (17.5%) | 0 (0.0%) |
| $55,000 to $64,999 | 30 (7.6%) | 86 (19.8%) |
| $65,000 to $74,999 | 25 (6.4%) | 18 (4.1%) |
| $75,000 to $99,999 | 0 (0.0%) | 22 (5.1%) |
| $100,000+ | 35 (8.9%) | 85 (19.5%) |
| Total | 394 (100.0%) | 435 (100.0%) |
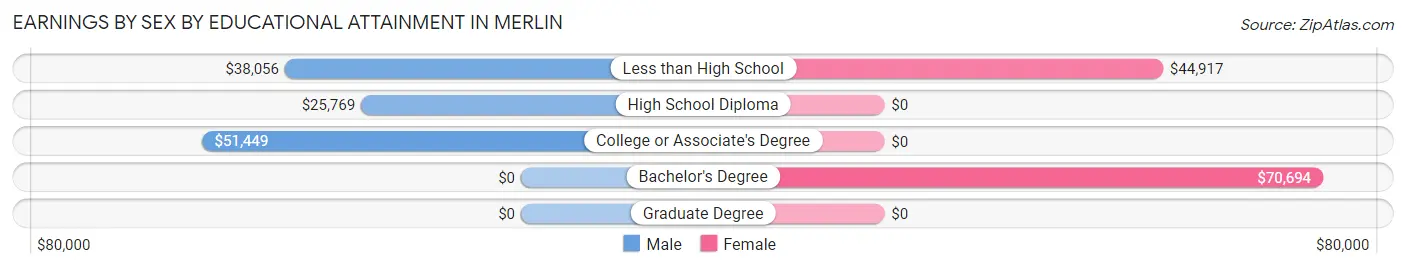
Earnings by Sex by Educational Attainment in Merlin
Average earnings in Merlin are $37,639 for men and $46,597 for women, a difference of 19.2%. Men with an educational attainment of college or associate's degree enjoy the highest average annual earnings of $51,449, while those with high school diploma education earn the least with $25,769. Women with an educational attainment of bachelor's degree earn the most with the average annual earnings of $70,694, while those with less than high school education have the smallest earnings of $44,917.
| Educational Attainment | Male Income | Female Income |
| Less than High School | $38,056 | $44,917 |
| High School Diploma | $25,769 | $0 |
| College or Associate's Degree | $51,449 | $0 |
| Bachelor's Degree | - | - |
| Graduate Degree | - | - |
| Total | $37,639 | $46,597 |
Family Income in Merlin
Family Income Brackets in Merlin
According to the Merlin family income data, there are 132 families falling into the $50,000 to $74,999 income range, which is the most common income bracket and makes up 24.3% of all families.
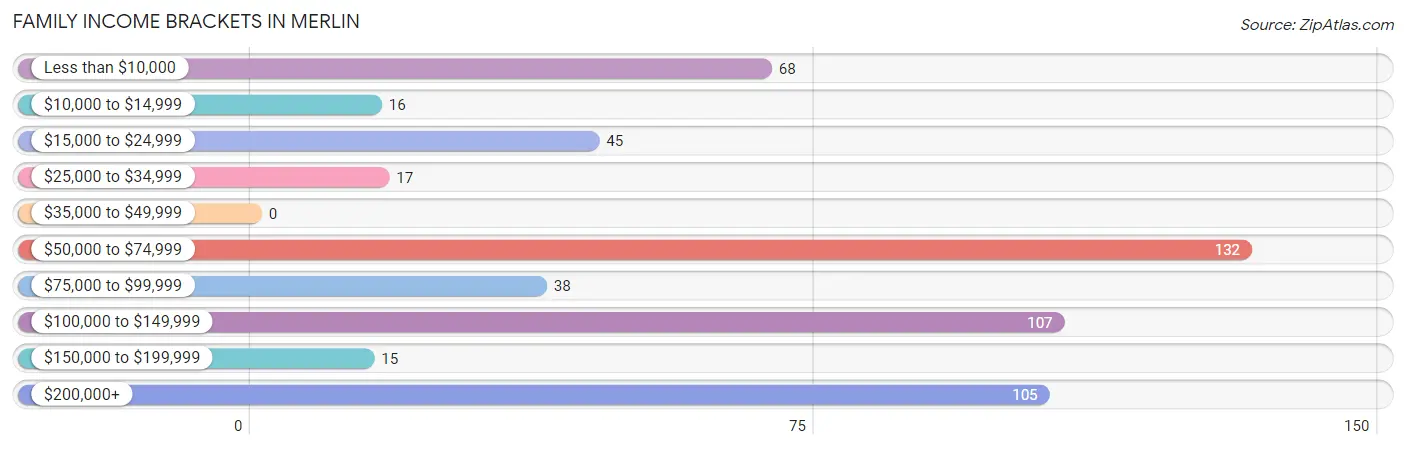
| Income Bracket | # Families | % Families |
| Less than $10,000 | 68 | 12.5% |
| $10,000 to $14,999 | 16 | 2.9% |
| $15,000 to $24,999 | 45 | 8.3% |
| $25,000 to $34,999 | 17 | 3.1% |
| $35,000 to $49,999 | 0 | 0.0% |
| $50,000 to $74,999 | 132 | 24.3% |
| $75,000 to $99,999 | 38 | 7.0% |
| $100,000 to $149,999 | 107 | 19.7% |
| $150,000 to $199,999 | 15 | 2.8% |
| $200,000+ | 105 | 19.3% |
Family Income by Famaliy Size in Merlin
3-person families (135 | 24.9%) account for the highest median family income in Merlin with $100,938 per family, while 3-person families (135 | 24.9%) have the highest median income of $33,646 per family member.
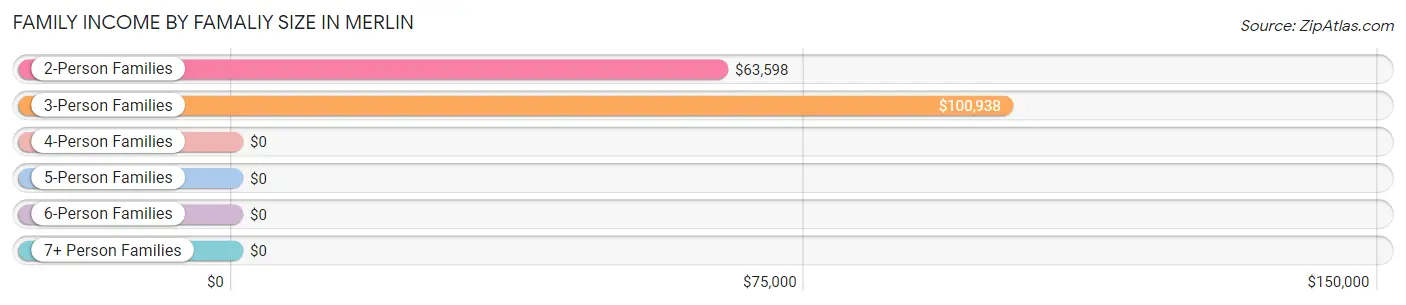
| Income Bracket | # Families | Median Income |
| 2-Person Families | 298 (54.9%) | $63,598 |
| 3-Person Families | 135 (24.9%) | $100,938 |
| 4-Person Families | 50 (9.2%) | $0 |
| 5-Person Families | 39 (7.2%) | $0 |
| 6-Person Families | 0 (0.0%) | $0 |
| 7+ Person Families | 21 (3.9%) | $0 |
| Total | 543 (100.0%) | $69,145 |
Family Income by Number of Earners in Merlin
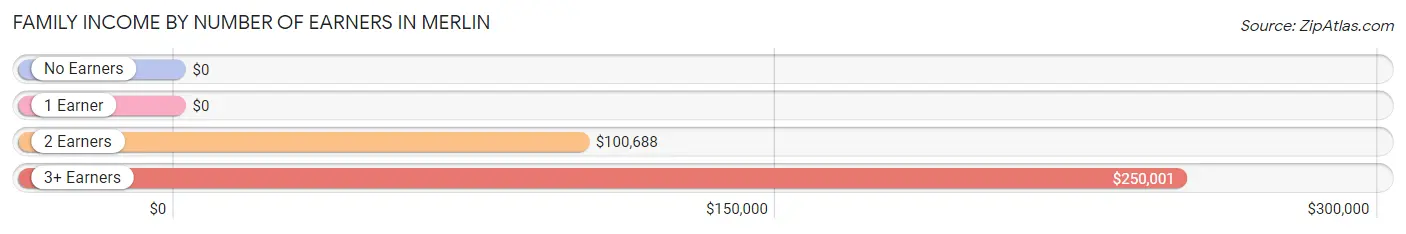
| Number of Earners | # Families | Median Income |
| No Earners | 161 (29.6%) | $0 |
| 1 Earner | 96 (17.7%) | $0 |
| 2 Earners | 221 (40.7%) | $100,688 |
| 3+ Earners | 65 (12.0%) | $250,001 |
| Total | 543 (100.0%) | $69,145 |
Household Income in Merlin
Household Income Brackets in Merlin
With 132 households falling in the category, the $50,000 to $74,999 income range is the most frequent in Merlin, accounting for 19.0% of all households. In contrast, only 15 households (2.2%) fall into the $150,000 to $199,999 income bracket, making it the least populous group.
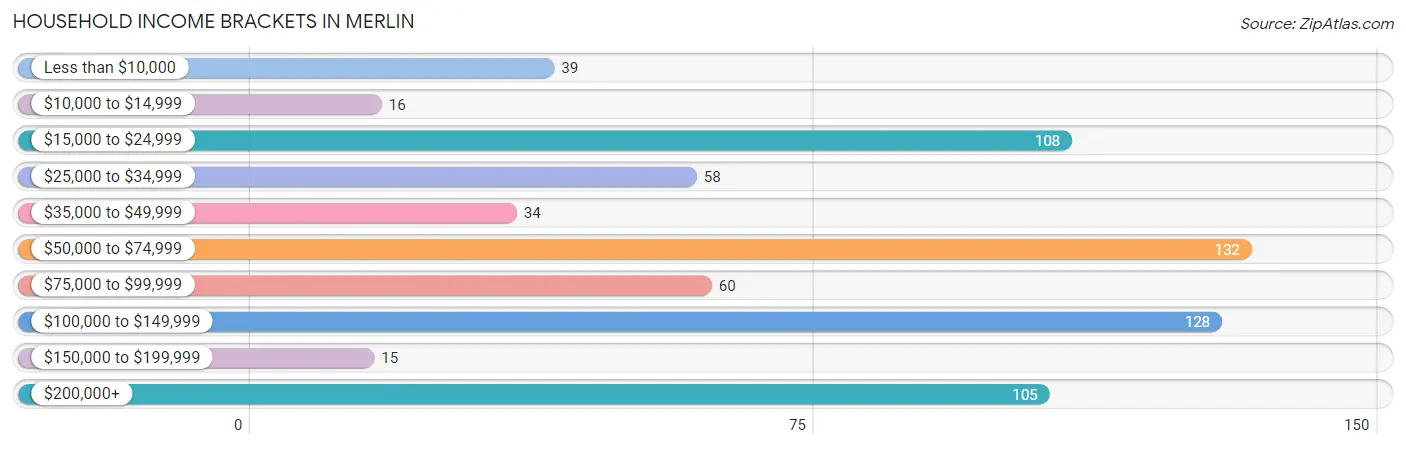
| Income Bracket | # Households | % Households |
| Less than $10,000 | 39 | 5.6% |
| $10,000 to $14,999 | 16 | 2.3% |
| $15,000 to $24,999 | 108 | 15.5% |
| $25,000 to $34,999 | 58 | 8.3% |
| $35,000 to $49,999 | 34 | 4.9% |
| $50,000 to $74,999 | 132 | 19.0% |
| $75,000 to $99,999 | 60 | 8.6% |
| $100,000 to $149,999 | 128 | 18.4% |
| $150,000 to $199,999 | 15 | 2.2% |
| $200,000+ | 105 | 15.1% |
Household Income by Householder Age in Merlin
The median household income in Merlin is $65,670, with the highest median household income of $100,125 found in the 45 to 64 years age bracket for the primary householder. A total of 342 households (49.2%) fall into this category.
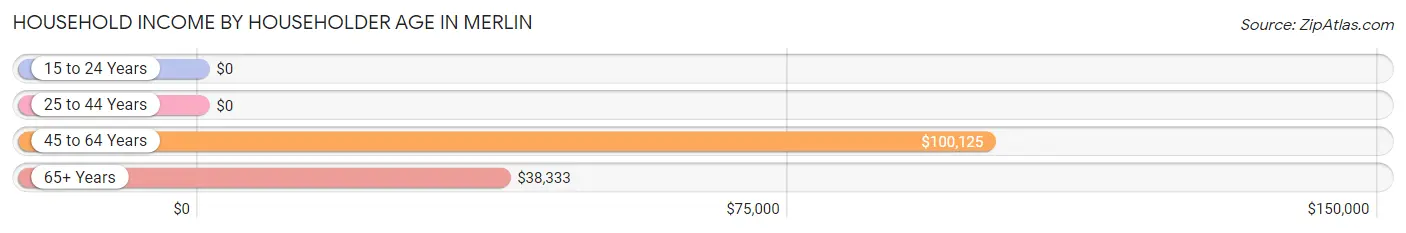
| Income Bracket | # Households | Median Income |
| 15 to 24 Years | 0 (0.0%) | $0 |
| 25 to 44 Years | 161 (23.2%) | $0 |
| 45 to 64 Years | 342 (49.2%) | $100,125 |
| 65+ Years | 192 (27.6%) | $38,333 |
| Total | 695 (100.0%) | $65,670 |
Poverty in Merlin
Income Below Poverty by Sex and Age in Merlin
With 21.6% poverty level for males and 13.0% for females among the residents of Merlin, 25 to 34 year old males and 12 to 14 year old females are the most vulnerable to poverty, with 45 males (63.4%) and 21 females (100.0%) in their respective age groups living below the poverty level.
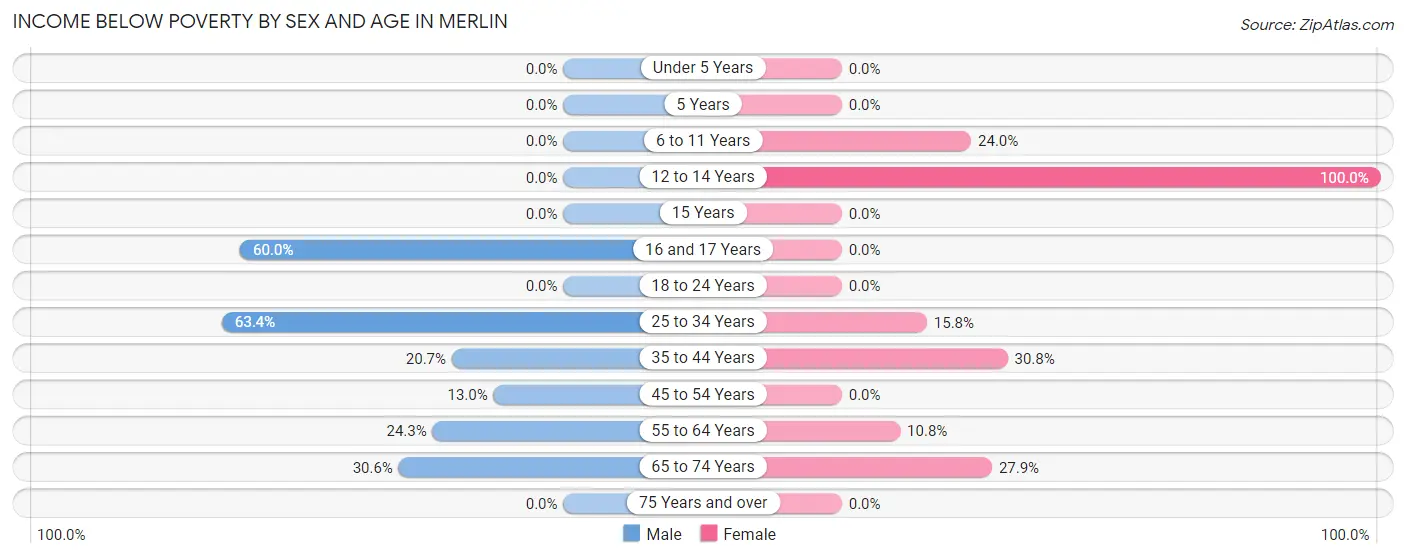
| Age Bracket | Male | Female |
| Under 5 Years | 0 (0.0%) | 0 (0.0%) |
| 5 Years | 0 (0.0%) | 0 (0.0%) |
| 6 to 11 Years | 0 (0.0%) | 24 (24.0%) |
| 12 to 14 Years | 0 (0.0%) | 21 (100.0%) |
| 15 Years | 0 (0.0%) | 0 (0.0%) |
| 16 and 17 Years | 15 (60.0%) | 0 (0.0%) |
| 18 to 24 Years | 0 (0.0%) | 0 (0.0%) |
| 25 to 34 Years | 45 (63.4%) | 27 (15.8%) |
| 35 to 44 Years | 18 (20.7%) | 16 (30.8%) |
| 45 to 54 Years | 18 (13.0%) | 0 (0.0%) |
| 55 to 64 Years | 59 (24.3%) | 17 (10.8%) |
| 65 to 74 Years | 33 (30.6%) | 17 (27.9%) |
| 75 Years and over | 0 (0.0%) | 0 (0.0%) |
| Total | 188 (21.6%) | 122 (13.0%) |
Income Above Poverty by Sex and Age in Merlin
According to the poverty statistics in Merlin, males aged 5 years and females aged under 5 years are the age groups that are most secure financially, with 100.0% of males and 100.0% of females in these age groups living above the poverty line.
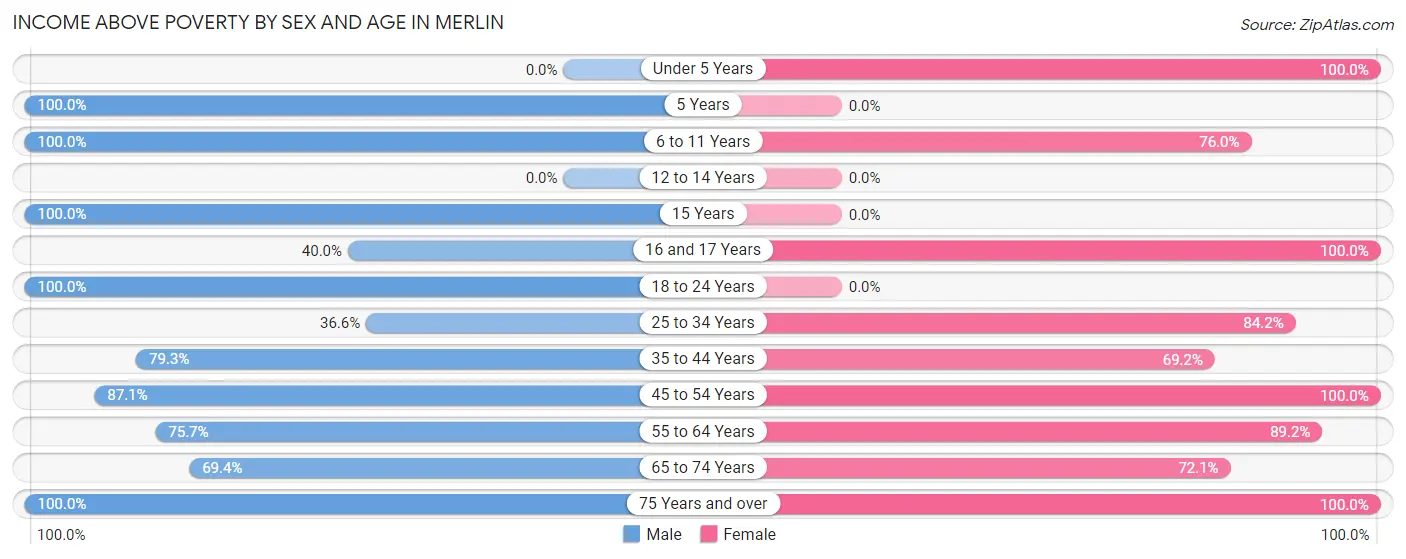
| Age Bracket | Male | Female |
| Under 5 Years | 0 (0.0%) | 17 (100.0%) |
| 5 Years | 26 (100.0%) | 0 (0.0%) |
| 6 to 11 Years | 35 (100.0%) | 76 (76.0%) |
| 12 to 14 Years | 0 (0.0%) | 0 (0.0%) |
| 15 Years | 10 (100.0%) | 0 (0.0%) |
| 16 and 17 Years | 10 (40.0%) | 78 (100.0%) |
| 18 to 24 Years | 25 (100.0%) | 0 (0.0%) |
| 25 to 34 Years | 26 (36.6%) | 144 (84.2%) |
| 35 to 44 Years | 69 (79.3%) | 36 (69.2%) |
| 45 to 54 Years | 121 (87.1%) | 172 (100.0%) |
| 55 to 64 Years | 184 (75.7%) | 140 (89.2%) |
| 65 to 74 Years | 75 (69.4%) | 44 (72.1%) |
| 75 Years and over | 103 (100.0%) | 113 (100.0%) |
| Total | 684 (78.4%) | 820 (87.1%) |
Income Below Poverty Among Married-Couple Families in Merlin
The poverty statistics for married-couple families in Merlin show that 13.4% or 61 of the total 456 families live below the poverty line. Families with 1 or 2 children have the highest poverty rate of 25.6%, comprising of 45 families. On the other hand, families with 3 or 4 children have the lowest poverty rate of 0.0%, which includes 0 families.
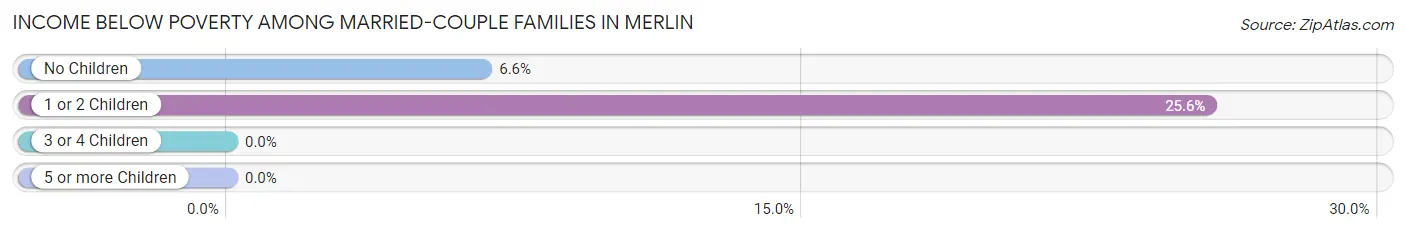
| Children | Above Poverty | Below Poverty |
| No Children | 225 (93.4%) | 16 (6.6%) |
| 1 or 2 Children | 131 (74.4%) | 45 (25.6%) |
| 3 or 4 Children | 39 (100.0%) | 0 (0.0%) |
| 5 or more Children | 0 (0.0%) | 0 (0.0%) |
| Total | 395 (86.6%) | 61 (13.4%) |
Income Below Poverty Among Single-Parent Households in Merlin
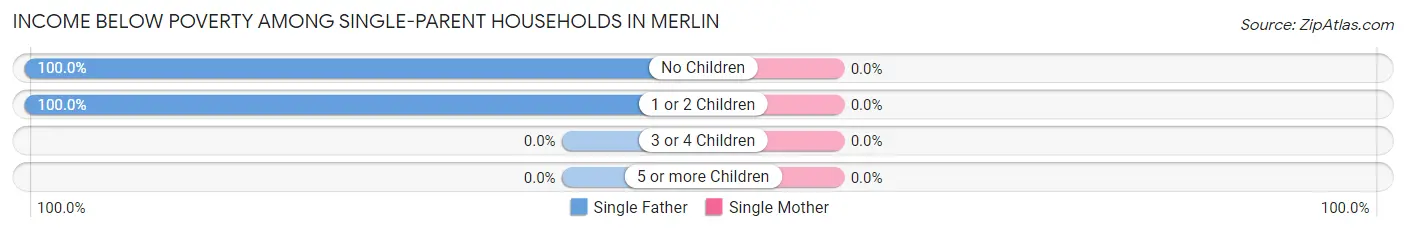
| Children | Single Father | Single Mother |
| No Children | 45 (100.0%) | 0 (0.0%) |
| 1 or 2 Children | 23 (100.0%) | 0 (0.0%) |
| 3 or 4 Children | 0 (0.0%) | 0 (0.0%) |
| 5 or more Children | 0 (0.0%) | 0 (0.0%) |
| Total | 68 (100.0%) | 0 (0.0%) |
Income Below Poverty Among Married-Couple vs Single-Parent Households in Merlin
The poverty data for Merlin shows that 61 of the married-couple family households (13.4%) and 68 of the single-parent households (78.2%) are living below the poverty level. Within the married-couple family households, those with 1 or 2 children have the highest poverty rate, with 45 households (25.6%) falling below the poverty line. Among the single-parent households, those with 1 or 2 children have the highest poverty rate, with 23 household (100.0%) living below poverty.
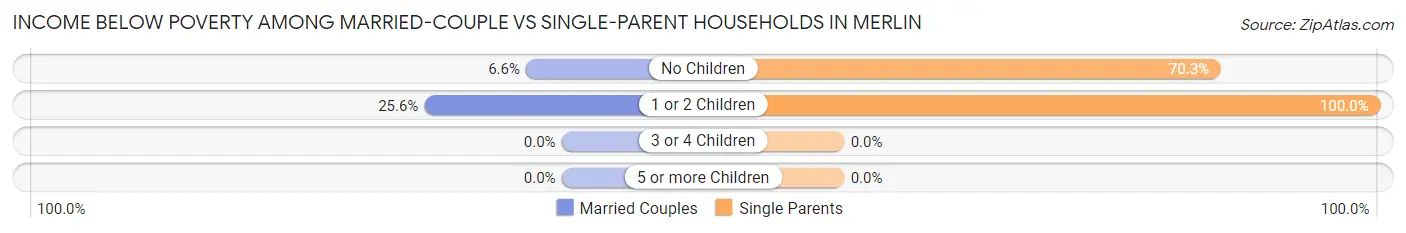
| Children | Married-Couple Families | Single-Parent Households |
| No Children | 16 (6.6%) | 45 (70.3%) |
| 1 or 2 Children | 45 (25.6%) | 23 (100.0%) |
| 3 or 4 Children | 0 (0.0%) | 0 (0.0%) |
| 5 or more Children | 0 (0.0%) | 0 (0.0%) |
| Total | 61 (13.4%) | 68 (78.2%) |
Race in Merlin
The most populous races in Merlin are White / Caucasian (1,526 | 84.1%), Two or more Races (222 | 12.2%), and Asian (56 | 3.1%).
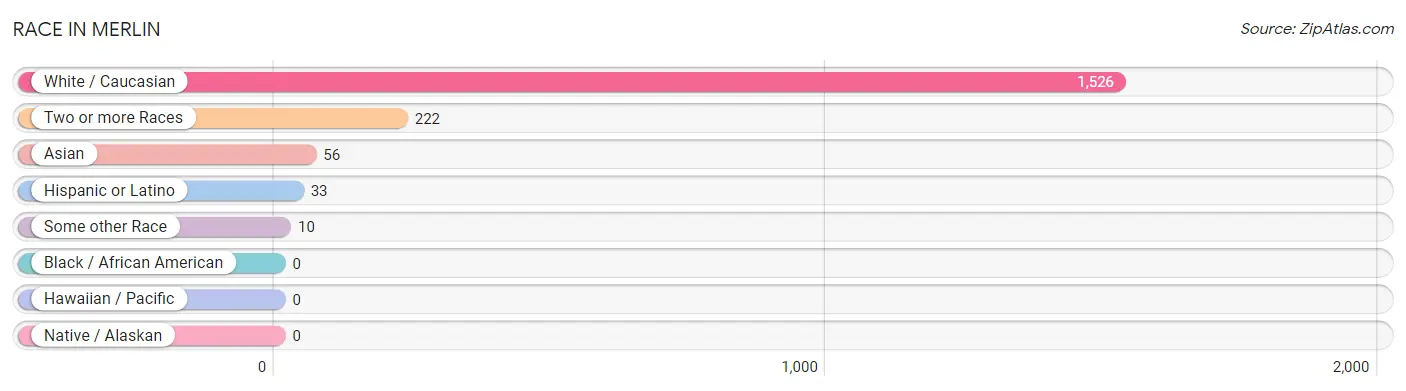
| Race | # Population | % Population |
| Asian | 56 | 3.1% |
| Black / African American | 0 | 0.0% |
| Hawaiian / Pacific | 0 | 0.0% |
| Hispanic or Latino | 33 | 1.8% |
| Native / Alaskan | 0 | 0.0% |
| White / Caucasian | 1,526 | 84.1% |
| Two or more Races | 222 | 12.2% |
| Some other Race | 10 | 0.5% |
| Total | 1,814 | 100.0% |
Ancestry in Merlin
The most populous ancestries reported in Merlin are German (215 | 11.8%), Irish (158 | 8.7%), English (152 | 8.4%), Scottish (120 | 6.6%), and Norwegian (82 | 4.5%), together accounting for 40.1% of all Merlin residents.
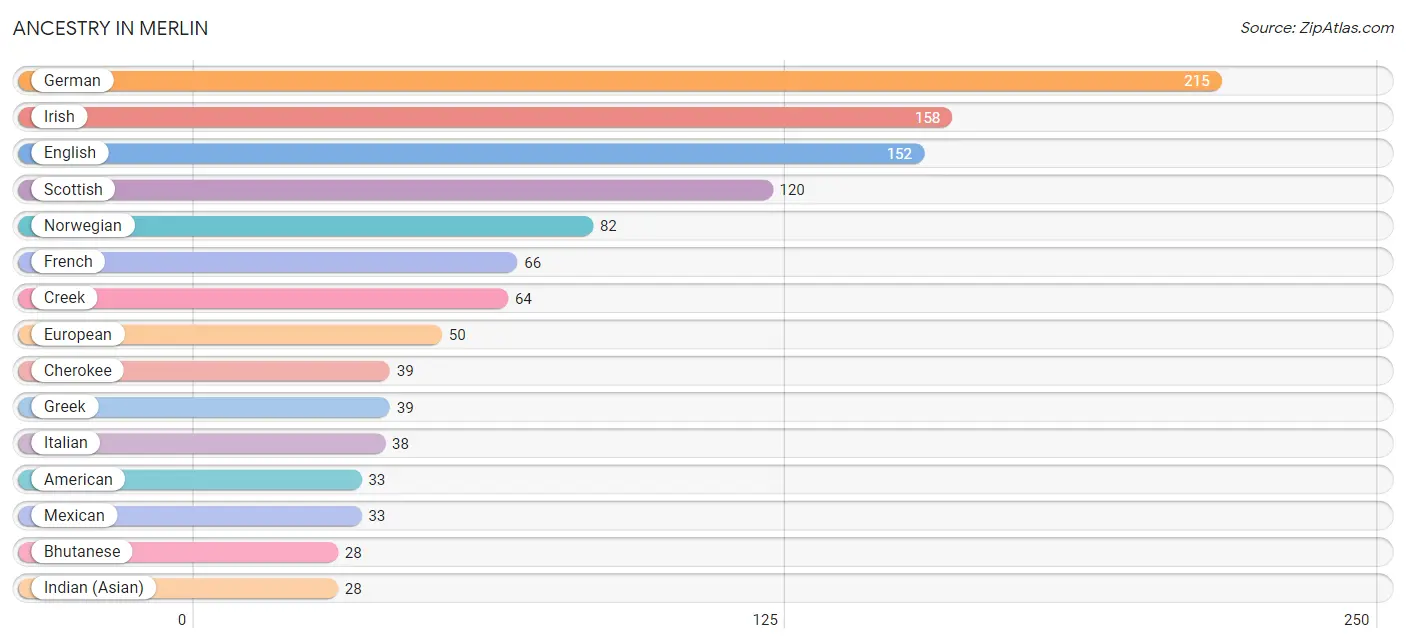
| Ancestry | # Population | % Population |
| American | 33 | 1.8% |
| Bhutanese | 28 | 1.5% |
| British | 19 | 1.1% |
| Cherokee | 39 | 2.1% |
| Choctaw | 27 | 1.5% |
| Creek | 64 | 3.5% |
| Eastern European | 18 | 1.0% |
| English | 152 | 8.4% |
| European | 50 | 2.8% |
| French | 66 | 3.6% |
| German | 215 | 11.8% |
| Greek | 39 | 2.1% |
| Indian (Asian) | 28 | 1.5% |
| Irish | 158 | 8.7% |
| Italian | 38 | 2.1% |
| Mexican | 33 | 1.8% |
| Northern European | 19 | 1.1% |
| Norwegian | 82 | 4.5% |
| Scotch-Irish | 22 | 1.2% |
| Scottish | 120 | 6.6% | View All 20 Rows |
Immigrants in Merlin
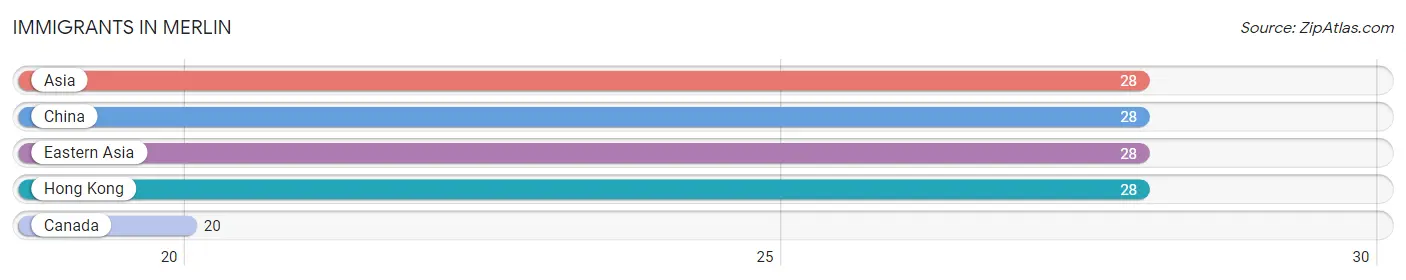
The most numerous immigrant groups reported in Merlin came from Asia (28 | 1.5%), China (28 | 1.5%), Eastern Asia (28 | 1.5%), Hong Kong (28 | 1.5%), and Canada (20 | 1.1%), together accounting for 7.3% of all Merlin residents.
| Immigration Origin | # Population | % Population |
| Asia | 28 | 1.5% |
| Canada | 20 | 1.1% |
| China | 28 | 1.5% |
| Eastern Asia | 28 | 1.5% |
| Hong Kong | 28 | 1.5% | View All 5 Rows |
Sex and Age in Merlin
Sex and Age in Merlin
The most populous age groups in Merlin are 55 to 59 Years (153 | 17.5%) for men and 30 to 34 Years (147 | 15.6%) for women.
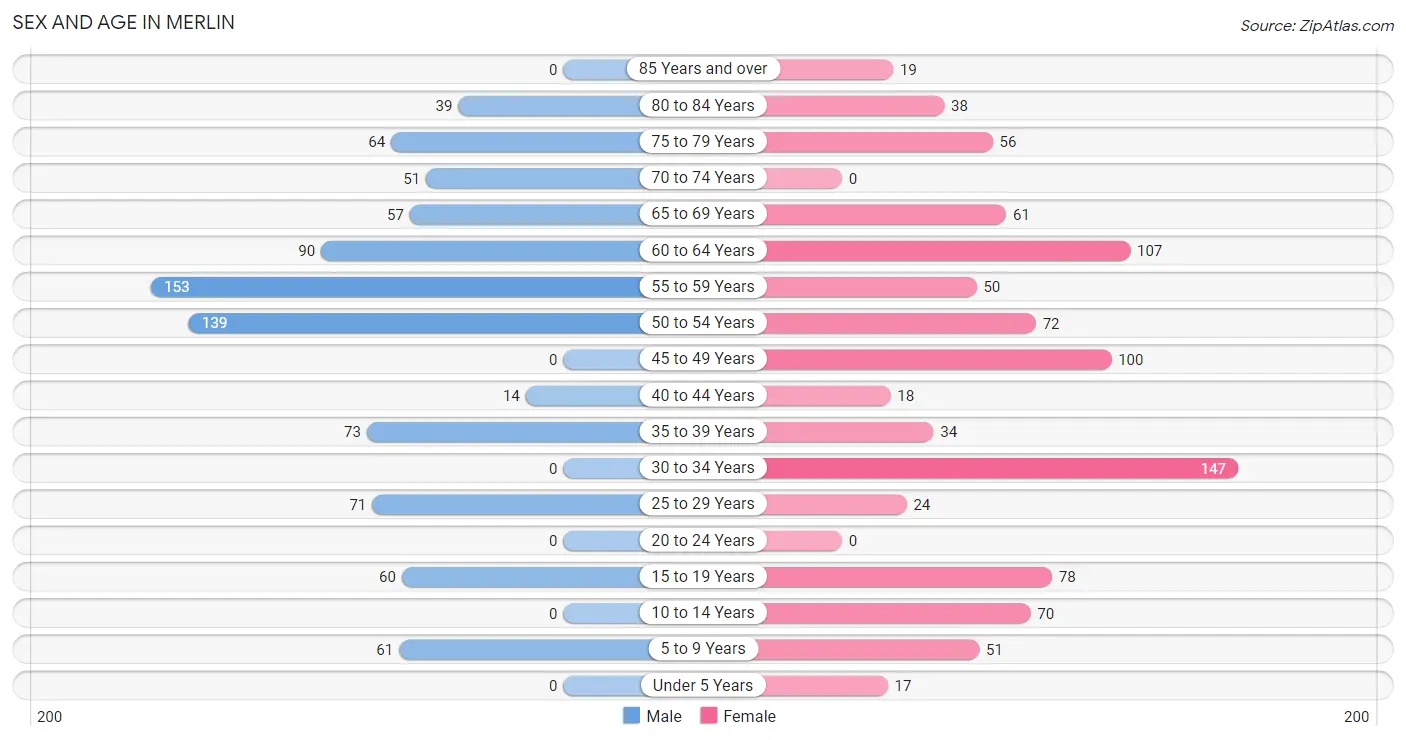
| Age Bracket | Male | Female |
| Under 5 Years | 0 (0.0%) | 17 (1.8%) |
| 5 to 9 Years | 61 (7.0%) | 51 (5.4%) |
| 10 to 14 Years | 0 (0.0%) | 70 (7.4%) |
| 15 to 19 Years | 60 (6.9%) | 78 (8.3%) |
| 20 to 24 Years | 0 (0.0%) | 0 (0.0%) |
| 25 to 29 Years | 71 (8.1%) | 24 (2.5%) |
| 30 to 34 Years | 0 (0.0%) | 147 (15.6%) |
| 35 to 39 Years | 73 (8.4%) | 34 (3.6%) |
| 40 to 44 Years | 14 (1.6%) | 18 (1.9%) |
| 45 to 49 Years | 0 (0.0%) | 100 (10.6%) |
| 50 to 54 Years | 139 (15.9%) | 72 (7.6%) |
| 55 to 59 Years | 153 (17.5%) | 50 (5.3%) |
| 60 to 64 Years | 90 (10.3%) | 107 (11.4%) |
| 65 to 69 Years | 57 (6.5%) | 61 (6.5%) |
| 70 to 74 Years | 51 (5.9%) | 0 (0.0%) |
| 75 to 79 Years | 64 (7.3%) | 56 (5.9%) |
| 80 to 84 Years | 39 (4.5%) | 38 (4.0%) |
| 85 Years and over | 0 (0.0%) | 19 (2.0%) |
| Total | 872 (100.0%) | 942 (100.0%) |
Families and Households in Merlin
Median Family Size in Merlin
The median family size in Merlin is 2.88 persons per family, with married-couple families (456 | 84.0%) accounting for the largest median family size of 3.06 persons per family. On the other hand, single male/father families (68 | 12.5%) represent the smallest median family size with 1.88 persons per family.
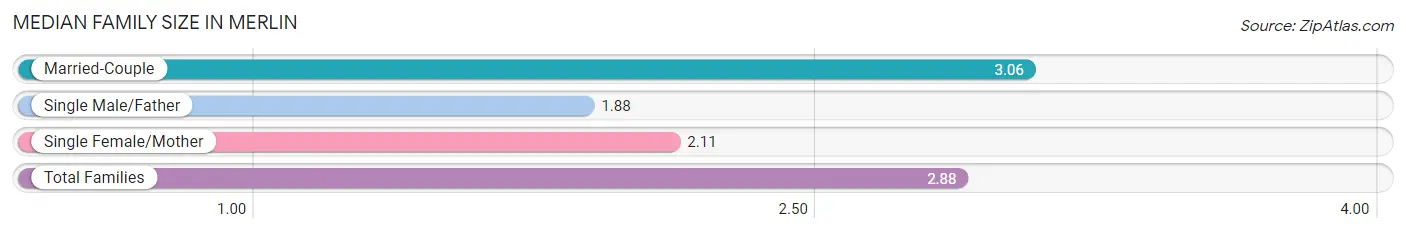
| Family Type | # Families | Family Size |
| Married-Couple | 456 (84.0%) | 3.06 |
| Single Male/Father | 68 (12.5%) | 1.88 |
| Single Female/Mother | 19 (3.5%) | 2.11 |
| Total Families | 543 (100.0%) | 2.88 |
Median Household Size in Merlin
The median household size in Merlin is 2.61 persons per household, with married-couple households (456 | 65.6%) accounting for the largest median household size of 3.06 persons per household. non-family households (152 | 21.9%) represent the smallest median household size with 1.44 persons per household.
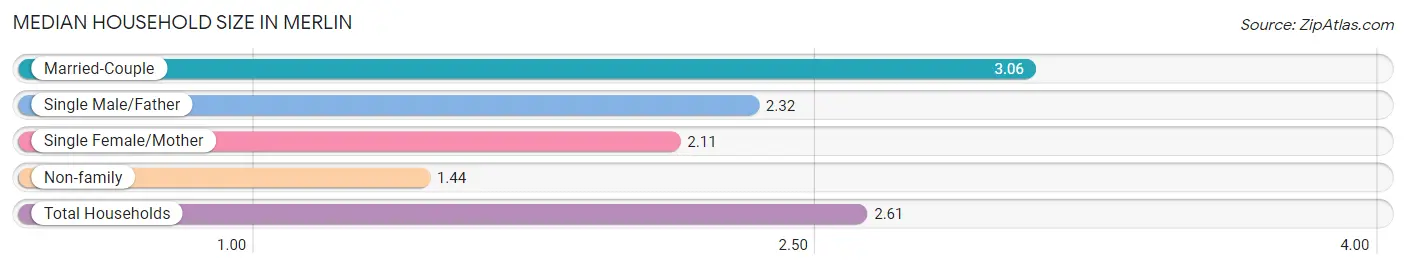
| Household Type | # Households | Household Size |
| Married-Couple | 456 (65.6%) | 3.06 |
| Single Male/Father | 68 (9.8%) | 2.32 |
| Single Female/Mother | 19 (2.7%) | 2.11 |
| Non-family | 152 (21.9%) | 1.44 |
| Total Households | 695 (100.0%) | 2.61 |
Household Size by Marriage Status in Merlin
Out of a total of 695 households in Merlin, 543 (78.1%) are family households, while 152 (21.9%) are nonfamily households. The most numerous type of family households are 2-person households, comprising 253, and the most common type of nonfamily households are 1-person households, comprising 113.
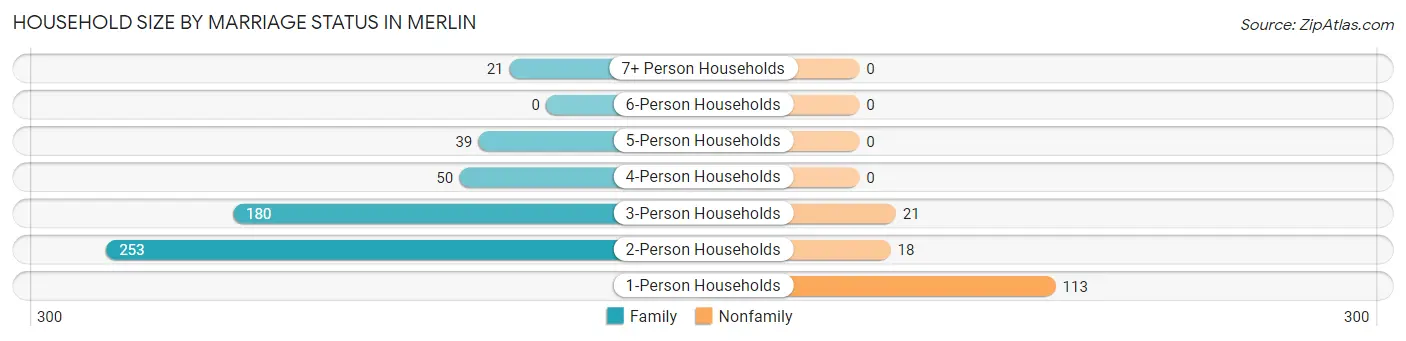
| Household Size | Family Households | Nonfamily Households |
| 1-Person Households | - | 113 (16.3%) |
| 2-Person Households | 253 (36.4%) | 18 (2.6%) |
| 3-Person Households | 180 (25.9%) | 21 (3.0%) |
| 4-Person Households | 50 (7.2%) | 0 (0.0%) |
| 5-Person Households | 39 (5.6%) | 0 (0.0%) |
| 6-Person Households | 0 (0.0%) | 0 (0.0%) |
| 7+ Person Households | 21 (3.0%) | 0 (0.0%) |
| Total | 543 (78.1%) | 152 (21.9%) |
Female Fertility in Merlin
Fertility by Age in Merlin
| Age Bracket | Women with Births | Births / 1,000 Women |
| 15 to 19 years | 0 (0.0%) | 0.0 |
| 20 to 34 years | 0 (0.0%) | 0.0 |
| 35 to 50 years | 0 (0.0%) | 0.0 |
| Total | 0 (0.0%) | 0.0 |
Fertility by Age by Marriage Status in Merlin
| Age Bracket | Married | Unmarried |
| 15 to 19 years | 0 (0.0%) | 0 (0.0%) |
| 20 to 34 years | 0 (0.0%) | 0 (0.0%) |
| 35 to 50 years | 0 (0.0%) | 0 (0.0%) |
| Total | 0 (0.0%) | 0 (0.0%) |
Fertility by Education in Merlin
| Educational Attainment | Women with Births | Births / 1,000 Women |
| Less than High School | 0 (0.0%) | 0.0 |
| High School Diploma | 0 (0.0%) | 0.0 |
| College or Associate's Degree | 0 (0.0%) | 0.0 |
| Bachelor's Degree | 0 (0.0%) | 0.0 |
| Graduate Degree | 0 (0.0%) | 0.0 |
| Total | 0 (0.0%) | 0.0 |
Fertility by Education by Marriage Status in Merlin
| Educational Attainment | Married | Unmarried |
| Less than High School | 0 (0.0%) | 0 (0.0%) |
| High School Diploma | 0 (0.0%) | 0 (0.0%) |
| College or Associate's Degree | 0 (0.0%) | 0 (0.0%) |
| Bachelor's Degree | 0 (0.0%) | 0 (0.0%) |
| Graduate Degree | 0 (0.0%) | 0 (0.0%) |
| Total | 0 (0.0%) | 0 (0.0%) |
Employment Characteristics in Merlin
Employment by Class of Employer in Merlin
Among the 782 employed individuals in Merlin, private company employees (578 | 73.9%), self-employed (incorporated) (71 | 9.1%), and local government employees (45 | 5.8%) make up the most common classes of employment.
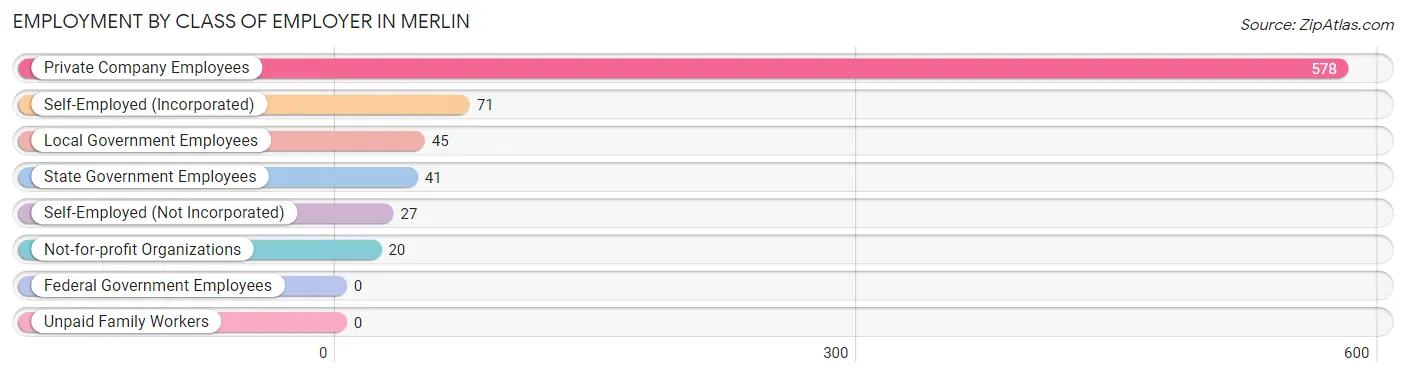
| Employer Class | # Employees | % Employees |
| Private Company Employees | 578 | 73.9% |
| Self-Employed (Incorporated) | 71 | 9.1% |
| Self-Employed (Not Incorporated) | 27 | 3.5% |
| Not-for-profit Organizations | 20 | 2.6% |
| Local Government Employees | 45 | 5.8% |
| State Government Employees | 41 | 5.2% |
| Federal Government Employees | 0 | 0.0% |
| Unpaid Family Workers | 0 | 0.0% |
| Total | 782 | 100.0% |
Employment Status by Age in Merlin
According to the labor force statistics for Merlin, out of the total population over 16 years of age (1,605), 55.6% or 892 individuals are in the labor force, with 10.9% or 97 of them unemployed. The age group with the highest labor force participation rate is 45 to 54 years, with 94.2% or 293 individuals in the labor force. Within the labor force, the 30 to 34 years age range has the highest percentage of unemployed individuals, with 65.3% or 62 of them being unemployed.
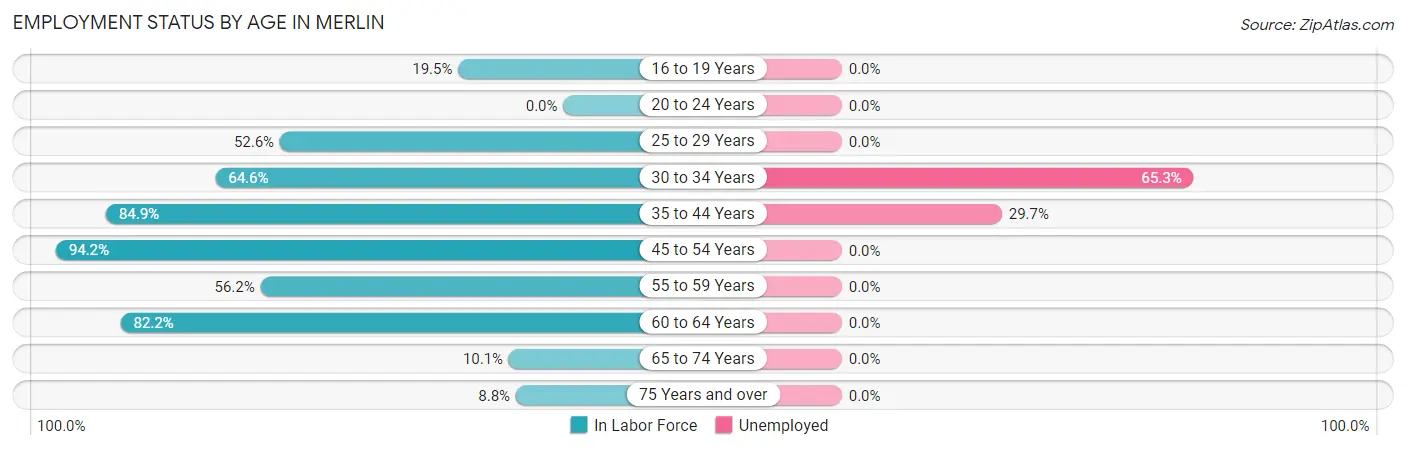
| Age Bracket | In Labor Force | Unemployed |
| 16 to 19 Years | 25 (19.5%) | 0 (0.0%) |
| 20 to 24 Years | 0 (0.0%) | 0 (0.0%) |
| 25 to 29 Years | 50 (52.6%) | 0 (0.0%) |
| 30 to 34 Years | 95 (64.6%) | 62 (65.3%) |
| 35 to 44 Years | 118 (84.9%) | 35 (29.7%) |
| 45 to 54 Years | 293 (94.2%) | 0 (0.0%) |
| 55 to 59 Years | 114 (56.2%) | 0 (0.0%) |
| 60 to 64 Years | 162 (82.2%) | 0 (0.0%) |
| 65 to 74 Years | 17 (10.1%) | 0 (0.0%) |
| 75 Years and over | 19 (8.8%) | 0 (0.0%) |
| Total | 892 (55.6%) | 97 (10.9%) |
Employment Status by Educational Attainment in Merlin
According to labor force statistics for Merlin, 76.2% of individuals (832) out of the total population between 25 and 64 years of age (1,092) are in the labor force, with 11.7% or 97 of them being unemployed. The group with the highest labor force participation rate are those with the educational attainment of bachelor's degree or higher, with 100.0% or 196 individuals in the labor force. Within the labor force, individuals with college / associate degree education have the highest percentage of unemployment, with 26.2% or 64 of them being unemployed.
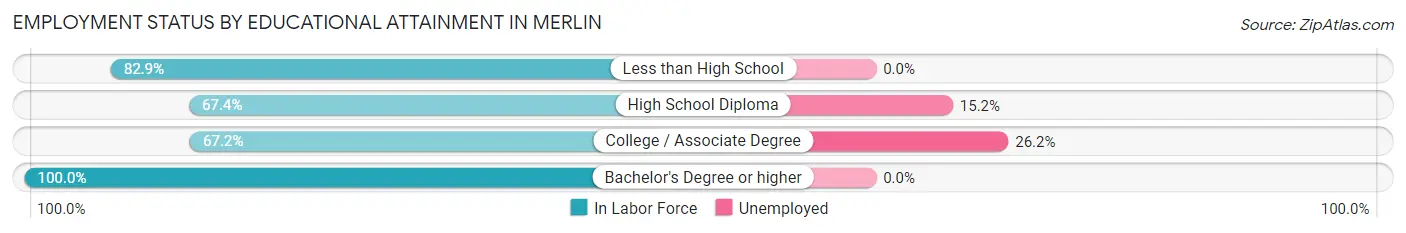
| Educational Attainment | In Labor Force | Unemployed |
| Less than High School | 175 (82.9%) | 0 (0.0%) |
| High School Diploma | 217 (67.4%) | 49 (15.2%) |
| College / Associate Degree | 244 (67.2%) | 95 (26.2%) |
| Bachelor's Degree or higher | 196 (100.0%) | 0 (0.0%) |
| Total | 832 (76.2%) | 128 (11.7%) |
Employment Occupations by Sex in Merlin
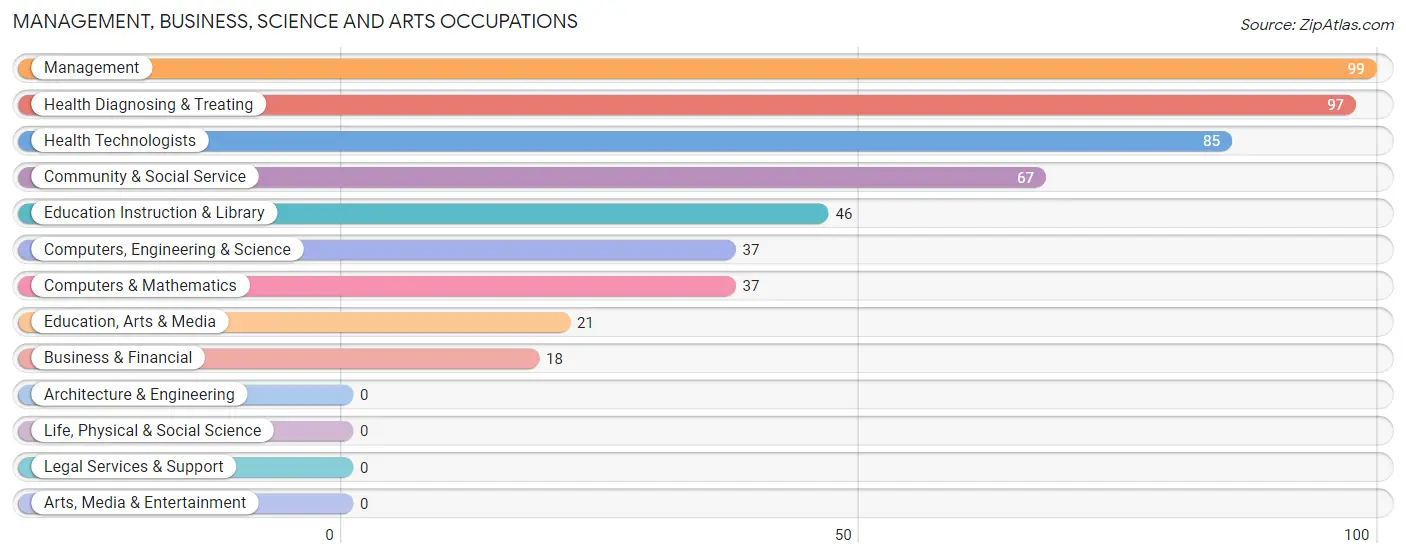
Management, Business, Science and Arts Occupations
The most common Management, Business, Science and Arts occupations in Merlin are Management (99 | 12.4%), Health Diagnosing & Treating (97 | 12.2%), Health Technologists (85 | 10.7%), Community & Social Service (67 | 8.4%), and Education Instruction & Library (46 | 5.8%).
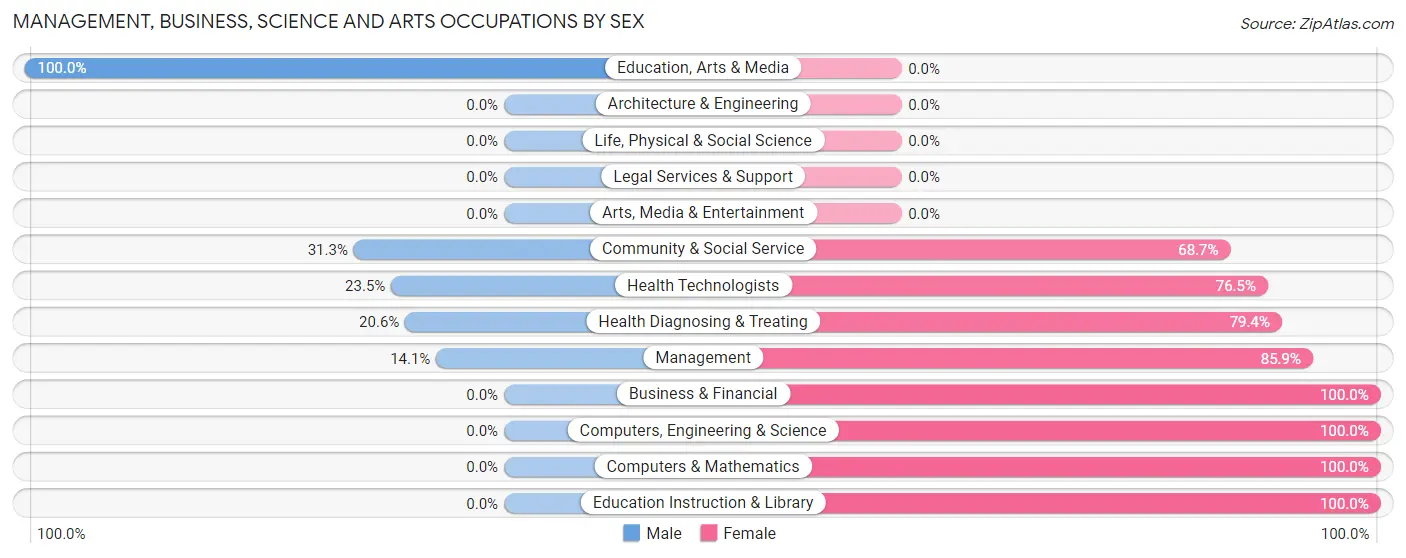
Management, Business, Science and Arts Occupations by Sex
Within the Management, Business, Science and Arts occupations in Merlin, the most male-oriented occupations are Education, Arts & Media (100.0%), Community & Social Service (31.3%), and Health Technologists (23.5%), while the most female-oriented occupations are Business & Financial (100.0%), Computers, Engineering & Science (100.0%), and Computers & Mathematics (100.0%).
| Occupation | Male | Female |
| Management | 14 (14.1%) | 85 (85.9%) |
| Business & Financial | 0 (0.0%) | 18 (100.0%) |
| Computers, Engineering & Science | 0 (0.0%) | 37 (100.0%) |
| Computers & Mathematics | 0 (0.0%) | 37 (100.0%) |
| Architecture & Engineering | 0 (0.0%) | 0 (0.0%) |
| Life, Physical & Social Science | 0 (0.0%) | 0 (0.0%) |
| Community & Social Service | 21 (31.3%) | 46 (68.7%) |
| Education, Arts & Media | 21 (100.0%) | 0 (0.0%) |
| Legal Services & Support | 0 (0.0%) | 0 (0.0%) |
| Education Instruction & Library | 0 (0.0%) | 46 (100.0%) |
| Arts, Media & Entertainment | 0 (0.0%) | 0 (0.0%) |
| Health Diagnosing & Treating | 20 (20.6%) | 77 (79.4%) |
| Health Technologists | 20 (23.5%) | 65 (76.5%) |
| Total (Category) | 55 (17.3%) | 263 (82.7%) |
| Total (Overall) | 394 (49.5%) | 402 (50.5%) |
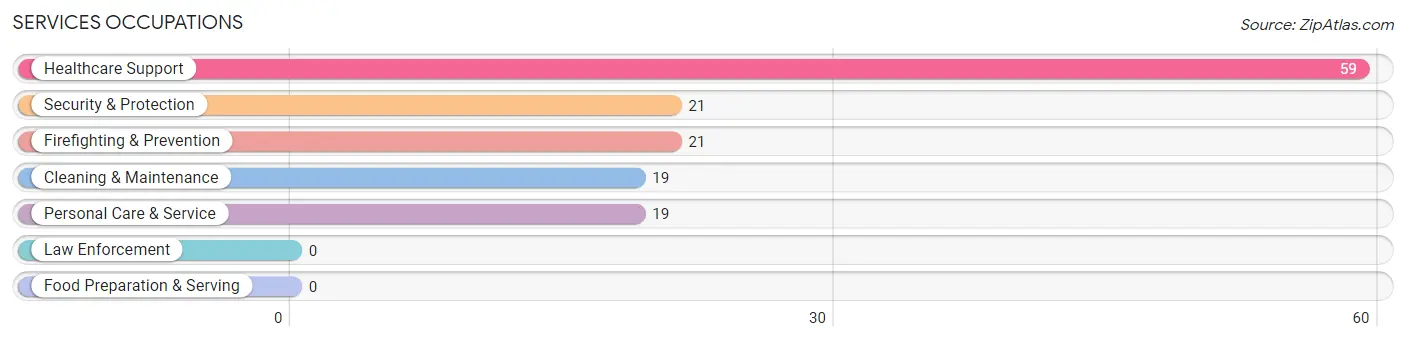
Services Occupations
The most common Services occupations in Merlin are Healthcare Support (59 | 7.4%), Security & Protection (21 | 2.6%), Firefighting & Prevention (21 | 2.6%), Cleaning & Maintenance (19 | 2.4%), and Personal Care & Service (19 | 2.4%).
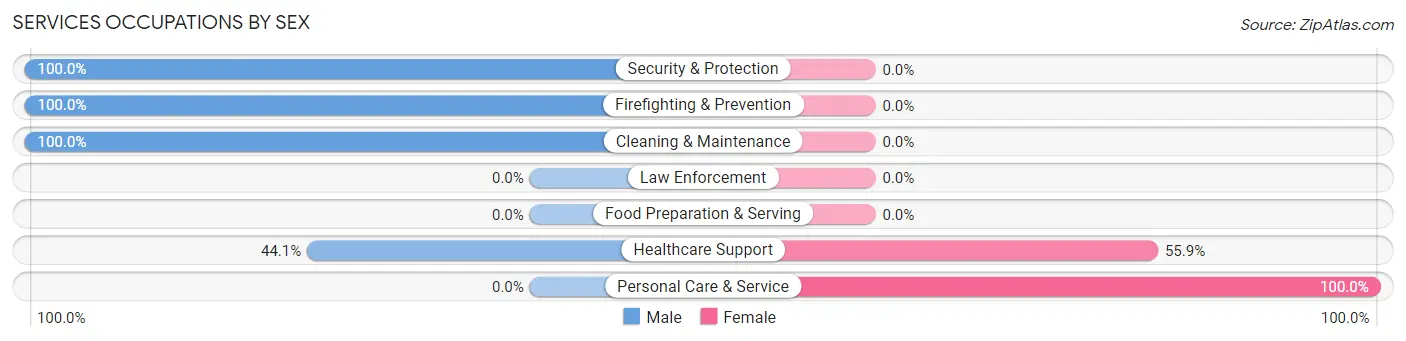
Services Occupations by Sex
Within the Services occupations in Merlin, the most male-oriented occupations are Security & Protection (100.0%), Firefighting & Prevention (100.0%), and Cleaning & Maintenance (100.0%), while the most female-oriented occupations are Personal Care & Service (100.0%), and Healthcare Support (55.9%).
| Occupation | Male | Female |
| Healthcare Support | 26 (44.1%) | 33 (55.9%) |
| Security & Protection | 21 (100.0%) | 0 (0.0%) |
| Firefighting & Prevention | 21 (100.0%) | 0 (0.0%) |
| Law Enforcement | 0 (0.0%) | 0 (0.0%) |
| Food Preparation & Serving | 0 (0.0%) | 0 (0.0%) |
| Cleaning & Maintenance | 19 (100.0%) | 0 (0.0%) |
| Personal Care & Service | 0 (0.0%) | 19 (100.0%) |
| Total (Category) | 66 (55.9%) | 52 (44.1%) |
| Total (Overall) | 394 (49.5%) | 402 (50.5%) |
Sales and Office Occupations
The most common Sales and Office occupations in Merlin are Office & Administration (87 | 10.9%), and Sales & Related (57 | 7.2%).
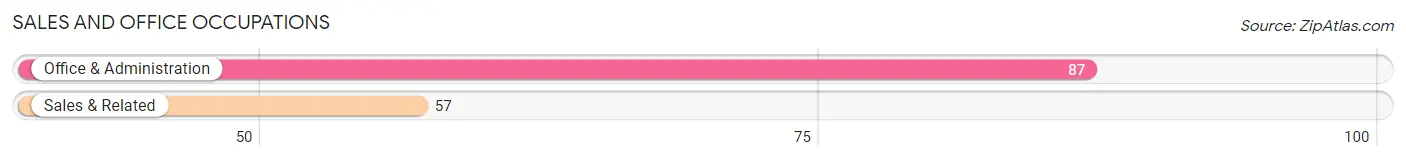
Sales and Office Occupations by Sex
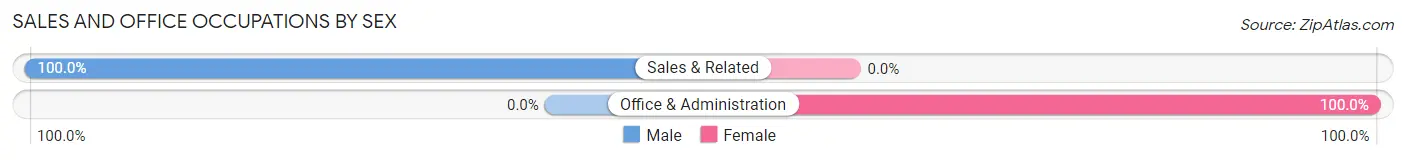
| Occupation | Male | Female |
| Sales & Related | 57 (100.0%) | 0 (0.0%) |
| Office & Administration | 0 (0.0%) | 87 (100.0%) |
| Total (Category) | 57 (39.6%) | 87 (60.4%) |
| Total (Overall) | 394 (49.5%) | 402 (50.5%) |
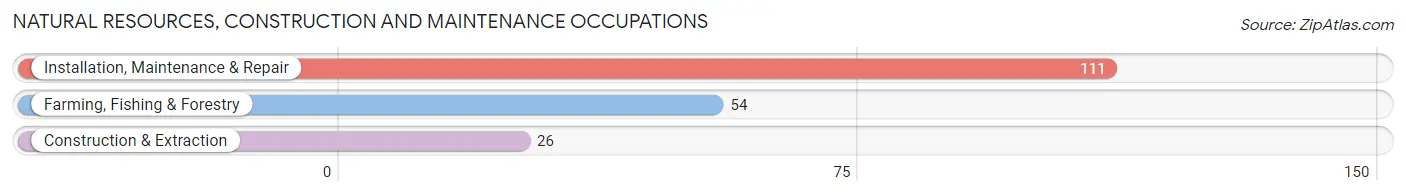
Natural Resources, Construction and Maintenance Occupations
The most common Natural Resources, Construction and Maintenance occupations in Merlin are Installation, Maintenance & Repair (111 | 13.9%), Farming, Fishing & Forestry (54 | 6.8%), and Construction & Extraction (26 | 3.3%).
Natural Resources, Construction and Maintenance Occupations by Sex
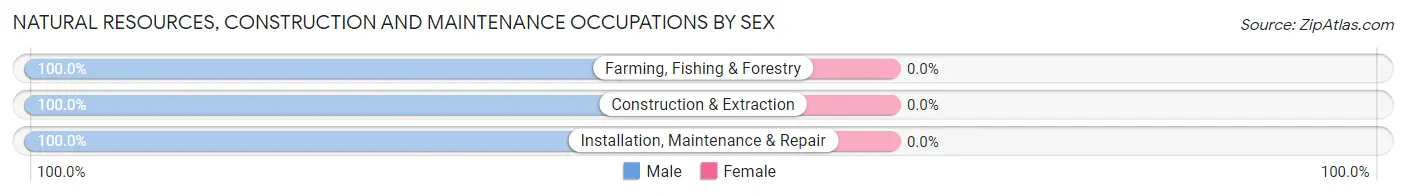
| Occupation | Male | Female |
| Farming, Fishing & Forestry | 54 (100.0%) | 0 (0.0%) |
| Construction & Extraction | 26 (100.0%) | 0 (0.0%) |
| Installation, Maintenance & Repair | 111 (100.0%) | 0 (0.0%) |
| Total (Category) | 191 (100.0%) | 0 (0.0%) |
| Total (Overall) | 394 (49.5%) | 402 (50.5%) |
Production, Transportation and Moving Occupations
The most common Production, Transportation and Moving occupations in Merlin are , and Material Moving (25 | 3.1%).
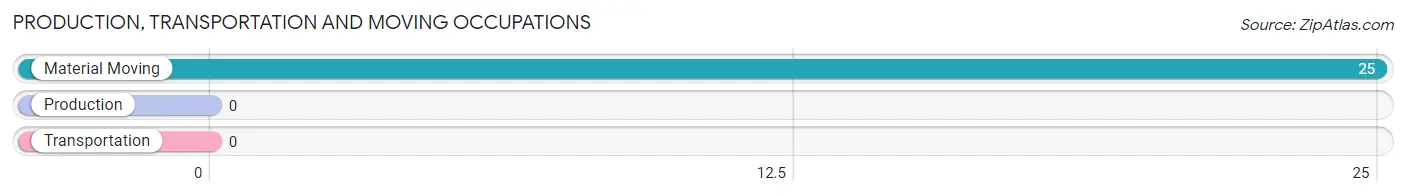
Production, Transportation and Moving Occupations by Sex
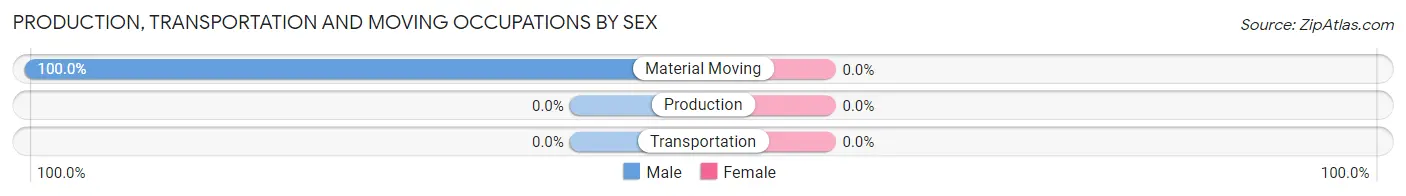
| Occupation | Male | Female |
| Production | 0 (0.0%) | 0 (0.0%) |
| Transportation | 0 (0.0%) | 0 (0.0%) |
| Material Moving | 25 (100.0%) | 0 (0.0%) |
| Total (Category) | 25 (100.0%) | 0 (0.0%) |
| Total (Overall) | 394 (49.5%) | 402 (50.5%) |
Employment Industries by Sex in Merlin
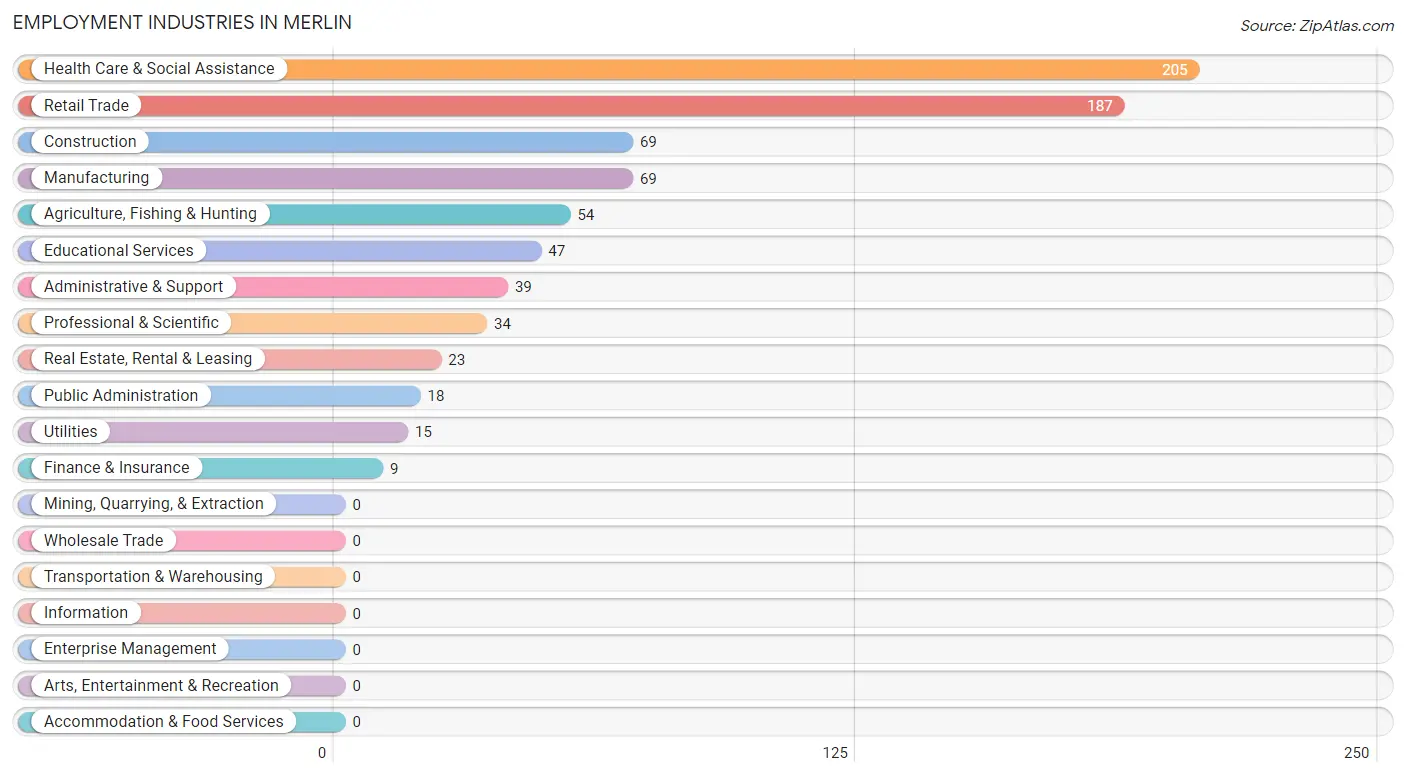
Employment Industries in Merlin
The major employment industries in Merlin include Health Care & Social Assistance (205 | 25.8%), Retail Trade (187 | 23.5%), Construction (69 | 8.7%), Manufacturing (69 | 8.7%), and Agriculture, Fishing & Hunting (54 | 6.8%).
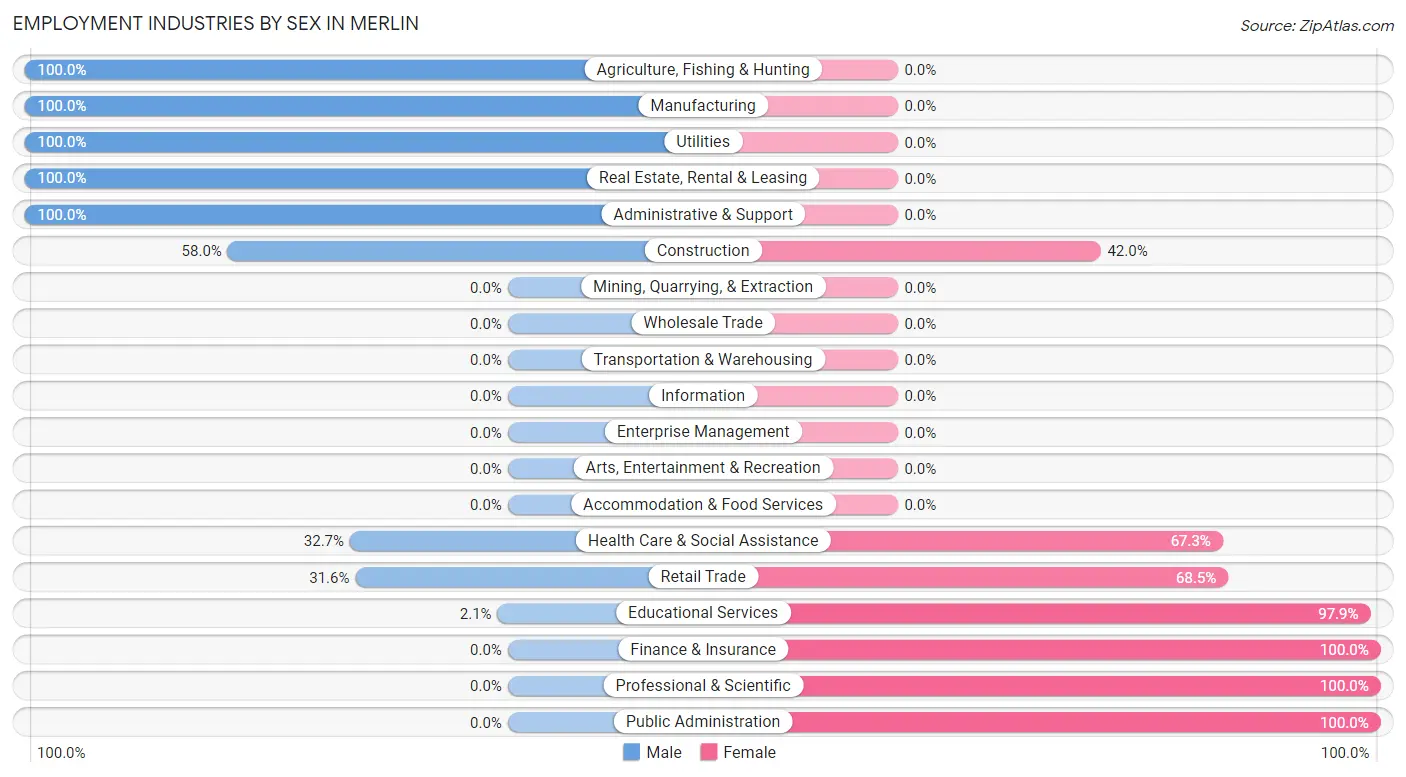
Employment Industries by Sex in Merlin
The Merlin industries that see more men than women are Agriculture, Fishing & Hunting (100.0%), Manufacturing (100.0%), and Utilities (100.0%), whereas the industries that tend to have a higher number of women are Finance & Insurance (100.0%), Professional & Scientific (100.0%), and Public Administration (100.0%).
| Industry | Male | Female |
| Agriculture, Fishing & Hunting | 54 (100.0%) | 0 (0.0%) |
| Mining, Quarrying, & Extraction | 0 (0.0%) | 0 (0.0%) |
| Construction | 40 (58.0%) | 29 (42.0%) |
| Manufacturing | 69 (100.0%) | 0 (0.0%) |
| Wholesale Trade | 0 (0.0%) | 0 (0.0%) |
| Retail Trade | 59 (31.6%) | 128 (68.4%) |
| Transportation & Warehousing | 0 (0.0%) | 0 (0.0%) |
| Utilities | 15 (100.0%) | 0 (0.0%) |
| Information | 0 (0.0%) | 0 (0.0%) |
| Finance & Insurance | 0 (0.0%) | 9 (100.0%) |
| Real Estate, Rental & Leasing | 23 (100.0%) | 0 (0.0%) |
| Professional & Scientific | 0 (0.0%) | 34 (100.0%) |
| Enterprise Management | 0 (0.0%) | 0 (0.0%) |
| Administrative & Support | 39 (100.0%) | 0 (0.0%) |
| Educational Services | 1 (2.1%) | 46 (97.9%) |
| Health Care & Social Assistance | 67 (32.7%) | 138 (67.3%) |
| Arts, Entertainment & Recreation | 0 (0.0%) | 0 (0.0%) |
| Accommodation & Food Services | 0 (0.0%) | 0 (0.0%) |
| Public Administration | 0 (0.0%) | 18 (100.0%) |
| Total | 394 (49.5%) | 402 (50.5%) |
Education in Merlin
School Enrollment in Merlin
The most common levels of schooling among the 422 students in Merlin are high school (113 | 26.8%), college / undergraduate (94 | 22.3%), and elementary school (86 | 20.4%).
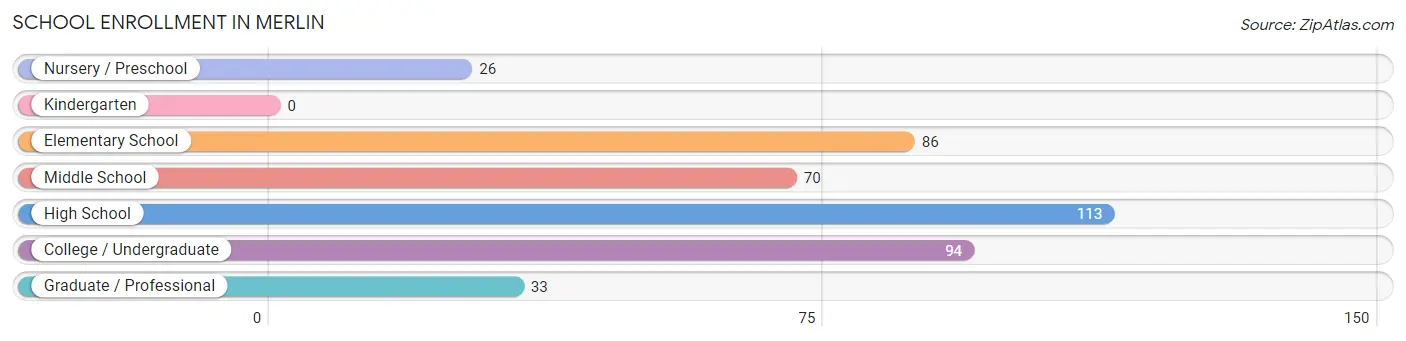
| School Level | # Students | % Students |
| Nursery / Preschool | 26 | 6.2% |
| Kindergarten | 0 | 0.0% |
| Elementary School | 86 | 20.4% |
| Middle School | 70 | 16.6% |
| High School | 113 | 26.8% |
| College / Undergraduate | 94 | 22.3% |
| Graduate / Professional | 33 | 7.8% |
| Total | 422 | 100.0% |
School Enrollment by Age by Funding Source in Merlin
Out of a total of 422 students who are enrolled in schools in Merlin, 143 (33.9%) attend a private institution, while the remaining 279 (66.1%) are enrolled in public schools. The age group of 10 to 14 year olds has the highest likelihood of being enrolled in private schools, with 45 (64.3% in the age bracket) enrolled. Conversely, the age group of 15 to 17 year olds has the lowest likelihood of being enrolled in a private school, with 113 (100.0% in the age bracket) attending a public institution.
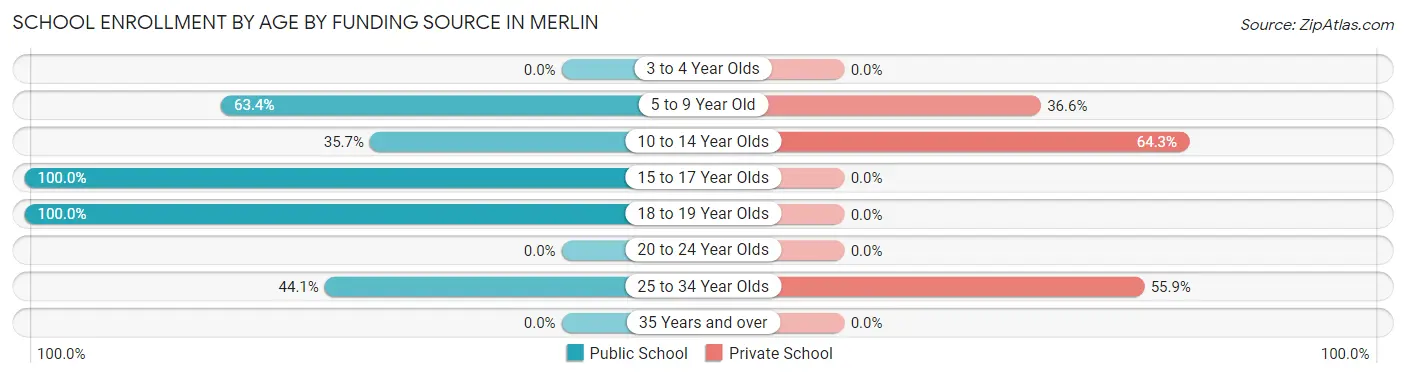
| Age Bracket | Public School | Private School |
| 3 to 4 Year Olds | 0 (0.0%) | 0 (0.0%) |
| 5 to 9 Year Old | 71 (63.4%) | 41 (36.6%) |
| 10 to 14 Year Olds | 25 (35.7%) | 45 (64.3%) |
| 15 to 17 Year Olds | 113 (100.0%) | 0 (0.0%) |
| 18 to 19 Year Olds | 25 (100.0%) | 0 (0.0%) |
| 20 to 24 Year Olds | 0 (0.0%) | 0 (0.0%) |
| 25 to 34 Year Olds | 45 (44.1%) | 57 (55.9%) |
| 35 Years and over | 0 (0.0%) | 0 (0.0%) |
| Total | 279 (66.1%) | 143 (33.9%) |
Educational Attainment by Field of Study in Merlin
Business (74 | 19.7%), psychology (72 | 19.2%), communications (64 | 17.1%), arts & humanities (35 | 9.3%), and bio, nature & agricultural (34 | 9.1%) are the most common fields of study among 375 individuals in Merlin who have obtained a bachelor's degree or higher.
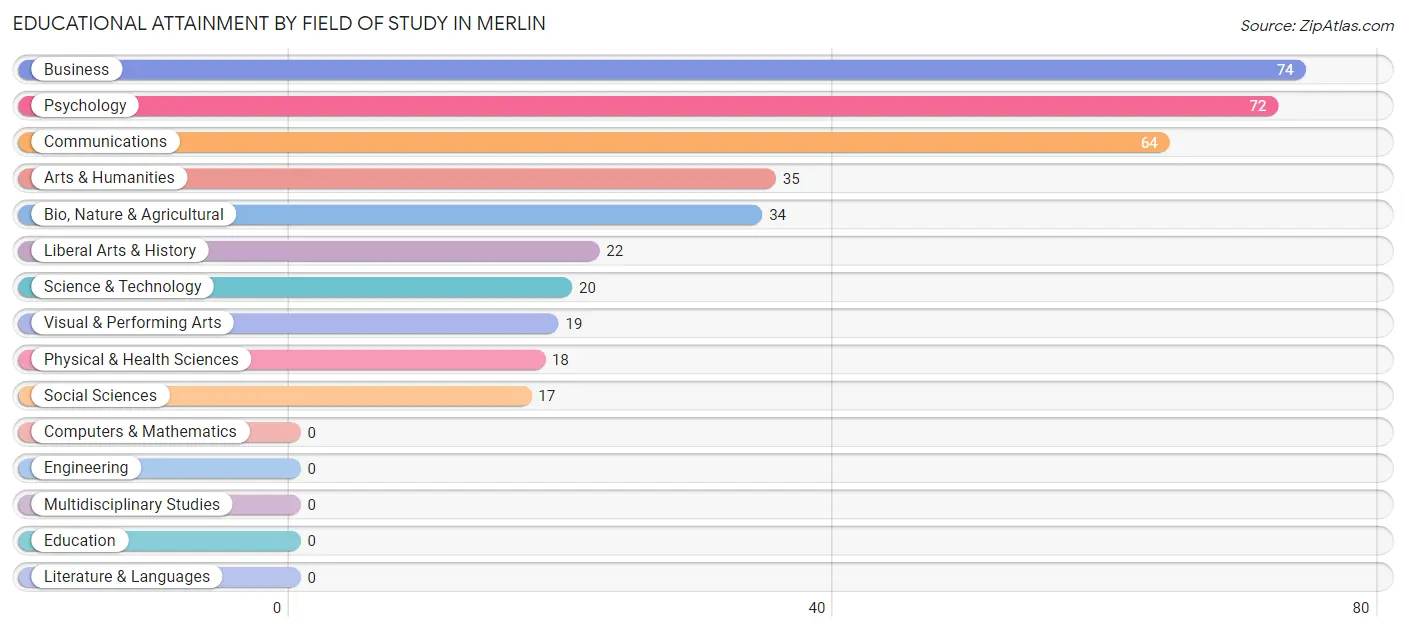
| Field of Study | # Graduates | % Graduates |
| Computers & Mathematics | 0 | 0.0% |
| Bio, Nature & Agricultural | 34 | 9.1% |
| Physical & Health Sciences | 18 | 4.8% |
| Psychology | 72 | 19.2% |
| Social Sciences | 17 | 4.5% |
| Engineering | 0 | 0.0% |
| Multidisciplinary Studies | 0 | 0.0% |
| Science & Technology | 20 | 5.3% |
| Business | 74 | 19.7% |
| Education | 0 | 0.0% |
| Literature & Languages | 0 | 0.0% |
| Liberal Arts & History | 22 | 5.9% |
| Visual & Performing Arts | 19 | 5.1% |
| Communications | 64 | 17.1% |
| Arts & Humanities | 35 | 9.3% |
| Total | 375 | 100.0% |
Transportation & Commute in Merlin
Vehicle Availability by Sex in Merlin
The most prevalent vehicle ownership categories in Merlin are males with 5 or more vehicles (120, accounting for 31.6%) and females with 5 or more vehicles (89, making up 29.8%).
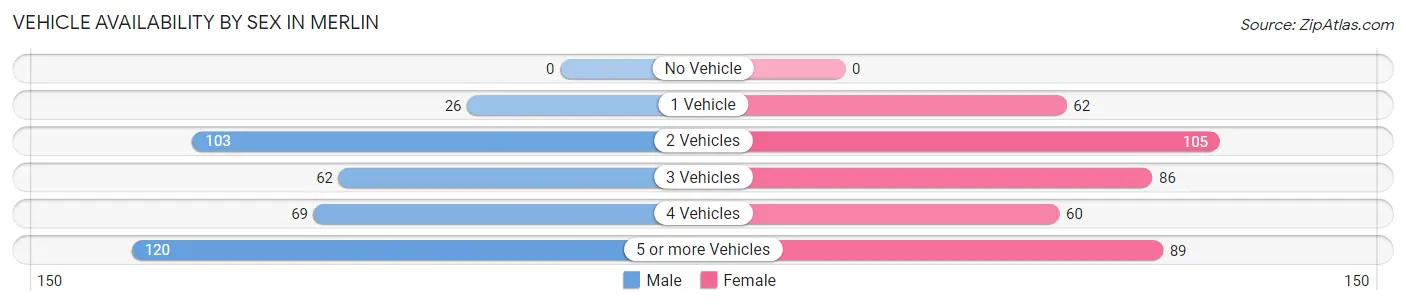
| Vehicles Available | Male | Female |
| No Vehicle | 0 (0.0%) | 0 (0.0%) |
| 1 Vehicle | 26 (6.8%) | 62 (15.4%) |
| 2 Vehicles | 103 (27.1%) | 105 (26.1%) |
| 3 Vehicles | 62 (16.3%) | 86 (21.4%) |
| 4 Vehicles | 69 (18.2%) | 60 (14.9%) |
| 5 or more Vehicles | 120 (31.6%) | 89 (22.1%) |
| Total | 380 (100.0%) | 402 (100.0%) |
Commute Time in Merlin
The most frequently occuring commute durations in Merlin are 45 to 59 minutes (245 commuters, 34.2%), 15 to 19 minutes (152 commuters, 21.2%), and 20 to 24 minutes (117 commuters, 16.3%).
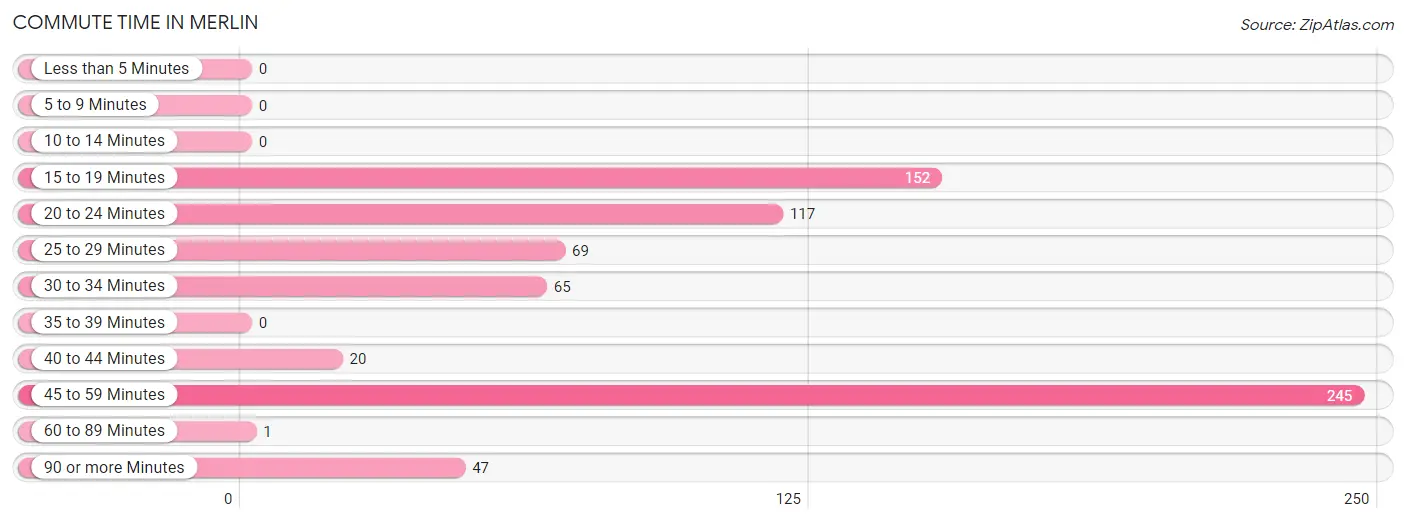
| Commute Time | # Commuters | % Commuters |
| Less than 5 Minutes | 0 | 0.0% |
| 5 to 9 Minutes | 0 | 0.0% |
| 10 to 14 Minutes | 0 | 0.0% |
| 15 to 19 Minutes | 152 | 21.2% |
| 20 to 24 Minutes | 117 | 16.3% |
| 25 to 29 Minutes | 69 | 9.6% |
| 30 to 34 Minutes | 65 | 9.1% |
| 35 to 39 Minutes | 0 | 0.0% |
| 40 to 44 Minutes | 20 | 2.8% |
| 45 to 59 Minutes | 245 | 34.2% |
| 60 to 89 Minutes | 1 | 0.1% |
| 90 or more Minutes | 47 | 6.6% |
Commute Time by Sex in Merlin
The most common commute times in Merlin are 45 to 59 minutes (151 commuters, 42.8%) for males and 15 to 19 minutes (127 commuters, 35.0%) for females.
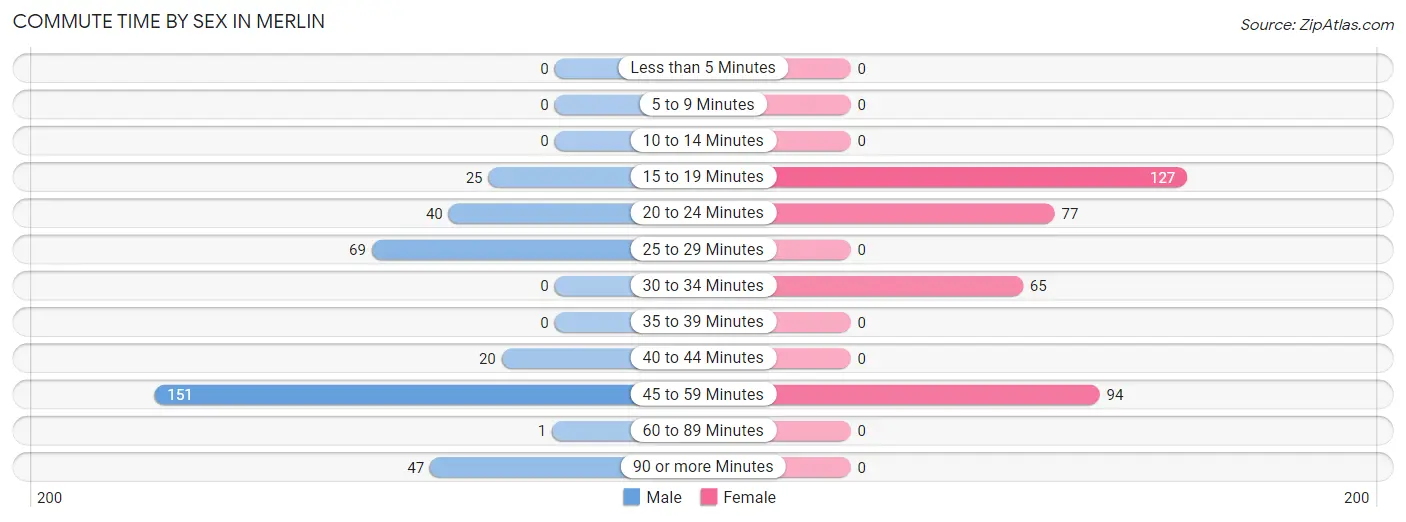
| Commute Time | Male | Female |
| Less than 5 Minutes | 0 (0.0%) | 0 (0.0%) |
| 5 to 9 Minutes | 0 (0.0%) | 0 (0.0%) |
| 10 to 14 Minutes | 0 (0.0%) | 0 (0.0%) |
| 15 to 19 Minutes | 25 (7.1%) | 127 (35.0%) |
| 20 to 24 Minutes | 40 (11.3%) | 77 (21.2%) |
| 25 to 29 Minutes | 69 (19.6%) | 0 (0.0%) |
| 30 to 34 Minutes | 0 (0.0%) | 65 (17.9%) |
| 35 to 39 Minutes | 0 (0.0%) | 0 (0.0%) |
| 40 to 44 Minutes | 20 (5.7%) | 0 (0.0%) |
| 45 to 59 Minutes | 151 (42.8%) | 94 (25.9%) |
| 60 to 89 Minutes | 1 (0.3%) | 0 (0.0%) |
| 90 or more Minutes | 47 (13.3%) | 0 (0.0%) |
Time of Departure to Work by Sex in Merlin
The most frequent times of departure to work in Merlin are 6:00 AM to 6:29 AM (137, 38.8%) for males and 10:00 AM to 10:59 AM (94, 25.9%) for females.
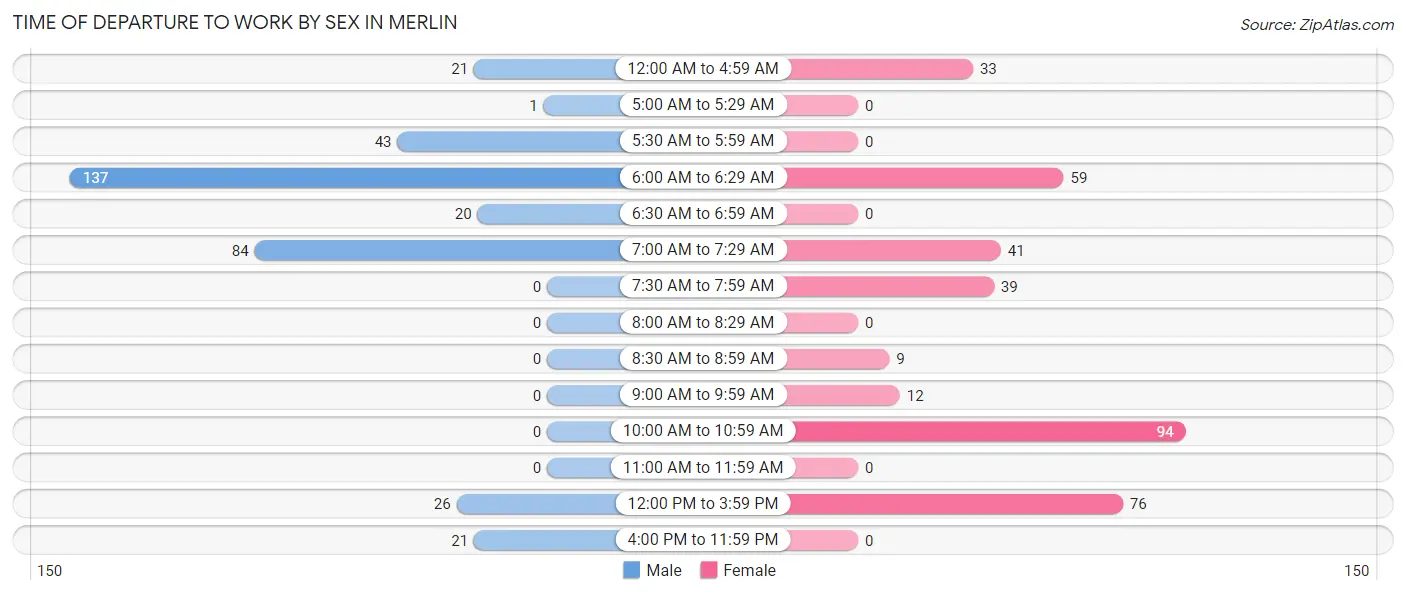
| Time of Departure | Male | Female |
| 12:00 AM to 4:59 AM | 21 (5.9%) | 33 (9.1%) |
| 5:00 AM to 5:29 AM | 1 (0.3%) | 0 (0.0%) |
| 5:30 AM to 5:59 AM | 43 (12.2%) | 0 (0.0%) |
| 6:00 AM to 6:29 AM | 137 (38.8%) | 59 (16.3%) |
| 6:30 AM to 6:59 AM | 20 (5.7%) | 0 (0.0%) |
| 7:00 AM to 7:29 AM | 84 (23.8%) | 41 (11.3%) |
| 7:30 AM to 7:59 AM | 0 (0.0%) | 39 (10.7%) |
| 8:00 AM to 8:29 AM | 0 (0.0%) | 0 (0.0%) |
| 8:30 AM to 8:59 AM | 0 (0.0%) | 9 (2.5%) |
| 9:00 AM to 9:59 AM | 0 (0.0%) | 12 (3.3%) |
| 10:00 AM to 10:59 AM | 0 (0.0%) | 94 (25.9%) |
| 11:00 AM to 11:59 AM | 0 (0.0%) | 0 (0.0%) |
| 12:00 PM to 3:59 PM | 26 (7.4%) | 76 (20.9%) |
| 4:00 PM to 11:59 PM | 21 (5.9%) | 0 (0.0%) |
| Total | 353 (100.0%) | 363 (100.0%) |
Housing Occupancy in Merlin
Occupancy by Ownership in Merlin
Of the total 695 dwellings in Merlin, owner-occupied units account for 560 (80.6%), while renter-occupied units make up 135 (19.4%).
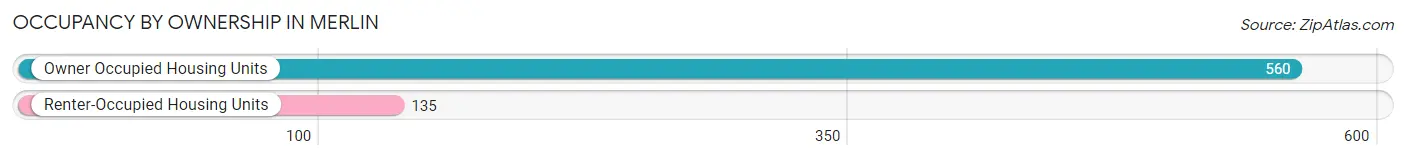
| Occupancy | # Housing Units | % Housing Units |
| Owner Occupied Housing Units | 560 | 80.6% |
| Renter-Occupied Housing Units | 135 | 19.4% |
| Total Occupied Housing Units | 695 | 100.0% |
Occupancy by Household Size in Merlin
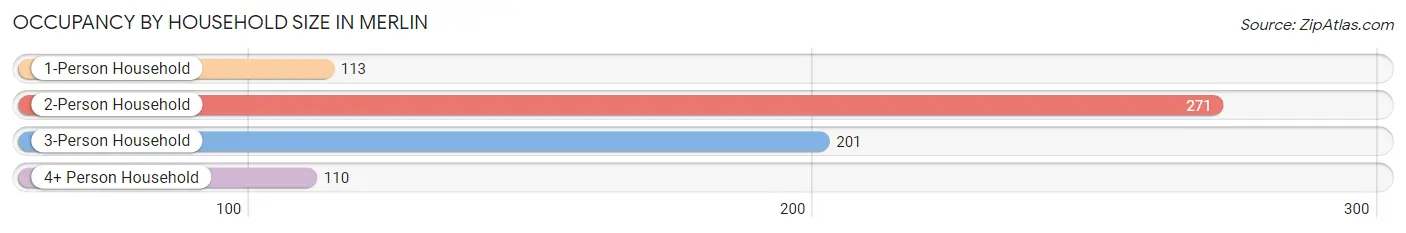
| Household Size | # Housing Units | % Housing Units |
| 1-Person Household | 113 | 16.3% |
| 2-Person Household | 271 | 39.0% |
| 3-Person Household | 201 | 28.9% |
| 4+ Person Household | 110 | 15.8% |
| Total Housing Units | 695 | 100.0% |
Occupancy by Ownership by Household Size in Merlin
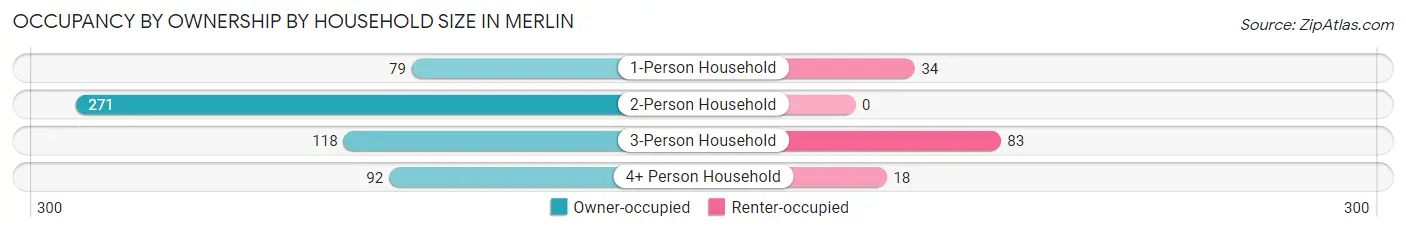
| Household Size | Owner-occupied | Renter-occupied |
| 1-Person Household | 79 (69.9%) | 34 (30.1%) |
| 2-Person Household | 271 (100.0%) | 0 (0.0%) |
| 3-Person Household | 118 (58.7%) | 83 (41.3%) |
| 4+ Person Household | 92 (83.6%) | 18 (16.4%) |
| Total Housing Units | 560 (80.6%) | 135 (19.4%) |
Occupancy by Educational Attainment in Merlin
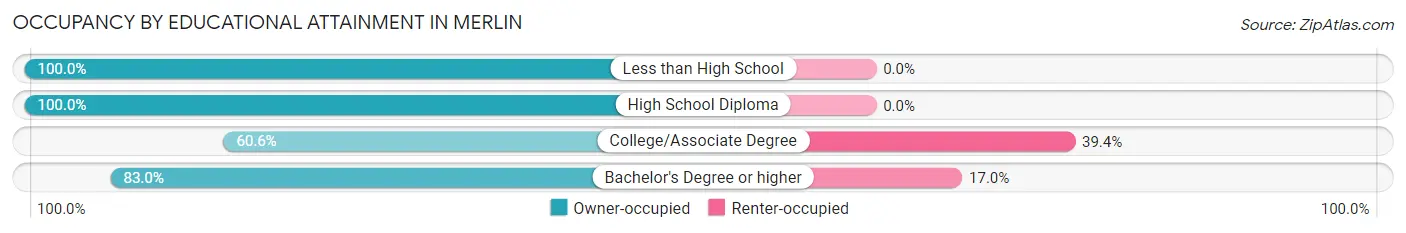
| Household Size | Owner-occupied | Renter-occupied |
| Less than High School | 92 (100.0%) | 0 (0.0%) |
| High School Diploma | 134 (100.0%) | 0 (0.0%) |
| College/Associate Degree | 149 (60.6%) | 97 (39.4%) |
| Bachelor's Degree or higher | 185 (83.0%) | 38 (17.0%) |
Occupancy by Age of Householder in Merlin
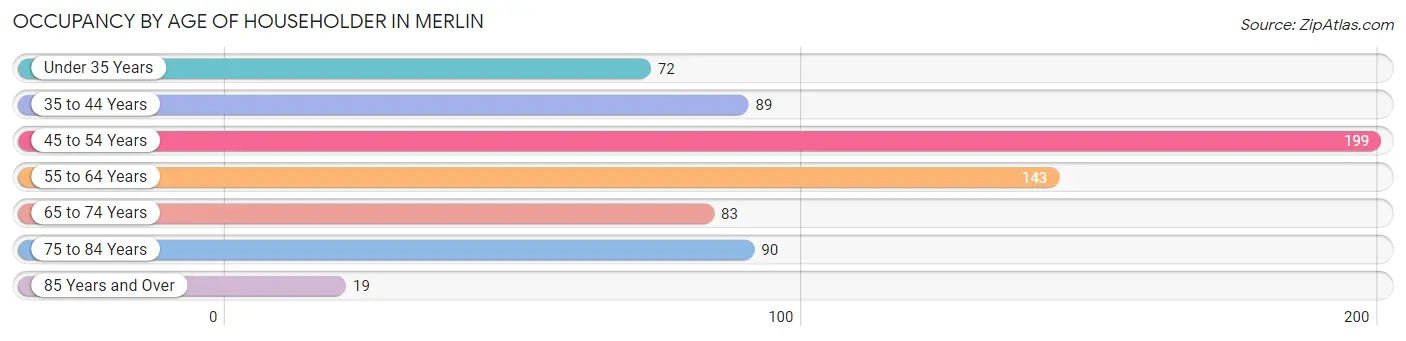
| Age Bracket | # Households | % Households |
| Under 35 Years | 72 | 10.4% |
| 35 to 44 Years | 89 | 12.8% |
| 45 to 54 Years | 199 | 28.6% |
| 55 to 64 Years | 143 | 20.6% |
| 65 to 74 Years | 83 | 11.9% |
| 75 to 84 Years | 90 | 13.0% |
| 85 Years and Over | 19 | 2.7% |
| Total | 695 | 100.0% |
Housing Finances in Merlin
Median Income by Occupancy in Merlin
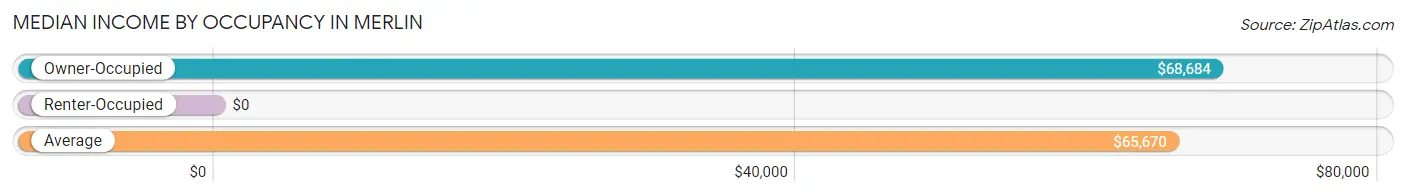
| Occupancy Type | # Households | Median Income |
| Owner-Occupied | 560 (80.6%) | $68,684 |
| Renter-Occupied | 135 (19.4%) | $0 |
| Average | 695 (100.0%) | $65,670 |
Occupancy by Householder Income Bracket in Merlin
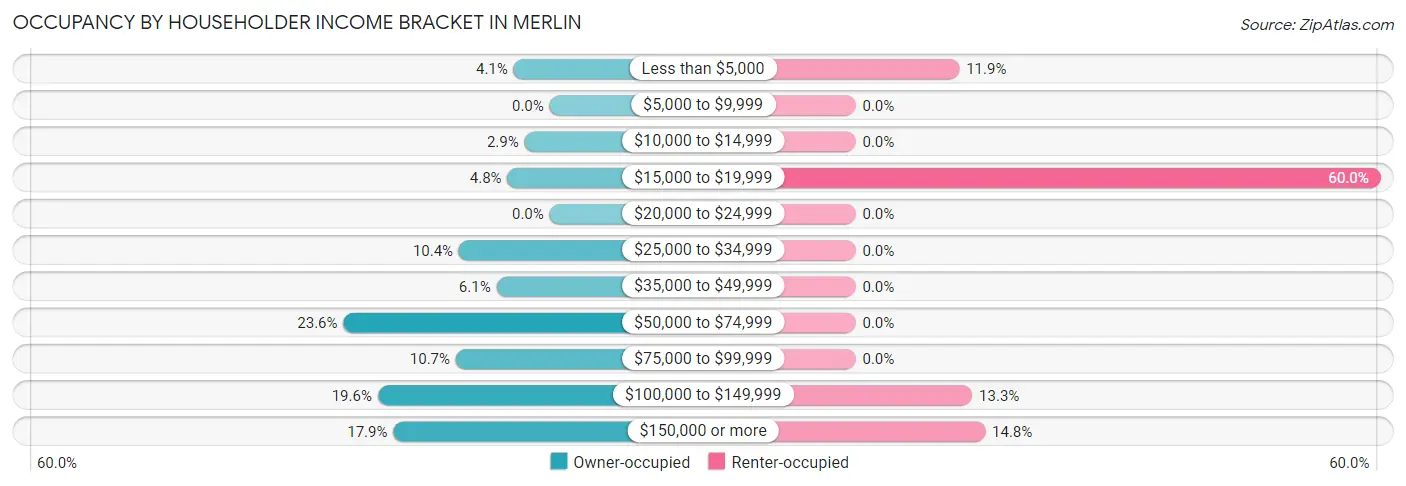
| Income Bracket | Owner-occupied | Renter-occupied |
| Less than $5,000 | 23 (4.1%) | 16 (11.8%) |
| $5,000 to $9,999 | 0 (0.0%) | 0 (0.0%) |
| $10,000 to $14,999 | 16 (2.9%) | 0 (0.0%) |
| $15,000 to $19,999 | 27 (4.8%) | 81 (60.0%) |
| $20,000 to $24,999 | 0 (0.0%) | 0 (0.0%) |
| $25,000 to $34,999 | 58 (10.4%) | 0 (0.0%) |
| $35,000 to $49,999 | 34 (6.1%) | 0 (0.0%) |
| $50,000 to $74,999 | 132 (23.6%) | 0 (0.0%) |
| $75,000 to $99,999 | 60 (10.7%) | 0 (0.0%) |
| $100,000 to $149,999 | 110 (19.6%) | 18 (13.3%) |
| $150,000 or more | 100 (17.9%) | 20 (14.8%) |
| Total | 560 (100.0%) | 135 (100.0%) |
Monthly Housing Cost Tiers in Merlin
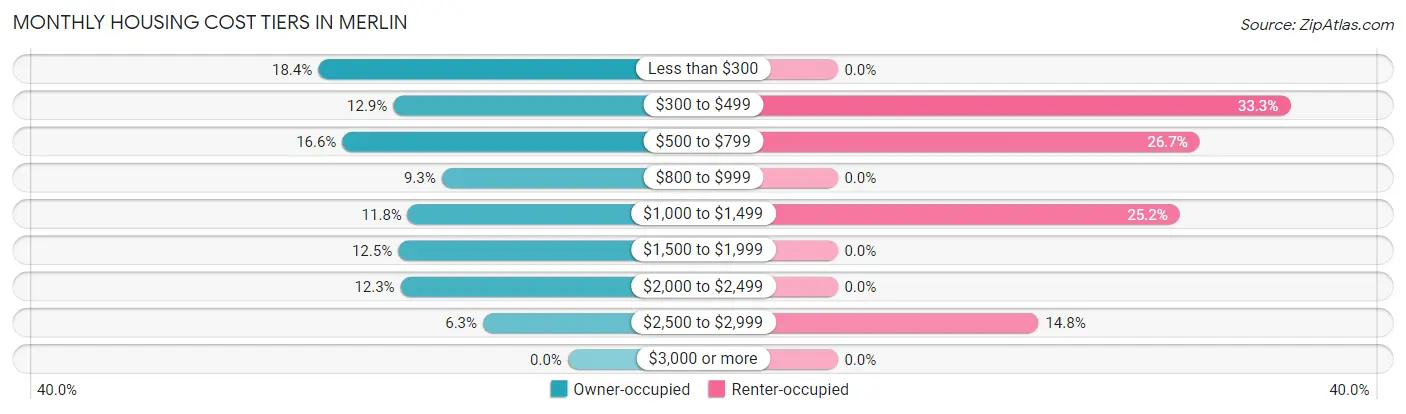
| Monthly Cost | Owner-occupied | Renter-occupied |
| Less than $300 | 103 (18.4%) | 0 (0.0%) |
| $300 to $499 | 72 (12.9%) | 45 (33.3%) |
| $500 to $799 | 93 (16.6%) | 36 (26.7%) |
| $800 to $999 | 52 (9.3%) | 0 (0.0%) |
| $1,000 to $1,499 | 66 (11.8%) | 34 (25.2%) |
| $1,500 to $1,999 | 70 (12.5%) | 0 (0.0%) |
| $2,000 to $2,499 | 69 (12.3%) | 0 (0.0%) |
| $2,500 to $2,999 | 35 (6.2%) | 20 (14.8%) |
| $3,000 or more | 0 (0.0%) | 0 (0.0%) |
| Total | 560 (100.0%) | 135 (100.0%) |
Physical Housing Characteristics in Merlin
Housing Structures in Merlin
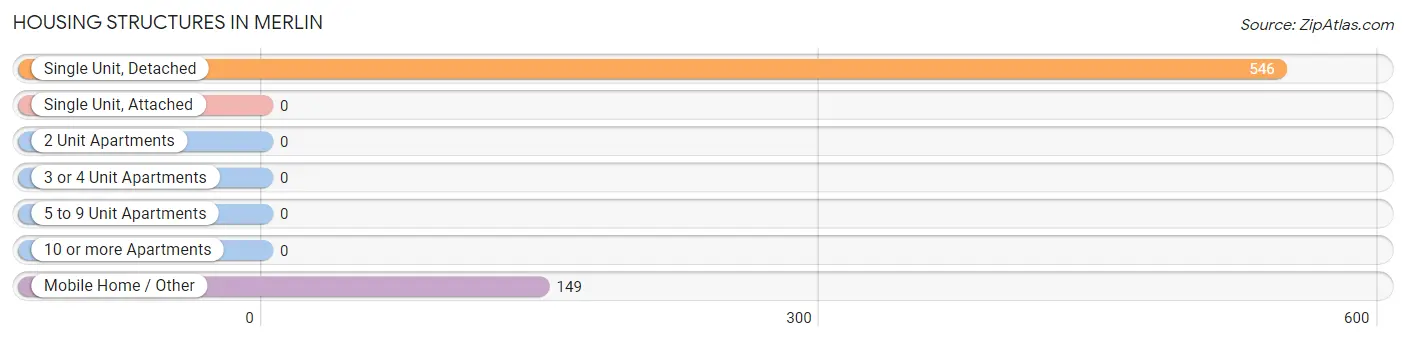
| Structure Type | # Housing Units | % Housing Units |
| Single Unit, Detached | 546 | 78.6% |
| Single Unit, Attached | 0 | 0.0% |
| 2 Unit Apartments | 0 | 0.0% |
| 3 or 4 Unit Apartments | 0 | 0.0% |
| 5 to 9 Unit Apartments | 0 | 0.0% |
| 10 or more Apartments | 0 | 0.0% |
| Mobile Home / Other | 149 | 21.4% |
| Total | 695 | 100.0% |
Housing Structures by Occupancy in Merlin
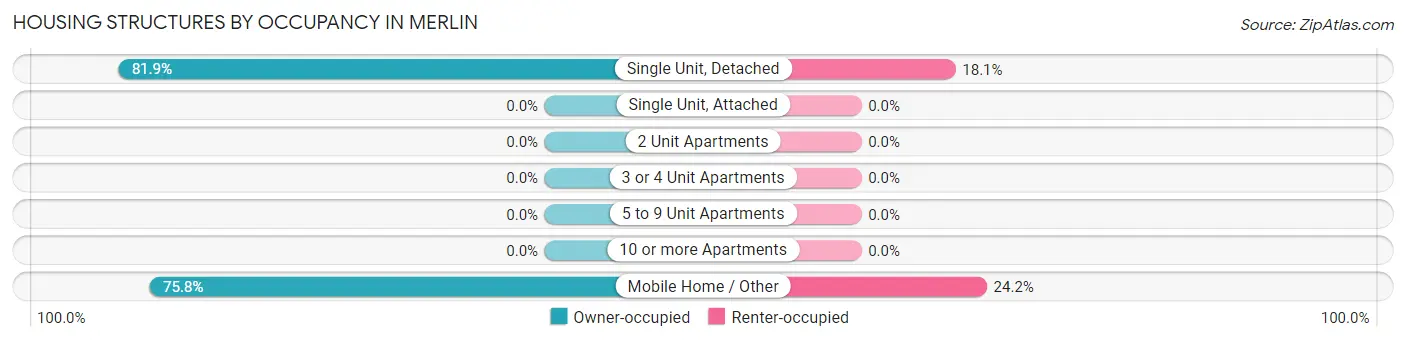
| Structure Type | Owner-occupied | Renter-occupied |
| Single Unit, Detached | 447 (81.9%) | 99 (18.1%) |
| Single Unit, Attached | 0 (0.0%) | 0 (0.0%) |
| 2 Unit Apartments | 0 (0.0%) | 0 (0.0%) |
| 3 or 4 Unit Apartments | 0 (0.0%) | 0 (0.0%) |
| 5 to 9 Unit Apartments | 0 (0.0%) | 0 (0.0%) |
| 10 or more Apartments | 0 (0.0%) | 0 (0.0%) |
| Mobile Home / Other | 113 (75.8%) | 36 (24.2%) |
| Total | 560 (80.6%) | 135 (19.4%) |
Housing Structures by Number of Rooms in Merlin
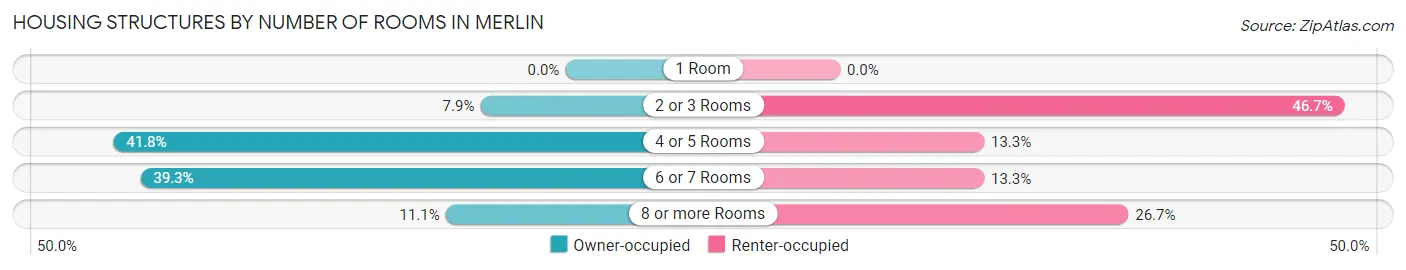
| Number of Rooms | Owner-occupied | Renter-occupied |
| 1 Room | 0 (0.0%) | 0 (0.0%) |
| 2 or 3 Rooms | 44 (7.9%) | 63 (46.7%) |
| 4 or 5 Rooms | 234 (41.8%) | 18 (13.3%) |
| 6 or 7 Rooms | 220 (39.3%) | 18 (13.3%) |
| 8 or more Rooms | 62 (11.1%) | 36 (26.7%) |
| Total | 560 (100.0%) | 135 (100.0%) |
Housing Structure by Heating Type in Merlin
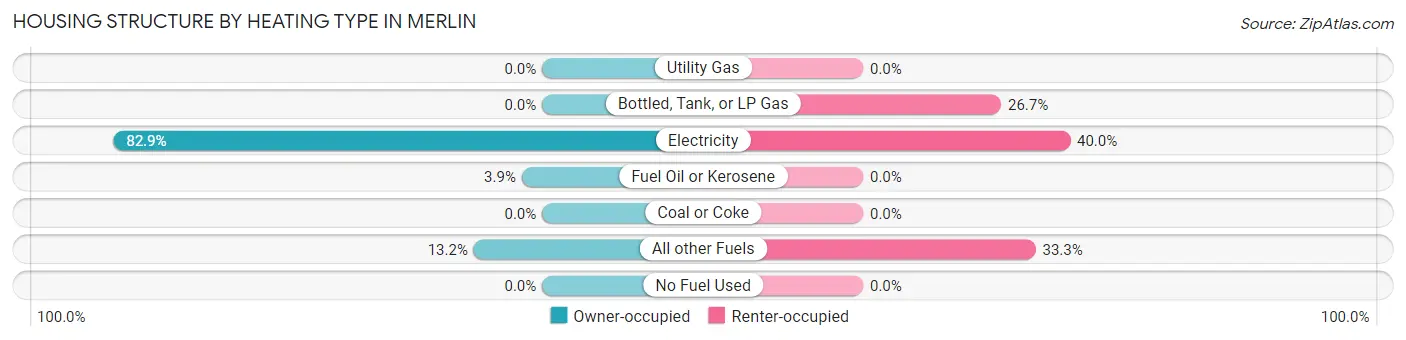
| Heating Type | Owner-occupied | Renter-occupied |
| Utility Gas | 0 (0.0%) | 0 (0.0%) |
| Bottled, Tank, or LP Gas | 0 (0.0%) | 36 (26.7%) |
| Electricity | 464 (82.9%) | 54 (40.0%) |
| Fuel Oil or Kerosene | 22 (3.9%) | 0 (0.0%) |
| Coal or Coke | 0 (0.0%) | 0 (0.0%) |
| All other Fuels | 74 (13.2%) | 45 (33.3%) |
| No Fuel Used | 0 (0.0%) | 0 (0.0%) |
| Total | 560 (100.0%) | 135 (100.0%) |
Household Vehicle Usage in Merlin
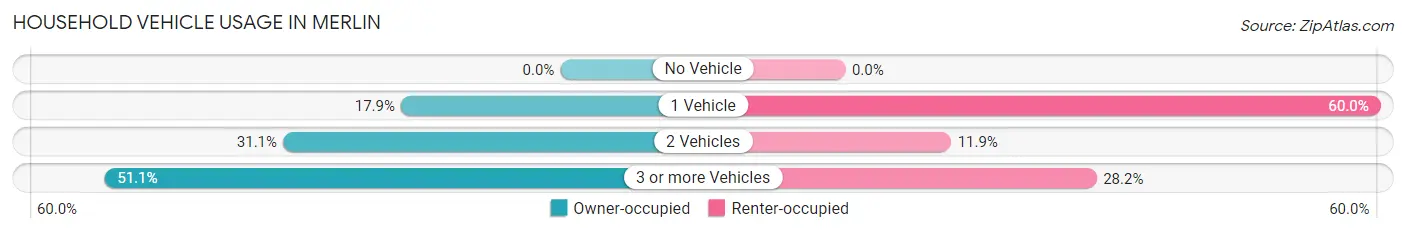
| Vehicles per Household | Owner-occupied | Renter-occupied |
| No Vehicle | 0 (0.0%) | 0 (0.0%) |
| 1 Vehicle | 100 (17.9%) | 81 (60.0%) |
| 2 Vehicles | 174 (31.1%) | 16 (11.8%) |
| 3 or more Vehicles | 286 (51.1%) | 38 (28.1%) |
| Total | 560 (100.0%) | 135 (100.0%) |
Real Estate & Mortgages in Merlin
Real Estate and Mortgage Overview in Merlin
| Characteristic | Without Mortgage | With Mortgage |
| Housing Units | 268 | 292 |
| Median Property Value | $407,800 | $361,500 |
| Median Household Income | - | - |
| Monthly Housing Costs | $380 | $0 |
| Real Estate Taxes | $1,613 | $0 |
Property Value by Mortgage Status in Merlin
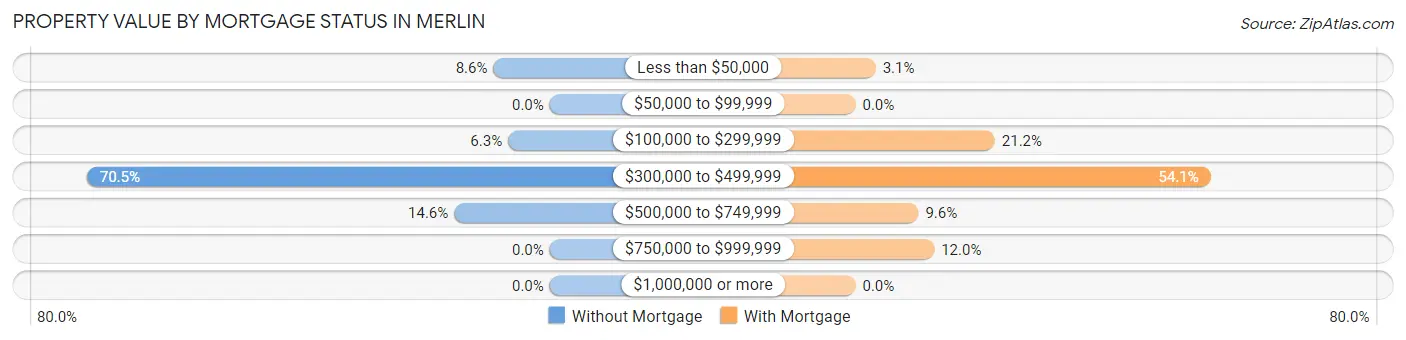
| Property Value | Without Mortgage | With Mortgage |
| Less than $50,000 | 23 (8.6%) | 9 (3.1%) |
| $50,000 to $99,999 | 0 (0.0%) | 0 (0.0%) |
| $100,000 to $299,999 | 17 (6.3%) | 62 (21.2%) |
| $300,000 to $499,999 | 189 (70.5%) | 158 (54.1%) |
| $500,000 to $749,999 | 39 (14.5%) | 28 (9.6%) |
| $750,000 to $999,999 | 0 (0.0%) | 35 (12.0%) |
| $1,000,000 or more | 0 (0.0%) | 0 (0.0%) |
| Total | 268 (100.0%) | 292 (100.0%) |
Household Income by Mortgage Status in Merlin
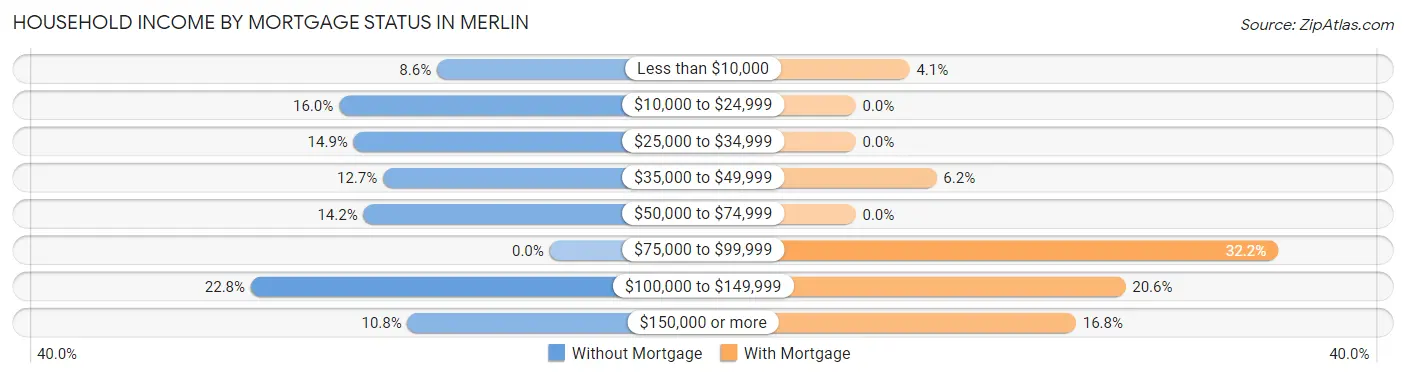
| Household Income | Without Mortgage | With Mortgage |
| Less than $10,000 | 23 (8.6%) | 12 (4.1%) |
| $10,000 to $24,999 | 43 (16.0%) | 0 (0.0%) |
| $25,000 to $34,999 | 40 (14.9%) | 0 (0.0%) |
| $35,000 to $49,999 | 34 (12.7%) | 18 (6.2%) |
| $50,000 to $74,999 | 38 (14.2%) | 0 (0.0%) |
| $75,000 to $99,999 | 0 (0.0%) | 94 (32.2%) |
| $100,000 to $149,999 | 61 (22.8%) | 60 (20.5%) |
| $150,000 or more | 29 (10.8%) | 49 (16.8%) |
| Total | 268 (100.0%) | 292 (100.0%) |
Property Value to Household Income Ratio in Merlin
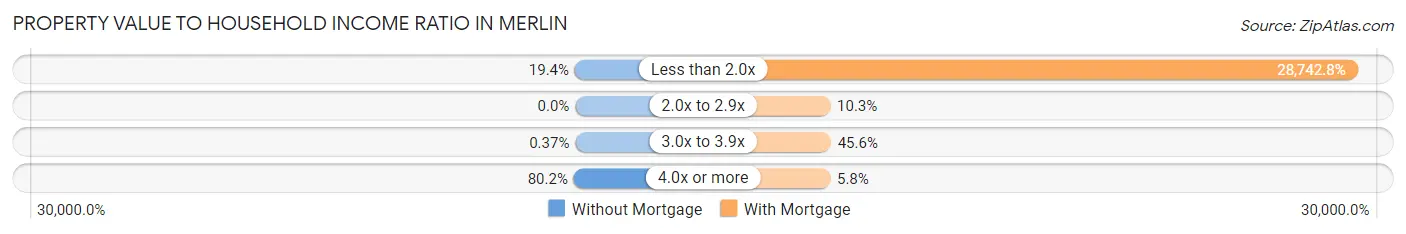
| Value-to-Income Ratio | Without Mortgage | With Mortgage |
| Less than 2.0x | 52 (19.4%) | 83,929 (28,742.8%) |
| 2.0x to 2.9x | 0 (0.0%) | 30 (10.3%) |
| 3.0x to 3.9x | 1 (0.4%) | 133 (45.6%) |
| 4.0x or more | 215 (80.2%) | 17 (5.8%) |
| Total | 268 (100.0%) | 292 (100.0%) |
Real Estate Taxes by Mortgage Status in Merlin
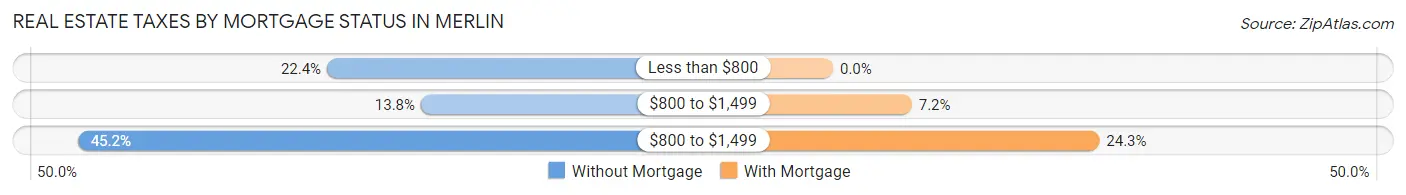
| Property Taxes | Without Mortgage | With Mortgage |
| Less than $800 | 60 (22.4%) | 0 (0.0%) |
| $800 to $1,499 | 37 (13.8%) | 21 (7.2%) |
| $800 to $1,499 | 121 (45.2%) | 71 (24.3%) |
| Total | 268 (100.0%) | 292 (100.0%) |
Health & Disability in Merlin
Health Insurance Coverage by Age in Merlin
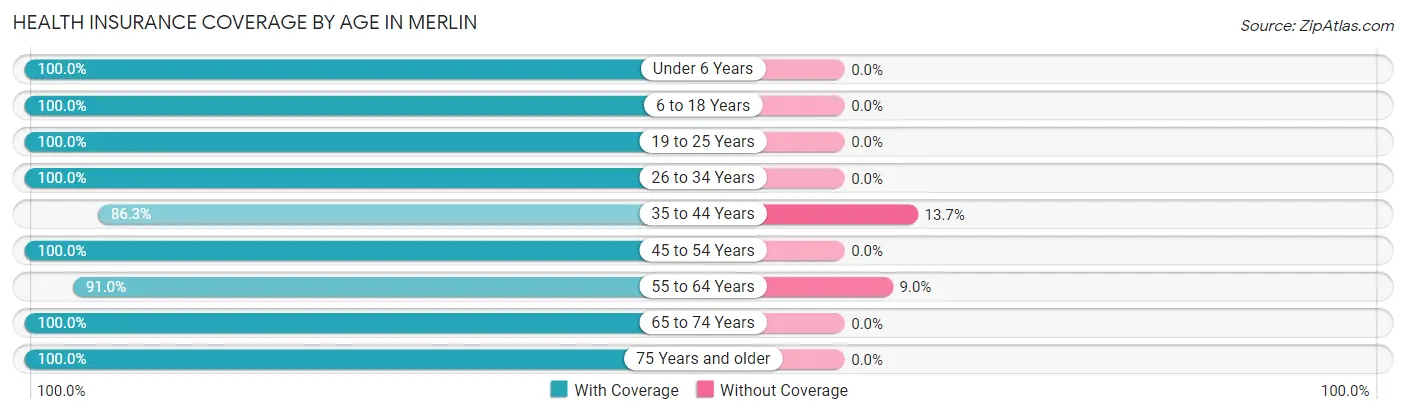
| Age Bracket | With Coverage | Without Coverage |
| Under 6 Years | 43 (100.0%) | 0 (0.0%) |
| 6 to 18 Years | 269 (100.0%) | 0 (0.0%) |
| 19 to 25 Years | 70 (100.0%) | 0 (0.0%) |
| 26 to 34 Years | 197 (100.0%) | 0 (0.0%) |
| 35 to 44 Years | 120 (86.3%) | 19 (13.7%) |
| 45 to 54 Years | 311 (100.0%) | 0 (0.0%) |
| 55 to 64 Years | 364 (91.0%) | 36 (9.0%) |
| 65 to 74 Years | 169 (100.0%) | 0 (0.0%) |
| 75 Years and older | 216 (100.0%) | 0 (0.0%) |
| Total | 1,759 (97.0%) | 55 (3.0%) |
Health Insurance Coverage by Citizenship Status in Merlin
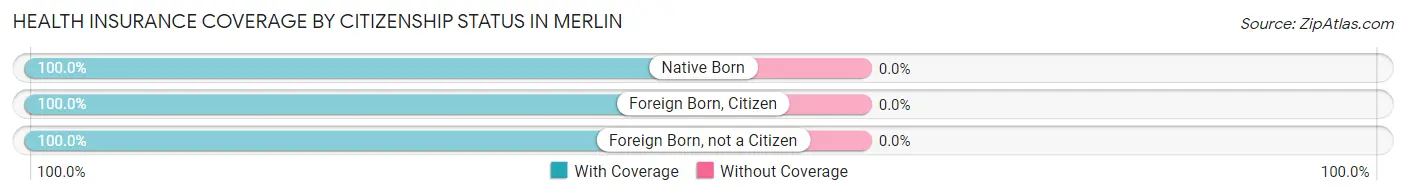
| Citizenship Status | With Coverage | Without Coverage |
| Native Born | 43 (100.0%) | 0 (0.0%) |
| Foreign Born, Citizen | 269 (100.0%) | 0 (0.0%) |
| Foreign Born, not a Citizen | 70 (100.0%) | 0 (0.0%) |
Health Insurance Coverage by Household Income in Merlin
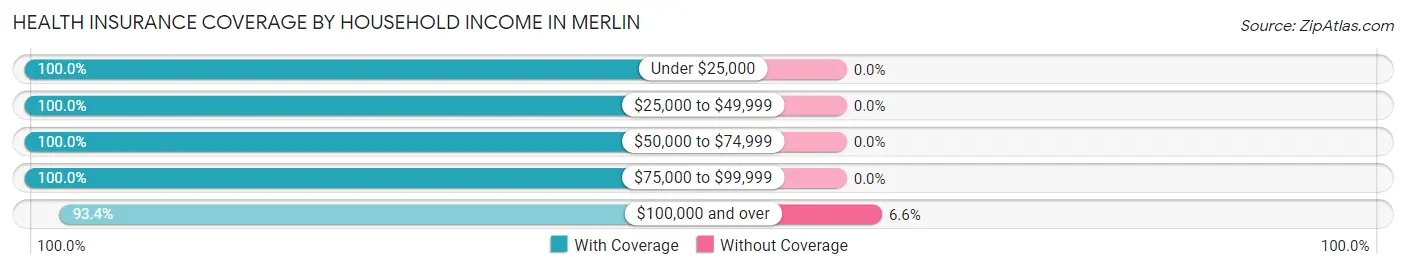
| Household Income | With Coverage | Without Coverage |
| Under $25,000 | 341 (100.0%) | 0 (0.0%) |
| $25,000 to $49,999 | 127 (100.0%) | 0 (0.0%) |
| $50,000 to $74,999 | 289 (100.0%) | 0 (0.0%) |
| $75,000 to $99,999 | 223 (100.0%) | 0 (0.0%) |
| $100,000 and over | 779 (93.4%) | 55 (6.6%) |
Public vs Private Health Insurance Coverage by Age in Merlin
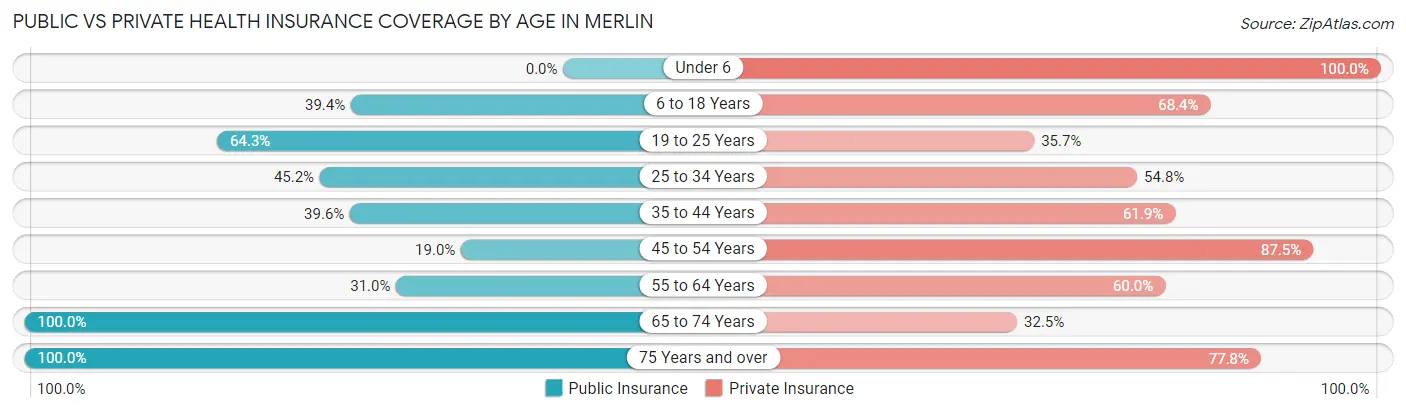
| Age Bracket | Public Insurance | Private Insurance |
| Under 6 | 0 (0.0%) | 43 (100.0%) |
| 6 to 18 Years | 106 (39.4%) | 184 (68.4%) |
| 19 to 25 Years | 45 (64.3%) | 25 (35.7%) |
| 25 to 34 Years | 89 (45.2%) | 108 (54.8%) |
| 35 to 44 Years | 55 (39.6%) | 86 (61.9%) |
| 45 to 54 Years | 59 (19.0%) | 272 (87.5%) |
| 55 to 64 Years | 124 (31.0%) | 240 (60.0%) |
| 65 to 74 Years | 169 (100.0%) | 55 (32.5%) |
| 75 Years and over | 216 (100.0%) | 168 (77.8%) |
| Total | 863 (47.6%) | 1,181 (65.1%) |
Disability Status by Sex by Age in Merlin
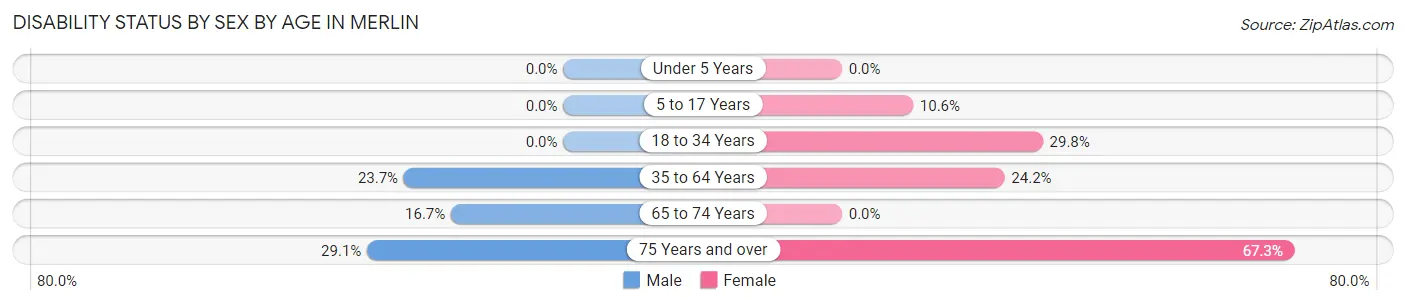
| Age Bracket | Male | Female |
| Under 5 Years | 0 (0.0%) | 0 (0.0%) |
| 5 to 17 Years | 0 (0.0%) | 21 (10.5%) |
| 18 to 34 Years | 0 (0.0%) | 51 (29.8%) |
| 35 to 64 Years | 111 (23.7%) | 92 (24.1%) |
| 65 to 74 Years | 18 (16.7%) | 0 (0.0%) |
| 75 Years and over | 30 (29.1%) | 76 (67.3%) |
Disability Class by Sex by Age in Merlin
Disability Class: Hearing Difficulty
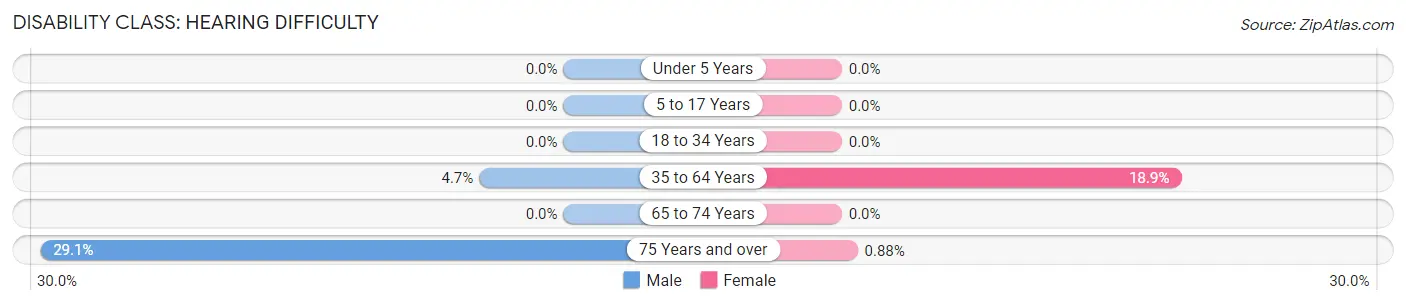
| Age Bracket | Male | Female |
| Under 5 Years | 0 (0.0%) | 0 (0.0%) |
| 5 to 17 Years | 0 (0.0%) | 0 (0.0%) |
| 18 to 34 Years | 0 (0.0%) | 0 (0.0%) |
| 35 to 64 Years | 22 (4.7%) | 72 (18.9%) |
| 65 to 74 Years | 0 (0.0%) | 0 (0.0%) |
| 75 Years and over | 30 (29.1%) | 1 (0.9%) |
Disability Class: Vision Difficulty
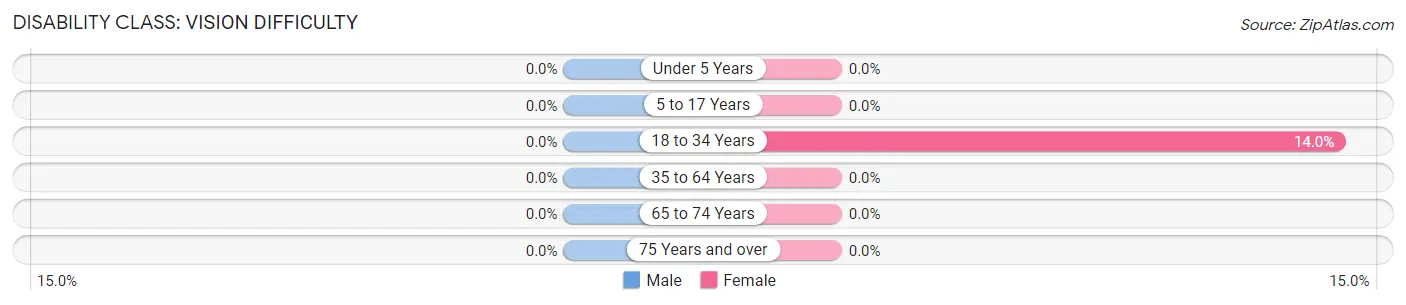
| Age Bracket | Male | Female |
| Under 5 Years | 0 (0.0%) | 0 (0.0%) |
| 5 to 17 Years | 0 (0.0%) | 0 (0.0%) |
| 18 to 34 Years | 0 (0.0%) | 24 (14.0%) |
| 35 to 64 Years | 0 (0.0%) | 0 (0.0%) |
| 65 to 74 Years | 0 (0.0%) | 0 (0.0%) |
| 75 Years and over | 0 (0.0%) | 0 (0.0%) |
Disability Class: Cognitive Difficulty
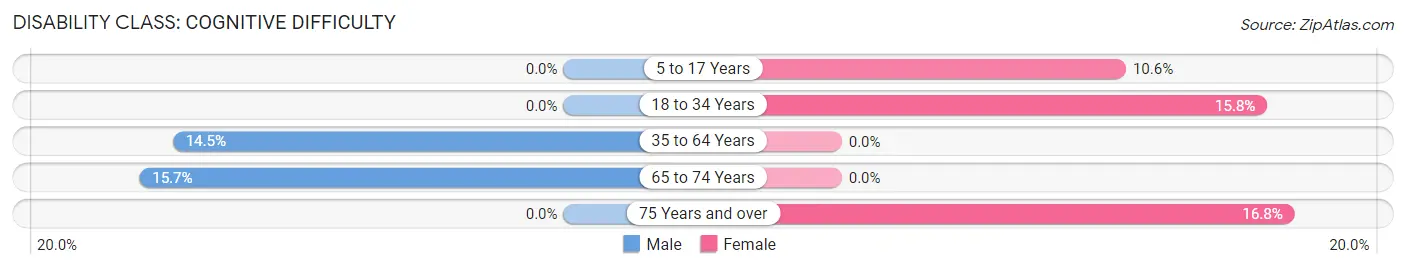
| Age Bracket | Male | Female |
| 5 to 17 Years | 0 (0.0%) | 21 (10.5%) |
| 18 to 34 Years | 0 (0.0%) | 27 (15.8%) |
| 35 to 64 Years | 68 (14.5%) | 0 (0.0%) |
| 65 to 74 Years | 17 (15.7%) | 0 (0.0%) |
| 75 Years and over | 0 (0.0%) | 19 (16.8%) |
Disability Class: Ambulatory Difficulty
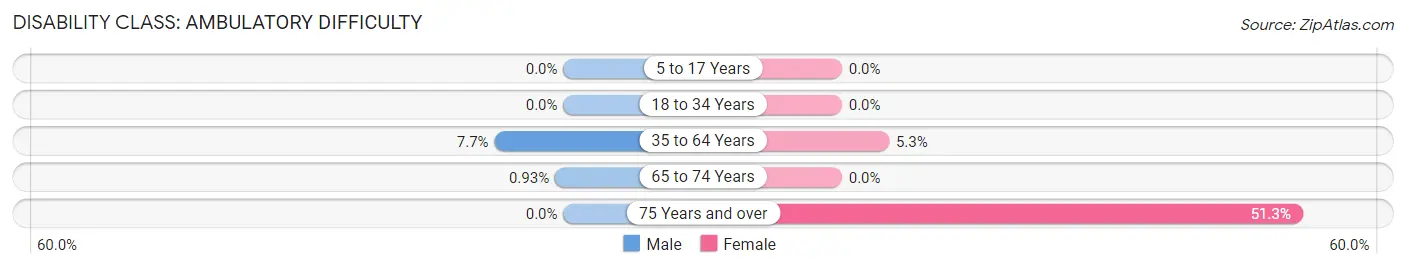
| Age Bracket | Male | Female |
| 5 to 17 Years | 0 (0.0%) | 0 (0.0%) |
| 18 to 34 Years | 0 (0.0%) | 0 (0.0%) |
| 35 to 64 Years | 36 (7.7%) | 20 (5.2%) |
| 65 to 74 Years | 1 (0.9%) | 0 (0.0%) |
| 75 Years and over | 0 (0.0%) | 58 (51.3%) |
Disability Class: Self-Care Difficulty
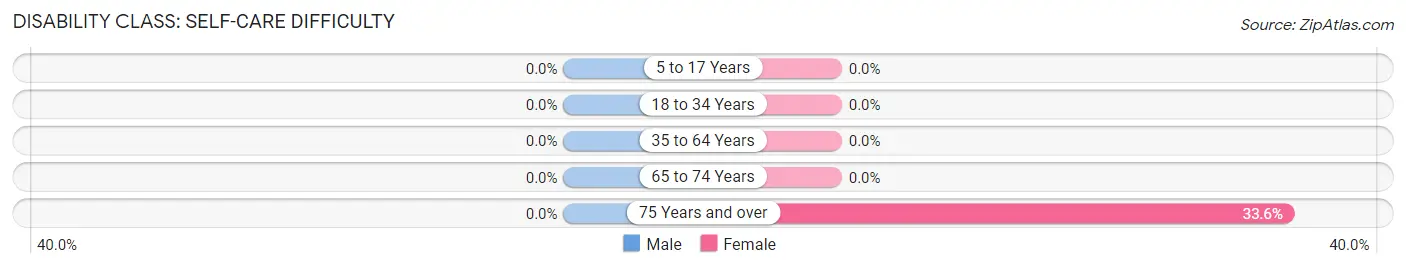
| Age Bracket | Male | Female |
| 5 to 17 Years | 0 (0.0%) | 0 (0.0%) |
| 18 to 34 Years | 0 (0.0%) | 0 (0.0%) |
| 35 to 64 Years | 0 (0.0%) | 0 (0.0%) |
| 65 to 74 Years | 0 (0.0%) | 0 (0.0%) |
| 75 Years and over | 0 (0.0%) | 38 (33.6%) |
Technology Access in Merlin
Computing Device Access in Merlin
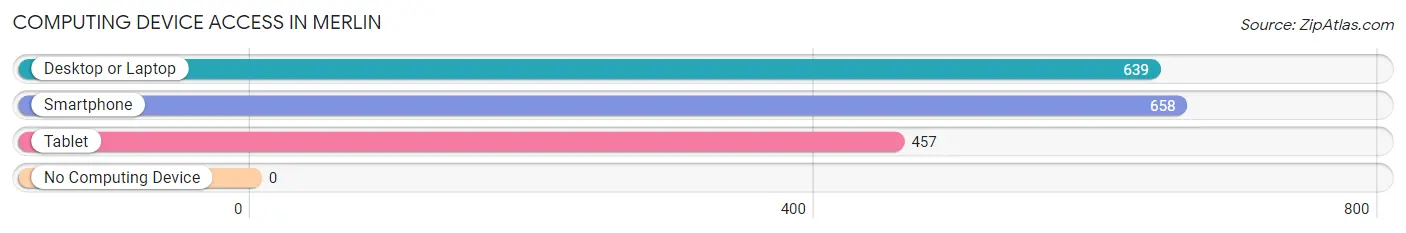
| Device Type | # Households | % Households |
| Desktop or Laptop | 639 | 91.9% |
| Smartphone | 658 | 94.7% |
| Tablet | 457 | 65.8% |
| No Computing Device | 0 | 0.0% |
| Total | 695 | 100.0% |
Internet Access in Merlin
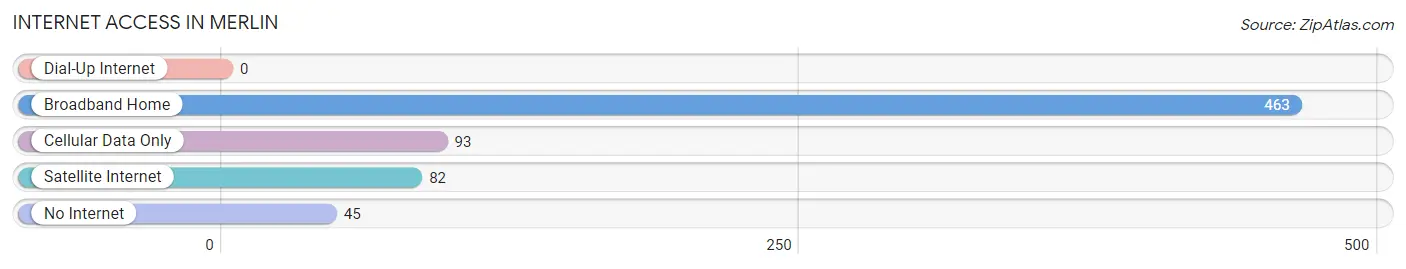
| Internet Type | # Households | % Households |
| Dial-Up Internet | 0 | 0.0% |
| Broadband Home | 463 | 66.6% |
| Cellular Data Only | 93 | 13.4% |
| Satellite Internet | 82 | 11.8% |
| No Internet | 45 | 6.5% |
| Total | 695 | 100.0% |
Merlin Summary
Merlin is a small unincorporated community located in Josephine County, Oregon. It is situated in the Rogue Valley, approximately 8 miles north of Grants Pass. The population of Merlin was estimated to be 1,845 in 2019.
History
Merlin was founded in 1884 by a group of settlers from the Midwest. The town was named after Merlin, a character from Arthurian legend. The first post office was established in 1885.
In the early 1900s, the town was a bustling center of commerce, with a variety of businesses, including a hotel, a general store, a blacksmith shop, and a sawmill. The town also had a school, a church, and a cemetery.
In the 1920s, the town began to decline as the timber industry moved away from the area. The population decreased and many of the businesses closed.
Geography
Merlin is located in the Rogue Valley, in the foothills of the Siskiyou Mountains. The town is situated at an elevation of 1,845 feet. The climate is mild, with warm summers and cool winters.
The town is surrounded by forests and is home to a variety of wildlife, including deer, elk, and black bears. The nearby Rogue River is a popular destination for fishing and rafting.
Economy
The economy of Merlin is largely based on agriculture and tourism. The town is home to several wineries and vineyards, as well as a variety of small businesses.
The nearby Rogue River is a popular destination for fishing and rafting, and the town is home to several campgrounds and RV parks.
Demographics
As of 2019, the population of Merlin was estimated to be 1,845. The racial makeup of the town was 94.3% White, 0.7% African American, 0.7% Native American, 0.7% Asian, 0.3% Pacific Islander, and 2.7% from other races.
The median household income in Merlin was $41,250, and the median family income was $45,000. The per capita income was $20,000. The unemployment rate was 6.2%.
Conclusion
Merlin is a small unincorporated community located in Josephine County, Oregon. It is situated in the Rogue Valley, approximately 8 miles north of Grants Pass. The population of Merlin was estimated to be 1,845 in 2019. The economy of Merlin is largely based on agriculture and tourism, and the town is home to several wineries and vineyards, as well as a variety of small businesses. The median household income in Merlin was $41,250, and the median family income was $45,000. The per capita income was $20,000. The unemployment rate was 6.2%.
Common Questions
What is Per Capita Income in Merlin?
Per Capita income in Merlin is $34,532.
What is the Median Family Income in Merlin?
Median Family Income in Merlin is $69,145.
What is the Median Household income in Merlin?
Median Household Income in Merlin is $65,670.
What is Income or Wage Gap in Merlin?
Income or Wage Gap in Merlin is 20.8%.
Women in Merlin earn 79.2 cents for every dollar earned by a man.
What is Inequality or Gini Index in Merlin?
Inequality or Gini Index in Merlin is 0.47.
What is the Total Population of Merlin?
Total Population of Merlin is 1,814.
What is the Total Male Population of Merlin?
Total Male Population of Merlin is 872.
What is the Total Female Population of Merlin?
Total Female Population of Merlin is 942.
What is the Ratio of Males per 100 Females in Merlin?
There are 92.57 Males per 100 Females in Merlin.
What is the Ratio of Females per 100 Males in Merlin?
There are 108.03 Females per 100 Males in Merlin.
What is the Median Population Age in Merlin?
Median Population Age in Merlin is 52.0 Years.
What is the Average Family Size in Merlin
Average Family Size in Merlin is 2.9 People.
What is the Average Household Size in Merlin
Average Household Size in Merlin is 2.6 People.
How Large is the Labor Force in Merlin?
There are 892 People in the Labor Forcein in Merlin.
What is the Percentage of People in the Labor Force in Merlin?
55.6% of People are in the Labor Force in Merlin.
What is the Unemployment Rate in Merlin?
Unemployment Rate in Merlin is 10.9%.