Zip Codes with the Highest Percentage of Population Employed in Administrative & Support Services in Grants Pass, OR
RELATED REPORTS & OPTIONS
Administrative & Support Services
Grants Pass
Compare Zip Codes
Map of Zip Codes with the Highest Percentage of Population Employed in Administrative & Support Services in Grants Pass
6.0%
6.7%
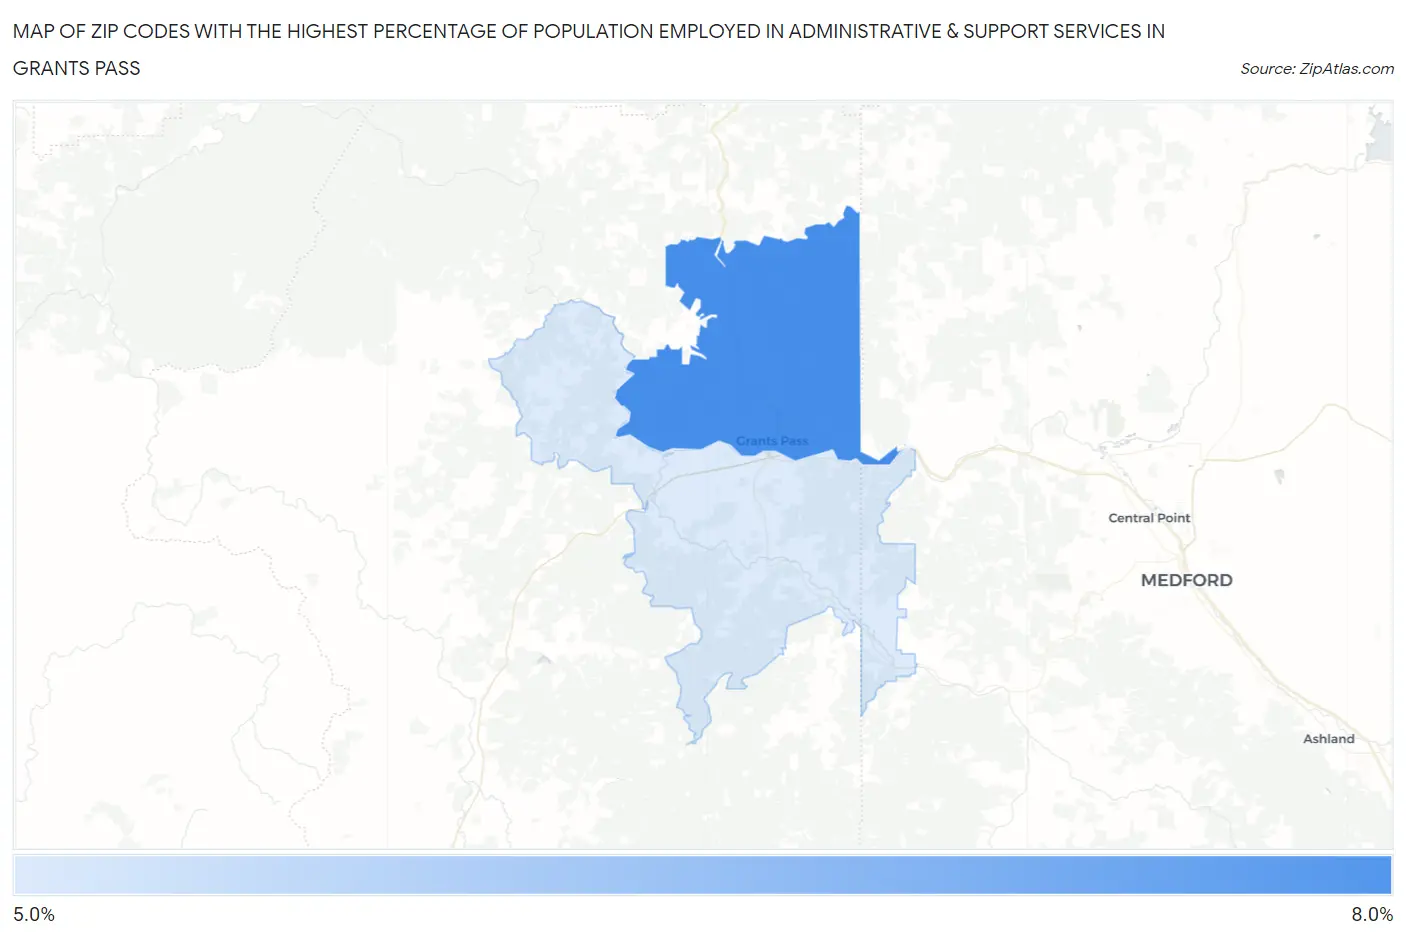
Zip Codes with the Highest Percentage of Population Employed in Administrative & Support Services in Grants Pass, OR
| Zip Code | % Employed | vs State | vs National | |
| 1. | 97526 | 6.7% | 3.9%(+2.73)#52 | 4.1%(+2.52)#3,668 |
| 2. | 97527 | 6.0% | 3.9%(+2.03)#66 | 4.1%(+1.82)#4,836 |
1
Common Questions
What are the Top Zip Codes with the Highest Percentage of Population Employed in Administrative & Support Services in Grants Pass, OR?
Top Zip Codes with the Highest Percentage of Population Employed in Administrative & Support Services in Grants Pass, OR are:
What zip code has the Highest Percentage of Population Employed in Administrative & Support Services in Grants Pass, OR?
97526 has the Highest Percentage of Population Employed in Administrative & Support Services in Grants Pass, OR with 6.7%.
What is the Percentage of Population Employed in Administrative & Support Services in Grants Pass, OR?
Percentage of Population Employed in Administrative & Support Services in Grants Pass is 6.7%.
What is the Percentage of Population Employed in Administrative & Support Services in Oregon?
Percentage of Population Employed in Administrative & Support Services in Oregon is 3.9%.
What is the Percentage of Population Employed in Administrative & Support Services in the United States?
Percentage of Population Employed in Administrative & Support Services in the United States is 4.1%.