Tri City, OR Map & Demographics
Tri City Map
Tri City Overview
$30,155
PER CAPITA INCOME
$61,075
AVG FAMILY INCOME
$53,766
AVG HOUSEHOLD INCOME
25.7%
WAGE / INCOME GAP [ % ]
74.3¢/ $1
WAGE / INCOME GAP [ $ ]
0.41
INEQUALITY / GINI INDEX
3,810
TOTAL POPULATION
2,098
MALE POPULATION
1,712
FEMALE POPULATION
122.55
MALES / 100 FEMALES
81.60
FEMALES / 100 MALES
53.8
MEDIAN AGE
2.9
AVG FAMILY SIZE
2.2
AVG HOUSEHOLD SIZE
1,393
LABOR FORCE [ PEOPLE ]
40.8%
PERCENT IN LABOR FORCE
13.7%
UNEMPLOYMENT RATE
Income in Tri City
Income Overview in Tri City
Per Capita Income in Tri City is $30,155, while median incomes of families and households are $61,075 and $53,766 respectively.
| Characteristic | Number | Measure |
| Per Capita Income | 3,810 | $30,155 |
| Median Family Income | 947 | $61,075 |
| Mean Family Income | 947 | $79,109 |
| Median Household Income | 1,691 | $53,766 |
| Mean Household Income | 1,691 | $65,676 |
| Income Deficit | 947 | $0 |
| Wage / Income Gap (%) | 3,810 | 25.68% |
| Wage / Income Gap ($) | 3,810 | 74.32¢ per $1 |
| Gini / Inequality Index | 3,810 | 0.41 |
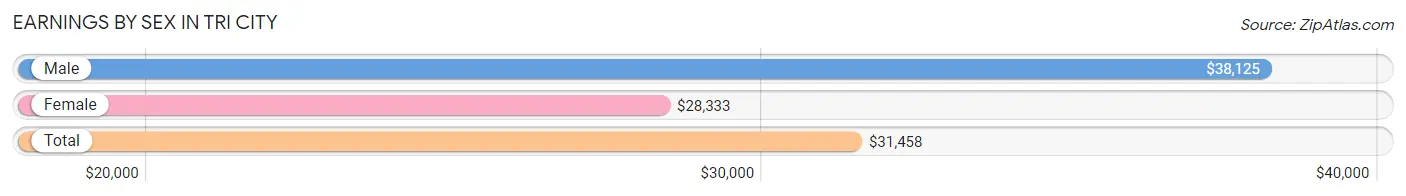
Earnings by Sex in Tri City
Average Earnings in Tri City are $31,458, $38,125 for men and $28,333 for women, a difference of 25.7%.
| Sex | Number | Average Earnings |
| Male | 633 (48.4%) | $38,125 |
| Female | 676 (51.6%) | $28,333 |
| Total | 1,309 (100.0%) | $31,458 |
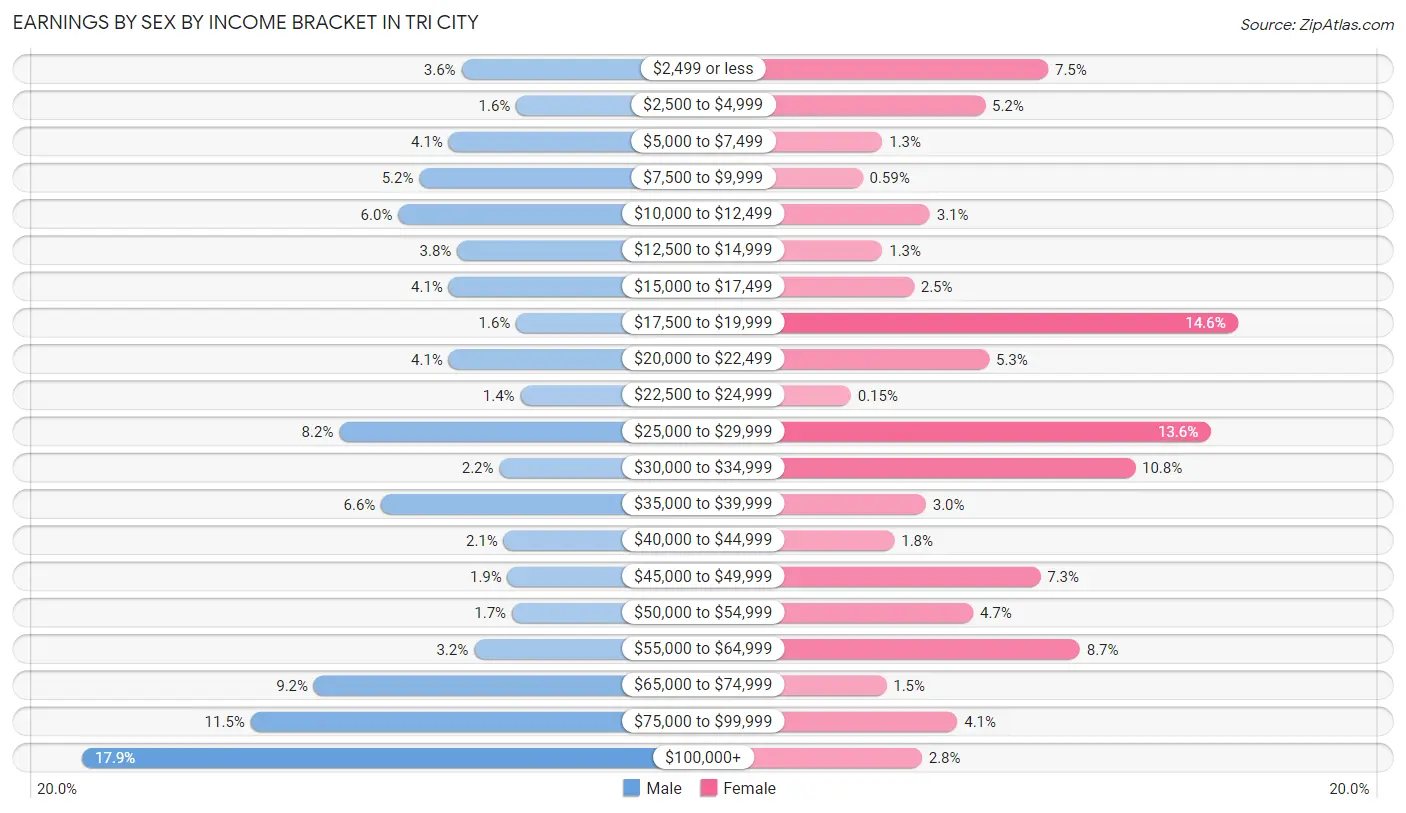
Earnings by Sex by Income Bracket in Tri City
The most common earnings brackets in Tri City are $100,000+ for men (113 | 17.8%) and $17,500 to $19,999 for women (99 | 14.6%).
| Income | Male | Female |
| $2,499 or less | 23 (3.6%) | 51 (7.5%) |
| $2,500 to $4,999 | 10 (1.6%) | 35 (5.2%) |
| $5,000 to $7,499 | 26 (4.1%) | 9 (1.3%) |
| $7,500 to $9,999 | 33 (5.2%) | 4 (0.6%) |
| $10,000 to $12,499 | 38 (6.0%) | 21 (3.1%) |
| $12,500 to $14,999 | 24 (3.8%) | 9 (1.3%) |
| $15,000 to $17,499 | 26 (4.1%) | 17 (2.5%) |
| $17,500 to $19,999 | 10 (1.6%) | 99 (14.6%) |
| $20,000 to $22,499 | 26 (4.1%) | 36 (5.3%) |
| $22,500 to $24,999 | 9 (1.4%) | 1 (0.2%) |
| $25,000 to $29,999 | 52 (8.2%) | 92 (13.6%) |
| $30,000 to $34,999 | 14 (2.2%) | 73 (10.8%) |
| $35,000 to $39,999 | 42 (6.6%) | 20 (3.0%) |
| $40,000 to $44,999 | 13 (2.1%) | 12 (1.8%) |
| $45,000 to $49,999 | 12 (1.9%) | 49 (7.2%) |
| $50,000 to $54,999 | 11 (1.7%) | 32 (4.7%) |
| $55,000 to $64,999 | 20 (3.2%) | 59 (8.7%) |
| $65,000 to $74,999 | 58 (9.2%) | 10 (1.5%) |
| $75,000 to $99,999 | 73 (11.5%) | 28 (4.1%) |
| $100,000+ | 113 (17.8%) | 19 (2.8%) |
| Total | 633 (100.0%) | 676 (100.0%) |
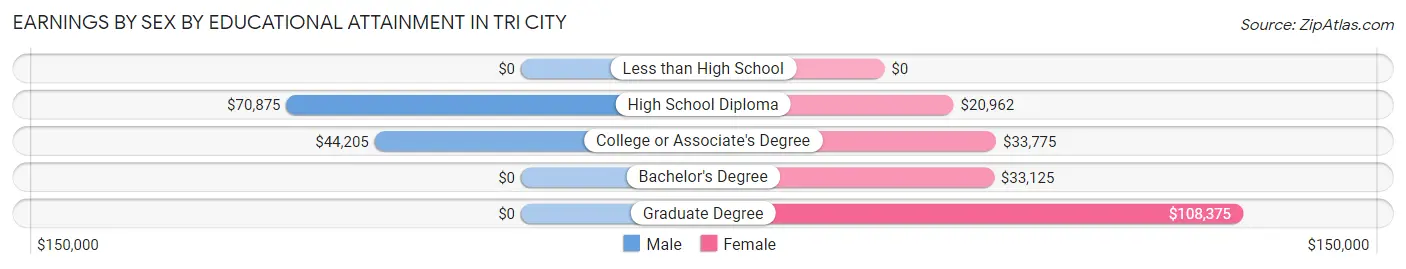
Earnings by Sex by Educational Attainment in Tri City
Average earnings in Tri City are $45,833 for men and $32,951 for women, a difference of 28.1%. Men with an educational attainment of high school diploma enjoy the highest average annual earnings of $70,875, while those with college or associate's degree education earn the least with $44,205. Women with an educational attainment of graduate degree earn the most with the average annual earnings of $108,375, while those with high school diploma education have the smallest earnings of $20,962.
| Educational Attainment | Male Income | Female Income |
| Less than High School | - | - |
| High School Diploma | $70,875 | $20,962 |
| College or Associate's Degree | $44,205 | $33,775 |
| Bachelor's Degree | - | - |
| Graduate Degree | - | - |
| Total | $45,833 | $32,951 |
Family Income in Tri City
Family Income Brackets in Tri City
According to the Tri City family income data, there are 270 families falling into the $50,000 to $74,999 income range, which is the most common income bracket and makes up 28.5% of all families. Conversely, the $10,000 to $14,999 income bracket is the least frequent group with only 5 families (0.5%) belonging to this category.
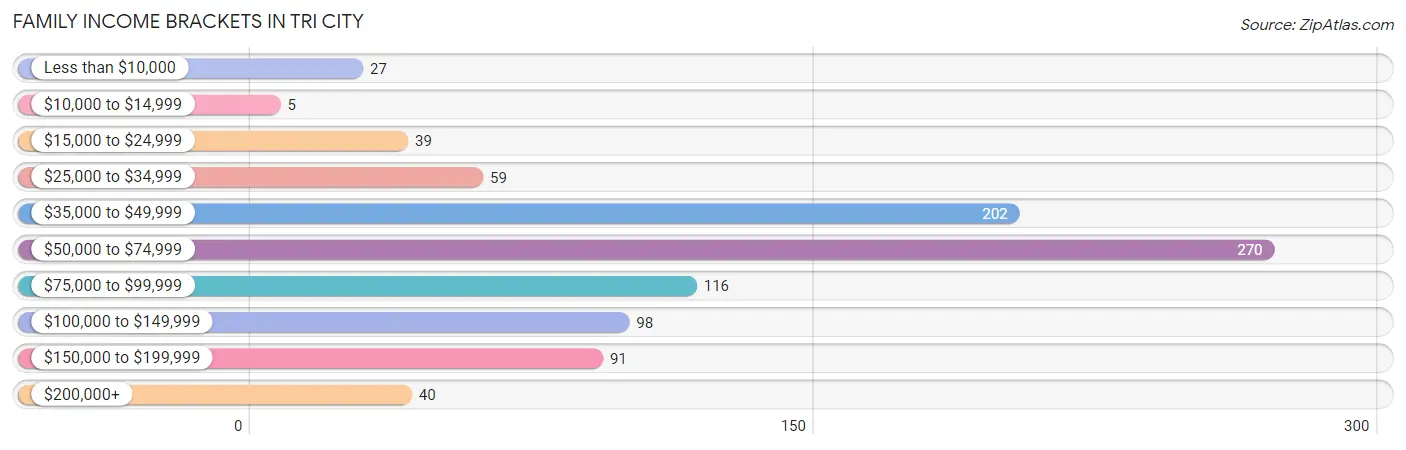
| Income Bracket | # Families | % Families |
| Less than $10,000 | 27 | 2.9% |
| $10,000 to $14,999 | 5 | 0.5% |
| $15,000 to $24,999 | 39 | 4.1% |
| $25,000 to $34,999 | 59 | 6.2% |
| $35,000 to $49,999 | 202 | 21.3% |
| $50,000 to $74,999 | 270 | 28.5% |
| $75,000 to $99,999 | 116 | 12.2% |
| $100,000 to $149,999 | 98 | 10.3% |
| $150,000 to $199,999 | 91 | 9.6% |
| $200,000+ | 40 | 4.2% |
Family Income by Famaliy Size in Tri City
6-person families (48 | 5.1%) account for the highest median family income in Tri City with $173,000 per family, while 6-person families (48 | 5.1%) have the highest median income of $28,833 per family member.
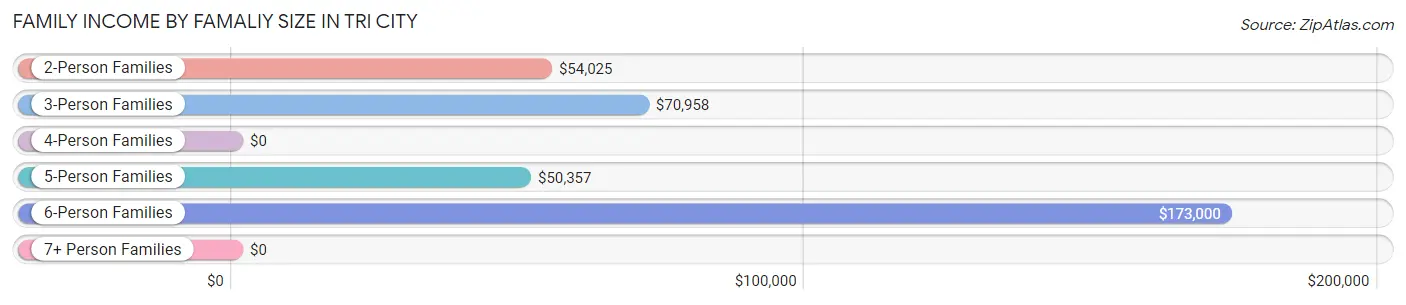
| Income Bracket | # Families | Median Income |
| 2-Person Families | 574 (60.6%) | $54,025 |
| 3-Person Families | 201 (21.2%) | $70,958 |
| 4-Person Families | 92 (9.7%) | $0 |
| 5-Person Families | 24 (2.5%) | $50,357 |
| 6-Person Families | 48 (5.1%) | $173,000 |
| 7+ Person Families | 8 (0.8%) | $0 |
| Total | 947 (100.0%) | $61,075 |
Family Income by Number of Earners in Tri City
The median family income in Tri City is $61,075, with families comprising 3+ earners (155) having the highest median family income of $181,197, while families with no earners (447) have the lowest median family income of $47,180, accounting for 16.4% and 47.2% of families, respectively.
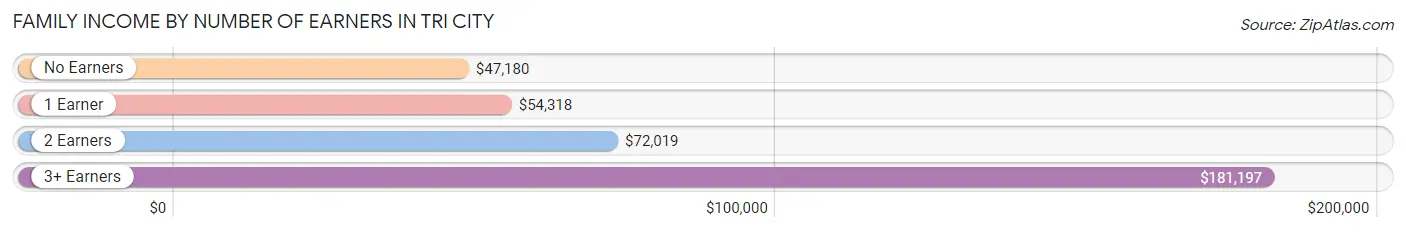
| Number of Earners | # Families | Median Income |
| No Earners | 447 (47.2%) | $47,180 |
| 1 Earner | 232 (24.5%) | $54,318 |
| 2 Earners | 113 (11.9%) | $72,019 |
| 3+ Earners | 155 (16.4%) | $181,197 |
| Total | 947 (100.0%) | $61,075 |
Household Income in Tri City
Household Income Brackets in Tri City
With 468 households falling in the category, the $50,000 to $74,999 income range is the most frequent in Tri City, accounting for 27.7% of all households. In contrast, only 15 households (0.9%) fall into the $10,000 to $14,999 income bracket, making it the least populous group.
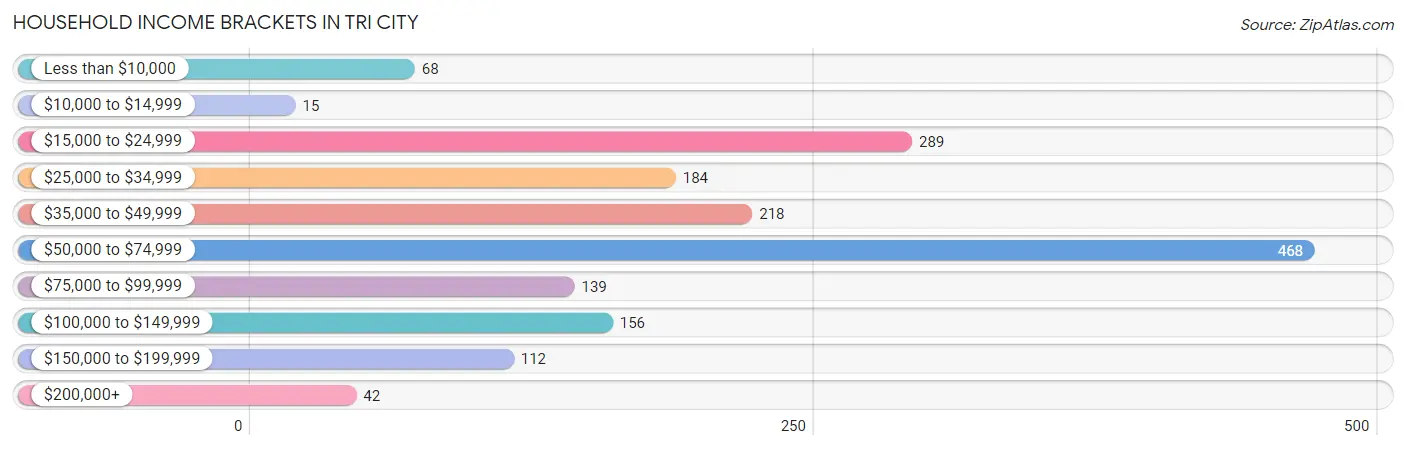
| Income Bracket | # Households | % Households |
| Less than $10,000 | 68 | 4.0% |
| $10,000 to $14,999 | 15 | 0.9% |
| $15,000 to $24,999 | 289 | 17.1% |
| $25,000 to $34,999 | 184 | 10.9% |
| $35,000 to $49,999 | 218 | 12.9% |
| $50,000 to $74,999 | 468 | 27.7% |
| $75,000 to $99,999 | 139 | 8.2% |
| $100,000 to $149,999 | 156 | 9.2% |
| $150,000 to $199,999 | 112 | 6.6% |
| $200,000+ | 42 | 2.5% |
Household Income by Householder Age in Tri City
The median household income in Tri City is $53,766, with the highest median household income of $56,927 found in the 45 to 64 years age bracket for the primary householder. A total of 563 households (33.3%) fall into this category. Meanwhile, the 15 to 24 years age bracket for the primary householder has the lowest median household income of $0, with 14 households (0.8%) in this group.
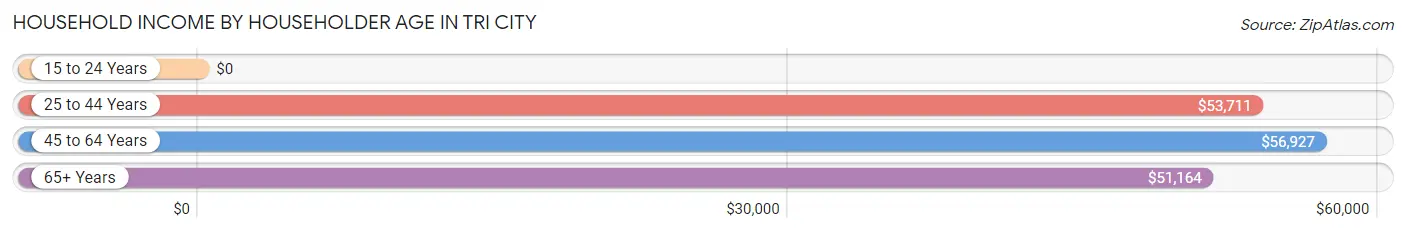
| Income Bracket | # Households | Median Income |
| 15 to 24 Years | 14 (0.8%) | $0 |
| 25 to 44 Years | 237 (14.0%) | $53,711 |
| 45 to 64 Years | 563 (33.3%) | $56,927 |
| 65+ Years | 877 (51.9%) | $51,164 |
| Total | 1,691 (100.0%) | $53,766 |
Poverty in Tri City
Income Below Poverty by Sex and Age in Tri City
With 10.6% poverty level for males and 8.9% for females among the residents of Tri City, 6 to 11 year old males and 12 to 14 year old females are the most vulnerable to poverty, with 49 males (47.1%) and 1 females (100.0%) in their respective age groups living below the poverty level.
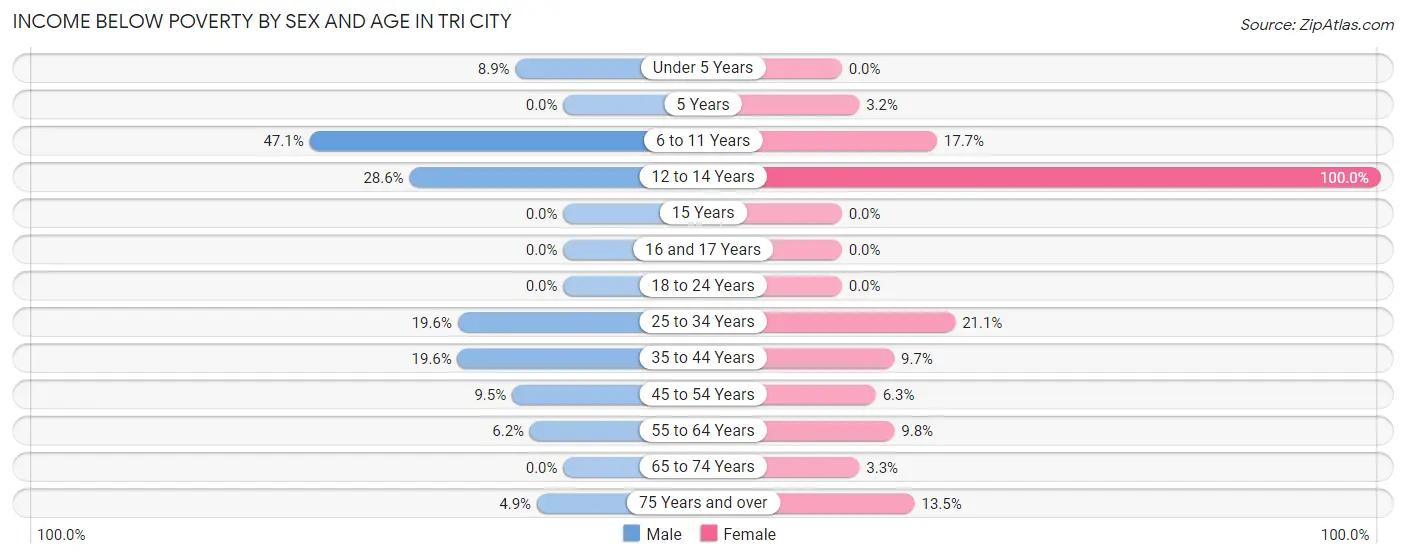
| Age Bracket | Male | Female |
| Under 5 Years | 8 (8.9%) | 0 (0.0%) |
| 5 Years | 0 (0.0%) | 1 (3.2%) |
| 6 to 11 Years | 49 (47.1%) | 9 (17.6%) |
| 12 to 14 Years | 22 (28.6%) | 1 (100.0%) |
| 15 Years | 0 (0.0%) | 0 (0.0%) |
| 16 and 17 Years | 0 (0.0%) | 0 (0.0%) |
| 18 to 24 Years | 0 (0.0%) | 0 (0.0%) |
| 25 to 34 Years | 49 (19.6%) | 48 (21.0%) |
| 35 to 44 Years | 42 (19.6%) | 13 (9.7%) |
| 45 to 54 Years | 24 (9.5%) | 15 (6.3%) |
| 55 to 64 Years | 19 (6.2%) | 31 (9.8%) |
| 65 to 74 Years | 0 (0.0%) | 14 (3.3%) |
| 75 Years and over | 10 (4.9%) | 20 (13.5%) |
| Total | 223 (10.6%) | 152 (8.9%) |
Income Above Poverty by Sex and Age in Tri City
According to the poverty statistics in Tri City, males aged 5 years and females aged 15 years are the age groups that are most secure financially, with 100.0% of males and 100.0% of females in these age groups living above the poverty line.
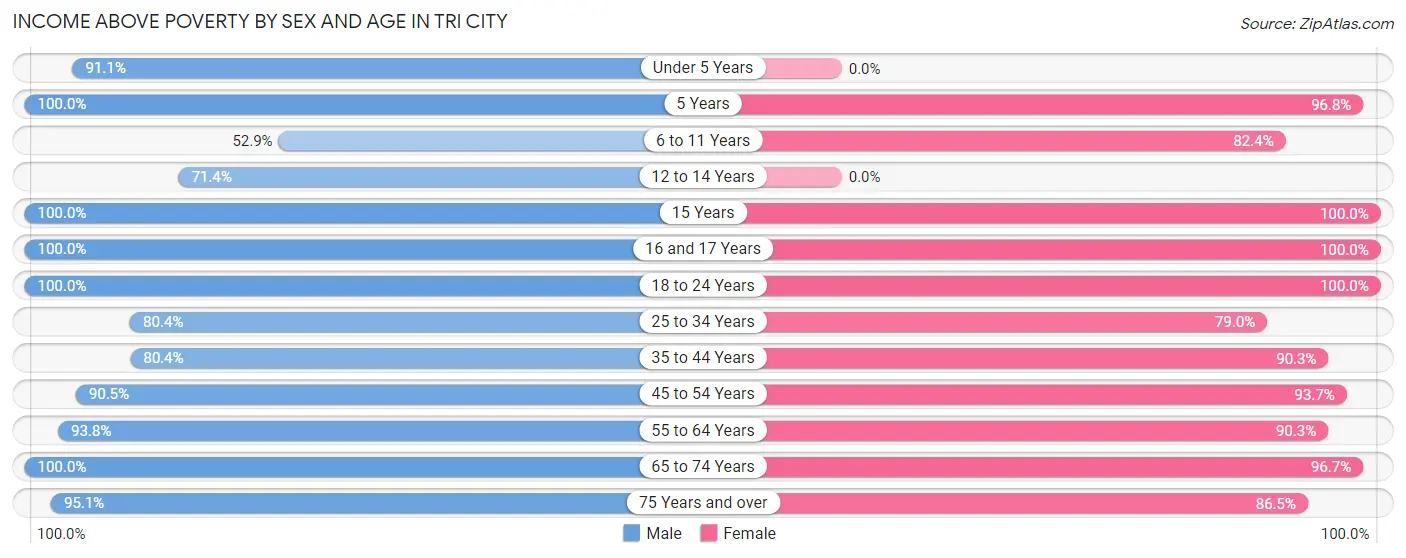
| Age Bracket | Male | Female |
| Under 5 Years | 82 (91.1%) | 0 (0.0%) |
| 5 Years | 13 (100.0%) | 30 (96.8%) |
| 6 to 11 Years | 55 (52.9%) | 42 (82.4%) |
| 12 to 14 Years | 55 (71.4%) | 0 (0.0%) |
| 15 Years | 21 (100.0%) | 9 (100.0%) |
| 16 and 17 Years | 25 (100.0%) | 48 (100.0%) |
| 18 to 24 Years | 65 (100.0%) | 76 (100.0%) |
| 25 to 34 Years | 201 (80.4%) | 180 (78.9%) |
| 35 to 44 Years | 172 (80.4%) | 121 (90.3%) |
| 45 to 54 Years | 228 (90.5%) | 223 (93.7%) |
| 55 to 64 Years | 287 (93.8%) | 287 (90.2%) |
| 65 to 74 Years | 477 (100.0%) | 416 (96.7%) |
| 75 Years and over | 194 (95.1%) | 128 (86.5%) |
| Total | 1,875 (89.4%) | 1,560 (91.1%) |
Income Below Poverty Among Married-Couple Families in Tri City
The poverty statistics for married-couple families in Tri City show that 2.1% or 15 of the total 721 families live below the poverty line. Families with 1 or 2 children have the highest poverty rate of 4.3%, comprising of 3 families. On the other hand, families with 3 or 4 children have the lowest poverty rate of 0.0%, which includes 0 families.
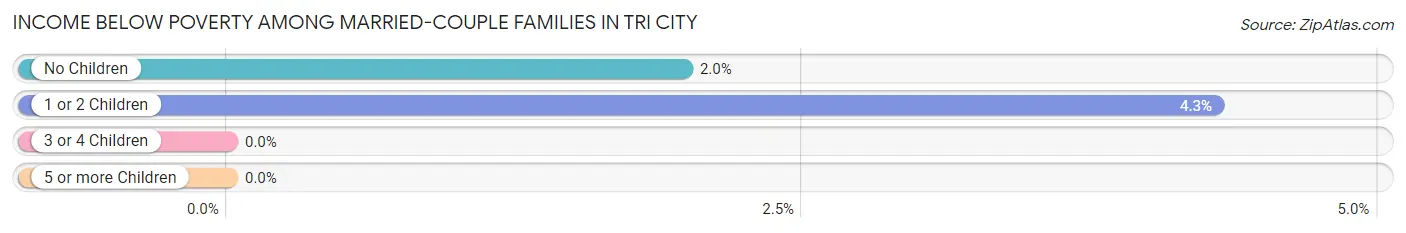
| Children | Above Poverty | Below Poverty |
| No Children | 595 (98.0%) | 12 (2.0%) |
| 1 or 2 Children | 67 (95.7%) | 3 (4.3%) |
| 3 or 4 Children | 36 (100.0%) | 0 (0.0%) |
| 5 or more Children | 8 (100.0%) | 0 (0.0%) |
| Total | 706 (97.9%) | 15 (2.1%) |
Income Below Poverty Among Single-Parent Households in Tri City
According to the poverty data in Tri City, 2.5% or 1 single-father households and 15.6% or 29 single-mother households are living below the poverty line. Among single-father households, those with 1 or 2 children have the highest poverty rate, with 1 households (2.7%) experiencing poverty. Likewise, among single-mother households, those with 3 or 4 children have the highest poverty rate, with 19 households (100.0%) falling below the poverty line.
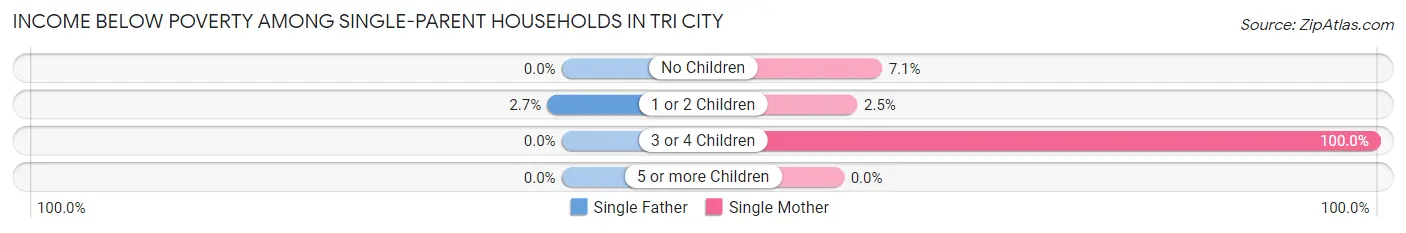
| Children | Single Father | Single Mother |
| No Children | 0 (0.0%) | 9 (7.1%) |
| 1 or 2 Children | 1 (2.7%) | 1 (2.5%) |
| 3 or 4 Children | 0 (0.0%) | 19 (100.0%) |
| 5 or more Children | 0 (0.0%) | 0 (0.0%) |
| Total | 1 (2.5%) | 29 (15.6%) |
Income Below Poverty Among Married-Couple vs Single-Parent Households in Tri City
The poverty data for Tri City shows that 15 of the married-couple family households (2.1%) and 30 of the single-parent households (13.3%) are living below the poverty level. Within the married-couple family households, those with 1 or 2 children have the highest poverty rate, with 3 households (4.3%) falling below the poverty line. Among the single-parent households, those with 3 or 4 children have the highest poverty rate, with 19 household (90.5%) living below poverty.
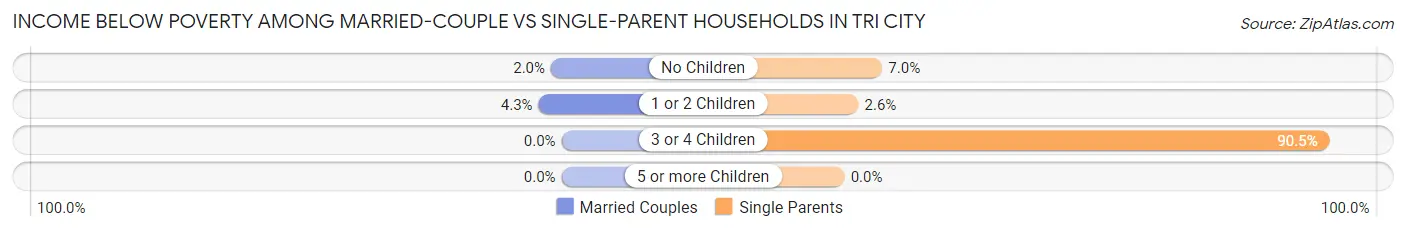
| Children | Married-Couple Families | Single-Parent Households |
| No Children | 12 (2.0%) | 9 (7.0%) |
| 1 or 2 Children | 3 (4.3%) | 2 (2.6%) |
| 3 or 4 Children | 0 (0.0%) | 19 (90.5%) |
| 5 or more Children | 0 (0.0%) | 0 (0.0%) |
| Total | 15 (2.1%) | 30 (13.3%) |
Race in Tri City
The most populous races in Tri City are White / Caucasian (3,370 | 88.4%), Two or more Races (294 | 7.7%), and Hispanic or Latino (235 | 6.2%).
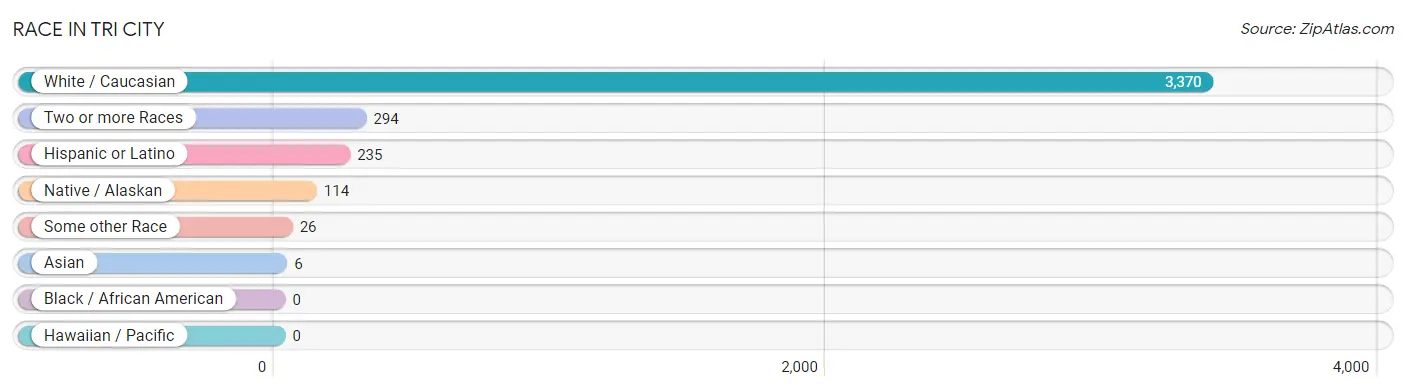
| Race | # Population | % Population |
| Asian | 6 | 0.2% |
| Black / African American | 0 | 0.0% |
| Hawaiian / Pacific | 0 | 0.0% |
| Hispanic or Latino | 235 | 6.2% |
| Native / Alaskan | 114 | 3.0% |
| White / Caucasian | 3,370 | 88.4% |
| Two or more Races | 294 | 7.7% |
| Some other Race | 26 | 0.7% |
| Total | 3,810 | 100.0% |
Ancestry in Tri City
The most populous ancestries reported in Tri City are German (879 | 23.1%), Irish (455 | 11.9%), English (417 | 10.9%), American (292 | 7.7%), and Norwegian (197 | 5.2%), together accounting for 58.8% of all Tri City residents.
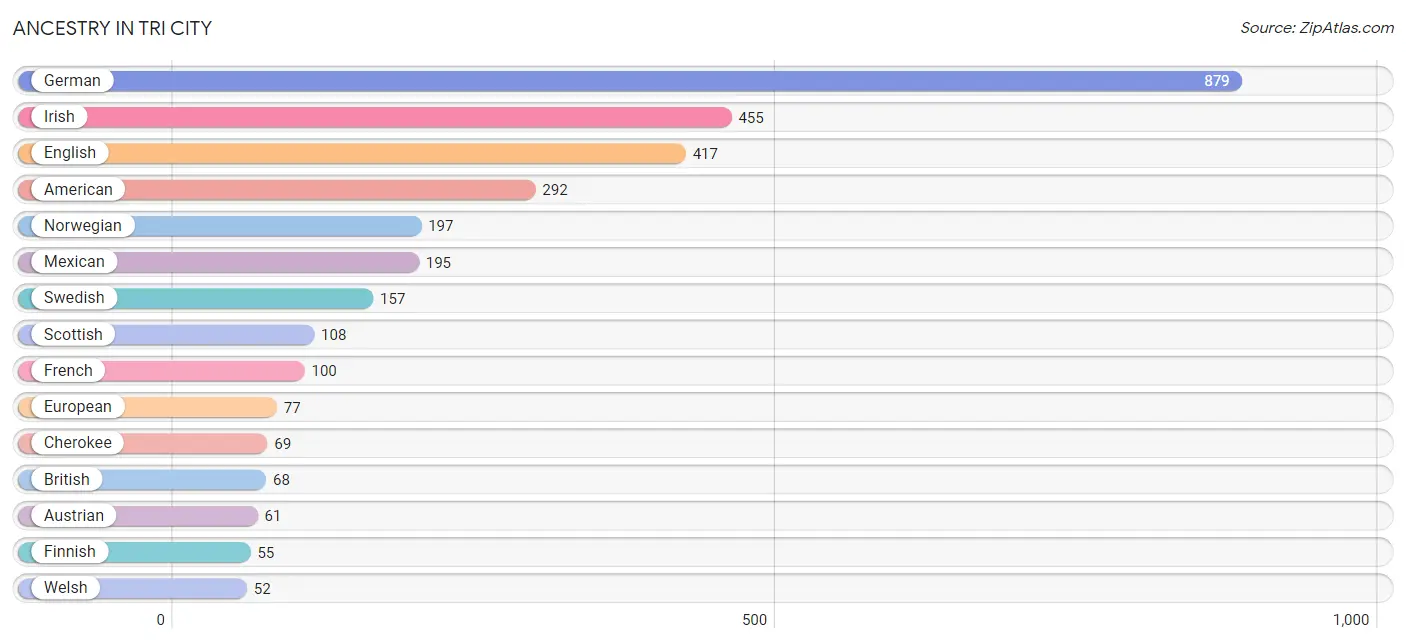
| Ancestry | # Population | % Population |
| American | 292 | 7.7% |
| Austrian | 61 | 1.6% |
| Belgian | 16 | 0.4% |
| British | 68 | 1.8% |
| Cherokee | 69 | 1.8% |
| Chickasaw | 45 | 1.2% |
| Danish | 30 | 0.8% |
| Dutch | 44 | 1.1% |
| English | 417 | 10.9% |
| European | 77 | 2.0% |
| Finnish | 55 | 1.4% |
| French | 100 | 2.6% |
| French American Indian | 2 | 0.1% |
| French Canadian | 2 | 0.1% |
| German | 879 | 23.1% |
| Greek | 10 | 0.3% |
| Irish | 455 | 11.9% |
| Italian | 42 | 1.1% |
| Korean | 41 | 1.1% |
| Mexican | 195 | 5.1% |
| Northern European | 8 | 0.2% |
| Norwegian | 197 | 5.2% |
| Peruvian | 40 | 1.1% |
| Polish | 30 | 0.8% |
| Portuguese | 31 | 0.8% |
| Russian | 23 | 0.6% |
| Scotch-Irish | 7 | 0.2% |
| Scottish | 108 | 2.8% |
| Sioux | 12 | 0.3% |
| South American | 40 | 1.1% |
| Swedish | 157 | 4.1% |
| Thai | 6 | 0.2% |
| Welsh | 52 | 1.4% |
| Yaqui | 16 | 0.4% | View All 34 Rows |
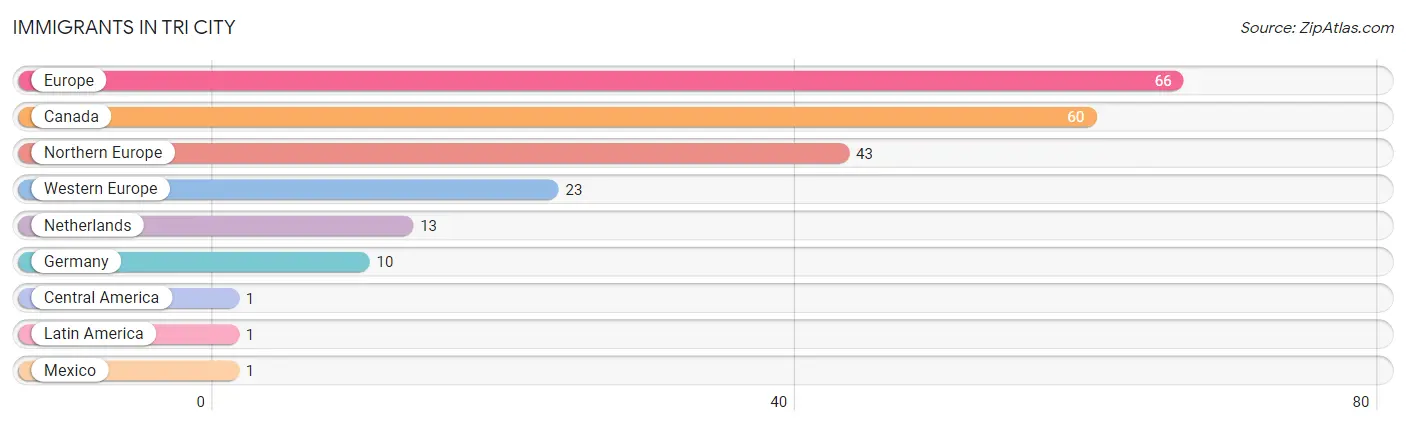
Immigrants in Tri City
The most numerous immigrant groups reported in Tri City came from Europe (66 | 1.7%), Canada (60 | 1.6%), Northern Europe (43 | 1.1%), Western Europe (23 | 0.6%), and Netherlands (13 | 0.3%), together accounting for 5.4% of all Tri City residents.
| Immigration Origin | # Population | % Population |
| Canada | 60 | 1.6% |
| Central America | 1 | 0.0% |
| Europe | 66 | 1.7% |
| Germany | 10 | 0.3% |
| Latin America | 1 | 0.0% |
| Mexico | 1 | 0.0% |
| Netherlands | 13 | 0.3% |
| Northern Europe | 43 | 1.1% |
| Western Europe | 23 | 0.6% | View All 9 Rows |
Sex and Age in Tri City
Sex and Age in Tri City
The most populous age groups in Tri City are 70 to 74 Years (273 | 13.0%) for men and 65 to 69 Years (240 | 14.0%) for women.
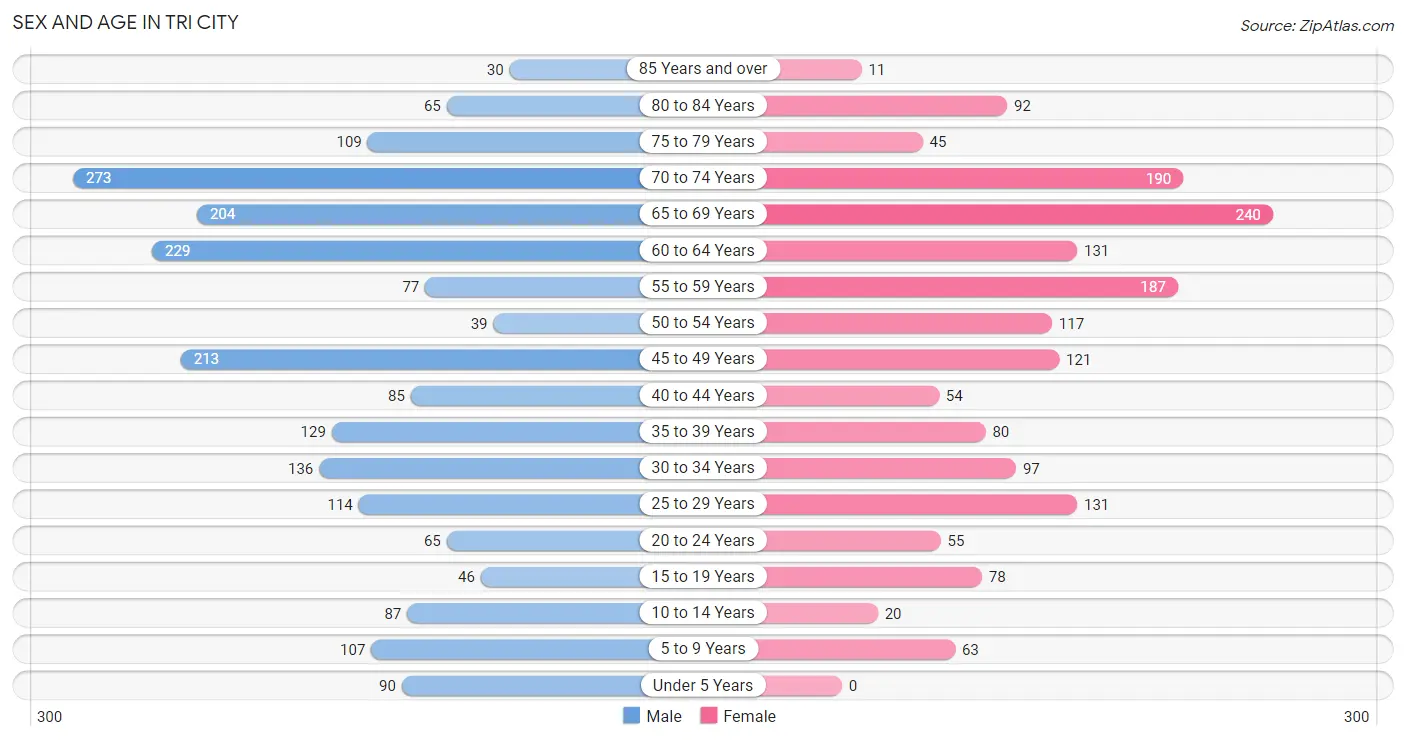
| Age Bracket | Male | Female |
| Under 5 Years | 90 (4.3%) | 0 (0.0%) |
| 5 to 9 Years | 107 (5.1%) | 63 (3.7%) |
| 10 to 14 Years | 87 (4.2%) | 20 (1.2%) |
| 15 to 19 Years | 46 (2.2%) | 78 (4.6%) |
| 20 to 24 Years | 65 (3.1%) | 55 (3.2%) |
| 25 to 29 Years | 114 (5.4%) | 131 (7.6%) |
| 30 to 34 Years | 136 (6.5%) | 97 (5.7%) |
| 35 to 39 Years | 129 (6.1%) | 80 (4.7%) |
| 40 to 44 Years | 85 (4.1%) | 54 (3.2%) |
| 45 to 49 Years | 213 (10.2%) | 121 (7.1%) |
| 50 to 54 Years | 39 (1.9%) | 117 (6.8%) |
| 55 to 59 Years | 77 (3.7%) | 187 (10.9%) |
| 60 to 64 Years | 229 (10.9%) | 131 (7.6%) |
| 65 to 69 Years | 204 (9.7%) | 240 (14.0%) |
| 70 to 74 Years | 273 (13.0%) | 190 (11.1%) |
| 75 to 79 Years | 109 (5.2%) | 45 (2.6%) |
| 80 to 84 Years | 65 (3.1%) | 92 (5.4%) |
| 85 Years and over | 30 (1.4%) | 11 (0.6%) |
| Total | 2,098 (100.0%) | 1,712 (100.0%) |
Families and Households in Tri City
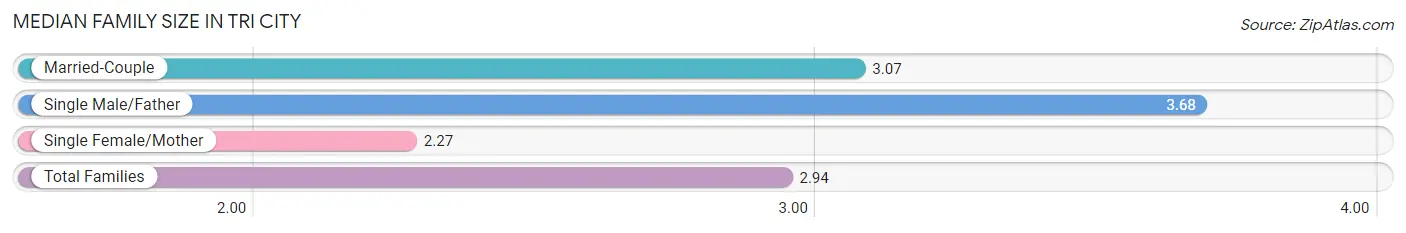
Median Family Size in Tri City
The median family size in Tri City is 2.94 persons per family, with single male/father families (40 | 4.2%) accounting for the largest median family size of 3.68 persons per family. On the other hand, single female/mother families (186 | 19.6%) represent the smallest median family size with 2.27 persons per family.
| Family Type | # Families | Family Size |
| Married-Couple | 721 (76.1%) | 3.07 |
| Single Male/Father | 40 (4.2%) | 3.68 |
| Single Female/Mother | 186 (19.6%) | 2.27 |
| Total Families | 947 (100.0%) | 2.94 |
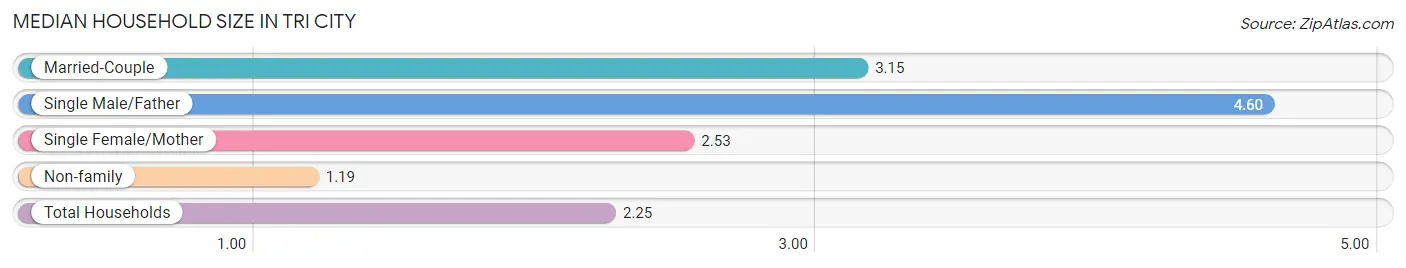
Median Household Size in Tri City
The median household size in Tri City is 2.25 persons per household, with single male/father households (40 | 2.4%) accounting for the largest median household size of 4.6 persons per household. non-family households (744 | 44.0%) represent the smallest median household size with 1.19 persons per household.
| Household Type | # Households | Household Size |
| Married-Couple | 721 (42.6%) | 3.15 |
| Single Male/Father | 40 (2.4%) | 4.60 |
| Single Female/Mother | 186 (11.0%) | 2.53 |
| Non-family | 744 (44.0%) | 1.19 |
| Total Households | 1,691 (100.0%) | 2.25 |
Household Size by Marriage Status in Tri City
Out of a total of 1,691 households in Tri City, 947 (56.0%) are family households, while 744 (44.0%) are nonfamily households. The most numerous type of family households are 2-person households, comprising 531, and the most common type of nonfamily households are 1-person households, comprising 605.
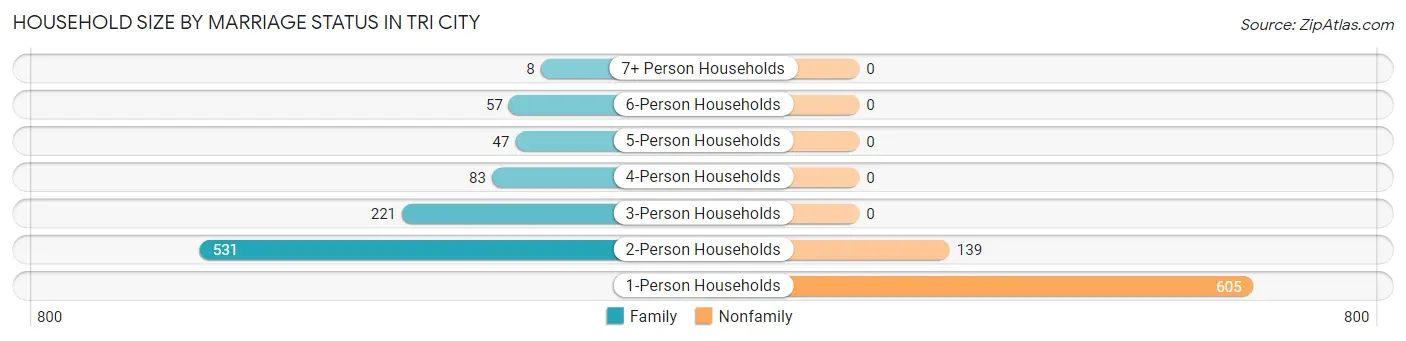
| Household Size | Family Households | Nonfamily Households |
| 1-Person Households | - | 605 (35.8%) |
| 2-Person Households | 531 (31.4%) | 139 (8.2%) |
| 3-Person Households | 221 (13.1%) | 0 (0.0%) |
| 4-Person Households | 83 (4.9%) | 0 (0.0%) |
| 5-Person Households | 47 (2.8%) | 0 (0.0%) |
| 6-Person Households | 57 (3.4%) | 0 (0.0%) |
| 7+ Person Households | 8 (0.5%) | 0 (0.0%) |
| Total | 947 (56.0%) | 744 (44.0%) |
Female Fertility in Tri City
Fertility by Age in Tri City
Average fertility rate in Tri City is 36.0 births per 1,000 women. Women in the age bracket of 20 to 34 years have the highest fertility rate with 71.0 births per 1,000 women. Women in the age bracket of 20 to 34 years acount for 87.0% of all women with births.
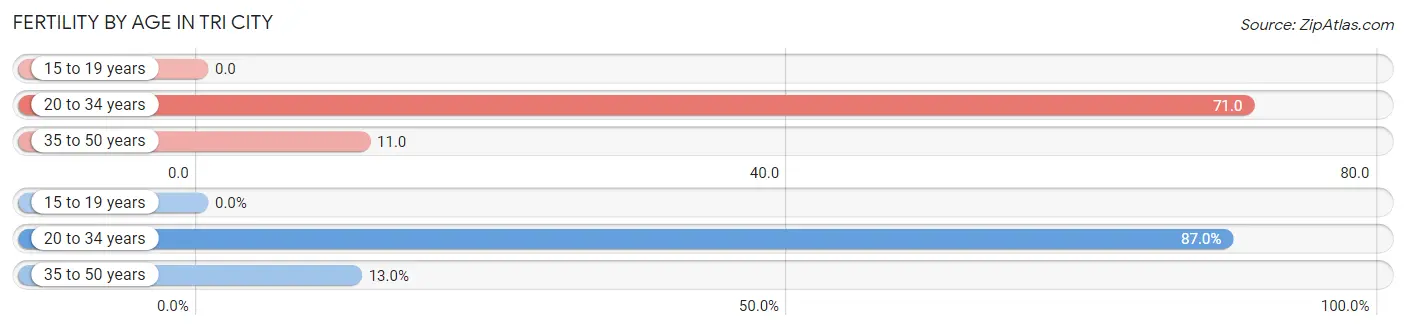
| Age Bracket | Women with Births | Births / 1,000 Women |
| 15 to 19 years | 0 (0.0%) | 0.0 |
| 20 to 34 years | 20 (87.0%) | 71.0 |
| 35 to 50 years | 3 (13.0%) | 11.0 |
| Total | 23 (100.0%) | 36.0 |
Fertility by Age by Marriage Status in Tri City
95.7% of women with births (23) in Tri City are married. The highest percentage of unmarried women with births falls into 20 to 34 years age bracket with 5.0% of them unmarried at the time of birth, while the lowest percentage of unmarried women with births belong to 35 to 50 years age bracket with 0.0% of them unmarried.
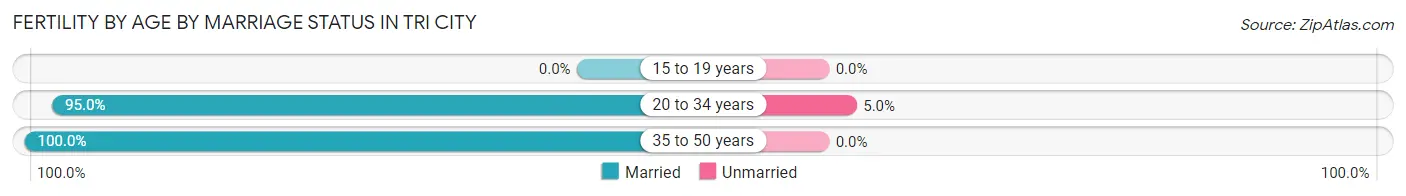
| Age Bracket | Married | Unmarried |
| 15 to 19 years | 0 (0.0%) | 0 (0.0%) |
| 20 to 34 years | 19 (95.0%) | 1 (5.0%) |
| 35 to 50 years | 3 (100.0%) | 0 (0.0%) |
| Total | 22 (95.7%) | 1 (4.3%) |
Fertility by Education in Tri City
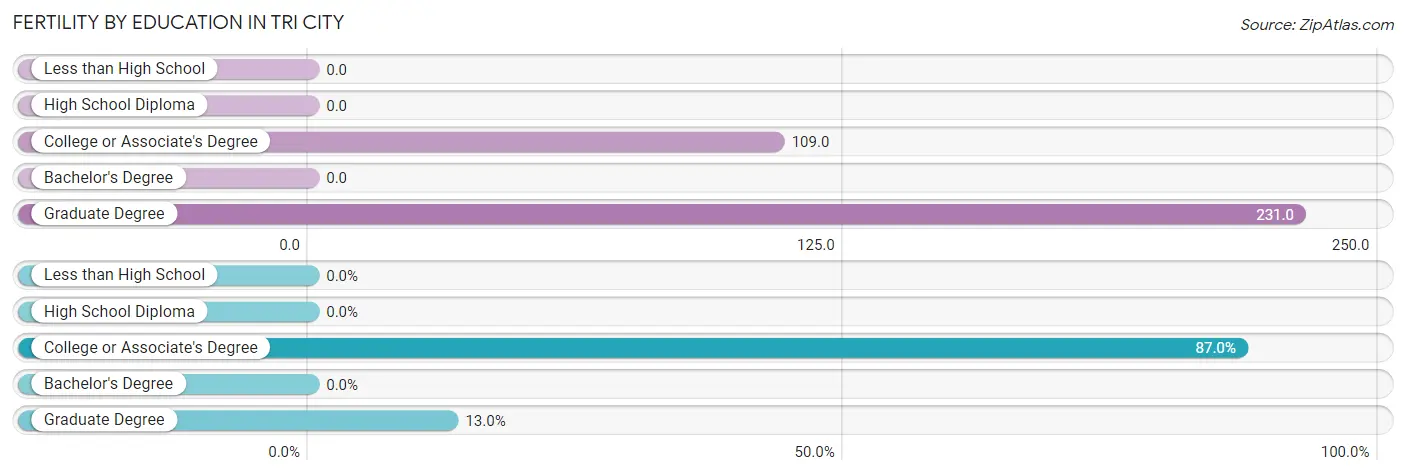
| Educational Attainment | Women with Births | Births / 1,000 Women |
| Less than High School | 0 (0.0%) | 0.0 |
| High School Diploma | 0 (0.0%) | 0.0 |
| College or Associate's Degree | 20 (87.0%) | 109.0 |
| Bachelor's Degree | 0 (0.0%) | 0.0 |
| Graduate Degree | 3 (13.0%) | 231.0 |
| Total | 23 (100.0%) | 36.0 |
Fertility by Education by Marriage Status in Tri City
4.3% of women with births in Tri City are unmarried. Women with the educational attainment of graduate degree are most likely to be married with 100.0% of them married at childbirth, while women with the educational attainment of college or associate's degree are least likely to be married with 5.0% of them unmarried at childbirth.
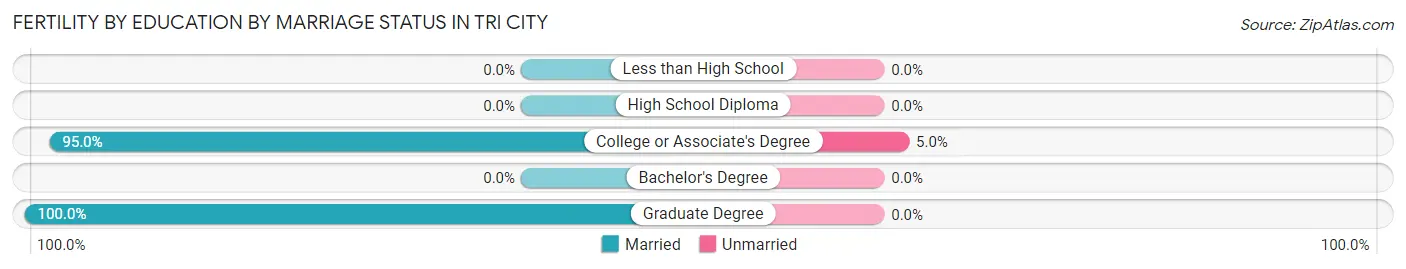
| Educational Attainment | Married | Unmarried |
| Less than High School | 0 (0.0%) | 0 (0.0%) |
| High School Diploma | 0 (0.0%) | 0 (0.0%) |
| College or Associate's Degree | 19 (95.0%) | 1 (5.0%) |
| Bachelor's Degree | 0 (0.0%) | 0 (0.0%) |
| Graduate Degree | 3 (100.0%) | 0 (0.0%) |
| Total | 22 (95.7%) | 1 (4.3%) |
Employment Characteristics in Tri City
Employment by Class of Employer in Tri City
Among the 1,162 employed individuals in Tri City, private company employees (840 | 72.3%), not-for-profit organizations (93 | 8.0%), and self-employed (not incorporated) (70 | 6.0%) make up the most common classes of employment.
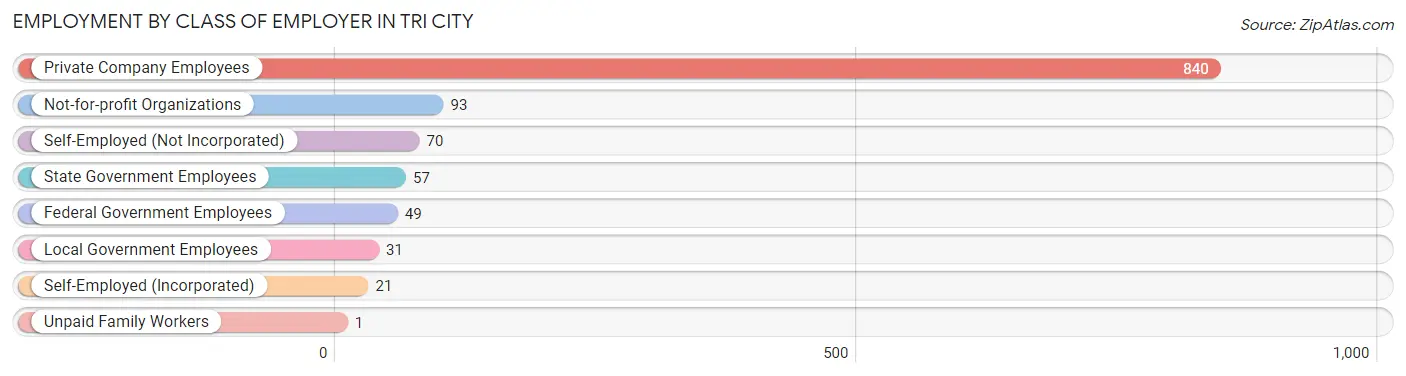
| Employer Class | # Employees | % Employees |
| Private Company Employees | 840 | 72.3% |
| Self-Employed (Incorporated) | 21 | 1.8% |
| Self-Employed (Not Incorporated) | 70 | 6.0% |
| Not-for-profit Organizations | 93 | 8.0% |
| Local Government Employees | 31 | 2.7% |
| State Government Employees | 57 | 4.9% |
| Federal Government Employees | 49 | 4.2% |
| Unpaid Family Workers | 1 | 0.1% |
| Total | 1,162 | 100.0% |
Employment Status by Age in Tri City
According to the labor force statistics for Tri City, out of the total population over 16 years of age (3,413), 40.8% or 1,393 individuals are in the labor force, with 13.7% or 191 of them unemployed. The age group with the highest labor force participation rate is 20 to 24 years, with 92.5% or 111 individuals in the labor force. Within the labor force, the 30 to 34 years age range has the highest percentage of unemployed individuals, with 31.8% or 49 of them being unemployed.
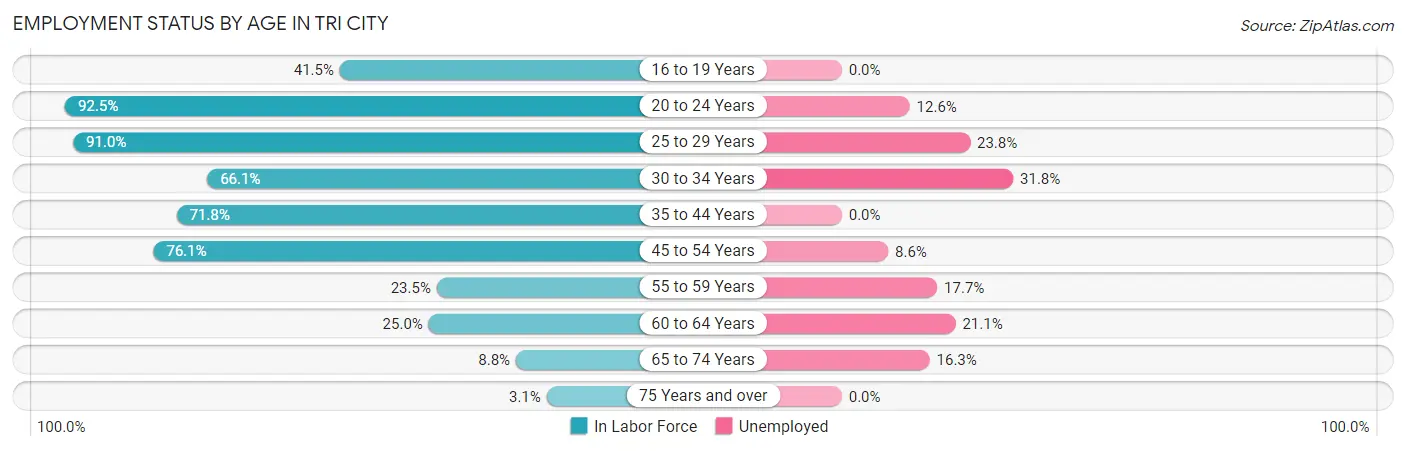
| Age Bracket | In Labor Force | Unemployed |
| 16 to 19 Years | 39 (41.5%) | 0 (0.0%) |
| 20 to 24 Years | 111 (92.5%) | 14 (12.6%) |
| 25 to 29 Years | 223 (91.0%) | 53 (23.8%) |
| 30 to 34 Years | 154 (66.1%) | 49 (31.8%) |
| 35 to 44 Years | 250 (71.8%) | 0 (0.0%) |
| 45 to 54 Years | 373 (76.1%) | 32 (8.6%) |
| 55 to 59 Years | 62 (23.5%) | 11 (17.7%) |
| 60 to 64 Years | 90 (25.0%) | 19 (21.1%) |
| 65 to 74 Years | 80 (8.8%) | 13 (16.3%) |
| 75 Years and over | 11 (3.1%) | 0 (0.0%) |
| Total | 1,393 (40.8%) | 191 (13.7%) |
Employment Status by Educational Attainment in Tri City
According to labor force statistics for Tri City, 59.4% of individuals (1,152) out of the total population between 25 and 64 years of age (1,940) are in the labor force, with 14.2% or 164 of them being unemployed. The group with the highest labor force participation rate are those with the educational attainment of bachelor's degree or higher, with 73.1% or 98 individuals in the labor force. Within the labor force, individuals with high school diploma education have the highest percentage of unemployment, with 16.8% or 86 of them being unemployed.
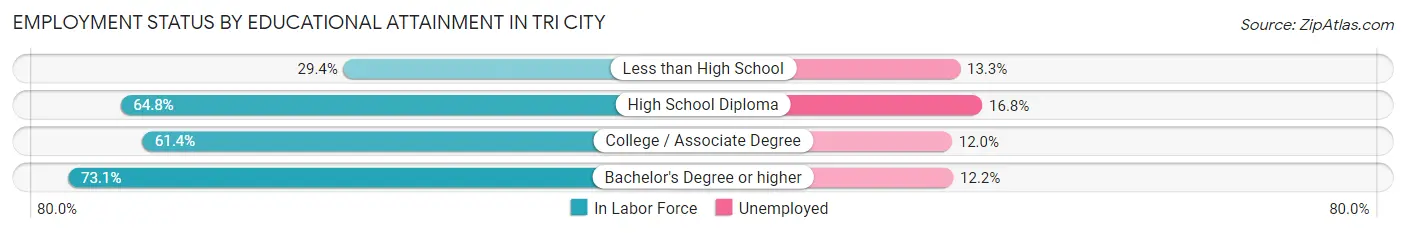
| Educational Attainment | In Labor Force | Unemployed |
| Less than High School | 75 (29.4%) | 34 (13.3%) |
| High School Diploma | 512 (64.8%) | 133 (16.8%) |
| College / Associate Degree | 467 (61.4%) | 91 (12.0%) |
| Bachelor's Degree or higher | 98 (73.1%) | 16 (12.2%) |
| Total | 1,152 (59.4%) | 275 (14.2%) |
Employment Occupations by Sex in Tri City
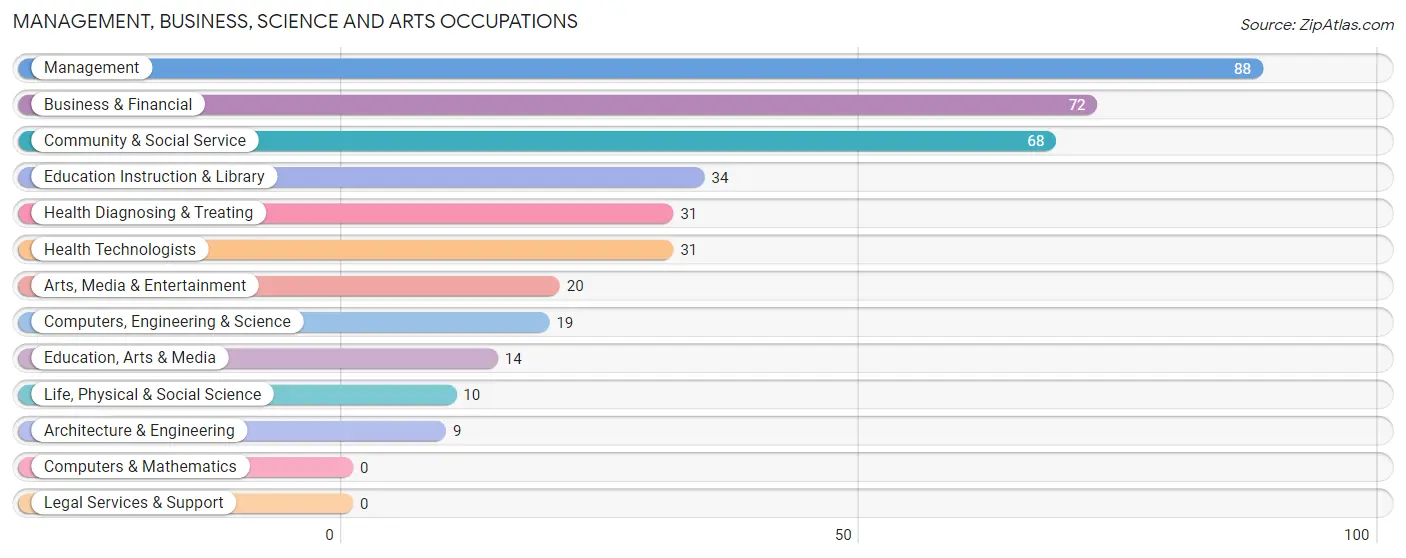
Management, Business, Science and Arts Occupations
The most common Management, Business, Science and Arts occupations in Tri City are Management (88 | 7.3%), Business & Financial (72 | 6.0%), Community & Social Service (68 | 5.7%), Education Instruction & Library (34 | 2.8%), and Health Diagnosing & Treating (31 | 2.6%).
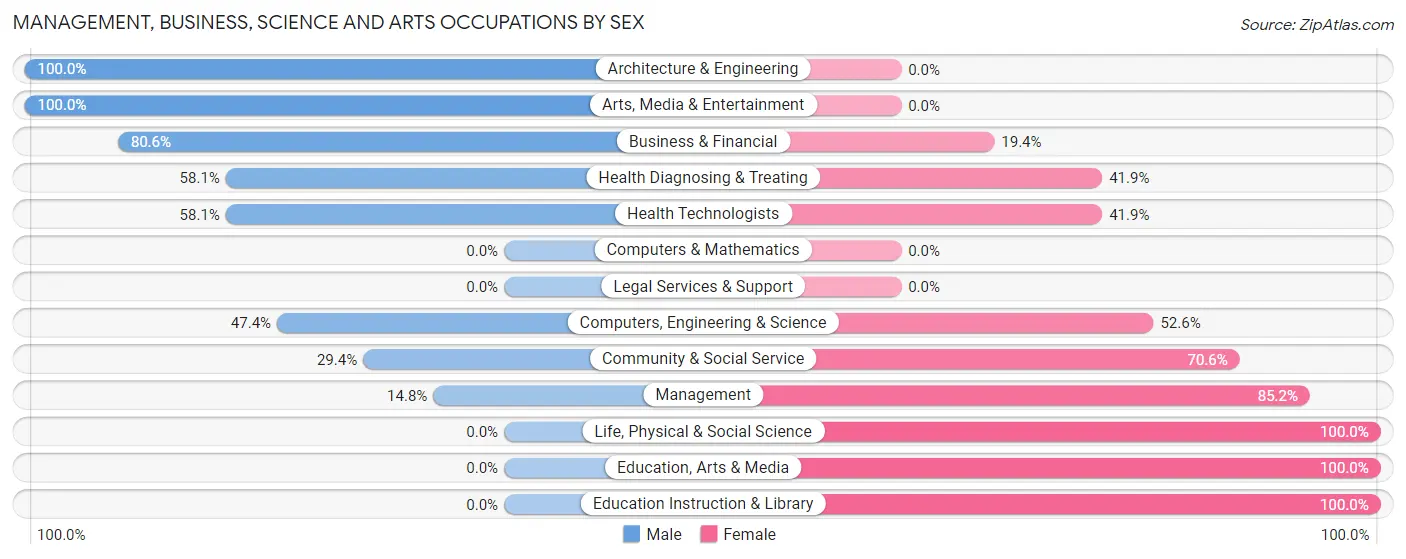
Management, Business, Science and Arts Occupations by Sex
Within the Management, Business, Science and Arts occupations in Tri City, the most male-oriented occupations are Architecture & Engineering (100.0%), Arts, Media & Entertainment (100.0%), and Business & Financial (80.6%), while the most female-oriented occupations are Life, Physical & Social Science (100.0%), Education, Arts & Media (100.0%), and Education Instruction & Library (100.0%).
| Occupation | Male | Female |
| Management | 13 (14.8%) | 75 (85.2%) |
| Business & Financial | 58 (80.6%) | 14 (19.4%) |
| Computers, Engineering & Science | 9 (47.4%) | 10 (52.6%) |
| Computers & Mathematics | 0 (0.0%) | 0 (0.0%) |
| Architecture & Engineering | 9 (100.0%) | 0 (0.0%) |
| Life, Physical & Social Science | 0 (0.0%) | 10 (100.0%) |
| Community & Social Service | 20 (29.4%) | 48 (70.6%) |
| Education, Arts & Media | 0 (0.0%) | 14 (100.0%) |
| Legal Services & Support | 0 (0.0%) | 0 (0.0%) |
| Education Instruction & Library | 0 (0.0%) | 34 (100.0%) |
| Arts, Media & Entertainment | 20 (100.0%) | 0 (0.0%) |
| Health Diagnosing & Treating | 18 (58.1%) | 13 (41.9%) |
| Health Technologists | 18 (58.1%) | 13 (41.9%) |
| Total (Category) | 118 (42.4%) | 160 (57.6%) |
| Total (Overall) | 596 (49.6%) | 606 (50.4%) |
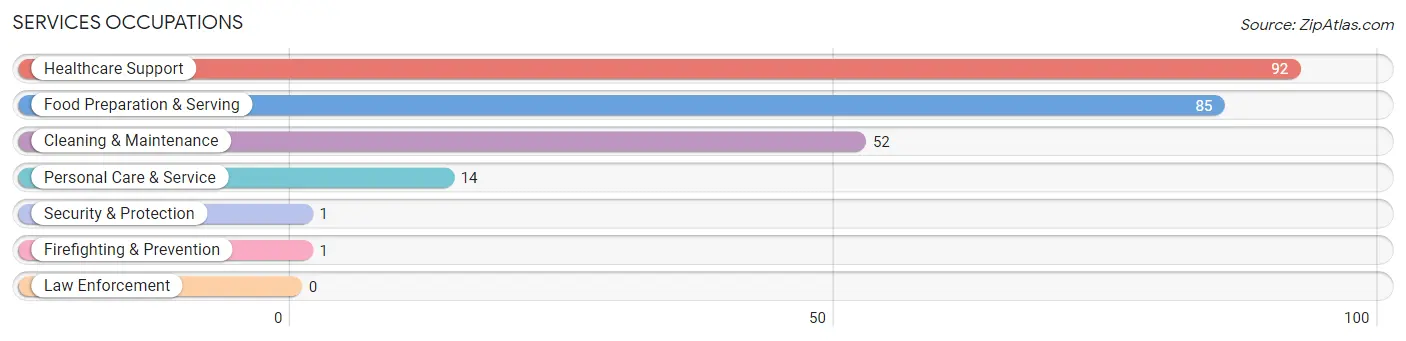
Services Occupations
The most common Services occupations in Tri City are Healthcare Support (92 | 7.6%), Food Preparation & Serving (85 | 7.1%), Cleaning & Maintenance (52 | 4.3%), Personal Care & Service (14 | 1.2%), and Security & Protection (1 | 0.1%).
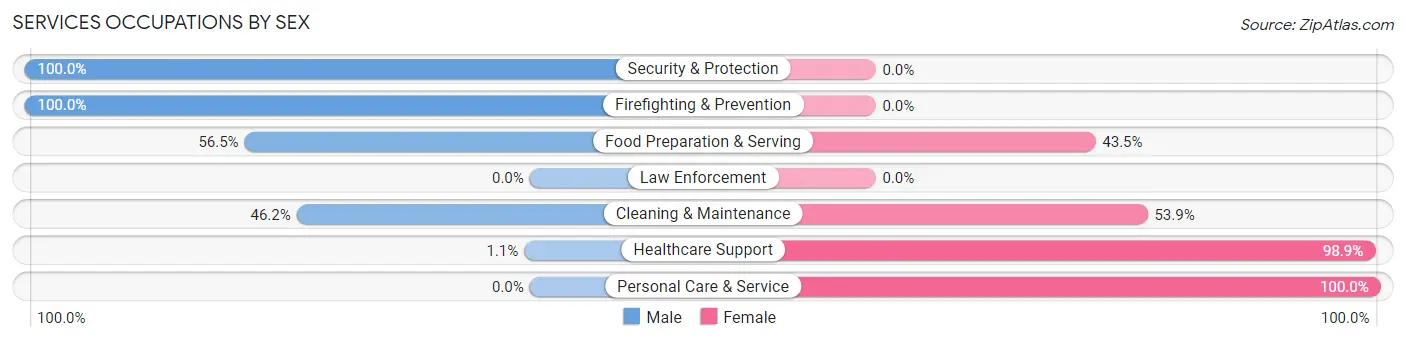
Services Occupations by Sex
Within the Services occupations in Tri City, the most male-oriented occupations are Security & Protection (100.0%), Firefighting & Prevention (100.0%), and Food Preparation & Serving (56.5%), while the most female-oriented occupations are Personal Care & Service (100.0%), Healthcare Support (98.9%), and Cleaning & Maintenance (53.8%).
| Occupation | Male | Female |
| Healthcare Support | 1 (1.1%) | 91 (98.9%) |
| Security & Protection | 1 (100.0%) | 0 (0.0%) |
| Firefighting & Prevention | 1 (100.0%) | 0 (0.0%) |
| Law Enforcement | 0 (0.0%) | 0 (0.0%) |
| Food Preparation & Serving | 48 (56.5%) | 37 (43.5%) |
| Cleaning & Maintenance | 24 (46.2%) | 28 (53.8%) |
| Personal Care & Service | 0 (0.0%) | 14 (100.0%) |
| Total (Category) | 74 (30.3%) | 170 (69.7%) |
| Total (Overall) | 596 (49.6%) | 606 (50.4%) |
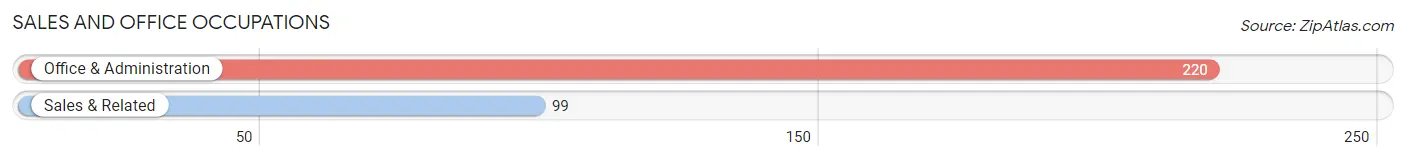
Sales and Office Occupations
The most common Sales and Office occupations in Tri City are Office & Administration (220 | 18.3%), and Sales & Related (99 | 8.2%).
Sales and Office Occupations by Sex
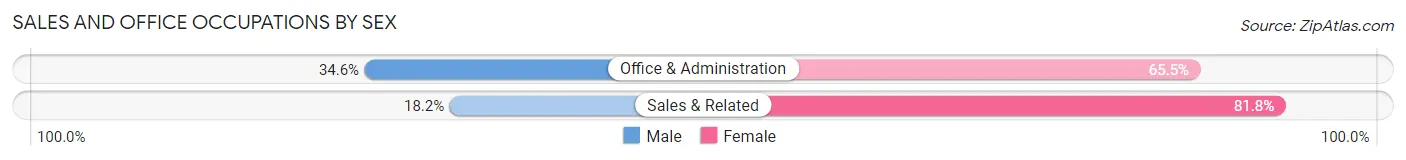
| Occupation | Male | Female |
| Sales & Related | 18 (18.2%) | 81 (81.8%) |
| Office & Administration | 76 (34.5%) | 144 (65.4%) |
| Total (Category) | 94 (29.5%) | 225 (70.5%) |
| Total (Overall) | 596 (49.6%) | 606 (50.4%) |
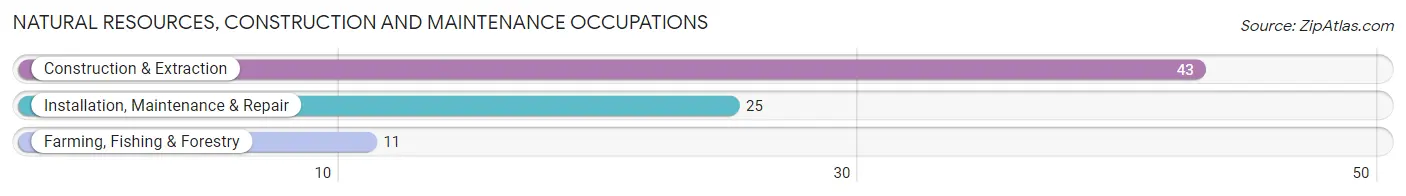
Natural Resources, Construction and Maintenance Occupations
The most common Natural Resources, Construction and Maintenance occupations in Tri City are Construction & Extraction (43 | 3.6%), Installation, Maintenance & Repair (25 | 2.1%), and Farming, Fishing & Forestry (11 | 0.9%).
Natural Resources, Construction and Maintenance Occupations by Sex
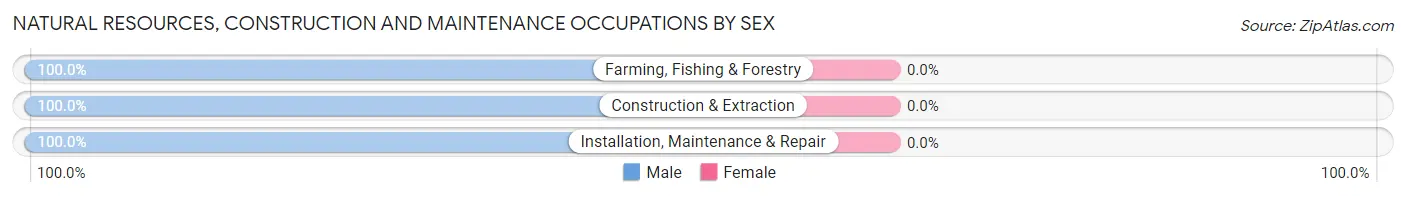
| Occupation | Male | Female |
| Farming, Fishing & Forestry | 11 (100.0%) | 0 (0.0%) |
| Construction & Extraction | 43 (100.0%) | 0 (0.0%) |
| Installation, Maintenance & Repair | 25 (100.0%) | 0 (0.0%) |
| Total (Category) | 79 (100.0%) | 0 (0.0%) |
| Total (Overall) | 596 (49.6%) | 606 (50.4%) |
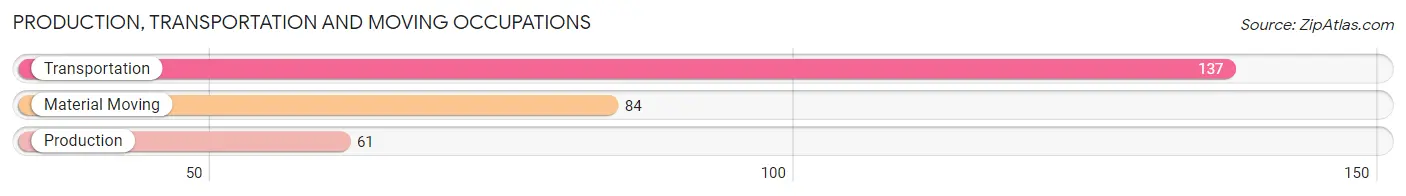
Production, Transportation and Moving Occupations
The most common Production, Transportation and Moving occupations in Tri City are Transportation (137 | 11.4%), Material Moving (84 | 7.0%), and Production (61 | 5.1%).
Production, Transportation and Moving Occupations by Sex
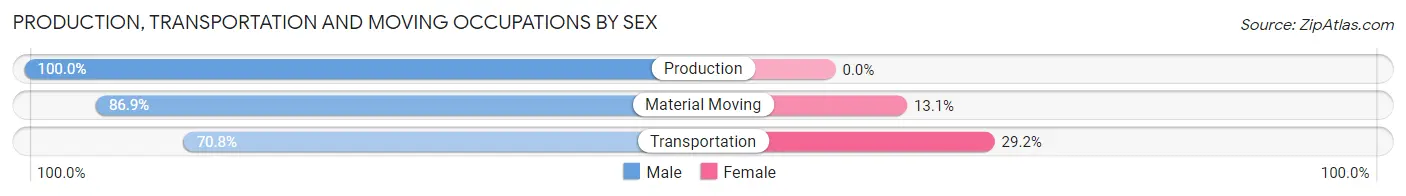
| Occupation | Male | Female |
| Production | 61 (100.0%) | 0 (0.0%) |
| Transportation | 97 (70.8%) | 40 (29.2%) |
| Material Moving | 73 (86.9%) | 11 (13.1%) |
| Total (Category) | 231 (81.9%) | 51 (18.1%) |
| Total (Overall) | 596 (49.6%) | 606 (50.4%) |
Employment Industries by Sex in Tri City
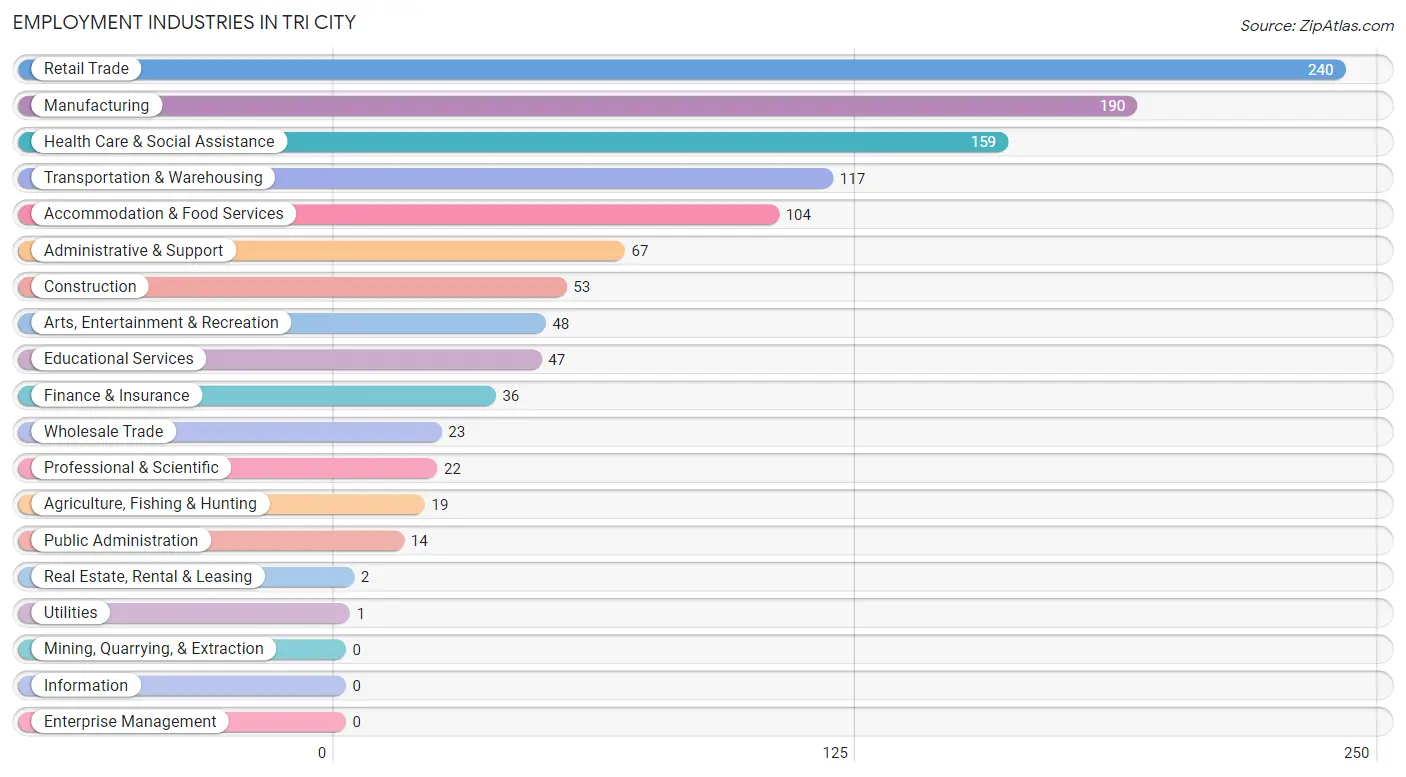
Employment Industries in Tri City
The major employment industries in Tri City include Retail Trade (240 | 20.0%), Manufacturing (190 | 15.8%), Health Care & Social Assistance (159 | 13.2%), Transportation & Warehousing (117 | 9.7%), and Accommodation & Food Services (104 | 8.6%).
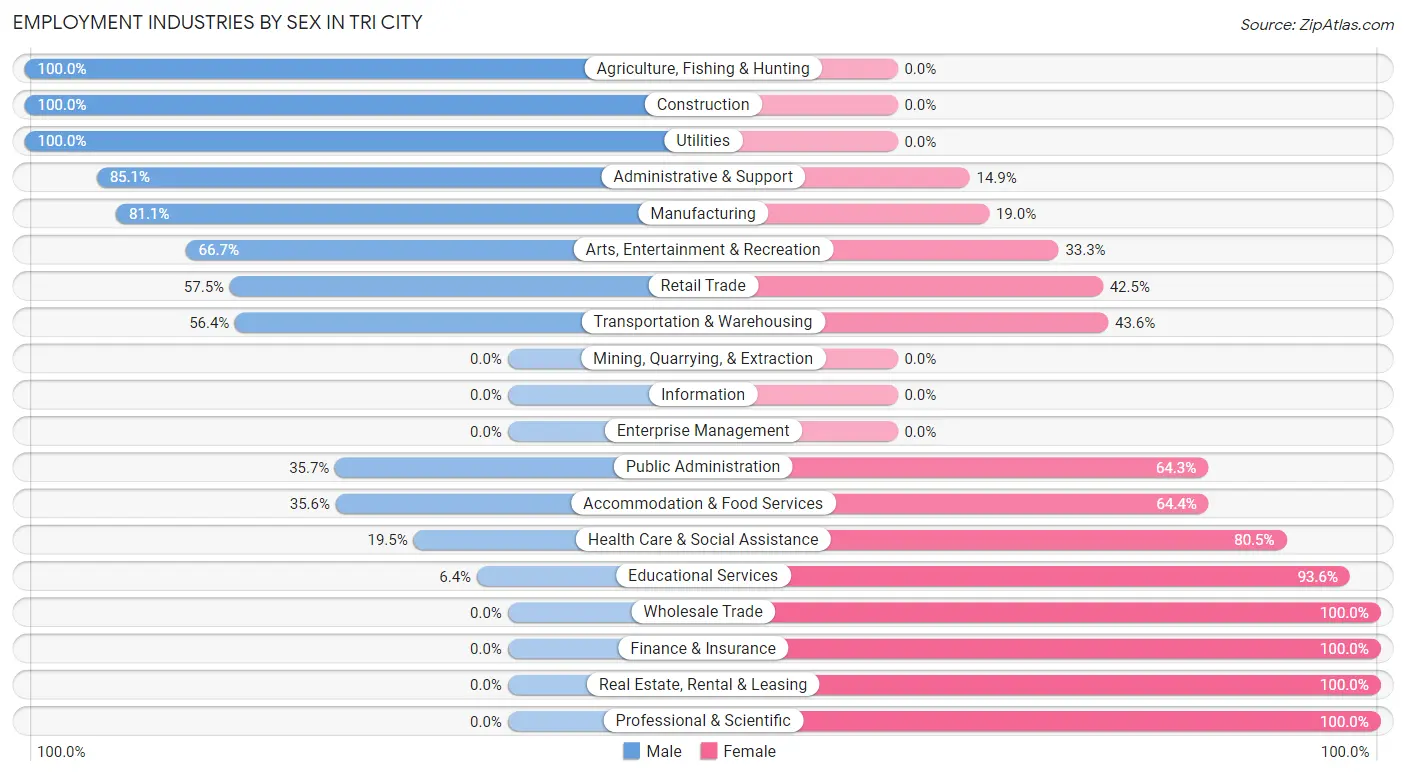
Employment Industries by Sex in Tri City
The Tri City industries that see more men than women are Agriculture, Fishing & Hunting (100.0%), Construction (100.0%), and Utilities (100.0%), whereas the industries that tend to have a higher number of women are Wholesale Trade (100.0%), Finance & Insurance (100.0%), and Real Estate, Rental & Leasing (100.0%).
| Industry | Male | Female |
| Agriculture, Fishing & Hunting | 19 (100.0%) | 0 (0.0%) |
| Mining, Quarrying, & Extraction | 0 (0.0%) | 0 (0.0%) |
| Construction | 53 (100.0%) | 0 (0.0%) |
| Manufacturing | 154 (81.0%) | 36 (19.0%) |
| Wholesale Trade | 0 (0.0%) | 23 (100.0%) |
| Retail Trade | 138 (57.5%) | 102 (42.5%) |
| Transportation & Warehousing | 66 (56.4%) | 51 (43.6%) |
| Utilities | 1 (100.0%) | 0 (0.0%) |
| Information | 0 (0.0%) | 0 (0.0%) |
| Finance & Insurance | 0 (0.0%) | 36 (100.0%) |
| Real Estate, Rental & Leasing | 0 (0.0%) | 2 (100.0%) |
| Professional & Scientific | 0 (0.0%) | 22 (100.0%) |
| Enterprise Management | 0 (0.0%) | 0 (0.0%) |
| Administrative & Support | 57 (85.1%) | 10 (14.9%) |
| Educational Services | 3 (6.4%) | 44 (93.6%) |
| Health Care & Social Assistance | 31 (19.5%) | 128 (80.5%) |
| Arts, Entertainment & Recreation | 32 (66.7%) | 16 (33.3%) |
| Accommodation & Food Services | 37 (35.6%) | 67 (64.4%) |
| Public Administration | 5 (35.7%) | 9 (64.3%) |
| Total | 596 (49.6%) | 606 (50.4%) |
Education in Tri City
School Enrollment in Tri City
The most common levels of schooling among the 410 students in Tri City are elementary school (106 | 25.9%), middle school (95 | 23.2%), and high school (89 | 21.7%).
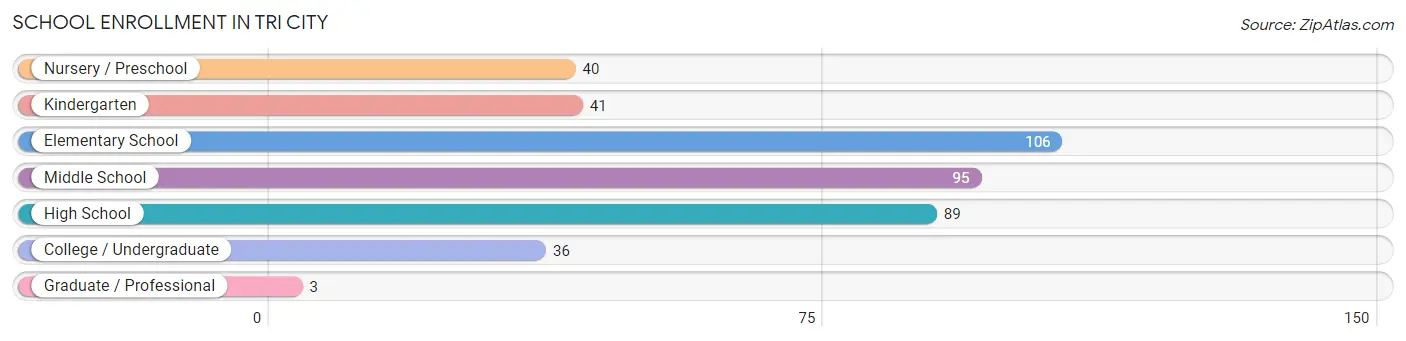
| School Level | # Students | % Students |
| Nursery / Preschool | 40 | 9.8% |
| Kindergarten | 41 | 10.0% |
| Elementary School | 106 | 25.9% |
| Middle School | 95 | 23.2% |
| High School | 89 | 21.7% |
| College / Undergraduate | 36 | 8.8% |
| Graduate / Professional | 3 | 0.7% |
| Total | 410 | 100.0% |
School Enrollment by Age by Funding Source in Tri City
Out of a total of 410 students who are enrolled in schools in Tri City, 84 (20.5%) attend a private institution, while the remaining 326 (79.5%) are enrolled in public schools. The age group of 3 to 4 year olds has the highest likelihood of being enrolled in private schools, with 11 (68.8% in the age bracket) enrolled. Conversely, the age group of 10 to 14 year olds has the lowest likelihood of being enrolled in a private school, with 107 (100.0% in the age bracket) attending a public institution.
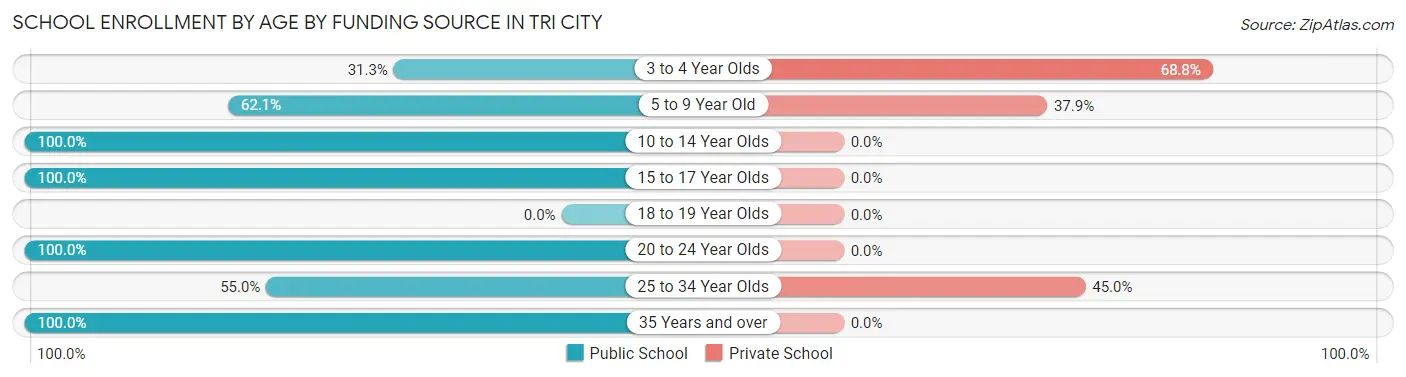
| Age Bracket | Public School | Private School |
| 3 to 4 Year Olds | 5 (31.2%) | 11 (68.8%) |
| 5 to 9 Year Old | 105 (62.1%) | 64 (37.9%) |
| 10 to 14 Year Olds | 107 (100.0%) | 0 (0.0%) |
| 15 to 17 Year Olds | 79 (100.0%) | 0 (0.0%) |
| 18 to 19 Year Olds | 0 (0.0%) | 0 (0.0%) |
| 20 to 24 Year Olds | 14 (100.0%) | 0 (0.0%) |
| 25 to 34 Year Olds | 11 (55.0%) | 9 (45.0%) |
| 35 Years and over | 5 (100.0%) | 0 (0.0%) |
| Total | 326 (79.5%) | 84 (20.5%) |
Educational Attainment by Field of Study in Tri City
Arts & humanities (43 | 13.8%), liberal arts & history (36 | 11.6%), physical & health sciences (35 | 11.3%), business (33 | 10.6%), and computers & mathematics (26 | 8.4%) are the most common fields of study among 311 individuals in Tri City who have obtained a bachelor's degree or higher.
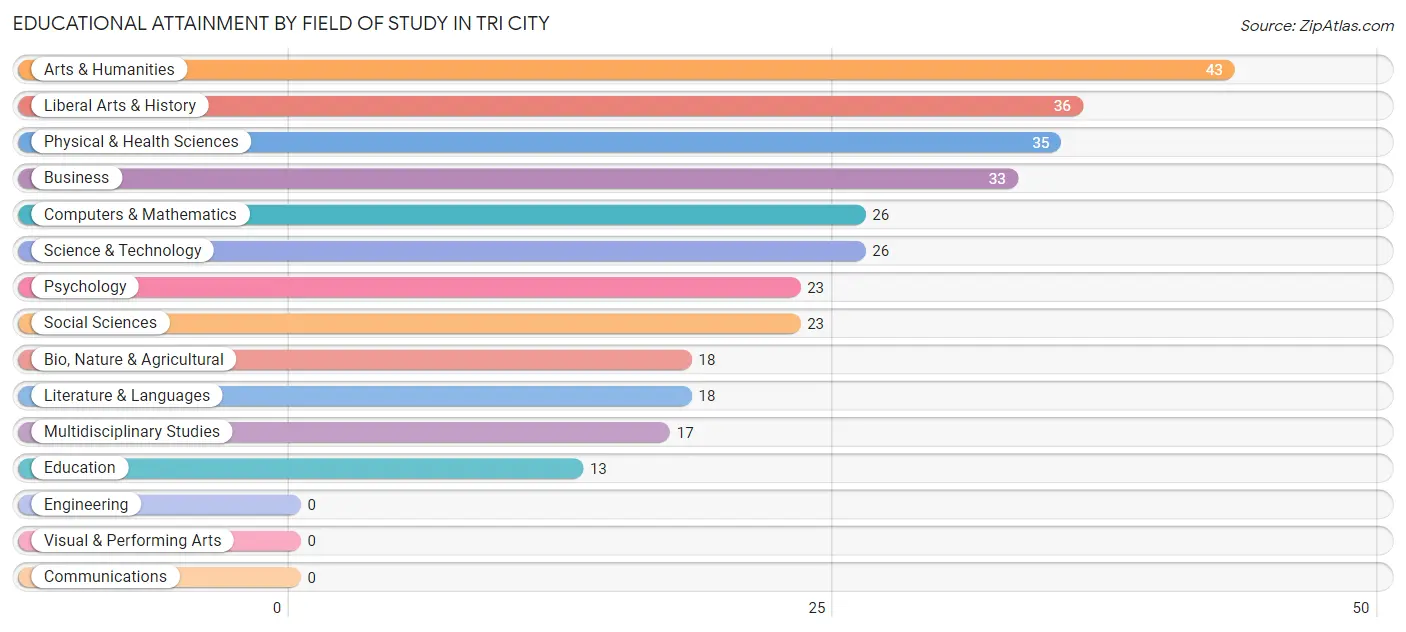
| Field of Study | # Graduates | % Graduates |
| Computers & Mathematics | 26 | 8.4% |
| Bio, Nature & Agricultural | 18 | 5.8% |
| Physical & Health Sciences | 35 | 11.3% |
| Psychology | 23 | 7.4% |
| Social Sciences | 23 | 7.4% |
| Engineering | 0 | 0.0% |
| Multidisciplinary Studies | 17 | 5.5% |
| Science & Technology | 26 | 8.4% |
| Business | 33 | 10.6% |
| Education | 13 | 4.2% |
| Literature & Languages | 18 | 5.8% |
| Liberal Arts & History | 36 | 11.6% |
| Visual & Performing Arts | 0 | 0.0% |
| Communications | 0 | 0.0% |
| Arts & Humanities | 43 | 13.8% |
| Total | 311 | 100.0% |
Transportation & Commute in Tri City
Vehicle Availability by Sex in Tri City
The most prevalent vehicle ownership categories in Tri City are males with 3 vehicles (145, accounting for 25.7%) and females with 3 vehicles (154, making up 24.2%).
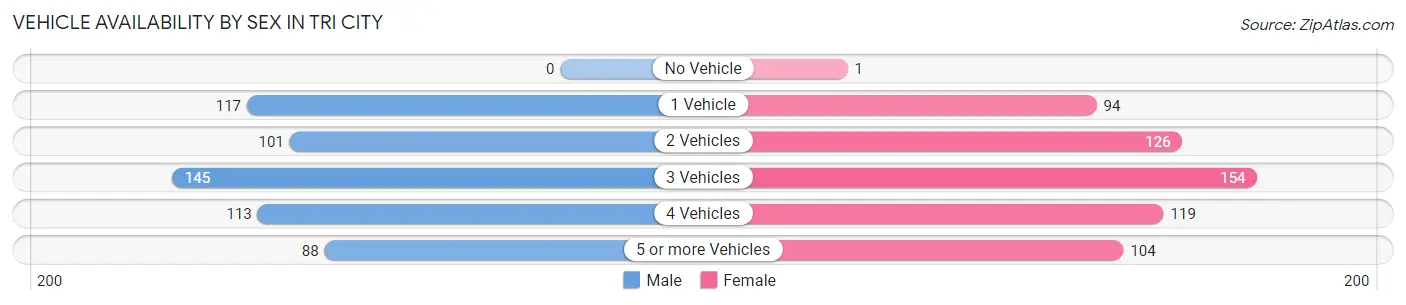
| Vehicles Available | Male | Female |
| No Vehicle | 0 (0.0%) | 1 (0.2%) |
| 1 Vehicle | 117 (20.7%) | 94 (15.7%) |
| 2 Vehicles | 101 (17.9%) | 126 (21.1%) |
| 3 Vehicles | 145 (25.7%) | 154 (25.8%) |
| 4 Vehicles | 113 (20.0%) | 119 (19.9%) |
| 5 or more Vehicles | 88 (15.6%) | 104 (17.4%) |
| Total | 564 (100.0%) | 598 (100.0%) |
Commute Time in Tri City
The most frequently occuring commute durations in Tri City are 10 to 14 minutes (260 commuters, 23.7%), 5 to 9 minutes (168 commuters, 15.3%), and 25 to 29 minutes (143 commuters, 13.1%).
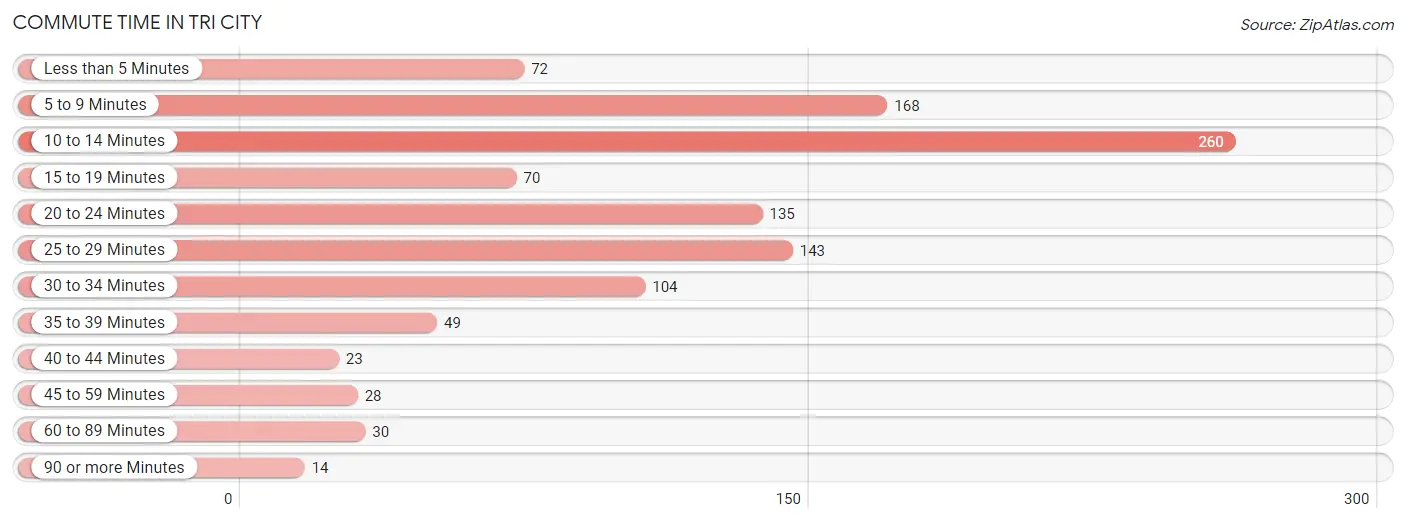
| Commute Time | # Commuters | % Commuters |
| Less than 5 Minutes | 72 | 6.6% |
| 5 to 9 Minutes | 168 | 15.3% |
| 10 to 14 Minutes | 260 | 23.7% |
| 15 to 19 Minutes | 70 | 6.4% |
| 20 to 24 Minutes | 135 | 12.3% |
| 25 to 29 Minutes | 143 | 13.1% |
| 30 to 34 Minutes | 104 | 9.5% |
| 35 to 39 Minutes | 49 | 4.5% |
| 40 to 44 Minutes | 23 | 2.1% |
| 45 to 59 Minutes | 28 | 2.5% |
| 60 to 89 Minutes | 30 | 2.7% |
| 90 or more Minutes | 14 | 1.3% |
Commute Time by Sex in Tri City
The most common commute times in Tri City are 10 to 14 minutes (113 commuters, 21.4%) for males and 10 to 14 minutes (147 commuters, 25.9%) for females.
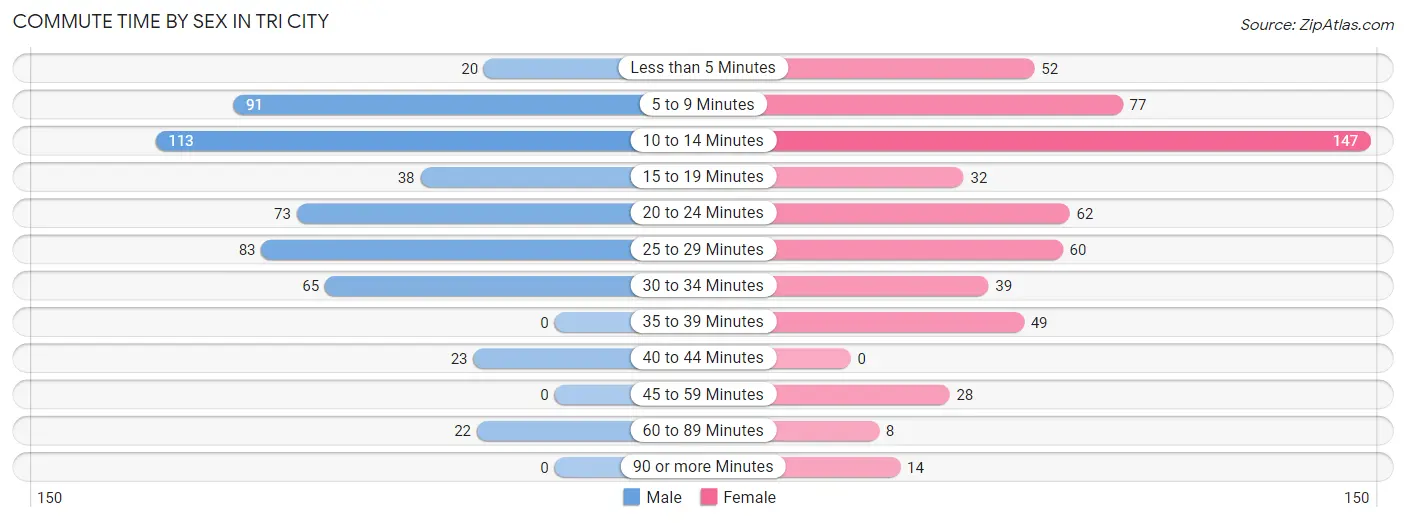
| Commute Time | Male | Female |
| Less than 5 Minutes | 20 (3.8%) | 52 (9.1%) |
| 5 to 9 Minutes | 91 (17.2%) | 77 (13.6%) |
| 10 to 14 Minutes | 113 (21.4%) | 147 (25.9%) |
| 15 to 19 Minutes | 38 (7.2%) | 32 (5.6%) |
| 20 to 24 Minutes | 73 (13.8%) | 62 (10.9%) |
| 25 to 29 Minutes | 83 (15.7%) | 60 (10.6%) |
| 30 to 34 Minutes | 65 (12.3%) | 39 (6.9%) |
| 35 to 39 Minutes | 0 (0.0%) | 49 (8.6%) |
| 40 to 44 Minutes | 23 (4.4%) | 0 (0.0%) |
| 45 to 59 Minutes | 0 (0.0%) | 28 (4.9%) |
| 60 to 89 Minutes | 22 (4.2%) | 8 (1.4%) |
| 90 or more Minutes | 0 (0.0%) | 14 (2.5%) |
Time of Departure to Work by Sex in Tri City
The most frequent times of departure to work in Tri City are 12:00 AM to 4:59 AM (118, 22.4%) for males and 9:00 AM to 9:59 AM (108, 19.0%) for females.
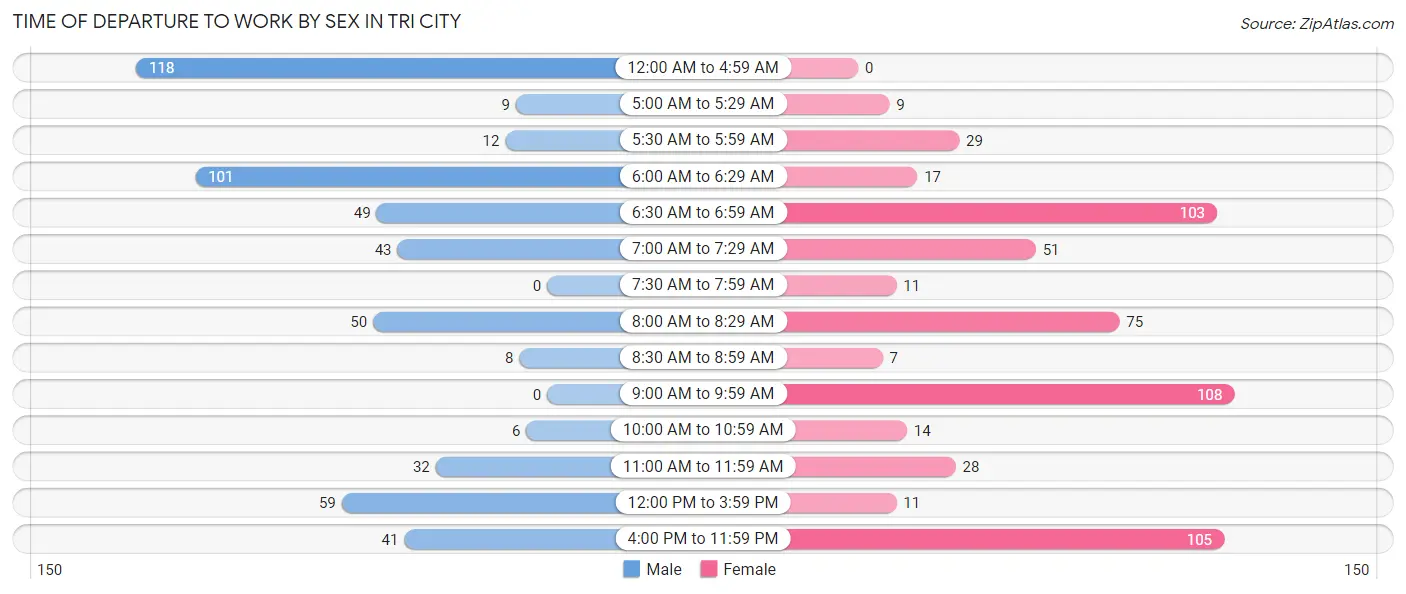
| Time of Departure | Male | Female |
| 12:00 AM to 4:59 AM | 118 (22.4%) | 0 (0.0%) |
| 5:00 AM to 5:29 AM | 9 (1.7%) | 9 (1.6%) |
| 5:30 AM to 5:59 AM | 12 (2.3%) | 29 (5.1%) |
| 6:00 AM to 6:29 AM | 101 (19.1%) | 17 (3.0%) |
| 6:30 AM to 6:59 AM | 49 (9.3%) | 103 (18.1%) |
| 7:00 AM to 7:29 AM | 43 (8.1%) | 51 (9.0%) |
| 7:30 AM to 7:59 AM | 0 (0.0%) | 11 (1.9%) |
| 8:00 AM to 8:29 AM | 50 (9.5%) | 75 (13.2%) |
| 8:30 AM to 8:59 AM | 8 (1.5%) | 7 (1.2%) |
| 9:00 AM to 9:59 AM | 0 (0.0%) | 108 (19.0%) |
| 10:00 AM to 10:59 AM | 6 (1.1%) | 14 (2.5%) |
| 11:00 AM to 11:59 AM | 32 (6.1%) | 28 (4.9%) |
| 12:00 PM to 3:59 PM | 59 (11.2%) | 11 (1.9%) |
| 4:00 PM to 11:59 PM | 41 (7.8%) | 105 (18.5%) |
| Total | 528 (100.0%) | 568 (100.0%) |
Housing Occupancy in Tri City
Occupancy by Ownership in Tri City
Of the total 1,691 dwellings in Tri City, owner-occupied units account for 1,333 (78.8%), while renter-occupied units make up 358 (21.2%).
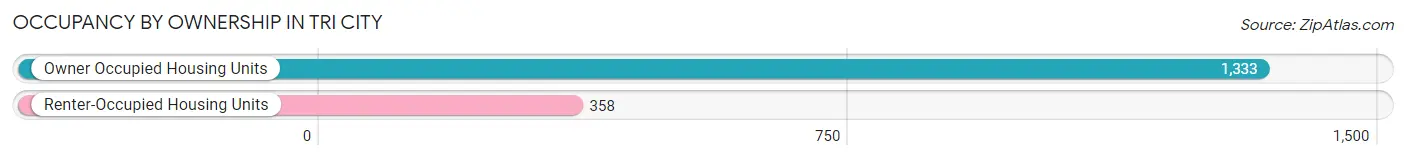
| Occupancy | # Housing Units | % Housing Units |
| Owner Occupied Housing Units | 1,333 | 78.8% |
| Renter-Occupied Housing Units | 358 | 21.2% |
| Total Occupied Housing Units | 1,691 | 100.0% |
Occupancy by Household Size in Tri City
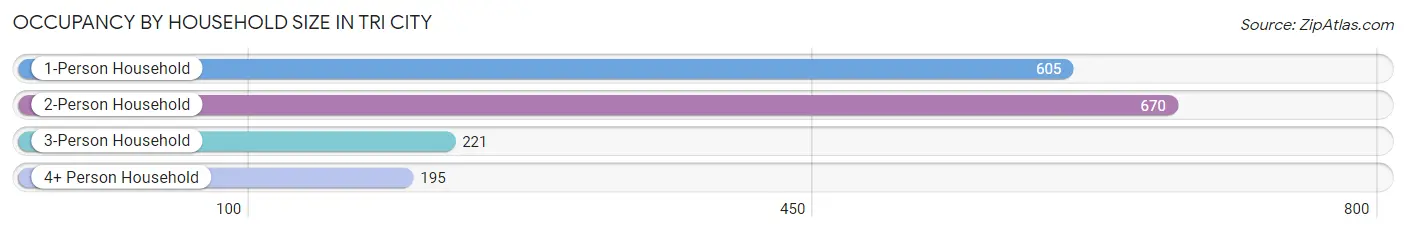
| Household Size | # Housing Units | % Housing Units |
| 1-Person Household | 605 | 35.8% |
| 2-Person Household | 670 | 39.6% |
| 3-Person Household | 221 | 13.1% |
| 4+ Person Household | 195 | 11.5% |
| Total Housing Units | 1,691 | 100.0% |
Occupancy by Ownership by Household Size in Tri City
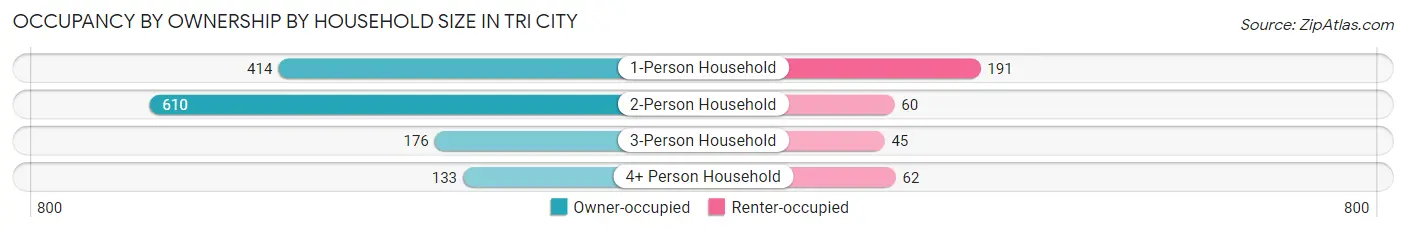
| Household Size | Owner-occupied | Renter-occupied |
| 1-Person Household | 414 (68.4%) | 191 (31.6%) |
| 2-Person Household | 610 (91.0%) | 60 (9.0%) |
| 3-Person Household | 176 (79.6%) | 45 (20.4%) |
| 4+ Person Household | 133 (68.2%) | 62 (31.8%) |
| Total Housing Units | 1,333 (78.8%) | 358 (21.2%) |
Occupancy by Educational Attainment in Tri City
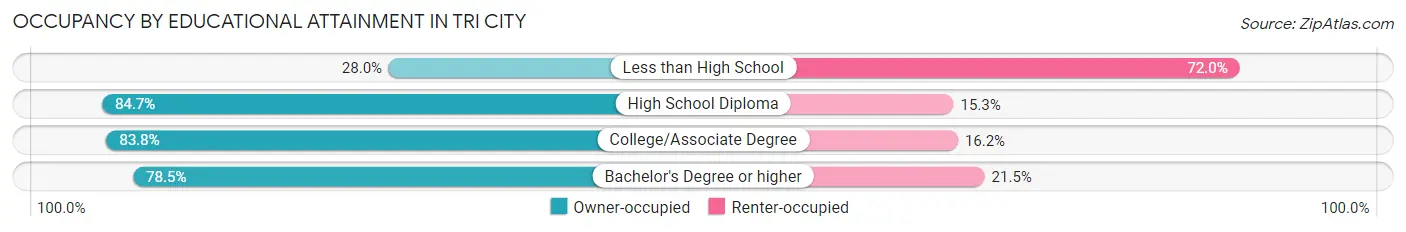
| Household Size | Owner-occupied | Renter-occupied |
| Less than High School | 40 (28.0%) | 103 (72.0%) |
| High School Diploma | 491 (84.7%) | 89 (15.3%) |
| College/Associate Degree | 667 (83.8%) | 129 (16.2%) |
| Bachelor's Degree or higher | 135 (78.5%) | 37 (21.5%) |
Occupancy by Age of Householder in Tri City
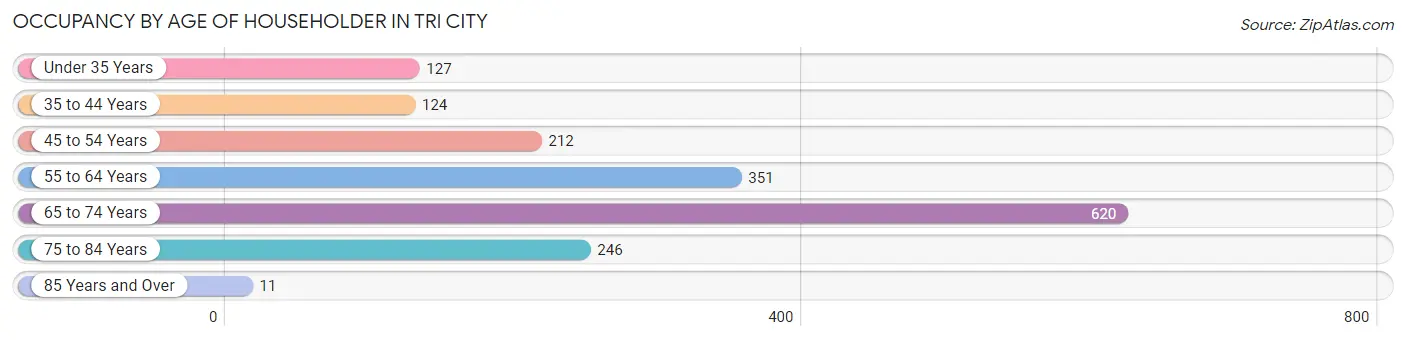
| Age Bracket | # Households | % Households |
| Under 35 Years | 127 | 7.5% |
| 35 to 44 Years | 124 | 7.3% |
| 45 to 54 Years | 212 | 12.5% |
| 55 to 64 Years | 351 | 20.8% |
| 65 to 74 Years | 620 | 36.7% |
| 75 to 84 Years | 246 | 14.5% |
| 85 Years and Over | 11 | 0.6% |
| Total | 1,691 | 100.0% |
Housing Finances in Tri City
Median Income by Occupancy in Tri City
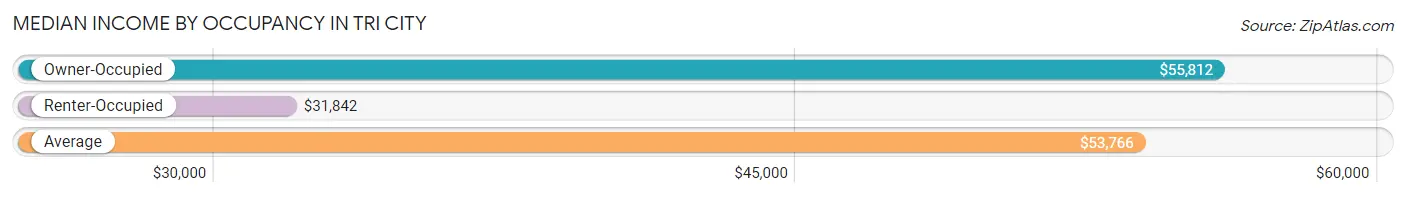
| Occupancy Type | # Households | Median Income |
| Owner-Occupied | 1,333 (78.8%) | $55,812 |
| Renter-Occupied | 358 (21.2%) | $31,842 |
| Average | 1,691 (100.0%) | $53,766 |
Occupancy by Householder Income Bracket in Tri City
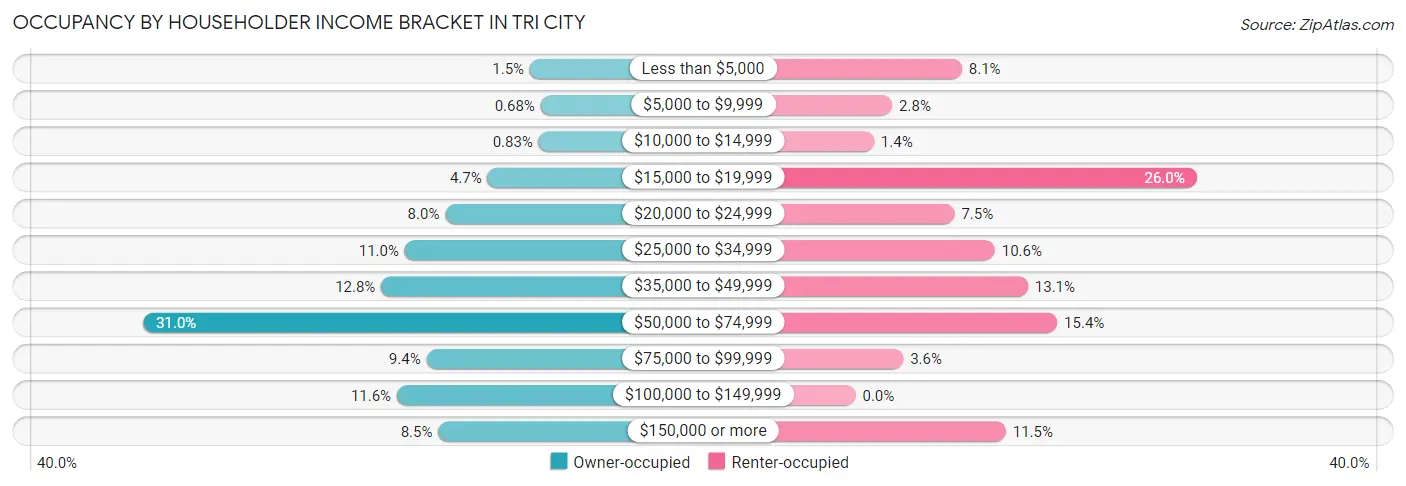
| Income Bracket | Owner-occupied | Renter-occupied |
| Less than $5,000 | 20 (1.5%) | 29 (8.1%) |
| $5,000 to $9,999 | 9 (0.7%) | 10 (2.8%) |
| $10,000 to $14,999 | 11 (0.8%) | 5 (1.4%) |
| $15,000 to $19,999 | 63 (4.7%) | 93 (26.0%) |
| $20,000 to $24,999 | 106 (8.0%) | 27 (7.5%) |
| $25,000 to $34,999 | 147 (11.0%) | 38 (10.6%) |
| $35,000 to $49,999 | 171 (12.8%) | 47 (13.1%) |
| $50,000 to $74,999 | 413 (31.0%) | 55 (15.4%) |
| $75,000 to $99,999 | 125 (9.4%) | 13 (3.6%) |
| $100,000 to $149,999 | 155 (11.6%) | 0 (0.0%) |
| $150,000 or more | 113 (8.5%) | 41 (11.5%) |
| Total | 1,333 (100.0%) | 358 (100.0%) |
Monthly Housing Cost Tiers in Tri City
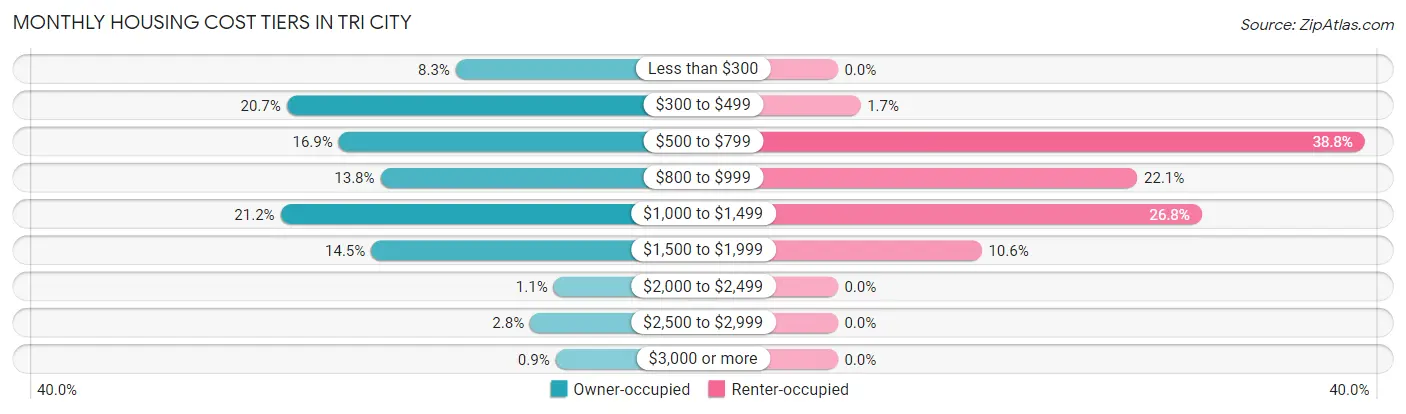
| Monthly Cost | Owner-occupied | Renter-occupied |
| Less than $300 | 110 (8.3%) | 0 (0.0%) |
| $300 to $499 | 276 (20.7%) | 6 (1.7%) |
| $500 to $799 | 225 (16.9%) | 139 (38.8%) |
| $800 to $999 | 184 (13.8%) | 79 (22.1%) |
| $1,000 to $1,499 | 282 (21.2%) | 96 (26.8%) |
| $1,500 to $1,999 | 193 (14.5%) | 38 (10.6%) |
| $2,000 to $2,499 | 14 (1.1%) | 0 (0.0%) |
| $2,500 to $2,999 | 37 (2.8%) | 0 (0.0%) |
| $3,000 or more | 12 (0.9%) | 0 (0.0%) |
| Total | 1,333 (100.0%) | 358 (100.0%) |
Physical Housing Characteristics in Tri City
Housing Structures in Tri City
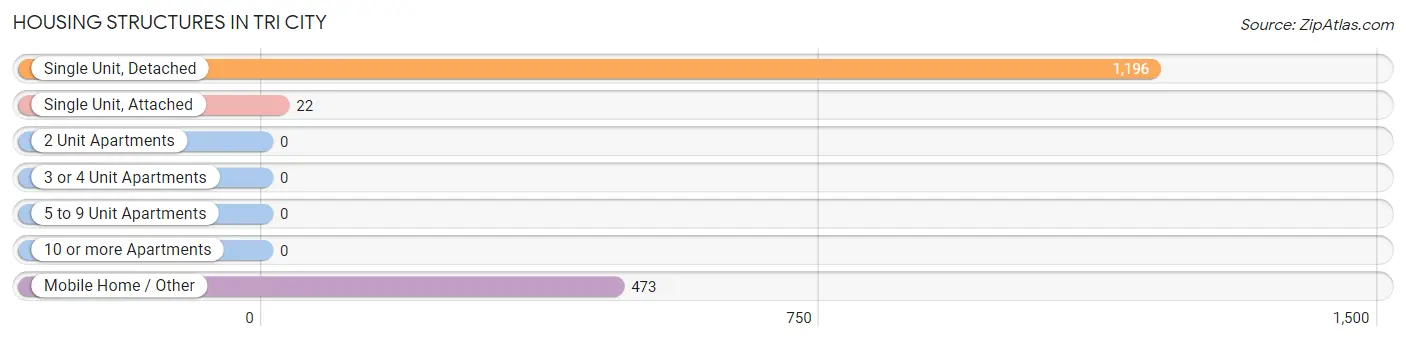
| Structure Type | # Housing Units | % Housing Units |
| Single Unit, Detached | 1,196 | 70.7% |
| Single Unit, Attached | 22 | 1.3% |
| 2 Unit Apartments | 0 | 0.0% |
| 3 or 4 Unit Apartments | 0 | 0.0% |
| 5 to 9 Unit Apartments | 0 | 0.0% |
| 10 or more Apartments | 0 | 0.0% |
| Mobile Home / Other | 473 | 28.0% |
| Total | 1,691 | 100.0% |
Housing Structures by Occupancy in Tri City
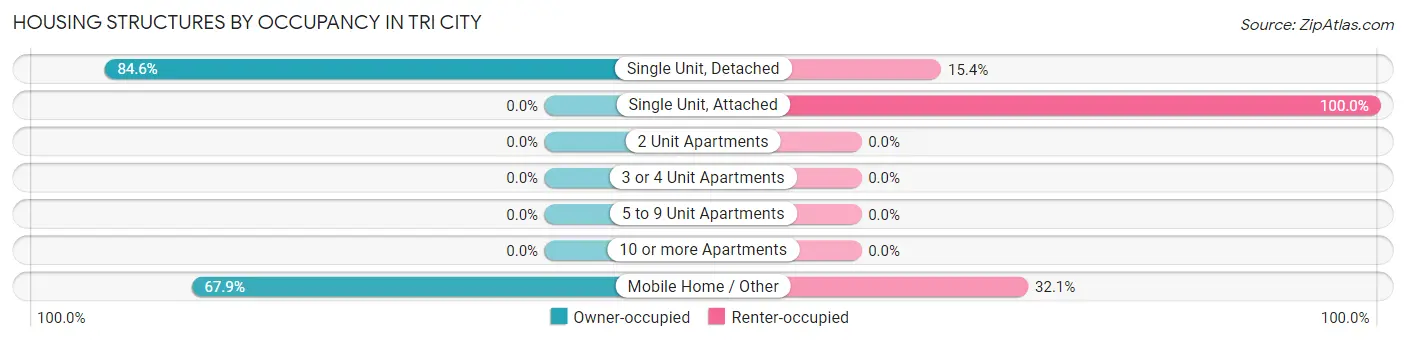
| Structure Type | Owner-occupied | Renter-occupied |
| Single Unit, Detached | 1,012 (84.6%) | 184 (15.4%) |
| Single Unit, Attached | 0 (0.0%) | 22 (100.0%) |
| 2 Unit Apartments | 0 (0.0%) | 0 (0.0%) |
| 3 or 4 Unit Apartments | 0 (0.0%) | 0 (0.0%) |
| 5 to 9 Unit Apartments | 0 (0.0%) | 0 (0.0%) |
| 10 or more Apartments | 0 (0.0%) | 0 (0.0%) |
| Mobile Home / Other | 321 (67.9%) | 152 (32.1%) |
| Total | 1,333 (78.8%) | 358 (21.2%) |
Housing Structures by Number of Rooms in Tri City
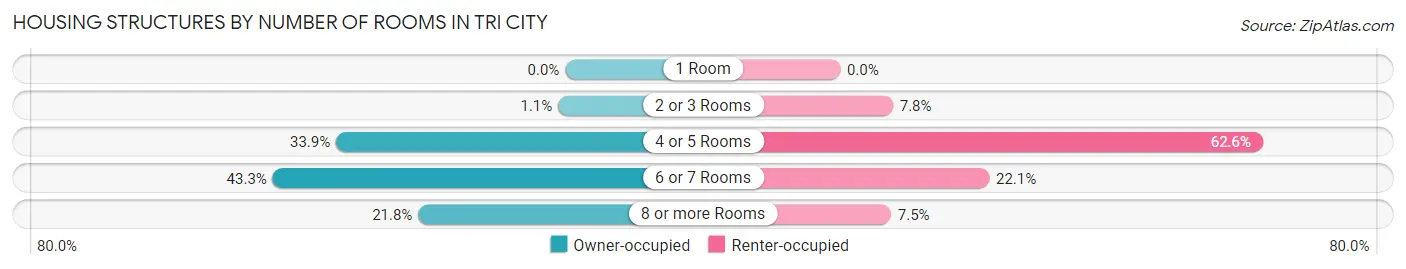
| Number of Rooms | Owner-occupied | Renter-occupied |
| 1 Room | 0 (0.0%) | 0 (0.0%) |
| 2 or 3 Rooms | 14 (1.1%) | 28 (7.8%) |
| 4 or 5 Rooms | 452 (33.9%) | 224 (62.6%) |
| 6 or 7 Rooms | 577 (43.3%) | 79 (22.1%) |
| 8 or more Rooms | 290 (21.8%) | 27 (7.5%) |
| Total | 1,333 (100.0%) | 358 (100.0%) |
Housing Structure by Heating Type in Tri City
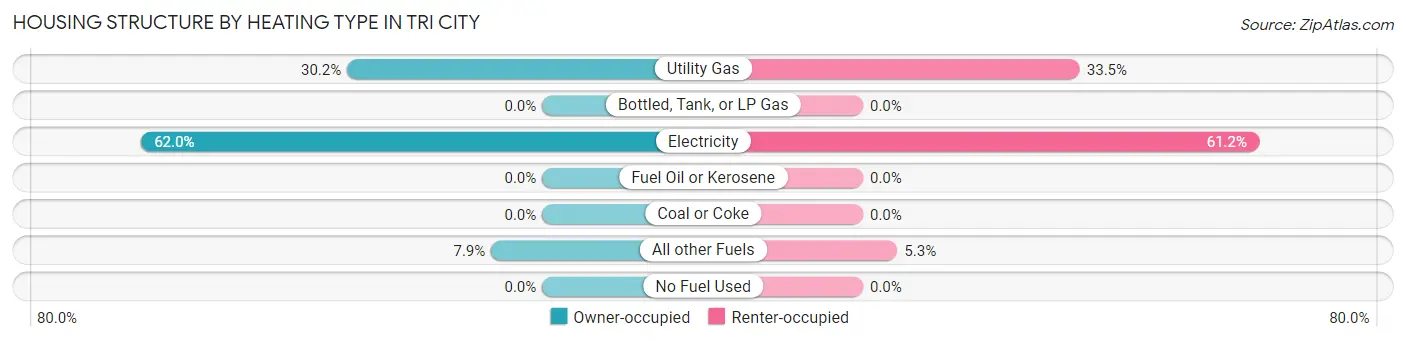
| Heating Type | Owner-occupied | Renter-occupied |
| Utility Gas | 402 (30.2%) | 120 (33.5%) |
| Bottled, Tank, or LP Gas | 0 (0.0%) | 0 (0.0%) |
| Electricity | 826 (62.0%) | 219 (61.2%) |
| Fuel Oil or Kerosene | 0 (0.0%) | 0 (0.0%) |
| Coal or Coke | 0 (0.0%) | 0 (0.0%) |
| All other Fuels | 105 (7.9%) | 19 (5.3%) |
| No Fuel Used | 0 (0.0%) | 0 (0.0%) |
| Total | 1,333 (100.0%) | 358 (100.0%) |
Household Vehicle Usage in Tri City
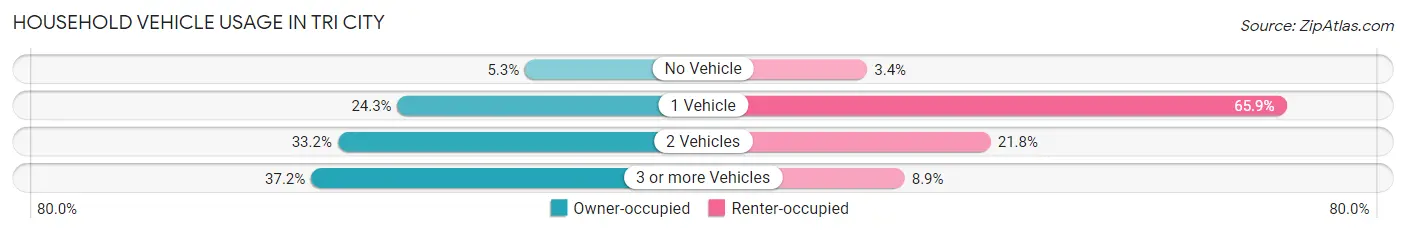
| Vehicles per Household | Owner-occupied | Renter-occupied |
| No Vehicle | 70 (5.2%) | 12 (3.4%) |
| 1 Vehicle | 324 (24.3%) | 236 (65.9%) |
| 2 Vehicles | 443 (33.2%) | 78 (21.8%) |
| 3 or more Vehicles | 496 (37.2%) | 32 (8.9%) |
| Total | 1,333 (100.0%) | 358 (100.0%) |
Real Estate & Mortgages in Tri City
Real Estate and Mortgage Overview in Tri City
| Characteristic | Without Mortgage | With Mortgage |
| Housing Units | 554 | 779 |
| Median Property Value | $233,900 | $214,900 |
| Median Household Income | $55,223 | $106 |
| Monthly Housing Costs | $380 | $12 |
| Real Estate Taxes | $1,430 | $30 |
Property Value by Mortgage Status in Tri City
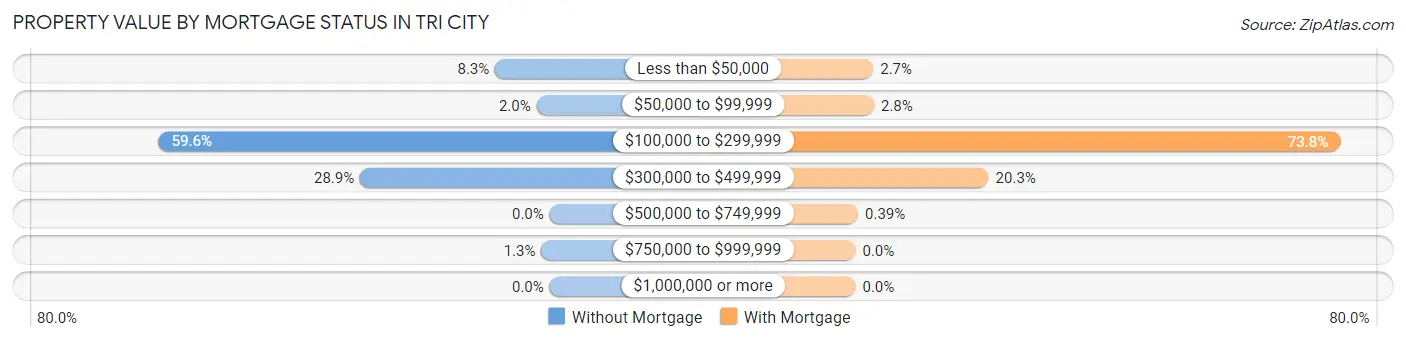
| Property Value | Without Mortgage | With Mortgage |
| Less than $50,000 | 46 (8.3%) | 21 (2.7%) |
| $50,000 to $99,999 | 11 (2.0%) | 22 (2.8%) |
| $100,000 to $299,999 | 330 (59.6%) | 575 (73.8%) |
| $300,000 to $499,999 | 160 (28.9%) | 158 (20.3%) |
| $500,000 to $749,999 | 0 (0.0%) | 3 (0.4%) |
| $750,000 to $999,999 | 7 (1.3%) | 0 (0.0%) |
| $1,000,000 or more | 0 (0.0%) | 0 (0.0%) |
| Total | 554 (100.0%) | 779 (100.0%) |
Household Income by Mortgage Status in Tri City
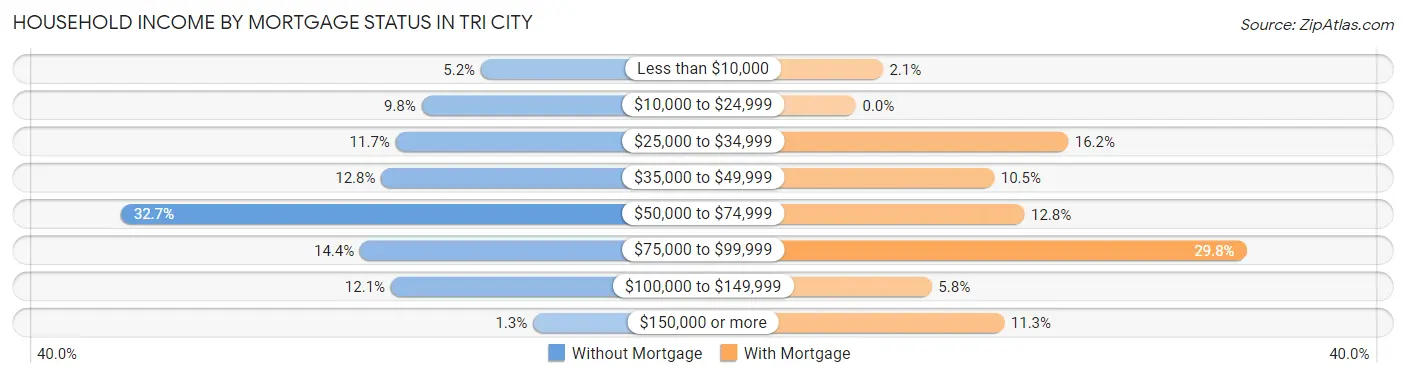
| Household Income | Without Mortgage | With Mortgage |
| Less than $10,000 | 29 (5.2%) | 16 (2.1%) |
| $10,000 to $24,999 | 54 (9.8%) | 0 (0.0%) |
| $25,000 to $34,999 | 65 (11.7%) | 126 (16.2%) |
| $35,000 to $49,999 | 71 (12.8%) | 82 (10.5%) |
| $50,000 to $74,999 | 181 (32.7%) | 100 (12.8%) |
| $75,000 to $99,999 | 80 (14.4%) | 232 (29.8%) |
| $100,000 to $149,999 | 67 (12.1%) | 45 (5.8%) |
| $150,000 or more | 7 (1.3%) | 88 (11.3%) |
| Total | 554 (100.0%) | 779 (100.0%) |
Property Value to Household Income Ratio in Tri City
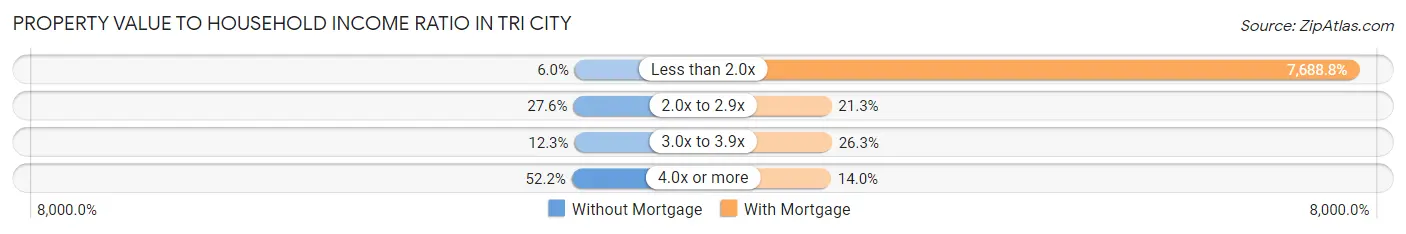
| Value-to-Income Ratio | Without Mortgage | With Mortgage |
| Less than 2.0x | 33 (6.0%) | 59,896 (7,688.8%) |
| 2.0x to 2.9x | 153 (27.6%) | 166 (21.3%) |
| 3.0x to 3.9x | 68 (12.3%) | 205 (26.3%) |
| 4.0x or more | 289 (52.2%) | 109 (14.0%) |
| Total | 554 (100.0%) | 779 (100.0%) |
Real Estate Taxes by Mortgage Status in Tri City
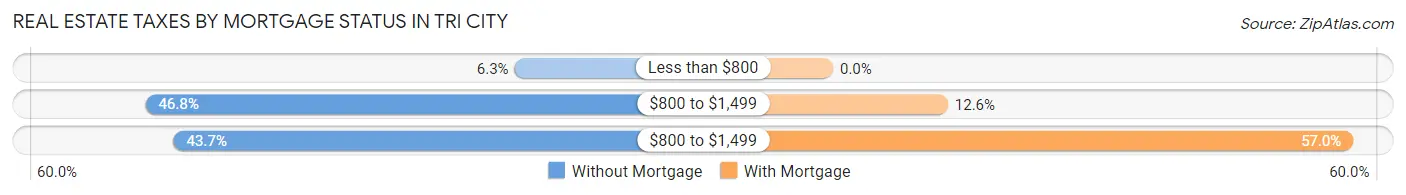
| Property Taxes | Without Mortgage | With Mortgage |
| Less than $800 | 35 (6.3%) | 0 (0.0%) |
| $800 to $1,499 | 259 (46.8%) | 98 (12.6%) |
| $800 to $1,499 | 242 (43.7%) | 444 (57.0%) |
| Total | 554 (100.0%) | 779 (100.0%) |
Health & Disability in Tri City
Health Insurance Coverage by Age in Tri City
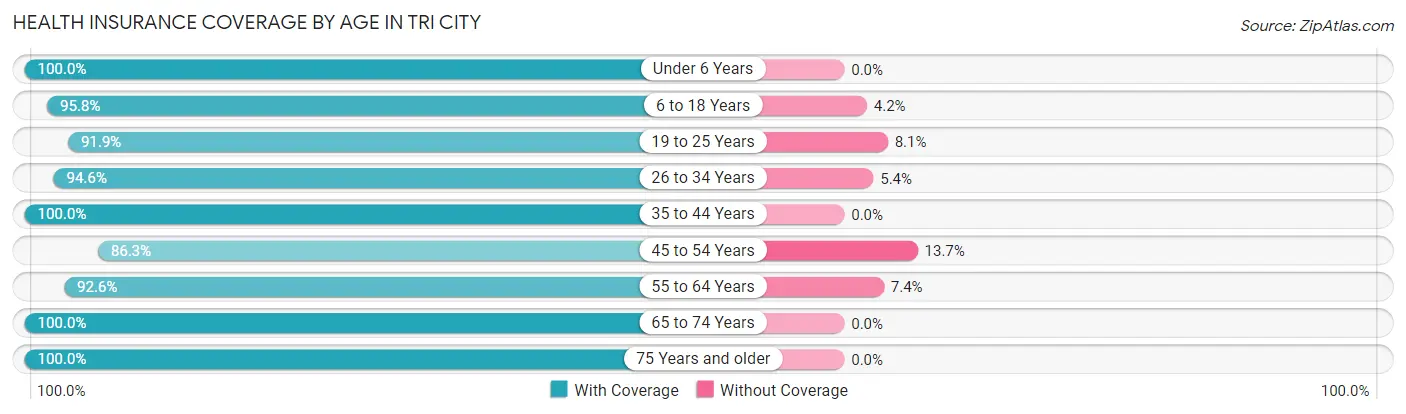
| Age Bracket | With Coverage | Without Coverage |
| Under 6 Years | 134 (100.0%) | 0 (0.0%) |
| 6 to 18 Years | 342 (95.8%) | 15 (4.2%) |
| 19 to 25 Years | 159 (91.9%) | 14 (8.1%) |
| 26 to 34 Years | 402 (94.6%) | 23 (5.4%) |
| 35 to 44 Years | 348 (100.0%) | 0 (0.0%) |
| 45 to 54 Years | 423 (86.3%) | 67 (13.7%) |
| 55 to 64 Years | 578 (92.6%) | 46 (7.4%) |
| 65 to 74 Years | 907 (100.0%) | 0 (0.0%) |
| 75 Years and older | 352 (100.0%) | 0 (0.0%) |
| Total | 3,645 (95.7%) | 165 (4.3%) |
Health Insurance Coverage by Citizenship Status in Tri City
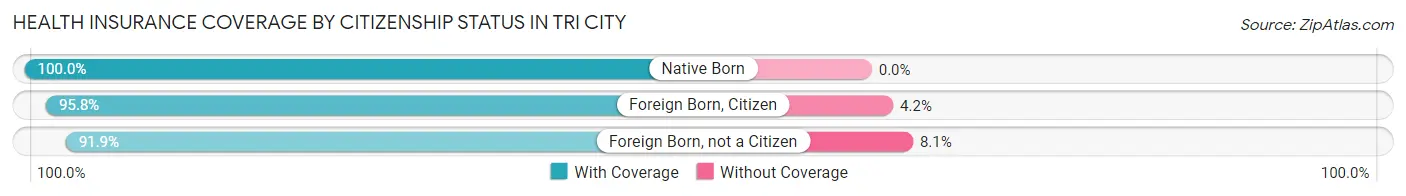
| Citizenship Status | With Coverage | Without Coverage |
| Native Born | 134 (100.0%) | 0 (0.0%) |
| Foreign Born, Citizen | 342 (95.8%) | 15 (4.2%) |
| Foreign Born, not a Citizen | 159 (91.9%) | 14 (8.1%) |
Health Insurance Coverage by Household Income in Tri City
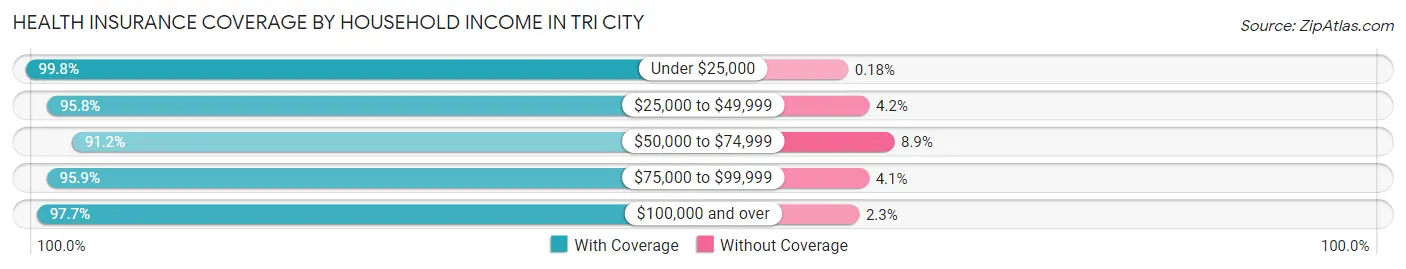
| Household Income | With Coverage | Without Coverage |
| Under $25,000 | 558 (99.8%) | 1 (0.2%) |
| $25,000 to $49,999 | 732 (95.8%) | 32 (4.2%) |
| $50,000 to $74,999 | 958 (91.1%) | 93 (8.8%) |
| $75,000 to $99,999 | 327 (95.9%) | 14 (4.1%) |
| $100,000 and over | 1,070 (97.7%) | 25 (2.3%) |
Public vs Private Health Insurance Coverage by Age in Tri City
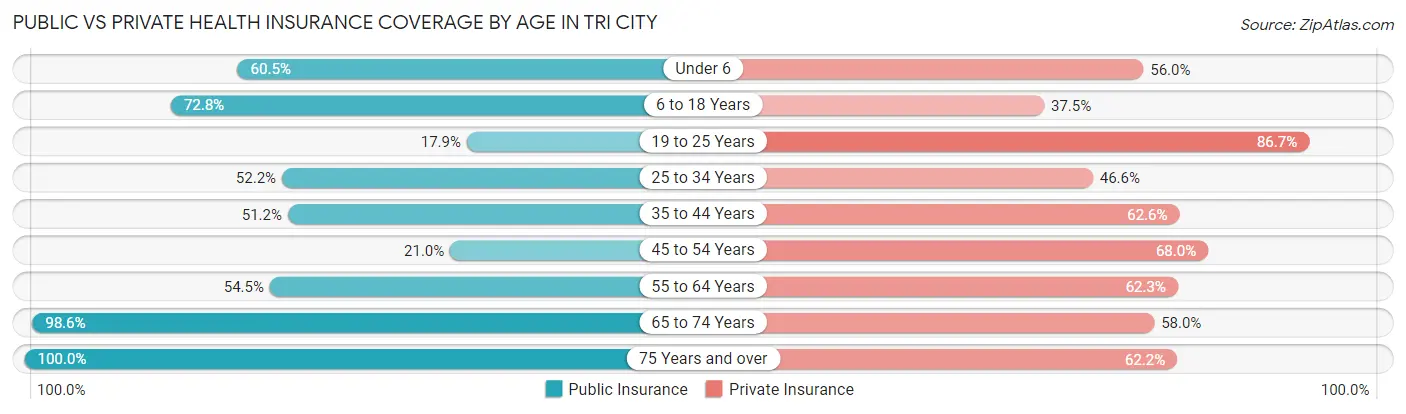
| Age Bracket | Public Insurance | Private Insurance |
| Under 6 | 81 (60.5%) | 75 (56.0%) |
| 6 to 18 Years | 260 (72.8%) | 134 (37.5%) |
| 19 to 25 Years | 31 (17.9%) | 150 (86.7%) |
| 25 to 34 Years | 222 (52.2%) | 198 (46.6%) |
| 35 to 44 Years | 178 (51.1%) | 218 (62.6%) |
| 45 to 54 Years | 103 (21.0%) | 333 (68.0%) |
| 55 to 64 Years | 340 (54.5%) | 389 (62.3%) |
| 65 to 74 Years | 894 (98.6%) | 526 (58.0%) |
| 75 Years and over | 352 (100.0%) | 219 (62.2%) |
| Total | 2,461 (64.6%) | 2,242 (58.9%) |
Disability Status by Sex by Age in Tri City
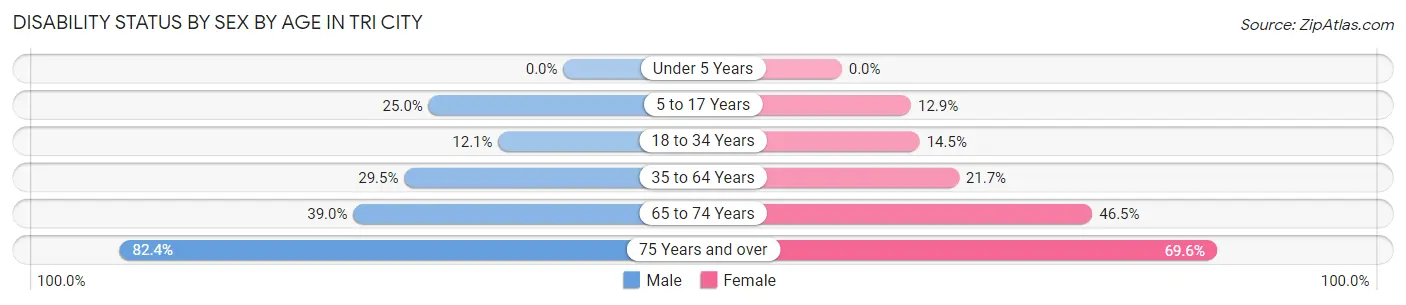
| Age Bracket | Male | Female |
| Under 5 Years | 0 (0.0%) | 0 (0.0%) |
| 5 to 17 Years | 60 (25.0%) | 18 (12.9%) |
| 18 to 34 Years | 38 (12.1%) | 44 (14.5%) |
| 35 to 64 Years | 228 (29.5%) | 150 (21.7%) |
| 65 to 74 Years | 186 (39.0%) | 200 (46.5%) |
| 75 Years and over | 168 (82.4%) | 103 (69.6%) |
Disability Class by Sex by Age in Tri City
Disability Class: Hearing Difficulty
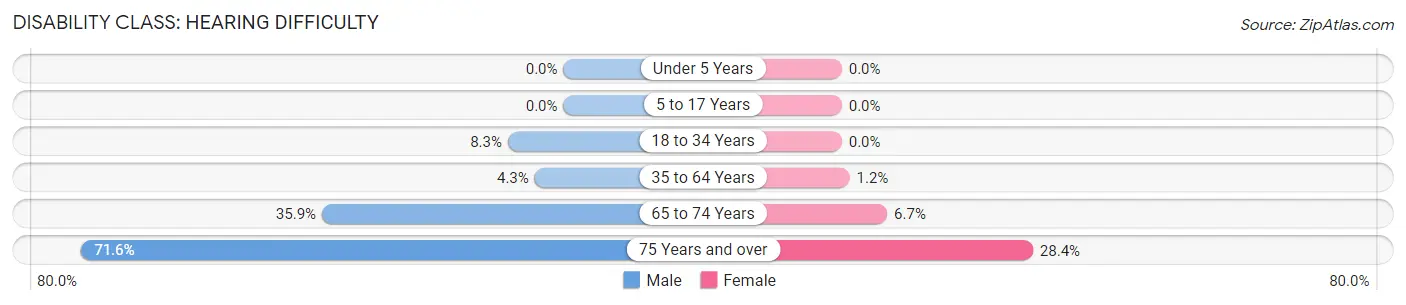
| Age Bracket | Male | Female |
| Under 5 Years | 0 (0.0%) | 0 (0.0%) |
| 5 to 17 Years | 0 (0.0%) | 0 (0.0%) |
| 18 to 34 Years | 26 (8.3%) | 0 (0.0%) |
| 35 to 64 Years | 33 (4.3%) | 8 (1.2%) |
| 65 to 74 Years | 171 (35.8%) | 29 (6.7%) |
| 75 Years and over | 146 (71.6%) | 42 (28.4%) |
Disability Class: Vision Difficulty
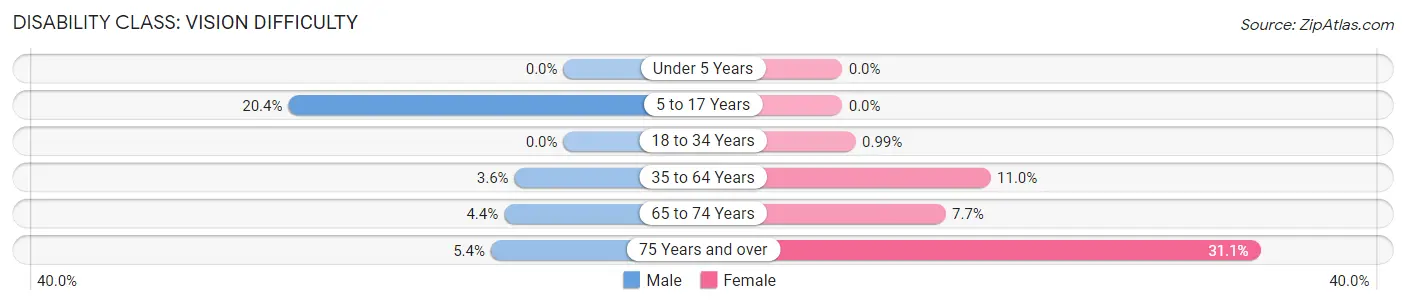
| Age Bracket | Male | Female |
| Under 5 Years | 0 (0.0%) | 0 (0.0%) |
| 5 to 17 Years | 49 (20.4%) | 0 (0.0%) |
| 18 to 34 Years | 0 (0.0%) | 3 (1.0%) |
| 35 to 64 Years | 28 (3.6%) | 76 (11.0%) |
| 65 to 74 Years | 21 (4.4%) | 33 (7.7%) |
| 75 Years and over | 11 (5.4%) | 46 (31.1%) |
Disability Class: Cognitive Difficulty
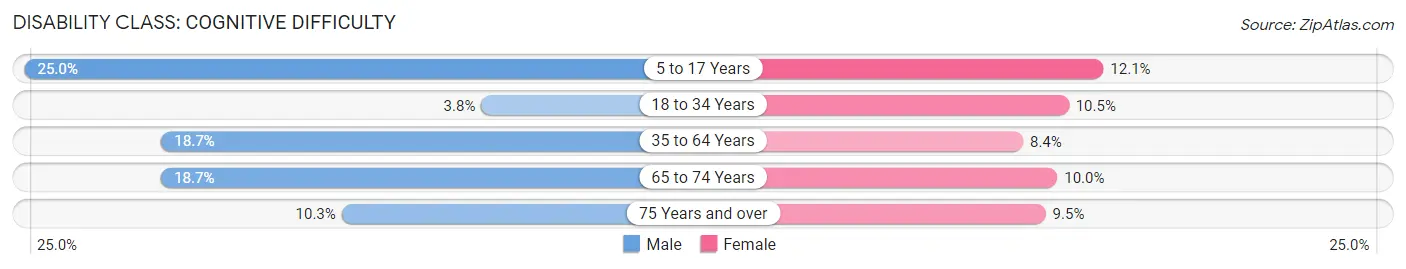
| Age Bracket | Male | Female |
| 5 to 17 Years | 60 (25.0%) | 17 (12.1%) |
| 18 to 34 Years | 12 (3.8%) | 32 (10.5%) |
| 35 to 64 Years | 144 (18.6%) | 58 (8.4%) |
| 65 to 74 Years | 89 (18.7%) | 43 (10.0%) |
| 75 Years and over | 21 (10.3%) | 14 (9.5%) |
Disability Class: Ambulatory Difficulty
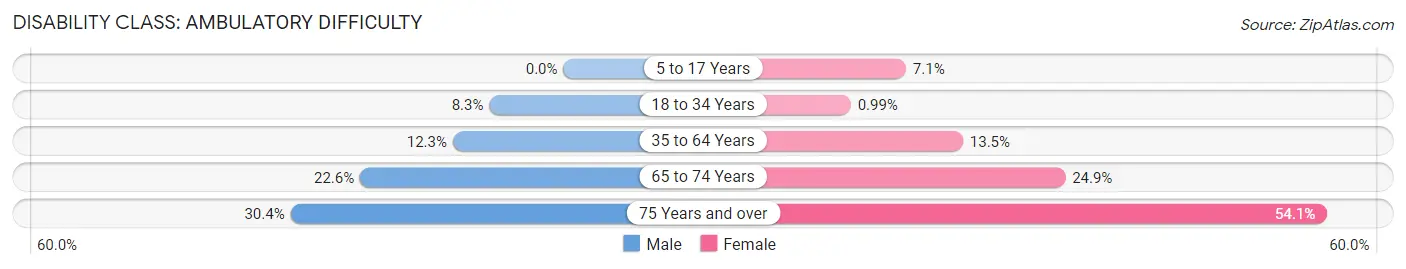
| Age Bracket | Male | Female |
| 5 to 17 Years | 0 (0.0%) | 10 (7.1%) |
| 18 to 34 Years | 26 (8.3%) | 3 (1.0%) |
| 35 to 64 Years | 95 (12.3%) | 93 (13.5%) |
| 65 to 74 Years | 108 (22.6%) | 107 (24.9%) |
| 75 Years and over | 62 (30.4%) | 80 (54.0%) |
Disability Class: Self-Care Difficulty
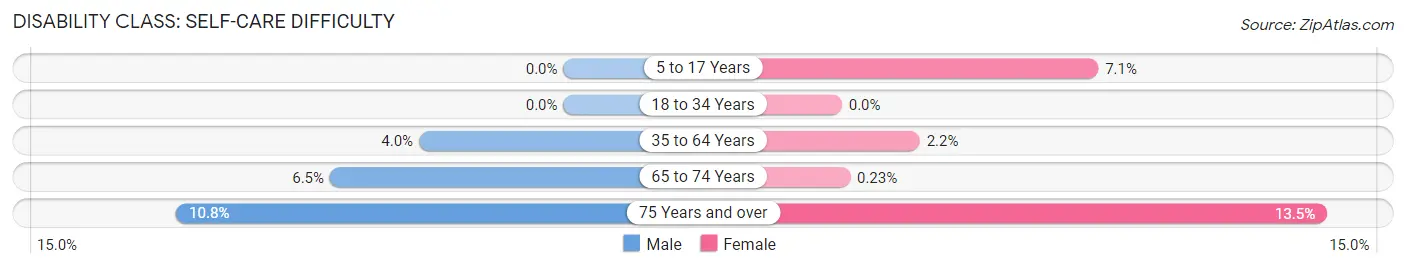
| Age Bracket | Male | Female |
| 5 to 17 Years | 0 (0.0%) | 10 (7.1%) |
| 18 to 34 Years | 0 (0.0%) | 0 (0.0%) |
| 35 to 64 Years | 31 (4.0%) | 15 (2.2%) |
| 65 to 74 Years | 31 (6.5%) | 1 (0.2%) |
| 75 Years and over | 22 (10.8%) | 20 (13.5%) |
Technology Access in Tri City
Computing Device Access in Tri City
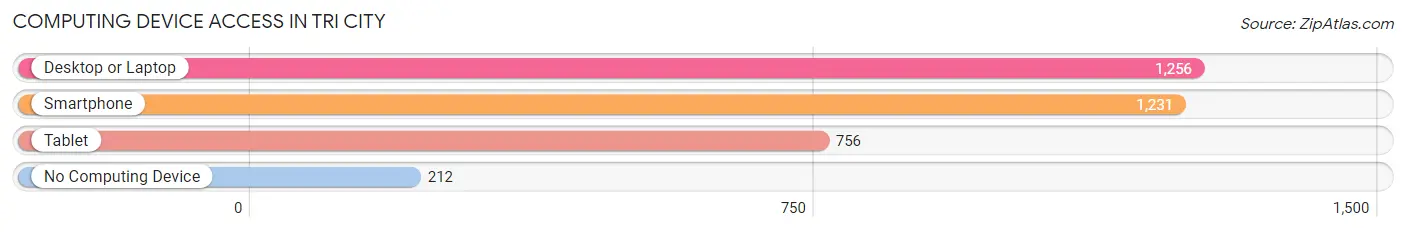
| Device Type | # Households | % Households |
| Desktop or Laptop | 1,256 | 74.3% |
| Smartphone | 1,231 | 72.8% |
| Tablet | 756 | 44.7% |
| No Computing Device | 212 | 12.5% |
| Total | 1,691 | 100.0% |
Internet Access in Tri City
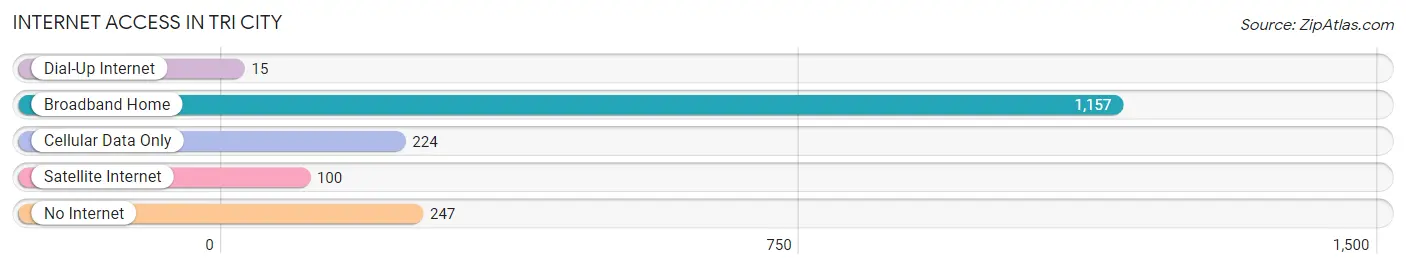
| Internet Type | # Households | % Households |
| Dial-Up Internet | 15 | 0.9% |
| Broadband Home | 1,157 | 68.4% |
| Cellular Data Only | 224 | 13.3% |
| Satellite Internet | 100 | 5.9% |
| No Internet | 247 | 14.6% |
| Total | 1,691 | 100.0% |
Tri City Summary
Tri City, Oregon is a small city located in the northeastern corner of the state. It is situated in the foothills of the Cascade Mountains, and is bordered by the Columbia River to the north and the Deschutes River to the south. The city is home to a population of approximately 8,000 people, and is the county seat of Umatilla County.
History
The area that is now Tri City was first inhabited by the Cayuse and Umatilla tribes, who were part of the larger Plateau culture. The first European settlers arrived in the area in the early 1800s, and the city was officially founded in 1864. The city was named after the three rivers that converge in the area: the Columbia, Deschutes, and Umatilla.
In the late 1800s, the city became a hub for the timber industry, and the population began to grow. The city was incorporated in 1891, and the first mayor was elected in 1892. The city continued to grow throughout the 20th century, and by the 2000s, it had become a popular tourist destination.
Geography
Tri City is located in the northeastern corner of Oregon, in the foothills of the Cascade Mountains. The city is bordered by the Columbia River to the north and the Deschutes River to the south. The city is situated at an elevation of 1,200 feet, and has a total area of 4.2 square miles.
The climate in Tri City is classified as a semi-arid climate, with hot summers and cold winters. The average annual temperature is around 50 degrees Fahrenheit, and the average annual precipitation is around 15 inches.
Economy
The economy of Tri City is largely based on agriculture and tourism. The city is home to several wineries, and is a popular destination for wine tasting. The city is also home to several small businesses, including restaurants, retail stores, and art galleries.
The city is also home to several manufacturing companies, including a paper mill and a wood products plant. The city is also home to a large military base, which provides jobs for many of the city’s residents.
Demographics
As of the 2010 census, the population of Tri City was 8,072. The racial makeup of the city was 79.3% White, 0.7% African American, 0.9% Native American, 0.7% Asian, 0.1% Pacific Islander, and 17.3% from other races. The median household income was $37,917, and the median family income was $45,917.
The city is home to a diverse population, with a variety of religious backgrounds. The largest religious group is the Catholic Church, followed by the Church of Jesus Christ of Latter-day Saints, and the Assemblies of God.
Tri City is a small city with a rich history and a diverse population. The city is home to a variety of businesses, and is a popular tourist destination. The city is also home to a large military base, which provides jobs for many of the city’s residents. Tri City is a great place to live, work, and visit.
Common Questions
What is Per Capita Income in Tri City?
Per Capita income in Tri City is $30,155.
What is the Median Family Income in Tri City?
Median Family Income in Tri City is $61,075.
What is the Median Household income in Tri City?
Median Household Income in Tri City is $53,766.
What is Income or Wage Gap in Tri City?
Income or Wage Gap in Tri City is 25.7%.
Women in Tri City earn 74.3 cents for every dollar earned by a man.
What is Inequality or Gini Index in Tri City?
Inequality or Gini Index in Tri City is 0.41.
What is the Total Population of Tri City?
Total Population of Tri City is 3,810.
What is the Total Male Population of Tri City?
Total Male Population of Tri City is 2,098.
What is the Total Female Population of Tri City?
Total Female Population of Tri City is 1,712.
What is the Ratio of Males per 100 Females in Tri City?
There are 122.55 Males per 100 Females in Tri City.
What is the Ratio of Females per 100 Males in Tri City?
There are 81.60 Females per 100 Males in Tri City.
What is the Median Population Age in Tri City?
Median Population Age in Tri City is 53.8 Years.
What is the Average Family Size in Tri City
Average Family Size in Tri City is 2.9 People.
What is the Average Household Size in Tri City
Average Household Size in Tri City is 2.2 People.
How Large is the Labor Force in Tri City?
There are 1,393 People in the Labor Forcein in Tri City.
What is the Percentage of People in the Labor Force in Tri City?
40.8% of People are in the Labor Force in Tri City.
What is the Unemployment Rate in Tri City?
Unemployment Rate in Tri City is 13.7%.