Zip Codes with the Highest Percentage of Population Employed in Administrative & Support Services in Hillsboro, OR
RELATED REPORTS & OPTIONS
Administrative & Support Services
Hillsboro
Compare Zip Codes
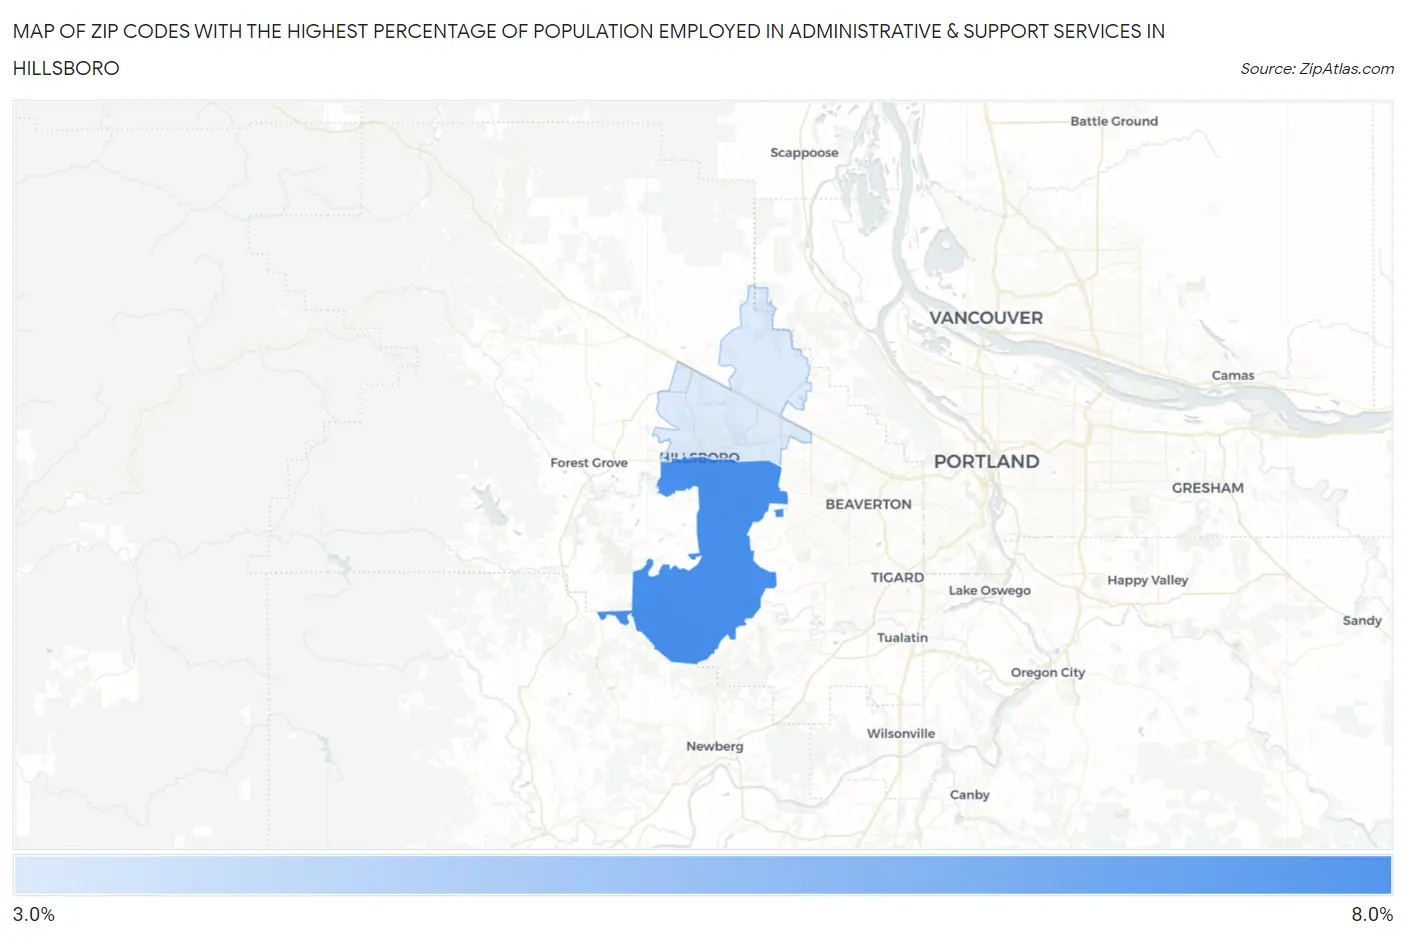
Map of Zip Codes with the Highest Percentage of Population Employed in Administrative & Support Services in Hillsboro
4.0%
6.2%
Zip Codes with the Highest Percentage of Population Employed in Administrative & Support Services in Hillsboro, OR
| Zip Code | % Employed | vs State | vs National | |
| 1. | 97123 | 6.2% | 3.9%(+2.28)#60 | 4.1%(+2.07)#4,373 |
| 2. | 97124 | 4.0% | 3.9%(+0.019)#154 | 4.1%(-0.187)#10,848 |
1
Common Questions
What are the Top Zip Codes with the Highest Percentage of Population Employed in Administrative & Support Services in Hillsboro, OR?
Top Zip Codes with the Highest Percentage of Population Employed in Administrative & Support Services in Hillsboro, OR are:
What zip code has the Highest Percentage of Population Employed in Administrative & Support Services in Hillsboro, OR?
97123 has the Highest Percentage of Population Employed in Administrative & Support Services in Hillsboro, OR with 6.2%.
What is the Percentage of Population Employed in Administrative & Support Services in Hillsboro, OR?
Percentage of Population Employed in Administrative & Support Services in Hillsboro is 4.9%.
What is the Percentage of Population Employed in Administrative & Support Services in Oregon?
Percentage of Population Employed in Administrative & Support Services in Oregon is 3.9%.
What is the Percentage of Population Employed in Administrative & Support Services in the United States?
Percentage of Population Employed in Administrative & Support Services in the United States is 4.1%.