Mehama, OR Map & Demographics
Mehama Map
Mehama Overview
$35,690
PER CAPITA INCOME
0.43
INEQUALITY / GINI INDEX
534
TOTAL POPULATION
297
MALE POPULATION
237
FEMALE POPULATION
125.32
MALES / 100 FEMALES
79.80
FEMALES / 100 MALES
43.0
MEDIAN AGE
2.8
AVG FAMILY SIZE
2.4
AVG HOUSEHOLD SIZE
297
LABOR FORCE [ PEOPLE ]
66.0%
PERCENT IN LABOR FORCE
3.4%
UNEMPLOYMENT RATE
Mehama Zip Codes
Mehama Area Codes
Income in Mehama
Income Overview in Mehama
| Characteristic | Number | Measure |
| Per Capita Income | 534 | $35,690 |
| Median Family Income | 156 | $0 |
| Mean Family Income | 156 | $105,004 |
| Median Household Income | 224 | $0 |
| Mean Household Income | 224 | $81,618 |
| Income Deficit | 156 | $0 |
| Wage / Income Gap (%) | 534 | 0.00% |
| Wage / Income Gap ($) | 534 | 100.00¢ per $1 |
| Gini / Inequality Index | 534 | 0.43 |
Earnings by Sex in Mehama
| Sex | Number | Average Earnings |
| Male | 167 (56.2%) | $0 |
| Female | 130 (43.8%) | $0 |
| Total | 297 (100.0%) | $0 |
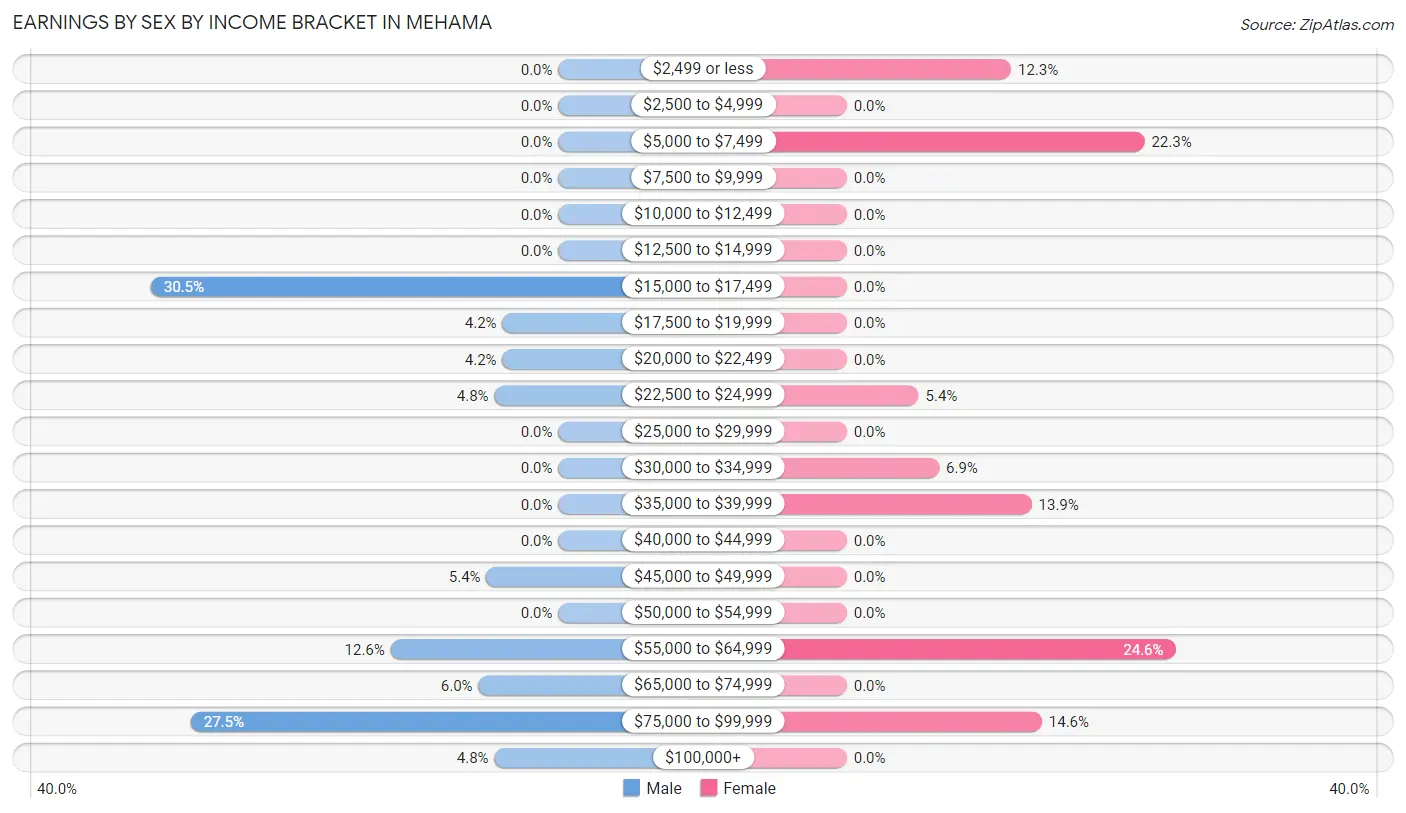
Earnings by Sex by Income Bracket in Mehama
The most common earnings brackets in Mehama are $15,000 to $17,499 for men (51 | 30.5%) and $55,000 to $64,999 for women (32 | 24.6%).
| Income | Male | Female |
| $2,499 or less | 0 (0.0%) | 16 (12.3%) |
| $2,500 to $4,999 | 0 (0.0%) | 0 (0.0%) |
| $5,000 to $7,499 | 0 (0.0%) | 29 (22.3%) |
| $7,500 to $9,999 | 0 (0.0%) | 0 (0.0%) |
| $10,000 to $12,499 | 0 (0.0%) | 0 (0.0%) |
| $12,500 to $14,999 | 0 (0.0%) | 0 (0.0%) |
| $15,000 to $17,499 | 51 (30.5%) | 0 (0.0%) |
| $17,500 to $19,999 | 7 (4.2%) | 0 (0.0%) |
| $20,000 to $22,499 | 7 (4.2%) | 0 (0.0%) |
| $22,500 to $24,999 | 8 (4.8%) | 7 (5.4%) |
| $25,000 to $29,999 | 0 (0.0%) | 0 (0.0%) |
| $30,000 to $34,999 | 0 (0.0%) | 9 (6.9%) |
| $35,000 to $39,999 | 0 (0.0%) | 18 (13.9%) |
| $40,000 to $44,999 | 0 (0.0%) | 0 (0.0%) |
| $45,000 to $49,999 | 9 (5.4%) | 0 (0.0%) |
| $50,000 to $54,999 | 0 (0.0%) | 0 (0.0%) |
| $55,000 to $64,999 | 21 (12.6%) | 32 (24.6%) |
| $65,000 to $74,999 | 10 (6.0%) | 0 (0.0%) |
| $75,000 to $99,999 | 46 (27.5%) | 19 (14.6%) |
| $100,000+ | 8 (4.8%) | 0 (0.0%) |
| Total | 167 (100.0%) | 130 (100.0%) |
Earnings by Sex by Educational Attainment in Mehama
| Educational Attainment | Male Income | Female Income |
| Less than High School | - | - |
| High School Diploma | - | - |
| College or Associate's Degree | - | - |
| Bachelor's Degree | - | - |
| Graduate Degree | - | - |
| Total | - | - |
Family Income in Mehama
Family Income Brackets in Mehama
According to the Mehama family income data, there are 60 families falling into the $150,000 to $199,999 income range, which is the most common income bracket and makes up 38.5% of all families.
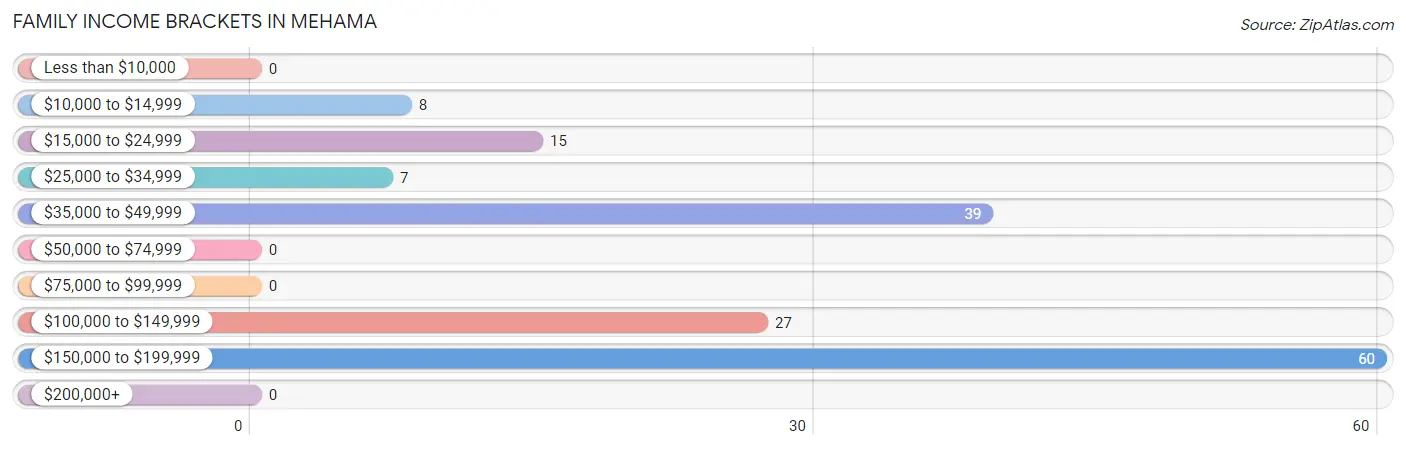
| Income Bracket | # Families | % Families |
| Less than $10,000 | 0 | 0.0% |
| $10,000 to $14,999 | 8 | 5.1% |
| $15,000 to $24,999 | 15 | 9.6% |
| $25,000 to $34,999 | 7 | 4.5% |
| $35,000 to $49,999 | 39 | 25.0% |
| $50,000 to $74,999 | 0 | 0.0% |
| $75,000 to $99,999 | 0 | 0.0% |
| $100,000 to $149,999 | 27 | 17.3% |
| $150,000 to $199,999 | 60 | 38.5% |
| $200,000+ | 0 | 0.0% |
Family Income by Famaliy Size in Mehama
4-person families (36 | 23.1%) account for the highest median family income in Mehama with $150,357 per family, while 4-person families (36 | 23.1%) have the highest median income of $37,589 per family member.
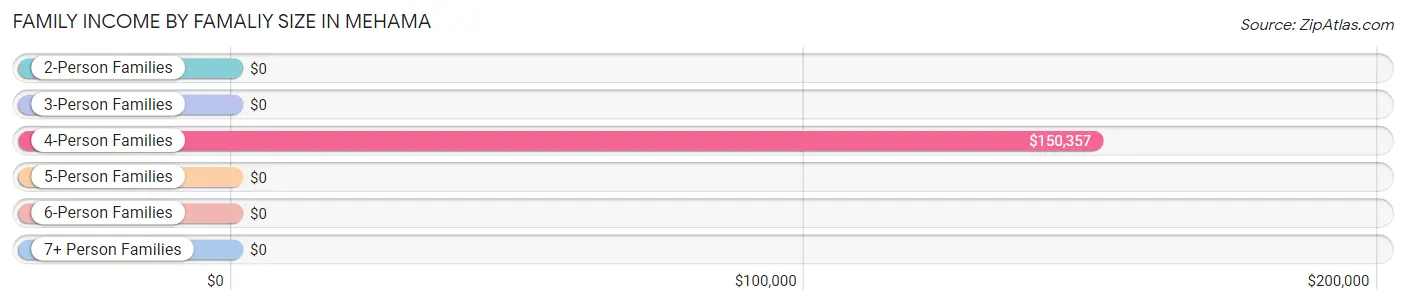
| Income Bracket | # Families | Median Income |
| 2-Person Families | 79 (50.6%) | $0 |
| 3-Person Families | 41 (26.3%) | $0 |
| 4-Person Families | 36 (23.1%) | $150,357 |
| 5-Person Families | 0 (0.0%) | $0 |
| 6-Person Families | 0 (0.0%) | $0 |
| 7+ Person Families | 0 (0.0%) | $0 |
| Total | 156 (100.0%) | $0 |
Family Income by Number of Earners in Mehama
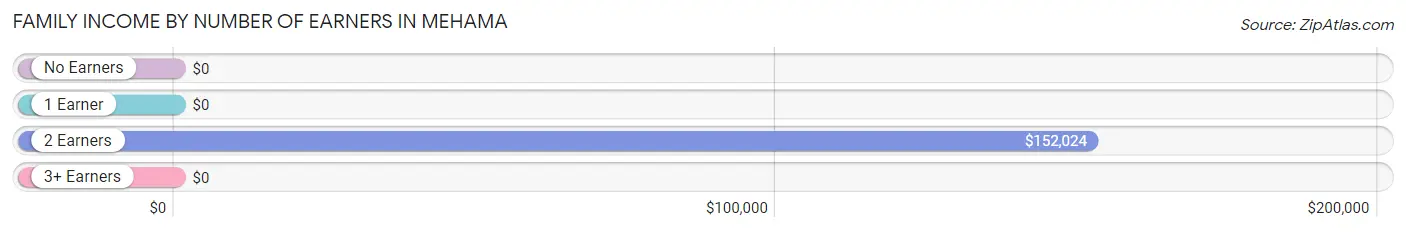
| Number of Earners | # Families | Median Income |
| No Earners | 47 (30.1%) | $0 |
| 1 Earner | 23 (14.7%) | $0 |
| 2 Earners | 86 (55.1%) | $152,024 |
| 3+ Earners | 0 (0.0%) | $0 |
| Total | 156 (100.0%) | $0 |
Household Income in Mehama
Household Income Brackets in Mehama
With 67 households falling in the category, the $15,000 to $24,999 income range is the most frequent in Mehama, accounting for 29.9% of all households.
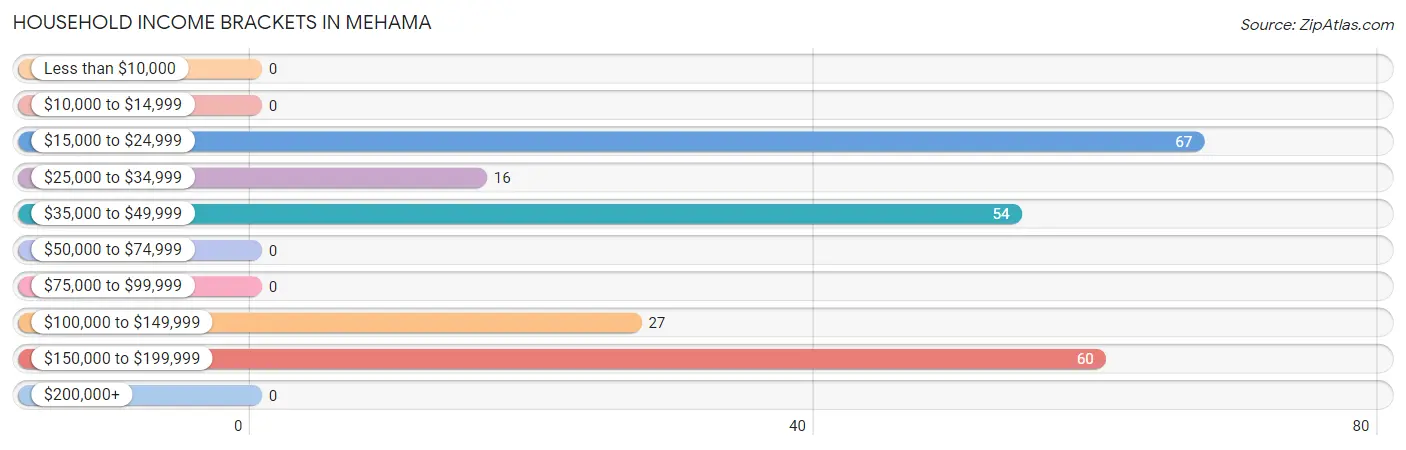
| Income Bracket | # Households | % Households |
| Less than $10,000 | 0 | 0.0% |
| $10,000 to $14,999 | 0 | 0.0% |
| $15,000 to $24,999 | 67 | 29.9% |
| $25,000 to $34,999 | 16 | 7.1% |
| $35,000 to $49,999 | 54 | 24.1% |
| $50,000 to $74,999 | 0 | 0.0% |
| $75,000 to $99,999 | 0 | 0.0% |
| $100,000 to $149,999 | 27 | 12.1% |
| $150,000 to $199,999 | 60 | 26.8% |
| $200,000+ | 0 | 0.0% |
Household Income by Householder Age in Mehama
The median household income in Mehama is $0, with the highest median household income of $151,845 found in the 25 to 44 years age bracket for the primary householder. A total of 75 households (33.5%) fall into this category.
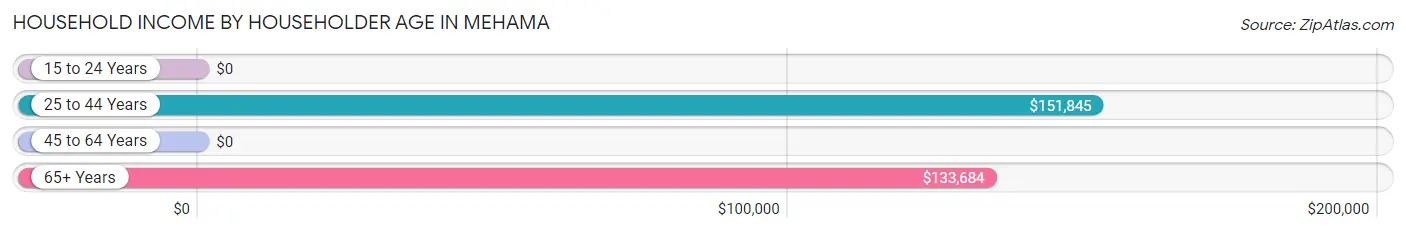
| Income Bracket | # Households | Median Income |
| 15 to 24 Years | 0 (0.0%) | $0 |
| 25 to 44 Years | 75 (33.5%) | $151,845 |
| 45 to 64 Years | 115 (51.3%) | $0 |
| 65+ Years | 34 (15.2%) | $133,684 |
| Total | 224 (100.0%) | $0 |
Poverty in Mehama
Income Below Poverty by Sex and Age in Mehama
With 12.5% poverty level for males and 31.2% for females among the residents of Mehama, 6 to 11 year old males and 45 to 54 year old females are the most vulnerable to poverty, with 7 males (100.0%) and 8 females (100.0%) in their respective age groups living below the poverty level.
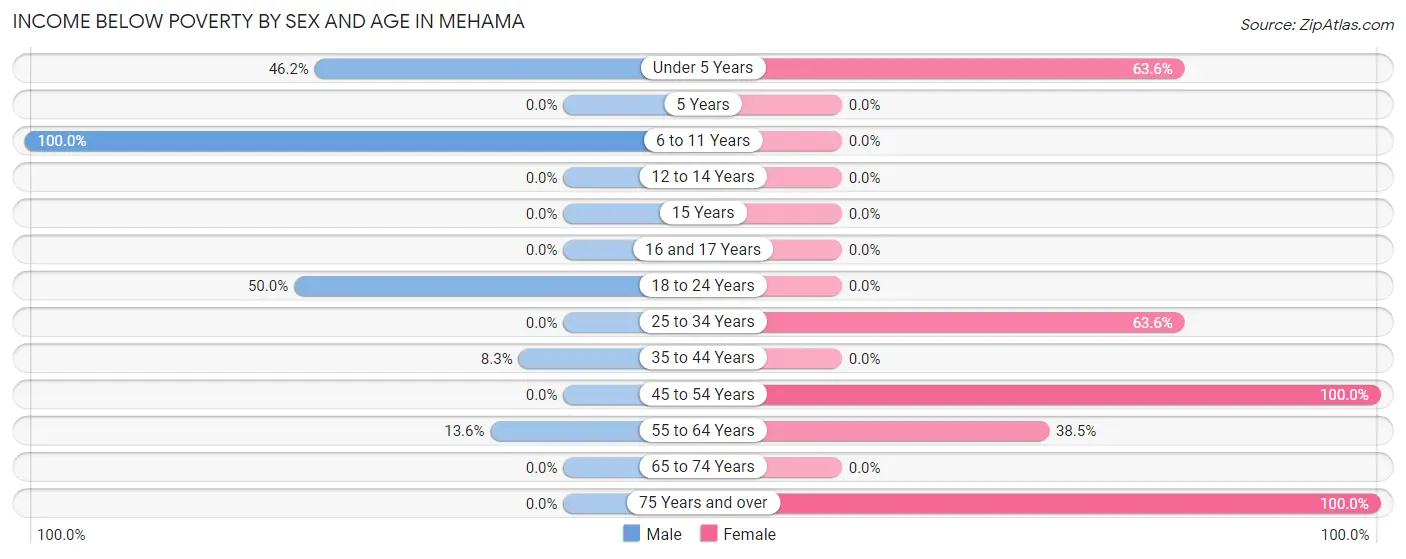
| Age Bracket | Male | Female |
| Under 5 Years | 6 (46.2%) | 14 (63.6%) |
| 5 Years | 0 (0.0%) | 0 (0.0%) |
| 6 to 11 Years | 7 (100.0%) | 0 (0.0%) |
| 12 to 14 Years | 0 (0.0%) | 0 (0.0%) |
| 15 Years | 0 (0.0%) | 0 (0.0%) |
| 16 and 17 Years | 0 (0.0%) | 0 (0.0%) |
| 18 to 24 Years | 9 (50.0%) | 0 (0.0%) |
| 25 to 34 Years | 0 (0.0%) | 14 (63.6%) |
| 35 to 44 Years | 7 (8.3%) | 0 (0.0%) |
| 45 to 54 Years | 0 (0.0%) | 8 (100.0%) |
| 55 to 64 Years | 8 (13.6%) | 30 (38.5%) |
| 65 to 74 Years | 0 (0.0%) | 0 (0.0%) |
| 75 Years and over | 0 (0.0%) | 8 (100.0%) |
| Total | 37 (12.5%) | 74 (31.2%) |
Income Above Poverty by Sex and Age in Mehama
According to the poverty statistics in Mehama, males aged 5 years and females aged 12 to 14 years are the age groups that are most secure financially, with 100.0% of males and 100.0% of females in these age groups living above the poverty line.
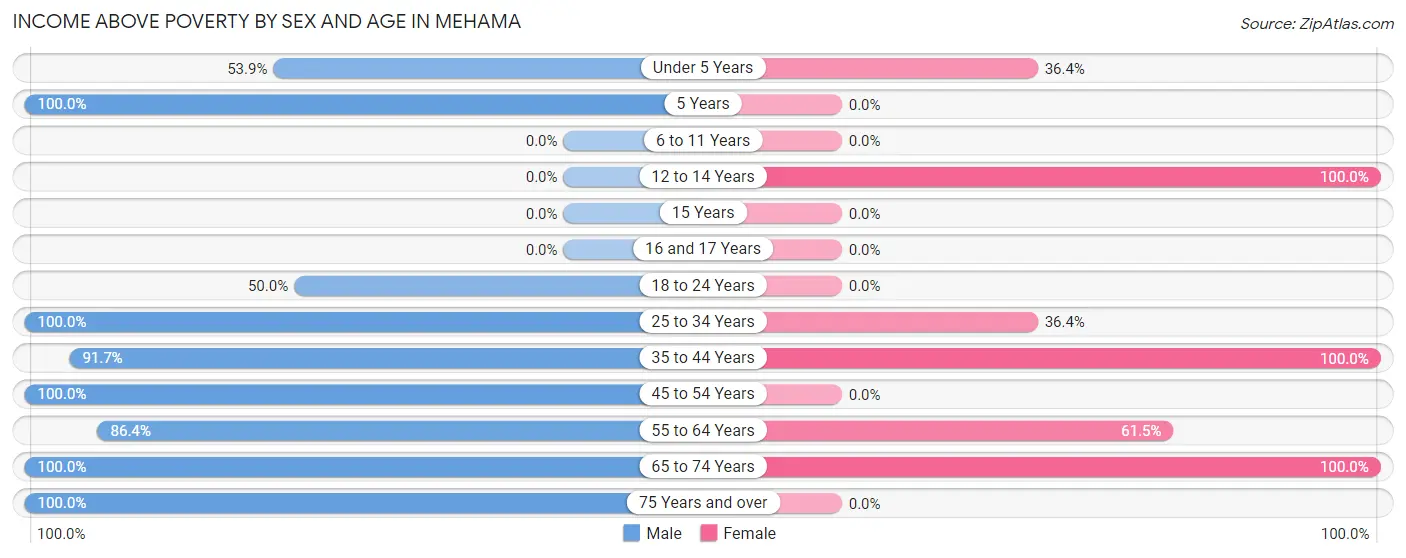
| Age Bracket | Male | Female |
| Under 5 Years | 7 (53.8%) | 8 (36.4%) |
| 5 Years | 20 (100.0%) | 0 (0.0%) |
| 6 to 11 Years | 0 (0.0%) | 0 (0.0%) |
| 12 to 14 Years | 0 (0.0%) | 22 (100.0%) |
| 15 Years | 0 (0.0%) | 0 (0.0%) |
| 16 and 17 Years | 0 (0.0%) | 0 (0.0%) |
| 18 to 24 Years | 9 (50.0%) | 0 (0.0%) |
| 25 to 34 Years | 15 (100.0%) | 8 (36.4%) |
| 35 to 44 Years | 77 (91.7%) | 51 (100.0%) |
| 45 to 54 Years | 8 (100.0%) | 0 (0.0%) |
| 55 to 64 Years | 51 (86.4%) | 48 (61.5%) |
| 65 to 74 Years | 47 (100.0%) | 26 (100.0%) |
| 75 Years and over | 26 (100.0%) | 0 (0.0%) |
| Total | 260 (87.5%) | 163 (68.8%) |
Income Below Poverty Among Married-Couple Families in Mehama
The poverty statistics for married-couple families in Mehama show that 10.6% or 15 of the total 141 families live below the poverty line. Families with 1 or 2 children have the highest poverty rate of 19.4%, comprising of 7 families. On the other hand, families with no children have the lowest poverty rate of 7.6%, which includes 8 families.
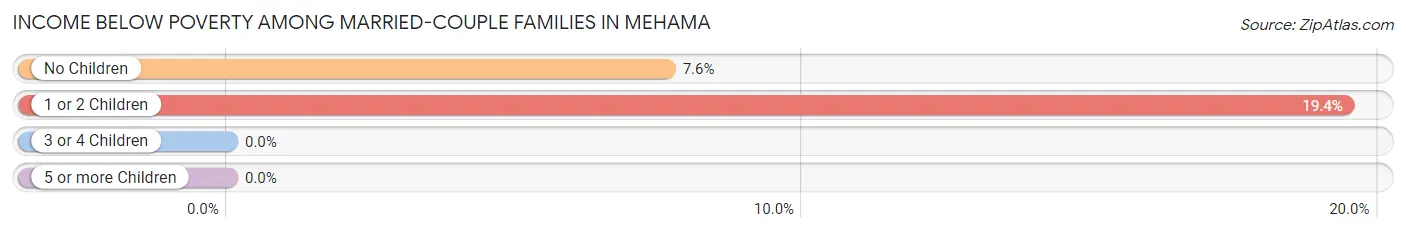
| Children | Above Poverty | Below Poverty |
| No Children | 97 (92.4%) | 8 (7.6%) |
| 1 or 2 Children | 29 (80.6%) | 7 (19.4%) |
| 3 or 4 Children | 0 (0.0%) | 0 (0.0%) |
| 5 or more Children | 0 (0.0%) | 0 (0.0%) |
| Total | 126 (89.4%) | 15 (10.6%) |
Income Below Poverty Among Single-Parent Households in Mehama
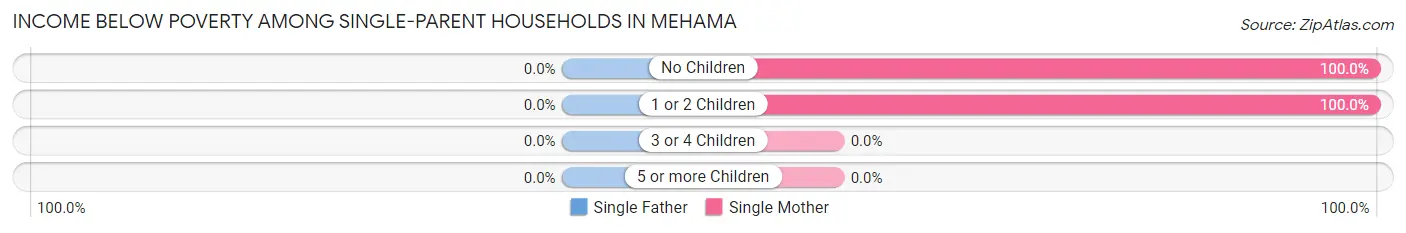
| Children | Single Father | Single Mother |
| No Children | 0 (0.0%) | 8 (100.0%) |
| 1 or 2 Children | 0 (0.0%) | 7 (100.0%) |
| 3 or 4 Children | 0 (0.0%) | 0 (0.0%) |
| 5 or more Children | 0 (0.0%) | 0 (0.0%) |
| Total | 0 (0.0%) | 15 (100.0%) |
Income Below Poverty Among Married-Couple vs Single-Parent Households in Mehama
The poverty data for Mehama shows that 15 of the married-couple family households (10.6%) and 15 of the single-parent households (100.0%) are living below the poverty level. Within the married-couple family households, those with 1 or 2 children have the highest poverty rate, with 7 households (19.4%) falling below the poverty line. Among the single-parent households, those with no children have the highest poverty rate, with 8 household (100.0%) living below poverty.
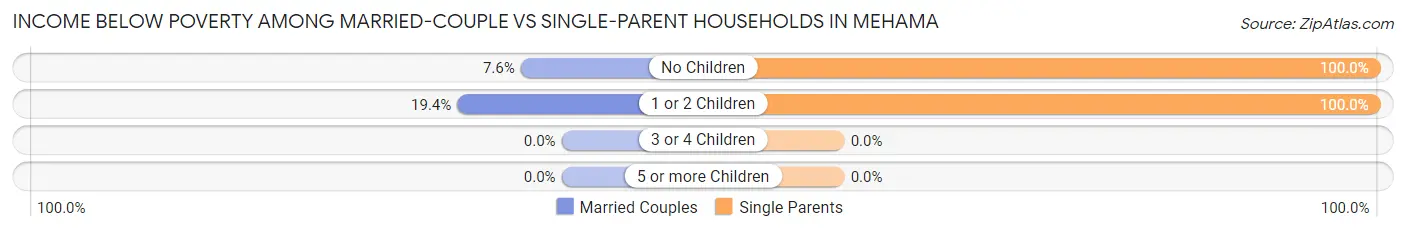
| Children | Married-Couple Families | Single-Parent Households |
| No Children | 8 (7.6%) | 8 (100.0%) |
| 1 or 2 Children | 7 (19.4%) | 7 (100.0%) |
| 3 or 4 Children | 0 (0.0%) | 0 (0.0%) |
| 5 or more Children | 0 (0.0%) | 0 (0.0%) |
| Total | 15 (10.6%) | 15 (100.0%) |
Race in Mehama
The most populous races in Mehama are White / Caucasian (461 | 86.3%), Two or more Races (57 | 10.7%), and Native / Alaskan (16 | 3.0%).
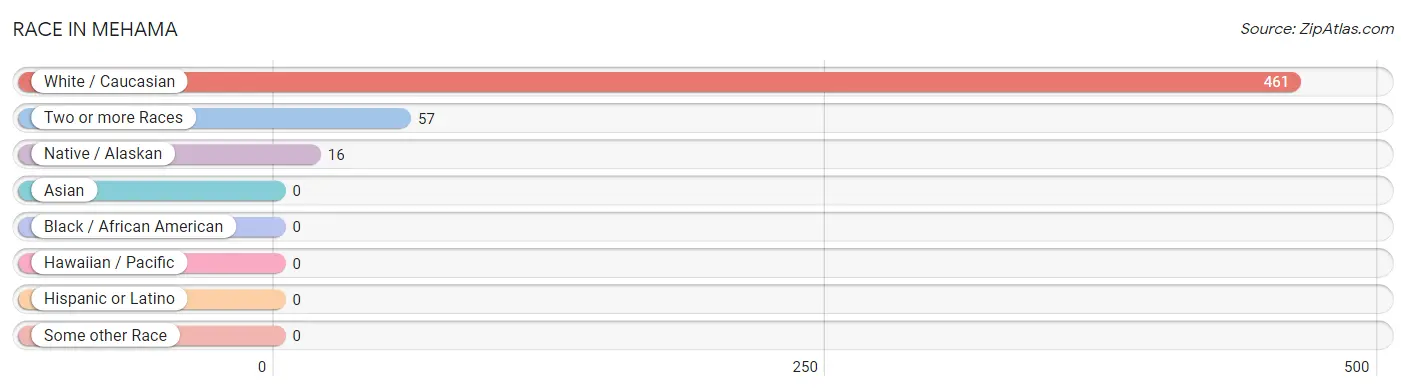
| Race | # Population | % Population |
| Asian | 0 | 0.0% |
| Black / African American | 0 | 0.0% |
| Hawaiian / Pacific | 0 | 0.0% |
| Hispanic or Latino | 0 | 0.0% |
| Native / Alaskan | 16 | 3.0% |
| White / Caucasian | 461 | 86.3% |
| Two or more Races | 57 | 10.7% |
| Some other Race | 0 | 0.0% |
| Total | 534 | 100.0% |
Ancestry in Mehama
The most populous ancestries reported in Mehama are German (138 | 25.8%), French (103 | 19.3%), English (79 | 14.8%), European (62 | 11.6%), and Irish (57 | 10.7%), together accounting for 82.2% of all Mehama residents.
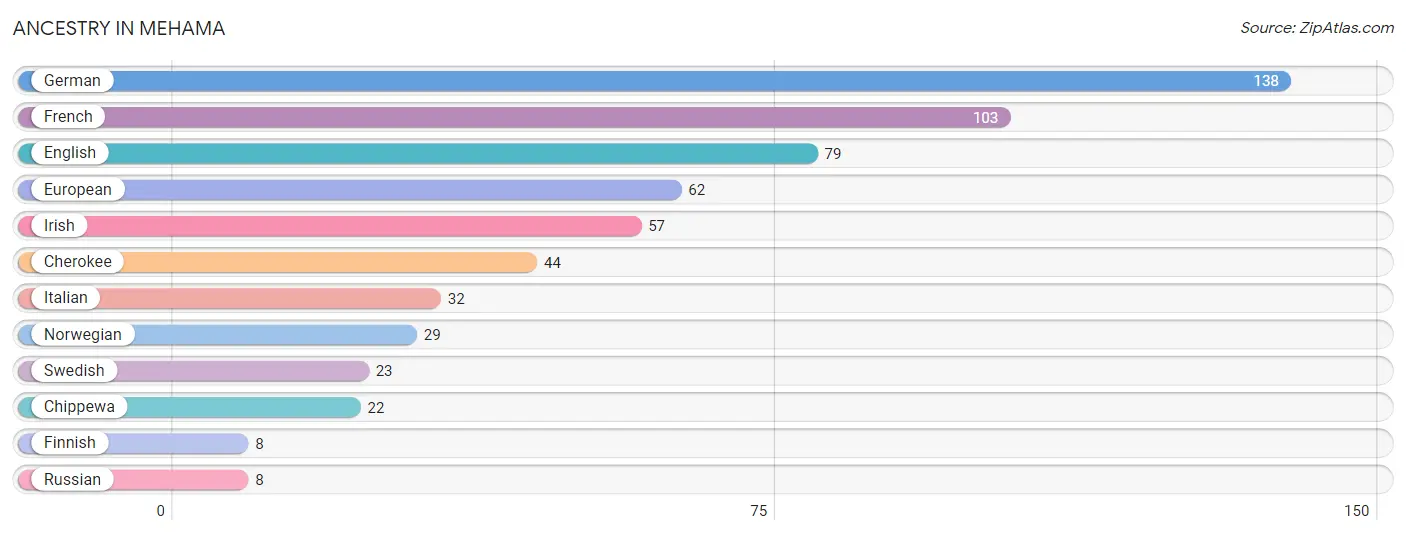
| Ancestry | # Population | % Population |
| Cherokee | 44 | 8.2% |
| Chippewa | 22 | 4.1% |
| English | 79 | 14.8% |
| European | 62 | 11.6% |
| Finnish | 8 | 1.5% |
| French | 103 | 19.3% |
| German | 138 | 25.8% |
| Irish | 57 | 10.7% |
| Italian | 32 | 6.0% |
| Norwegian | 29 | 5.4% |
| Russian | 8 | 1.5% |
| Swedish | 23 | 4.3% | View All 12 Rows |
Immigrants in Mehama
The most numerous immigrant groups reported in Mehama came from Canada (22 | 4.1%), Asia (8 | 1.5%), China (8 | 1.5%), and Eastern Asia (8 | 1.5%), together accounting for 8.6% of all Mehama residents.
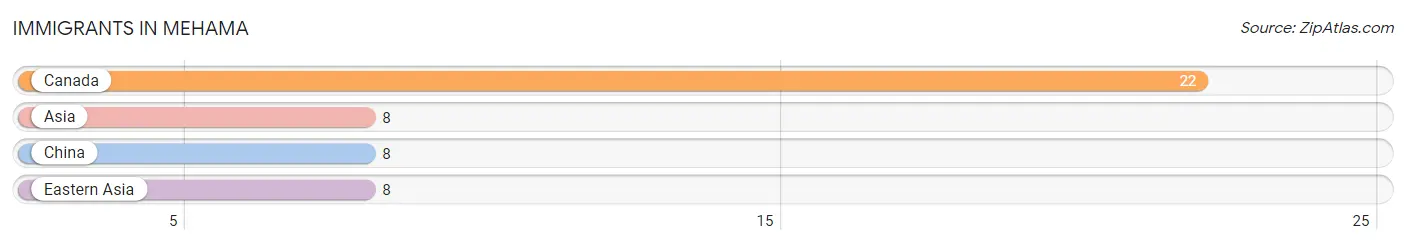
| Immigration Origin | # Population | % Population |
| Asia | 8 | 1.5% |
| Canada | 22 | 4.1% |
| China | 8 | 1.5% |
| Eastern Asia | 8 | 1.5% | View All 4 Rows |
Sex and Age in Mehama
Sex and Age in Mehama
The most populous age groups in Mehama are 35 to 39 Years (56 | 18.9%) for men and 60 to 64 Years (56 | 23.6%) for women.
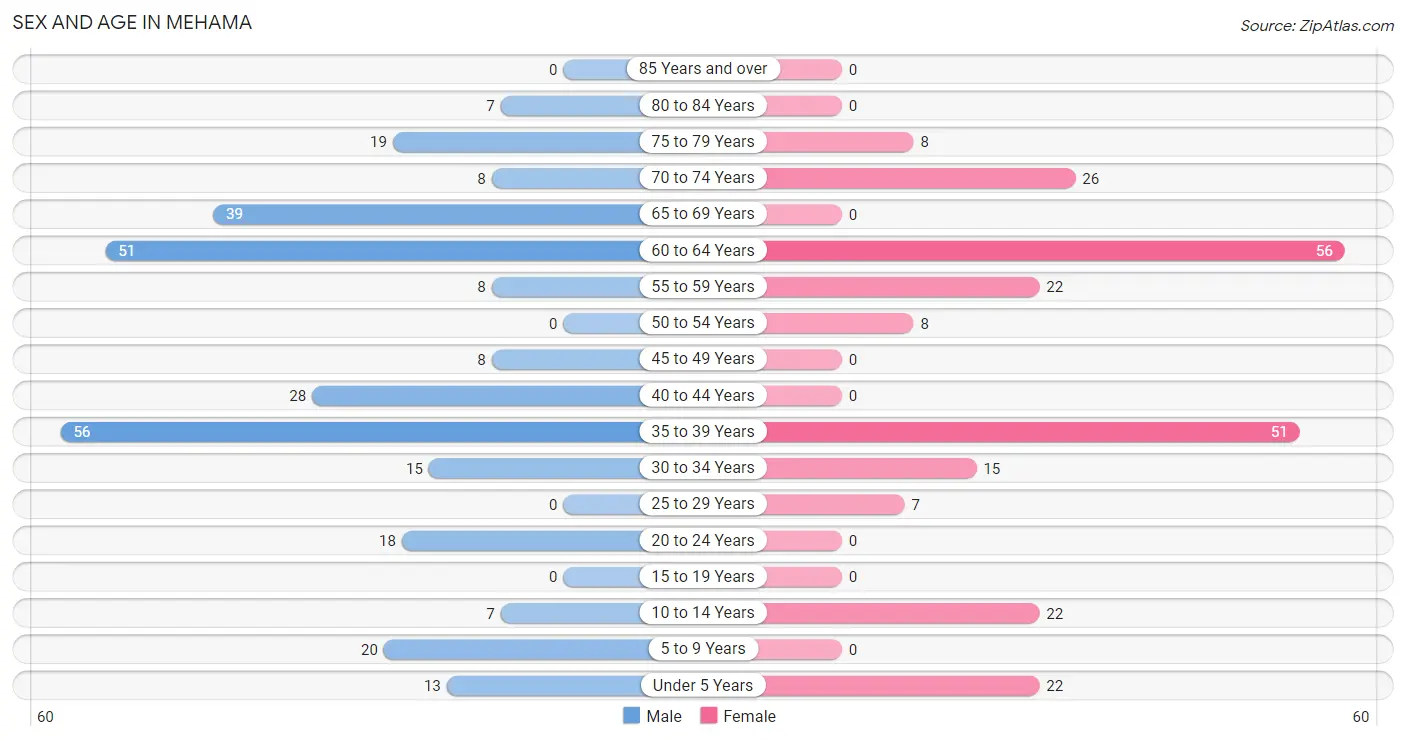
| Age Bracket | Male | Female |
| Under 5 Years | 13 (4.4%) | 22 (9.3%) |
| 5 to 9 Years | 20 (6.7%) | 0 (0.0%) |
| 10 to 14 Years | 7 (2.4%) | 22 (9.3%) |
| 15 to 19 Years | 0 (0.0%) | 0 (0.0%) |
| 20 to 24 Years | 18 (6.1%) | 0 (0.0%) |
| 25 to 29 Years | 0 (0.0%) | 7 (2.9%) |
| 30 to 34 Years | 15 (5.1%) | 15 (6.3%) |
| 35 to 39 Years | 56 (18.9%) | 51 (21.5%) |
| 40 to 44 Years | 28 (9.4%) | 0 (0.0%) |
| 45 to 49 Years | 8 (2.7%) | 0 (0.0%) |
| 50 to 54 Years | 0 (0.0%) | 8 (3.4%) |
| 55 to 59 Years | 8 (2.7%) | 22 (9.3%) |
| 60 to 64 Years | 51 (17.2%) | 56 (23.6%) |
| 65 to 69 Years | 39 (13.1%) | 0 (0.0%) |
| 70 to 74 Years | 8 (2.7%) | 26 (11.0%) |
| 75 to 79 Years | 19 (6.4%) | 8 (3.4%) |
| 80 to 84 Years | 7 (2.4%) | 0 (0.0%) |
| 85 Years and over | 0 (0.0%) | 0 (0.0%) |
| Total | 297 (100.0%) | 237 (100.0%) |
Families and Households in Mehama
Median Family Size in Mehama
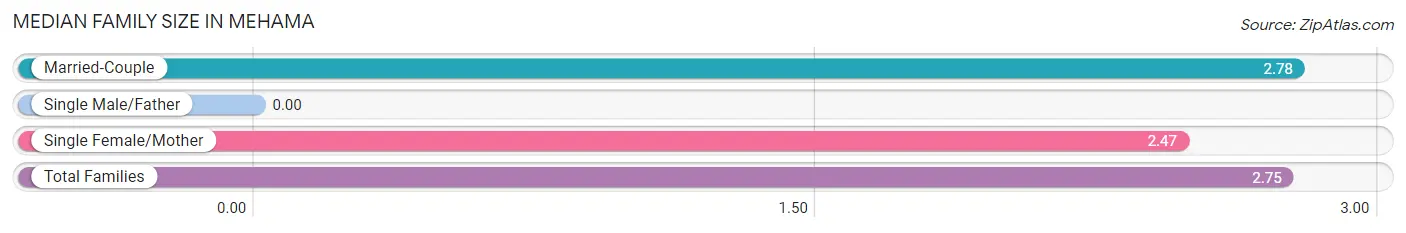
| Family Type | # Families | Family Size |
| Married-Couple | 141 (90.4%) | 2.78 |
| Single Male/Father | 0 (0.0%) | - |
| Single Female/Mother | 15 (9.6%) | 2.47 |
| Total Families | 156 (100.0%) | 2.75 |
Median Household Size in Mehama
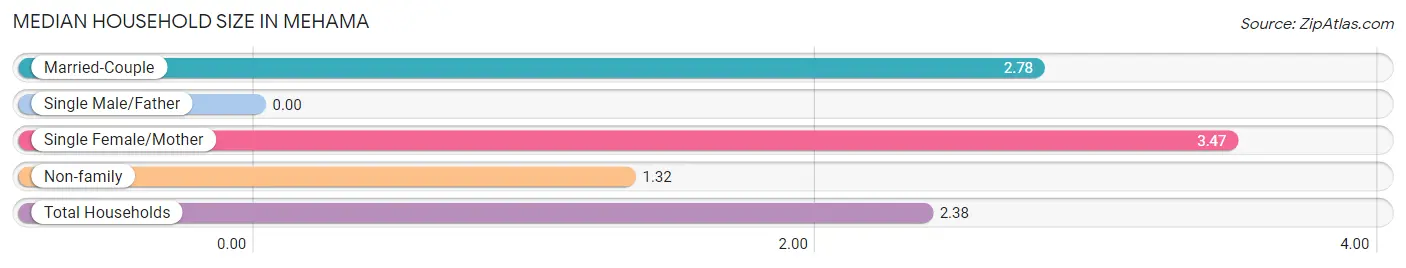
| Household Type | # Households | Household Size |
| Married-Couple | 141 (62.9%) | 2.78 |
| Single Male/Father | 0 (0.0%) | - |
| Single Female/Mother | 15 (6.7%) | 3.47 |
| Non-family | 68 (30.4%) | 1.32 |
| Total Households | 224 (100.0%) | 2.38 |
Household Size by Marriage Status in Mehama
Out of a total of 224 households in Mehama, 156 (69.6%) are family households, while 68 (30.4%) are nonfamily households. The most numerous type of family households are 2-person households, comprising 71, and the most common type of nonfamily households are 2-person households, comprising 51.
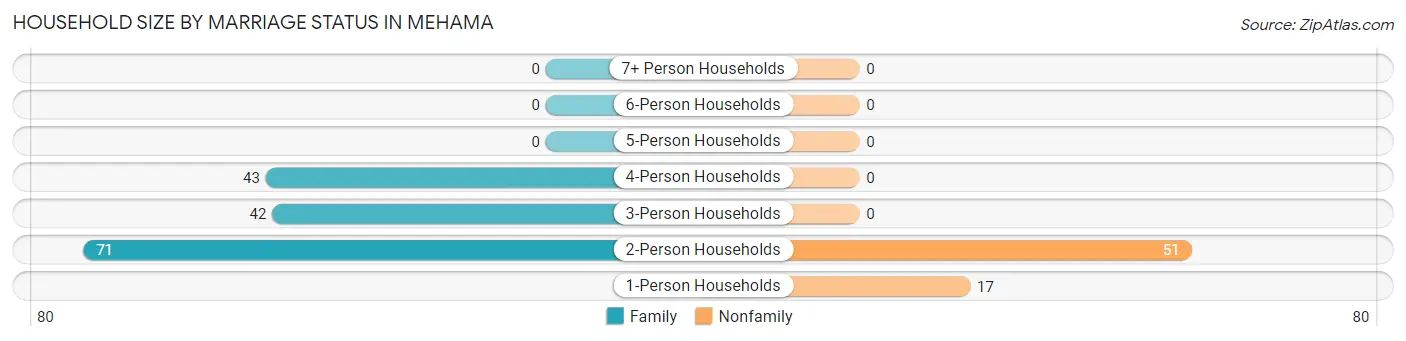
| Household Size | Family Households | Nonfamily Households |
| 1-Person Households | - | 17 (7.6%) |
| 2-Person Households | 71 (31.7%) | 51 (22.8%) |
| 3-Person Households | 42 (18.8%) | 0 (0.0%) |
| 4-Person Households | 43 (19.2%) | 0 (0.0%) |
| 5-Person Households | 0 (0.0%) | 0 (0.0%) |
| 6-Person Households | 0 (0.0%) | 0 (0.0%) |
| 7+ Person Households | 0 (0.0%) | 0 (0.0%) |
| Total | 156 (69.6%) | 68 (30.4%) |
Female Fertility in Mehama
Fertility by Age in Mehama
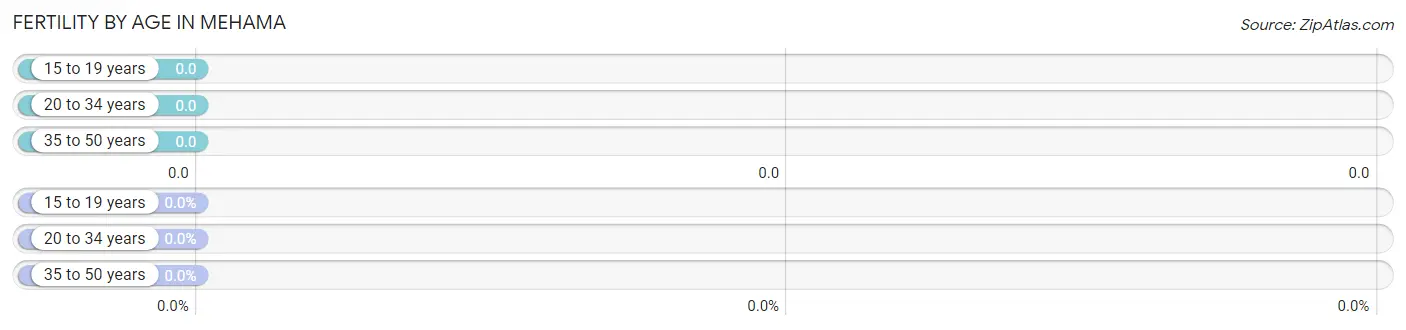
| Age Bracket | Women with Births | Births / 1,000 Women |
| 15 to 19 years | 0 (0.0%) | 0.0 |
| 20 to 34 years | 0 (0.0%) | 0.0 |
| 35 to 50 years | 0 (0.0%) | 0.0 |
| Total | 0 (0.0%) | 0.0 |
Fertility by Age by Marriage Status in Mehama
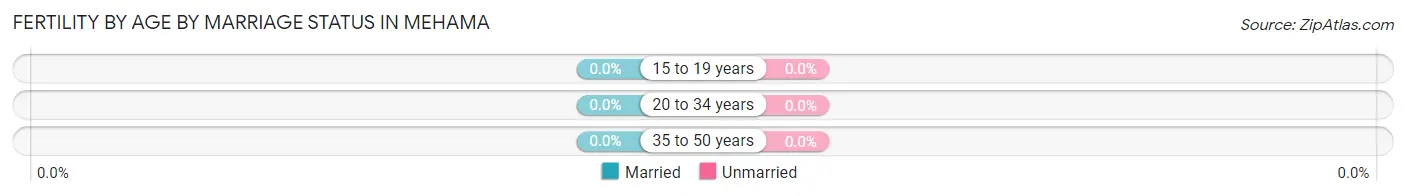
| Age Bracket | Married | Unmarried |
| 15 to 19 years | 0 (0.0%) | 0 (0.0%) |
| 20 to 34 years | 0 (0.0%) | 0 (0.0%) |
| 35 to 50 years | 0 (0.0%) | 0 (0.0%) |
| Total | 0 (0.0%) | 0 (0.0%) |
Fertility by Education in Mehama
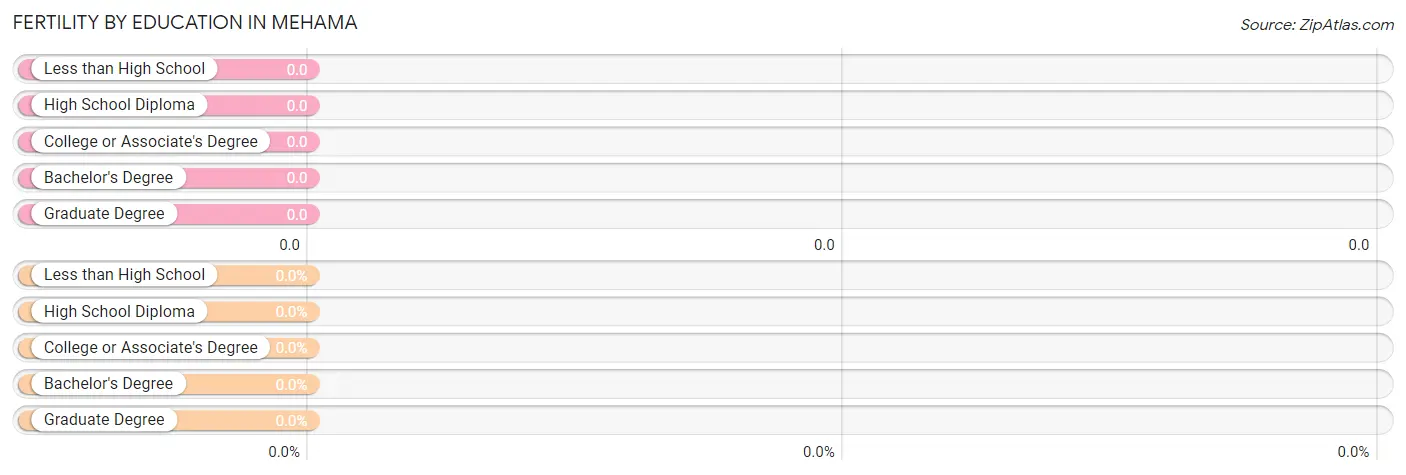
| Educational Attainment | Women with Births | Births / 1,000 Women |
| Less than High School | 0 (0.0%) | 0.0 |
| High School Diploma | 0 (0.0%) | 0.0 |
| College or Associate's Degree | 0 (0.0%) | 0.0 |
| Bachelor's Degree | 0 (0.0%) | 0.0 |
| Graduate Degree | 0 (0.0%) | 0.0 |
| Total | 0 (0.0%) | 0.0 |
Fertility by Education by Marriage Status in Mehama
| Educational Attainment | Married | Unmarried |
| Less than High School | 0 (0.0%) | 0 (0.0%) |
| High School Diploma | 0 (0.0%) | 0 (0.0%) |
| College or Associate's Degree | 0 (0.0%) | 0 (0.0%) |
| Bachelor's Degree | 0 (0.0%) | 0 (0.0%) |
| Graduate Degree | 0 (0.0%) | 0 (0.0%) |
| Total | 0 (0.0%) | 0 (0.0%) |
Employment Characteristics in Mehama
Employment by Class of Employer in Mehama
Among the 287 employed individuals in Mehama, self-employed (not incorporated) (128 | 44.6%), private company employees (105 | 36.6%), and local government employees (46 | 16.0%) make up the most common classes of employment.
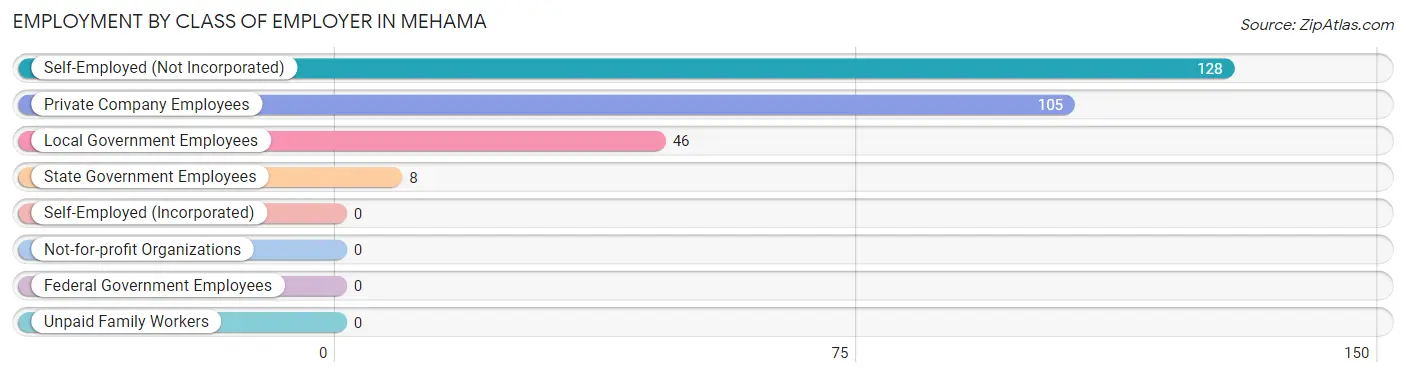
| Employer Class | # Employees | % Employees |
| Private Company Employees | 105 | 36.6% |
| Self-Employed (Incorporated) | 0 | 0.0% |
| Self-Employed (Not Incorporated) | 128 | 44.6% |
| Not-for-profit Organizations | 0 | 0.0% |
| Local Government Employees | 46 | 16.0% |
| State Government Employees | 8 | 2.8% |
| Federal Government Employees | 0 | 0.0% |
| Unpaid Family Workers | 0 | 0.0% |
| Total | 287 | 100.0% |
Employment Status by Age in Mehama
According to the labor force statistics for Mehama, out of the total population over 16 years of age (450), 66.0% or 297 individuals are in the labor force, with 3.4% or 10 of them unemployed. The age group with the highest labor force participation rate is 25 to 29 years, with 100.0% or 7 individuals in the labor force. Within the labor force, the 35 to 44 years age range has the highest percentage of unemployed individuals, with 7.4% or 10 of them being unemployed.
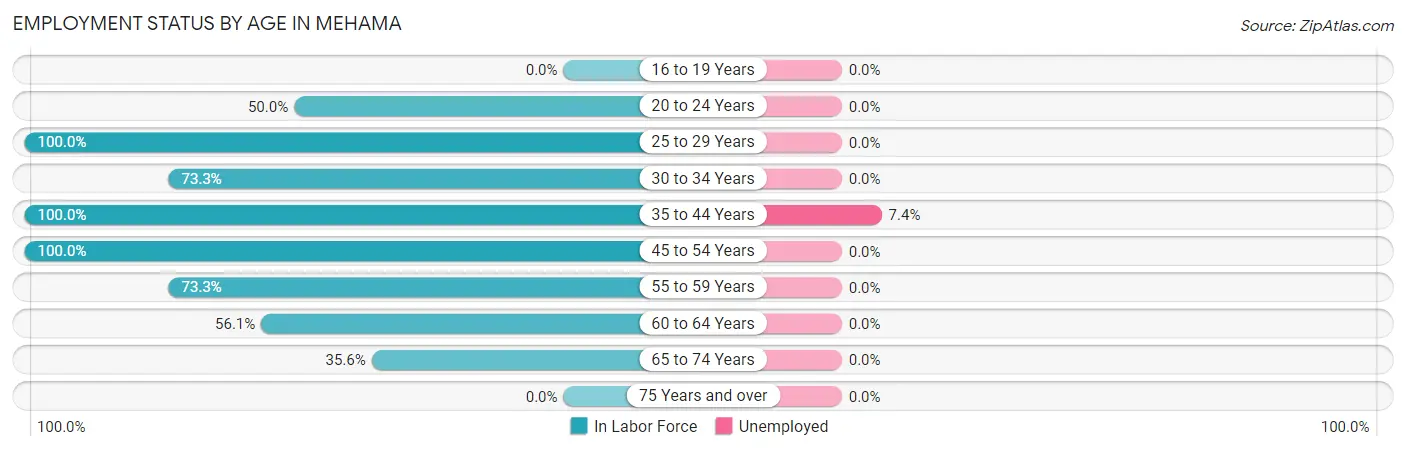
| Age Bracket | In Labor Force | Unemployed |
| 16 to 19 Years | 0 (0.0%) | 0 (0.0%) |
| 20 to 24 Years | 9 (50.0%) | 0 (0.0%) |
| 25 to 29 Years | 7 (100.0%) | 0 (0.0%) |
| 30 to 34 Years | 22 (73.3%) | 0 (0.0%) |
| 35 to 44 Years | 135 (100.0%) | 10 (7.4%) |
| 45 to 54 Years | 16 (100.0%) | 0 (0.0%) |
| 55 to 59 Years | 22 (73.3%) | 0 (0.0%) |
| 60 to 64 Years | 60 (56.1%) | 0 (0.0%) |
| 65 to 74 Years | 26 (35.6%) | 0 (0.0%) |
| 75 Years and over | 0 (0.0%) | 0 (0.0%) |
| Total | 297 (66.0%) | 10 (3.4%) |
Employment Status by Educational Attainment in Mehama
According to labor force statistics for Mehama, 80.6% of individuals (262) out of the total population between 25 and 64 years of age (325) are in the labor force, with 3.8% or 10 of them being unemployed. The group with the highest labor force participation rate are those with the educational attainment of high school diploma, with 90.8% or 157 individuals in the labor force. Within the labor force, individuals with high school diploma education have the highest percentage of unemployment, with 6.4% or 10 of them being unemployed.
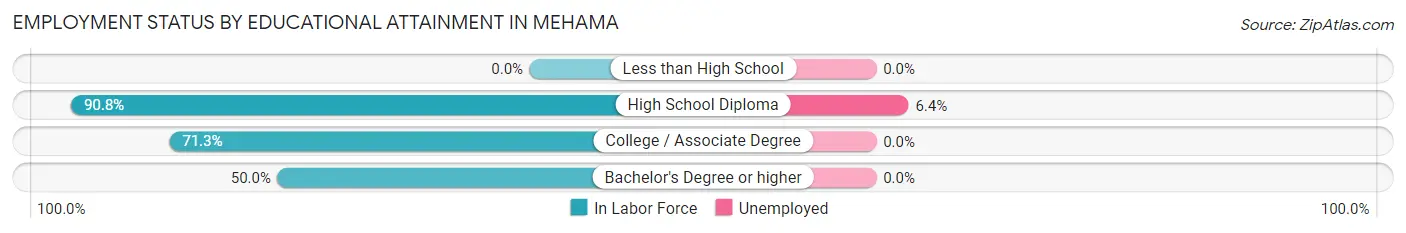
| Educational Attainment | In Labor Force | Unemployed |
| Less than High School | 0 (0.0%) | 0 (0.0%) |
| High School Diploma | 157 (90.8%) | 11 (6.4%) |
| College / Associate Degree | 97 (71.3%) | 0 (0.0%) |
| Bachelor's Degree or higher | 8 (50.0%) | 0 (0.0%) |
| Total | 262 (80.6%) | 12 (3.8%) |
Employment Occupations by Sex in Mehama
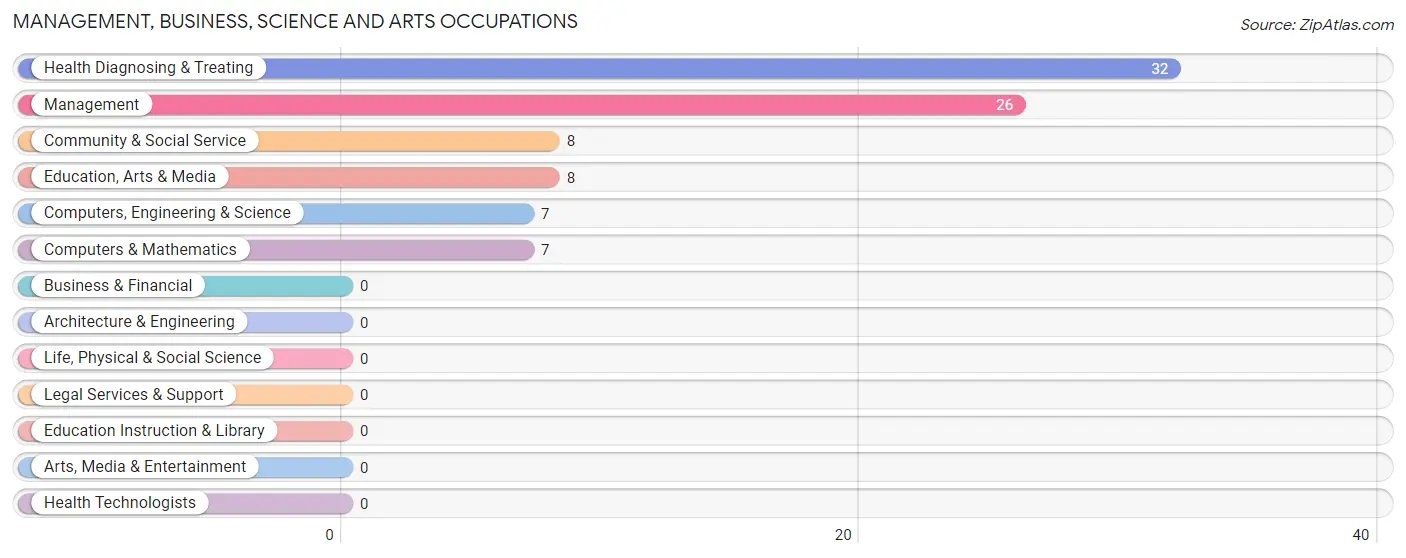
Management, Business, Science and Arts Occupations
The most common Management, Business, Science and Arts occupations in Mehama are Health Diagnosing & Treating (32 | 11.2%), Management (26 | 9.1%), Community & Social Service (8 | 2.8%), Education, Arts & Media (8 | 2.8%), and Computers, Engineering & Science (7 | 2.4%).
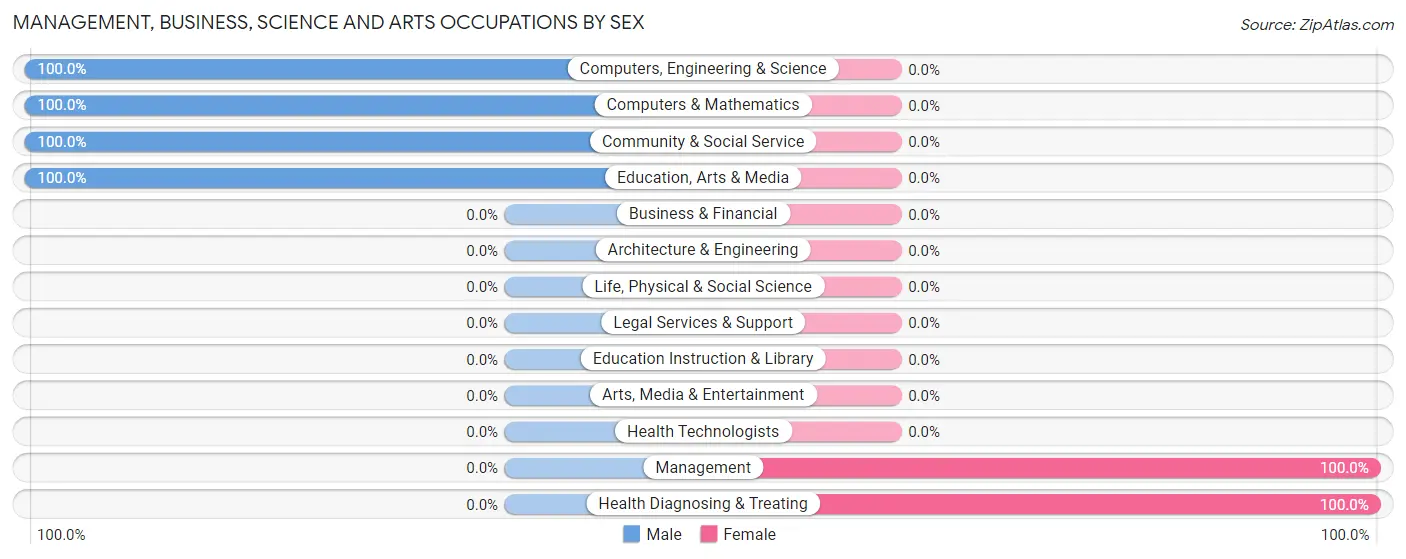
Management, Business, Science and Arts Occupations by Sex
Within the Management, Business, Science and Arts occupations in Mehama, the most male-oriented occupations are Computers, Engineering & Science (100.0%), Computers & Mathematics (100.0%), and Community & Social Service (100.0%), while the most female-oriented occupations are Management (100.0%), and Health Diagnosing & Treating (100.0%).
| Occupation | Male | Female |
| Management | 0 (0.0%) | 26 (100.0%) |
| Business & Financial | 0 (0.0%) | 0 (0.0%) |
| Computers, Engineering & Science | 7 (100.0%) | 0 (0.0%) |
| Computers & Mathematics | 7 (100.0%) | 0 (0.0%) |
| Architecture & Engineering | 0 (0.0%) | 0 (0.0%) |
| Life, Physical & Social Science | 0 (0.0%) | 0 (0.0%) |
| Community & Social Service | 8 (100.0%) | 0 (0.0%) |
| Education, Arts & Media | 8 (100.0%) | 0 (0.0%) |
| Legal Services & Support | 0 (0.0%) | 0 (0.0%) |
| Education Instruction & Library | 0 (0.0%) | 0 (0.0%) |
| Arts, Media & Entertainment | 0 (0.0%) | 0 (0.0%) |
| Health Diagnosing & Treating | 0 (0.0%) | 32 (100.0%) |
| Health Technologists | 0 (0.0%) | 0 (0.0%) |
| Total (Category) | 15 (20.5%) | 58 (79.4%) |
| Total (Overall) | 157 (54.7%) | 130 (45.3%) |
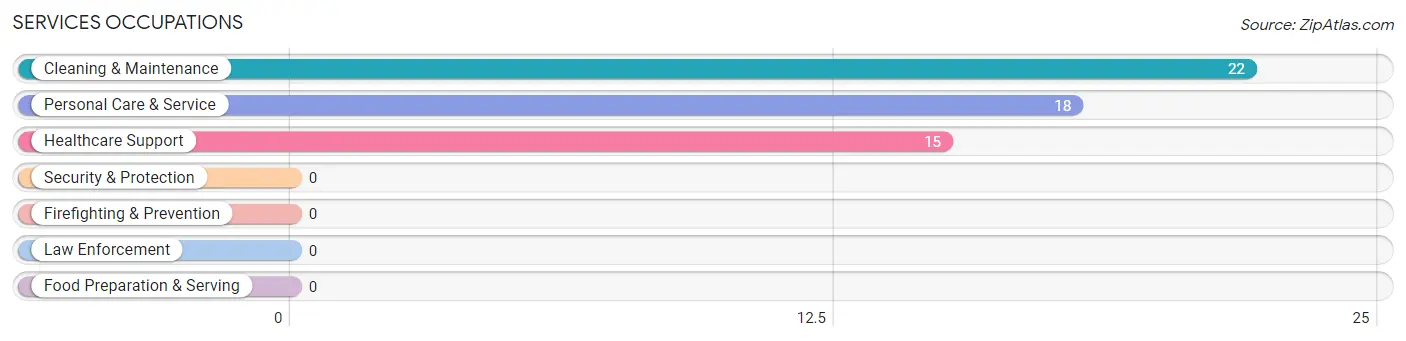
Services Occupations
The most common Services occupations in Mehama are Cleaning & Maintenance (22 | 7.7%), Personal Care & Service (18 | 6.3%), and Healthcare Support (15 | 5.2%).
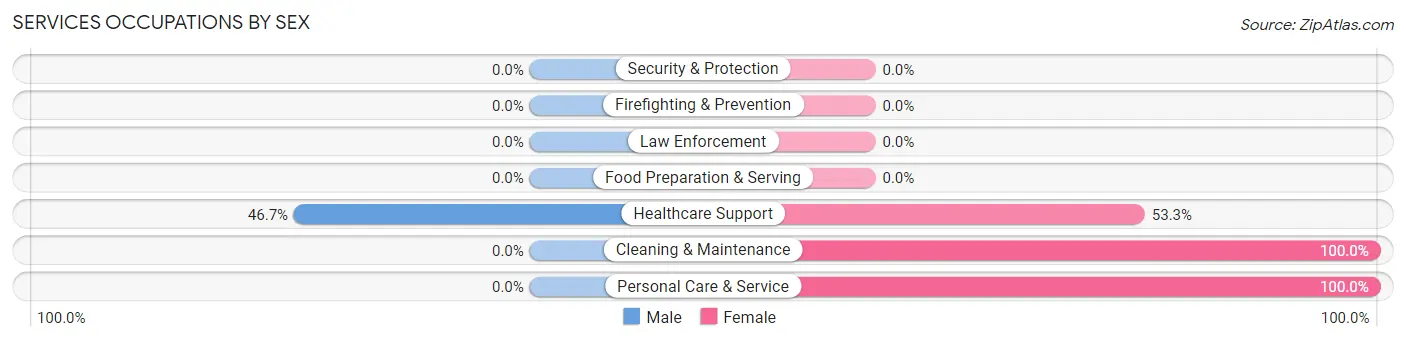
Services Occupations by Sex
| Occupation | Male | Female |
| Healthcare Support | 7 (46.7%) | 8 (53.3%) |
| Security & Protection | 0 (0.0%) | 0 (0.0%) |
| Firefighting & Prevention | 0 (0.0%) | 0 (0.0%) |
| Law Enforcement | 0 (0.0%) | 0 (0.0%) |
| Food Preparation & Serving | 0 (0.0%) | 0 (0.0%) |
| Cleaning & Maintenance | 0 (0.0%) | 22 (100.0%) |
| Personal Care & Service | 0 (0.0%) | 18 (100.0%) |
| Total (Category) | 7 (12.7%) | 48 (87.3%) |
| Total (Overall) | 157 (54.7%) | 130 (45.3%) |
Sales and Office Occupations
The most common Sales and Office occupations in Mehama are , and Sales & Related (17 | 5.9%).
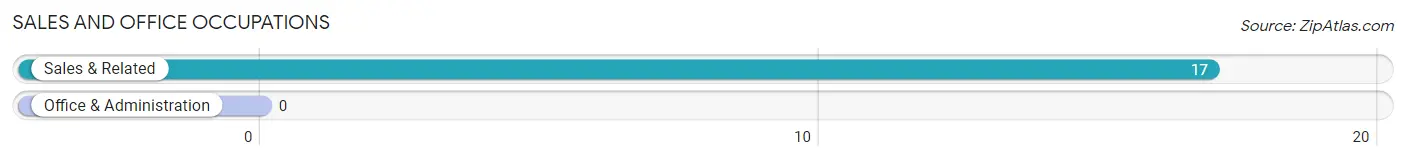
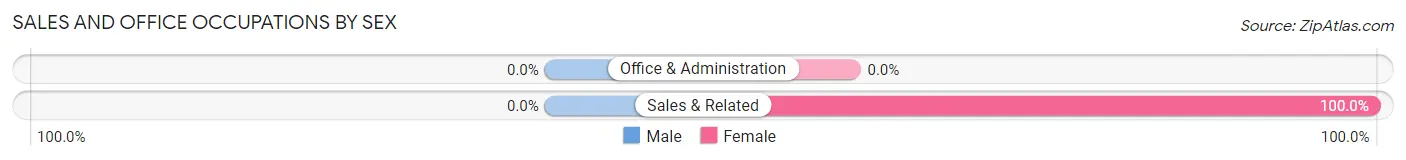
Sales and Office Occupations by Sex
| Occupation | Male | Female |
| Sales & Related | 0 (0.0%) | 17 (100.0%) |
| Office & Administration | 0 (0.0%) | 0 (0.0%) |
| Total (Category) | 0 (0.0%) | 17 (100.0%) |
| Total (Overall) | 157 (54.7%) | 130 (45.3%) |
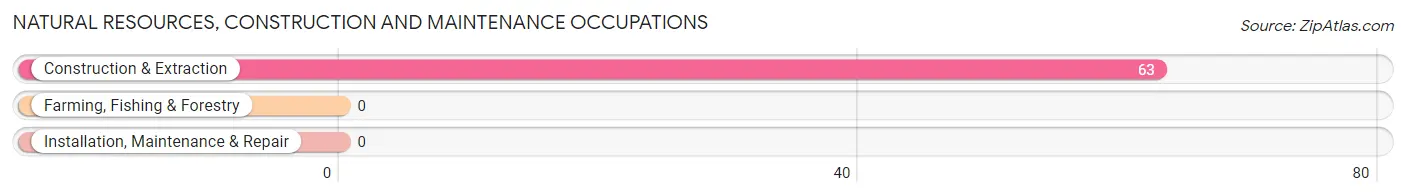
Natural Resources, Construction and Maintenance Occupations
The most common Natural Resources, Construction and Maintenance occupations in Mehama are , and Construction & Extraction (63 | 22.0%).
Natural Resources, Construction and Maintenance Occupations by Sex
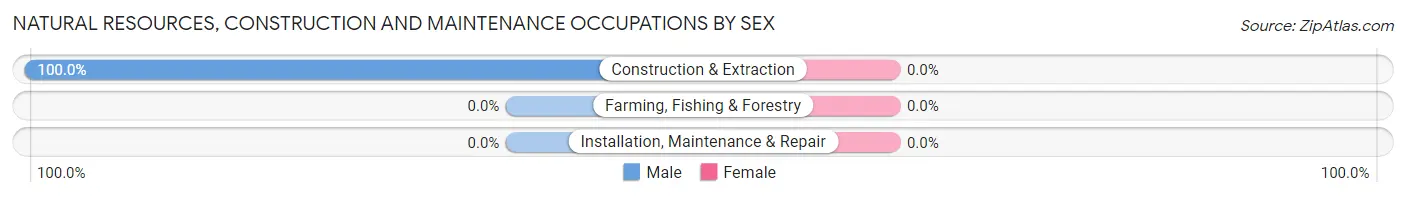
| Occupation | Male | Female |
| Farming, Fishing & Forestry | 0 (0.0%) | 0 (0.0%) |
| Construction & Extraction | 63 (100.0%) | 0 (0.0%) |
| Installation, Maintenance & Repair | 0 (0.0%) | 0 (0.0%) |
| Total (Category) | 63 (100.0%) | 0 (0.0%) |
| Total (Overall) | 157 (54.7%) | 130 (45.3%) |
Production, Transportation and Moving Occupations
The most common Production, Transportation and Moving occupations in Mehama are Production (51 | 17.8%), Transportation (21 | 7.3%), and Material Moving (7 | 2.4%).
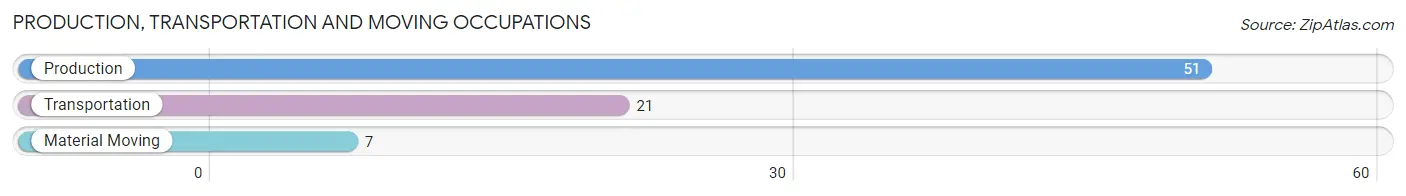
Production, Transportation and Moving Occupations by Sex
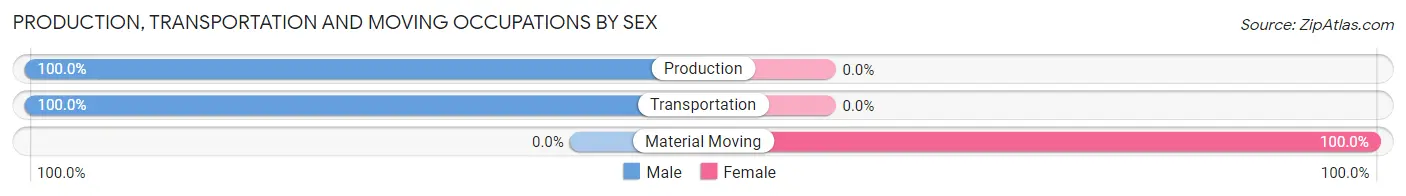
| Occupation | Male | Female |
| Production | 51 (100.0%) | 0 (0.0%) |
| Transportation | 21 (100.0%) | 0 (0.0%) |
| Material Moving | 0 (0.0%) | 7 (100.0%) |
| Total (Category) | 72 (91.1%) | 7 (8.9%) |
| Total (Overall) | 157 (54.7%) | 130 (45.3%) |
Employment Industries by Sex in Mehama
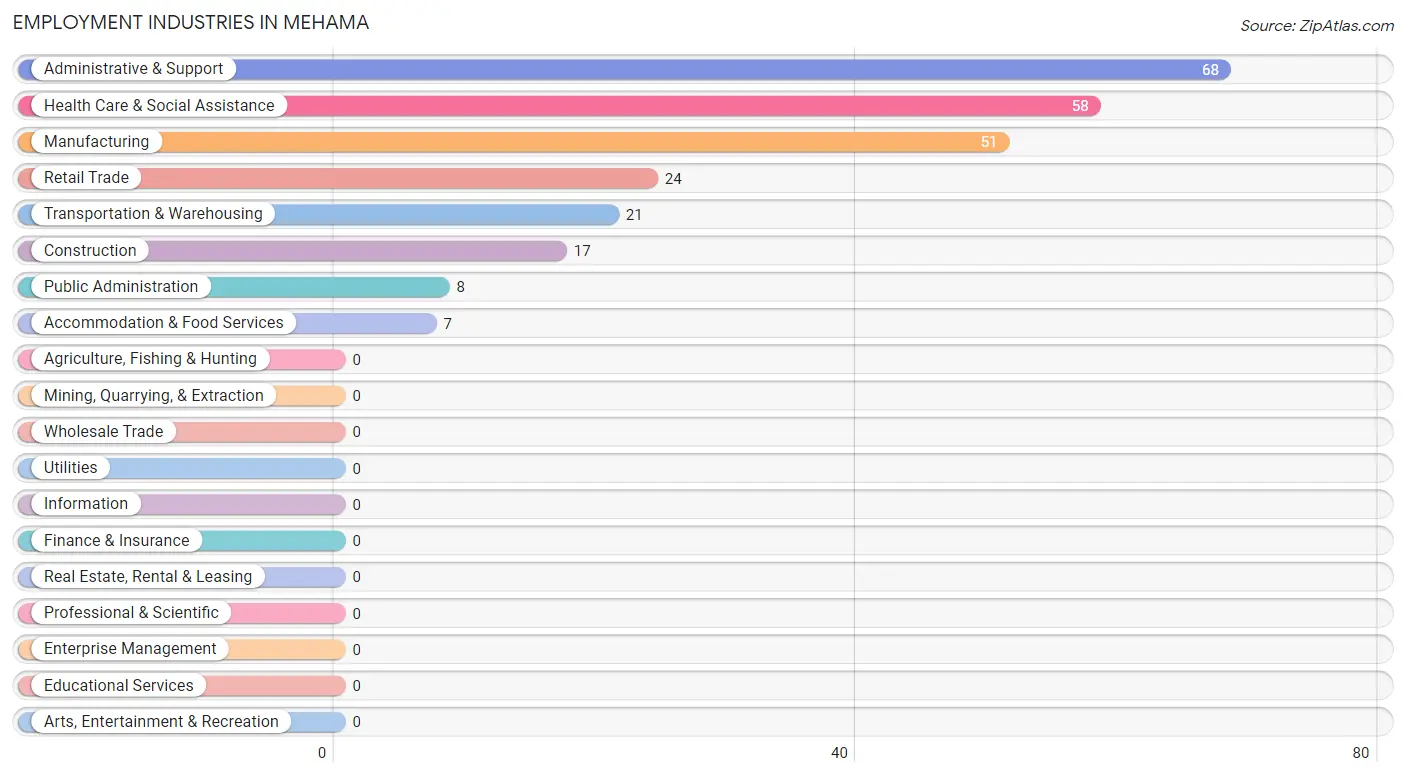
Employment Industries in Mehama
The major employment industries in Mehama include Administrative & Support (68 | 23.7%), Health Care & Social Assistance (58 | 20.2%), Manufacturing (51 | 17.8%), Retail Trade (24 | 8.4%), and Transportation & Warehousing (21 | 7.3%).
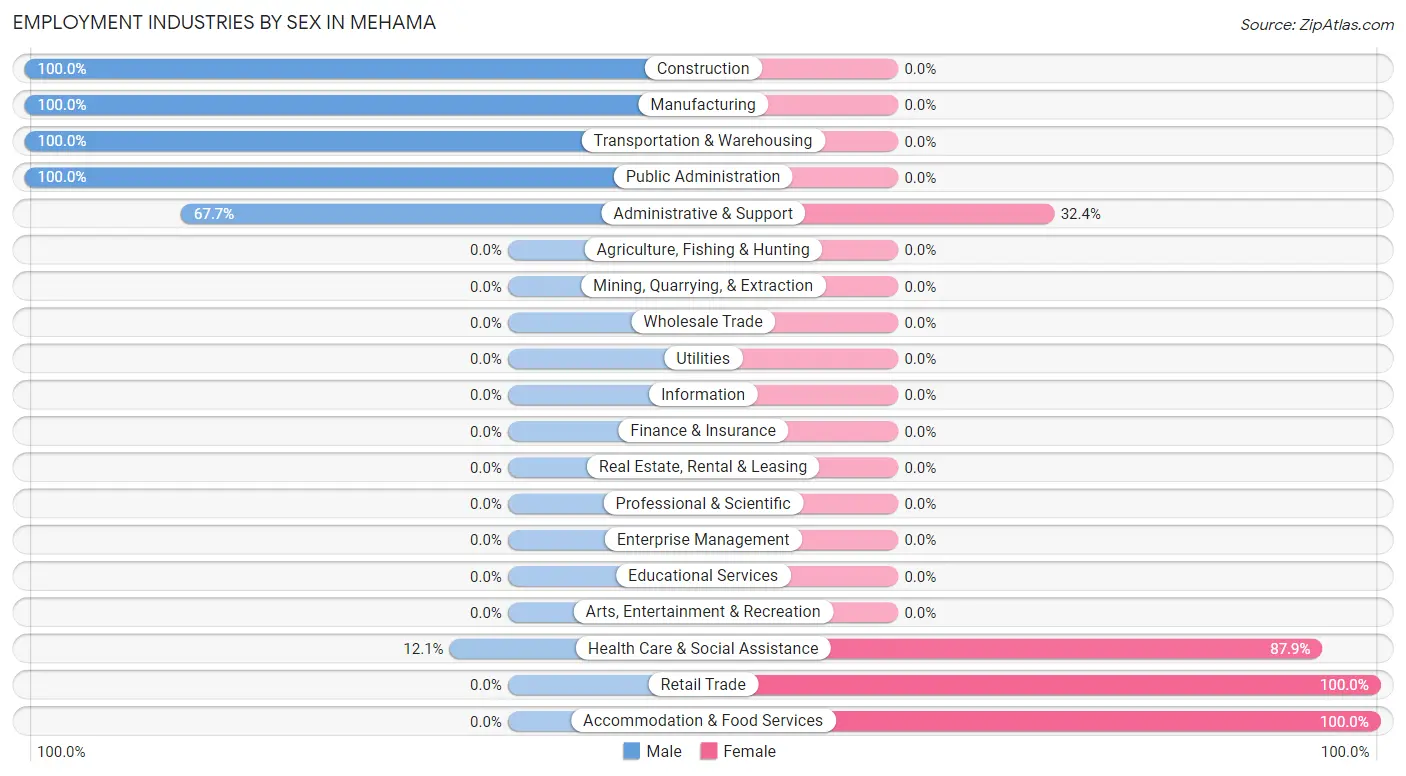
Employment Industries by Sex in Mehama
The Mehama industries that see more men than women are Construction (100.0%), Manufacturing (100.0%), and Transportation & Warehousing (100.0%), whereas the industries that tend to have a higher number of women are Retail Trade (100.0%), Accommodation & Food Services (100.0%), and Health Care & Social Assistance (87.9%).
| Industry | Male | Female |
| Agriculture, Fishing & Hunting | 0 (0.0%) | 0 (0.0%) |
| Mining, Quarrying, & Extraction | 0 (0.0%) | 0 (0.0%) |
| Construction | 17 (100.0%) | 0 (0.0%) |
| Manufacturing | 51 (100.0%) | 0 (0.0%) |
| Wholesale Trade | 0 (0.0%) | 0 (0.0%) |
| Retail Trade | 0 (0.0%) | 24 (100.0%) |
| Transportation & Warehousing | 21 (100.0%) | 0 (0.0%) |
| Utilities | 0 (0.0%) | 0 (0.0%) |
| Information | 0 (0.0%) | 0 (0.0%) |
| Finance & Insurance | 0 (0.0%) | 0 (0.0%) |
| Real Estate, Rental & Leasing | 0 (0.0%) | 0 (0.0%) |
| Professional & Scientific | 0 (0.0%) | 0 (0.0%) |
| Enterprise Management | 0 (0.0%) | 0 (0.0%) |
| Administrative & Support | 46 (67.6%) | 22 (32.4%) |
| Educational Services | 0 (0.0%) | 0 (0.0%) |
| Health Care & Social Assistance | 7 (12.1%) | 51 (87.9%) |
| Arts, Entertainment & Recreation | 0 (0.0%) | 0 (0.0%) |
| Accommodation & Food Services | 0 (0.0%) | 7 (100.0%) |
| Public Administration | 8 (100.0%) | 0 (0.0%) |
| Total | 157 (54.7%) | 130 (45.3%) |
Education in Mehama
School Enrollment in Mehama
The most common levels of schooling among the 58 students in Mehama are middle school (29 | 50.0%), kindergarten (20 | 34.5%), and college / undergraduate (9 | 15.5%).
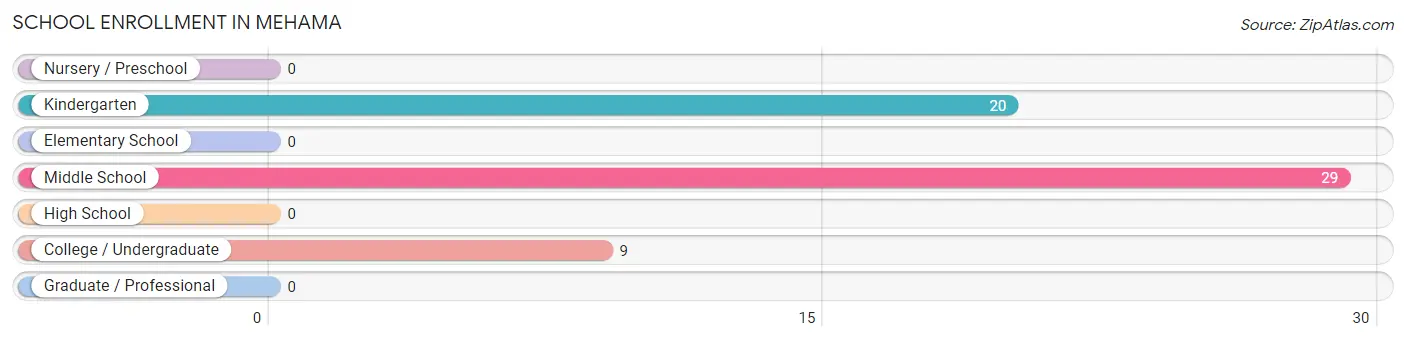
| School Level | # Students | % Students |
| Nursery / Preschool | 0 | 0.0% |
| Kindergarten | 20 | 34.5% |
| Elementary School | 0 | 0.0% |
| Middle School | 29 | 50.0% |
| High School | 0 | 0.0% |
| College / Undergraduate | 9 | 15.5% |
| Graduate / Professional | 0 | 0.0% |
| Total | 58 | 100.0% |
School Enrollment by Age by Funding Source in Mehama
Out of a total of 58 students who are enrolled in schools in Mehama, 16 (27.6%) attend a private institution, while the remaining 42 (72.4%) are enrolled in public schools. The age group of 20 to 24 year olds has the highest likelihood of being enrolled in private schools, with 9 (100.0% in the age bracket) enrolled. Conversely, the age group of 5 to 9 year old has the lowest likelihood of being enrolled in a private school, with 20 (100.0% in the age bracket) attending a public institution.
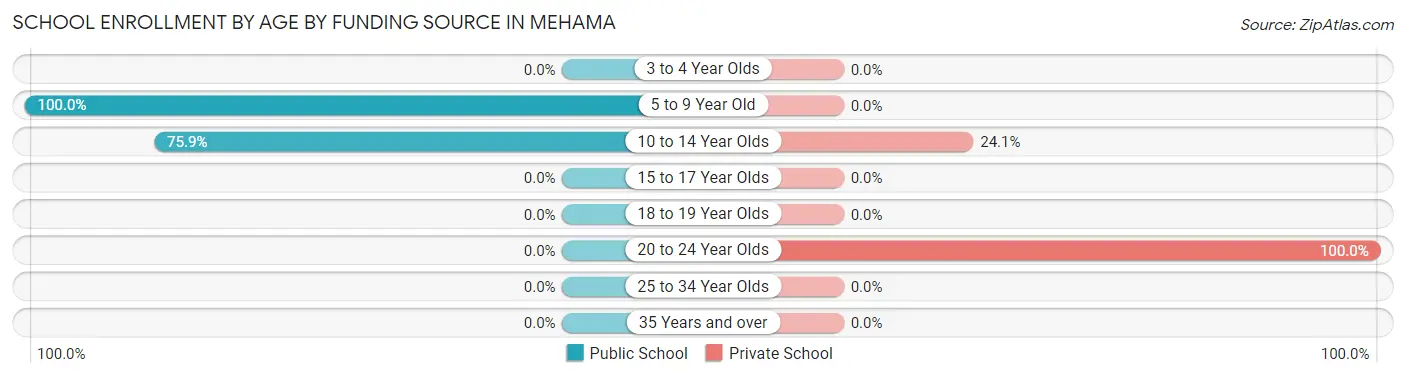
| Age Bracket | Public School | Private School |
| 3 to 4 Year Olds | 0 (0.0%) | 0 (0.0%) |
| 5 to 9 Year Old | 20 (100.0%) | 0 (0.0%) |
| 10 to 14 Year Olds | 22 (75.9%) | 7 (24.1%) |
| 15 to 17 Year Olds | 0 (0.0%) | 0 (0.0%) |
| 18 to 19 Year Olds | 0 (0.0%) | 0 (0.0%) |
| 20 to 24 Year Olds | 0 (0.0%) | 9 (100.0%) |
| 25 to 34 Year Olds | 0 (0.0%) | 0 (0.0%) |
| 35 Years and over | 0 (0.0%) | 0 (0.0%) |
| Total | 42 (72.4%) | 16 (27.6%) |
Educational Attainment by Field of Study in Mehama
Visual & performing arts (16 | 50.0%), education (8 | 25.0%), and literature & languages (8 | 25.0%) are the most common fields of study among 32 individuals in Mehama who have obtained a bachelor's degree or higher.
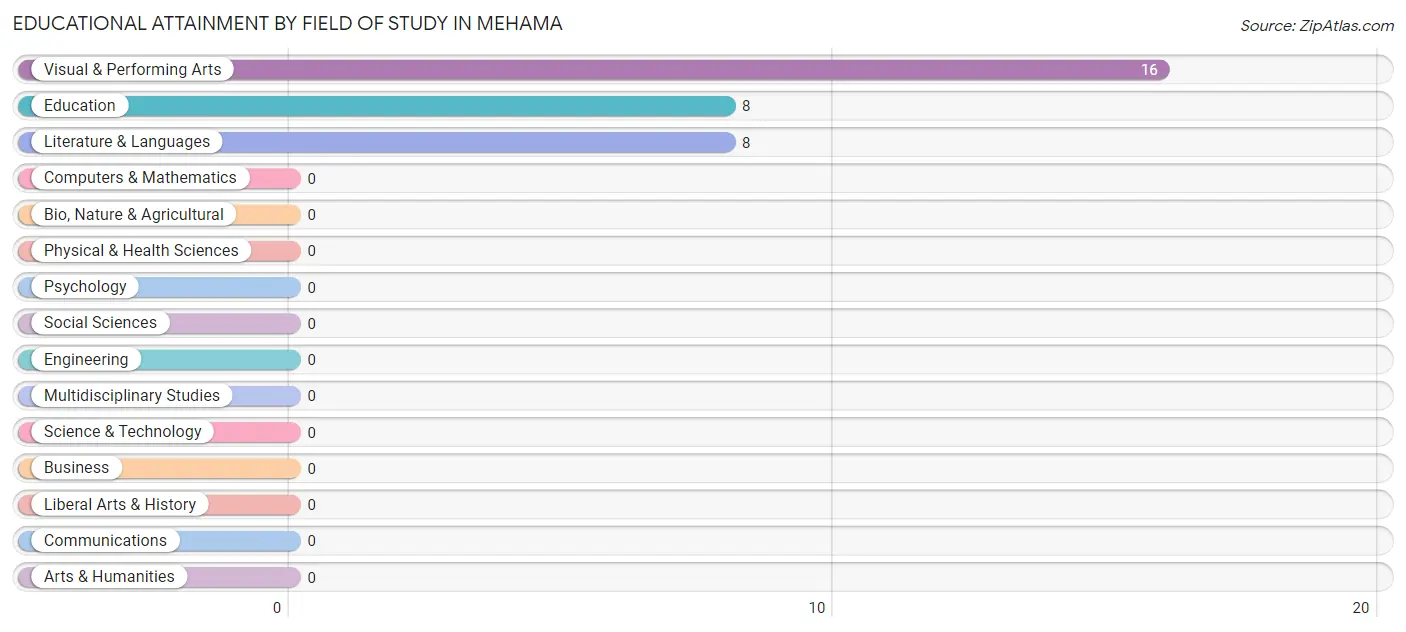
| Field of Study | # Graduates | % Graduates |
| Computers & Mathematics | 0 | 0.0% |
| Bio, Nature & Agricultural | 0 | 0.0% |
| Physical & Health Sciences | 0 | 0.0% |
| Psychology | 0 | 0.0% |
| Social Sciences | 0 | 0.0% |
| Engineering | 0 | 0.0% |
| Multidisciplinary Studies | 0 | 0.0% |
| Science & Technology | 0 | 0.0% |
| Business | 0 | 0.0% |
| Education | 8 | 25.0% |
| Literature & Languages | 8 | 25.0% |
| Liberal Arts & History | 0 | 0.0% |
| Visual & Performing Arts | 16 | 50.0% |
| Communications | 0 | 0.0% |
| Arts & Humanities | 0 | 0.0% |
| Total | 32 | 100.0% |
Transportation & Commute in Mehama
Vehicle Availability by Sex in Mehama
The most prevalent vehicle ownership categories in Mehama are males with 1 vehicle (59, accounting for 37.6%) and females with 1 vehicle (39, making up 45.4%).
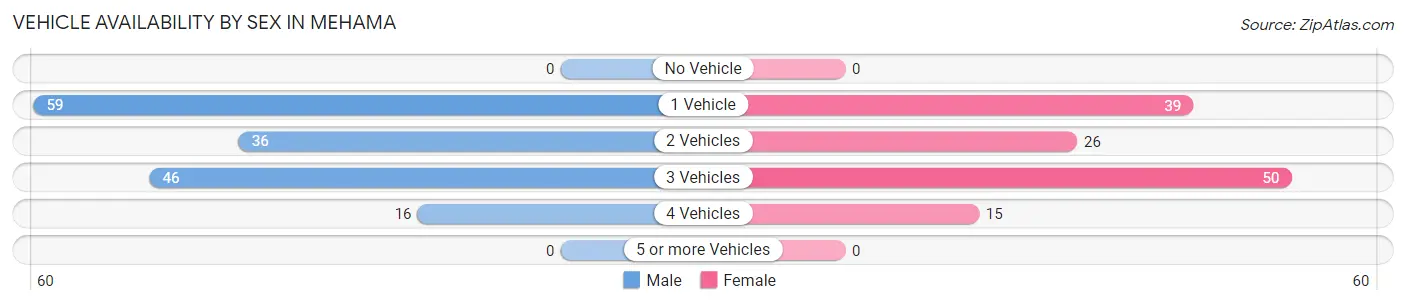
| Vehicles Available | Male | Female |
| No Vehicle | 0 (0.0%) | 0 (0.0%) |
| 1 Vehicle | 59 (37.6%) | 39 (30.0%) |
| 2 Vehicles | 36 (22.9%) | 26 (20.0%) |
| 3 Vehicles | 46 (29.3%) | 50 (38.5%) |
| 4 Vehicles | 16 (10.2%) | 15 (11.5%) |
| 5 or more Vehicles | 0 (0.0%) | 0 (0.0%) |
| Total | 157 (100.0%) | 130 (100.0%) |
Commute Time in Mehama
The most frequently occuring commute durations in Mehama are 30 to 34 minutes (62 commuters, 26.5%), 25 to 29 minutes (51 commuters, 21.8%), and 15 to 19 minutes (42 commuters, 17.9%).
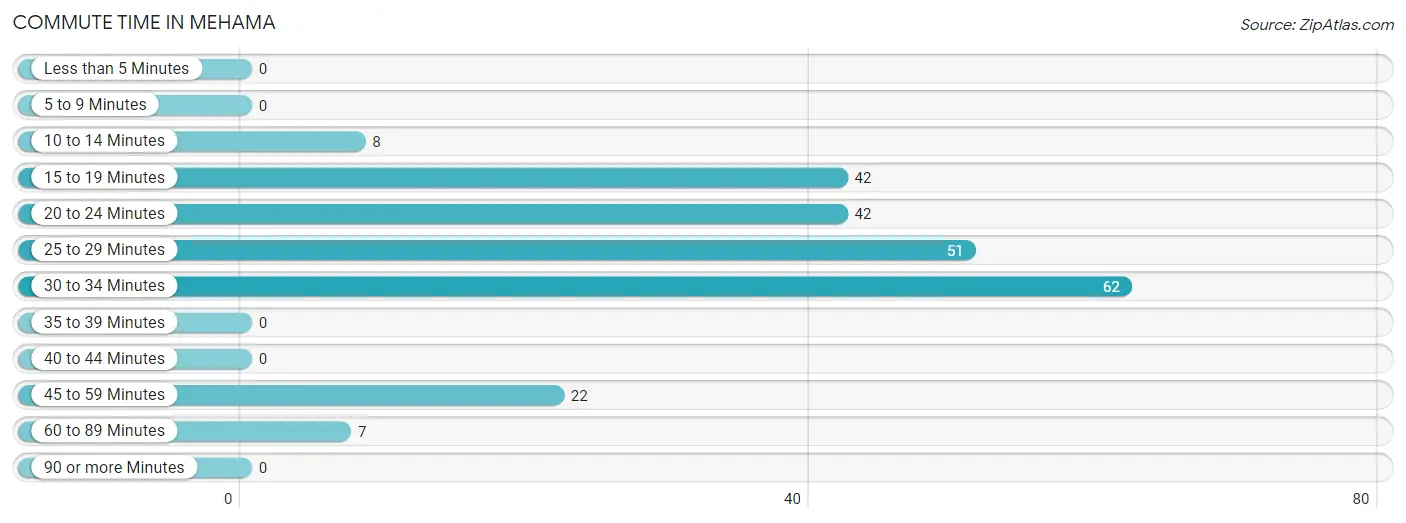
| Commute Time | # Commuters | % Commuters |
| Less than 5 Minutes | 0 | 0.0% |
| 5 to 9 Minutes | 0 | 0.0% |
| 10 to 14 Minutes | 8 | 3.4% |
| 15 to 19 Minutes | 42 | 17.9% |
| 20 to 24 Minutes | 42 | 17.9% |
| 25 to 29 Minutes | 51 | 21.8% |
| 30 to 34 Minutes | 62 | 26.5% |
| 35 to 39 Minutes | 0 | 0.0% |
| 40 to 44 Minutes | 0 | 0.0% |
| 45 to 59 Minutes | 22 | 9.4% |
| 60 to 89 Minutes | 7 | 3.0% |
| 90 or more Minutes | 0 | 0.0% |
Commute Time by Sex in Mehama
The most common commute times in Mehama are 30 to 34 minutes (62 commuters, 45.6%) for males and 15 to 19 minutes (42 commuters, 42.9%) for females.
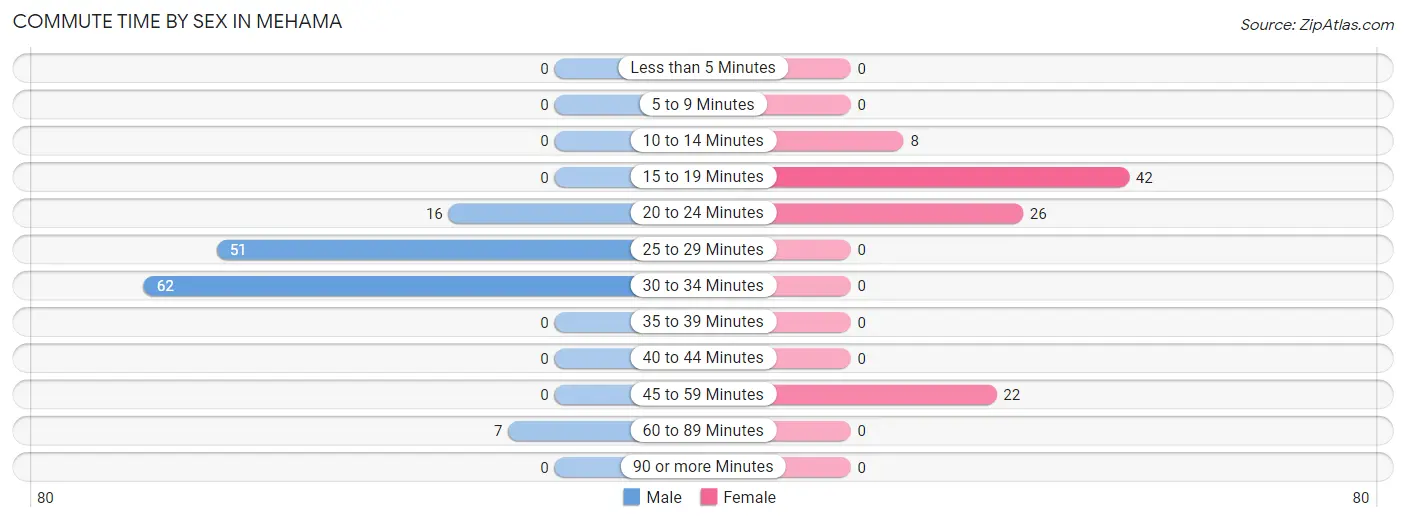
| Commute Time | Male | Female |
| Less than 5 Minutes | 0 (0.0%) | 0 (0.0%) |
| 5 to 9 Minutes | 0 (0.0%) | 0 (0.0%) |
| 10 to 14 Minutes | 0 (0.0%) | 8 (8.2%) |
| 15 to 19 Minutes | 0 (0.0%) | 42 (42.9%) |
| 20 to 24 Minutes | 16 (11.8%) | 26 (26.5%) |
| 25 to 29 Minutes | 51 (37.5%) | 0 (0.0%) |
| 30 to 34 Minutes | 62 (45.6%) | 0 (0.0%) |
| 35 to 39 Minutes | 0 (0.0%) | 0 (0.0%) |
| 40 to 44 Minutes | 0 (0.0%) | 0 (0.0%) |
| 45 to 59 Minutes | 0 (0.0%) | 22 (22.5%) |
| 60 to 89 Minutes | 7 (5.1%) | 0 (0.0%) |
| 90 or more Minutes | 0 (0.0%) | 0 (0.0%) |
Time of Departure to Work by Sex in Mehama
The most frequent times of departure to work in Mehama are 6:00 AM to 6:29 AM (62, 45.6%) for males and 8:00 AM to 8:29 AM (30, 30.6%) for females.
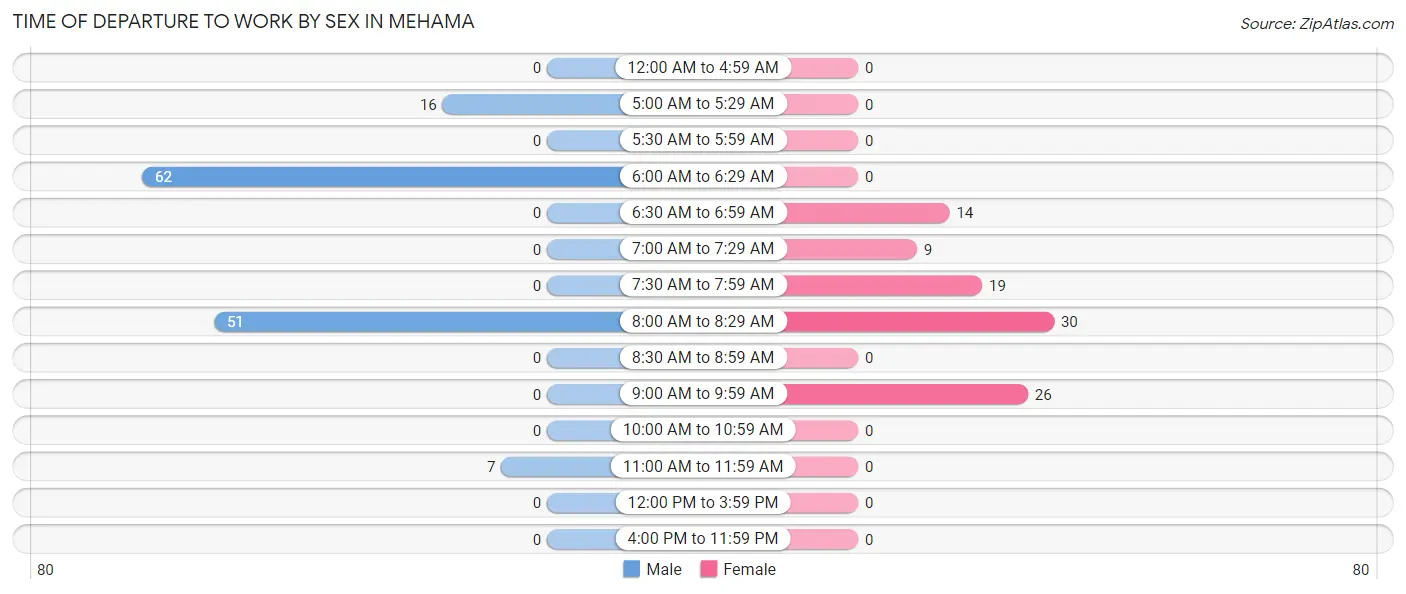
| Time of Departure | Male | Female |
| 12:00 AM to 4:59 AM | 0 (0.0%) | 0 (0.0%) |
| 5:00 AM to 5:29 AM | 16 (11.8%) | 0 (0.0%) |
| 5:30 AM to 5:59 AM | 0 (0.0%) | 0 (0.0%) |
| 6:00 AM to 6:29 AM | 62 (45.6%) | 0 (0.0%) |
| 6:30 AM to 6:59 AM | 0 (0.0%) | 14 (14.3%) |
| 7:00 AM to 7:29 AM | 0 (0.0%) | 9 (9.2%) |
| 7:30 AM to 7:59 AM | 0 (0.0%) | 19 (19.4%) |
| 8:00 AM to 8:29 AM | 51 (37.5%) | 30 (30.6%) |
| 8:30 AM to 8:59 AM | 0 (0.0%) | 0 (0.0%) |
| 9:00 AM to 9:59 AM | 0 (0.0%) | 26 (26.5%) |
| 10:00 AM to 10:59 AM | 0 (0.0%) | 0 (0.0%) |
| 11:00 AM to 11:59 AM | 7 (5.1%) | 0 (0.0%) |
| 12:00 PM to 3:59 PM | 0 (0.0%) | 0 (0.0%) |
| 4:00 PM to 11:59 PM | 0 (0.0%) | 0 (0.0%) |
| Total | 136 (100.0%) | 98 (100.0%) |
Housing Occupancy in Mehama
Occupancy by Ownership in Mehama
Of the total 224 dwellings in Mehama, owner-occupied units account for 165 (73.7%), while renter-occupied units make up 59 (26.3%).
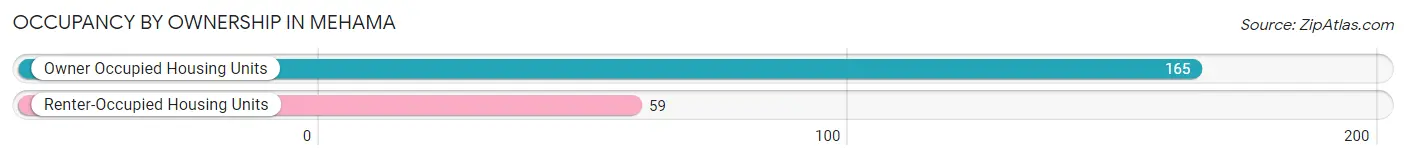
| Occupancy | # Housing Units | % Housing Units |
| Owner Occupied Housing Units | 165 | 73.7% |
| Renter-Occupied Housing Units | 59 | 26.3% |
| Total Occupied Housing Units | 224 | 100.0% |
Occupancy by Household Size in Mehama
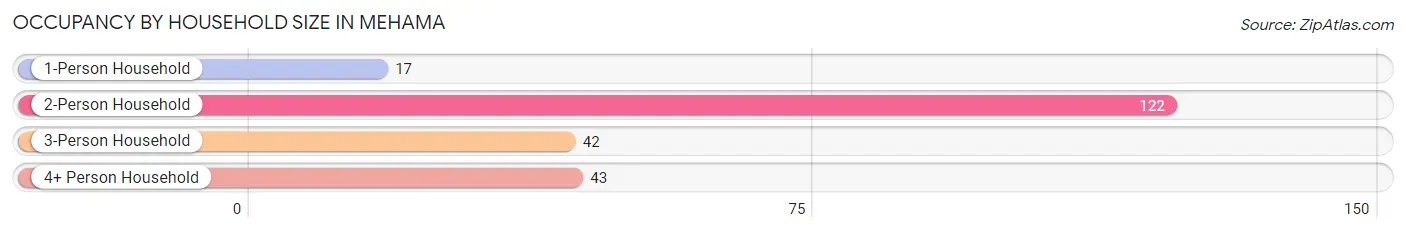
| Household Size | # Housing Units | % Housing Units |
| 1-Person Household | 17 | 7.6% |
| 2-Person Household | 122 | 54.5% |
| 3-Person Household | 42 | 18.8% |
| 4+ Person Household | 43 | 19.2% |
| Total Housing Units | 224 | 100.0% |
Occupancy by Ownership by Household Size in Mehama
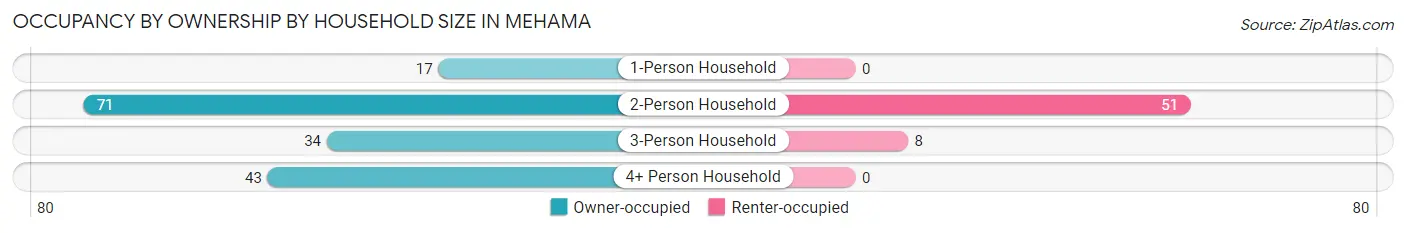
| Household Size | Owner-occupied | Renter-occupied |
| 1-Person Household | 17 (100.0%) | 0 (0.0%) |
| 2-Person Household | 71 (58.2%) | 51 (41.8%) |
| 3-Person Household | 34 (80.9%) | 8 (19.1%) |
| 4+ Person Household | 43 (100.0%) | 0 (0.0%) |
| Total Housing Units | 165 (73.7%) | 59 (26.3%) |
Occupancy by Educational Attainment in Mehama
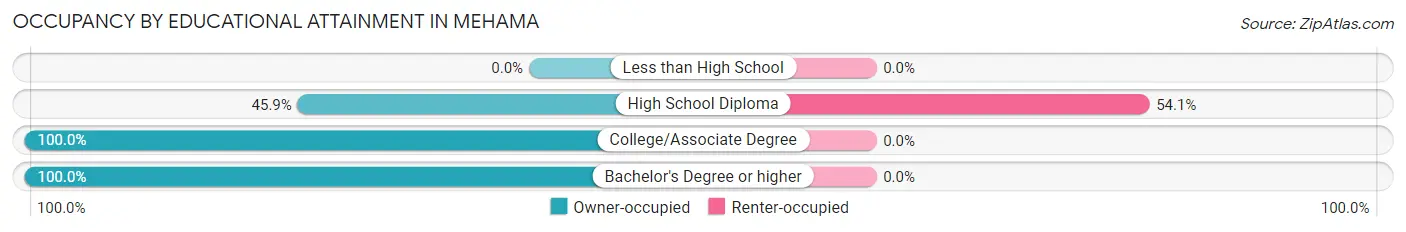
| Household Size | Owner-occupied | Renter-occupied |
| Less than High School | 0 (0.0%) | 0 (0.0%) |
| High School Diploma | 50 (45.9%) | 59 (54.1%) |
| College/Associate Degree | 107 (100.0%) | 0 (0.0%) |
| Bachelor's Degree or higher | 8 (100.0%) | 0 (0.0%) |
Occupancy by Age of Householder in Mehama
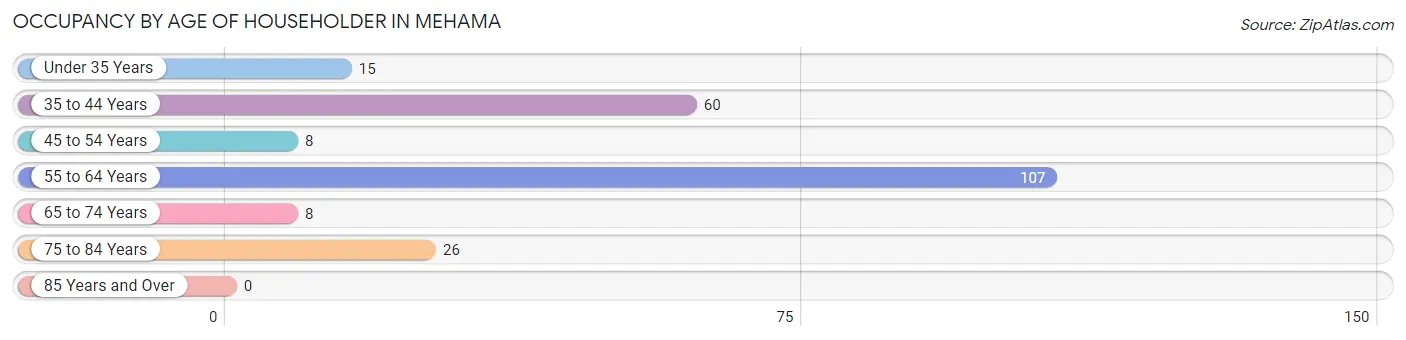
| Age Bracket | # Households | % Households |
| Under 35 Years | 15 | 6.7% |
| 35 to 44 Years | 60 | 26.8% |
| 45 to 54 Years | 8 | 3.6% |
| 55 to 64 Years | 107 | 47.8% |
| 65 to 74 Years | 8 | 3.6% |
| 75 to 84 Years | 26 | 11.6% |
| 85 Years and Over | 0 | 0.0% |
| Total | 224 | 100.0% |
Housing Finances in Mehama
Median Income by Occupancy in Mehama
| Occupancy Type | # Households | Median Income |
| Owner-Occupied | 165 (73.7%) | $0 |
| Renter-Occupied | 59 (26.3%) | $0 |
| Average | 224 (100.0%) | $0 |
Occupancy by Householder Income Bracket in Mehama
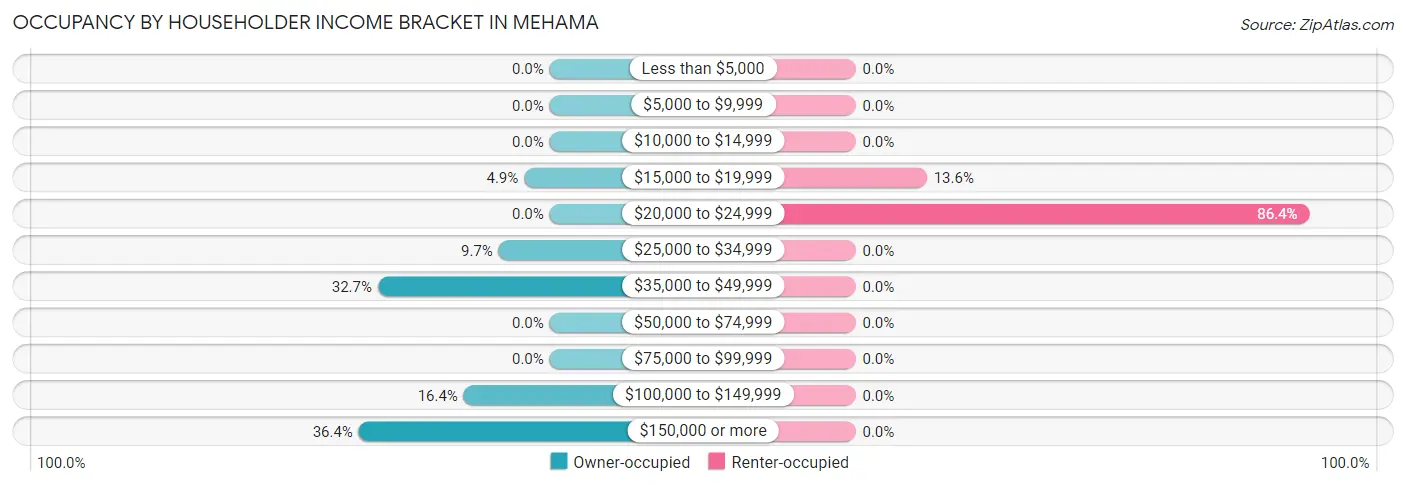
| Income Bracket | Owner-occupied | Renter-occupied |
| Less than $5,000 | 0 (0.0%) | 0 (0.0%) |
| $5,000 to $9,999 | 0 (0.0%) | 0 (0.0%) |
| $10,000 to $14,999 | 0 (0.0%) | 0 (0.0%) |
| $15,000 to $19,999 | 8 (4.9%) | 8 (13.6%) |
| $20,000 to $24,999 | 0 (0.0%) | 51 (86.4%) |
| $25,000 to $34,999 | 16 (9.7%) | 0 (0.0%) |
| $35,000 to $49,999 | 54 (32.7%) | 0 (0.0%) |
| $50,000 to $74,999 | 0 (0.0%) | 0 (0.0%) |
| $75,000 to $99,999 | 0 (0.0%) | 0 (0.0%) |
| $100,000 to $149,999 | 27 (16.4%) | 0 (0.0%) |
| $150,000 or more | 60 (36.4%) | 0 (0.0%) |
| Total | 165 (100.0%) | 59 (100.0%) |
Monthly Housing Cost Tiers in Mehama
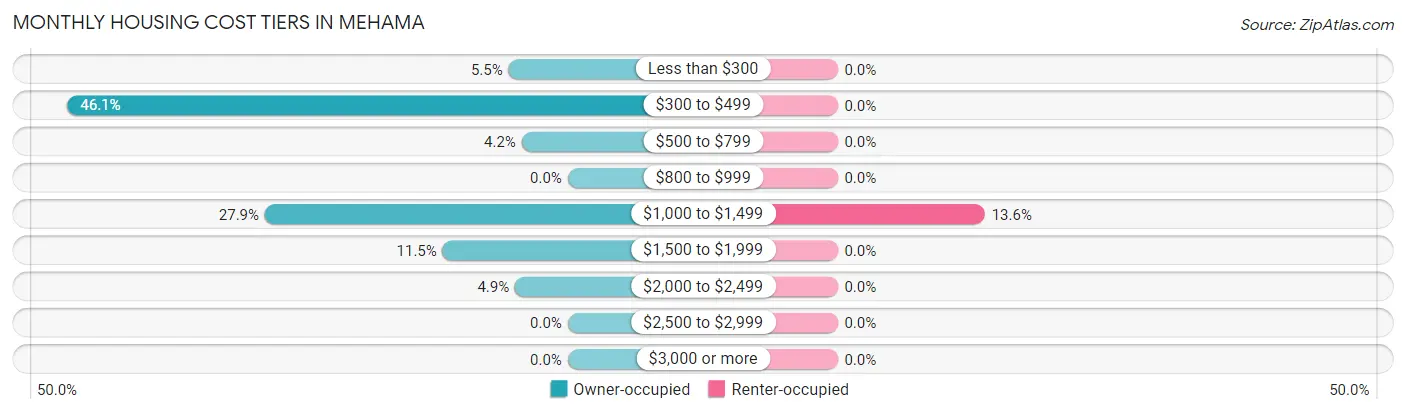
| Monthly Cost | Owner-occupied | Renter-occupied |
| Less than $300 | 9 (5.4%) | 0 (0.0%) |
| $300 to $499 | 76 (46.1%) | 0 (0.0%) |
| $500 to $799 | 7 (4.2%) | 0 (0.0%) |
| $800 to $999 | 0 (0.0%) | 0 (0.0%) |
| $1,000 to $1,499 | 46 (27.9%) | 8 (13.6%) |
| $1,500 to $1,999 | 19 (11.5%) | 0 (0.0%) |
| $2,000 to $2,499 | 8 (4.9%) | 0 (0.0%) |
| $2,500 to $2,999 | 0 (0.0%) | 0 (0.0%) |
| $3,000 or more | 0 (0.0%) | 0 (0.0%) |
| Total | 165 (100.0%) | 59 (100.0%) |
Physical Housing Characteristics in Mehama
Housing Structures in Mehama
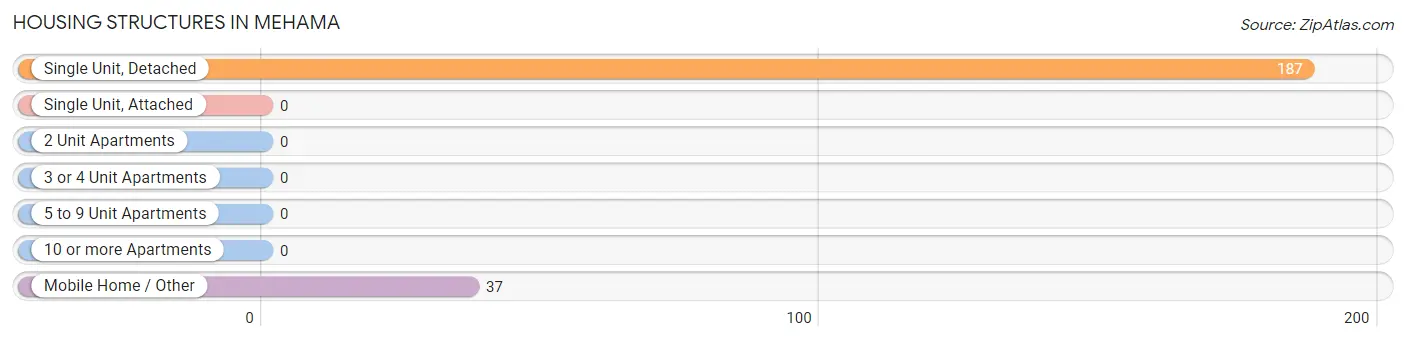
| Structure Type | # Housing Units | % Housing Units |
| Single Unit, Detached | 187 | 83.5% |
| Single Unit, Attached | 0 | 0.0% |
| 2 Unit Apartments | 0 | 0.0% |
| 3 or 4 Unit Apartments | 0 | 0.0% |
| 5 to 9 Unit Apartments | 0 | 0.0% |
| 10 or more Apartments | 0 | 0.0% |
| Mobile Home / Other | 37 | 16.5% |
| Total | 224 | 100.0% |
Housing Structures by Occupancy in Mehama
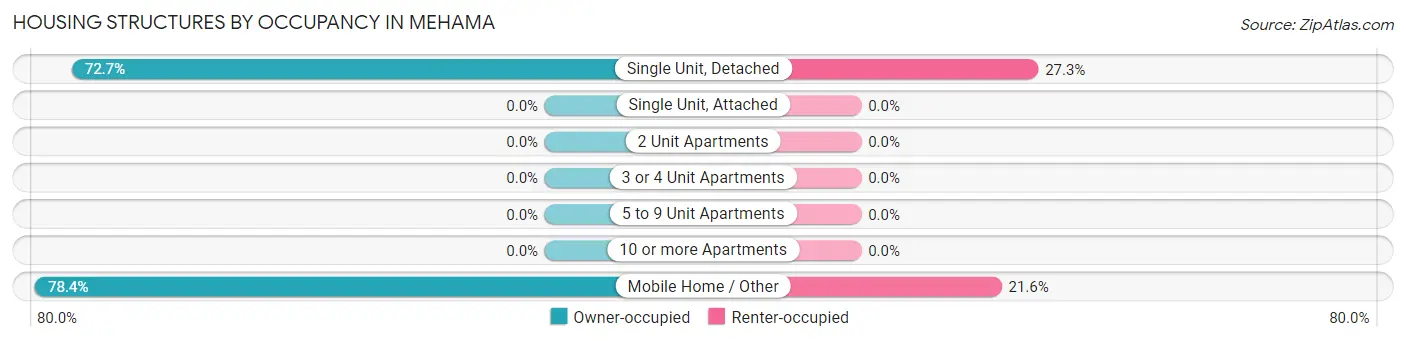
| Structure Type | Owner-occupied | Renter-occupied |
| Single Unit, Detached | 136 (72.7%) | 51 (27.3%) |
| Single Unit, Attached | 0 (0.0%) | 0 (0.0%) |
| 2 Unit Apartments | 0 (0.0%) | 0 (0.0%) |
| 3 or 4 Unit Apartments | 0 (0.0%) | 0 (0.0%) |
| 5 to 9 Unit Apartments | 0 (0.0%) | 0 (0.0%) |
| 10 or more Apartments | 0 (0.0%) | 0 (0.0%) |
| Mobile Home / Other | 29 (78.4%) | 8 (21.6%) |
| Total | 165 (73.7%) | 59 (26.3%) |
Housing Structures by Number of Rooms in Mehama
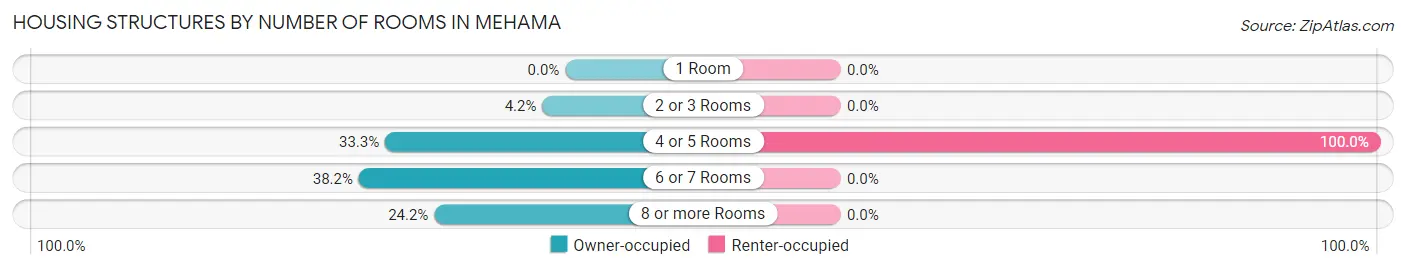
| Number of Rooms | Owner-occupied | Renter-occupied |
| 1 Room | 0 (0.0%) | 0 (0.0%) |
| 2 or 3 Rooms | 7 (4.2%) | 0 (0.0%) |
| 4 or 5 Rooms | 55 (33.3%) | 59 (100.0%) |
| 6 or 7 Rooms | 63 (38.2%) | 0 (0.0%) |
| 8 or more Rooms | 40 (24.2%) | 0 (0.0%) |
| Total | 165 (100.0%) | 59 (100.0%) |
Housing Structure by Heating Type in Mehama
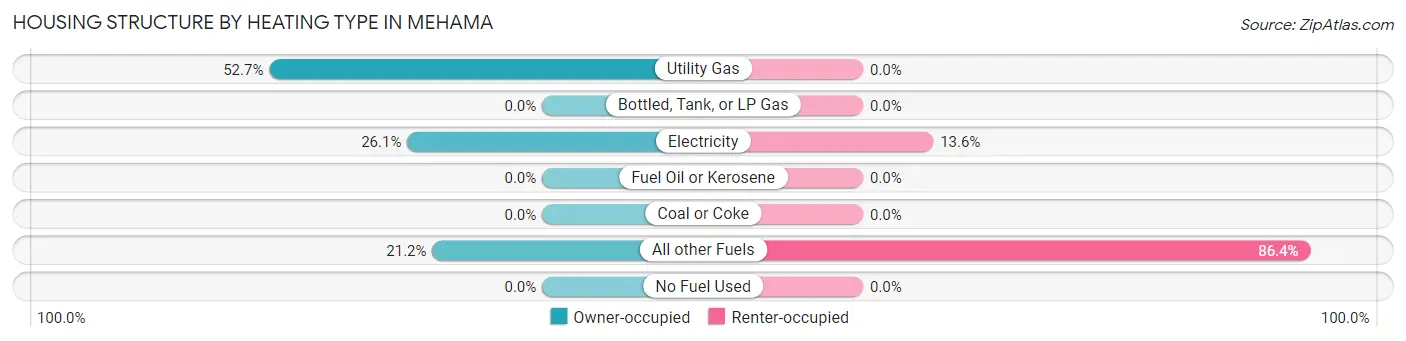
| Heating Type | Owner-occupied | Renter-occupied |
| Utility Gas | 87 (52.7%) | 0 (0.0%) |
| Bottled, Tank, or LP Gas | 0 (0.0%) | 0 (0.0%) |
| Electricity | 43 (26.1%) | 8 (13.6%) |
| Fuel Oil or Kerosene | 0 (0.0%) | 0 (0.0%) |
| Coal or Coke | 0 (0.0%) | 0 (0.0%) |
| All other Fuels | 35 (21.2%) | 51 (86.4%) |
| No Fuel Used | 0 (0.0%) | 0 (0.0%) |
| Total | 165 (100.0%) | 59 (100.0%) |
Household Vehicle Usage in Mehama
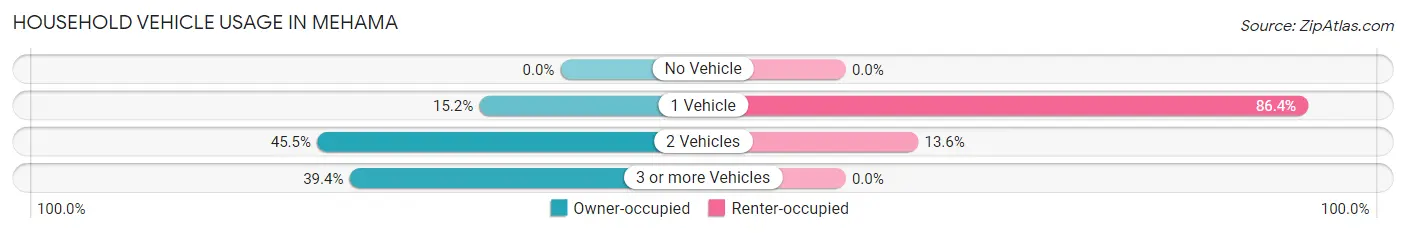
| Vehicles per Household | Owner-occupied | Renter-occupied |
| No Vehicle | 0 (0.0%) | 0 (0.0%) |
| 1 Vehicle | 25 (15.1%) | 51 (86.4%) |
| 2 Vehicles | 75 (45.5%) | 8 (13.6%) |
| 3 or more Vehicles | 65 (39.4%) | 0 (0.0%) |
| Total | 165 (100.0%) | 59 (100.0%) |
Real Estate & Mortgages in Mehama
Real Estate and Mortgage Overview in Mehama
| Characteristic | Without Mortgage | With Mortgage |
| Housing Units | 45 | 120 |
| Median Property Value | $109,400 | $312,800 |
| Median Household Income | - | - |
| Monthly Housing Costs | $447 | $0 |
| Real Estate Taxes | $1,131 | $8 |
Property Value by Mortgage Status in Mehama
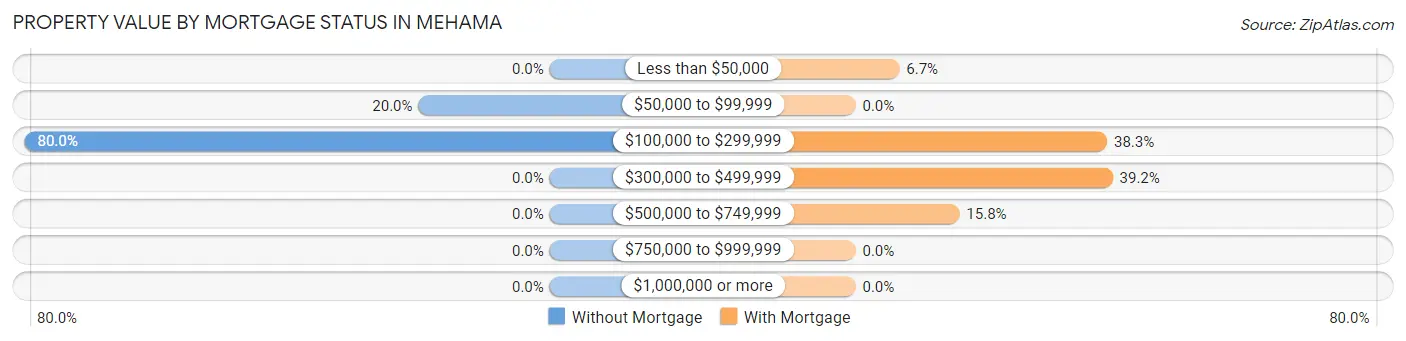
| Property Value | Without Mortgage | With Mortgage |
| Less than $50,000 | 0 (0.0%) | 8 (6.7%) |
| $50,000 to $99,999 | 9 (20.0%) | 0 (0.0%) |
| $100,000 to $299,999 | 36 (80.0%) | 46 (38.3%) |
| $300,000 to $499,999 | 0 (0.0%) | 47 (39.2%) |
| $500,000 to $749,999 | 0 (0.0%) | 19 (15.8%) |
| $750,000 to $999,999 | 0 (0.0%) | 0 (0.0%) |
| $1,000,000 or more | 0 (0.0%) | 0 (0.0%) |
| Total | 45 (100.0%) | 120 (100.0%) |
Household Income by Mortgage Status in Mehama
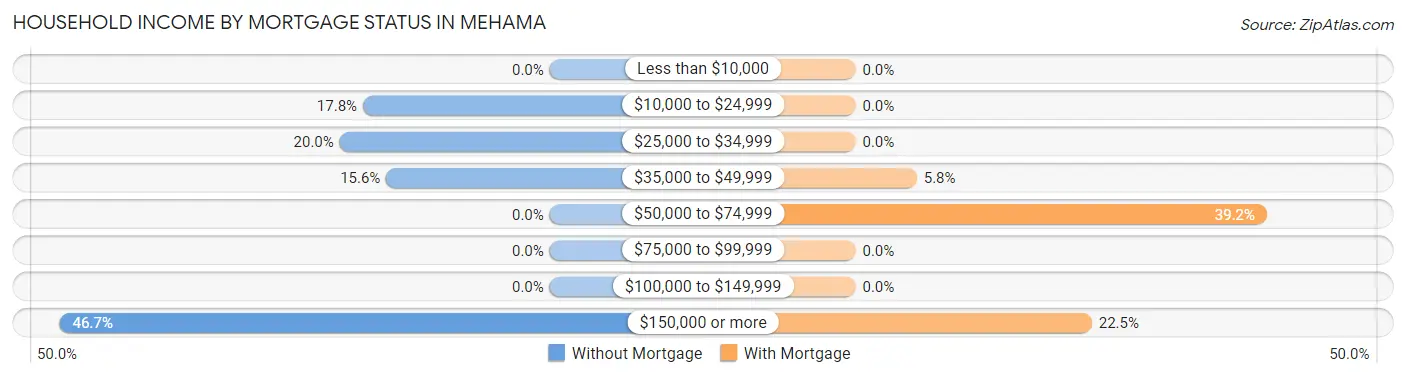
| Household Income | Without Mortgage | With Mortgage |
| Less than $10,000 | 0 (0.0%) | 0 (0.0%) |
| $10,000 to $24,999 | 8 (17.8%) | 0 (0.0%) |
| $25,000 to $34,999 | 9 (20.0%) | 0 (0.0%) |
| $35,000 to $49,999 | 7 (15.6%) | 7 (5.8%) |
| $50,000 to $74,999 | 0 (0.0%) | 47 (39.2%) |
| $75,000 to $99,999 | 0 (0.0%) | 0 (0.0%) |
| $100,000 to $149,999 | 0 (0.0%) | 0 (0.0%) |
| $150,000 or more | 21 (46.7%) | 27 (22.5%) |
| Total | 45 (100.0%) | 120 (100.0%) |
Property Value to Household Income Ratio in Mehama
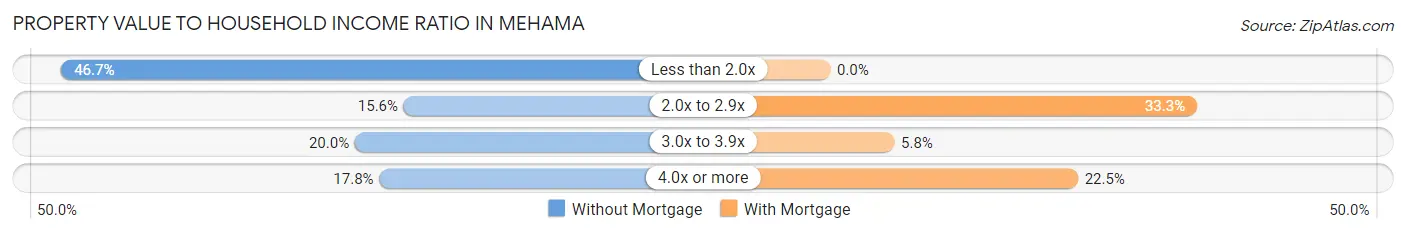
| Value-to-Income Ratio | Without Mortgage | With Mortgage |
| Less than 2.0x | 21 (46.7%) | 0 (0.0%) |
| 2.0x to 2.9x | 7 (15.6%) | 40 (33.3%) |
| 3.0x to 3.9x | 9 (20.0%) | 7 (5.8%) |
| 4.0x or more | 8 (17.8%) | 27 (22.5%) |
| Total | 45 (100.0%) | 120 (100.0%) |
Real Estate Taxes by Mortgage Status in Mehama
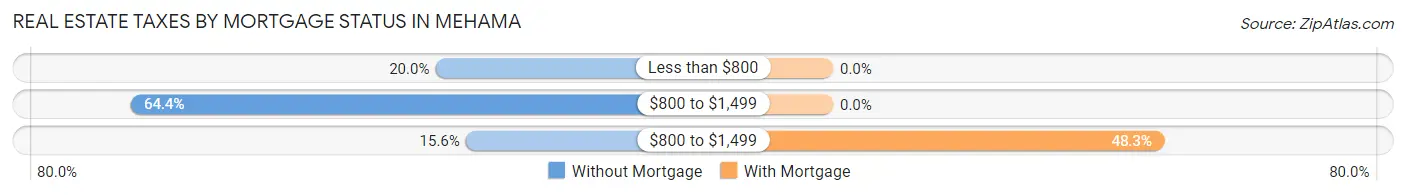
| Property Taxes | Without Mortgage | With Mortgage |
| Less than $800 | 9 (20.0%) | 0 (0.0%) |
| $800 to $1,499 | 29 (64.4%) | 0 (0.0%) |
| $800 to $1,499 | 7 (15.6%) | 58 (48.3%) |
| Total | 45 (100.0%) | 120 (100.0%) |
Health & Disability in Mehama
Health Insurance Coverage by Age in Mehama
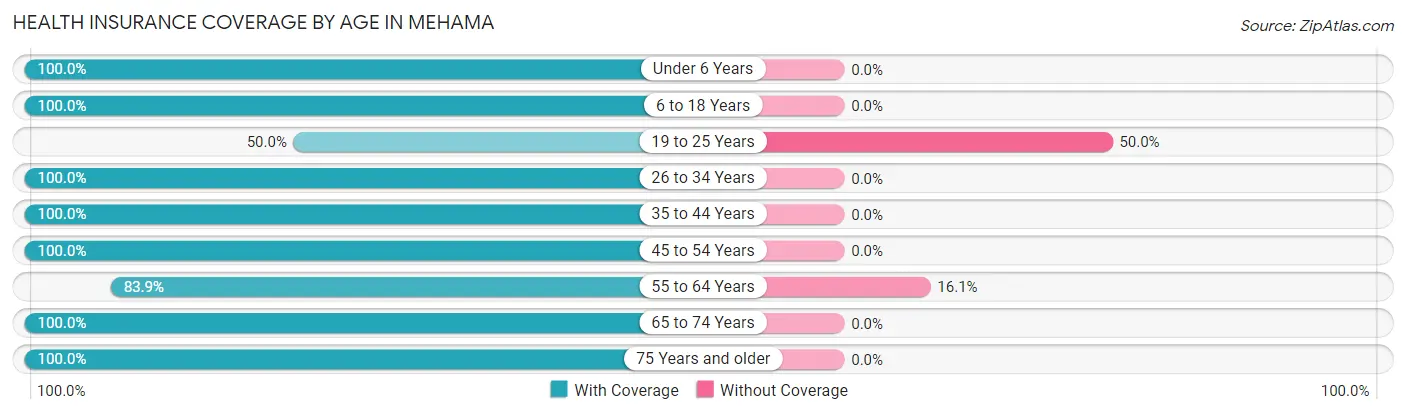
| Age Bracket | With Coverage | Without Coverage |
| Under 6 Years | 55 (100.0%) | 0 (0.0%) |
| 6 to 18 Years | 29 (100.0%) | 0 (0.0%) |
| 19 to 25 Years | 9 (50.0%) | 9 (50.0%) |
| 26 to 34 Years | 37 (100.0%) | 0 (0.0%) |
| 35 to 44 Years | 135 (100.0%) | 0 (0.0%) |
| 45 to 54 Years | 16 (100.0%) | 0 (0.0%) |
| 55 to 64 Years | 115 (83.9%) | 22 (16.1%) |
| 65 to 74 Years | 73 (100.0%) | 0 (0.0%) |
| 75 Years and older | 34 (100.0%) | 0 (0.0%) |
| Total | 503 (94.2%) | 31 (5.8%) |
Health Insurance Coverage by Citizenship Status in Mehama
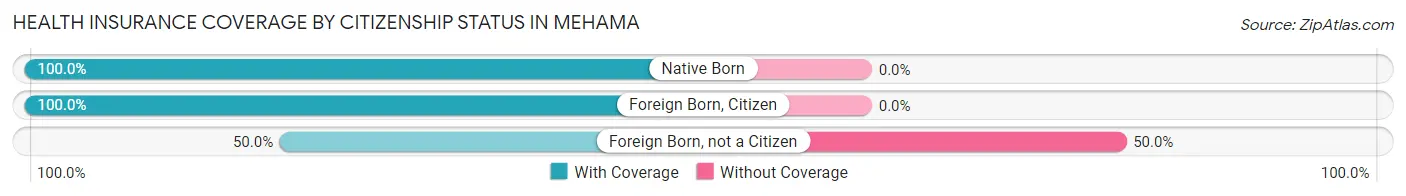
| Citizenship Status | With Coverage | Without Coverage |
| Native Born | 55 (100.0%) | 0 (0.0%) |
| Foreign Born, Citizen | 29 (100.0%) | 0 (0.0%) |
| Foreign Born, not a Citizen | 9 (50.0%) | 9 (50.0%) |
Health Insurance Coverage by Household Income in Mehama
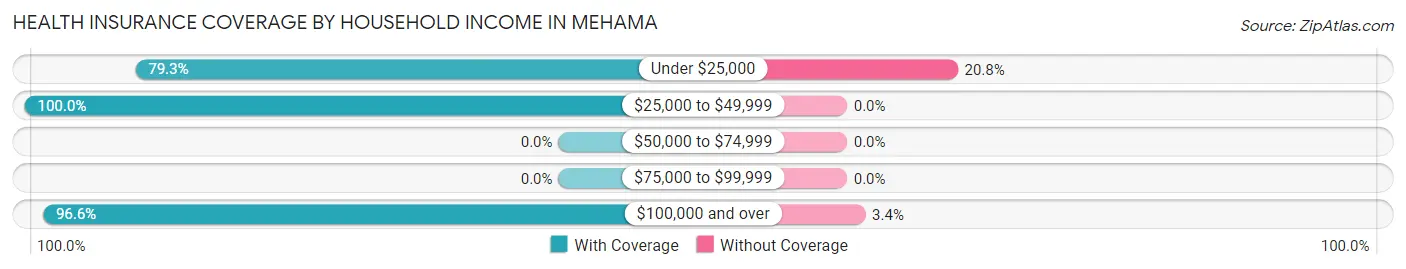
| Household Income | With Coverage | Without Coverage |
| Under $25,000 | 84 (79.2%) | 22 (20.7%) |
| $25,000 to $49,999 | 166 (100.0%) | 0 (0.0%) |
| $50,000 to $74,999 | 0 (0.0%) | 0 (0.0%) |
| $75,000 to $99,999 | 0 (0.0%) | 0 (0.0%) |
| $100,000 and over | 253 (96.6%) | 9 (3.4%) |
Public vs Private Health Insurance Coverage by Age in Mehama
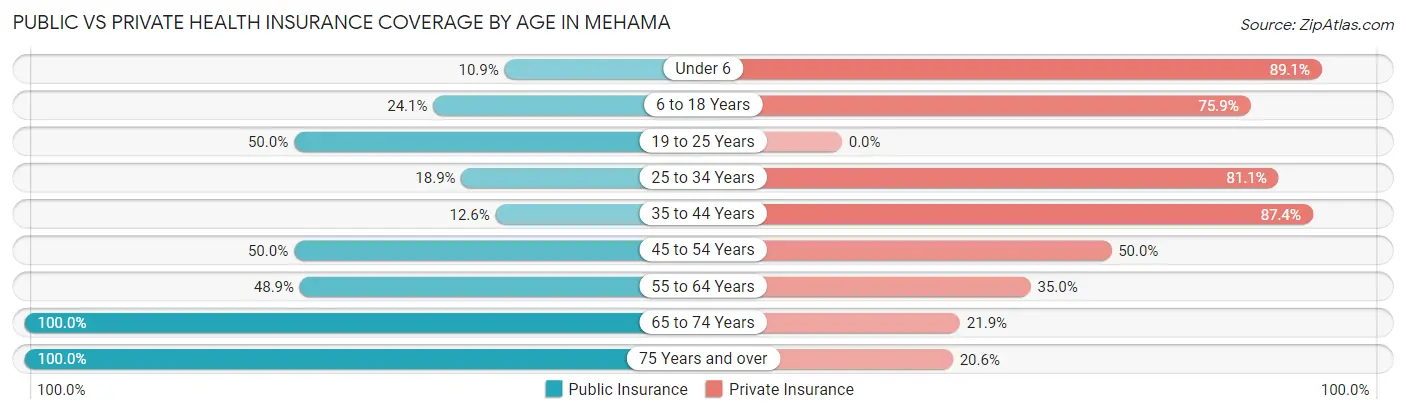
| Age Bracket | Public Insurance | Private Insurance |
| Under 6 | 6 (10.9%) | 49 (89.1%) |
| 6 to 18 Years | 7 (24.1%) | 22 (75.9%) |
| 19 to 25 Years | 9 (50.0%) | 0 (0.0%) |
| 25 to 34 Years | 7 (18.9%) | 30 (81.1%) |
| 35 to 44 Years | 17 (12.6%) | 118 (87.4%) |
| 45 to 54 Years | 8 (50.0%) | 8 (50.0%) |
| 55 to 64 Years | 67 (48.9%) | 48 (35.0%) |
| 65 to 74 Years | 73 (100.0%) | 16 (21.9%) |
| 75 Years and over | 34 (100.0%) | 7 (20.6%) |
| Total | 228 (42.7%) | 298 (55.8%) |
Disability Status by Sex by Age in Mehama
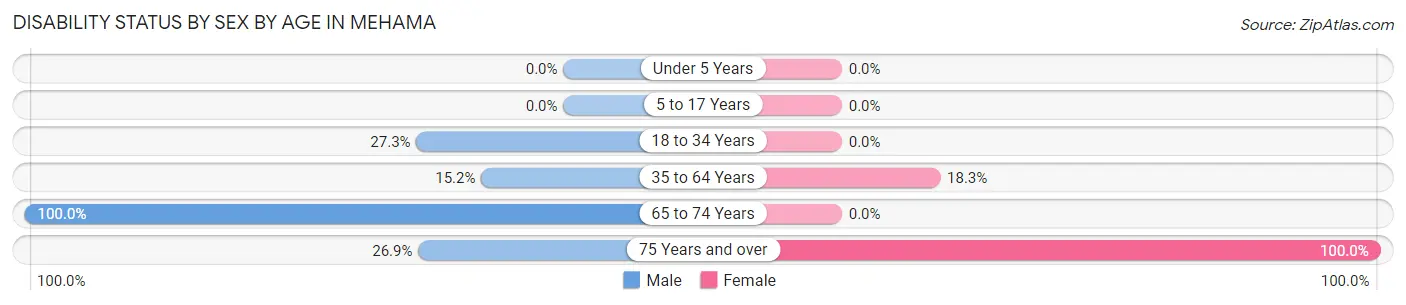
| Age Bracket | Male | Female |
| Under 5 Years | 0 (0.0%) | 0 (0.0%) |
| 5 to 17 Years | 0 (0.0%) | 0 (0.0%) |
| 18 to 34 Years | 9 (27.3%) | 0 (0.0%) |
| 35 to 64 Years | 23 (15.2%) | 25 (18.2%) |
| 65 to 74 Years | 47 (100.0%) | 0 (0.0%) |
| 75 Years and over | 7 (26.9%) | 8 (100.0%) |
Disability Class by Sex by Age in Mehama
Disability Class: Hearing Difficulty
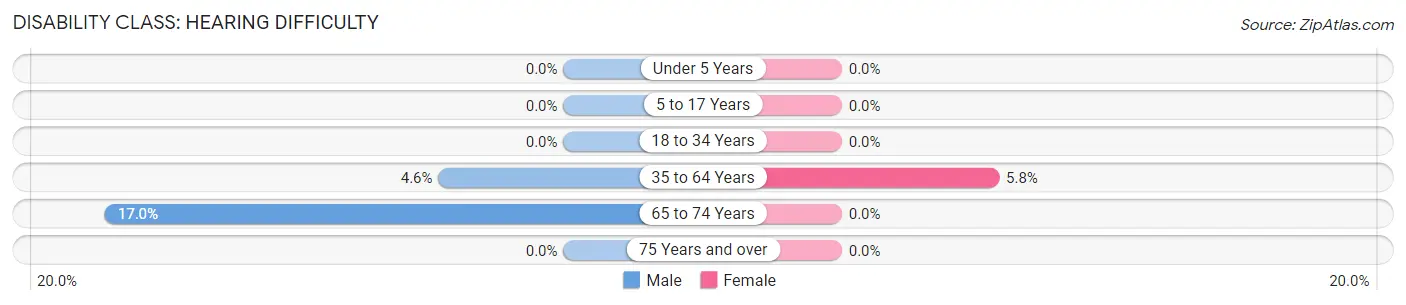
| Age Bracket | Male | Female |
| Under 5 Years | 0 (0.0%) | 0 (0.0%) |
| 5 to 17 Years | 0 (0.0%) | 0 (0.0%) |
| 18 to 34 Years | 0 (0.0%) | 0 (0.0%) |
| 35 to 64 Years | 7 (4.6%) | 8 (5.8%) |
| 65 to 74 Years | 8 (17.0%) | 0 (0.0%) |
| 75 Years and over | 0 (0.0%) | 0 (0.0%) |
Disability Class: Vision Difficulty
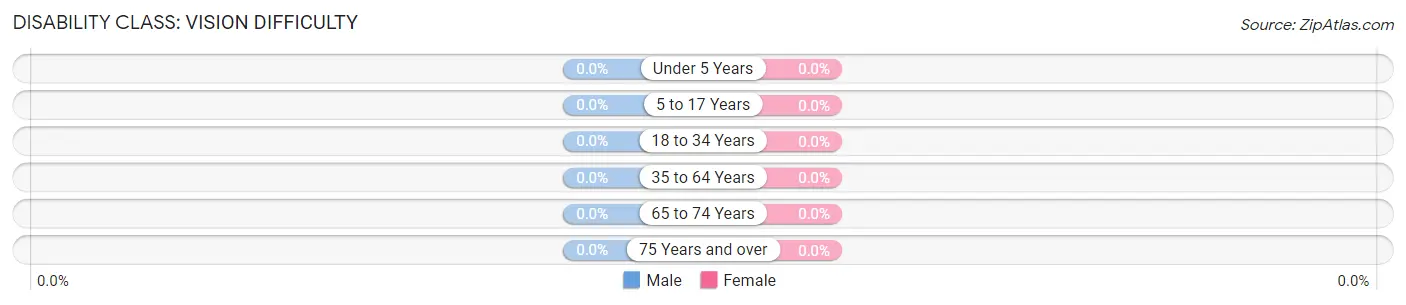
| Age Bracket | Male | Female |
| Under 5 Years | 0 (0.0%) | 0 (0.0%) |
| 5 to 17 Years | 0 (0.0%) | 0 (0.0%) |
| 18 to 34 Years | 0 (0.0%) | 0 (0.0%) |
| 35 to 64 Years | 0 (0.0%) | 0 (0.0%) |
| 65 to 74 Years | 0 (0.0%) | 0 (0.0%) |
| 75 Years and over | 0 (0.0%) | 0 (0.0%) |
Disability Class: Cognitive Difficulty
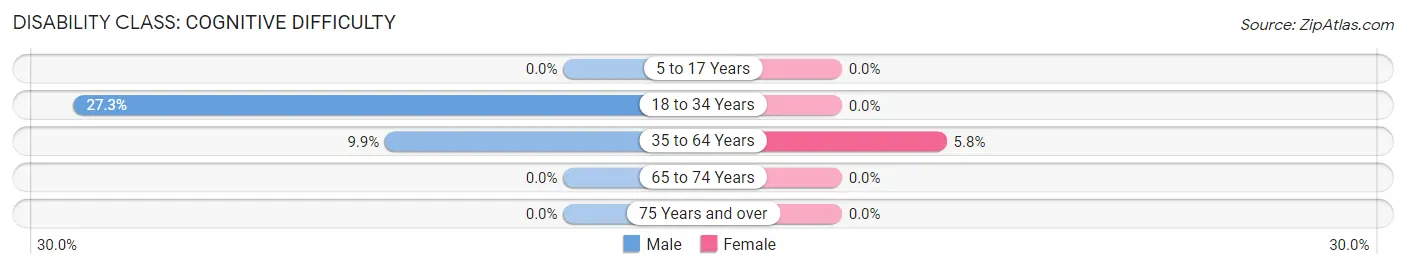
| Age Bracket | Male | Female |
| 5 to 17 Years | 0 (0.0%) | 0 (0.0%) |
| 18 to 34 Years | 9 (27.3%) | 0 (0.0%) |
| 35 to 64 Years | 15 (9.9%) | 8 (5.8%) |
| 65 to 74 Years | 0 (0.0%) | 0 (0.0%) |
| 75 Years and over | 0 (0.0%) | 0 (0.0%) |
Disability Class: Ambulatory Difficulty
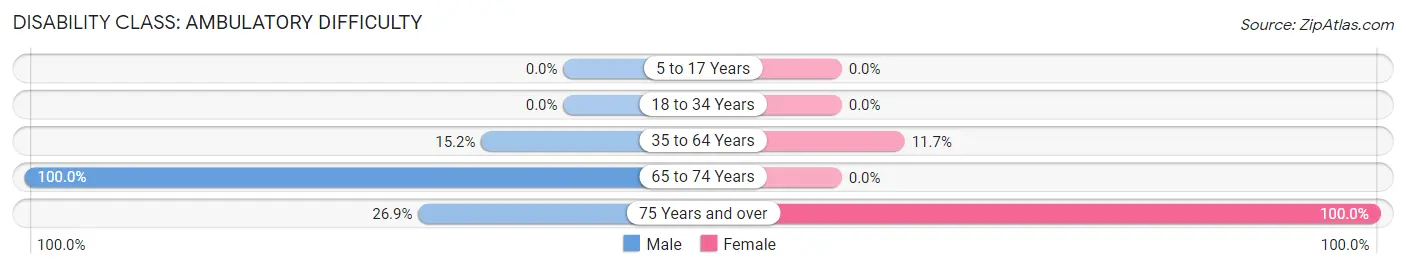
| Age Bracket | Male | Female |
| 5 to 17 Years | 0 (0.0%) | 0 (0.0%) |
| 18 to 34 Years | 0 (0.0%) | 0 (0.0%) |
| 35 to 64 Years | 23 (15.2%) | 16 (11.7%) |
| 65 to 74 Years | 47 (100.0%) | 0 (0.0%) |
| 75 Years and over | 7 (26.9%) | 8 (100.0%) |
Disability Class: Self-Care Difficulty
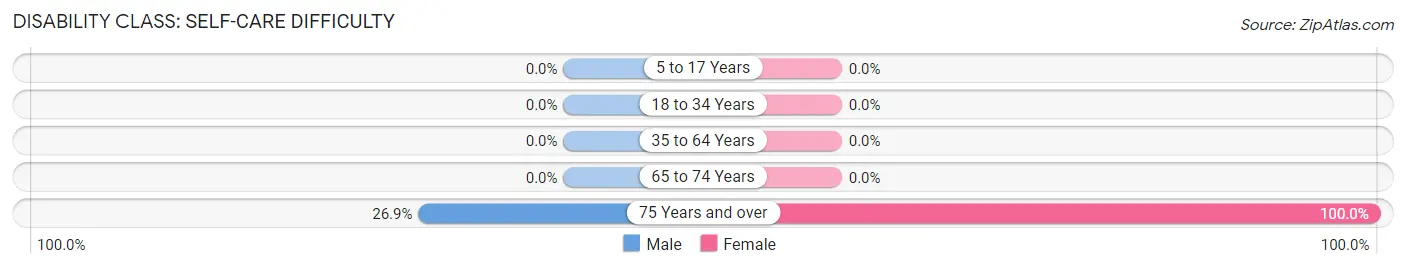
| Age Bracket | Male | Female |
| 5 to 17 Years | 0 (0.0%) | 0 (0.0%) |
| 18 to 34 Years | 0 (0.0%) | 0 (0.0%) |
| 35 to 64 Years | 0 (0.0%) | 0 (0.0%) |
| 65 to 74 Years | 0 (0.0%) | 0 (0.0%) |
| 75 Years and over | 7 (26.9%) | 8 (100.0%) |
Technology Access in Mehama
Computing Device Access in Mehama
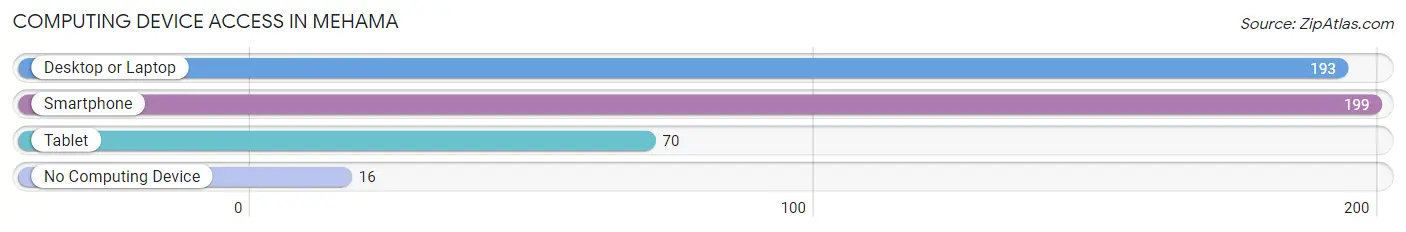
| Device Type | # Households | % Households |
| Desktop or Laptop | 193 | 86.2% |
| Smartphone | 199 | 88.8% |
| Tablet | 70 | 31.2% |
| No Computing Device | 16 | 7.1% |
| Total | 224 | 100.0% |
Internet Access in Mehama
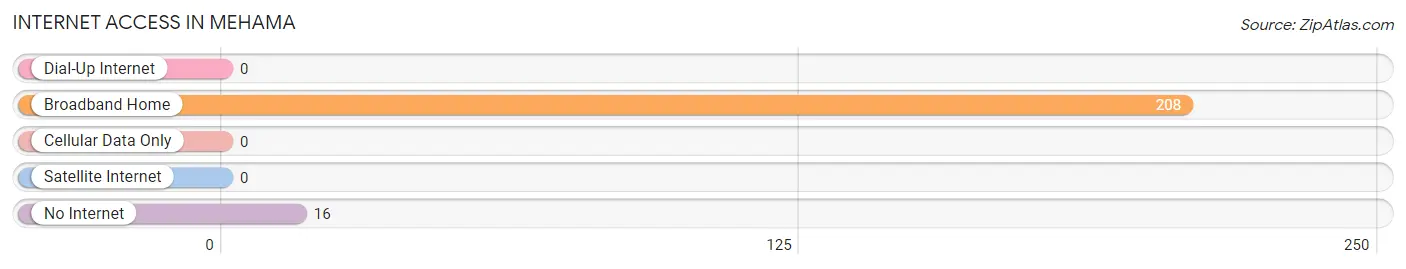
| Internet Type | # Households | % Households |
| Dial-Up Internet | 0 | 0.0% |
| Broadband Home | 208 | 92.9% |
| Cellular Data Only | 0 | 0.0% |
| Satellite Internet | 0 | 0.0% |
| No Internet | 16 | 7.1% |
| Total | 224 | 100.0% |
Mehama Summary
Mehama is a small unincorporated community located in Marion County, Oregon, United States. It is situated along the North Santiam River, approximately 10 miles east of Salem, the state capital. The population of Mehama was estimated to be around 1,000 in 2020.
History
Mehama was founded in 1845 by a group of settlers from the Willamette Valley. The town was originally known as "Mehama Station" and was a stop on the Oregon and California Railroad. The name "Mehama" is derived from the Native American word for "plenty of water".
The town was incorporated in 1891 and was home to a variety of businesses, including a sawmill, a flour mill, a blacksmith shop, and a general store. The town also had a post office, a school, and a church.
In the early 1900s, the town experienced a period of growth and prosperity. The population increased from around 200 in 1900 to over 500 in 1910. The town was home to a variety of businesses, including a hotel, a bank, a movie theater, and a variety of stores.
Geography
Mehama is located in the foothills of the Cascade Mountains, approximately 10 miles east of Salem. The town is situated along the North Santiam River, which provides a variety of recreational activities, including fishing, swimming, and boating. The town is surrounded by rolling hills and lush forests, providing a picturesque backdrop for the town.
Economy
Mehama is a small, rural community with a limited economy. The town is home to a variety of small businesses, including a grocery store, a hardware store, a gas station, and a few restaurants. The town also has a post office and a library.
The town is also home to a variety of agricultural businesses, including a dairy farm, a fruit orchard, and a vineyard. The town is also home to a variety of small manufacturing businesses, including a woodworking shop and a metal fabrication shop.
Demographics
As of the 2010 census, the population of Mehama was estimated to be around 1,000. The town is predominantly white, with around 95% of the population identifying as Caucasian. The median household income in Mehama is around $50,000, which is slightly lower than the national average.
Conclusion
Mehama is a small, rural community located in Marion County, Oregon. The town was founded in 1845 and has a population of around 1,000. The town is situated along the North Santiam River and is surrounded by rolling hills and lush forests. The town is home to a variety of small businesses, including a grocery store, a hardware store, a gas station, and a few restaurants. The town is also home to a variety of agricultural businesses, including a dairy farm, a fruit orchard, and a vineyard. The median household income in Mehama is around $50,000, which is slightly lower than the national average.
Common Questions
What is Per Capita Income in Mehama?
Per Capita income in Mehama is $35,690.
What is Inequality or Gini Index in Mehama?
Inequality or Gini Index in Mehama is 0.43.
What is the Total Population of Mehama?
Total Population of Mehama is 534.
What is the Total Male Population of Mehama?
Total Male Population of Mehama is 297.
What is the Total Female Population of Mehama?
Total Female Population of Mehama is 237.
What is the Ratio of Males per 100 Females in Mehama?
There are 125.32 Males per 100 Females in Mehama.
What is the Ratio of Females per 100 Males in Mehama?
There are 79.80 Females per 100 Males in Mehama.
What is the Median Population Age in Mehama?
Median Population Age in Mehama is 43.0 Years.
What is the Average Family Size in Mehama
Average Family Size in Mehama is 2.8 People.
What is the Average Household Size in Mehama
Average Household Size in Mehama is 2.4 People.
How Large is the Labor Force in Mehama?
There are 297 People in the Labor Forcein in Mehama.
What is the Percentage of People in the Labor Force in Mehama?
66.0% of People are in the Labor Force in Mehama.
What is the Unemployment Rate in Mehama?
Unemployment Rate in Mehama is 3.4%.