Zip Codes with the Highest Percentage of Population Employed in Administrative & Support Services in Beaverton, OR
RELATED REPORTS & OPTIONS
Administrative & Support Services
Beaverton
Compare Zip Codes
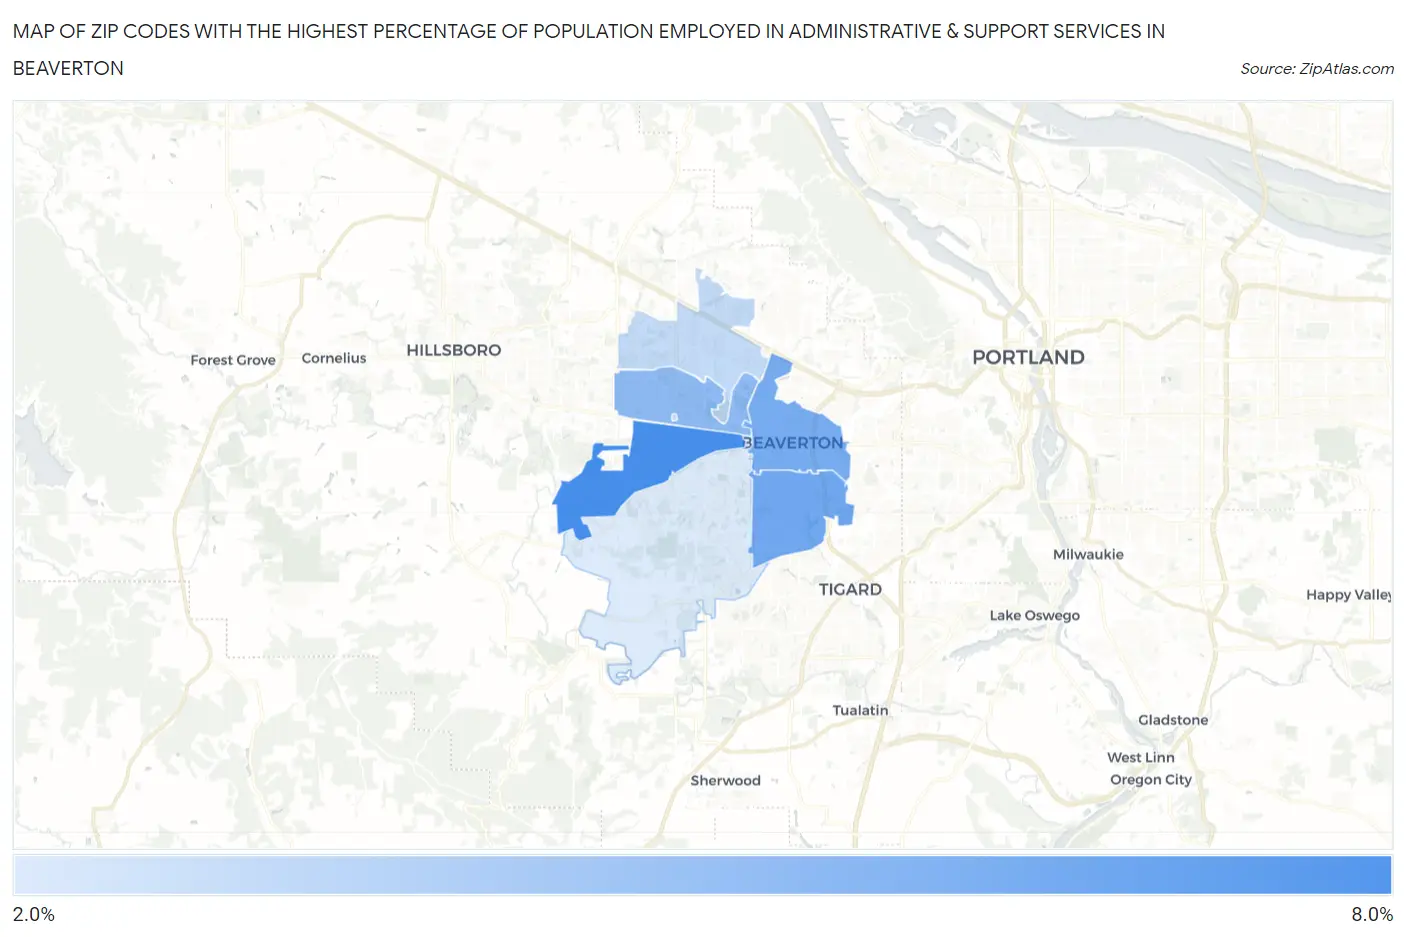
Map of Zip Codes with the Highest Percentage of Population Employed in Administrative & Support Services in Beaverton
2.7%
7.5%
Zip Codes with the Highest Percentage of Population Employed in Administrative & Support Services in Beaverton, OR
| Zip Code | % Employed | vs State | vs National | |
| 1. | 97078 | 7.5% | 3.9%(+3.54)#43 | 4.1%(+3.34)#2,698 |
| 2. | 97008 | 6.1% | 3.9%(+2.19)#61 | 4.1%(+1.99)#4,523 |
| 3. | 97005 | 5.9% | 3.9%(+1.98)#69 | 4.1%(+1.77)#4,928 |
| 4. | 97003 | 5.2% | 3.9%(+1.23)#90 | 4.1%(+1.02)#6,653 |
| 5. | 97006 | 3.5% | 3.9%(-0.420)#180 | 4.1%(-0.626)#12,841 |
| 6. | 97007 | 2.7% | 3.9%(-1.24)#228 | 4.1%(-1.45)#17,055 |
1
Common Questions
What are the Top 5 Zip Codes with the Highest Percentage of Population Employed in Administrative & Support Services in Beaverton, OR?
Top 5 Zip Codes with the Highest Percentage of Population Employed in Administrative & Support Services in Beaverton, OR are:
What zip code has the Highest Percentage of Population Employed in Administrative & Support Services in Beaverton, OR?
97078 has the Highest Percentage of Population Employed in Administrative & Support Services in Beaverton, OR with 7.5%.
What is the Percentage of Population Employed in Administrative & Support Services in Beaverton, OR?
Percentage of Population Employed in Administrative & Support Services in Beaverton is 4.0%.
What is the Percentage of Population Employed in Administrative & Support Services in Oregon?
Percentage of Population Employed in Administrative & Support Services in Oregon is 3.9%.
What is the Percentage of Population Employed in Administrative & Support Services in the United States?
Percentage of Population Employed in Administrative & Support Services in the United States is 4.1%.