Zip Codes with the Highest Percentage of Population Employed in Administrative & Support Services in Portland, OR
RELATED REPORTS & OPTIONS
Administrative & Support Services
Portland
Compare Zip Codes
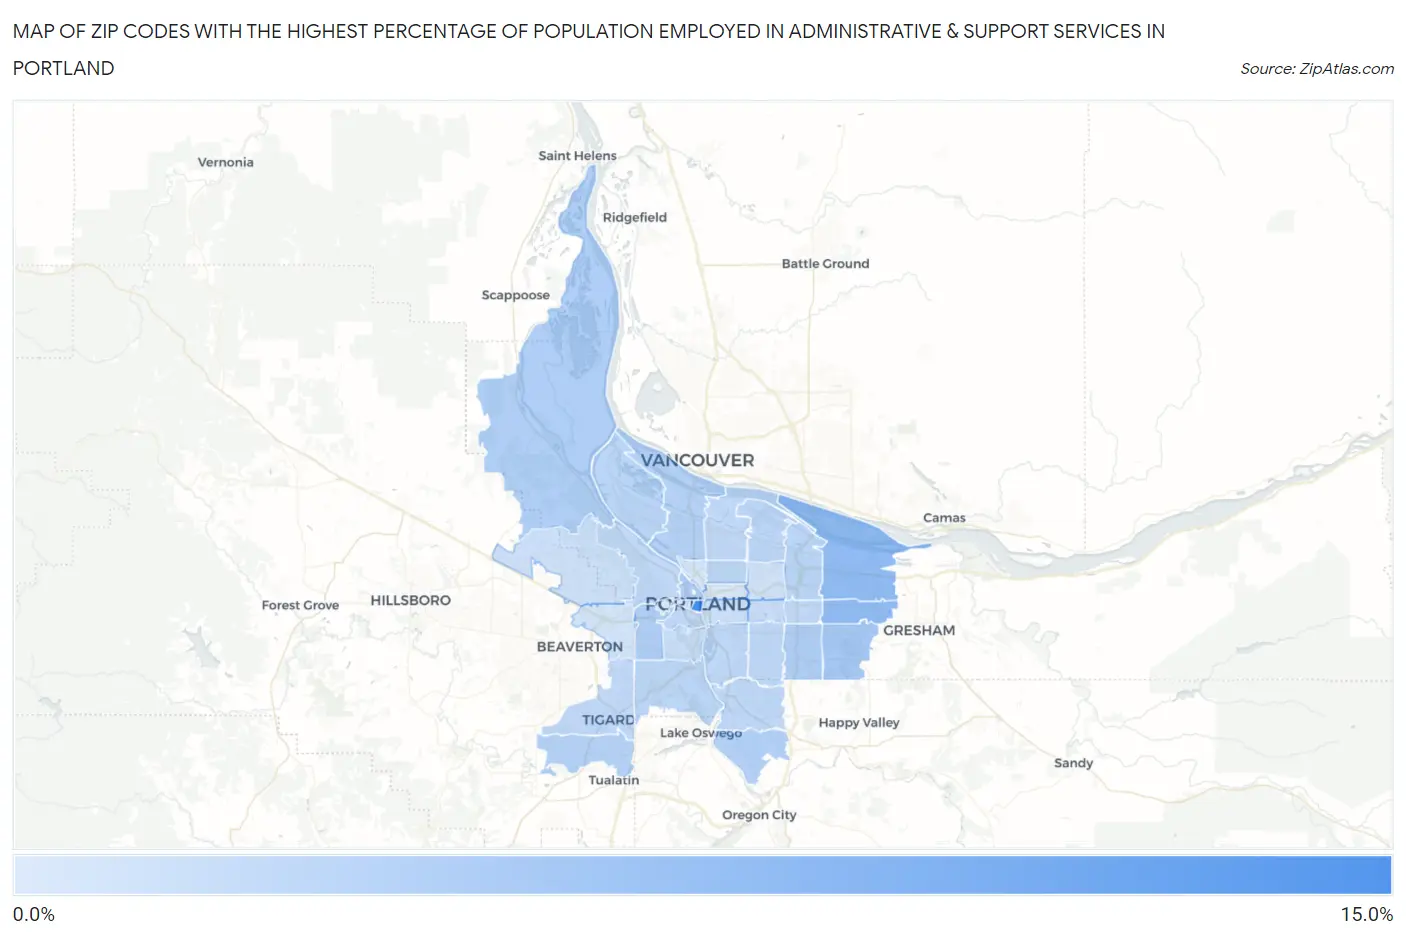
Map of Zip Codes with the Highest Percentage of Population Employed in Administrative & Support Services in Portland
0.89%
12.8%
Zip Codes with the Highest Percentage of Population Employed in Administrative & Support Services in Portland, OR
| Zip Code | % Employed | vs State | vs National | |
| 1. | 97204 | 12.8% | 3.9%(+8.86)#17 | 4.1%(+8.66)#744 |
| 2. | 97233 | 6.8% | 3.9%(+2.88)#47 | 4.1%(+2.67)#3,457 |
| 3. | 97230 | 6.8% | 3.9%(+2.83)#50 | 4.1%(+2.62)#3,510 |
| 4. | 97236 | 5.1% | 3.9%(+1.13)#94 | 4.1%(+0.922)#6,919 |
| 5. | 97209 | 4.5% | 3.9%(+0.579)#120 | 4.1%(+0.373)#8,643 |
| 6. | 97221 | 4.5% | 3.9%(+0.533)#122 | 4.1%(+0.327)#8,803 |
| 7. | 97266 | 4.4% | 3.9%(+0.438)#129 | 4.1%(+0.232)#9,153 |
| 8. | 97231 | 4.3% | 3.9%(+0.338)#133 | 4.1%(+0.131)#9,518 |
| 9. | 97267 | 4.1% | 3.9%(+0.183)#142 | 4.1%(-0.024)#10,132 |
| 10. | 97224 | 3.9% | 3.9%(-0.080)#159 | 4.1%(-0.286)#11,270 |
| 11. | 97217 | 3.8% | 3.9%(-0.124)#163 | 4.1%(-0.330)#11,450 |
| 12. | 97220 | 3.6% | 3.9%(-0.361)#175 | 4.1%(-0.567)#12,554 |
| 13. | 97203 | 3.5% | 3.9%(-0.475)#184 | 4.1%(-0.682)#13,127 |
| 14. | 97218 | 3.4% | 3.9%(-0.566)#190 | 4.1%(-0.772)#13,559 |
| 15. | 97212 | 3.4% | 3.9%(-0.570)#191 | 4.1%(-0.776)#13,577 |
| 16. | 97219 | 3.3% | 3.9%(-0.668)#197 | 4.1%(-0.874)#14,080 |
| 17. | 97206 | 3.2% | 3.9%(-0.764)#202 | 4.1%(-0.970)#14,579 |
| 18. | 97202 | 3.2% | 3.9%(-0.770)#203 | 4.1%(-0.976)#14,610 |
| 19. | 97201 | 3.2% | 3.9%(-0.777)#205 | 4.1%(-0.983)#14,651 |
| 20. | 97222 | 3.1% | 3.9%(-0.845)#212 | 4.1%(-1.05)#15,003 |
| 21. | 97223 | 3.0% | 3.9%(-0.967)#215 | 4.1%(-1.17)#15,595 |
| 22. | 97216 | 2.9% | 3.9%(-1.00)#217 | 4.1%(-1.21)#15,813 |
| 23. | 97210 | 2.9% | 3.9%(-1.01)#219 | 4.1%(-1.22)#15,845 |
| 24. | 97211 | 2.9% | 3.9%(-1.02)#220 | 4.1%(-1.22)#15,857 |
| 25. | 97239 | 2.5% | 3.9%(-1.45)#237 | 4.1%(-1.65)#18,158 |
| 26. | 97215 | 2.4% | 3.9%(-1.56)#241 | 4.1%(-1.76)#18,730 |
| 27. | 97229 | 2.2% | 3.9%(-1.77)#252 | 4.1%(-1.97)#19,760 |
| 28. | 97214 | 2.1% | 3.9%(-1.80)#254 | 4.1%(-2.01)#19,954 |
| 29. | 97213 | 1.8% | 3.9%(-2.14)#272 | 4.1%(-2.35)#21,507 |
| 30. | 97225 | 1.6% | 3.9%(-2.38)#280 | 4.1%(-2.58)#22,482 |
| 31. | 97227 | 1.4% | 3.9%(-2.56)#288 | 4.1%(-2.77)#23,185 |
| 32. | 97232 | 1.2% | 3.9%(-2.79)#298 | 4.1%(-3.00)#24,007 |
| 33. | 97205 | 0.89% | 3.9%(-3.05)#304 | 4.1%(-3.26)#24,860 |
1
Common Questions
What are the Top 10 Zip Codes with the Highest Percentage of Population Employed in Administrative & Support Services in Portland, OR?
Top 10 Zip Codes with the Highest Percentage of Population Employed in Administrative & Support Services in Portland, OR are:
What zip code has the Highest Percentage of Population Employed in Administrative & Support Services in Portland, OR?
97204 has the Highest Percentage of Population Employed in Administrative & Support Services in Portland, OR with 12.8%.
What is the Percentage of Population Employed in Administrative & Support Services in Portland, OR?
Percentage of Population Employed in Administrative & Support Services in Portland is 3.4%.
What is the Percentage of Population Employed in Administrative & Support Services in Oregon?
Percentage of Population Employed in Administrative & Support Services in Oregon is 3.9%.
What is the Percentage of Population Employed in Administrative & Support Services in the United States?
Percentage of Population Employed in Administrative & Support Services in the United States is 4.1%.