Grants Pass, OR Map & Demographics
Grants Pass Map
Grants Pass Overview
$30,649
PER CAPITA INCOME
$62,144
AVG FAMILY INCOME
$53,941
AVG HOUSEHOLD INCOME
30.3%
WAGE / INCOME GAP [ % ]
69.7¢/ $1
WAGE / INCOME GAP [ $ ]
$9,676
FAMILY INCOME DEFICIT
0.45
INEQUALITY / GINI INDEX
39,131
TOTAL POPULATION
18,552
MALE POPULATION
20,579
FEMALE POPULATION
90.15
MALES / 100 FEMALES
110.93
FEMALES / 100 MALES
41.0
MEDIAN AGE
2.8
AVG FAMILY SIZE
2.3
AVG HOUSEHOLD SIZE
17,811
LABOR FORCE [ PEOPLE ]
55.8%
PERCENT IN LABOR FORCE
6.3%
UNEMPLOYMENT RATE
Grants Pass Area Codes
Income in Grants Pass
Income Overview in Grants Pass
Per Capita Income in Grants Pass is $30,649, while median incomes of families and households are $62,144 and $53,941 respectively.
| Characteristic | Number | Measure |
| Per Capita Income | 39,131 | $30,649 |
| Median Family Income | 10,419 | $62,144 |
| Mean Family Income | 10,419 | $79,149 |
| Median Household Income | 16,474 | $53,941 |
| Mean Household Income | 16,474 | $72,439 |
| Income Deficit | 10,419 | $9,676 |
| Wage / Income Gap (%) | 39,131 | 30.29% |
| Wage / Income Gap ($) | 39,131 | 69.71¢ per $1 |
| Gini / Inequality Index | 39,131 | 0.45 |
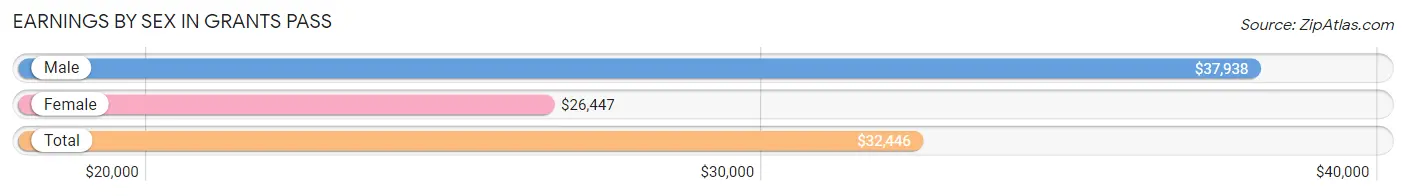
Earnings by Sex in Grants Pass
Average Earnings in Grants Pass are $32,446, $37,938 for men and $26,447 for women, a difference of 30.3%.
| Sex | Number | Average Earnings |
| Male | 9,223 (49.7%) | $37,938 |
| Female | 9,349 (50.3%) | $26,447 |
| Total | 18,572 (100.0%) | $32,446 |
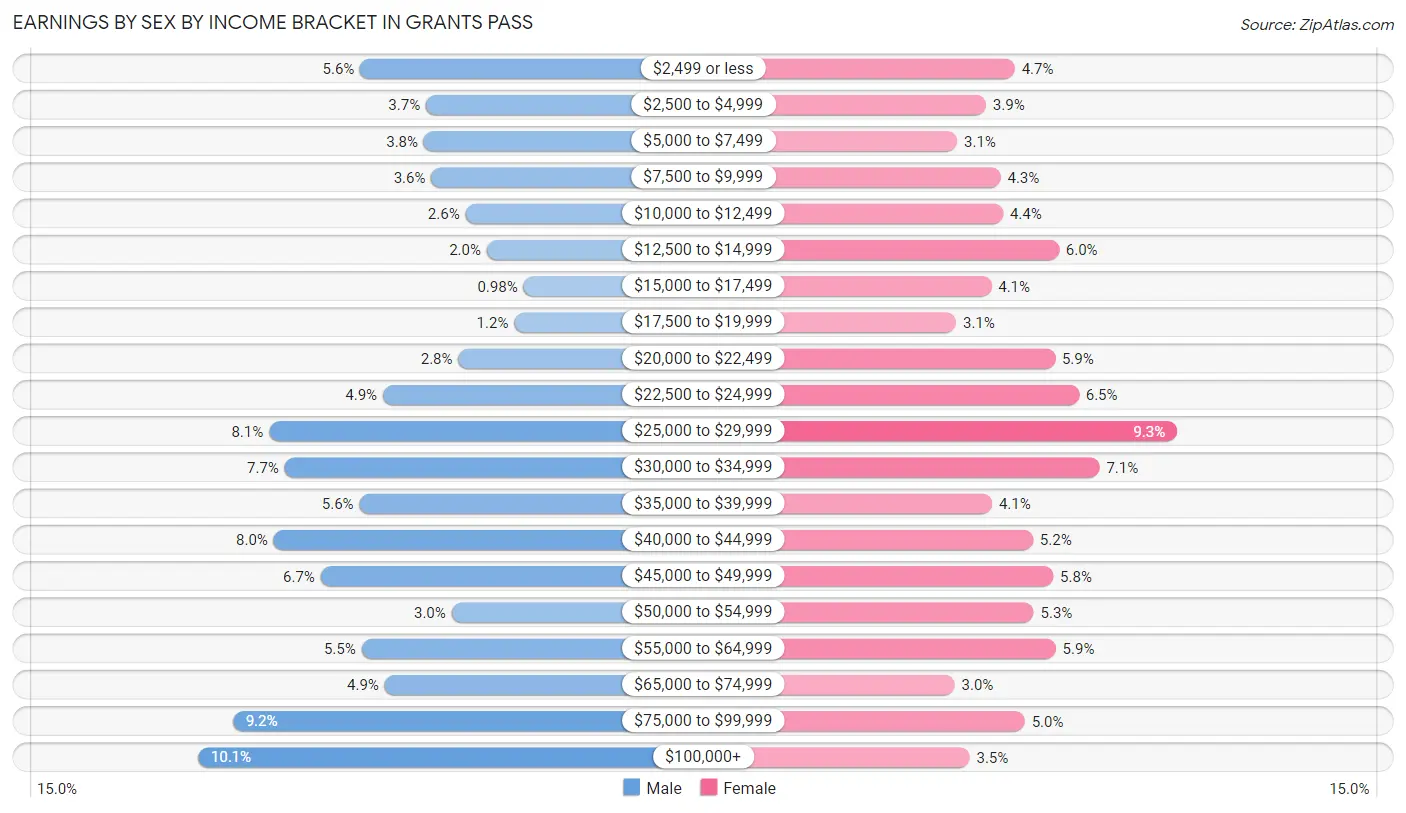
Earnings by Sex by Income Bracket in Grants Pass
The most common earnings brackets in Grants Pass are $100,000+ for men (934 | 10.1%) and $25,000 to $29,999 for women (868 | 9.3%).
| Income | Male | Female |
| $2,499 or less | 514 (5.6%) | 441 (4.7%) |
| $2,500 to $4,999 | 343 (3.7%) | 366 (3.9%) |
| $5,000 to $7,499 | 349 (3.8%) | 290 (3.1%) |
| $7,500 to $9,999 | 329 (3.6%) | 404 (4.3%) |
| $10,000 to $12,499 | 241 (2.6%) | 410 (4.4%) |
| $12,500 to $14,999 | 185 (2.0%) | 557 (6.0%) |
| $15,000 to $17,499 | 90 (1.0%) | 380 (4.1%) |
| $17,500 to $19,999 | 114 (1.2%) | 287 (3.1%) |
| $20,000 to $22,499 | 259 (2.8%) | 547 (5.9%) |
| $22,500 to $24,999 | 455 (4.9%) | 610 (6.5%) |
| $25,000 to $29,999 | 750 (8.1%) | 868 (9.3%) |
| $30,000 to $34,999 | 709 (7.7%) | 664 (7.1%) |
| $35,000 to $39,999 | 516 (5.6%) | 381 (4.1%) |
| $40,000 to $44,999 | 738 (8.0%) | 489 (5.2%) |
| $45,000 to $49,999 | 616 (6.7%) | 542 (5.8%) |
| $50,000 to $54,999 | 277 (3.0%) | 491 (5.2%) |
| $55,000 to $64,999 | 510 (5.5%) | 549 (5.9%) |
| $65,000 to $74,999 | 450 (4.9%) | 283 (3.0%) |
| $75,000 to $99,999 | 844 (9.1%) | 467 (5.0%) |
| $100,000+ | 934 (10.1%) | 323 (3.5%) |
| Total | 9,223 (100.0%) | 9,349 (100.0%) |
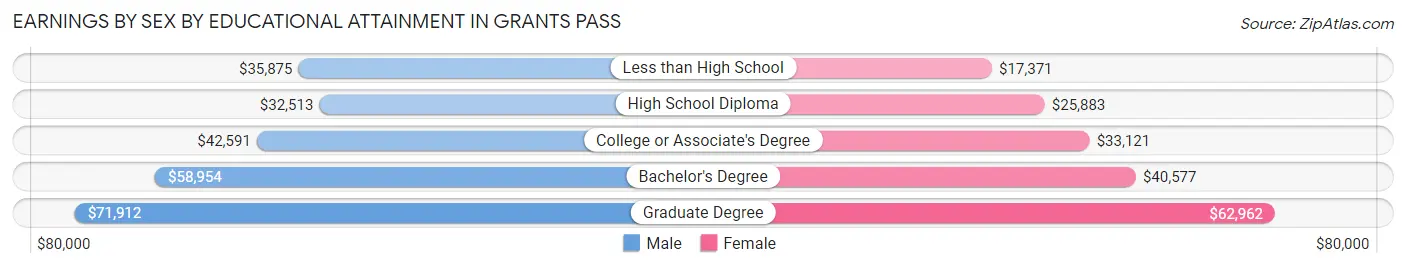
Earnings by Sex by Educational Attainment in Grants Pass
Average earnings in Grants Pass are $42,800 for men and $31,059 for women, a difference of 27.4%. Men with an educational attainment of graduate degree enjoy the highest average annual earnings of $71,912, while those with high school diploma education earn the least with $32,513. Women with an educational attainment of graduate degree earn the most with the average annual earnings of $62,962, while those with less than high school education have the smallest earnings of $17,371.
| Educational Attainment | Male Income | Female Income |
| Less than High School | $35,875 | $17,371 |
| High School Diploma | $32,513 | $25,883 |
| College or Associate's Degree | $42,591 | $33,121 |
| Bachelor's Degree | $58,954 | $40,577 |
| Graduate Degree | $71,912 | $62,962 |
| Total | $42,800 | $31,059 |
Family Income in Grants Pass
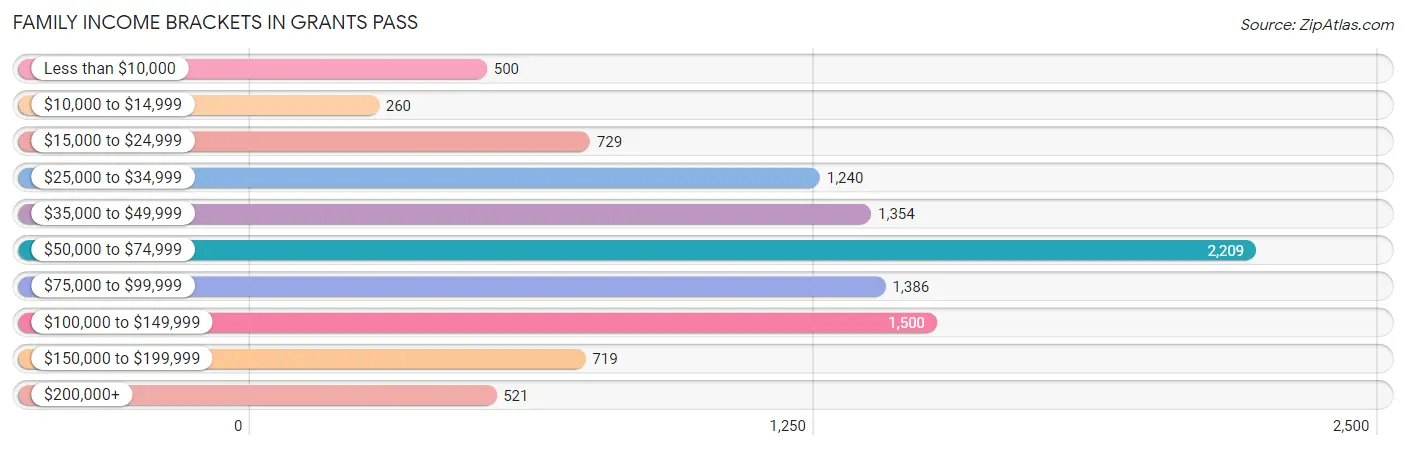
Family Income Brackets in Grants Pass
According to the Grants Pass family income data, there are 2,209 families falling into the $50,000 to $74,999 income range, which is the most common income bracket and makes up 21.2% of all families. Conversely, the $10,000 to $14,999 income bracket is the least frequent group with only 260 families (2.5%) belonging to this category.
| Income Bracket | # Families | % Families |
| Less than $10,000 | 500 | 4.8% |
| $10,000 to $14,999 | 260 | 2.5% |
| $15,000 to $24,999 | 729 | 7.0% |
| $25,000 to $34,999 | 1,240 | 11.9% |
| $35,000 to $49,999 | 1,354 | 13.0% |
| $50,000 to $74,999 | 2,209 | 21.2% |
| $75,000 to $99,999 | 1,386 | 13.3% |
| $100,000 to $149,999 | 1,500 | 14.4% |
| $150,000 to $199,999 | 719 | 6.9% |
| $200,000+ | 521 | 5.0% |
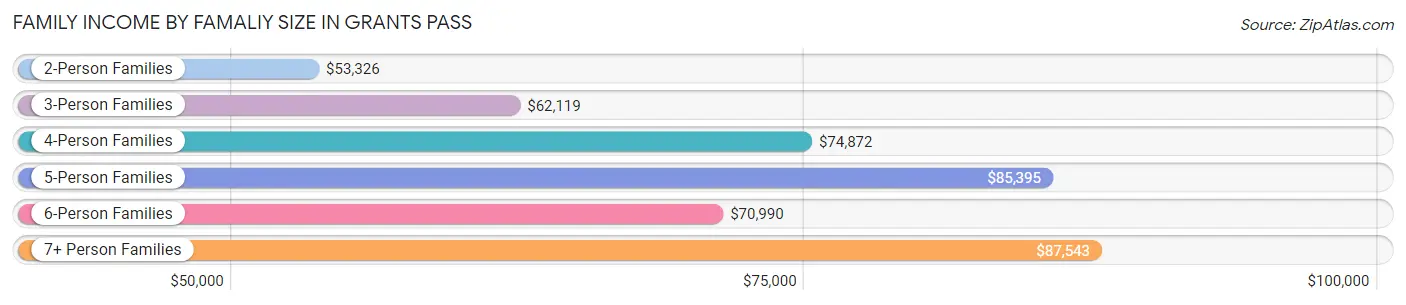
Family Income by Famaliy Size in Grants Pass
7+ person families (57 | 0.5%) account for the highest median family income in Grants Pass with $87,543 per family, while 2-person families (5,349 | 51.3%) have the highest median income of $26,663 per family member.
| Income Bracket | # Families | Median Income |
| 2-Person Families | 5,349 (51.3%) | $53,326 |
| 3-Person Families | 2,385 (22.9%) | $62,119 |
| 4-Person Families | 1,404 (13.5%) | $74,872 |
| 5-Person Families | 926 (8.9%) | $85,395 |
| 6-Person Families | 298 (2.9%) | $70,990 |
| 7+ Person Families | 57 (0.5%) | $87,543 |
| Total | 10,419 (100.0%) | $62,144 |
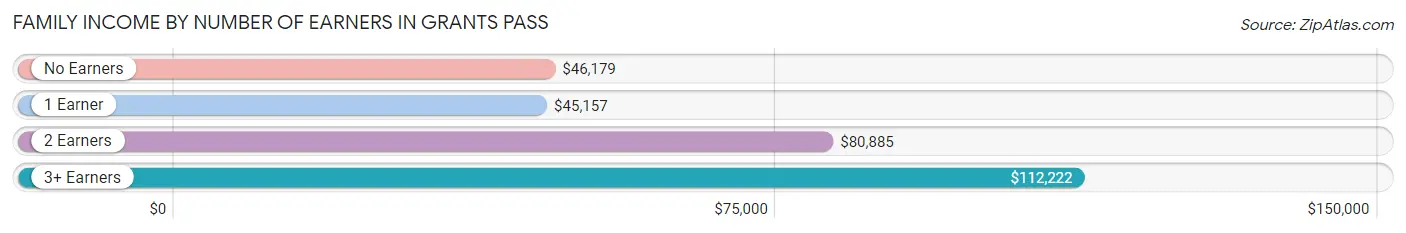
Family Income by Number of Earners in Grants Pass
The median family income in Grants Pass is $62,144, with families comprising 3+ earners (618) having the highest median family income of $112,222, while families with 1 earner (3,811) have the lowest median family income of $45,157, accounting for 5.9% and 36.6% of families, respectively.
| Number of Earners | # Families | Median Income |
| No Earners | 2,088 (20.0%) | $46,179 |
| 1 Earner | 3,811 (36.6%) | $45,157 |
| 2 Earners | 3,902 (37.4%) | $80,885 |
| 3+ Earners | 618 (5.9%) | $112,222 |
| Total | 10,419 (100.0%) | $62,144 |
Household Income in Grants Pass
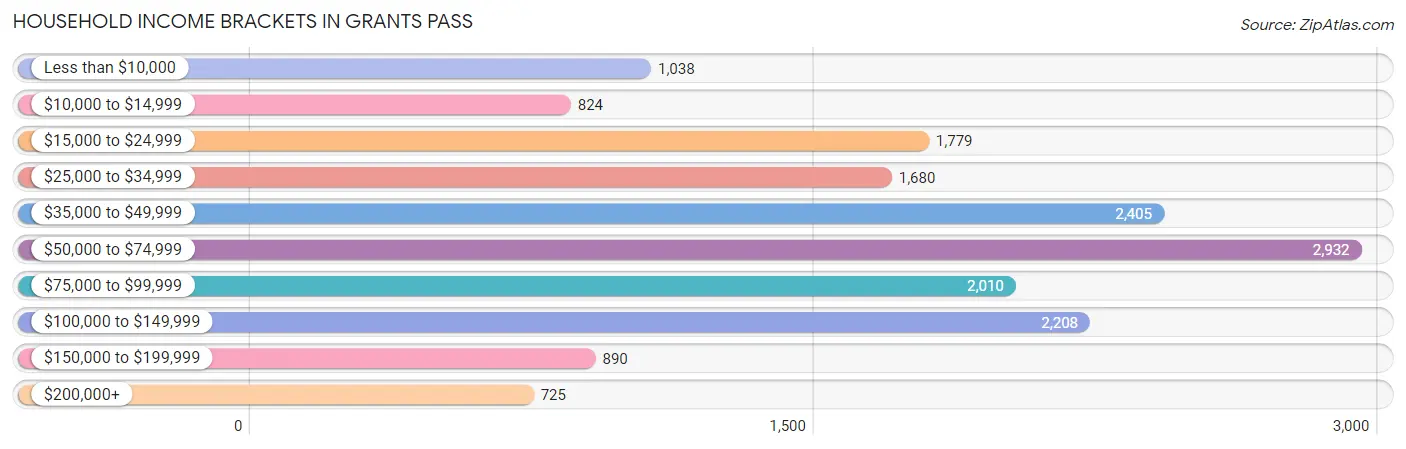
Household Income Brackets in Grants Pass
With 2,932 households falling in the category, the $50,000 to $74,999 income range is the most frequent in Grants Pass, accounting for 17.8% of all households. In contrast, only 725 households (4.4%) fall into the $200,000+ income bracket, making it the least populous group.
| Income Bracket | # Households | % Households |
| Less than $10,000 | 1,038 | 6.3% |
| $10,000 to $14,999 | 824 | 5.0% |
| $15,000 to $24,999 | 1,779 | 10.8% |
| $25,000 to $34,999 | 1,680 | 10.2% |
| $35,000 to $49,999 | 2,405 | 14.6% |
| $50,000 to $74,999 | 2,932 | 17.8% |
| $75,000 to $99,999 | 2,010 | 12.2% |
| $100,000 to $149,999 | 2,208 | 13.4% |
| $150,000 to $199,999 | 890 | 5.4% |
| $200,000+ | 725 | 4.4% |
Household Income by Householder Age in Grants Pass
The median household income in Grants Pass is $53,941, with the highest median household income of $62,034 found in the 25 to 44 years age bracket for the primary householder. A total of 4,961 households (30.1%) fall into this category. Meanwhile, the 65+ years age bracket for the primary householder has the lowest median household income of $45,722, with 5,363 households (32.6%) in this group.
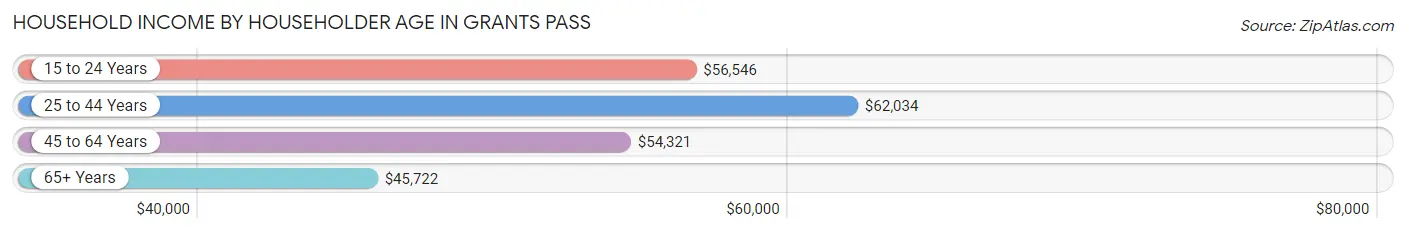
| Income Bracket | # Households | Median Income |
| 15 to 24 Years | 907 (5.5%) | $56,546 |
| 25 to 44 Years | 4,961 (30.1%) | $62,034 |
| 45 to 64 Years | 5,243 (31.8%) | $54,321 |
| 65+ Years | 5,363 (32.6%) | $45,722 |
| Total | 16,474 (100.0%) | $53,941 |
Poverty in Grants Pass
Income Below Poverty by Sex and Age in Grants Pass
With 14.4% poverty level for males and 16.9% for females among the residents of Grants Pass, under 5 year old males and 16 and 17 year old females are the most vulnerable to poverty, with 261 males (31.6%) and 151 females (29.8%) in their respective age groups living below the poverty level.
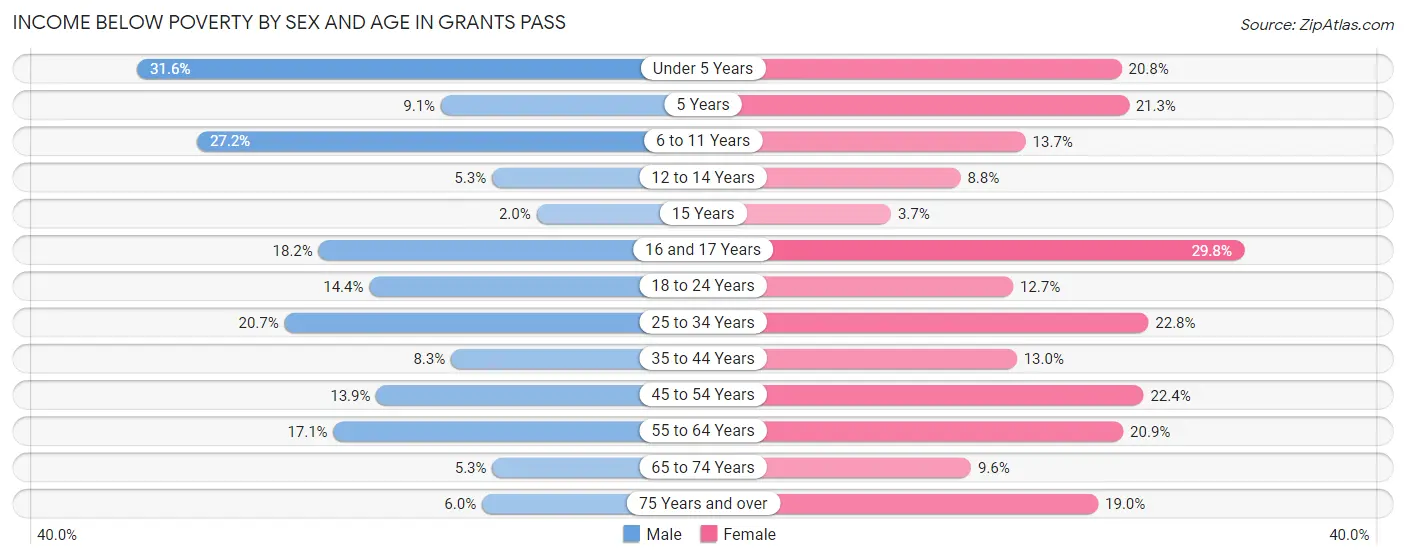
| Age Bracket | Male | Female |
| Under 5 Years | 261 (31.6%) | 205 (20.8%) |
| 5 Years | 13 (9.1%) | 36 (21.3%) |
| 6 to 11 Years | 365 (27.2%) | 197 (13.7%) |
| 12 to 14 Years | 43 (5.3%) | 77 (8.8%) |
| 15 Years | 3 (2.0%) | 8 (3.6%) |
| 16 and 17 Years | 133 (18.2%) | 151 (29.8%) |
| 18 to 24 Years | 245 (14.4%) | 202 (12.7%) |
| 25 to 34 Years | 531 (20.7%) | 565 (22.8%) |
| 35 to 44 Years | 180 (8.3%) | 341 (13.0%) |
| 45 to 54 Years | 260 (13.9%) | 489 (22.4%) |
| 55 to 64 Years | 367 (17.1%) | 498 (20.9%) |
| 65 to 74 Years | 101 (5.3%) | 269 (9.6%) |
| 75 Years and over | 99 (6.0%) | 384 (19.0%) |
| Total | 2,601 (14.4%) | 3,422 (16.9%) |
Income Above Poverty by Sex and Age in Grants Pass
According to the poverty statistics in Grants Pass, males aged 15 years and females aged 15 years are the age groups that are most secure financially, with 98.0% of males and 96.4% of females in these age groups living above the poverty line.
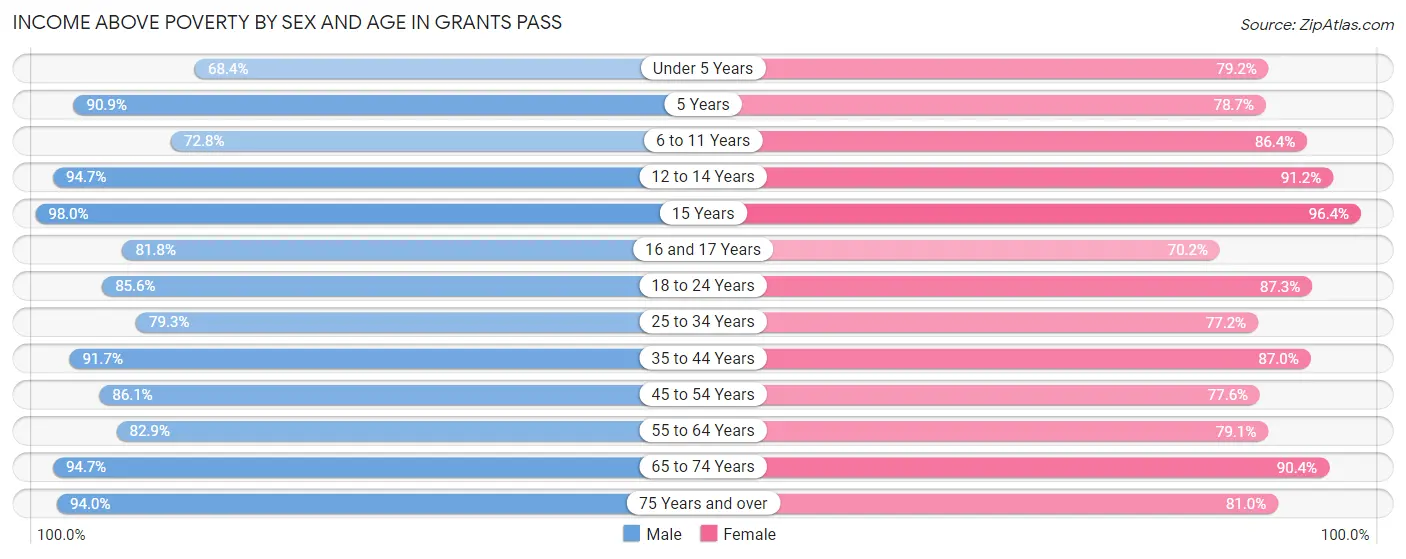
| Age Bracket | Male | Female |
| Under 5 Years | 564 (68.4%) | 782 (79.2%) |
| 5 Years | 130 (90.9%) | 133 (78.7%) |
| 6 to 11 Years | 977 (72.8%) | 1,246 (86.4%) |
| 12 to 14 Years | 768 (94.7%) | 797 (91.2%) |
| 15 Years | 148 (98.0%) | 211 (96.4%) |
| 16 and 17 Years | 599 (81.8%) | 355 (70.2%) |
| 18 to 24 Years | 1,455 (85.6%) | 1,387 (87.3%) |
| 25 to 34 Years | 2,034 (79.3%) | 1,917 (77.2%) |
| 35 to 44 Years | 1,979 (91.7%) | 2,284 (87.0%) |
| 45 to 54 Years | 1,612 (86.1%) | 1,694 (77.6%) |
| 55 to 64 Years | 1,783 (82.9%) | 1,886 (79.1%) |
| 65 to 74 Years | 1,814 (94.7%) | 2,537 (90.4%) |
| 75 Years and over | 1,539 (94.0%) | 1,634 (81.0%) |
| Total | 15,402 (85.6%) | 16,863 (83.1%) |
Income Below Poverty Among Married-Couple Families in Grants Pass
The poverty statistics for married-couple families in Grants Pass show that 4.2% or 289 of the total 6,810 families live below the poverty line. Families with 3 or 4 children have the highest poverty rate of 8.1%, comprising of 64 families. On the other hand, families with 5 or more children have the lowest poverty rate of 0.0%, which includes 0 families.
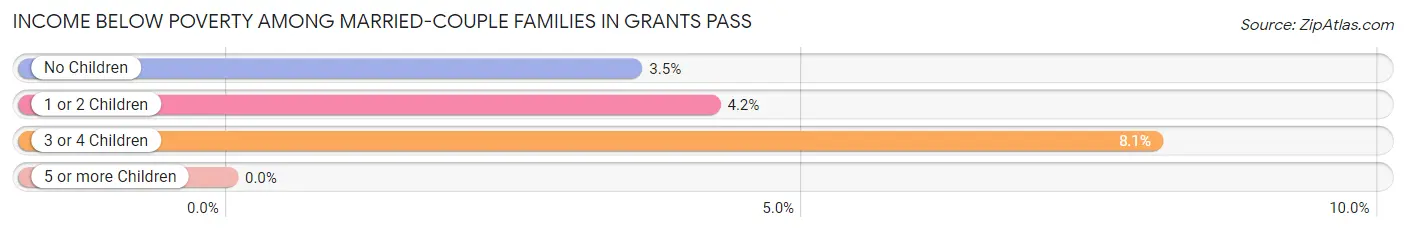
| Children | Above Poverty | Below Poverty |
| No Children | 3,835 (96.5%) | 140 (3.5%) |
| 1 or 2 Children | 1,941 (95.8%) | 85 (4.2%) |
| 3 or 4 Children | 731 (91.9%) | 64 (8.1%) |
| 5 or more Children | 14 (100.0%) | 0 (0.0%) |
| Total | 6,521 (95.8%) | 289 (4.2%) |
Income Below Poverty Among Single-Parent Households in Grants Pass
According to the poverty data in Grants Pass, 17.3% or 160 single-father households and 31.2% or 838 single-mother households are living below the poverty line. Among single-father households, those with 1 or 2 children have the highest poverty rate, with 160 households (25.1%) experiencing poverty. Likewise, among single-mother households, those with 3 or 4 children have the highest poverty rate, with 133 households (45.4%) falling below the poverty line.
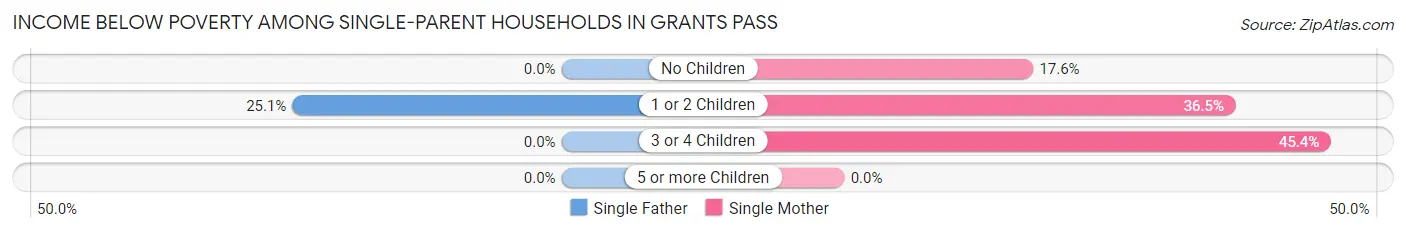
| Children | Single Father | Single Mother |
| No Children | 0 (0.0%) | 157 (17.6%) |
| 1 or 2 Children | 160 (25.1%) | 548 (36.5%) |
| 3 or 4 Children | 0 (0.0%) | 133 (45.4%) |
| 5 or more Children | 0 (0.0%) | 0 (0.0%) |
| Total | 160 (17.3%) | 838 (31.2%) |
Income Below Poverty Among Married-Couple vs Single-Parent Households in Grants Pass
The poverty data for Grants Pass shows that 289 of the married-couple family households (4.2%) and 998 of the single-parent households (27.7%) are living below the poverty level. Within the married-couple family households, those with 3 or 4 children have the highest poverty rate, with 64 households (8.1%) falling below the poverty line. Among the single-parent households, those with 3 or 4 children have the highest poverty rate, with 133 household (41.3%) living below poverty.
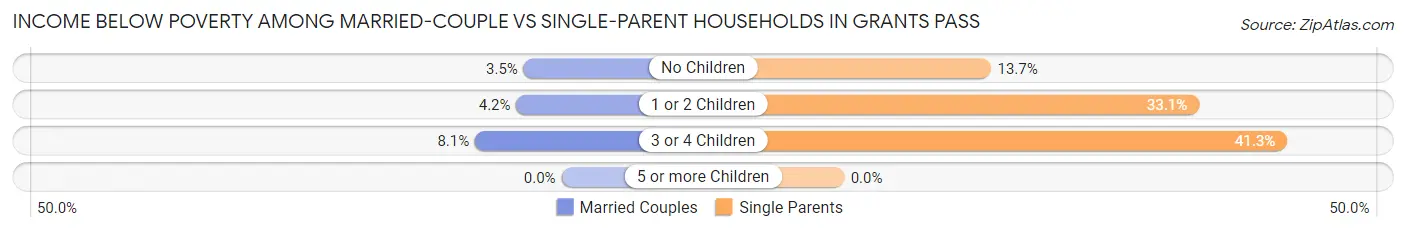
| Children | Married-Couple Families | Single-Parent Households |
| No Children | 140 (3.5%) | 157 (13.7%) |
| 1 or 2 Children | 85 (4.2%) | 708 (33.1%) |
| 3 or 4 Children | 64 (8.1%) | 133 (41.3%) |
| 5 or more Children | 0 (0.0%) | 0 (0.0%) |
| Total | 289 (4.2%) | 998 (27.7%) |
Race in Grants Pass
The most populous races in Grants Pass are White / Caucasian (33,826 | 86.4%), Hispanic or Latino (4,010 | 10.2%), and Two or more Races (3,713 | 9.5%).
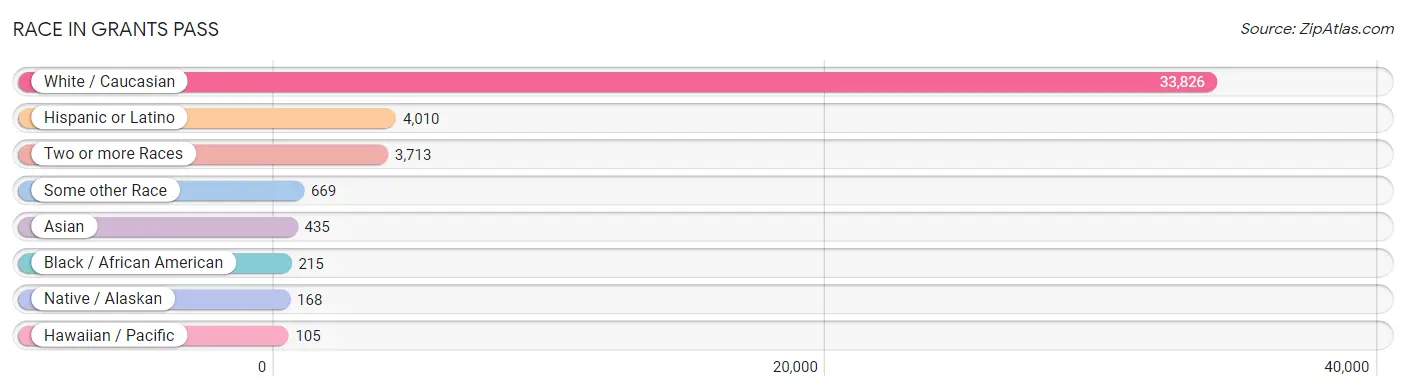
| Race | # Population | % Population |
| Asian | 435 | 1.1% |
| Black / African American | 215 | 0.5% |
| Hawaiian / Pacific | 105 | 0.3% |
| Hispanic or Latino | 4,010 | 10.2% |
| Native / Alaskan | 168 | 0.4% |
| White / Caucasian | 33,826 | 86.4% |
| Two or more Races | 3,713 | 9.5% |
| Some other Race | 669 | 1.7% |
| Total | 39,131 | 100.0% |
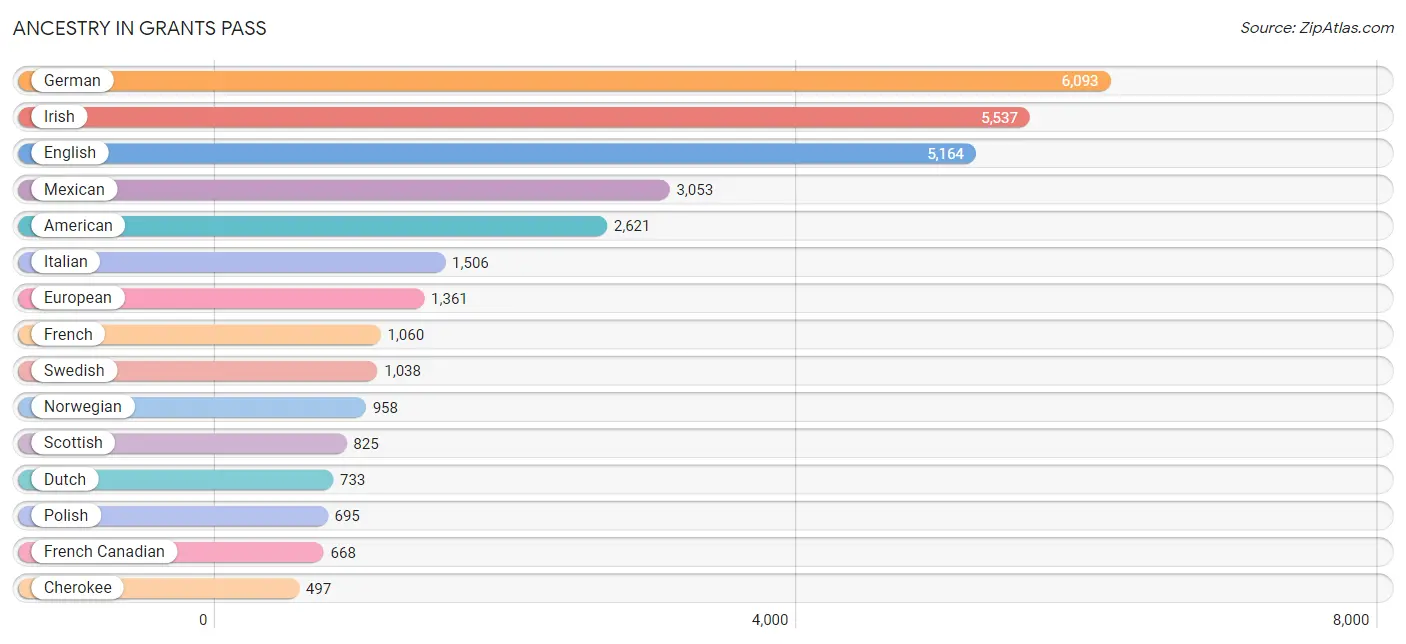
Ancestry in Grants Pass
The most populous ancestries reported in Grants Pass are German (6,093 | 15.6%), Irish (5,537 | 14.1%), English (5,164 | 13.2%), Mexican (3,053 | 7.8%), and American (2,621 | 6.7%), together accounting for 57.4% of all Grants Pass residents.
| Ancestry | # Population | % Population |
| African | 54 | 0.1% |
| American | 2,621 | 6.7% |
| Apache | 262 | 0.7% |
| Arab | 73 | 0.2% |
| Armenian | 15 | 0.0% |
| Austrian | 106 | 0.3% |
| Belgian | 48 | 0.1% |
| Bhutanese | 81 | 0.2% |
| Blackfeet | 99 | 0.3% |
| British | 274 | 0.7% |
| Burmese | 17 | 0.0% |
| Canadian | 19 | 0.1% |
| Central American | 349 | 0.9% |
| Cherokee | 497 | 1.3% |
| Choctaw | 123 | 0.3% |
| Costa Rican | 77 | 0.2% |
| Croatian | 22 | 0.1% |
| Cuban | 16 | 0.0% |
| Czech | 73 | 0.2% |
| Czechoslovakian | 12 | 0.0% |
| Danish | 218 | 0.6% |
| Dutch | 733 | 1.9% |
| Eastern European | 133 | 0.3% |
| English | 5,164 | 13.2% |
| Estonian | 11 | 0.0% |
| European | 1,361 | 3.5% |
| Finnish | 60 | 0.2% |
| French | 1,060 | 2.7% |
| French Canadian | 668 | 1.7% |
| German | 6,093 | 15.6% |
| Greek | 133 | 0.3% |
| Guatemalan | 22 | 0.1% |
| Hungarian | 119 | 0.3% |
| Icelander | 16 | 0.0% |
| Indian (Asian) | 151 | 0.4% |
| Inupiat | 65 | 0.2% |
| Irish | 5,537 | 14.1% |
| Iroquois | 45 | 0.1% |
| Italian | 1,506 | 3.8% |
| Korean | 298 | 0.8% |
| Laotian | 87 | 0.2% |
| Lebanese | 18 | 0.1% |
| Lithuanian | 142 | 0.4% |
| Menominee | 22 | 0.1% |
| Mexican | 3,053 | 7.8% |
| Mexican American Indian | 28 | 0.1% |
| Native Hawaiian | 257 | 0.7% |
| Navajo | 31 | 0.1% |
| Nicaraguan | 72 | 0.2% |
| Northern European | 40 | 0.1% |
| Norwegian | 958 | 2.5% |
| Pakistani | 42 | 0.1% |
| Palestinian | 9 | 0.0% |
| Pennsylvania German | 10 | 0.0% |
| Peruvian | 13 | 0.0% |
| Polish | 695 | 1.8% |
| Portuguese | 448 | 1.1% |
| Potawatomi | 18 | 0.1% |
| Puerto Rican | 41 | 0.1% |
| Romanian | 29 | 0.1% |
| Russian | 161 | 0.4% |
| Salvadoran | 178 | 0.4% |
| Scandinavian | 176 | 0.4% |
| Scotch-Irish | 307 | 0.8% |
| Scottish | 825 | 2.1% |
| Sioux | 30 | 0.1% |
| Slovene | 8 | 0.0% |
| South African | 10 | 0.0% |
| South American | 13 | 0.0% |
| South American Indian | 76 | 0.2% |
| Spaniard | 228 | 0.6% |
| Spanish | 264 | 0.7% |
| Sri Lankan | 189 | 0.5% |
| Subsaharan African | 76 | 0.2% |
| Swedish | 1,038 | 2.6% |
| Swiss | 188 | 0.5% |
| Syrian | 46 | 0.1% |
| Thai | 102 | 0.3% |
| Ukrainian | 14 | 0.0% |
| Welsh | 294 | 0.7% |
| Yugoslavian | 27 | 0.1% | View All 81 Rows |
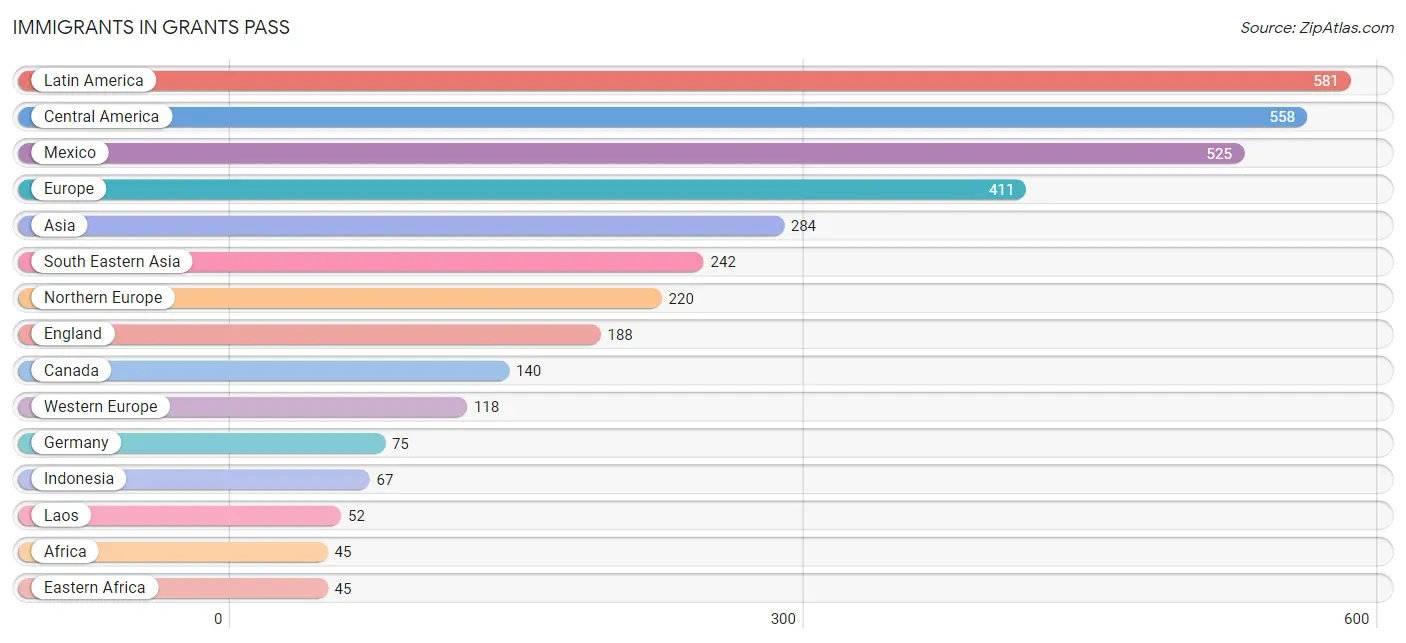
Immigrants in Grants Pass
The most numerous immigrant groups reported in Grants Pass came from Latin America (581 | 1.5%), Central America (558 | 1.4%), Mexico (525 | 1.3%), Europe (411 | 1.1%), and Asia (284 | 0.7%), together accounting for 6.0% of all Grants Pass residents.
| Immigration Origin | # Population | % Population |
| Africa | 45 | 0.1% |
| Asia | 284 | 0.7% |
| Australia | 20 | 0.1% |
| Belize | 7 | 0.0% |
| Canada | 140 | 0.4% |
| Central America | 558 | 1.4% |
| China | 13 | 0.0% |
| Eastern Africa | 45 | 0.1% |
| Eastern Asia | 27 | 0.1% |
| Eastern Europe | 44 | 0.1% |
| El Salvador | 24 | 0.1% |
| England | 188 | 0.5% |
| Europe | 411 | 1.1% |
| Germany | 75 | 0.2% |
| Greece | 15 | 0.0% |
| Guatemala | 2 | 0.0% |
| Hungary | 33 | 0.1% |
| India | 15 | 0.0% |
| Indonesia | 67 | 0.2% |
| Ireland | 15 | 0.0% |
| Japan | 8 | 0.0% |
| Kenya | 31 | 0.1% |
| Korea | 6 | 0.0% |
| Laos | 52 | 0.1% |
| Latin America | 581 | 1.5% |
| Mexico | 525 | 1.3% |
| Netherlands | 31 | 0.1% |
| Northern Europe | 220 | 0.6% |
| Oceania | 20 | 0.1% |
| Peru | 13 | 0.0% |
| Philippines | 37 | 0.1% |
| Portugal | 14 | 0.0% |
| South America | 23 | 0.1% |
| South Central Asia | 15 | 0.0% |
| South Eastern Asia | 242 | 0.6% |
| Southern Europe | 29 | 0.1% |
| Switzerland | 12 | 0.0% |
| Thailand | 42 | 0.1% |
| Venezuela | 10 | 0.0% |
| Vietnam | 44 | 0.1% |
| Western Europe | 118 | 0.3% | View All 41 Rows |
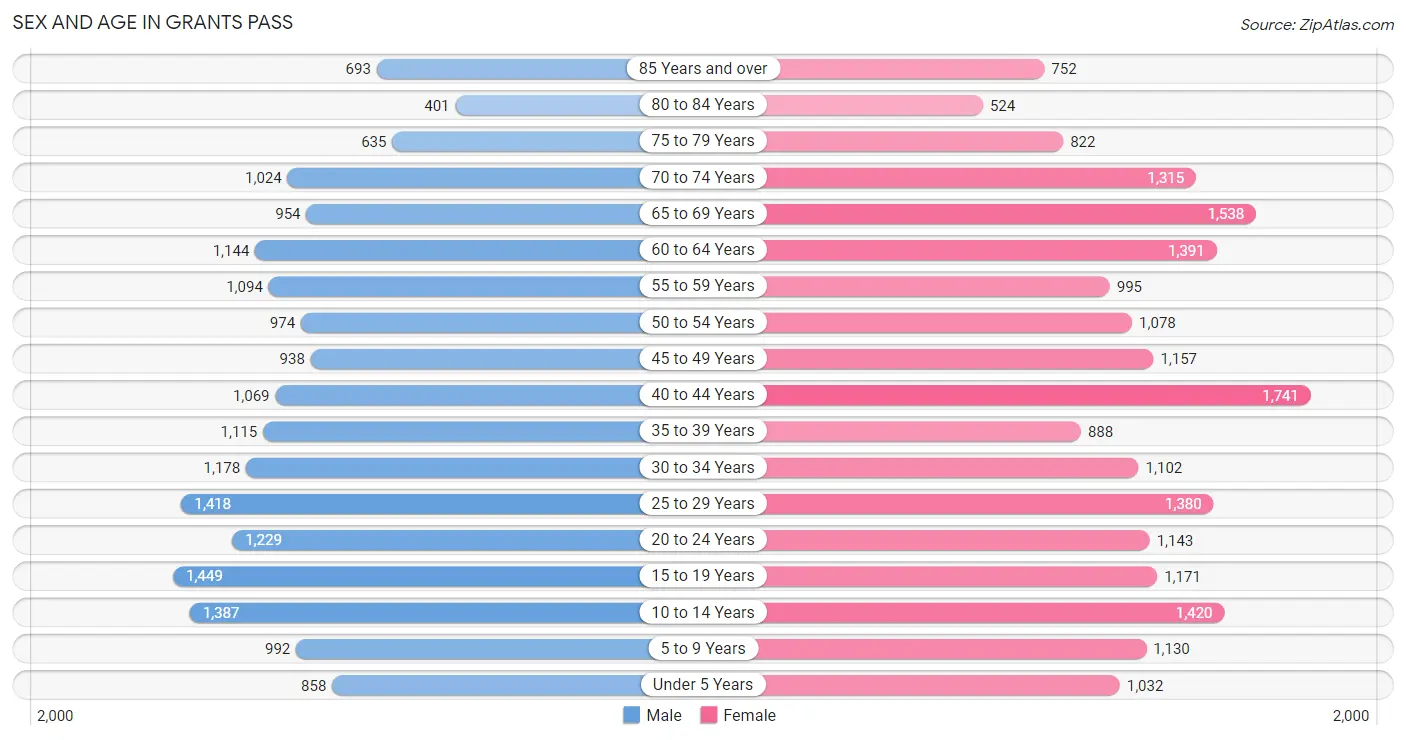
Sex and Age in Grants Pass
Sex and Age in Grants Pass
The most populous age groups in Grants Pass are 15 to 19 Years (1,449 | 7.8%) for men and 40 to 44 Years (1,741 | 8.5%) for women.
| Age Bracket | Male | Female |
| Under 5 Years | 858 (4.6%) | 1,032 (5.0%) |
| 5 to 9 Years | 992 (5.3%) | 1,130 (5.5%) |
| 10 to 14 Years | 1,387 (7.5%) | 1,420 (6.9%) |
| 15 to 19 Years | 1,449 (7.8%) | 1,171 (5.7%) |
| 20 to 24 Years | 1,229 (6.6%) | 1,143 (5.6%) |
| 25 to 29 Years | 1,418 (7.6%) | 1,380 (6.7%) |
| 30 to 34 Years | 1,178 (6.4%) | 1,102 (5.3%) |
| 35 to 39 Years | 1,115 (6.0%) | 888 (4.3%) |
| 40 to 44 Years | 1,069 (5.8%) | 1,741 (8.5%) |
| 45 to 49 Years | 938 (5.1%) | 1,157 (5.6%) |
| 50 to 54 Years | 974 (5.2%) | 1,078 (5.2%) |
| 55 to 59 Years | 1,094 (5.9%) | 995 (4.8%) |
| 60 to 64 Years | 1,144 (6.2%) | 1,391 (6.8%) |
| 65 to 69 Years | 954 (5.1%) | 1,538 (7.5%) |
| 70 to 74 Years | 1,024 (5.5%) | 1,315 (6.4%) |
| 75 to 79 Years | 635 (3.4%) | 822 (4.0%) |
| 80 to 84 Years | 401 (2.2%) | 524 (2.5%) |
| 85 Years and over | 693 (3.7%) | 752 (3.6%) |
| Total | 18,552 (100.0%) | 20,579 (100.0%) |
Families and Households in Grants Pass
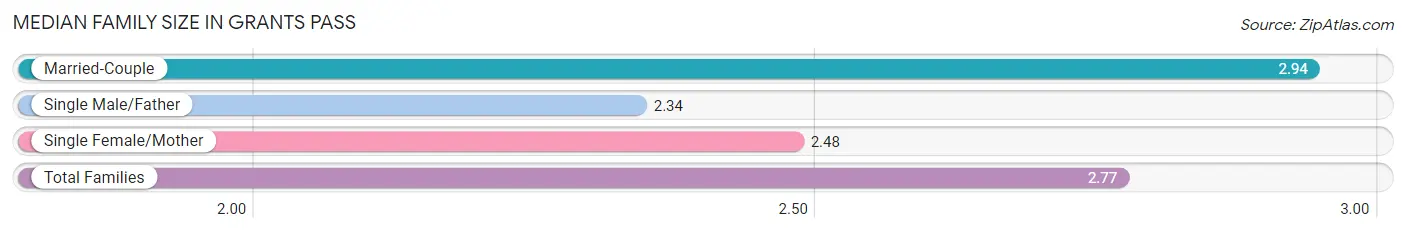
Median Family Size in Grants Pass
The median family size in Grants Pass is 2.77 persons per family, with married-couple families (6,810 | 65.4%) accounting for the largest median family size of 2.94 persons per family. On the other hand, single male/father families (922 | 8.8%) represent the smallest median family size with 2.34 persons per family.
| Family Type | # Families | Family Size |
| Married-Couple | 6,810 (65.4%) | 2.94 |
| Single Male/Father | 922 (8.8%) | 2.34 |
| Single Female/Mother | 2,687 (25.8%) | 2.48 |
| Total Families | 10,419 (100.0%) | 2.77 |
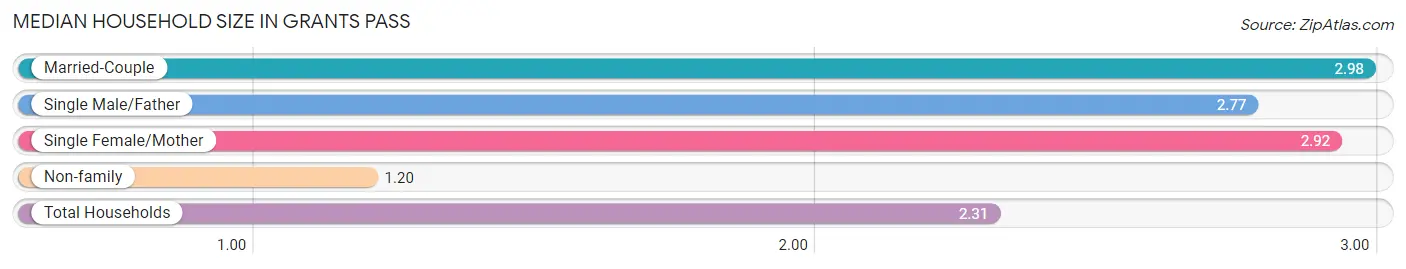
Median Household Size in Grants Pass
The median household size in Grants Pass is 2.31 persons per household, with married-couple households (6,810 | 41.3%) accounting for the largest median household size of 2.98 persons per household. non-family households (6,055 | 36.7%) represent the smallest median household size with 1.20 persons per household.
| Household Type | # Households | Household Size |
| Married-Couple | 6,810 (41.3%) | 2.98 |
| Single Male/Father | 922 (5.6%) | 2.77 |
| Single Female/Mother | 2,687 (16.3%) | 2.92 |
| Non-family | 6,055 (36.7%) | 1.20 |
| Total Households | 16,474 (100.0%) | 2.31 |
Household Size by Marriage Status in Grants Pass
Out of a total of 16,474 households in Grants Pass, 10,419 (63.2%) are family households, while 6,055 (36.7%) are nonfamily households. The most numerous type of family households are 2-person households, comprising 4,674, and the most common type of nonfamily households are 1-person households, comprising 4,921.
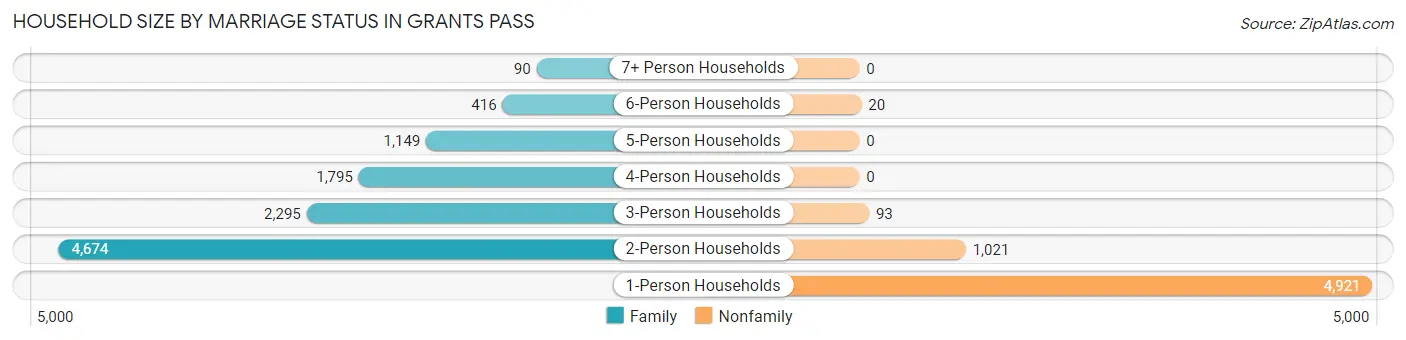
| Household Size | Family Households | Nonfamily Households |
| 1-Person Households | - | 4,921 (29.9%) |
| 2-Person Households | 4,674 (28.4%) | 1,021 (6.2%) |
| 3-Person Households | 2,295 (13.9%) | 93 (0.6%) |
| 4-Person Households | 1,795 (10.9%) | 0 (0.0%) |
| 5-Person Households | 1,149 (7.0%) | 0 (0.0%) |
| 6-Person Households | 416 (2.5%) | 20 (0.1%) |
| 7+ Person Households | 90 (0.5%) | 0 (0.0%) |
| Total | 10,419 (63.2%) | 6,055 (36.7%) |
Female Fertility in Grants Pass
Fertility by Age in Grants Pass
Average fertility rate in Grants Pass is 42.0 births per 1,000 women. Women in the age bracket of 20 to 34 years have the highest fertility rate with 92.0 births per 1,000 women. Women in the age bracket of 20 to 34 years acount for 91.2% of all women with births.
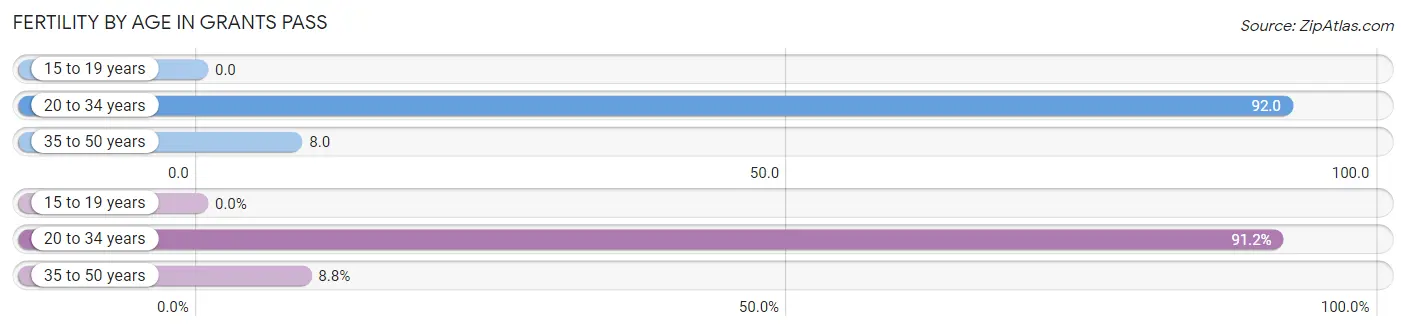
| Age Bracket | Women with Births | Births / 1,000 Women |
| 15 to 19 years | 0 (0.0%) | 0.0 |
| 20 to 34 years | 333 (91.2%) | 92.0 |
| 35 to 50 years | 32 (8.8%) | 8.0 |
| Total | 365 (100.0%) | 42.0 |
Fertility by Age by Marriage Status in Grants Pass
72.3% of women with births (365) in Grants Pass are married. The highest percentage of unmarried women with births falls into 20 to 34 years age bracket with 30.3% of them unmarried at the time of birth, while the lowest percentage of unmarried women with births belong to 35 to 50 years age bracket with 0.0% of them unmarried.
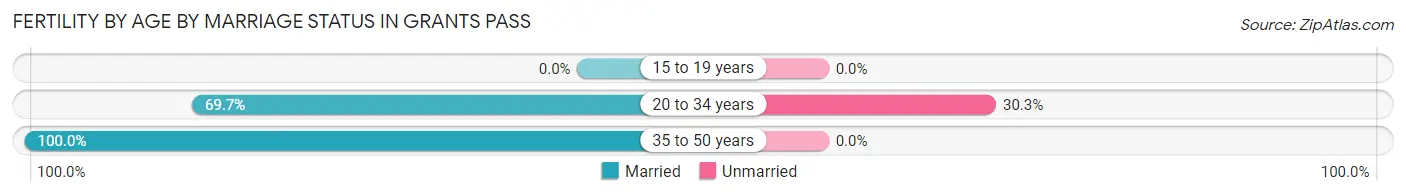
| Age Bracket | Married | Unmarried |
| 15 to 19 years | 0 (0.0%) | 0 (0.0%) |
| 20 to 34 years | 232 (69.7%) | 101 (30.3%) |
| 35 to 50 years | 32 (100.0%) | 0 (0.0%) |
| Total | 264 (72.3%) | 101 (27.7%) |
Fertility by Education in Grants Pass
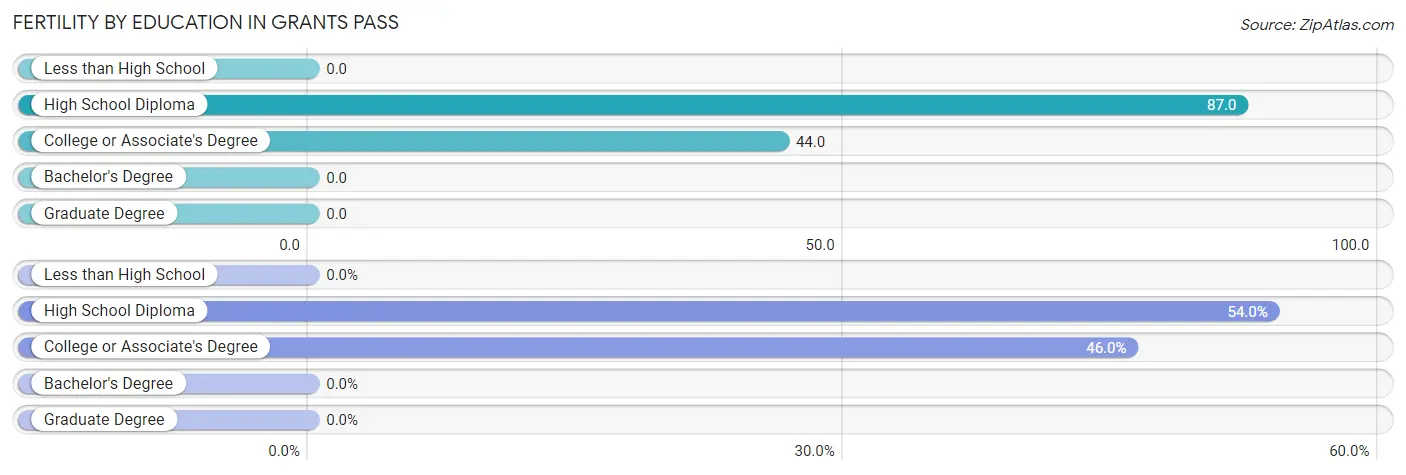
| Educational Attainment | Women with Births | Births / 1,000 Women |
| Less than High School | 0 (0.0%) | 0.0 |
| High School Diploma | 197 (54.0%) | 87.0 |
| College or Associate's Degree | 168 (46.0%) | 44.0 |
| Bachelor's Degree | 0 (0.0%) | 0.0 |
| Graduate Degree | 0 (0.0%) | 0.0 |
| Total | 365 (100.0%) | 42.0 |
Fertility by Education by Marriage Status in Grants Pass
27.7% of women with births in Grants Pass are unmarried. Women with the educational attainment of college or associate's degree are most likely to be married with 95.2% of them married at childbirth, while women with the educational attainment of high school diploma are least likely to be married with 47.2% of them unmarried at childbirth.
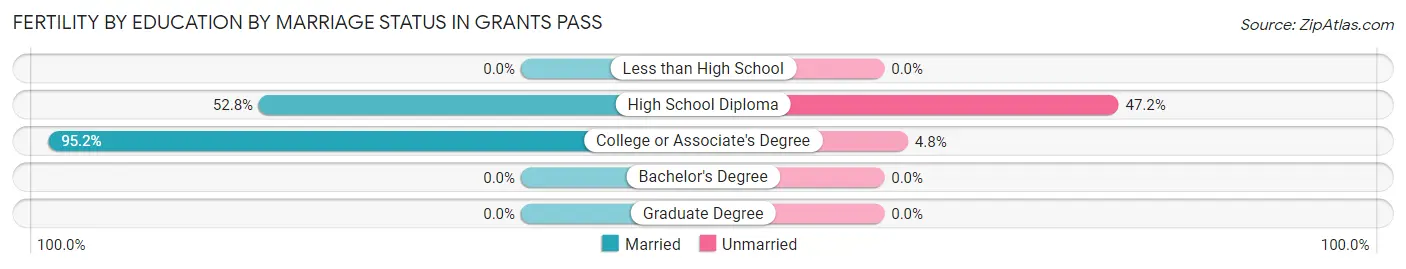
| Educational Attainment | Married | Unmarried |
| Less than High School | 0 (0.0%) | 0 (0.0%) |
| High School Diploma | 104 (52.8%) | 93 (47.2%) |
| College or Associate's Degree | 160 (95.2%) | 8 (4.8%) |
| Bachelor's Degree | 0 (0.0%) | 0 (0.0%) |
| Graduate Degree | 0 (0.0%) | 0 (0.0%) |
| Total | 264 (72.3%) | 101 (27.7%) |
Employment Characteristics in Grants Pass
Employment by Class of Employer in Grants Pass
Among the 16,440 employed individuals in Grants Pass, private company employees (10,678 | 64.9%), not-for-profit organizations (1,709 | 10.4%), and local government employees (1,382 | 8.4%) make up the most common classes of employment.
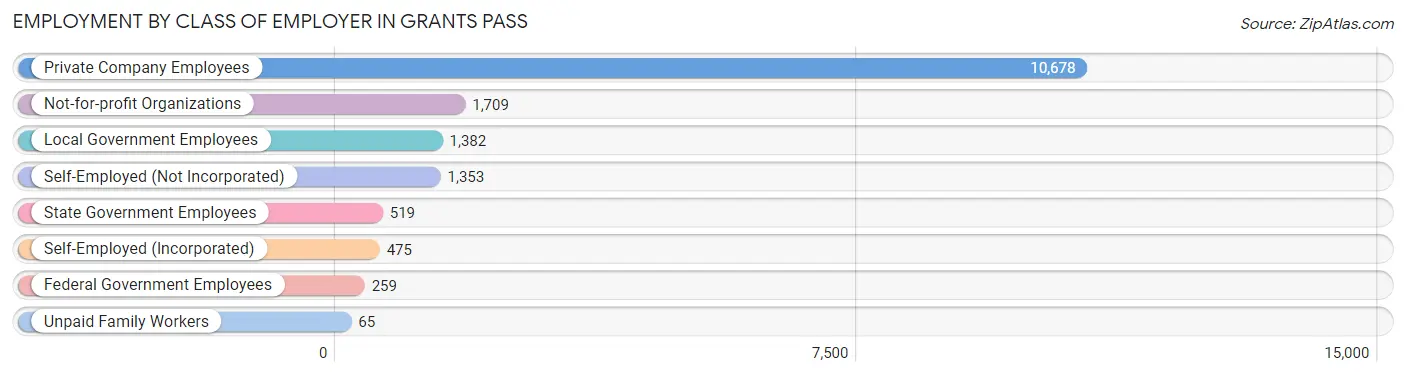
| Employer Class | # Employees | % Employees |
| Private Company Employees | 10,678 | 64.9% |
| Self-Employed (Incorporated) | 475 | 2.9% |
| Self-Employed (Not Incorporated) | 1,353 | 8.2% |
| Not-for-profit Organizations | 1,709 | 10.4% |
| Local Government Employees | 1,382 | 8.4% |
| State Government Employees | 519 | 3.2% |
| Federal Government Employees | 259 | 1.6% |
| Unpaid Family Workers | 65 | 0.4% |
| Total | 16,440 | 100.0% |
Employment Status by Age in Grants Pass
According to the labor force statistics for Grants Pass, out of the total population over 16 years of age (31,919), 55.8% or 17,811 individuals are in the labor force, with 6.3% or 1,122 of them unemployed. The age group with the highest labor force participation rate is 20 to 24 years, with 89.4% or 2,121 individuals in the labor force. Within the labor force, the 75 years and over age range has the highest percentage of unemployed individuals, with 39.9% or 92 of them being unemployed.
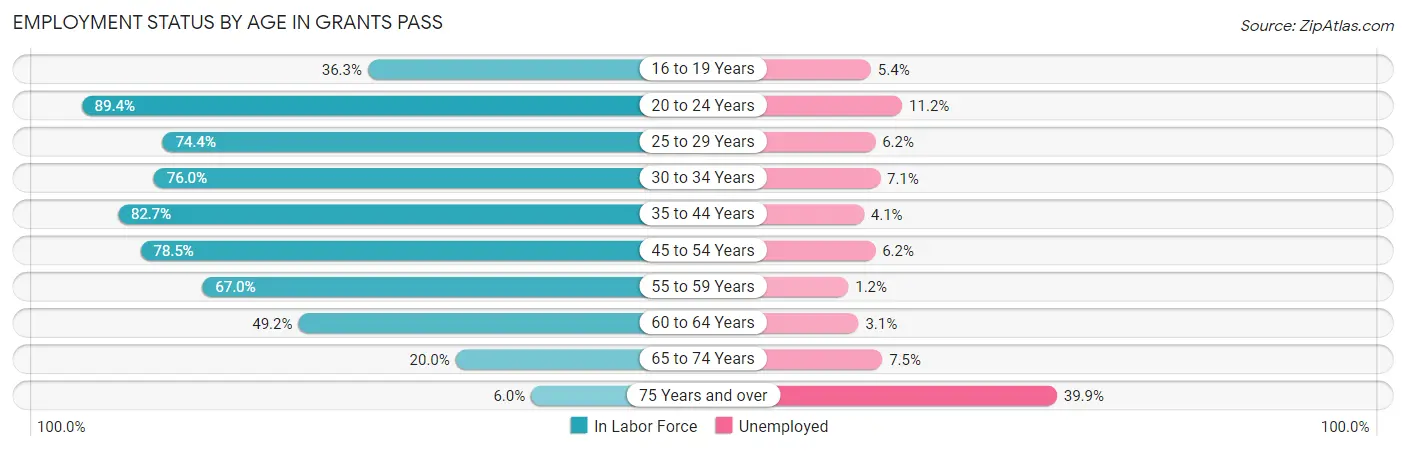
| Age Bracket | In Labor Force | Unemployed |
| 16 to 19 Years | 808 (36.3%) | 44 (5.4%) |
| 20 to 24 Years | 2,121 (89.4%) | 238 (11.2%) |
| 25 to 29 Years | 2,082 (74.4%) | 129 (6.2%) |
| 30 to 34 Years | 1,733 (76.0%) | 123 (7.1%) |
| 35 to 44 Years | 3,980 (82.7%) | 163 (4.1%) |
| 45 to 54 Years | 3,255 (78.5%) | 202 (6.2%) |
| 55 to 59 Years | 1,400 (67.0%) | 17 (1.2%) |
| 60 to 64 Years | 1,247 (49.2%) | 39 (3.1%) |
| 65 to 74 Years | 966 (20.0%) | 72 (7.5%) |
| 75 Years and over | 230 (6.0%) | 92 (39.9%) |
| Total | 17,811 (55.8%) | 1,122 (6.3%) |
Employment Status by Educational Attainment in Grants Pass
According to labor force statistics for Grants Pass, 73.4% of individuals (13,698) out of the total population between 25 and 64 years of age (18,662) are in the labor force, with 4.9% or 671 of them being unemployed. The group with the highest labor force participation rate are those with the educational attainment of bachelor's degree or higher, with 81.1% or 2,506 individuals in the labor force. Within the labor force, individuals with less than high school education have the highest percentage of unemployment, with 21.0% or 199 of them being unemployed.
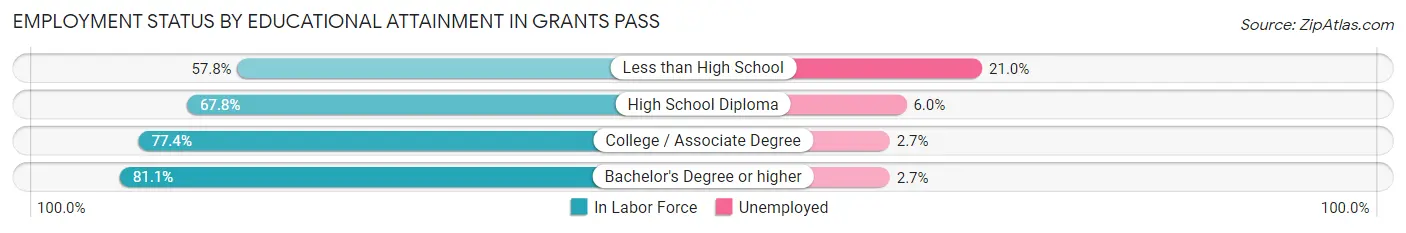
| Educational Attainment | In Labor Force | Unemployed |
| Less than High School | 946 (57.8%) | 344 (21.0%) |
| High School Diploma | 3,833 (67.8%) | 339 (6.0%) |
| College / Associate Degree | 6,410 (77.4%) | 224 (2.7%) |
| Bachelor's Degree or higher | 2,506 (81.1%) | 83 (2.7%) |
| Total | 13,698 (73.4%) | 914 (4.9%) |
Employment Occupations by Sex in Grants Pass
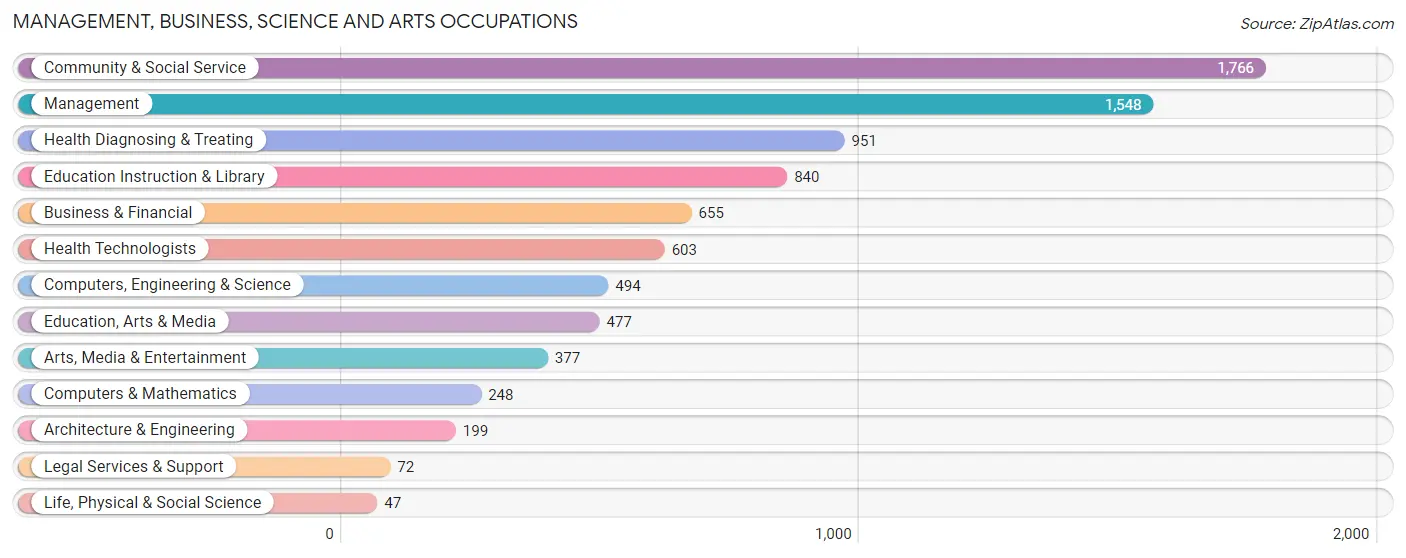
Management, Business, Science and Arts Occupations
The most common Management, Business, Science and Arts occupations in Grants Pass are Community & Social Service (1,766 | 10.6%), Management (1,548 | 9.3%), Health Diagnosing & Treating (951 | 5.7%), Education Instruction & Library (840 | 5.0%), and Business & Financial (655 | 3.9%).
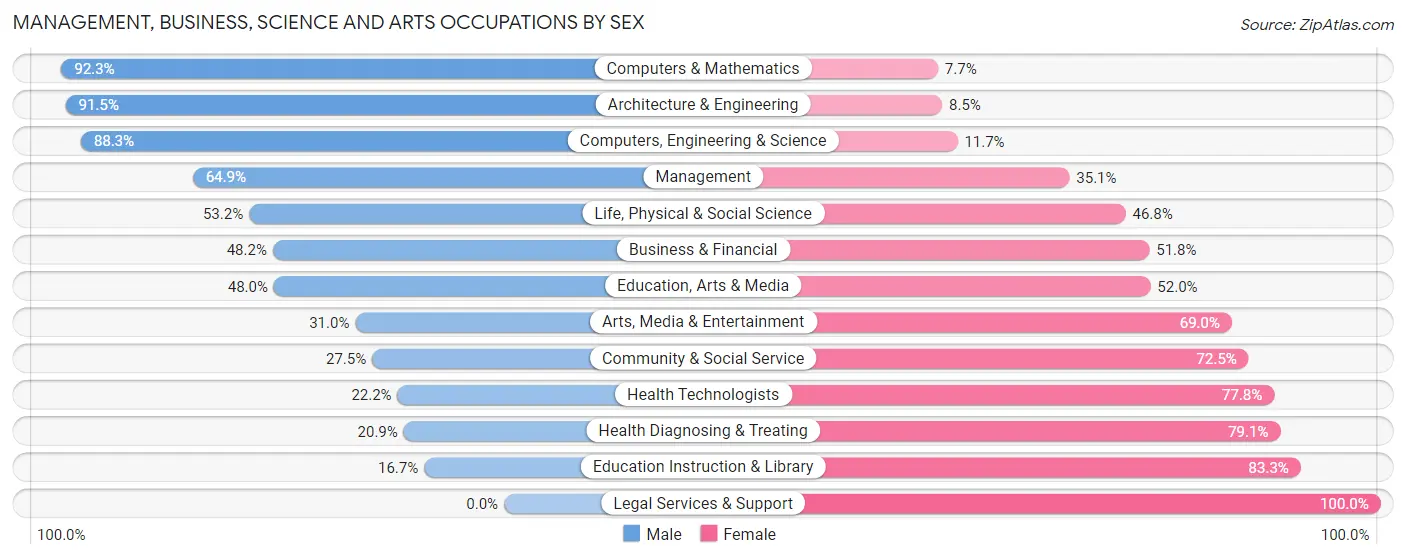
Management, Business, Science and Arts Occupations by Sex
Within the Management, Business, Science and Arts occupations in Grants Pass, the most male-oriented occupations are Computers & Mathematics (92.3%), Architecture & Engineering (91.5%), and Computers, Engineering & Science (88.3%), while the most female-oriented occupations are Legal Services & Support (100.0%), Education Instruction & Library (83.3%), and Health Diagnosing & Treating (79.1%).
| Occupation | Male | Female |
| Management | 1,005 (64.9%) | 543 (35.1%) |
| Business & Financial | 316 (48.2%) | 339 (51.8%) |
| Computers, Engineering & Science | 436 (88.3%) | 58 (11.7%) |
| Computers & Mathematics | 229 (92.3%) | 19 (7.7%) |
| Architecture & Engineering | 182 (91.5%) | 17 (8.5%) |
| Life, Physical & Social Science | 25 (53.2%) | 22 (46.8%) |
| Community & Social Service | 486 (27.5%) | 1,280 (72.5%) |
| Education, Arts & Media | 229 (48.0%) | 248 (52.0%) |
| Legal Services & Support | 0 (0.0%) | 72 (100.0%) |
| Education Instruction & Library | 140 (16.7%) | 700 (83.3%) |
| Arts, Media & Entertainment | 117 (31.0%) | 260 (69.0%) |
| Health Diagnosing & Treating | 199 (20.9%) | 752 (79.1%) |
| Health Technologists | 134 (22.2%) | 469 (77.8%) |
| Total (Category) | 2,442 (45.1%) | 2,972 (54.9%) |
| Total (Overall) | 8,285 (49.6%) | 8,415 (50.4%) |
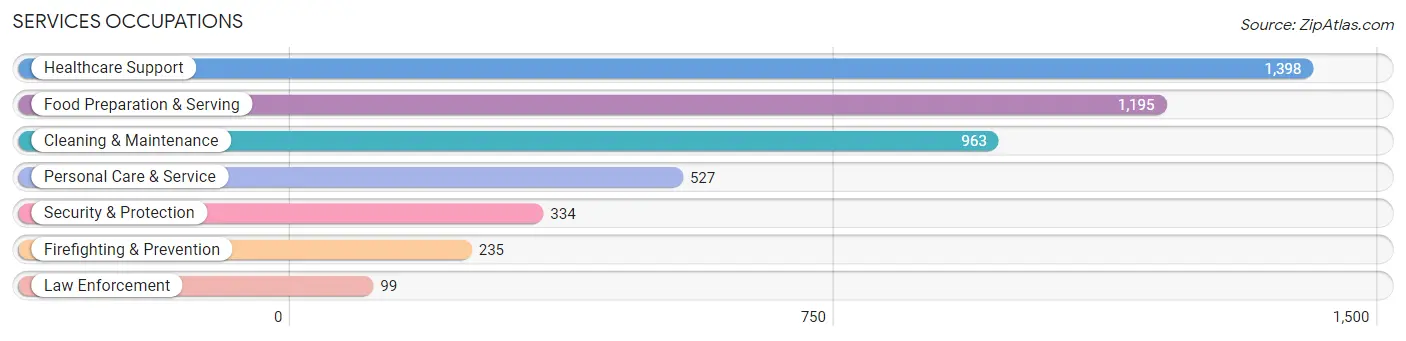
Services Occupations
The most common Services occupations in Grants Pass are Healthcare Support (1,398 | 8.4%), Food Preparation & Serving (1,195 | 7.2%), Cleaning & Maintenance (963 | 5.8%), Personal Care & Service (527 | 3.2%), and Security & Protection (334 | 2.0%).
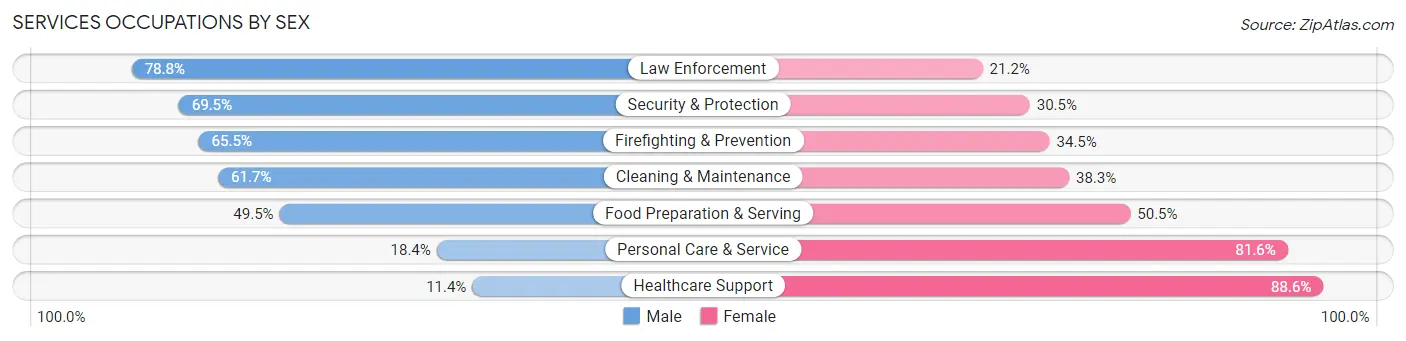
Services Occupations by Sex
Within the Services occupations in Grants Pass, the most male-oriented occupations are Law Enforcement (78.8%), Security & Protection (69.5%), and Firefighting & Prevention (65.5%), while the most female-oriented occupations are Healthcare Support (88.6%), Personal Care & Service (81.6%), and Food Preparation & Serving (50.5%).
| Occupation | Male | Female |
| Healthcare Support | 159 (11.4%) | 1,239 (88.6%) |
| Security & Protection | 232 (69.5%) | 102 (30.5%) |
| Firefighting & Prevention | 154 (65.5%) | 81 (34.5%) |
| Law Enforcement | 78 (78.8%) | 21 (21.2%) |
| Food Preparation & Serving | 592 (49.5%) | 603 (50.5%) |
| Cleaning & Maintenance | 594 (61.7%) | 369 (38.3%) |
| Personal Care & Service | 97 (18.4%) | 430 (81.6%) |
| Total (Category) | 1,674 (37.9%) | 2,743 (62.1%) |
| Total (Overall) | 8,285 (49.6%) | 8,415 (50.4%) |
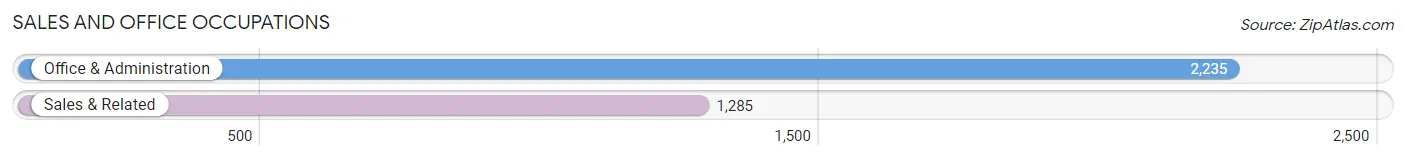
Sales and Office Occupations
The most common Sales and Office occupations in Grants Pass are Office & Administration (2,235 | 13.4%), and Sales & Related (1,285 | 7.7%).
Sales and Office Occupations by Sex
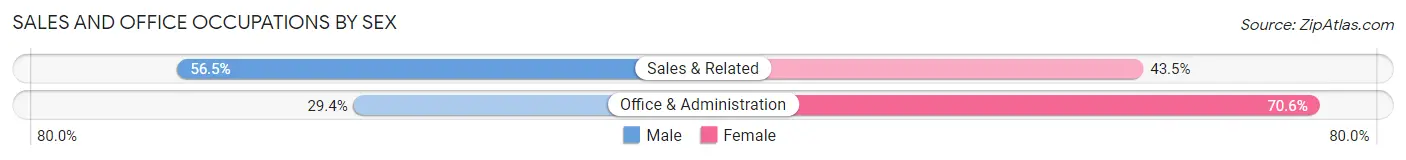
| Occupation | Male | Female |
| Sales & Related | 726 (56.5%) | 559 (43.5%) |
| Office & Administration | 657 (29.4%) | 1,578 (70.6%) |
| Total (Category) | 1,383 (39.3%) | 2,137 (60.7%) |
| Total (Overall) | 8,285 (49.6%) | 8,415 (50.4%) |
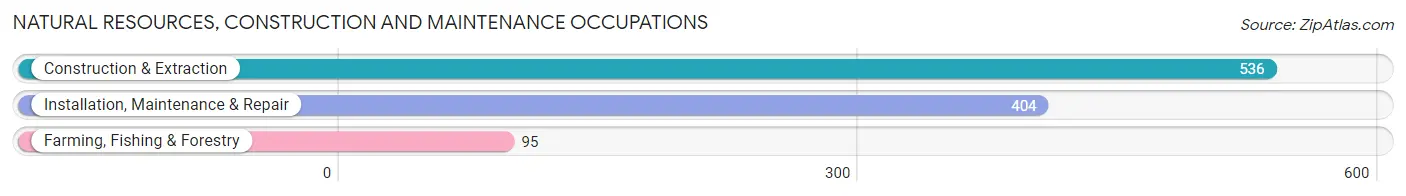
Natural Resources, Construction and Maintenance Occupations
The most common Natural Resources, Construction and Maintenance occupations in Grants Pass are Construction & Extraction (536 | 3.2%), Installation, Maintenance & Repair (404 | 2.4%), and Farming, Fishing & Forestry (95 | 0.6%).
Natural Resources, Construction and Maintenance Occupations by Sex
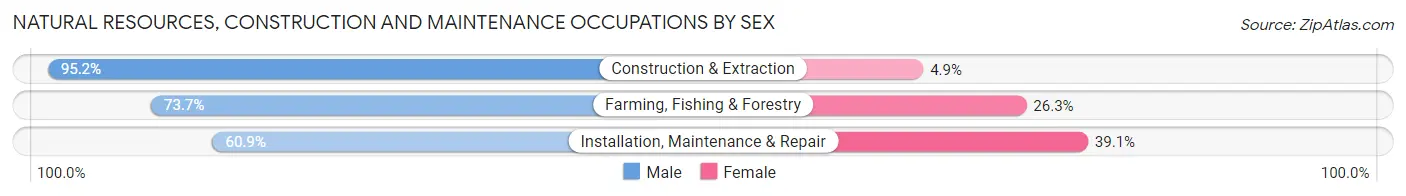
| Occupation | Male | Female |
| Farming, Fishing & Forestry | 70 (73.7%) | 25 (26.3%) |
| Construction & Extraction | 510 (95.2%) | 26 (4.9%) |
| Installation, Maintenance & Repair | 246 (60.9%) | 158 (39.1%) |
| Total (Category) | 826 (79.8%) | 209 (20.2%) |
| Total (Overall) | 8,285 (49.6%) | 8,415 (50.4%) |
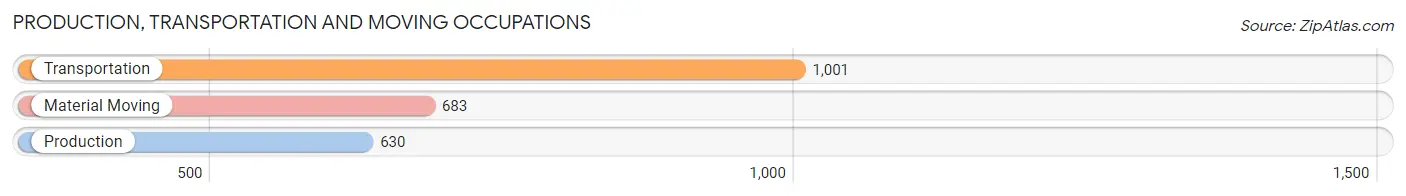
Production, Transportation and Moving Occupations
The most common Production, Transportation and Moving occupations in Grants Pass are Transportation (1,001 | 6.0%), Material Moving (683 | 4.1%), and Production (630 | 3.8%).
Production, Transportation and Moving Occupations by Sex
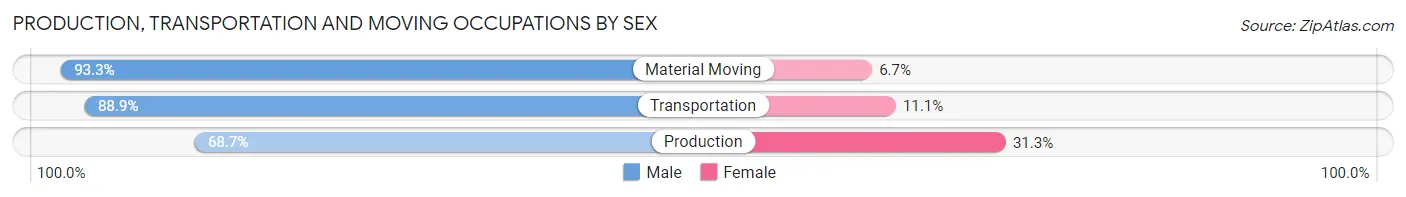
| Occupation | Male | Female |
| Production | 433 (68.7%) | 197 (31.3%) |
| Transportation | 890 (88.9%) | 111 (11.1%) |
| Material Moving | 637 (93.3%) | 46 (6.7%) |
| Total (Category) | 1,960 (84.7%) | 354 (15.3%) |
| Total (Overall) | 8,285 (49.6%) | 8,415 (50.4%) |
Employment Industries by Sex in Grants Pass
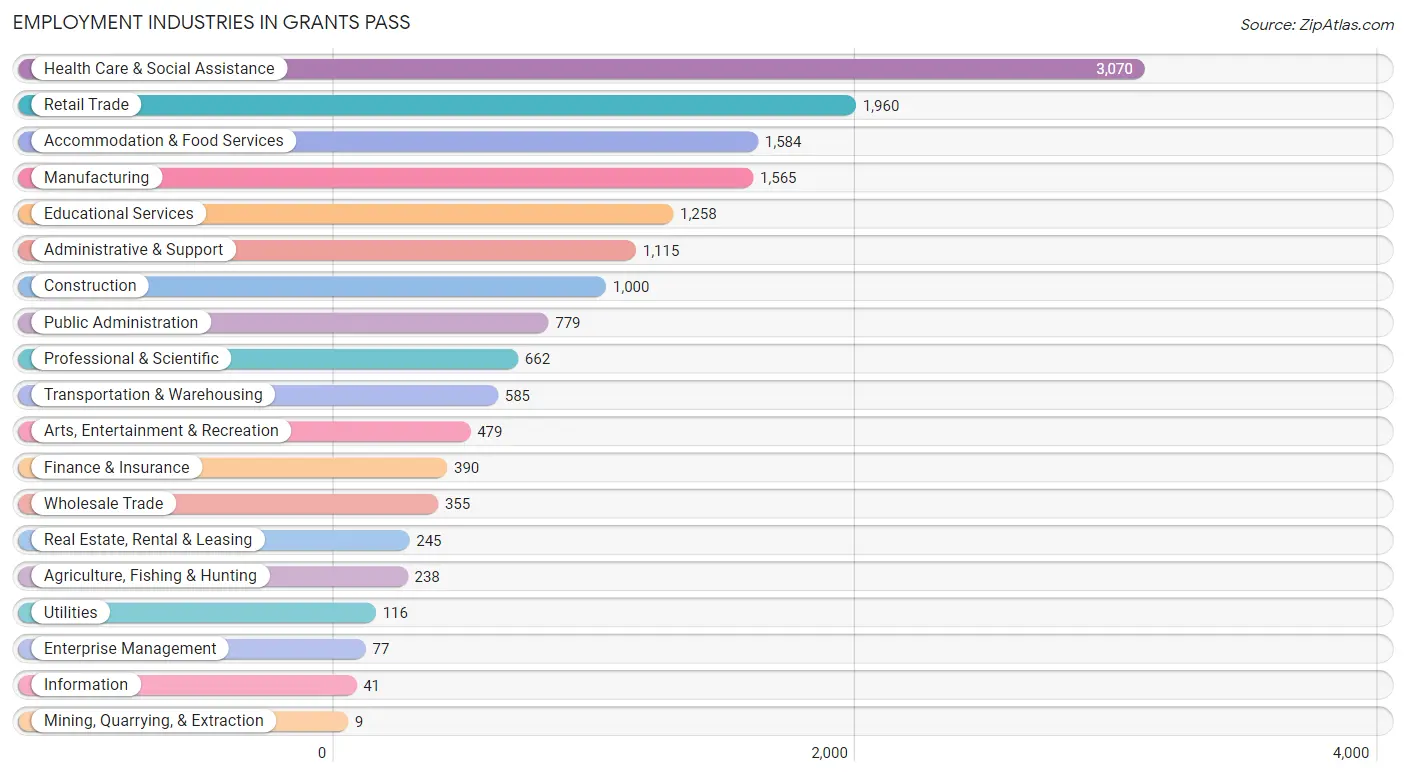
Employment Industries in Grants Pass
The major employment industries in Grants Pass include Health Care & Social Assistance (3,070 | 18.4%), Retail Trade (1,960 | 11.7%), Accommodation & Food Services (1,584 | 9.5%), Manufacturing (1,565 | 9.4%), and Educational Services (1,258 | 7.5%).
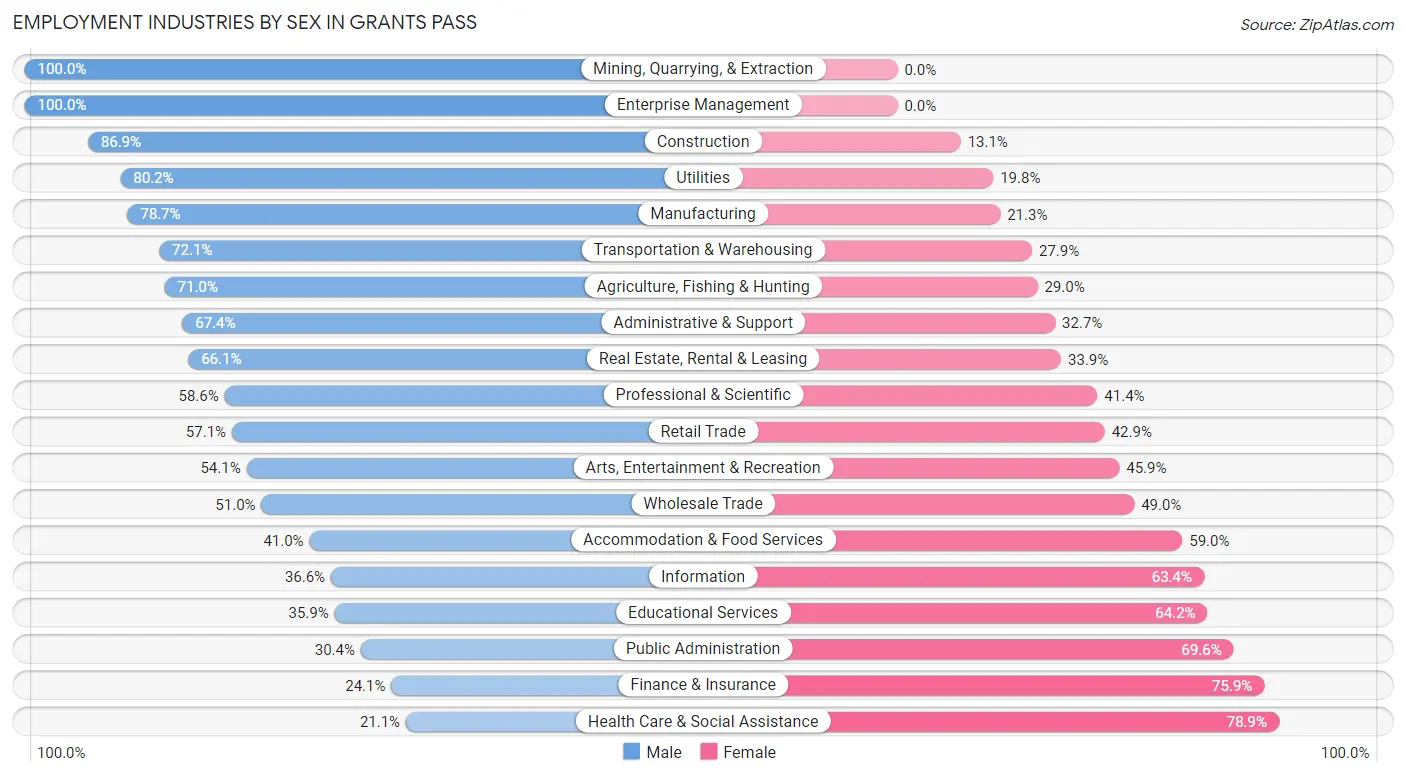
Employment Industries by Sex in Grants Pass
The Grants Pass industries that see more men than women are Mining, Quarrying, & Extraction (100.0%), Enterprise Management (100.0%), and Construction (86.9%), whereas the industries that tend to have a higher number of women are Health Care & Social Assistance (78.9%), Finance & Insurance (75.9%), and Public Administration (69.6%).
| Industry | Male | Female |
| Agriculture, Fishing & Hunting | 169 (71.0%) | 69 (29.0%) |
| Mining, Quarrying, & Extraction | 9 (100.0%) | 0 (0.0%) |
| Construction | 869 (86.9%) | 131 (13.1%) |
| Manufacturing | 1,232 (78.7%) | 333 (21.3%) |
| Wholesale Trade | 181 (51.0%) | 174 (49.0%) |
| Retail Trade | 1,119 (57.1%) | 841 (42.9%) |
| Transportation & Warehousing | 422 (72.1%) | 163 (27.9%) |
| Utilities | 93 (80.2%) | 23 (19.8%) |
| Information | 15 (36.6%) | 26 (63.4%) |
| Finance & Insurance | 94 (24.1%) | 296 (75.9%) |
| Real Estate, Rental & Leasing | 162 (66.1%) | 83 (33.9%) |
| Professional & Scientific | 388 (58.6%) | 274 (41.4%) |
| Enterprise Management | 77 (100.0%) | 0 (0.0%) |
| Administrative & Support | 751 (67.3%) | 364 (32.7%) |
| Educational Services | 451 (35.8%) | 807 (64.1%) |
| Health Care & Social Assistance | 647 (21.1%) | 2,423 (78.9%) |
| Arts, Entertainment & Recreation | 259 (54.1%) | 220 (45.9%) |
| Accommodation & Food Services | 650 (41.0%) | 934 (59.0%) |
| Public Administration | 237 (30.4%) | 542 (69.6%) |
| Total | 8,285 (49.6%) | 8,415 (50.4%) |
Education in Grants Pass
School Enrollment in Grants Pass
The most common levels of schooling among the 8,686 students in Grants Pass are high school (2,449 | 28.2%), elementary school (2,159 | 24.9%), and middle school (1,916 | 22.1%).
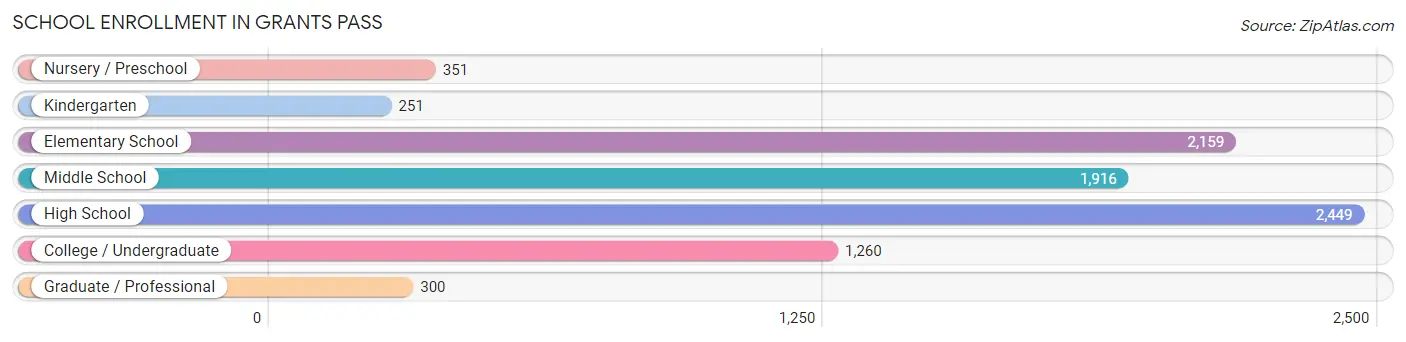
| School Level | # Students | % Students |
| Nursery / Preschool | 351 | 4.0% |
| Kindergarten | 251 | 2.9% |
| Elementary School | 2,159 | 24.9% |
| Middle School | 1,916 | 22.1% |
| High School | 2,449 | 28.2% |
| College / Undergraduate | 1,260 | 14.5% |
| Graduate / Professional | 300 | 3.5% |
| Total | 8,686 | 100.0% |
School Enrollment by Age by Funding Source in Grants Pass
Out of a total of 8,686 students who are enrolled in schools in Grants Pass, 1,563 (18.0%) attend a private institution, while the remaining 7,123 (82.0%) are enrolled in public schools. The age group of 3 to 4 year olds has the highest likelihood of being enrolled in private schools, with 122 (46.7% in the age bracket) enrolled. Conversely, the age group of 15 to 17 year olds has the lowest likelihood of being enrolled in a private school, with 1,537 (95.4% in the age bracket) attending a public institution.
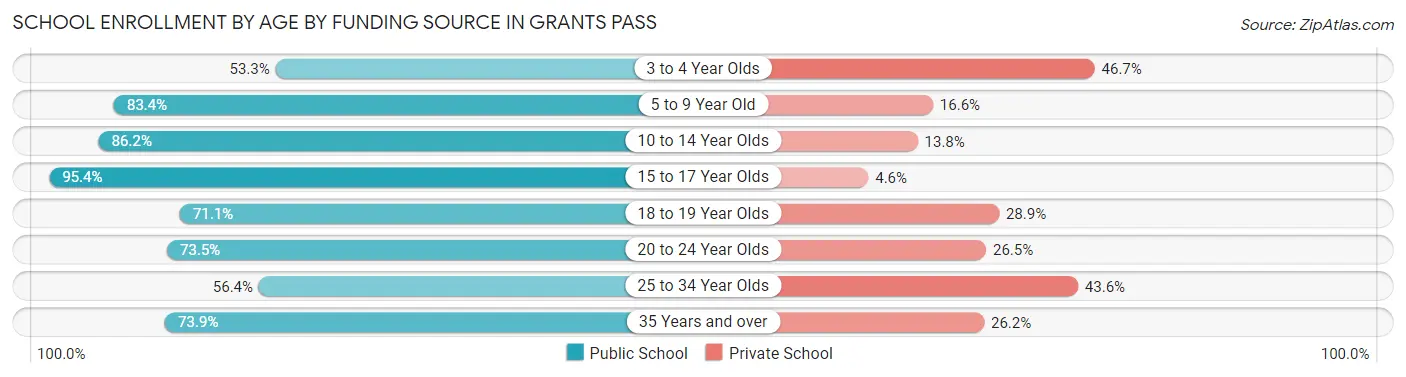
| Age Bracket | Public School | Private School |
| 3 to 4 Year Olds | 139 (53.3%) | 122 (46.7%) |
| 5 to 9 Year Old | 1,636 (83.4%) | 326 (16.6%) |
| 10 to 14 Year Olds | 2,398 (86.2%) | 383 (13.8%) |
| 15 to 17 Year Olds | 1,537 (95.4%) | 74 (4.6%) |
| 18 to 19 Year Olds | 479 (71.1%) | 195 (28.9%) |
| 20 to 24 Year Olds | 266 (73.5%) | 96 (26.5%) |
| 25 to 34 Year Olds | 301 (56.4%) | 233 (43.6%) |
| 35 Years and over | 370 (73.9%) | 131 (26.2%) |
| Total | 7,123 (82.0%) | 1,563 (18.0%) |
Educational Attainment by Field of Study in Grants Pass
Education (709 | 12.6%), business (650 | 11.6%), psychology (609 | 10.8%), visual & performing arts (475 | 8.5%), and social sciences (445 | 7.9%) are the most common fields of study among 5,617 individuals in Grants Pass who have obtained a bachelor's degree or higher.
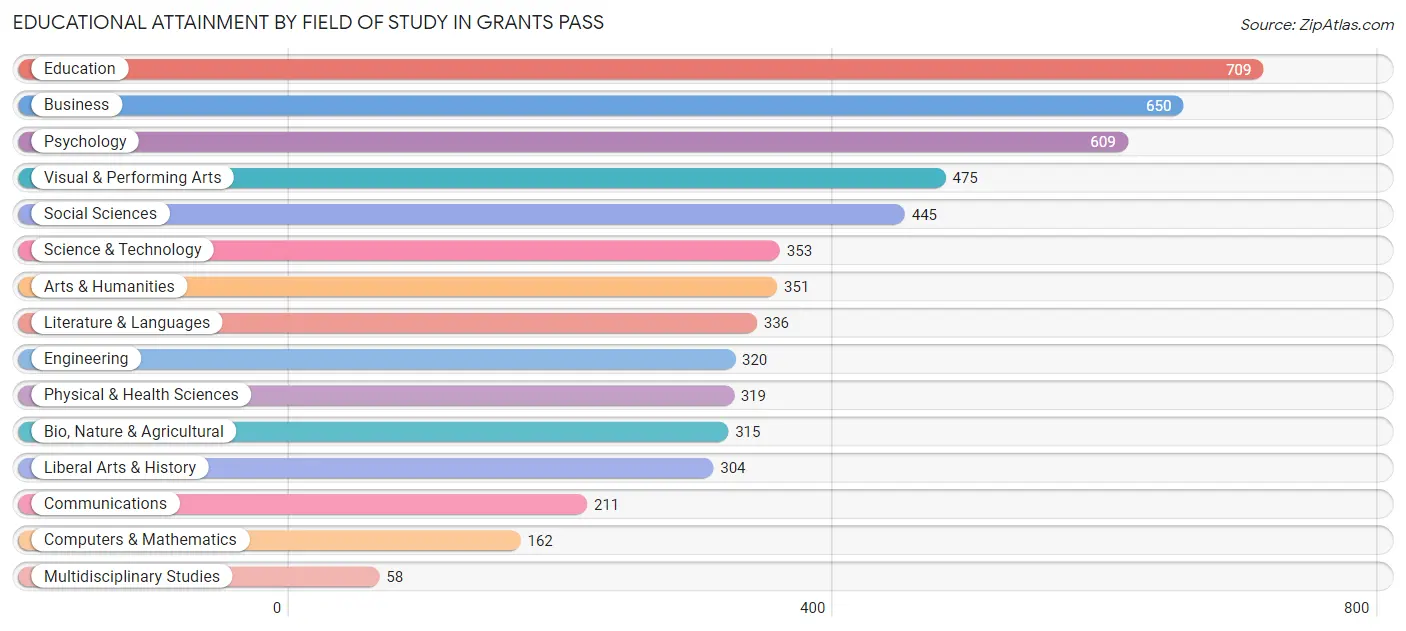
| Field of Study | # Graduates | % Graduates |
| Computers & Mathematics | 162 | 2.9% |
| Bio, Nature & Agricultural | 315 | 5.6% |
| Physical & Health Sciences | 319 | 5.7% |
| Psychology | 609 | 10.8% |
| Social Sciences | 445 | 7.9% |
| Engineering | 320 | 5.7% |
| Multidisciplinary Studies | 58 | 1.0% |
| Science & Technology | 353 | 6.3% |
| Business | 650 | 11.6% |
| Education | 709 | 12.6% |
| Literature & Languages | 336 | 6.0% |
| Liberal Arts & History | 304 | 5.4% |
| Visual & Performing Arts | 475 | 8.5% |
| Communications | 211 | 3.8% |
| Arts & Humanities | 351 | 6.2% |
| Total | 5,617 | 100.0% |
Transportation & Commute in Grants Pass
Vehicle Availability by Sex in Grants Pass
The most prevalent vehicle ownership categories in Grants Pass are males with 2 vehicles (3,422, accounting for 41.9%) and females with 2 vehicles (2,904, making up 41.8%).
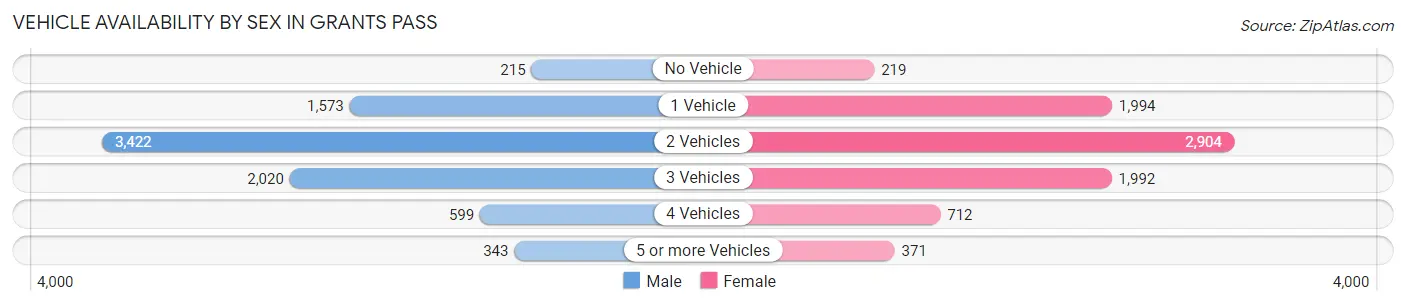
| Vehicles Available | Male | Female |
| No Vehicle | 215 (2.6%) | 219 (2.7%) |
| 1 Vehicle | 1,573 (19.3%) | 1,994 (24.3%) |
| 2 Vehicles | 3,422 (41.9%) | 2,904 (35.4%) |
| 3 Vehicles | 2,020 (24.7%) | 1,992 (24.3%) |
| 4 Vehicles | 599 (7.3%) | 712 (8.7%) |
| 5 or more Vehicles | 343 (4.2%) | 371 (4.5%) |
| Total | 8,172 (100.0%) | 8,192 (100.0%) |
Commute Time in Grants Pass
The most frequently occuring commute durations in Grants Pass are 5 to 9 minutes (4,154 commuters, 27.7%), 10 to 14 minutes (3,860 commuters, 25.7%), and 15 to 19 minutes (2,007 commuters, 13.4%).
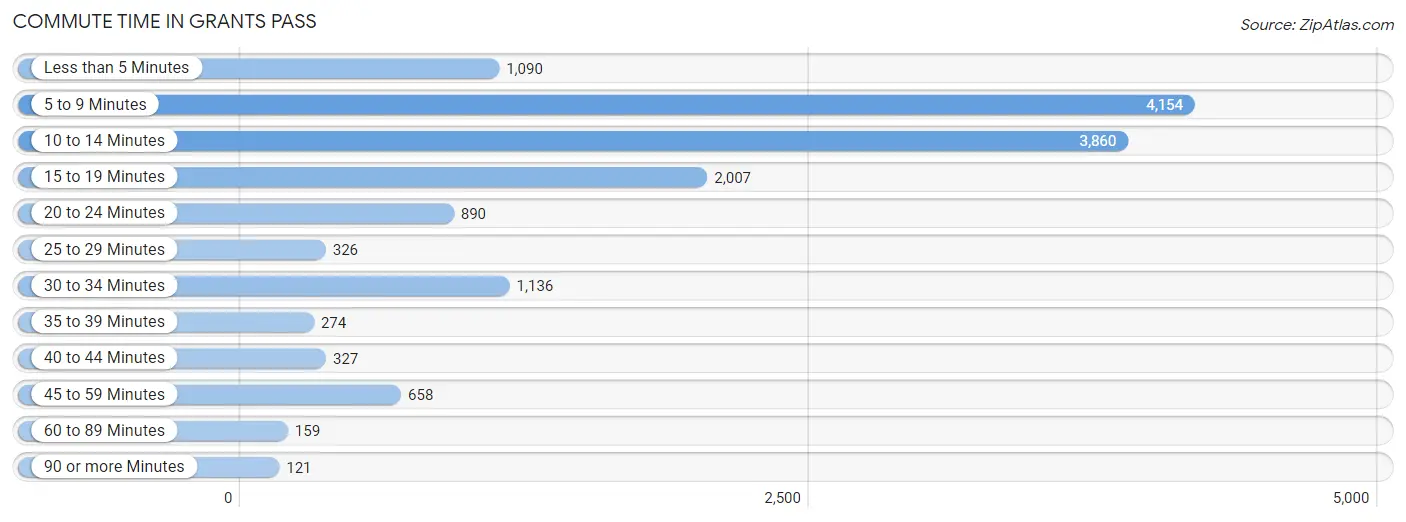
| Commute Time | # Commuters | % Commuters |
| Less than 5 Minutes | 1,090 | 7.3% |
| 5 to 9 Minutes | 4,154 | 27.7% |
| 10 to 14 Minutes | 3,860 | 25.7% |
| 15 to 19 Minutes | 2,007 | 13.4% |
| 20 to 24 Minutes | 890 | 5.9% |
| 25 to 29 Minutes | 326 | 2.2% |
| 30 to 34 Minutes | 1,136 | 7.6% |
| 35 to 39 Minutes | 274 | 1.8% |
| 40 to 44 Minutes | 327 | 2.2% |
| 45 to 59 Minutes | 658 | 4.4% |
| 60 to 89 Minutes | 159 | 1.1% |
| 90 or more Minutes | 121 | 0.8% |
Commute Time by Sex in Grants Pass
The most common commute times in Grants Pass are 10 to 14 minutes (2,104 commuters, 27.8%) for males and 5 to 9 minutes (2,554 commuters, 34.4%) for females.
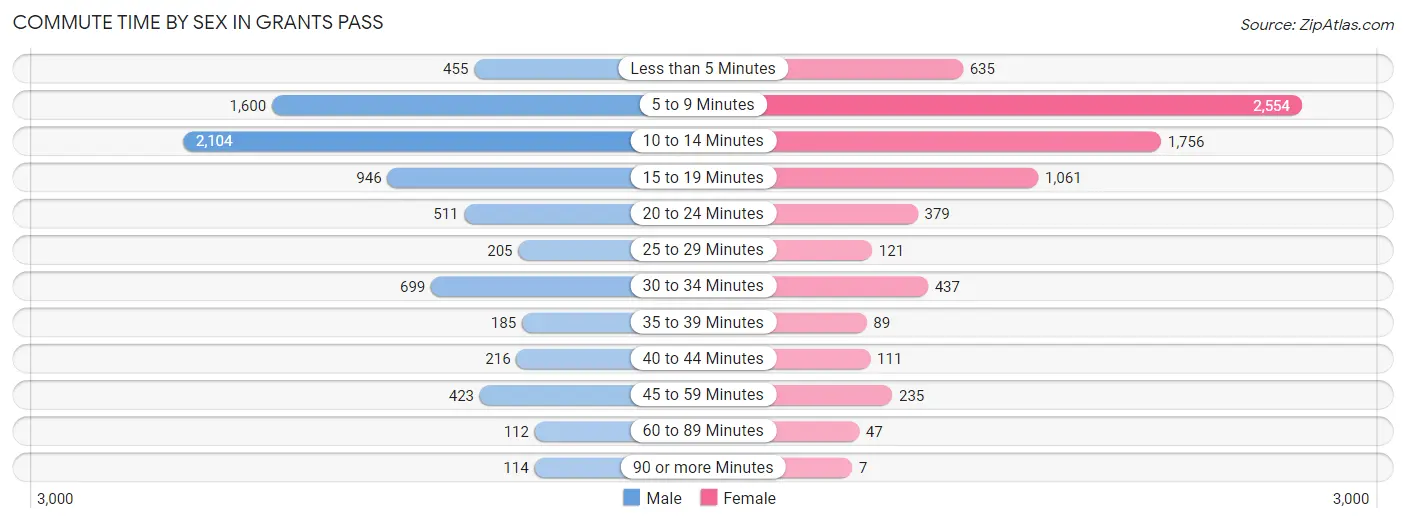
| Commute Time | Male | Female |
| Less than 5 Minutes | 455 (6.0%) | 635 (8.5%) |
| 5 to 9 Minutes | 1,600 (21.1%) | 2,554 (34.4%) |
| 10 to 14 Minutes | 2,104 (27.8%) | 1,756 (23.6%) |
| 15 to 19 Minutes | 946 (12.5%) | 1,061 (14.3%) |
| 20 to 24 Minutes | 511 (6.8%) | 379 (5.1%) |
| 25 to 29 Minutes | 205 (2.7%) | 121 (1.6%) |
| 30 to 34 Minutes | 699 (9.2%) | 437 (5.9%) |
| 35 to 39 Minutes | 185 (2.4%) | 89 (1.2%) |
| 40 to 44 Minutes | 216 (2.9%) | 111 (1.5%) |
| 45 to 59 Minutes | 423 (5.6%) | 235 (3.2%) |
| 60 to 89 Minutes | 112 (1.5%) | 47 (0.6%) |
| 90 or more Minutes | 114 (1.5%) | 7 (0.1%) |
Time of Departure to Work by Sex in Grants Pass
The most frequent times of departure to work in Grants Pass are 6:30 AM to 6:59 AM (1,085, 14.3%) for males and 7:30 AM to 7:59 AM (1,352, 18.2%) for females.
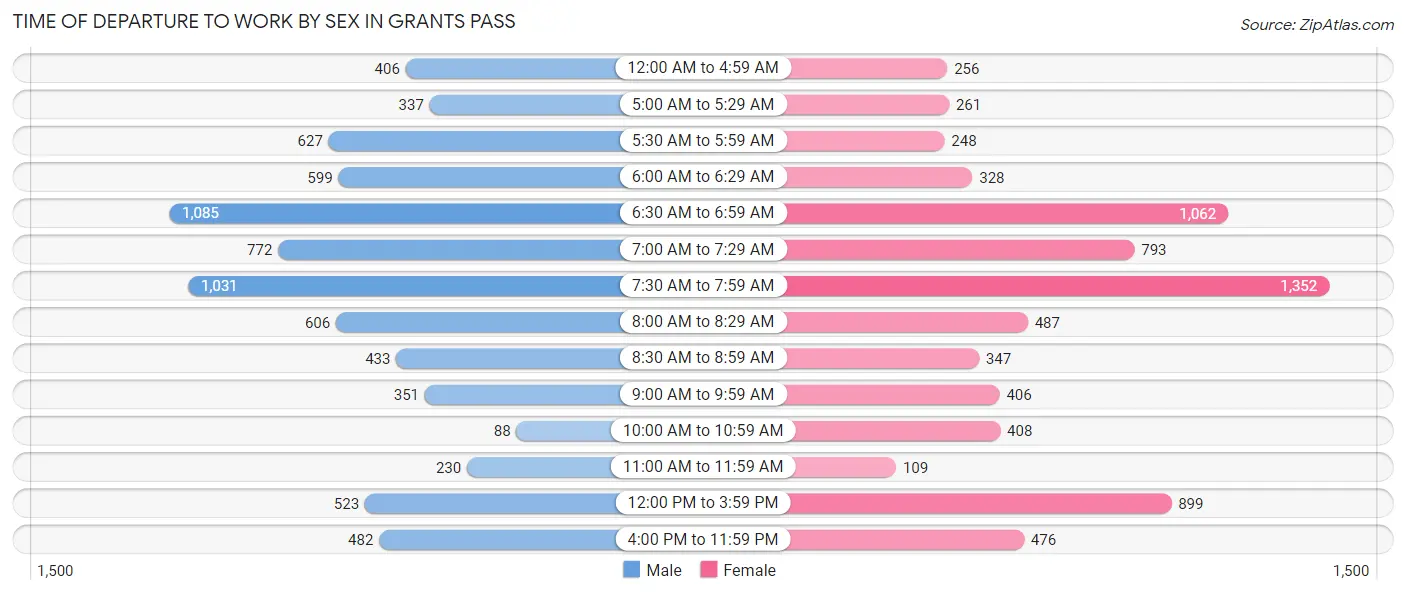
| Time of Departure | Male | Female |
| 12:00 AM to 4:59 AM | 406 (5.4%) | 256 (3.4%) |
| 5:00 AM to 5:29 AM | 337 (4.4%) | 261 (3.5%) |
| 5:30 AM to 5:59 AM | 627 (8.3%) | 248 (3.3%) |
| 6:00 AM to 6:29 AM | 599 (7.9%) | 328 (4.4%) |
| 6:30 AM to 6:59 AM | 1,085 (14.3%) | 1,062 (14.3%) |
| 7:00 AM to 7:29 AM | 772 (10.2%) | 793 (10.7%) |
| 7:30 AM to 7:59 AM | 1,031 (13.6%) | 1,352 (18.2%) |
| 8:00 AM to 8:29 AM | 606 (8.0%) | 487 (6.6%) |
| 8:30 AM to 8:59 AM | 433 (5.7%) | 347 (4.7%) |
| 9:00 AM to 9:59 AM | 351 (4.6%) | 406 (5.5%) |
| 10:00 AM to 10:59 AM | 88 (1.2%) | 408 (5.5%) |
| 11:00 AM to 11:59 AM | 230 (3.0%) | 109 (1.5%) |
| 12:00 PM to 3:59 PM | 523 (6.9%) | 899 (12.1%) |
| 4:00 PM to 11:59 PM | 482 (6.4%) | 476 (6.4%) |
| Total | 7,570 (100.0%) | 7,432 (100.0%) |
Housing Occupancy in Grants Pass
Occupancy by Ownership in Grants Pass
Of the total 16,474 dwellings in Grants Pass, owner-occupied units account for 9,085 (55.1%), while renter-occupied units make up 7,389 (44.9%).
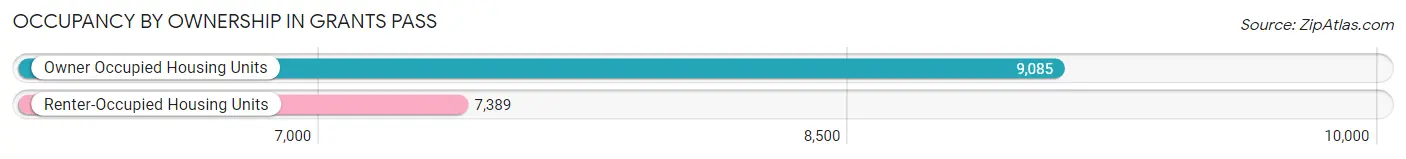
| Occupancy | # Housing Units | % Housing Units |
| Owner Occupied Housing Units | 9,085 | 55.1% |
| Renter-Occupied Housing Units | 7,389 | 44.9% |
| Total Occupied Housing Units | 16,474 | 100.0% |
Occupancy by Household Size in Grants Pass
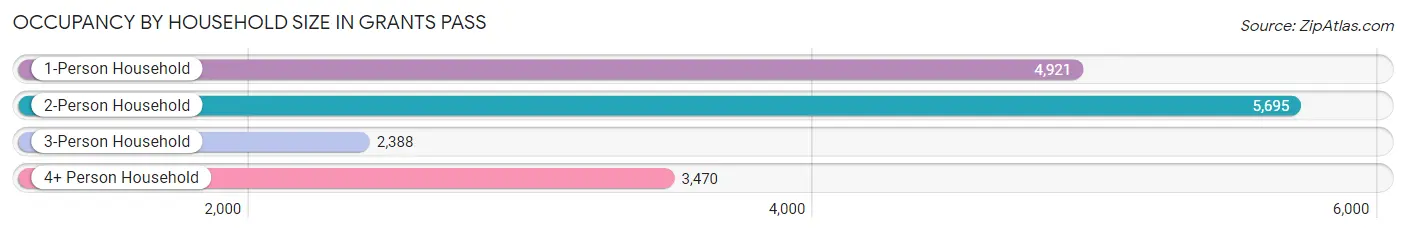
| Household Size | # Housing Units | % Housing Units |
| 1-Person Household | 4,921 | 29.9% |
| 2-Person Household | 5,695 | 34.6% |
| 3-Person Household | 2,388 | 14.5% |
| 4+ Person Household | 3,470 | 21.1% |
| Total Housing Units | 16,474 | 100.0% |
Occupancy by Ownership by Household Size in Grants Pass
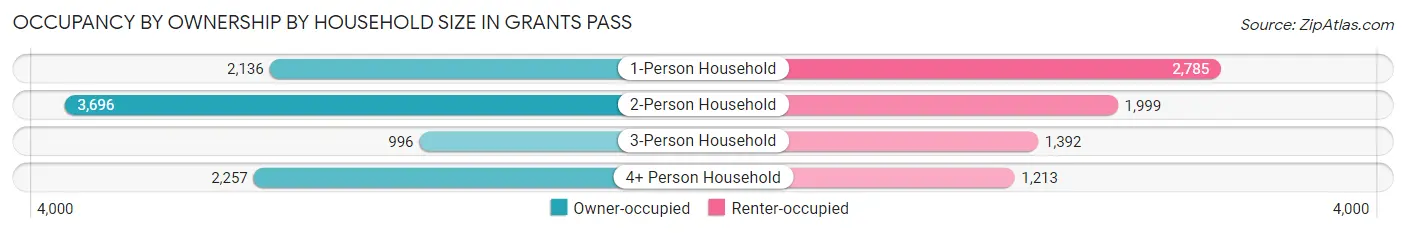
| Household Size | Owner-occupied | Renter-occupied |
| 1-Person Household | 2,136 (43.4%) | 2,785 (56.6%) |
| 2-Person Household | 3,696 (64.9%) | 1,999 (35.1%) |
| 3-Person Household | 996 (41.7%) | 1,392 (58.3%) |
| 4+ Person Household | 2,257 (65.0%) | 1,213 (35.0%) |
| Total Housing Units | 9,085 (55.1%) | 7,389 (44.9%) |
Occupancy by Educational Attainment in Grants Pass
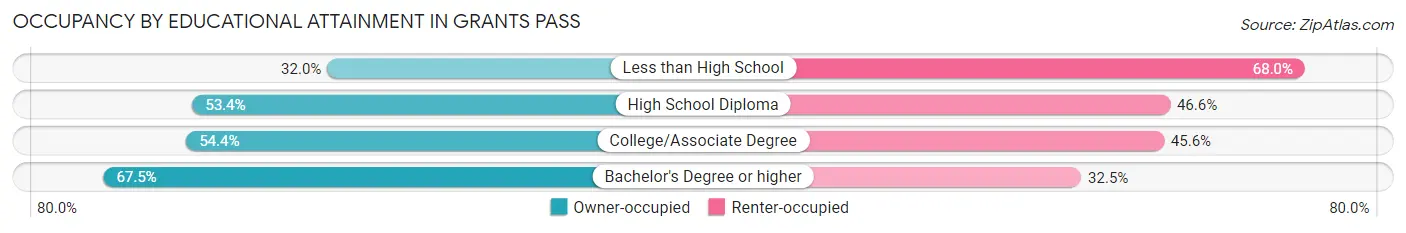
| Household Size | Owner-occupied | Renter-occupied |
| Less than High School | 410 (32.0%) | 871 (68.0%) |
| High School Diploma | 2,189 (53.4%) | 1,910 (46.6%) |
| College/Associate Degree | 4,148 (54.4%) | 3,482 (45.6%) |
| Bachelor's Degree or higher | 2,338 (67.5%) | 1,126 (32.5%) |
Occupancy by Age of Householder in Grants Pass
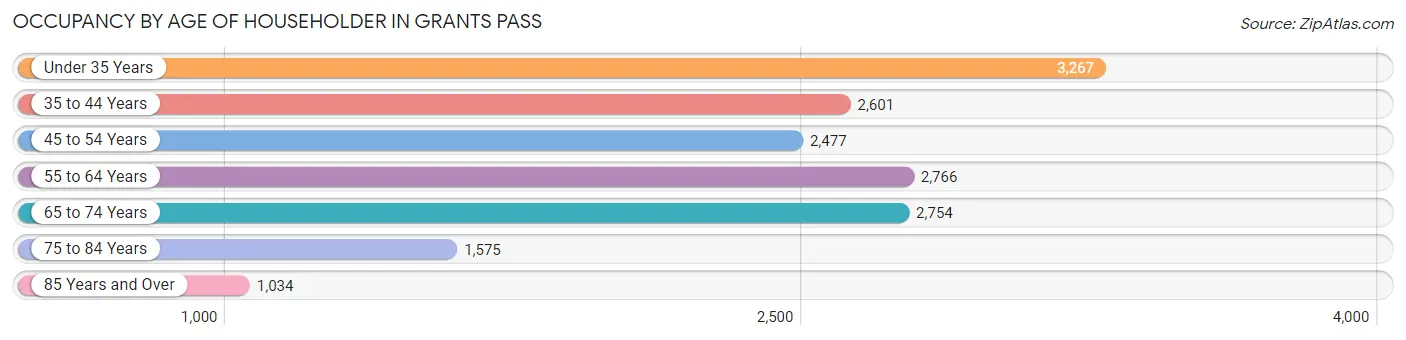
| Age Bracket | # Households | % Households |
| Under 35 Years | 3,267 | 19.8% |
| 35 to 44 Years | 2,601 | 15.8% |
| 45 to 54 Years | 2,477 | 15.0% |
| 55 to 64 Years | 2,766 | 16.8% |
| 65 to 74 Years | 2,754 | 16.7% |
| 75 to 84 Years | 1,575 | 9.6% |
| 85 Years and Over | 1,034 | 6.3% |
| Total | 16,474 | 100.0% |
Housing Finances in Grants Pass
Median Income by Occupancy in Grants Pass
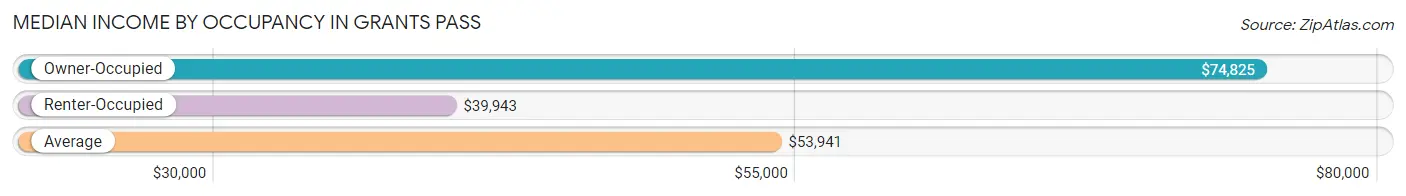
| Occupancy Type | # Households | Median Income |
| Owner-Occupied | 9,085 (55.1%) | $74,825 |
| Renter-Occupied | 7,389 (44.9%) | $39,943 |
| Average | 16,474 (100.0%) | $53,941 |
Occupancy by Householder Income Bracket in Grants Pass
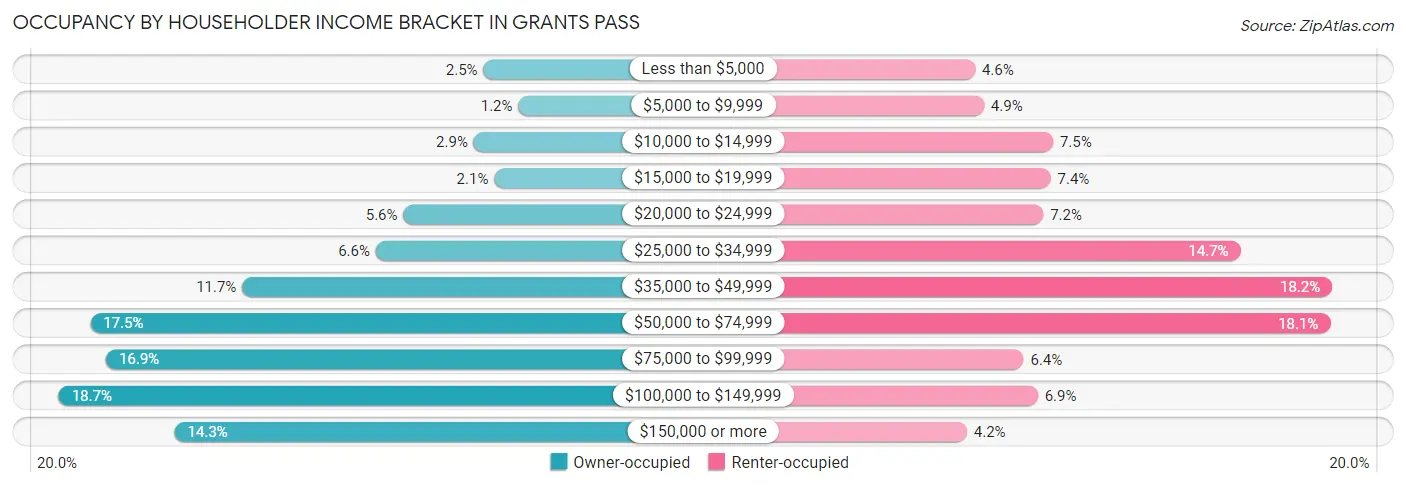
| Income Bracket | Owner-occupied | Renter-occupied |
| Less than $5,000 | 229 (2.5%) | 336 (4.5%) |
| $5,000 to $9,999 | 108 (1.2%) | 361 (4.9%) |
| $10,000 to $14,999 | 263 (2.9%) | 556 (7.5%) |
| $15,000 to $19,999 | 192 (2.1%) | 549 (7.4%) |
| $20,000 to $24,999 | 506 (5.6%) | 528 (7.1%) |
| $25,000 to $34,999 | 601 (6.6%) | 1,083 (14.7%) |
| $35,000 to $49,999 | 1,064 (11.7%) | 1,341 (18.1%) |
| $50,000 to $74,999 | 1,590 (17.5%) | 1,336 (18.1%) |
| $75,000 to $99,999 | 1,535 (16.9%) | 473 (6.4%) |
| $100,000 to $149,999 | 1,699 (18.7%) | 513 (6.9%) |
| $150,000 or more | 1,298 (14.3%) | 313 (4.2%) |
| Total | 9,085 (100.0%) | 7,389 (100.0%) |
Monthly Housing Cost Tiers in Grants Pass
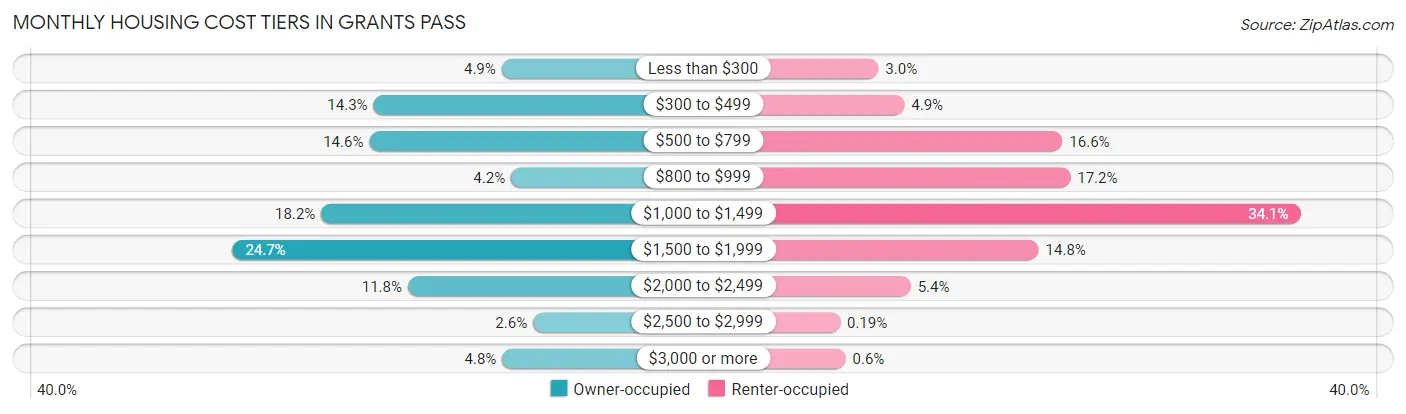
| Monthly Cost | Owner-occupied | Renter-occupied |
| Less than $300 | 442 (4.9%) | 223 (3.0%) |
| $300 to $499 | 1,300 (14.3%) | 364 (4.9%) |
| $500 to $799 | 1,328 (14.6%) | 1,224 (16.6%) |
| $800 to $999 | 380 (4.2%) | 1,267 (17.2%) |
| $1,000 to $1,499 | 1,650 (18.2%) | 2,519 (34.1%) |
| $1,500 to $1,999 | 2,243 (24.7%) | 1,095 (14.8%) |
| $2,000 to $2,499 | 1,070 (11.8%) | 399 (5.4%) |
| $2,500 to $2,999 | 233 (2.6%) | 14 (0.2%) |
| $3,000 or more | 439 (4.8%) | 44 (0.6%) |
| Total | 9,085 (100.0%) | 7,389 (100.0%) |
Physical Housing Characteristics in Grants Pass
Housing Structures in Grants Pass
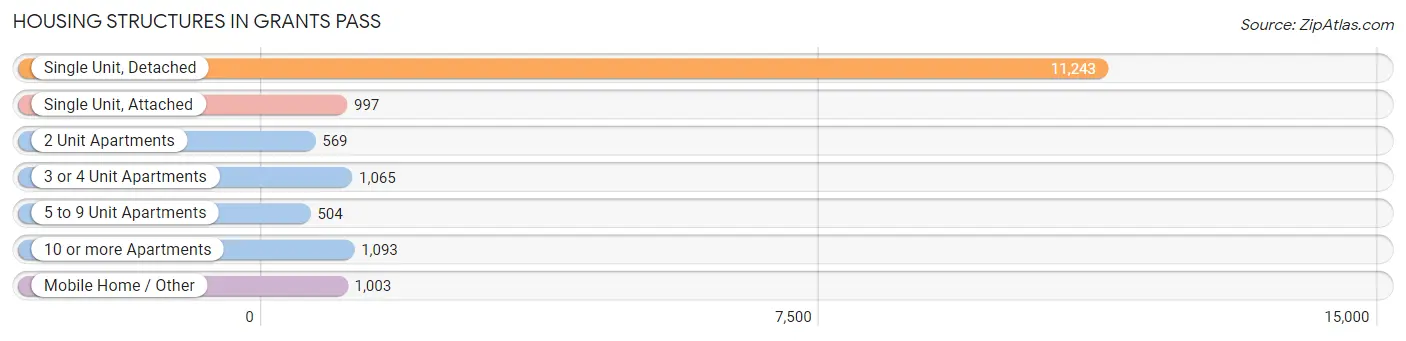
| Structure Type | # Housing Units | % Housing Units |
| Single Unit, Detached | 11,243 | 68.2% |
| Single Unit, Attached | 997 | 6.0% |
| 2 Unit Apartments | 569 | 3.5% |
| 3 or 4 Unit Apartments | 1,065 | 6.5% |
| 5 to 9 Unit Apartments | 504 | 3.1% |
| 10 or more Apartments | 1,093 | 6.6% |
| Mobile Home / Other | 1,003 | 6.1% |
| Total | 16,474 | 100.0% |
Housing Structures by Occupancy in Grants Pass
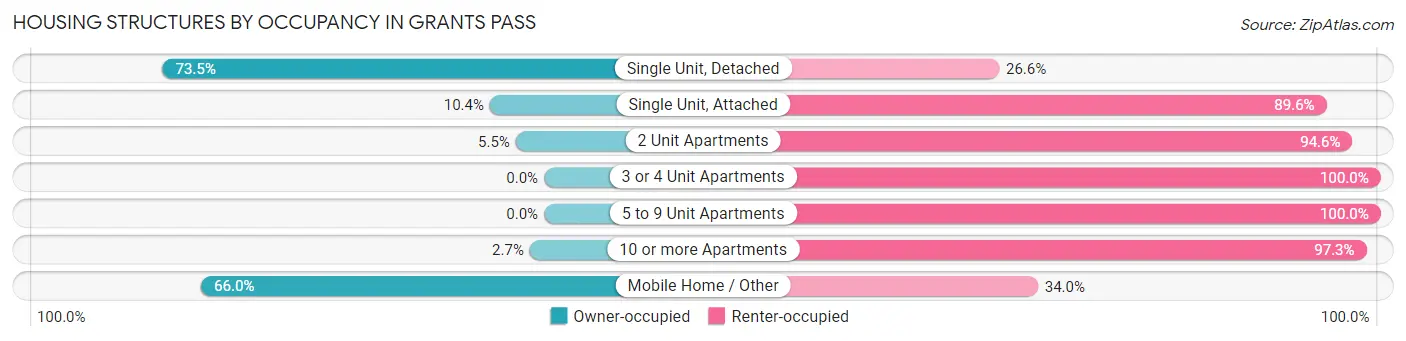
| Structure Type | Owner-occupied | Renter-occupied |
| Single Unit, Detached | 8,258 (73.5%) | 2,985 (26.6%) |
| Single Unit, Attached | 104 (10.4%) | 893 (89.6%) |
| 2 Unit Apartments | 31 (5.4%) | 538 (94.6%) |
| 3 or 4 Unit Apartments | 0 (0.0%) | 1,065 (100.0%) |
| 5 to 9 Unit Apartments | 0 (0.0%) | 504 (100.0%) |
| 10 or more Apartments | 30 (2.7%) | 1,063 (97.3%) |
| Mobile Home / Other | 662 (66.0%) | 341 (34.0%) |
| Total | 9,085 (55.1%) | 7,389 (44.9%) |
Housing Structures by Number of Rooms in Grants Pass
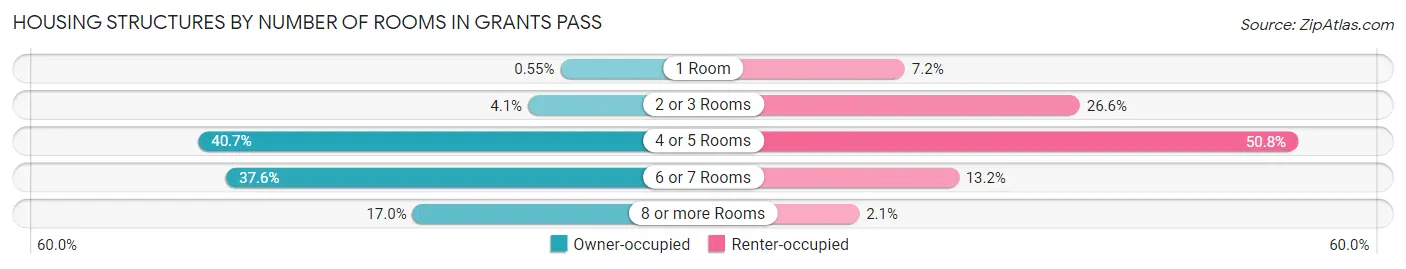
| Number of Rooms | Owner-occupied | Renter-occupied |
| 1 Room | 50 (0.5%) | 533 (7.2%) |
| 2 or 3 Rooms | 376 (4.1%) | 1,968 (26.6%) |
| 4 or 5 Rooms | 3,699 (40.7%) | 3,756 (50.8%) |
| 6 or 7 Rooms | 3,420 (37.6%) | 974 (13.2%) |
| 8 or more Rooms | 1,540 (17.0%) | 158 (2.1%) |
| Total | 9,085 (100.0%) | 7,389 (100.0%) |
Housing Structure by Heating Type in Grants Pass
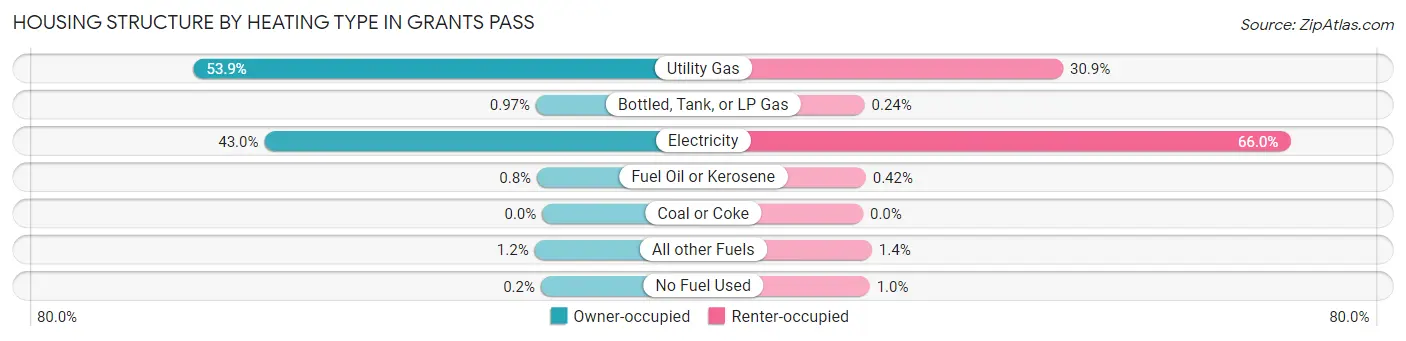
| Heating Type | Owner-occupied | Renter-occupied |
| Utility Gas | 4,897 (53.9%) | 2,285 (30.9%) |
| Bottled, Tank, or LP Gas | 88 (1.0%) | 18 (0.2%) |
| Electricity | 3,902 (42.9%) | 4,878 (66.0%) |
| Fuel Oil or Kerosene | 73 (0.8%) | 31 (0.4%) |
| Coal or Coke | 0 (0.0%) | 0 (0.0%) |
| All other Fuels | 107 (1.2%) | 101 (1.4%) |
| No Fuel Used | 18 (0.2%) | 76 (1.0%) |
| Total | 9,085 (100.0%) | 7,389 (100.0%) |
Household Vehicle Usage in Grants Pass
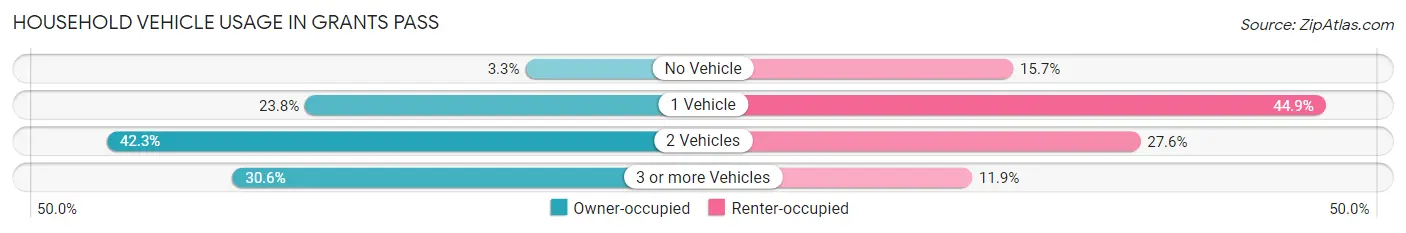
| Vehicles per Household | Owner-occupied | Renter-occupied |
| No Vehicle | 296 (3.3%) | 1,160 (15.7%) |
| 1 Vehicle | 2,164 (23.8%) | 3,315 (44.9%) |
| 2 Vehicles | 3,844 (42.3%) | 2,037 (27.6%) |
| 3 or more Vehicles | 2,781 (30.6%) | 877 (11.9%) |
| Total | 9,085 (100.0%) | 7,389 (100.0%) |
Real Estate & Mortgages in Grants Pass
Real Estate and Mortgage Overview in Grants Pass
| Characteristic | Without Mortgage | With Mortgage |
| Housing Units | 3,255 | 5,830 |
| Median Property Value | $307,700 | $342,100 |
| Median Household Income | $51,627 | $1,001 |
| Monthly Housing Costs | $492 | $439 |
| Real Estate Taxes | $2,322 | $80 |
Property Value by Mortgage Status in Grants Pass
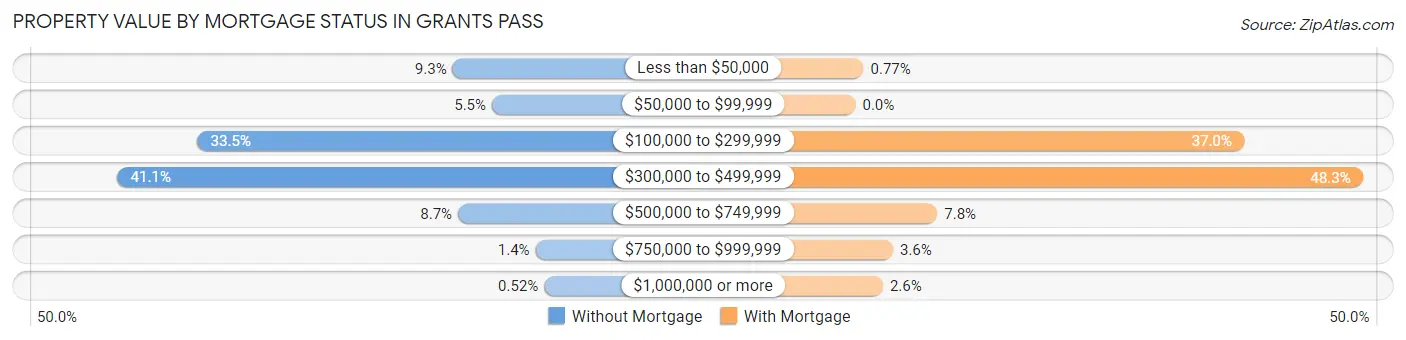
| Property Value | Without Mortgage | With Mortgage |
| Less than $50,000 | 301 (9.2%) | 45 (0.8%) |
| $50,000 to $99,999 | 179 (5.5%) | 0 (0.0%) |
| $100,000 to $299,999 | 1,091 (33.5%) | 2,156 (37.0%) |
| $300,000 to $499,999 | 1,339 (41.1%) | 2,815 (48.3%) |
| $500,000 to $749,999 | 284 (8.7%) | 454 (7.8%) |
| $750,000 to $999,999 | 44 (1.3%) | 208 (3.6%) |
| $1,000,000 or more | 17 (0.5%) | 152 (2.6%) |
| Total | 3,255 (100.0%) | 5,830 (100.0%) |
Household Income by Mortgage Status in Grants Pass
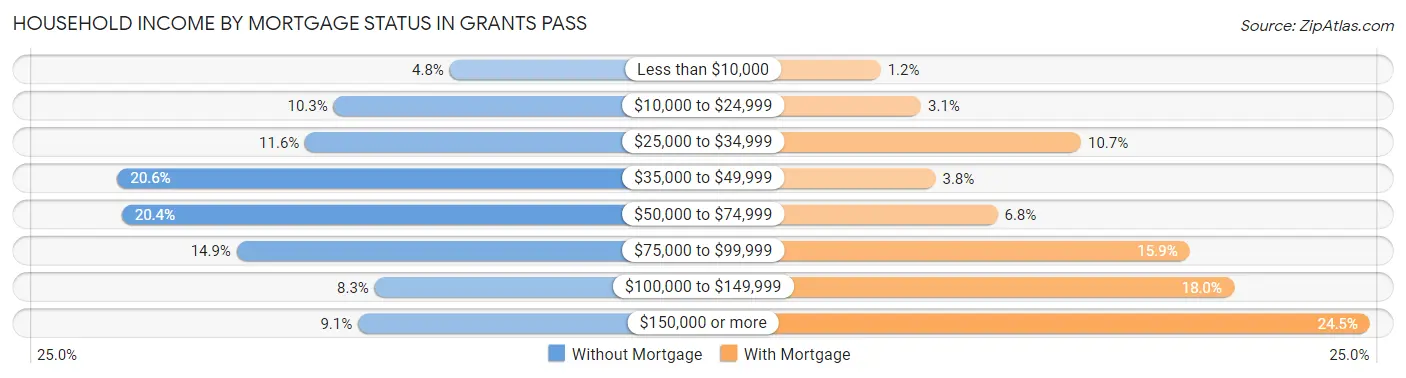
| Household Income | Without Mortgage | With Mortgage |
| Less than $10,000 | 155 (4.8%) | 70 (1.2%) |
| $10,000 to $24,999 | 335 (10.3%) | 182 (3.1%) |
| $25,000 to $34,999 | 379 (11.6%) | 626 (10.7%) |
| $35,000 to $49,999 | 670 (20.6%) | 222 (3.8%) |
| $50,000 to $74,999 | 663 (20.4%) | 394 (6.8%) |
| $75,000 to $99,999 | 485 (14.9%) | 927 (15.9%) |
| $100,000 to $149,999 | 271 (8.3%) | 1,050 (18.0%) |
| $150,000 or more | 297 (9.1%) | 1,428 (24.5%) |
| Total | 3,255 (100.0%) | 5,830 (100.0%) |
Property Value to Household Income Ratio in Grants Pass
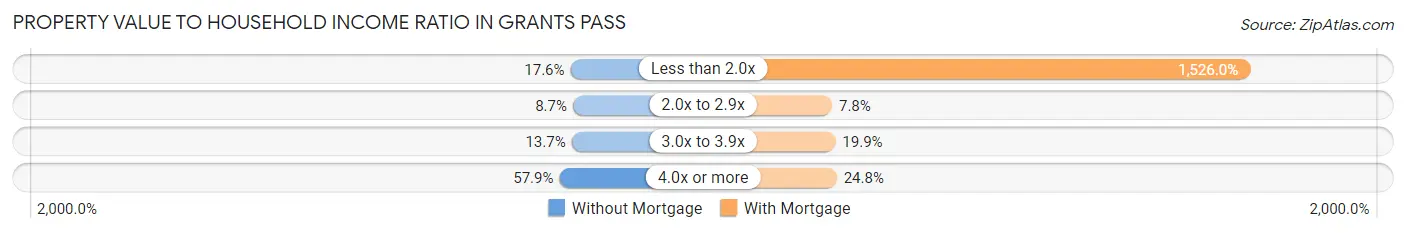
| Value-to-Income Ratio | Without Mortgage | With Mortgage |
| Less than 2.0x | 574 (17.6%) | 88,967 (1,526.0%) |
| 2.0x to 2.9x | 284 (8.7%) | 454 (7.8%) |
| 3.0x to 3.9x | 445 (13.7%) | 1,159 (19.9%) |
| 4.0x or more | 1,886 (57.9%) | 1,445 (24.8%) |
| Total | 3,255 (100.0%) | 5,830 (100.0%) |
Real Estate Taxes by Mortgage Status in Grants Pass
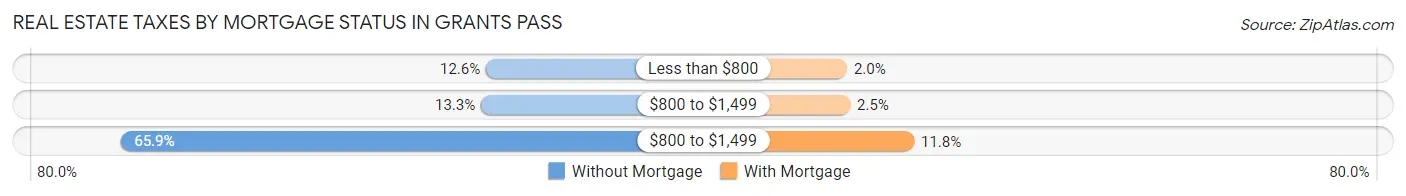
| Property Taxes | Without Mortgage | With Mortgage |
| Less than $800 | 409 (12.6%) | 119 (2.0%) |
| $800 to $1,499 | 433 (13.3%) | 145 (2.5%) |
| $800 to $1,499 | 2,144 (65.9%) | 690 (11.8%) |
| Total | 3,255 (100.0%) | 5,830 (100.0%) |
Health & Disability in Grants Pass
Health Insurance Coverage by Age in Grants Pass
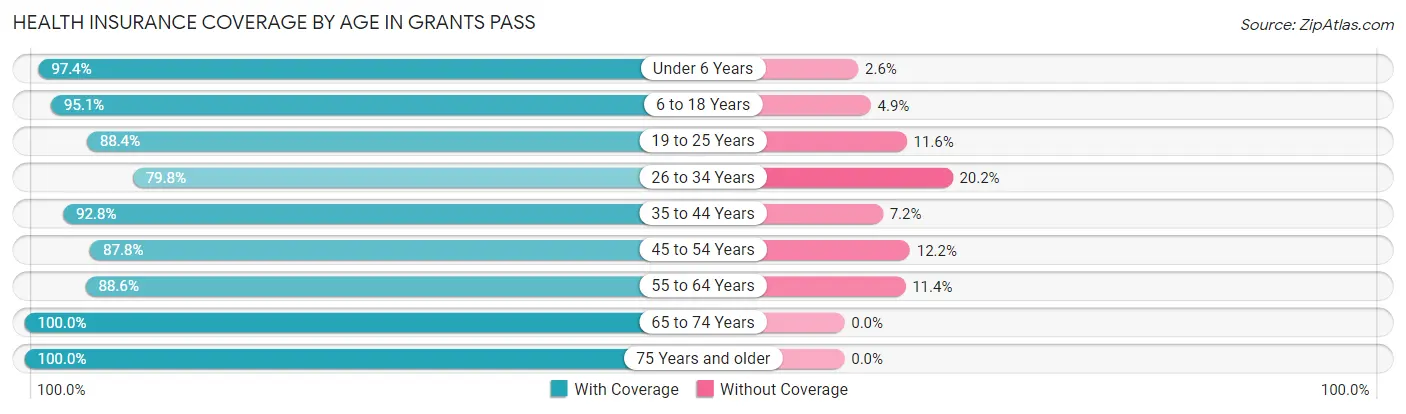
| Age Bracket | With Coverage | Without Coverage |
| Under 6 Years | 2,161 (97.4%) | 57 (2.6%) |
| 6 to 18 Years | 6,520 (95.1%) | 337 (4.9%) |
| 19 to 25 Years | 2,930 (88.4%) | 385 (11.6%) |
| 26 to 34 Years | 3,491 (79.8%) | 882 (20.2%) |
| 35 to 44 Years | 4,441 (92.8%) | 343 (7.2%) |
| 45 to 54 Years | 3,560 (87.8%) | 495 (12.2%) |
| 55 to 64 Years | 4,019 (88.6%) | 515 (11.4%) |
| 65 to 74 Years | 4,721 (100.0%) | 0 (0.0%) |
| 75 Years and older | 3,656 (100.0%) | 0 (0.0%) |
| Total | 35,499 (92.2%) | 3,014 (7.8%) |
Health Insurance Coverage by Citizenship Status in Grants Pass
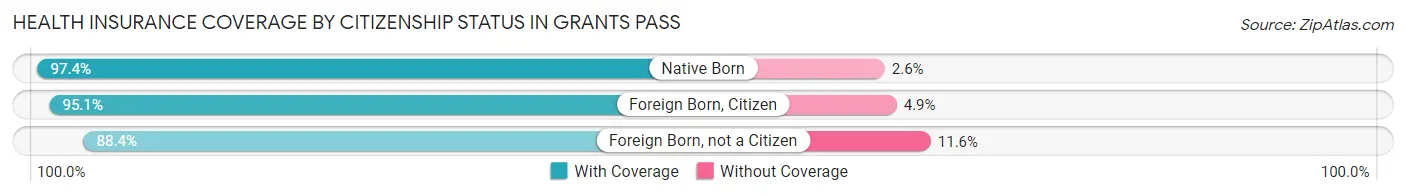
| Citizenship Status | With Coverage | Without Coverage |
| Native Born | 2,161 (97.4%) | 57 (2.6%) |
| Foreign Born, Citizen | 6,520 (95.1%) | 337 (4.9%) |
| Foreign Born, not a Citizen | 2,930 (88.4%) | 385 (11.6%) |
Health Insurance Coverage by Household Income in Grants Pass
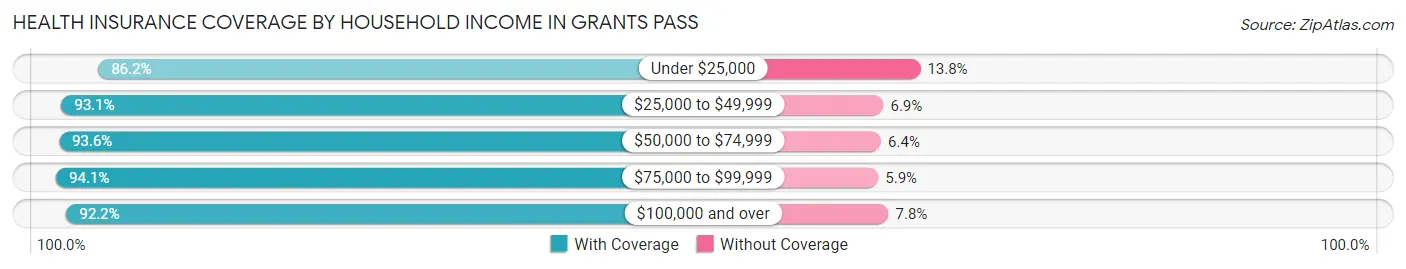
| Household Income | With Coverage | Without Coverage |
| Under $25,000 | 4,527 (86.2%) | 725 (13.8%) |
| $25,000 to $49,999 | 8,283 (93.1%) | 612 (6.9%) |
| $50,000 to $74,999 | 7,775 (93.6%) | 535 (6.4%) |
| $75,000 to $99,999 | 5,014 (94.1%) | 315 (5.9%) |
| $100,000 and over | 9,409 (92.2%) | 799 (7.8%) |
Public vs Private Health Insurance Coverage by Age in Grants Pass
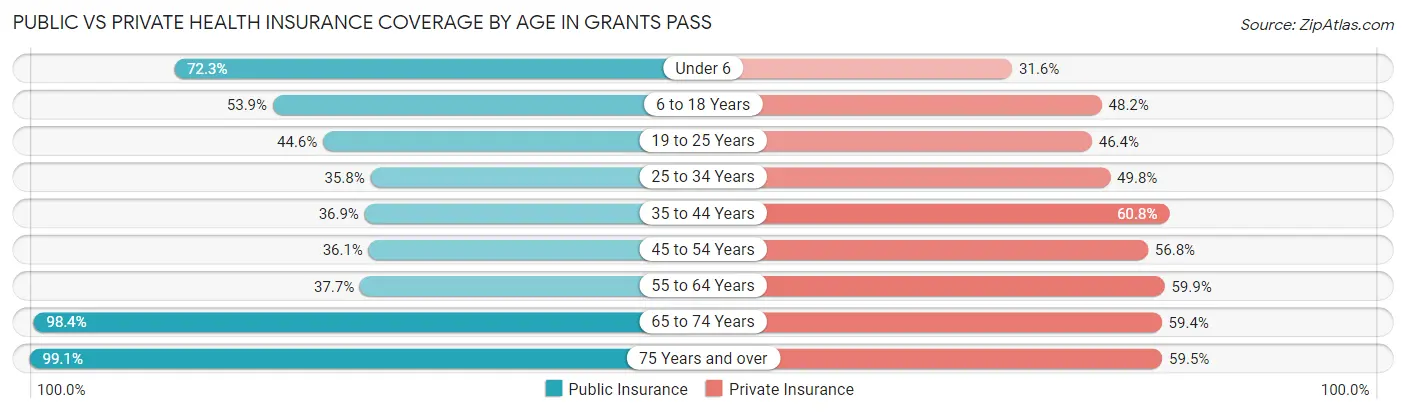
| Age Bracket | Public Insurance | Private Insurance |
| Under 6 | 1,603 (72.3%) | 701 (31.6%) |
| 6 to 18 Years | 3,697 (53.9%) | 3,307 (48.2%) |
| 19 to 25 Years | 1,478 (44.6%) | 1,538 (46.4%) |
| 25 to 34 Years | 1,565 (35.8%) | 2,178 (49.8%) |
| 35 to 44 Years | 1,764 (36.9%) | 2,907 (60.8%) |
| 45 to 54 Years | 1,465 (36.1%) | 2,304 (56.8%) |
| 55 to 64 Years | 1,711 (37.7%) | 2,716 (59.9%) |
| 65 to 74 Years | 4,644 (98.4%) | 2,803 (59.4%) |
| 75 Years and over | 3,622 (99.1%) | 2,174 (59.5%) |
| Total | 21,549 (55.9%) | 20,628 (53.6%) |
Disability Status by Sex by Age in Grants Pass
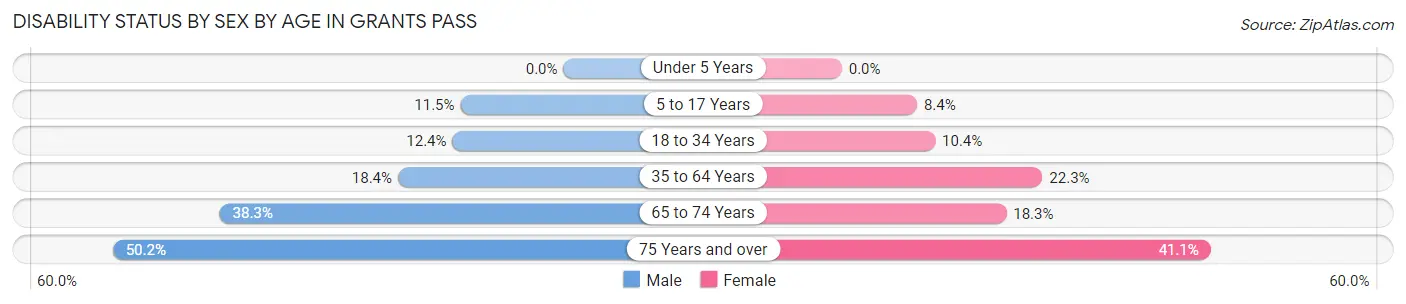
| Age Bracket | Male | Female |
| Under 5 Years | 0 (0.0%) | 0 (0.0%) |
| 5 to 17 Years | 374 (11.5%) | 274 (8.4%) |
| 18 to 34 Years | 527 (12.4%) | 423 (10.4%) |
| 35 to 64 Years | 1,139 (18.4%) | 1,607 (22.3%) |
| 65 to 74 Years | 733 (38.3%) | 514 (18.3%) |
| 75 Years and over | 822 (50.2%) | 829 (41.1%) |
Disability Class by Sex by Age in Grants Pass
Disability Class: Hearing Difficulty
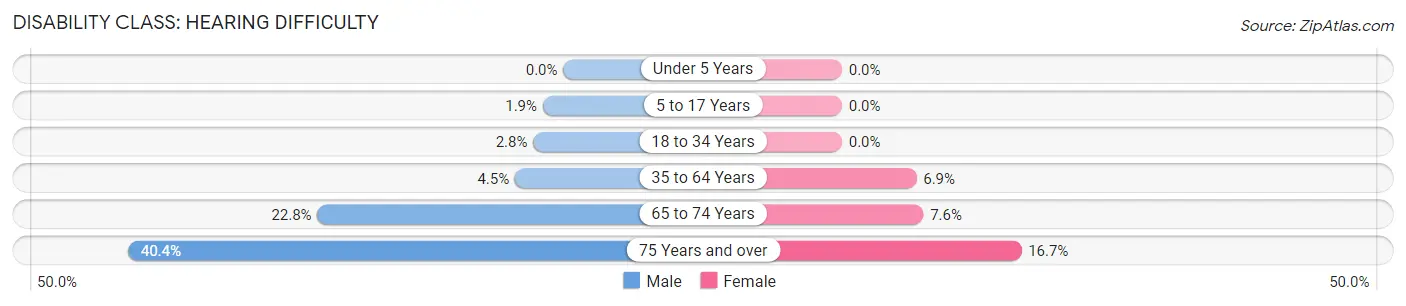
| Age Bracket | Male | Female |
| Under 5 Years | 0 (0.0%) | 0 (0.0%) |
| 5 to 17 Years | 62 (1.9%) | 0 (0.0%) |
| 18 to 34 Years | 119 (2.8%) | 0 (0.0%) |
| 35 to 64 Years | 277 (4.5%) | 497 (6.9%) |
| 65 to 74 Years | 437 (22.8%) | 212 (7.6%) |
| 75 Years and over | 662 (40.4%) | 336 (16.7%) |
Disability Class: Vision Difficulty
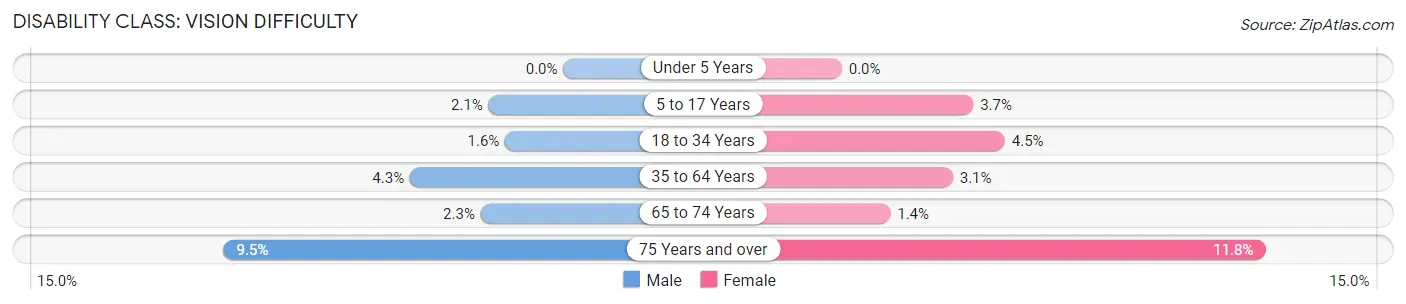
| Age Bracket | Male | Female |
| Under 5 Years | 0 (0.0%) | 0 (0.0%) |
| 5 to 17 Years | 68 (2.1%) | 120 (3.7%) |
| 18 to 34 Years | 69 (1.6%) | 185 (4.5%) |
| 35 to 64 Years | 264 (4.3%) | 222 (3.1%) |
| 65 to 74 Years | 44 (2.3%) | 38 (1.3%) |
| 75 Years and over | 155 (9.5%) | 238 (11.8%) |
Disability Class: Cognitive Difficulty
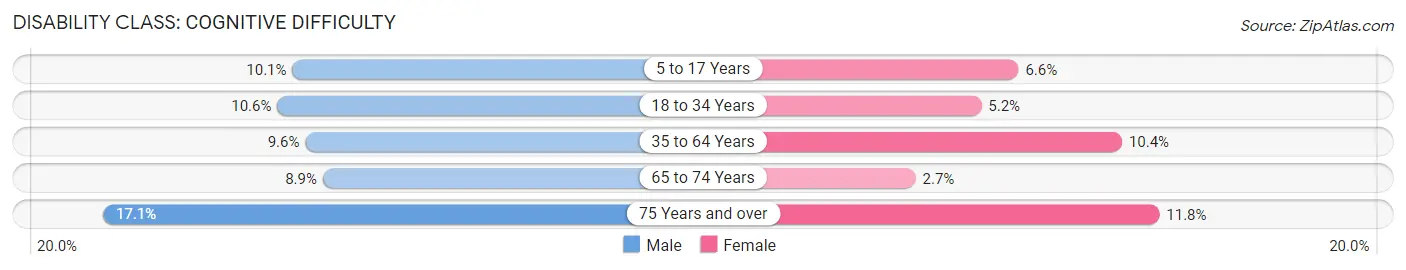
| Age Bracket | Male | Female |
| 5 to 17 Years | 328 (10.1%) | 215 (6.6%) |
| 18 to 34 Years | 453 (10.6%) | 211 (5.2%) |
| 35 to 64 Years | 592 (9.6%) | 748 (10.4%) |
| 65 to 74 Years | 171 (8.9%) | 77 (2.7%) |
| 75 Years and over | 280 (17.1%) | 238 (11.8%) |
Disability Class: Ambulatory Difficulty
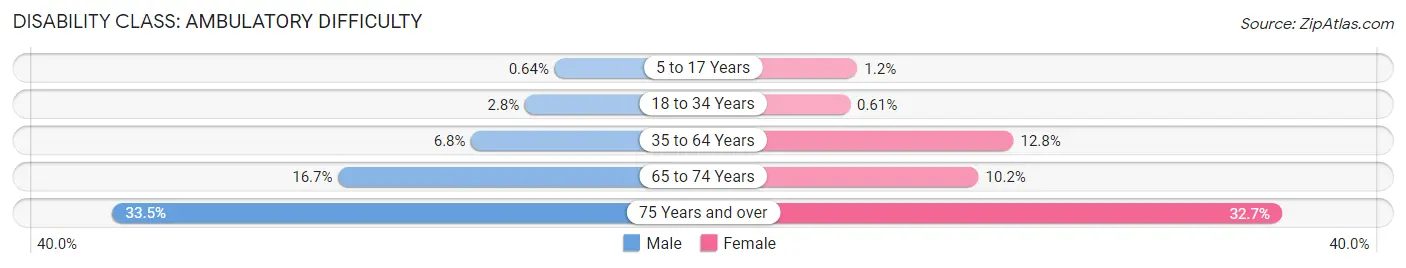
| Age Bracket | Male | Female |
| 5 to 17 Years | 21 (0.6%) | 38 (1.2%) |
| 18 to 34 Years | 121 (2.8%) | 25 (0.6%) |
| 35 to 64 Years | 422 (6.8%) | 917 (12.8%) |
| 65 to 74 Years | 320 (16.7%) | 285 (10.2%) |
| 75 Years and over | 548 (33.5%) | 659 (32.7%) |
Disability Class: Self-Care Difficulty
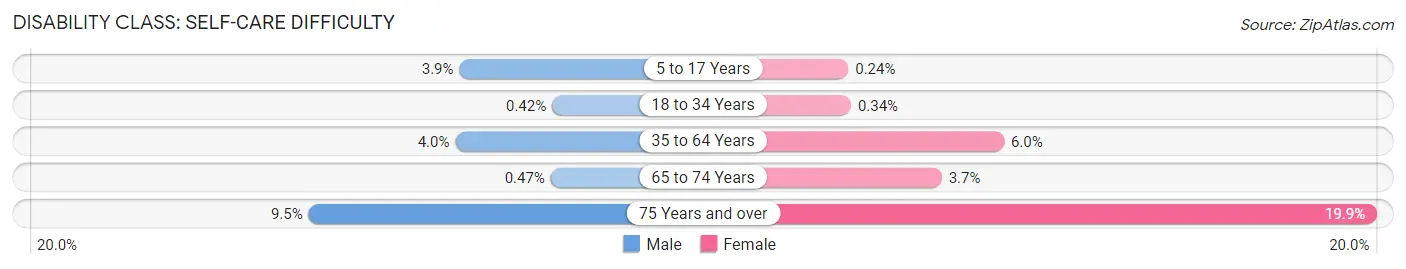
| Age Bracket | Male | Female |
| 5 to 17 Years | 126 (3.9%) | 8 (0.2%) |
| 18 to 34 Years | 18 (0.4%) | 14 (0.3%) |
| 35 to 64 Years | 248 (4.0%) | 433 (6.0%) |
| 65 to 74 Years | 9 (0.5%) | 104 (3.7%) |
| 75 Years and over | 155 (9.5%) | 401 (19.9%) |
Technology Access in Grants Pass
Computing Device Access in Grants Pass
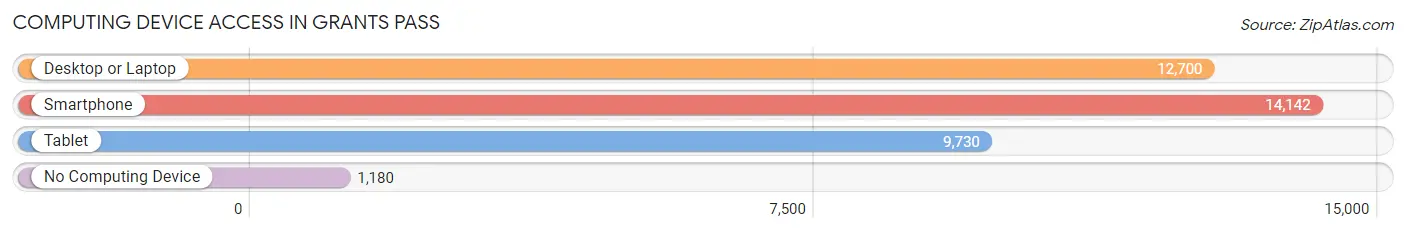
| Device Type | # Households | % Households |
| Desktop or Laptop | 12,700 | 77.1% |
| Smartphone | 14,142 | 85.8% |
| Tablet | 9,730 | 59.1% |
| No Computing Device | 1,180 | 7.2% |
| Total | 16,474 | 100.0% |
Internet Access in Grants Pass
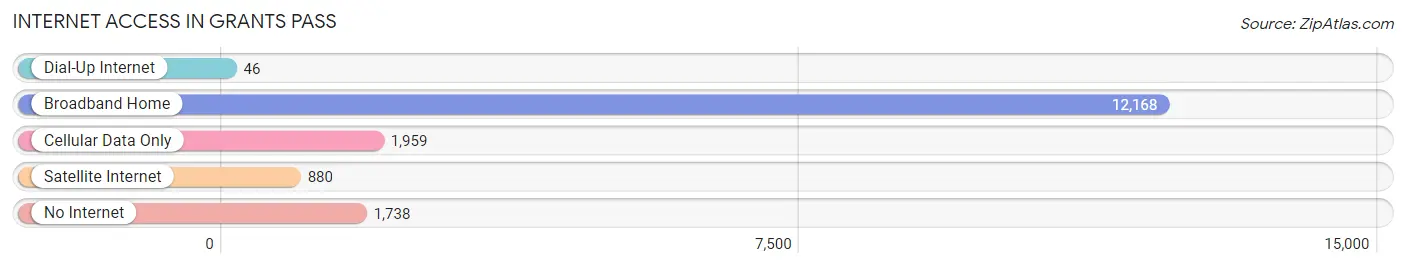
| Internet Type | # Households | % Households |
| Dial-Up Internet | 46 | 0.3% |
| Broadband Home | 12,168 | 73.9% |
| Cellular Data Only | 1,959 | 11.9% |
| Satellite Internet | 880 | 5.3% |
| No Internet | 1,738 | 10.5% |
| Total | 16,474 | 100.0% |
Grants Pass Summary
Grants Pass is a city located in the southwestern corner of Oregon, United States. It is the county seat of Josephine County and is located along the Rogue River. The city is situated in the Rogue Valley, a region of the Pacific Northwest known for its mild climate and abundant natural beauty. The city is home to a population of approximately 35,000 people, making it the largest city in Josephine County.
Geography
Grants Pass is located in the Rogue Valley, a region of the Pacific Northwest known for its mild climate and abundant natural beauty. The city is situated at the confluence of the Rogue River and the Applegate River, and is surrounded by the Siskiyou and Cascade mountain ranges. The city is located at an elevation of 1,000 feet (305 m) above sea level. The climate in Grants Pass is mild and temperate, with an average annual temperature of 54°F (12°C). The city receives an average of 33 inches (84 cm) of precipitation annually.
Economy
Grants Pass is the economic hub of Josephine County, and is home to a variety of businesses and industries. The city is home to a number of manufacturing companies, including a paper mill, a wood products plant, and a food processing plant. The city is also home to a number of retail stores, restaurants, and other businesses. The city is also home to a number of medical facilities, including a hospital, a medical center, and a number of clinics.
Demographics
As of the 2010 census, the population of Grants Pass was 34,533. The racial makeup of the city was 90.2% White, 0.7% African American, 1.2% Native American, 1.2% Asian, 0.2% Pacific Islander, 3.3% from other races, and 3.2% from two or more races. Hispanic or Latino of any race were 8.2% of the population.
The median income for a household in the city was $37,837, and the median income for a family was $45,837. The per capita income for the city was $20,837. About 14.2% of families and 17.7% of the population were below the poverty line, including 25.2% of those under age 18 and 8.2% of those age 65 or over.
History
Grants Pass was founded in 1851 by settlers from the Oregon Trail. The city was named after General Ulysses S. Grant, who had recently been elected President of the United States. The city was incorporated in 1887, and has since grown to become the largest city in Josephine County. The city has a rich history, and is home to a number of historic buildings and sites, including the Josephine County Courthouse, the Grants Pass Museum of Art, and the Rogue River National Forest.
Common Questions
What is Per Capita Income in Grants Pass?
Per Capita income in Grants Pass is $30,649.
What is the Median Family Income in Grants Pass?
Median Family Income in Grants Pass is $62,144.
What is the Median Household income in Grants Pass?
Median Household Income in Grants Pass is $53,941.
What is Income or Wage Gap in Grants Pass?
Income or Wage Gap in Grants Pass is 30.3%.
Women in Grants Pass earn 69.7 cents for every dollar earned by a man.
What is Family Income Deficit in Grants Pass?
Family Income Deficit in Grants Pass is $9,676.
Families that are below poverty line in Grants Pass earn $9,676 less on average than the poverty threshold level.
What is Inequality or Gini Index in Grants Pass?
Inequality or Gini Index in Grants Pass is 0.45.
What is the Total Population of Grants Pass?
Total Population of Grants Pass is 39,131.
What is the Total Male Population of Grants Pass?
Total Male Population of Grants Pass is 18,552.
What is the Total Female Population of Grants Pass?
Total Female Population of Grants Pass is 20,579.
What is the Ratio of Males per 100 Females in Grants Pass?
There are 90.15 Males per 100 Females in Grants Pass.
What is the Ratio of Females per 100 Males in Grants Pass?
There are 110.93 Females per 100 Males in Grants Pass.
What is the Median Population Age in Grants Pass?
Median Population Age in Grants Pass is 41.0 Years.
What is the Average Family Size in Grants Pass
Average Family Size in Grants Pass is 2.8 People.
What is the Average Household Size in Grants Pass
Average Household Size in Grants Pass is 2.3 People.
How Large is the Labor Force in Grants Pass?
There are 17,811 People in the Labor Forcein in Grants Pass.
What is the Percentage of People in the Labor Force in Grants Pass?
55.8% of People are in the Labor Force in Grants Pass.
What is the Unemployment Rate in Grants Pass?
Unemployment Rate in Grants Pass is 6.3%.