Echo, OR Map & Demographics
Echo Map
Echo Overview
$33,634
PER CAPITA INCOME
$71,442
AVG FAMILY INCOME
$67,578
AVG HOUSEHOLD INCOME
74.5%
WAGE / INCOME GAP [ % ]
25.5¢/ $1
WAGE / INCOME GAP [ $ ]
0.41
INEQUALITY / GINI INDEX
478
TOTAL POPULATION
234
MALE POPULATION
244
FEMALE POPULATION
95.90
MALES / 100 FEMALES
104.27
FEMALES / 100 MALES
38.6
MEDIAN AGE
2.8
AVG FAMILY SIZE
2.3
AVG HOUSEHOLD SIZE
245
LABOR FORCE [ PEOPLE ]
67.1%
PERCENT IN LABOR FORCE
8.2%
UNEMPLOYMENT RATE
Echo Zip Codes
Echo Area Codes
Income in Echo
Income Overview in Echo
Per Capita Income in Echo is $33,634, while median incomes of families and households are $71,442 and $67,578 respectively.
| Characteristic | Number | Measure |
| Per Capita Income | 478 | $33,634 |
| Median Family Income | 149 | $71,442 |
| Mean Family Income | 149 | $97,567 |
| Median Household Income | 207 | $67,578 |
| Mean Household Income | 207 | $81,527 |
| Income Deficit | 149 | $0 |
| Wage / Income Gap (%) | 478 | 74.55% |
| Wage / Income Gap ($) | 478 | 25.45¢ per $1 |
| Gini / Inequality Index | 478 | 0.41 |
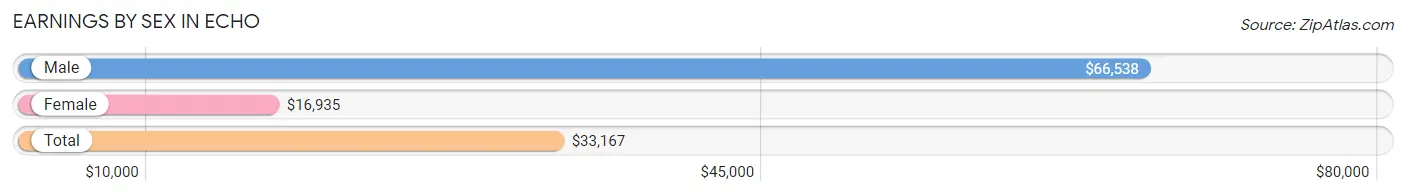
Earnings by Sex in Echo
Average Earnings in Echo are $33,167, $66,538 for men and $16,935 for women, a difference of 74.6%.
| Sex | Number | Average Earnings |
| Male | 124 (49.2%) | $66,538 |
| Female | 128 (50.8%) | $16,935 |
| Total | 252 (100.0%) | $33,167 |
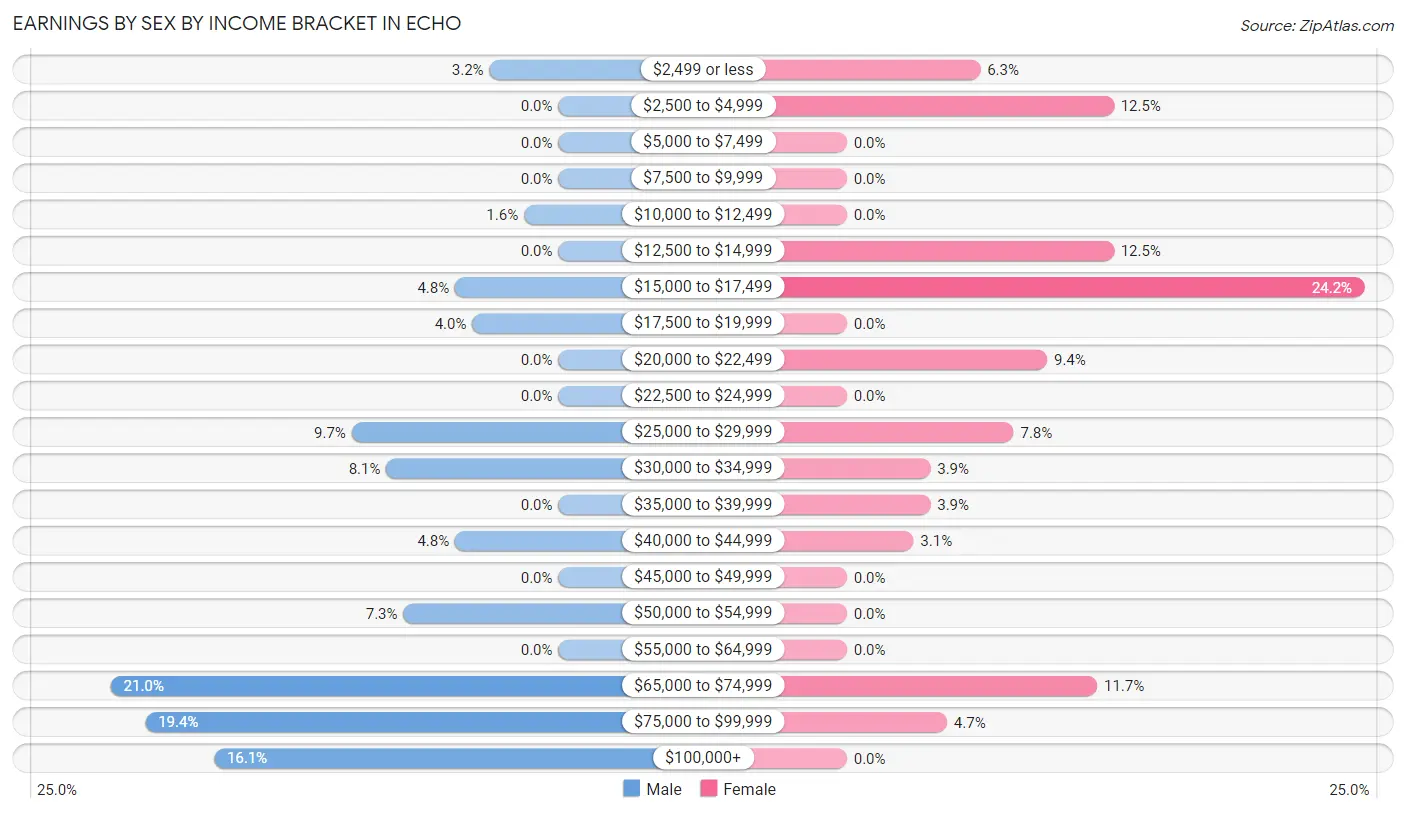
Earnings by Sex by Income Bracket in Echo
The most common earnings brackets in Echo are $65,000 to $74,999 for men (26 | 21.0%) and $15,000 to $17,499 for women (31 | 24.2%).
| Income | Male | Female |
| $2,499 or less | 4 (3.2%) | 8 (6.2%) |
| $2,500 to $4,999 | 0 (0.0%) | 16 (12.5%) |
| $5,000 to $7,499 | 0 (0.0%) | 0 (0.0%) |
| $7,500 to $9,999 | 0 (0.0%) | 0 (0.0%) |
| $10,000 to $12,499 | 2 (1.6%) | 0 (0.0%) |
| $12,500 to $14,999 | 0 (0.0%) | 16 (12.5%) |
| $15,000 to $17,499 | 6 (4.8%) | 31 (24.2%) |
| $17,500 to $19,999 | 5 (4.0%) | 0 (0.0%) |
| $20,000 to $22,499 | 0 (0.0%) | 12 (9.4%) |
| $22,500 to $24,999 | 0 (0.0%) | 0 (0.0%) |
| $25,000 to $29,999 | 12 (9.7%) | 10 (7.8%) |
| $30,000 to $34,999 | 10 (8.1%) | 5 (3.9%) |
| $35,000 to $39,999 | 0 (0.0%) | 5 (3.9%) |
| $40,000 to $44,999 | 6 (4.8%) | 4 (3.1%) |
| $45,000 to $49,999 | 0 (0.0%) | 0 (0.0%) |
| $50,000 to $54,999 | 9 (7.3%) | 0 (0.0%) |
| $55,000 to $64,999 | 0 (0.0%) | 0 (0.0%) |
| $65,000 to $74,999 | 26 (21.0%) | 15 (11.7%) |
| $75,000 to $99,999 | 24 (19.4%) | 6 (4.7%) |
| $100,000+ | 20 (16.1%) | 0 (0.0%) |
| Total | 124 (100.0%) | 128 (100.0%) |
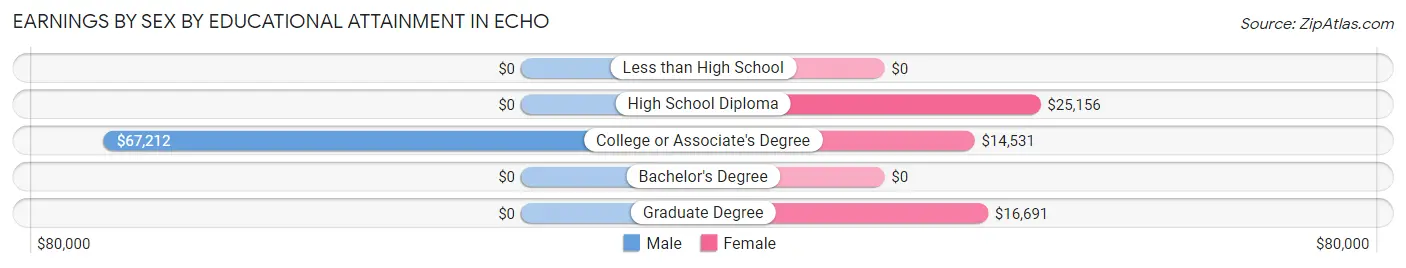
Earnings by Sex by Educational Attainment in Echo
Average earnings in Echo are $66,635 for men and $16,767 for women, a difference of 74.8%. Men with an educational attainment of college or associate's degree enjoy the highest average annual earnings of $67,212, while those with college or associate's degree education earn the least with $67,212. Women with an educational attainment of high school diploma earn the most with the average annual earnings of $25,156, while those with college or associate's degree education have the smallest earnings of $14,531.
| Educational Attainment | Male Income | Female Income |
| Less than High School | - | - |
| High School Diploma | - | - |
| College or Associate's Degree | $67,212 | $14,531 |
| Bachelor's Degree | - | - |
| Graduate Degree | - | - |
| Total | $66,635 | $16,767 |
Family Income in Echo
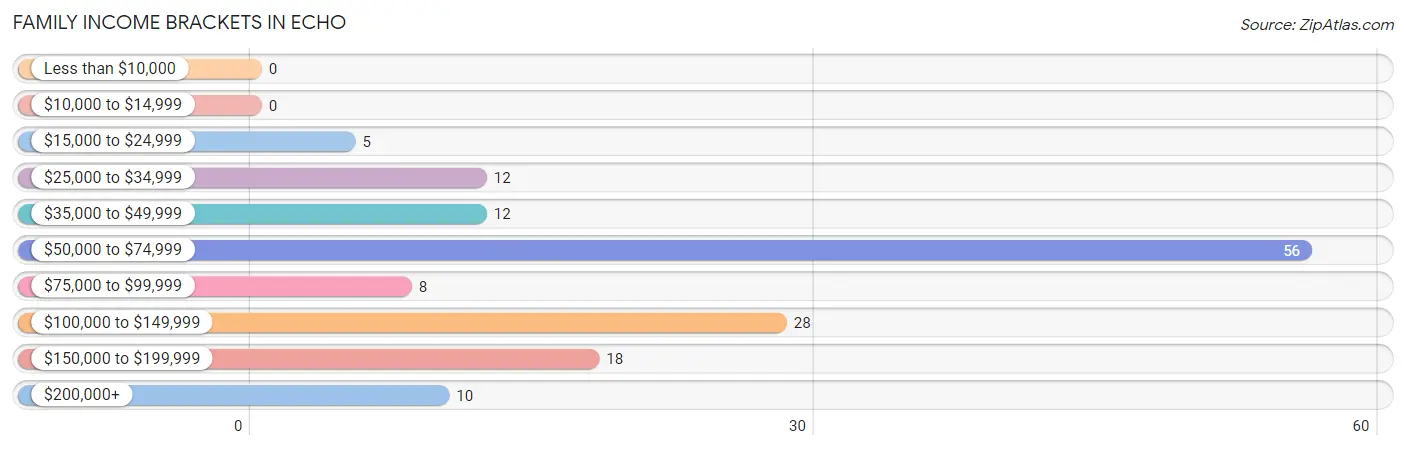
Family Income Brackets in Echo
According to the Echo family income data, there are 56 families falling into the $50,000 to $74,999 income range, which is the most common income bracket and makes up 37.6% of all families.
| Income Bracket | # Families | % Families |
| Less than $10,000 | 0 | 0.0% |
| $10,000 to $14,999 | 0 | 0.0% |
| $15,000 to $24,999 | 5 | 3.4% |
| $25,000 to $34,999 | 12 | 8.1% |
| $35,000 to $49,999 | 12 | 8.1% |
| $50,000 to $74,999 | 56 | 37.6% |
| $75,000 to $99,999 | 8 | 5.4% |
| $100,000 to $149,999 | 28 | 18.8% |
| $150,000 to $199,999 | 18 | 12.1% |
| $200,000+ | 10 | 6.7% |
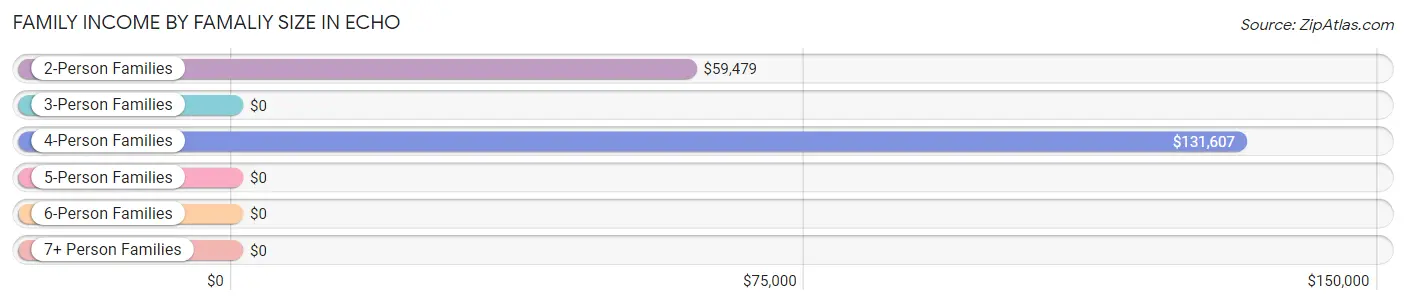
Family Income by Famaliy Size in Echo
4-person families (17 | 11.4%) account for the highest median family income in Echo with $131,607 per family, while 4-person families (17 | 11.4%) have the highest median income of $32,902 per family member.
| Income Bracket | # Families | Median Income |
| 2-Person Families | 83 (55.7%) | $59,479 |
| 3-Person Families | 28 (18.8%) | $0 |
| 4-Person Families | 17 (11.4%) | $131,607 |
| 5-Person Families | 21 (14.1%) | $0 |
| 6-Person Families | 0 (0.0%) | $0 |
| 7+ Person Families | 0 (0.0%) | $0 |
| Total | 149 (100.0%) | $71,442 |
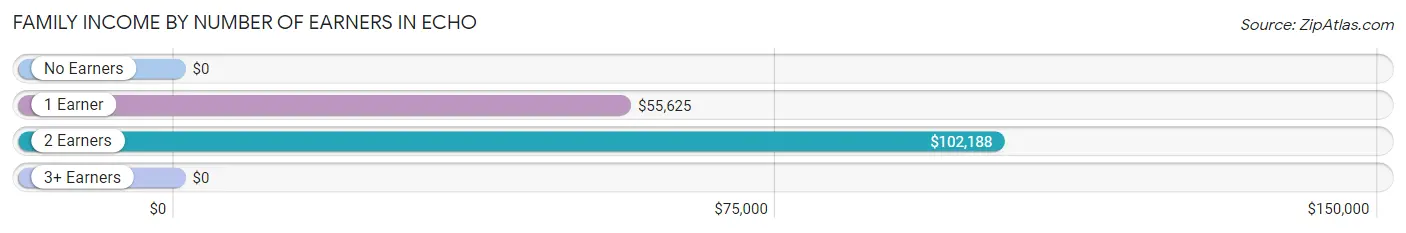
Family Income by Number of Earners in Echo
| Number of Earners | # Families | Median Income |
| No Earners | 11 (7.4%) | $0 |
| 1 Earner | 49 (32.9%) | $55,625 |
| 2 Earners | 83 (55.7%) | $102,188 |
| 3+ Earners | 6 (4.0%) | $0 |
| Total | 149 (100.0%) | $71,442 |
Household Income in Echo
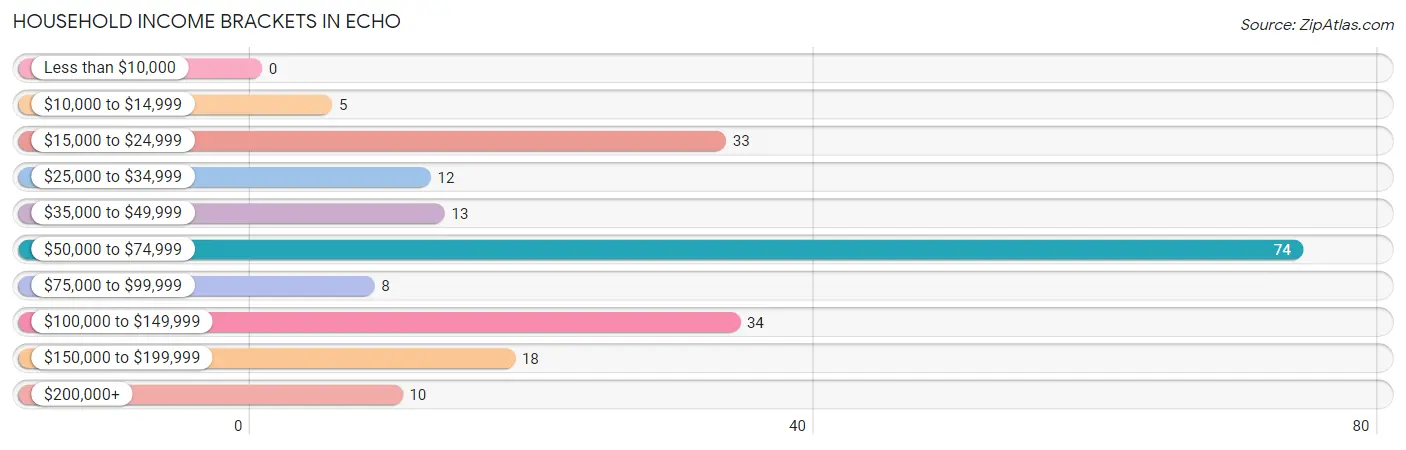
Household Income Brackets in Echo
With 74 households falling in the category, the $50,000 to $74,999 income range is the most frequent in Echo, accounting for 35.7% of all households.
| Income Bracket | # Households | % Households |
| Less than $10,000 | 0 | 0.0% |
| $10,000 to $14,999 | 5 | 2.4% |
| $15,000 to $24,999 | 33 | 15.9% |
| $25,000 to $34,999 | 12 | 5.8% |
| $35,000 to $49,999 | 13 | 6.3% |
| $50,000 to $74,999 | 74 | 35.7% |
| $75,000 to $99,999 | 8 | 3.9% |
| $100,000 to $149,999 | 34 | 16.4% |
| $150,000 to $199,999 | 18 | 8.7% |
| $200,000+ | 10 | 4.8% |
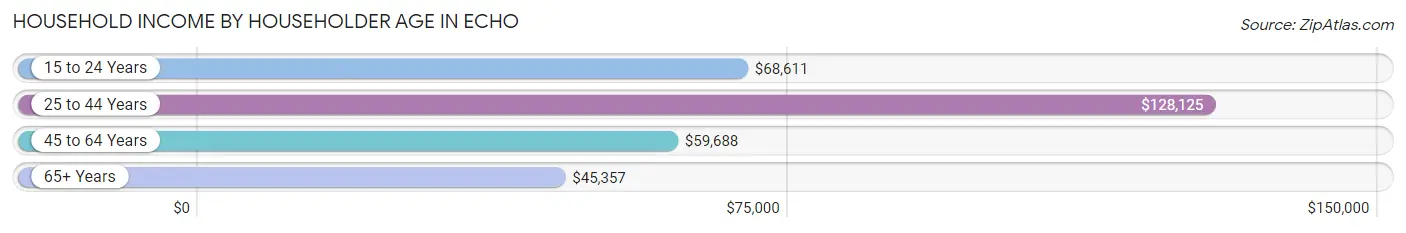
Household Income by Householder Age in Echo
The median household income in Echo is $67,578, with the highest median household income of $128,125 found in the 25 to 44 years age bracket for the primary householder. A total of 54 households (26.1%) fall into this category. Meanwhile, the 65+ years age bracket for the primary householder has the lowest median household income of $45,357, with 58 households (28.0%) in this group.
| Income Bracket | # Households | Median Income |
| 15 to 24 Years | 26 (12.6%) | $68,611 |
| 25 to 44 Years | 54 (26.1%) | $128,125 |
| 45 to 64 Years | 69 (33.3%) | $59,688 |
| 65+ Years | 58 (28.0%) | $45,357 |
| Total | 207 (100.0%) | $67,578 |
Poverty in Echo
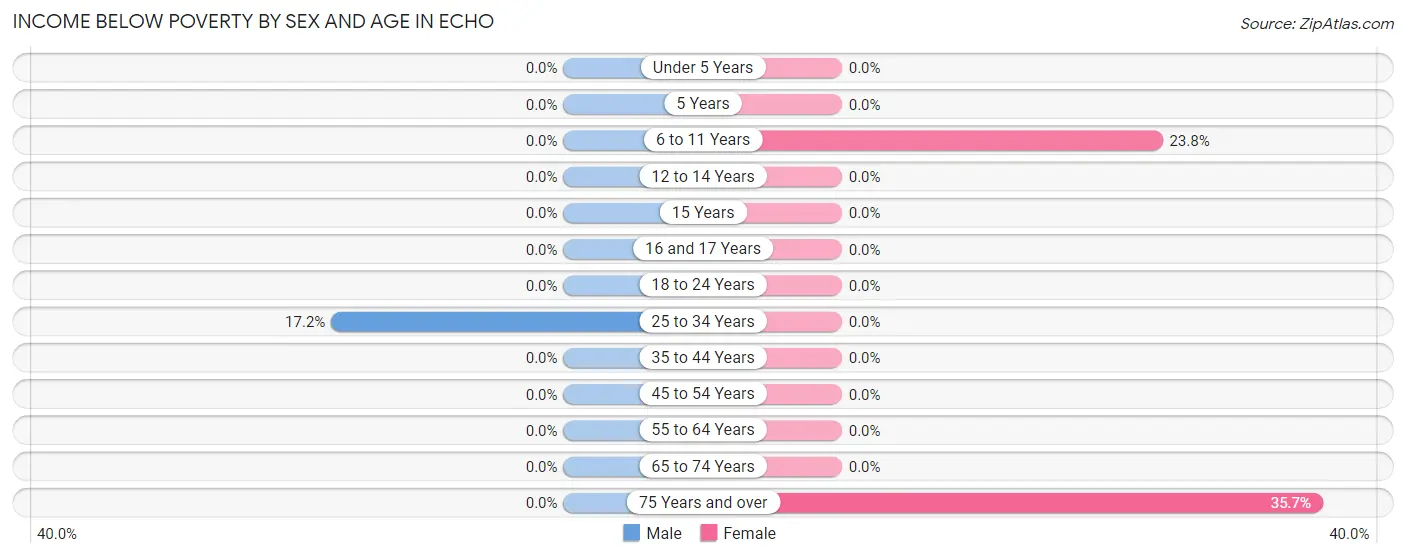
Income Below Poverty by Sex and Age in Echo
With 2.1% poverty level for males and 4.1% for females among the residents of Echo, 25 to 34 year old males and 75 year old and over females are the most vulnerable to poverty, with 5 males (17.2%) and 5 females (35.7%) in their respective age groups living below the poverty level.
| Age Bracket | Male | Female |
| Under 5 Years | 0 (0.0%) | 0 (0.0%) |
| 5 Years | 0 (0.0%) | 0 (0.0%) |
| 6 to 11 Years | 0 (0.0%) | 5 (23.8%) |
| 12 to 14 Years | 0 (0.0%) | 0 (0.0%) |
| 15 Years | 0 (0.0%) | 0 (0.0%) |
| 16 and 17 Years | 0 (0.0%) | 0 (0.0%) |
| 18 to 24 Years | 0 (0.0%) | 0 (0.0%) |
| 25 to 34 Years | 5 (17.2%) | 0 (0.0%) |
| 35 to 44 Years | 0 (0.0%) | 0 (0.0%) |
| 45 to 54 Years | 0 (0.0%) | 0 (0.0%) |
| 55 to 64 Years | 0 (0.0%) | 0 (0.0%) |
| 65 to 74 Years | 0 (0.0%) | 0 (0.0%) |
| 75 Years and over | 0 (0.0%) | 5 (35.7%) |
| Total | 5 (2.1%) | 10 (4.1%) |
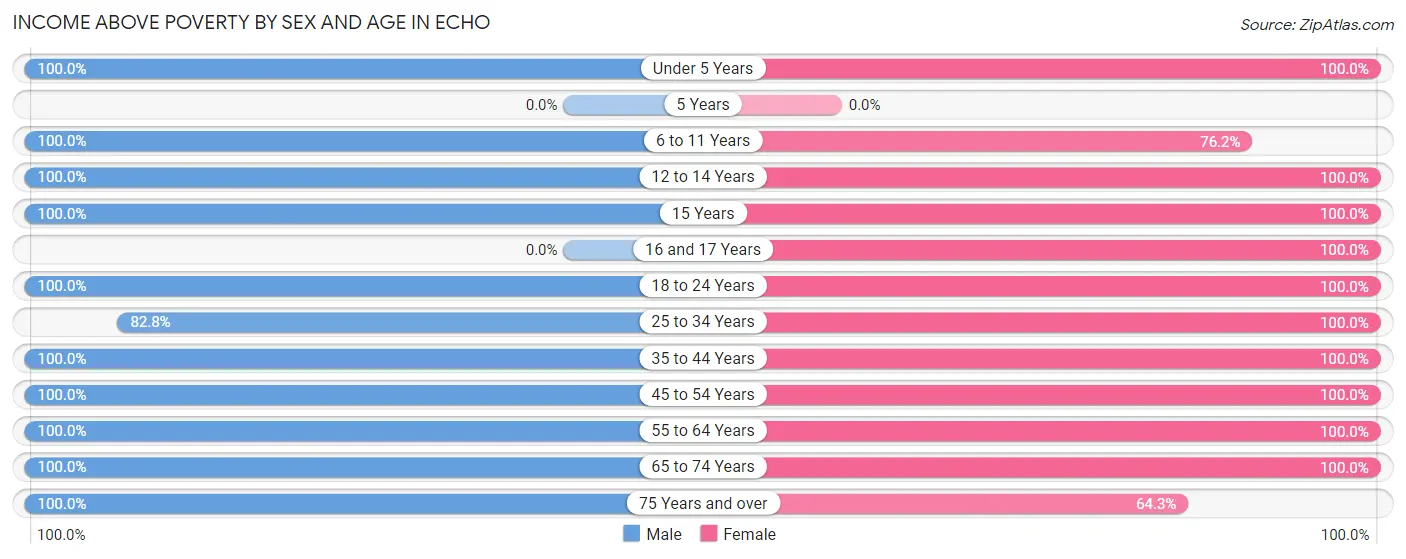
Income Above Poverty by Sex and Age in Echo
According to the poverty statistics in Echo, males aged under 5 years and females aged under 5 years are the age groups that are most secure financially, with 100.0% of males and 100.0% of females in these age groups living above the poverty line.
| Age Bracket | Male | Female |
| Under 5 Years | 13 (100.0%) | 19 (100.0%) |
| 5 Years | 0 (0.0%) | 0 (0.0%) |
| 6 to 11 Years | 30 (100.0%) | 16 (76.2%) |
| 12 to 14 Years | 10 (100.0%) | 10 (100.0%) |
| 15 Years | 5 (100.0%) | 5 (100.0%) |
| 16 and 17 Years | 0 (0.0%) | 9 (100.0%) |
| 18 to 24 Years | 17 (100.0%) | 11 (100.0%) |
| 25 to 34 Years | 24 (82.8%) | 34 (100.0%) |
| 35 to 44 Years | 20 (100.0%) | 38 (100.0%) |
| 45 to 54 Years | 21 (100.0%) | 26 (100.0%) |
| 55 to 64 Years | 45 (100.0%) | 30 (100.0%) |
| 65 to 74 Years | 38 (100.0%) | 27 (100.0%) |
| 75 Years and over | 6 (100.0%) | 9 (64.3%) |
| Total | 229 (97.9%) | 234 (95.9%) |
Income Below Poverty Among Married-Couple Families in Echo
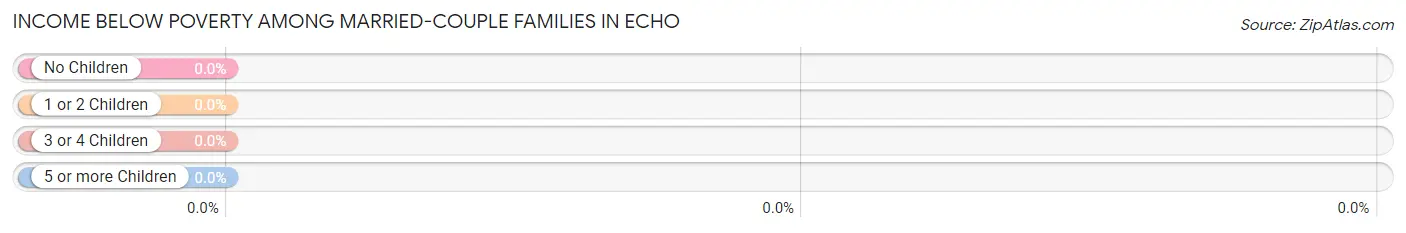
| Children | Above Poverty | Below Poverty |
| No Children | 82 (100.0%) | 0 (0.0%) |
| 1 or 2 Children | 23 (100.0%) | 0 (0.0%) |
| 3 or 4 Children | 21 (100.0%) | 0 (0.0%) |
| 5 or more Children | 0 (0.0%) | 0 (0.0%) |
| Total | 126 (100.0%) | 0 (0.0%) |
Income Below Poverty Among Single-Parent Households in Echo
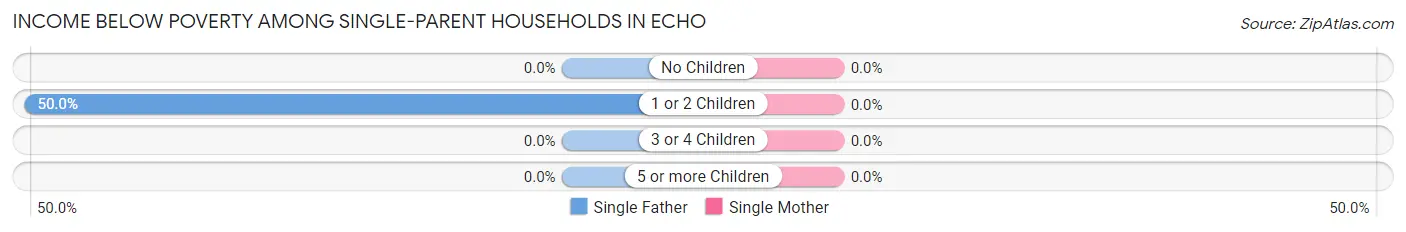
| Children | Single Father | Single Mother |
| No Children | 0 (0.0%) | 0 (0.0%) |
| 1 or 2 Children | 5 (50.0%) | 0 (0.0%) |
| 3 or 4 Children | 0 (0.0%) | 0 (0.0%) |
| 5 or more Children | 0 (0.0%) | 0 (0.0%) |
| Total | 5 (27.8%) | 0 (0.0%) |
Income Below Poverty Among Married-Couple vs Single-Parent Households in Echo
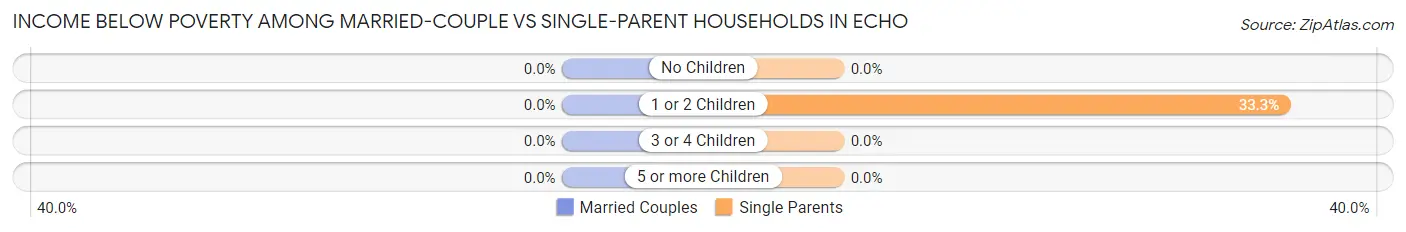
| Children | Married-Couple Families | Single-Parent Households |
| No Children | 0 (0.0%) | 0 (0.0%) |
| 1 or 2 Children | 0 (0.0%) | 5 (33.3%) |
| 3 or 4 Children | 0 (0.0%) | 0 (0.0%) |
| 5 or more Children | 0 (0.0%) | 0 (0.0%) |
| Total | 0 (0.0%) | 5 (21.7%) |
Race in Echo
The most populous races in Echo are White / Caucasian (413 | 86.4%), Hispanic or Latino (43 | 9.0%), and Two or more Races (43 | 9.0%).
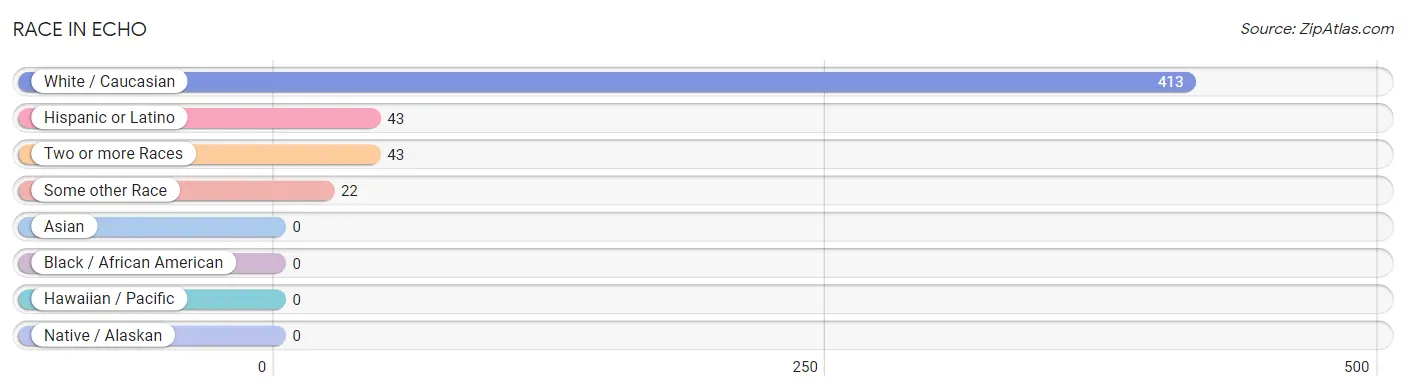
| Race | # Population | % Population |
| Asian | 0 | 0.0% |
| Black / African American | 0 | 0.0% |
| Hawaiian / Pacific | 0 | 0.0% |
| Hispanic or Latino | 43 | 9.0% |
| Native / Alaskan | 0 | 0.0% |
| White / Caucasian | 413 | 86.4% |
| Two or more Races | 43 | 9.0% |
| Some other Race | 22 | 4.6% |
| Total | 478 | 100.0% |
Ancestry in Echo
The most populous ancestries reported in Echo are German (92 | 19.3%), Irish (89 | 18.6%), English (58 | 12.1%), Mexican (38 | 8.0%), and American (36 | 7.5%), together accounting for 65.5% of all Echo residents.
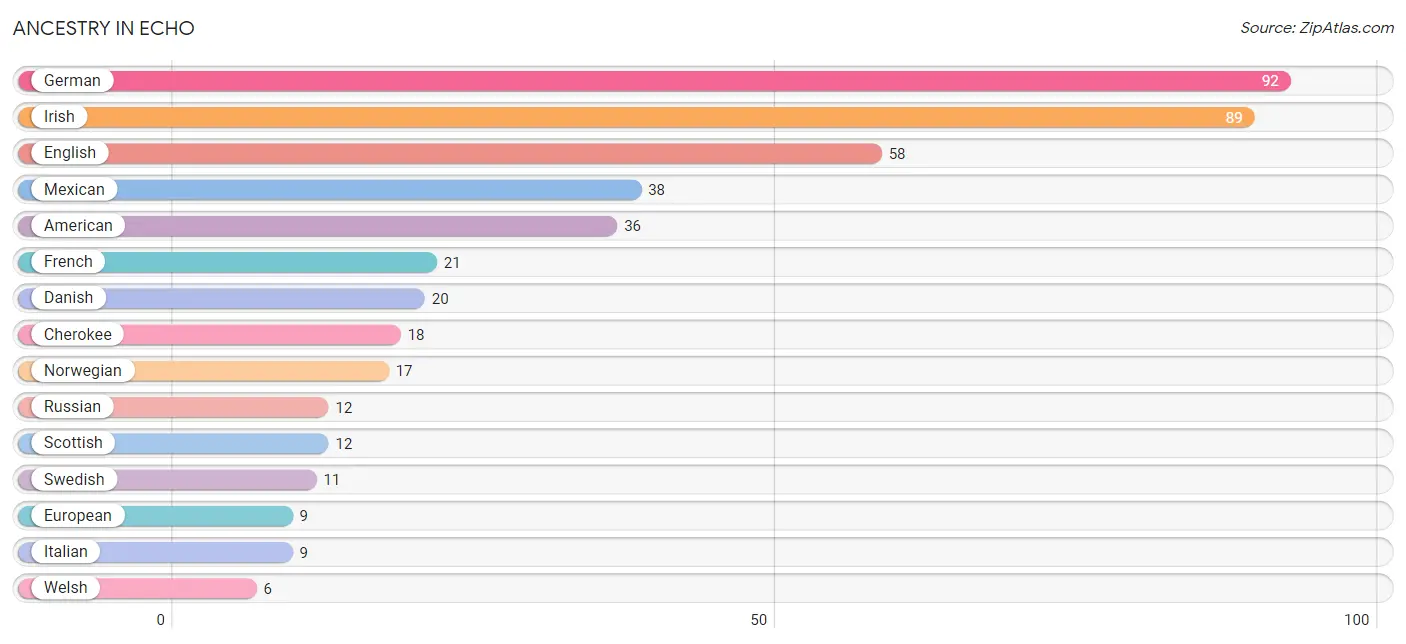
| Ancestry | # Population | % Population |
| American | 36 | 7.5% |
| British | 5 | 1.1% |
| Cherokee | 18 | 3.8% |
| Danish | 20 | 4.2% |
| Dutch | 4 | 0.8% |
| English | 58 | 12.1% |
| European | 9 | 1.9% |
| Finnish | 5 | 1.1% |
| French | 21 | 4.4% |
| French Canadian | 5 | 1.1% |
| German | 92 | 19.3% |
| Irish | 89 | 18.6% |
| Italian | 9 | 1.9% |
| Mexican | 38 | 8.0% |
| Norwegian | 17 | 3.6% |
| Puerto Rican | 5 | 1.1% |
| Russian | 12 | 2.5% |
| Scotch-Irish | 4 | 0.8% |
| Scottish | 12 | 2.5% |
| Swedish | 11 | 2.3% |
| Welsh | 6 | 1.3% | View All 21 Rows |
Immigrants in Echo
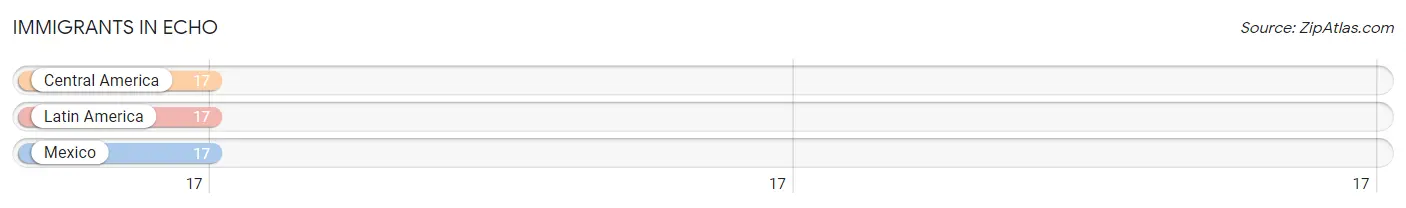
The most numerous immigrant groups reported in Echo came from Central America (17 | 3.6%), Latin America (17 | 3.6%), and Mexico (17 | 3.6%), together accounting for 10.7% of all Echo residents.
| Immigration Origin | # Population | % Population |
| Central America | 17 | 3.6% |
| Latin America | 17 | 3.6% |
| Mexico | 17 | 3.6% | View All 3 Rows |
Sex and Age in Echo
Sex and Age in Echo
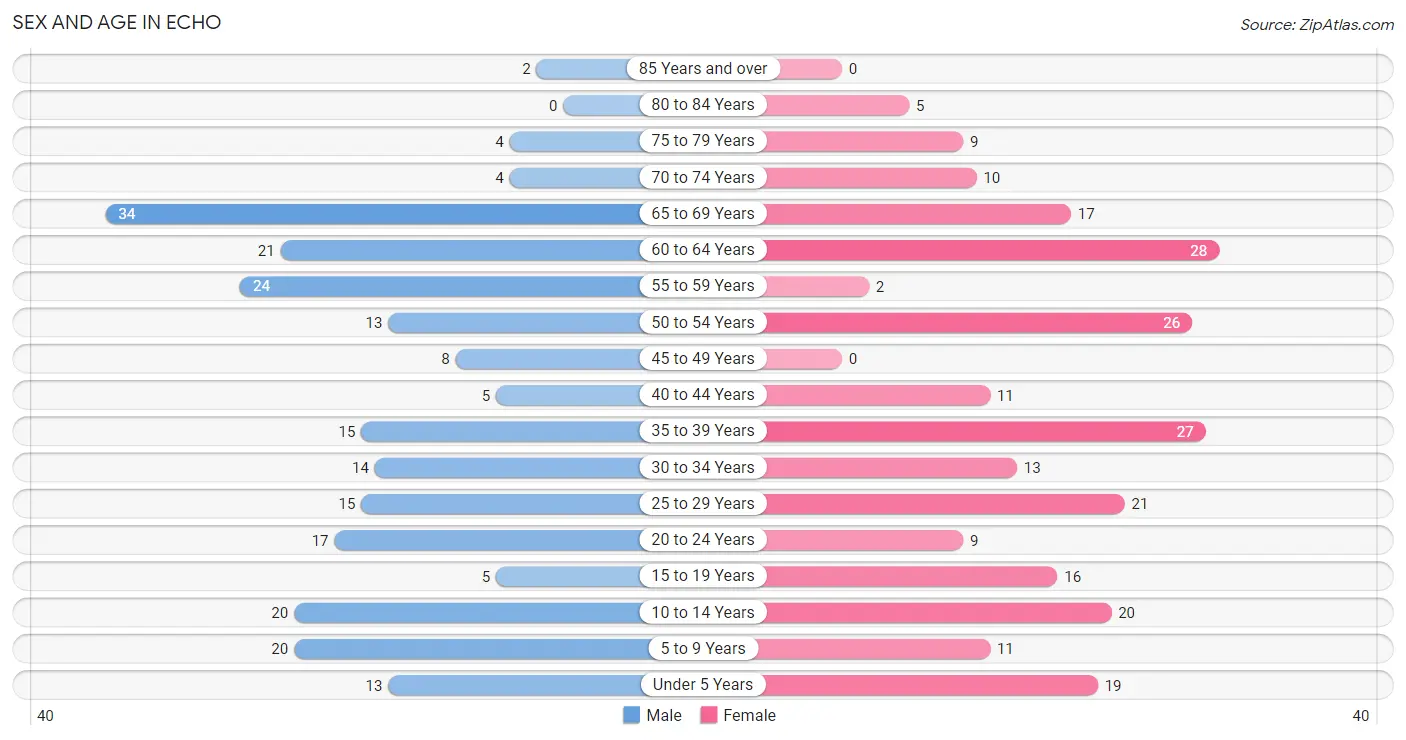
The most populous age groups in Echo are 65 to 69 Years (34 | 14.5%) for men and 60 to 64 Years (28 | 11.5%) for women.
| Age Bracket | Male | Female |
| Under 5 Years | 13 (5.6%) | 19 (7.8%) |
| 5 to 9 Years | 20 (8.6%) | 11 (4.5%) |
| 10 to 14 Years | 20 (8.6%) | 20 (8.2%) |
| 15 to 19 Years | 5 (2.1%) | 16 (6.6%) |
| 20 to 24 Years | 17 (7.3%) | 9 (3.7%) |
| 25 to 29 Years | 15 (6.4%) | 21 (8.6%) |
| 30 to 34 Years | 14 (6.0%) | 13 (5.3%) |
| 35 to 39 Years | 15 (6.4%) | 27 (11.1%) |
| 40 to 44 Years | 5 (2.1%) | 11 (4.5%) |
| 45 to 49 Years | 8 (3.4%) | 0 (0.0%) |
| 50 to 54 Years | 13 (5.6%) | 26 (10.7%) |
| 55 to 59 Years | 24 (10.3%) | 2 (0.8%) |
| 60 to 64 Years | 21 (9.0%) | 28 (11.5%) |
| 65 to 69 Years | 34 (14.5%) | 17 (7.0%) |
| 70 to 74 Years | 4 (1.7%) | 10 (4.1%) |
| 75 to 79 Years | 4 (1.7%) | 9 (3.7%) |
| 80 to 84 Years | 0 (0.0%) | 5 (2.1%) |
| 85 Years and over | 2 (0.9%) | 0 (0.0%) |
| Total | 234 (100.0%) | 244 (100.0%) |
Families and Households in Echo
Median Family Size in Echo
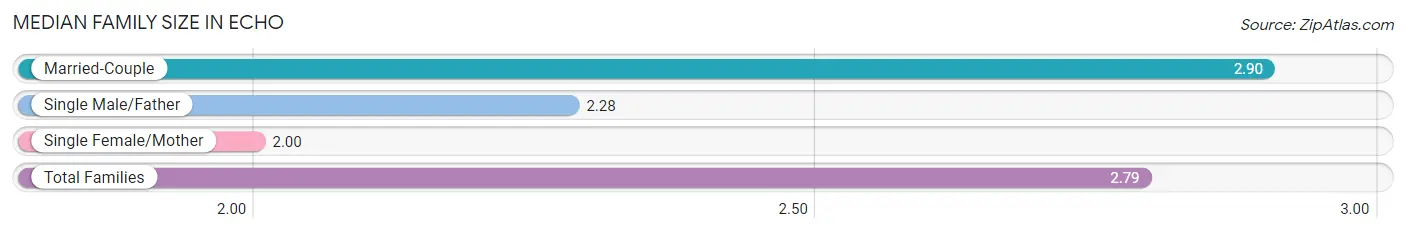
The median family size in Echo is 2.79 persons per family, with married-couple families (126 | 84.6%) accounting for the largest median family size of 2.9 persons per family. On the other hand, single female/mother families (5 | 3.4%) represent the smallest median family size with 2.00 persons per family.
| Family Type | # Families | Family Size |
| Married-Couple | 126 (84.6%) | 2.90 |
| Single Male/Father | 18 (12.1%) | 2.28 |
| Single Female/Mother | 5 (3.4%) | 2.00 |
| Total Families | 149 (100.0%) | 2.79 |
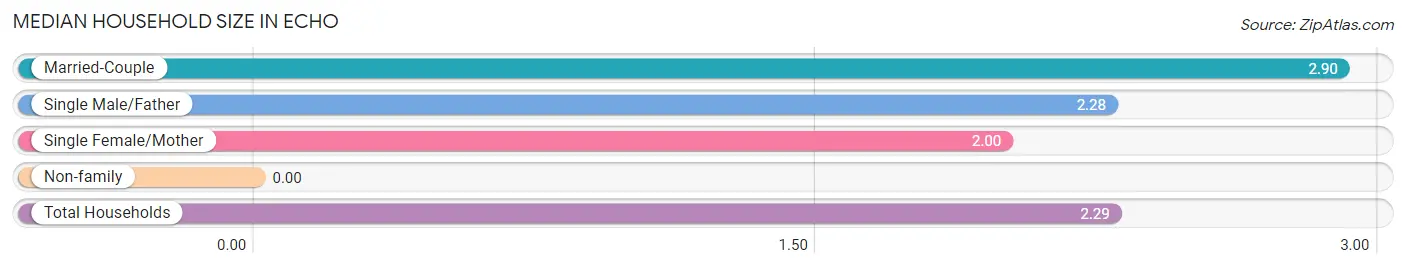
Median Household Size in Echo
| Household Type | # Households | Household Size |
| Married-Couple | 126 (60.9%) | 2.90 |
| Single Male/Father | 18 (8.7%) | 2.28 |
| Single Female/Mother | 5 (2.4%) | 2.00 |
| Non-family | 58 (28.0%) | - |
| Total Households | 207 (100.0%) | 2.29 |
Household Size by Marriage Status in Echo
Out of a total of 207 households in Echo, 149 (72.0%) are family households, while 58 (28.0%) are nonfamily households. The most numerous type of family households are 2-person households, comprising 83, and the most common type of nonfamily households are 1-person households, comprising 58.
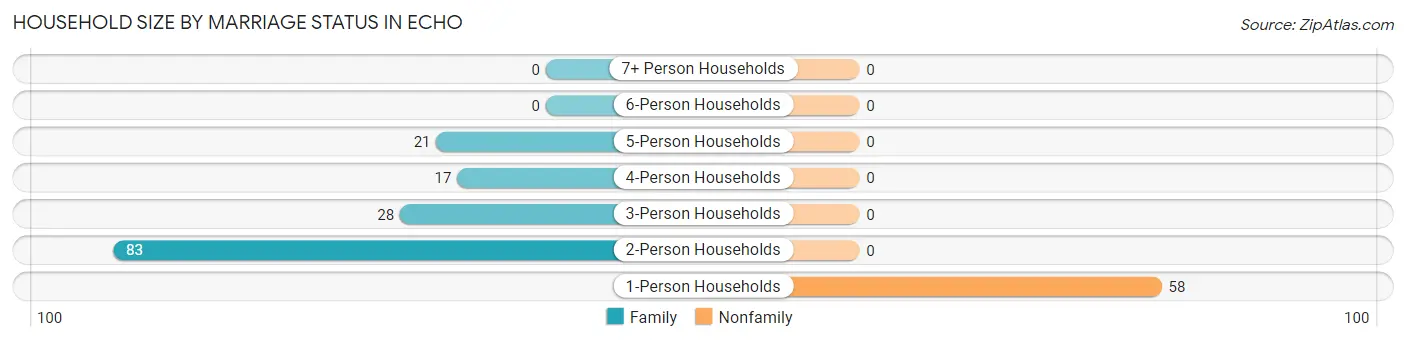
| Household Size | Family Households | Nonfamily Households |
| 1-Person Households | - | 58 (28.0%) |
| 2-Person Households | 83 (40.1%) | 0 (0.0%) |
| 3-Person Households | 28 (13.5%) | 0 (0.0%) |
| 4-Person Households | 17 (8.2%) | 0 (0.0%) |
| 5-Person Households | 21 (10.1%) | 0 (0.0%) |
| 6-Person Households | 0 (0.0%) | 0 (0.0%) |
| 7+ Person Households | 0 (0.0%) | 0 (0.0%) |
| Total | 149 (72.0%) | 58 (28.0%) |
Female Fertility in Echo
Fertility by Age in Echo
| Age Bracket | Women with Births | Births / 1,000 Women |
| 15 to 19 years | 0 (0.0%) | 0.0 |
| 20 to 34 years | 0 (0.0%) | 0.0 |
| 35 to 50 years | 0 (0.0%) | 0.0 |
| Total | 0 (0.0%) | 0.0 |
Fertility by Age by Marriage Status in Echo
| Age Bracket | Married | Unmarried |
| 15 to 19 years | 0 (0.0%) | 0 (0.0%) |
| 20 to 34 years | 0 (0.0%) | 0 (0.0%) |
| 35 to 50 years | 0 (0.0%) | 0 (0.0%) |
| Total | 0 (0.0%) | 0 (0.0%) |
Fertility by Education in Echo
| Educational Attainment | Women with Births | Births / 1,000 Women |
| Less than High School | 0 (0.0%) | 0.0 |
| High School Diploma | 0 (0.0%) | 0.0 |
| College or Associate's Degree | 0 (0.0%) | 0.0 |
| Bachelor's Degree | 0 (0.0%) | 0.0 |
| Graduate Degree | 0 (0.0%) | 0.0 |
| Total | 0 (0.0%) | 0.0 |
Fertility by Education by Marriage Status in Echo
| Educational Attainment | Married | Unmarried |
| Less than High School | 0 (0.0%) | 0 (0.0%) |
| High School Diploma | 0 (0.0%) | 0 (0.0%) |
| College or Associate's Degree | 0 (0.0%) | 0 (0.0%) |
| Bachelor's Degree | 0 (0.0%) | 0 (0.0%) |
| Graduate Degree | 0 (0.0%) | 0 (0.0%) |
| Total | 0 (0.0%) | 0 (0.0%) |
Employment Characteristics in Echo
Employment by Class of Employer in Echo
Among the 215 employed individuals in Echo, private company employees (156 | 72.6%), not-for-profit organizations (19 | 8.8%), and local government employees (19 | 8.8%) make up the most common classes of employment.
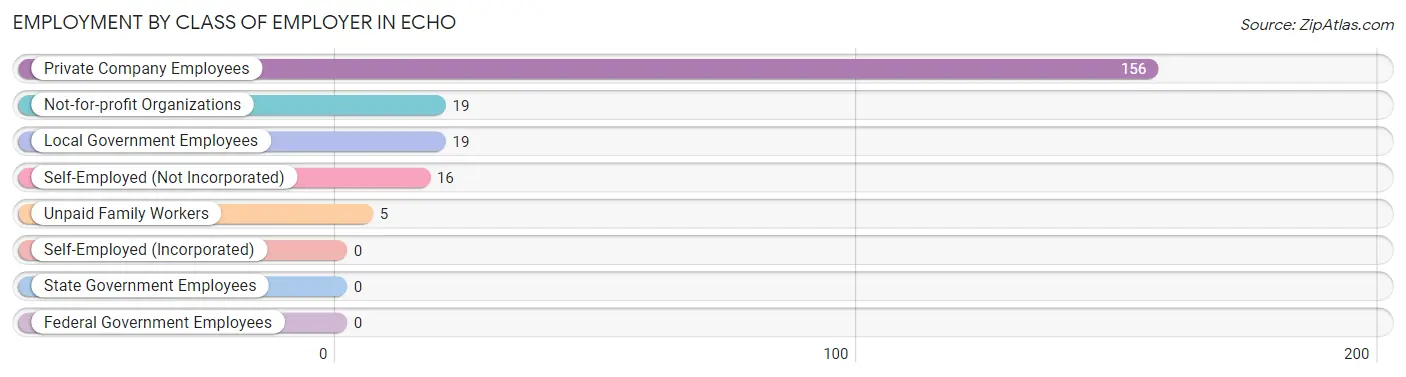
| Employer Class | # Employees | % Employees |
| Private Company Employees | 156 | 72.6% |
| Self-Employed (Incorporated) | 0 | 0.0% |
| Self-Employed (Not Incorporated) | 16 | 7.4% |
| Not-for-profit Organizations | 19 | 8.8% |
| Local Government Employees | 19 | 8.8% |
| State Government Employees | 0 | 0.0% |
| Federal Government Employees | 0 | 0.0% |
| Unpaid Family Workers | 5 | 2.3% |
| Total | 215 | 100.0% |
Employment Status by Age in Echo
According to the labor force statistics for Echo, out of the total population over 16 years of age (365), 67.1% or 245 individuals are in the labor force, with 8.2% or 20 of them unemployed. The age group with the highest labor force participation rate is 20 to 24 years, with 100.0% or 26 individuals in the labor force. Within the labor force, the 60 to 64 years age range has the highest percentage of unemployed individuals, with 41.9% or 13 of them being unemployed.
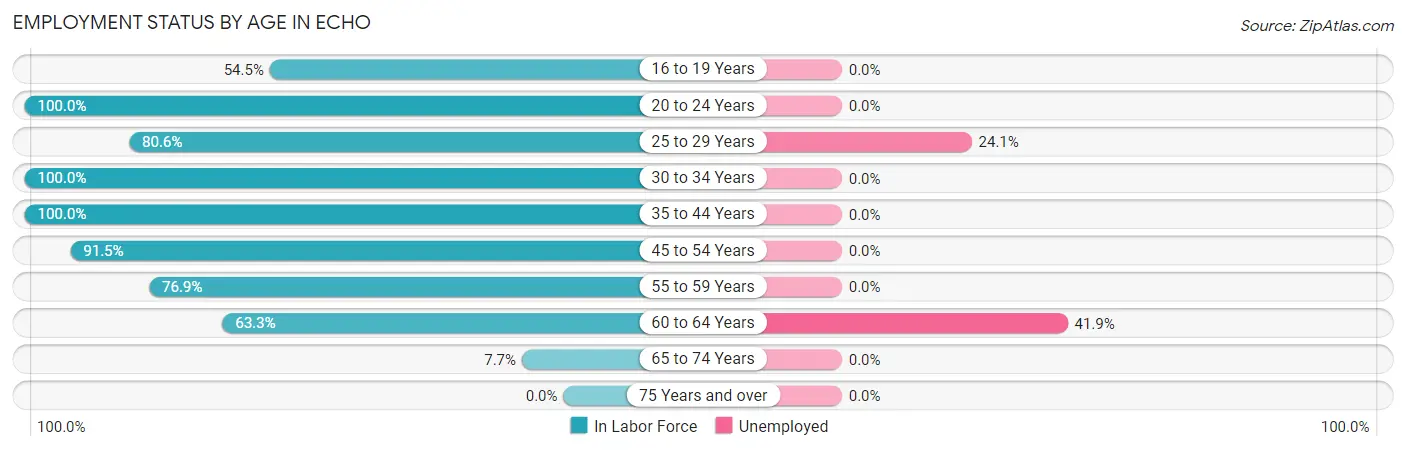
| Age Bracket | In Labor Force | Unemployed |
| 16 to 19 Years | 6 (54.5%) | 0 (0.0%) |
| 20 to 24 Years | 26 (100.0%) | 0 (0.0%) |
| 25 to 29 Years | 29 (80.6%) | 7 (24.1%) |
| 30 to 34 Years | 27 (100.0%) | 0 (0.0%) |
| 35 to 44 Years | 58 (100.0%) | 0 (0.0%) |
| 45 to 54 Years | 43 (91.5%) | 0 (0.0%) |
| 55 to 59 Years | 20 (76.9%) | 0 (0.0%) |
| 60 to 64 Years | 31 (63.3%) | 13 (41.9%) |
| 65 to 74 Years | 5 (7.7%) | 0 (0.0%) |
| 75 Years and over | 0 (0.0%) | 0 (0.0%) |
| Total | 245 (67.1%) | 20 (8.2%) |
Employment Status by Educational Attainment in Echo
According to labor force statistics for Echo, 85.6% of individuals (208) out of the total population between 25 and 64 years of age (243) are in the labor force, with 9.6% or 20 of them being unemployed. The group with the highest labor force participation rate are those with the educational attainment of bachelor's degree or higher, with 100.0% or 37 individuals in the labor force. Within the labor force, individuals with bachelor's degree or higher education have the highest percentage of unemployment, with 35.1% or 13 of them being unemployed.
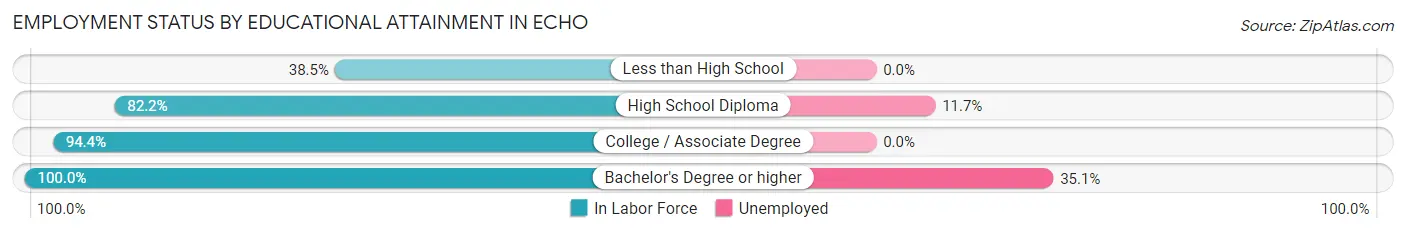
| Educational Attainment | In Labor Force | Unemployed |
| Less than High School | 10 (38.5%) | 0 (0.0%) |
| High School Diploma | 60 (82.2%) | 9 (11.7%) |
| College / Associate Degree | 101 (94.4%) | 0 (0.0%) |
| Bachelor's Degree or higher | 37 (100.0%) | 13 (35.1%) |
| Total | 208 (85.6%) | 23 (9.6%) |
Employment Occupations by Sex in Echo
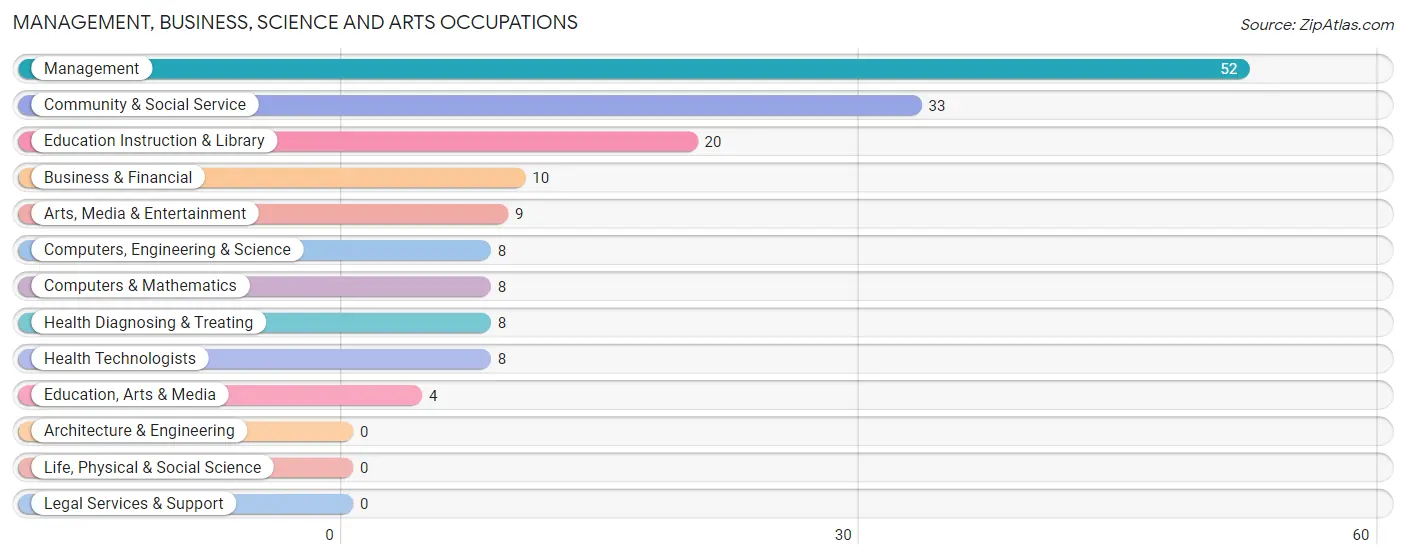
Management, Business, Science and Arts Occupations
The most common Management, Business, Science and Arts occupations in Echo are Management (52 | 23.1%), Community & Social Service (33 | 14.7%), Education Instruction & Library (20 | 8.9%), Business & Financial (10 | 4.4%), and Arts, Media & Entertainment (9 | 4.0%).
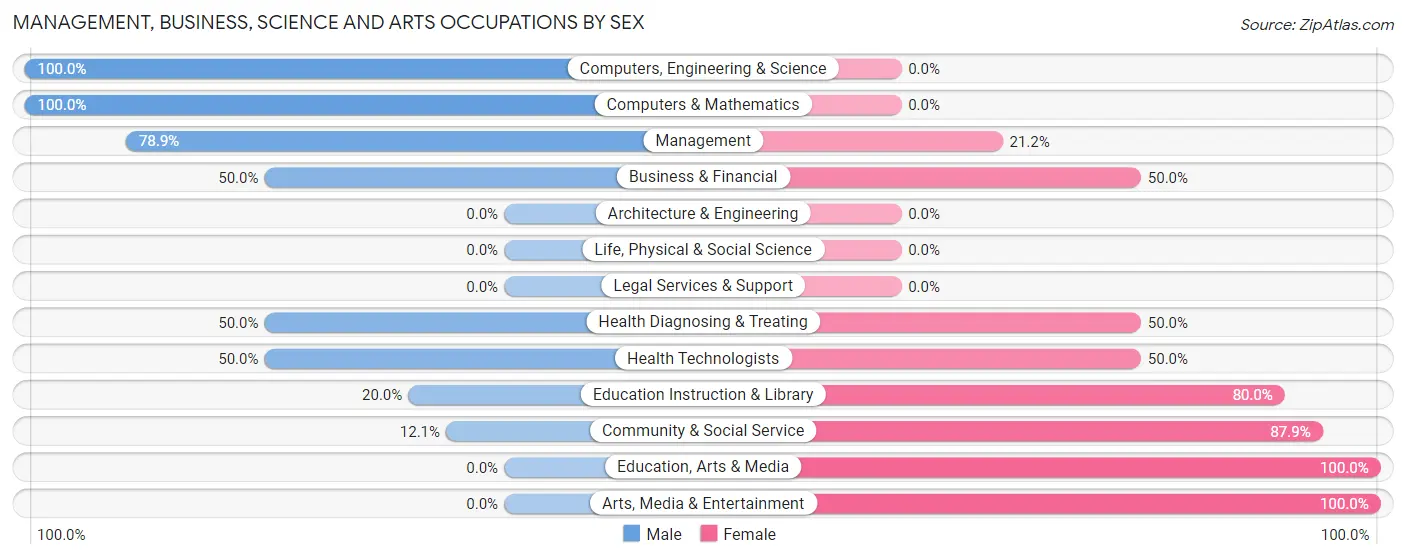
Management, Business, Science and Arts Occupations by Sex
Within the Management, Business, Science and Arts occupations in Echo, the most male-oriented occupations are Computers, Engineering & Science (100.0%), Computers & Mathematics (100.0%), and Management (78.8%), while the most female-oriented occupations are Education, Arts & Media (100.0%), Arts, Media & Entertainment (100.0%), and Community & Social Service (87.9%).
| Occupation | Male | Female |
| Management | 41 (78.8%) | 11 (21.1%) |
| Business & Financial | 5 (50.0%) | 5 (50.0%) |
| Computers, Engineering & Science | 8 (100.0%) | 0 (0.0%) |
| Computers & Mathematics | 8 (100.0%) | 0 (0.0%) |
| Architecture & Engineering | 0 (0.0%) | 0 (0.0%) |
| Life, Physical & Social Science | 0 (0.0%) | 0 (0.0%) |
| Community & Social Service | 4 (12.1%) | 29 (87.9%) |
| Education, Arts & Media | 0 (0.0%) | 4 (100.0%) |
| Legal Services & Support | 0 (0.0%) | 0 (0.0%) |
| Education Instruction & Library | 4 (20.0%) | 16 (80.0%) |
| Arts, Media & Entertainment | 0 (0.0%) | 9 (100.0%) |
| Health Diagnosing & Treating | 4 (50.0%) | 4 (50.0%) |
| Health Technologists | 4 (50.0%) | 4 (50.0%) |
| Total (Category) | 62 (55.9%) | 49 (44.1%) |
| Total (Overall) | 114 (50.7%) | 111 (49.3%) |
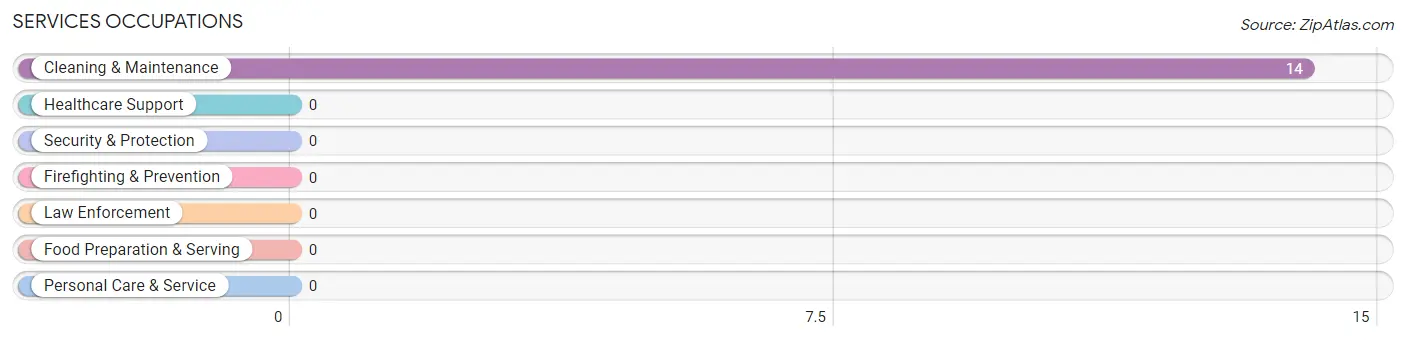
Services Occupations
The most common Services occupations in Echo are , and Cleaning & Maintenance (14 | 6.2%).
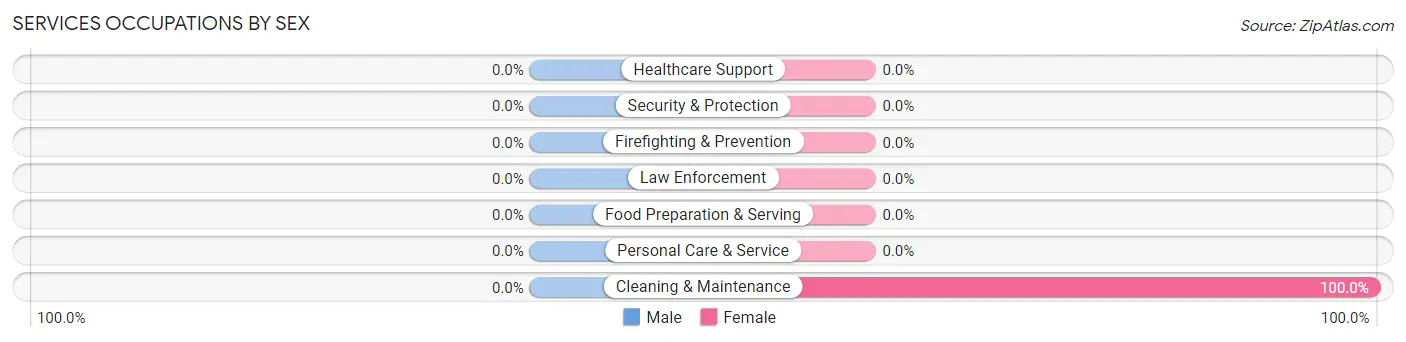
Services Occupations by Sex
| Occupation | Male | Female |
| Healthcare Support | 0 (0.0%) | 0 (0.0%) |
| Security & Protection | 0 (0.0%) | 0 (0.0%) |
| Firefighting & Prevention | 0 (0.0%) | 0 (0.0%) |
| Law Enforcement | 0 (0.0%) | 0 (0.0%) |
| Food Preparation & Serving | 0 (0.0%) | 0 (0.0%) |
| Cleaning & Maintenance | 0 (0.0%) | 14 (100.0%) |
| Personal Care & Service | 0 (0.0%) | 0 (0.0%) |
| Total (Category) | 0 (0.0%) | 14 (100.0%) |
| Total (Overall) | 114 (50.7%) | 111 (49.3%) |
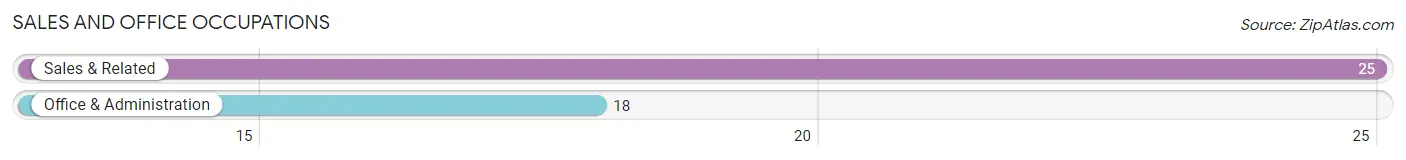
Sales and Office Occupations
The most common Sales and Office occupations in Echo are Sales & Related (25 | 11.1%), and Office & Administration (18 | 8.0%).
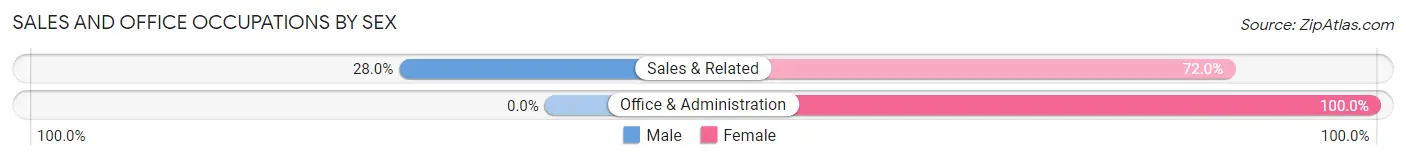
Sales and Office Occupations by Sex
| Occupation | Male | Female |
| Sales & Related | 7 (28.0%) | 18 (72.0%) |
| Office & Administration | 0 (0.0%) | 18 (100.0%) |
| Total (Category) | 7 (16.3%) | 36 (83.7%) |
| Total (Overall) | 114 (50.7%) | 111 (49.3%) |
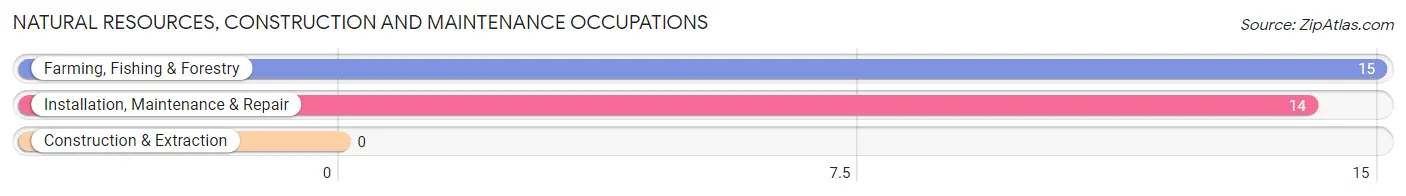
Natural Resources, Construction and Maintenance Occupations
The most common Natural Resources, Construction and Maintenance occupations in Echo are Farming, Fishing & Forestry (15 | 6.7%), and Installation, Maintenance & Repair (14 | 6.2%).
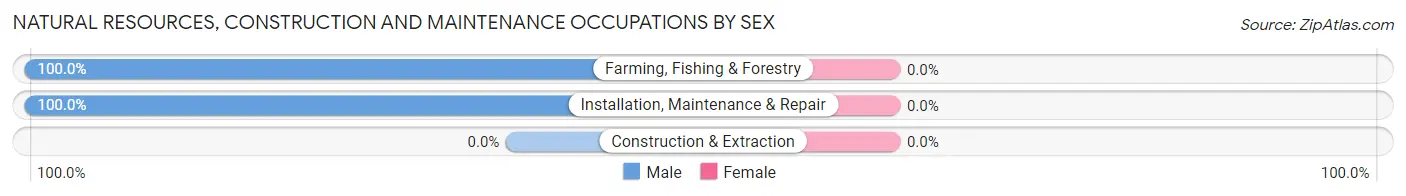
Natural Resources, Construction and Maintenance Occupations by Sex
| Occupation | Male | Female |
| Farming, Fishing & Forestry | 15 (100.0%) | 0 (0.0%) |
| Construction & Extraction | 0 (0.0%) | 0 (0.0%) |
| Installation, Maintenance & Repair | 14 (100.0%) | 0 (0.0%) |
| Total (Category) | 29 (100.0%) | 0 (0.0%) |
| Total (Overall) | 114 (50.7%) | 111 (49.3%) |
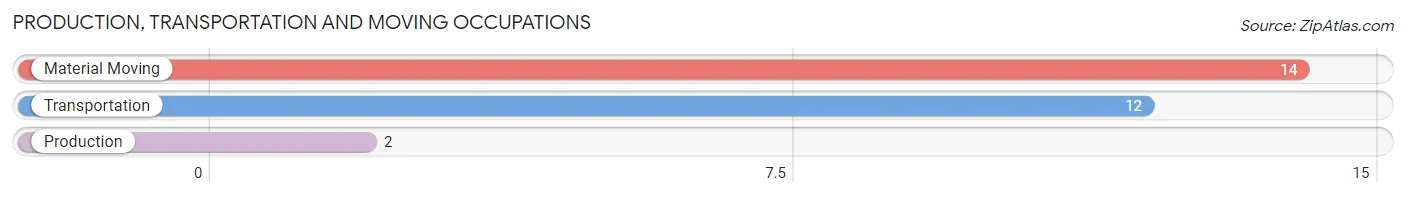
Production, Transportation and Moving Occupations
The most common Production, Transportation and Moving occupations in Echo are Material Moving (14 | 6.2%), Transportation (12 | 5.3%), and Production (2 | 0.9%).
Production, Transportation and Moving Occupations by Sex
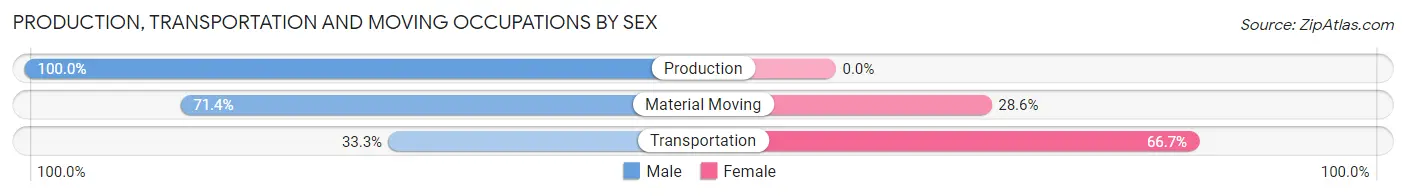
| Occupation | Male | Female |
| Production | 2 (100.0%) | 0 (0.0%) |
| Transportation | 4 (33.3%) | 8 (66.7%) |
| Material Moving | 10 (71.4%) | 4 (28.6%) |
| Total (Category) | 16 (57.1%) | 12 (42.9%) |
| Total (Overall) | 114 (50.7%) | 111 (49.3%) |
Employment Industries by Sex in Echo
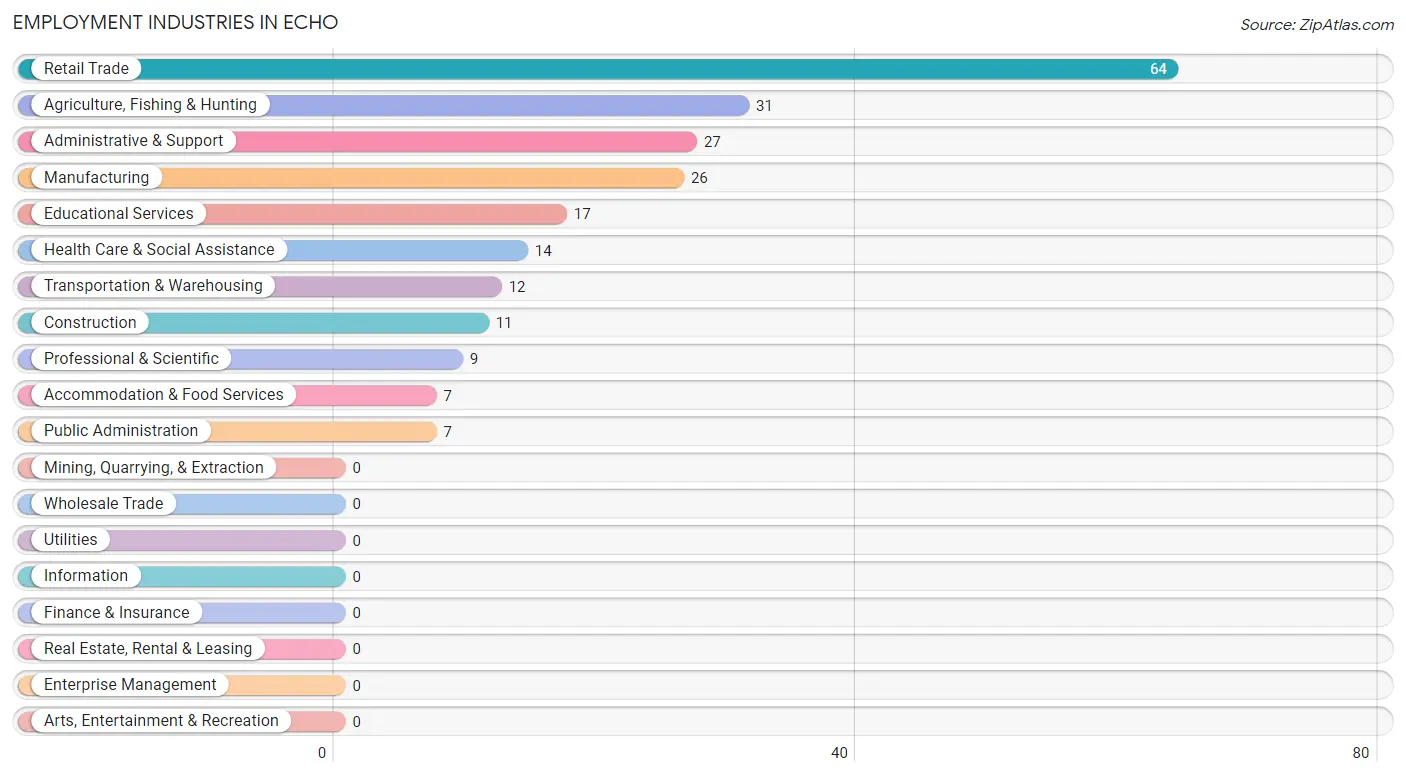
Employment Industries in Echo
The major employment industries in Echo include Retail Trade (64 | 28.4%), Agriculture, Fishing & Hunting (31 | 13.8%), Administrative & Support (27 | 12.0%), Manufacturing (26 | 11.6%), and Educational Services (17 | 7.6%).
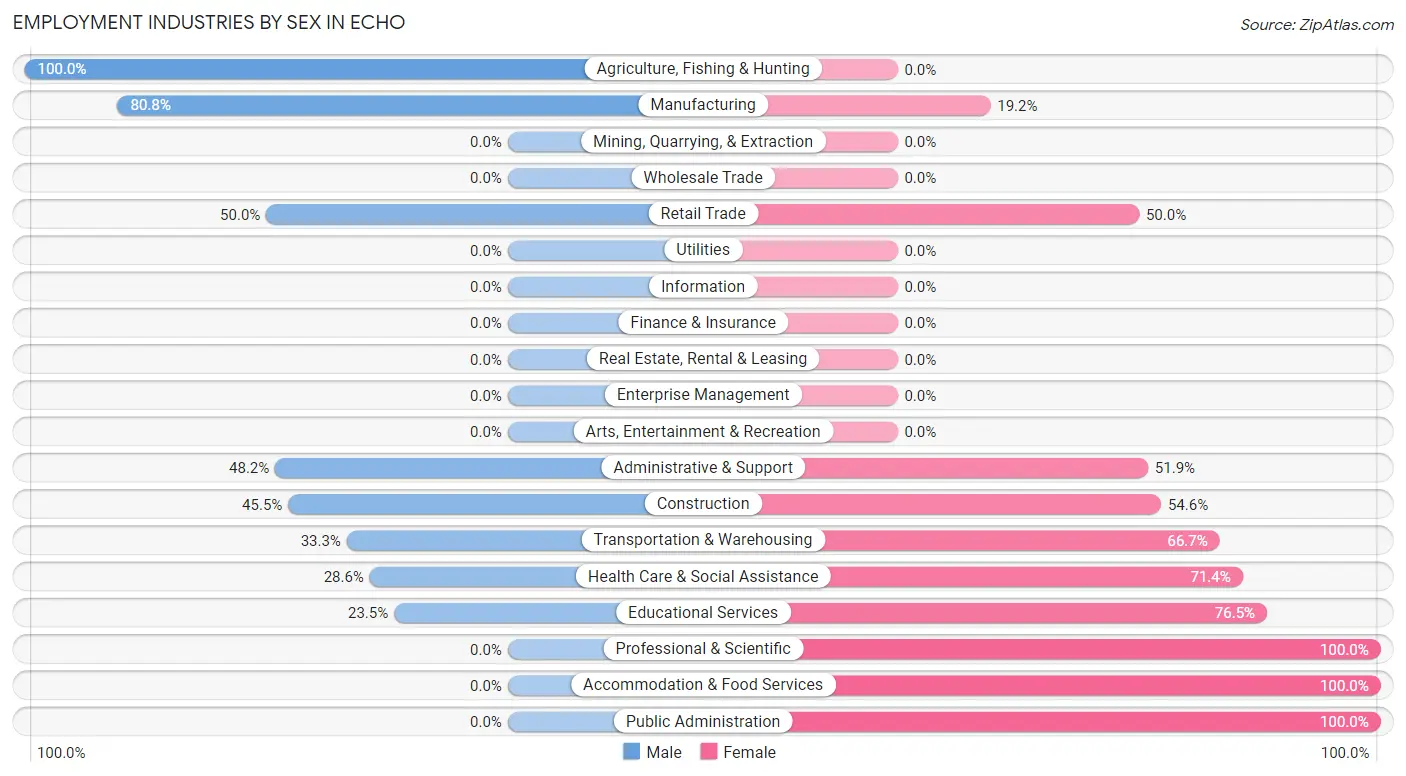
Employment Industries by Sex in Echo
The Echo industries that see more men than women are Agriculture, Fishing & Hunting (100.0%), Manufacturing (80.8%), and Retail Trade (50.0%), whereas the industries that tend to have a higher number of women are Professional & Scientific (100.0%), Accommodation & Food Services (100.0%), and Public Administration (100.0%).
| Industry | Male | Female |
| Agriculture, Fishing & Hunting | 31 (100.0%) | 0 (0.0%) |
| Mining, Quarrying, & Extraction | 0 (0.0%) | 0 (0.0%) |
| Construction | 5 (45.5%) | 6 (54.5%) |
| Manufacturing | 21 (80.8%) | 5 (19.2%) |
| Wholesale Trade | 0 (0.0%) | 0 (0.0%) |
| Retail Trade | 32 (50.0%) | 32 (50.0%) |
| Transportation & Warehousing | 4 (33.3%) | 8 (66.7%) |
| Utilities | 0 (0.0%) | 0 (0.0%) |
| Information | 0 (0.0%) | 0 (0.0%) |
| Finance & Insurance | 0 (0.0%) | 0 (0.0%) |
| Real Estate, Rental & Leasing | 0 (0.0%) | 0 (0.0%) |
| Professional & Scientific | 0 (0.0%) | 9 (100.0%) |
| Enterprise Management | 0 (0.0%) | 0 (0.0%) |
| Administrative & Support | 13 (48.1%) | 14 (51.8%) |
| Educational Services | 4 (23.5%) | 13 (76.5%) |
| Health Care & Social Assistance | 4 (28.6%) | 10 (71.4%) |
| Arts, Entertainment & Recreation | 0 (0.0%) | 0 (0.0%) |
| Accommodation & Food Services | 0 (0.0%) | 7 (100.0%) |
| Public Administration | 0 (0.0%) | 7 (100.0%) |
| Total | 114 (50.7%) | 111 (49.3%) |
Education in Echo
School Enrollment in Echo
The most common levels of schooling among the 111 students in Echo are middle school (30 | 27.0%), elementary school (26 | 23.4%), and high school (24 | 21.6%).
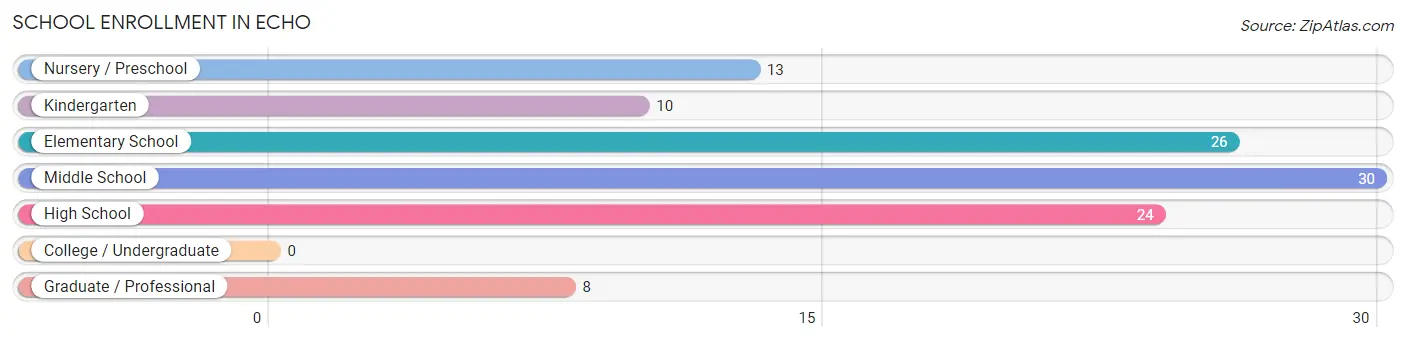
| School Level | # Students | % Students |
| Nursery / Preschool | 13 | 11.7% |
| Kindergarten | 10 | 9.0% |
| Elementary School | 26 | 23.4% |
| Middle School | 30 | 27.0% |
| High School | 24 | 21.6% |
| College / Undergraduate | 0 | 0.0% |
| Graduate / Professional | 8 | 7.2% |
| Total | 111 | 100.0% |
School Enrollment by Age by Funding Source in Echo
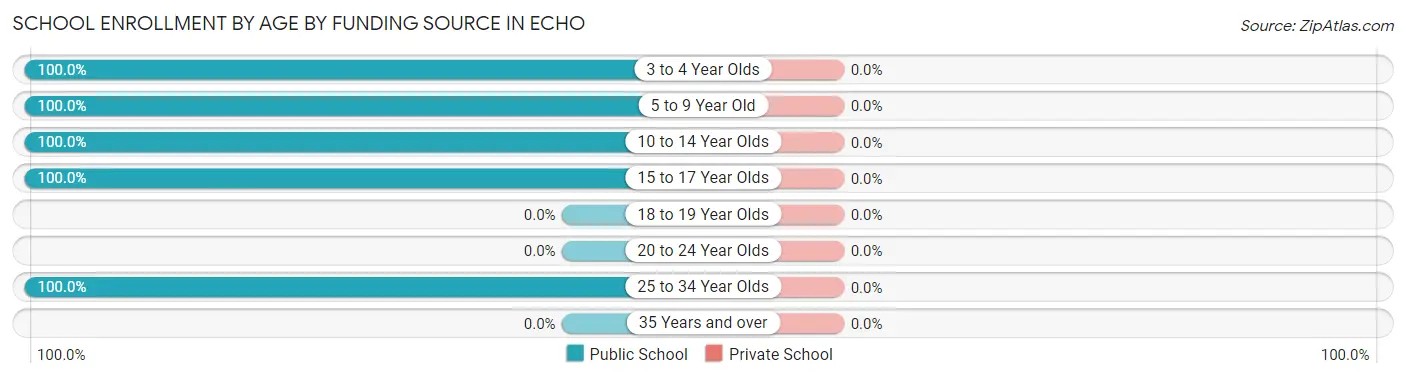
| Age Bracket | Public School | Private School |
| 3 to 4 Year Olds | 13 (100.0%) | 0 (0.0%) |
| 5 to 9 Year Old | 31 (100.0%) | 0 (0.0%) |
| 10 to 14 Year Olds | 40 (100.0%) | 0 (0.0%) |
| 15 to 17 Year Olds | 19 (100.0%) | 0 (0.0%) |
| 18 to 19 Year Olds | 0 (0.0%) | 0 (0.0%) |
| 20 to 24 Year Olds | 0 (0.0%) | 0 (0.0%) |
| 25 to 34 Year Olds | 8 (100.0%) | 0 (0.0%) |
| 35 Years and over | 0 (0.0%) | 0 (0.0%) |
| Total | 111 (100.0%) | 0 (0.0%) |
Educational Attainment by Field of Study in Echo
Science & technology (30 | 55.6%), social sciences (13 | 24.1%), arts & humanities (5 | 9.3%), psychology (4 | 7.4%), and liberal arts & history (2 | 3.7%) are the most common fields of study among 54 individuals in Echo who have obtained a bachelor's degree or higher.
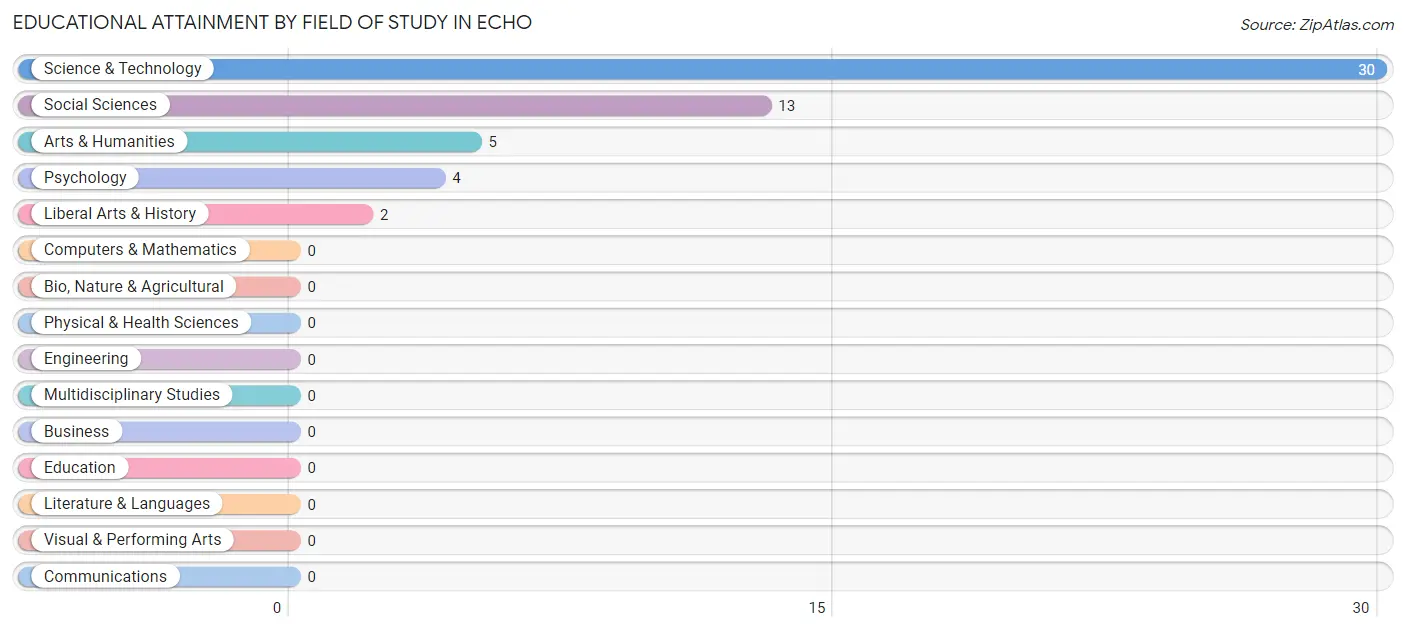
| Field of Study | # Graduates | % Graduates |
| Computers & Mathematics | 0 | 0.0% |
| Bio, Nature & Agricultural | 0 | 0.0% |
| Physical & Health Sciences | 0 | 0.0% |
| Psychology | 4 | 7.4% |
| Social Sciences | 13 | 24.1% |
| Engineering | 0 | 0.0% |
| Multidisciplinary Studies | 0 | 0.0% |
| Science & Technology | 30 | 55.6% |
| Business | 0 | 0.0% |
| Education | 0 | 0.0% |
| Literature & Languages | 0 | 0.0% |
| Liberal Arts & History | 2 | 3.7% |
| Visual & Performing Arts | 0 | 0.0% |
| Communications | 0 | 0.0% |
| Arts & Humanities | 5 | 9.3% |
| Total | 54 | 100.0% |
Transportation & Commute in Echo
Vehicle Availability by Sex in Echo
The most prevalent vehicle ownership categories in Echo are males with 2 vehicles (51, accounting for 46.4%) and females with 2 vehicles (44, making up 48.6%).
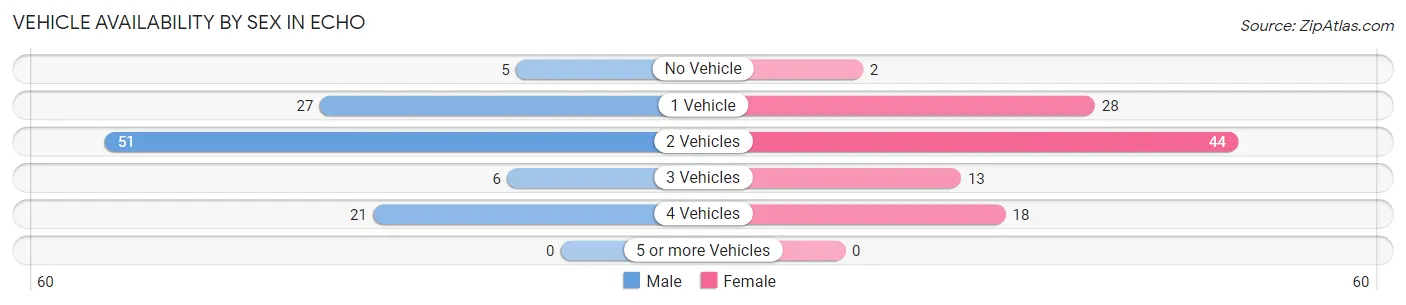
| Vehicles Available | Male | Female |
| No Vehicle | 5 (4.5%) | 2 (1.9%) |
| 1 Vehicle | 27 (24.5%) | 28 (26.7%) |
| 2 Vehicles | 51 (46.4%) | 44 (41.9%) |
| 3 Vehicles | 6 (5.4%) | 13 (12.4%) |
| 4 Vehicles | 21 (19.1%) | 18 (17.1%) |
| 5 or more Vehicles | 0 (0.0%) | 0 (0.0%) |
| Total | 110 (100.0%) | 105 (100.0%) |
Commute Time in Echo
The most frequently occuring commute durations in Echo are 30 to 34 minutes (42 commuters, 19.5%), less than 5 minutes (41 commuters, 19.1%), and 15 to 19 minutes (40 commuters, 18.6%).
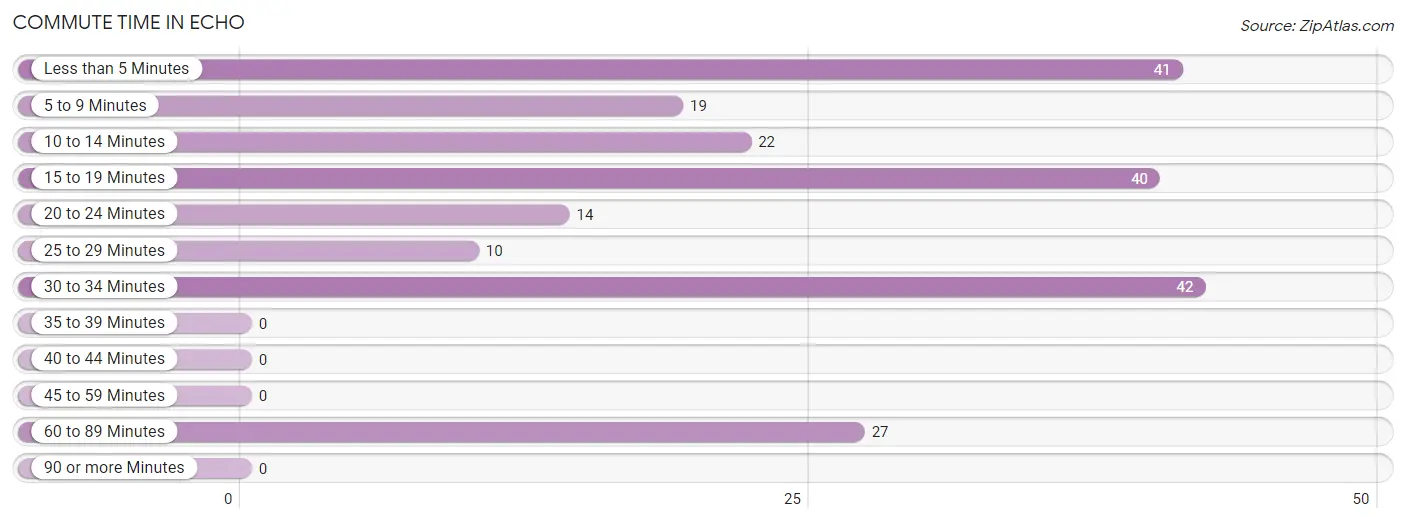
| Commute Time | # Commuters | % Commuters |
| Less than 5 Minutes | 41 | 19.1% |
| 5 to 9 Minutes | 19 | 8.8% |
| 10 to 14 Minutes | 22 | 10.2% |
| 15 to 19 Minutes | 40 | 18.6% |
| 20 to 24 Minutes | 14 | 6.5% |
| 25 to 29 Minutes | 10 | 4.6% |
| 30 to 34 Minutes | 42 | 19.5% |
| 35 to 39 Minutes | 0 | 0.0% |
| 40 to 44 Minutes | 0 | 0.0% |
| 45 to 59 Minutes | 0 | 0.0% |
| 60 to 89 Minutes | 27 | 12.6% |
| 90 or more Minutes | 0 | 0.0% |
Commute Time by Sex in Echo
The most common commute times in Echo are 30 to 34 minutes (31 commuters, 28.2%) for males and less than 5 minutes (26 commuters, 24.8%) for females.
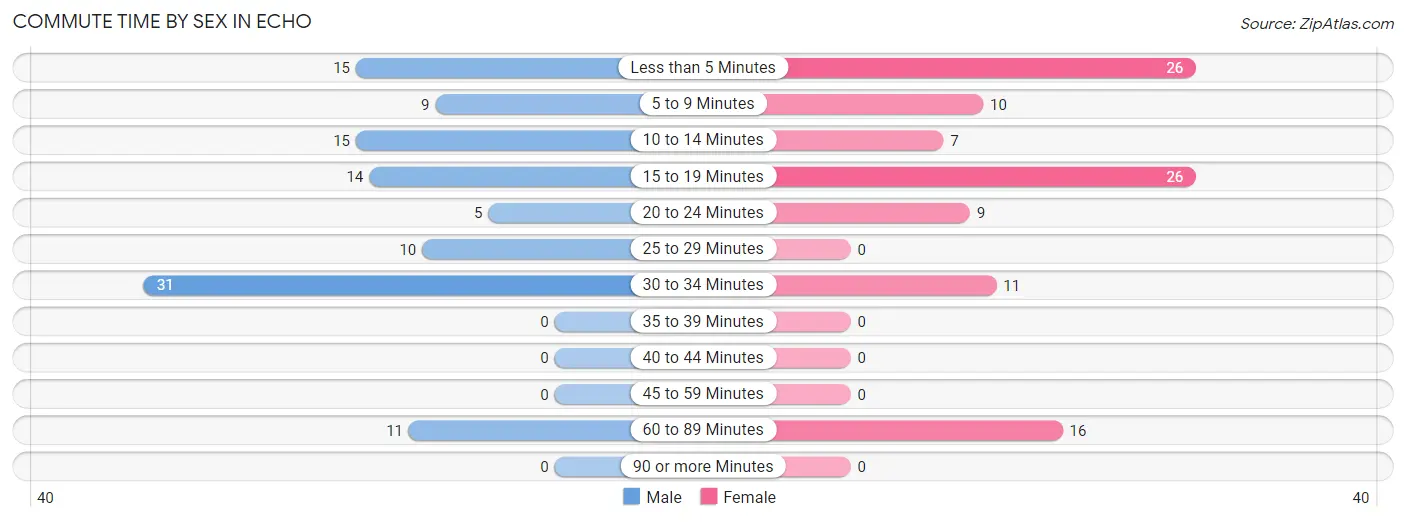
| Commute Time | Male | Female |
| Less than 5 Minutes | 15 (13.6%) | 26 (24.8%) |
| 5 to 9 Minutes | 9 (8.2%) | 10 (9.5%) |
| 10 to 14 Minutes | 15 (13.6%) | 7 (6.7%) |
| 15 to 19 Minutes | 14 (12.7%) | 26 (24.8%) |
| 20 to 24 Minutes | 5 (4.5%) | 9 (8.6%) |
| 25 to 29 Minutes | 10 (9.1%) | 0 (0.0%) |
| 30 to 34 Minutes | 31 (28.2%) | 11 (10.5%) |
| 35 to 39 Minutes | 0 (0.0%) | 0 (0.0%) |
| 40 to 44 Minutes | 0 (0.0%) | 0 (0.0%) |
| 45 to 59 Minutes | 0 (0.0%) | 0 (0.0%) |
| 60 to 89 Minutes | 11 (10.0%) | 16 (15.2%) |
| 90 or more Minutes | 0 (0.0%) | 0 (0.0%) |
Time of Departure to Work by Sex in Echo
The most frequent times of departure to work in Echo are 12:00 AM to 4:59 AM (28, 25.5%) for males and 6:30 AM to 6:59 AM (24, 22.9%) for females.
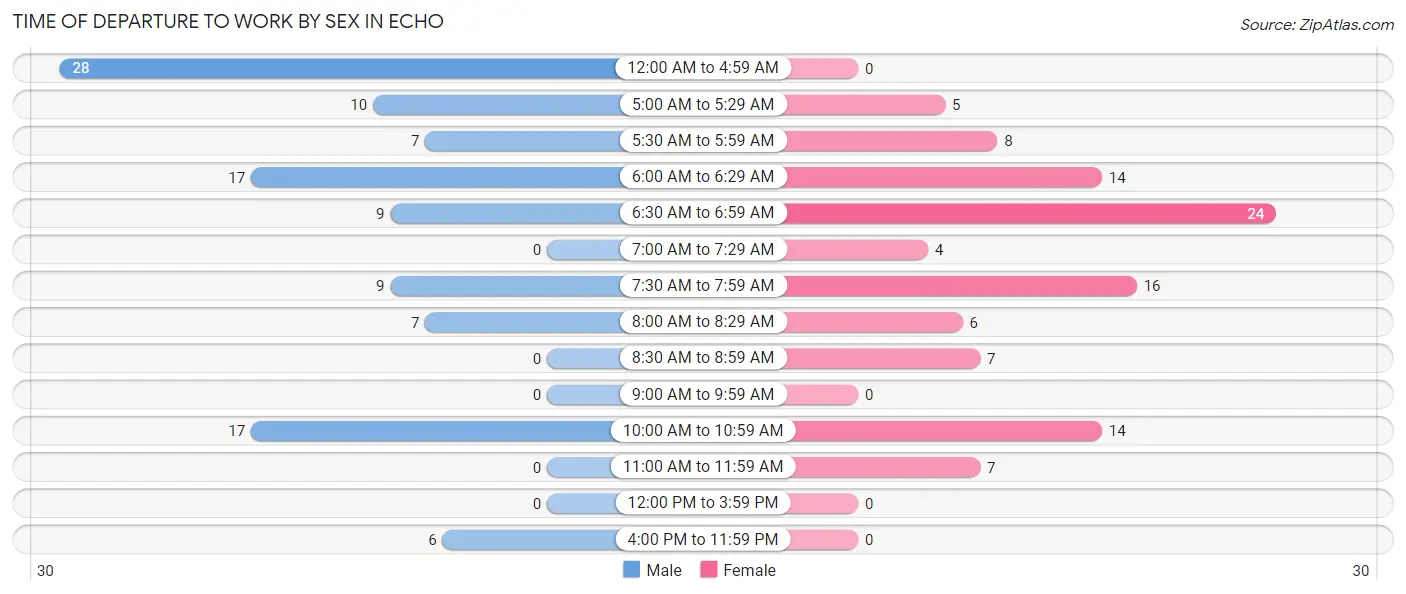
| Time of Departure | Male | Female |
| 12:00 AM to 4:59 AM | 28 (25.5%) | 0 (0.0%) |
| 5:00 AM to 5:29 AM | 10 (9.1%) | 5 (4.8%) |
| 5:30 AM to 5:59 AM | 7 (6.4%) | 8 (7.6%) |
| 6:00 AM to 6:29 AM | 17 (15.4%) | 14 (13.3%) |
| 6:30 AM to 6:59 AM | 9 (8.2%) | 24 (22.9%) |
| 7:00 AM to 7:29 AM | 0 (0.0%) | 4 (3.8%) |
| 7:30 AM to 7:59 AM | 9 (8.2%) | 16 (15.2%) |
| 8:00 AM to 8:29 AM | 7 (6.4%) | 6 (5.7%) |
| 8:30 AM to 8:59 AM | 0 (0.0%) | 7 (6.7%) |
| 9:00 AM to 9:59 AM | 0 (0.0%) | 0 (0.0%) |
| 10:00 AM to 10:59 AM | 17 (15.4%) | 14 (13.3%) |
| 11:00 AM to 11:59 AM | 0 (0.0%) | 7 (6.7%) |
| 12:00 PM to 3:59 PM | 0 (0.0%) | 0 (0.0%) |
| 4:00 PM to 11:59 PM | 6 (5.4%) | 0 (0.0%) |
| Total | 110 (100.0%) | 105 (100.0%) |
Housing Occupancy in Echo
Occupancy by Ownership in Echo
Of the total 207 dwellings in Echo, owner-occupied units account for 98 (47.3%), while renter-occupied units make up 109 (52.7%).
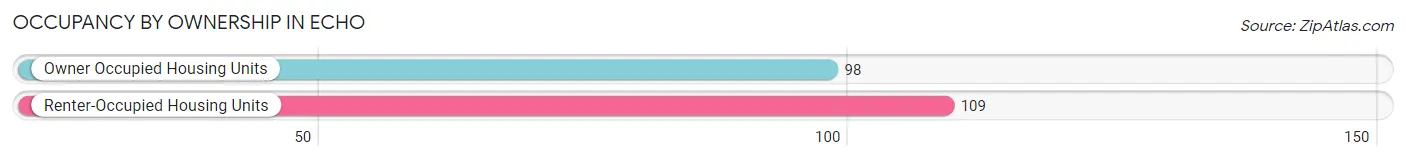
| Occupancy | # Housing Units | % Housing Units |
| Owner Occupied Housing Units | 98 | 47.3% |
| Renter-Occupied Housing Units | 109 | 52.7% |
| Total Occupied Housing Units | 207 | 100.0% |
Occupancy by Household Size in Echo
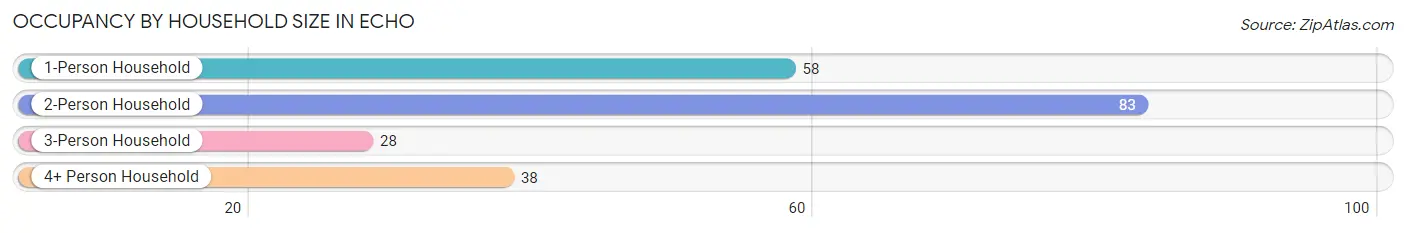
| Household Size | # Housing Units | % Housing Units |
| 1-Person Household | 58 | 28.0% |
| 2-Person Household | 83 | 40.1% |
| 3-Person Household | 28 | 13.5% |
| 4+ Person Household | 38 | 18.4% |
| Total Housing Units | 207 | 100.0% |
Occupancy by Ownership by Household Size in Echo
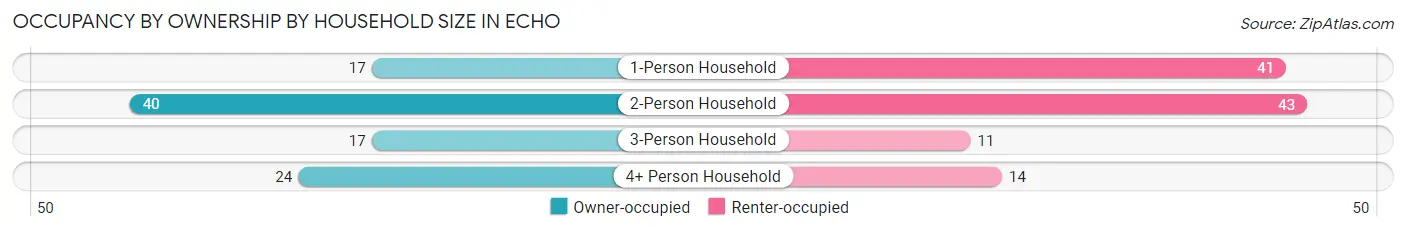
| Household Size | Owner-occupied | Renter-occupied |
| 1-Person Household | 17 (29.3%) | 41 (70.7%) |
| 2-Person Household | 40 (48.2%) | 43 (51.8%) |
| 3-Person Household | 17 (60.7%) | 11 (39.3%) |
| 4+ Person Household | 24 (63.2%) | 14 (36.8%) |
| Total Housing Units | 98 (47.3%) | 109 (52.7%) |
Occupancy by Educational Attainment in Echo
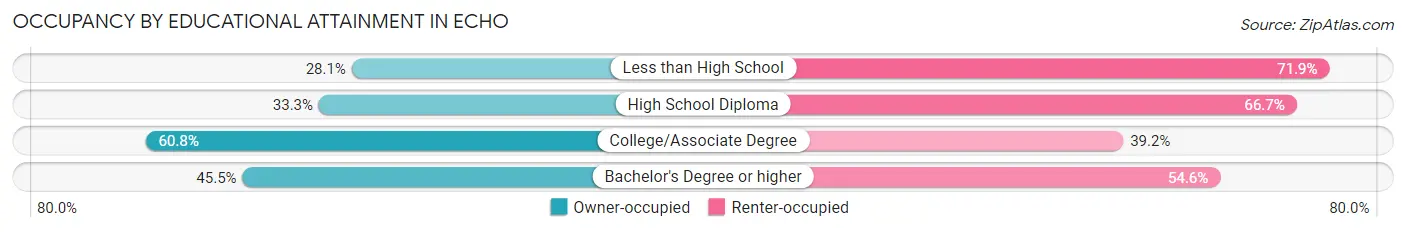
| Household Size | Owner-occupied | Renter-occupied |
| Less than High School | 9 (28.1%) | 23 (71.9%) |
| High School Diploma | 15 (33.3%) | 30 (66.7%) |
| College/Associate Degree | 59 (60.8%) | 38 (39.2%) |
| Bachelor's Degree or higher | 15 (45.5%) | 18 (54.5%) |
Occupancy by Age of Householder in Echo
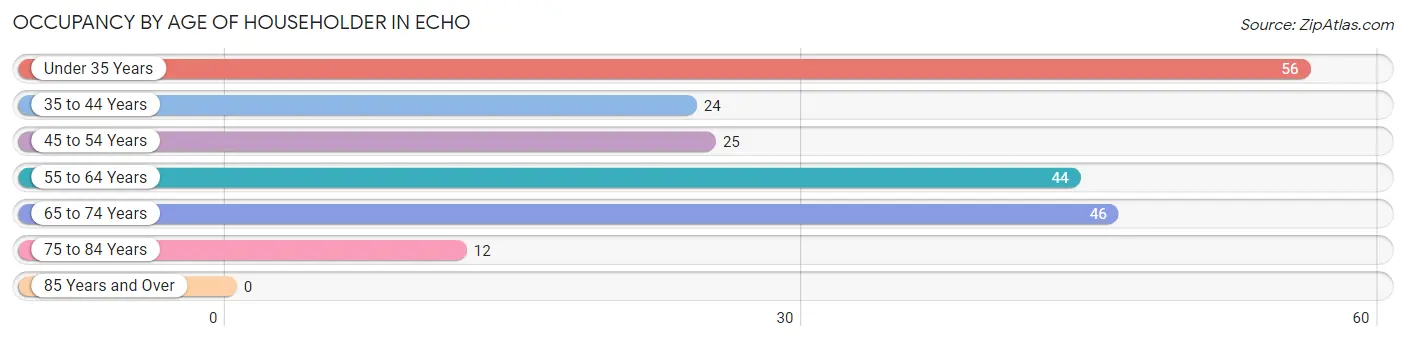
| Age Bracket | # Households | % Households |
| Under 35 Years | 56 | 27.1% |
| 35 to 44 Years | 24 | 11.6% |
| 45 to 54 Years | 25 | 12.1% |
| 55 to 64 Years | 44 | 21.3% |
| 65 to 74 Years | 46 | 22.2% |
| 75 to 84 Years | 12 | 5.8% |
| 85 Years and Over | 0 | 0.0% |
| Total | 207 | 100.0% |
Housing Finances in Echo
Median Income by Occupancy in Echo
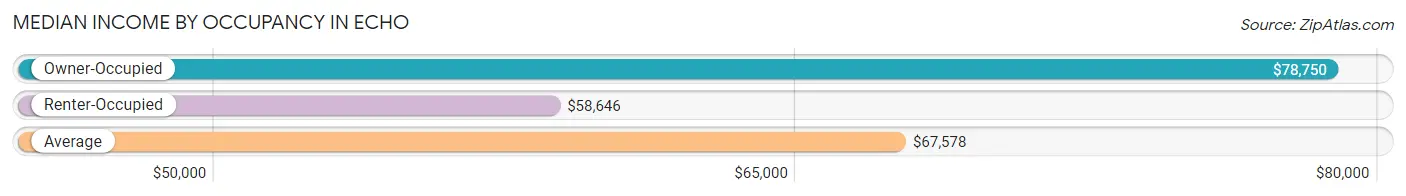
| Occupancy Type | # Households | Median Income |
| Owner-Occupied | 98 (47.3%) | $78,750 |
| Renter-Occupied | 109 (52.7%) | $58,646 |
| Average | 207 (100.0%) | $67,578 |
Occupancy by Householder Income Bracket in Echo
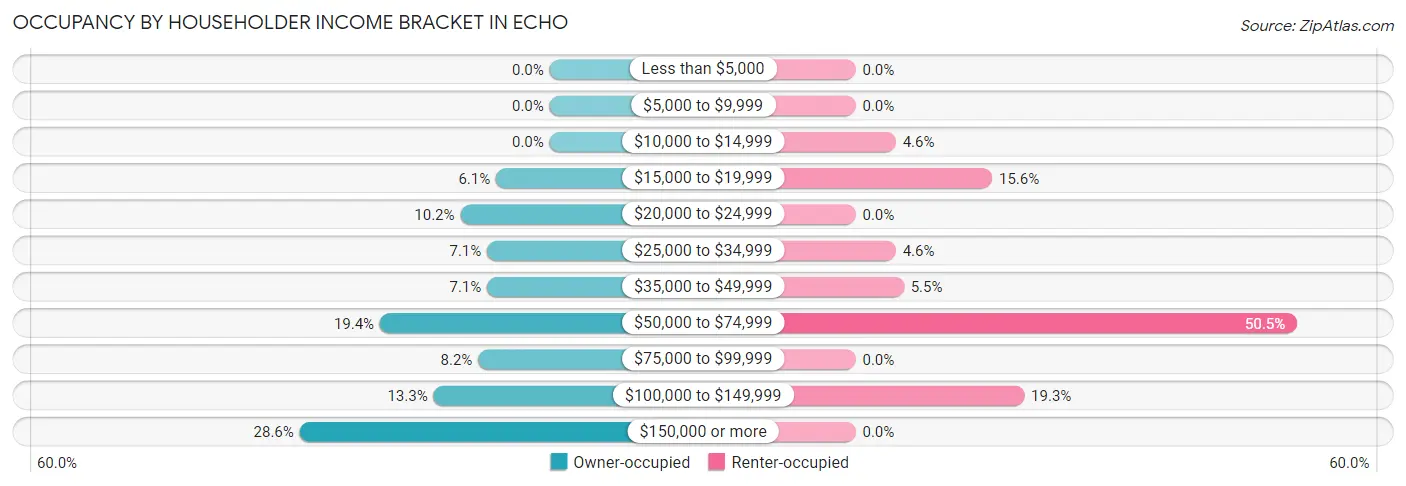
| Income Bracket | Owner-occupied | Renter-occupied |
| Less than $5,000 | 0 (0.0%) | 0 (0.0%) |
| $5,000 to $9,999 | 0 (0.0%) | 0 (0.0%) |
| $10,000 to $14,999 | 0 (0.0%) | 5 (4.6%) |
| $15,000 to $19,999 | 6 (6.1%) | 17 (15.6%) |
| $20,000 to $24,999 | 10 (10.2%) | 0 (0.0%) |
| $25,000 to $34,999 | 7 (7.1%) | 5 (4.6%) |
| $35,000 to $49,999 | 7 (7.1%) | 6 (5.5%) |
| $50,000 to $74,999 | 19 (19.4%) | 55 (50.5%) |
| $75,000 to $99,999 | 8 (8.2%) | 0 (0.0%) |
| $100,000 to $149,999 | 13 (13.3%) | 21 (19.3%) |
| $150,000 or more | 28 (28.6%) | 0 (0.0%) |
| Total | 98 (100.0%) | 109 (100.0%) |
Monthly Housing Cost Tiers in Echo
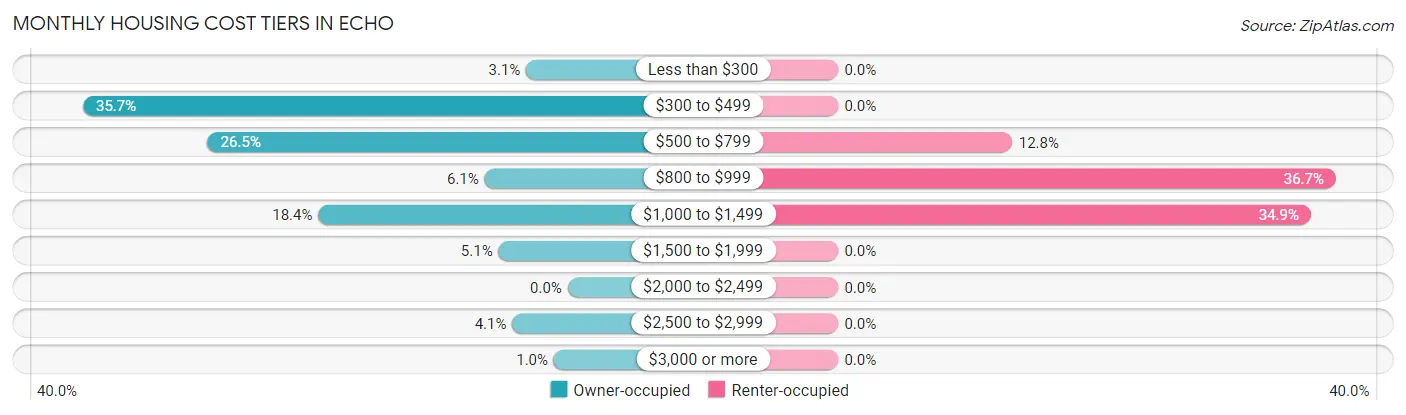
| Monthly Cost | Owner-occupied | Renter-occupied |
| Less than $300 | 3 (3.1%) | 0 (0.0%) |
| $300 to $499 | 35 (35.7%) | 0 (0.0%) |
| $500 to $799 | 26 (26.5%) | 14 (12.8%) |
| $800 to $999 | 6 (6.1%) | 40 (36.7%) |
| $1,000 to $1,499 | 18 (18.4%) | 38 (34.9%) |
| $1,500 to $1,999 | 5 (5.1%) | 0 (0.0%) |
| $2,000 to $2,499 | 0 (0.0%) | 0 (0.0%) |
| $2,500 to $2,999 | 4 (4.1%) | 0 (0.0%) |
| $3,000 or more | 1 (1.0%) | 0 (0.0%) |
| Total | 98 (100.0%) | 109 (100.0%) |
Physical Housing Characteristics in Echo
Housing Structures in Echo
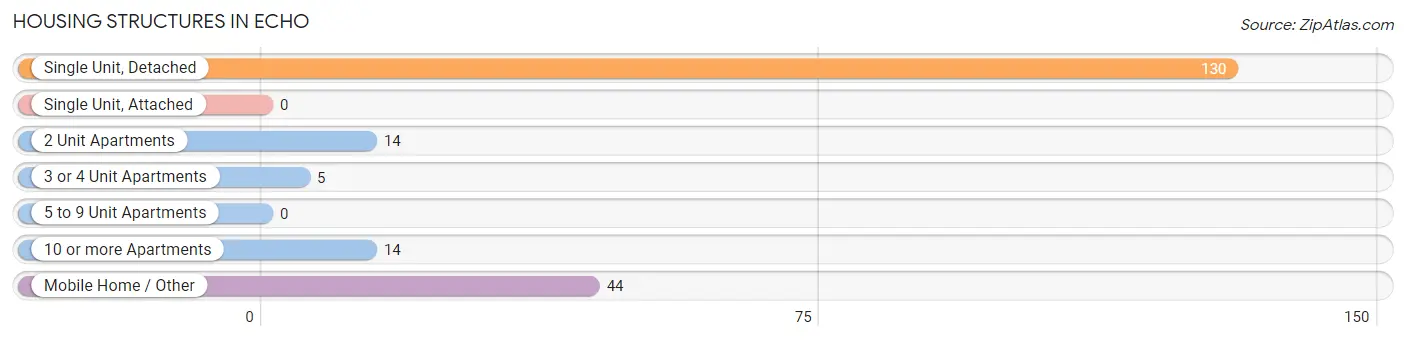
| Structure Type | # Housing Units | % Housing Units |
| Single Unit, Detached | 130 | 62.8% |
| Single Unit, Attached | 0 | 0.0% |
| 2 Unit Apartments | 14 | 6.8% |
| 3 or 4 Unit Apartments | 5 | 2.4% |
| 5 to 9 Unit Apartments | 0 | 0.0% |
| 10 or more Apartments | 14 | 6.8% |
| Mobile Home / Other | 44 | 21.3% |
| Total | 207 | 100.0% |
Housing Structures by Occupancy in Echo
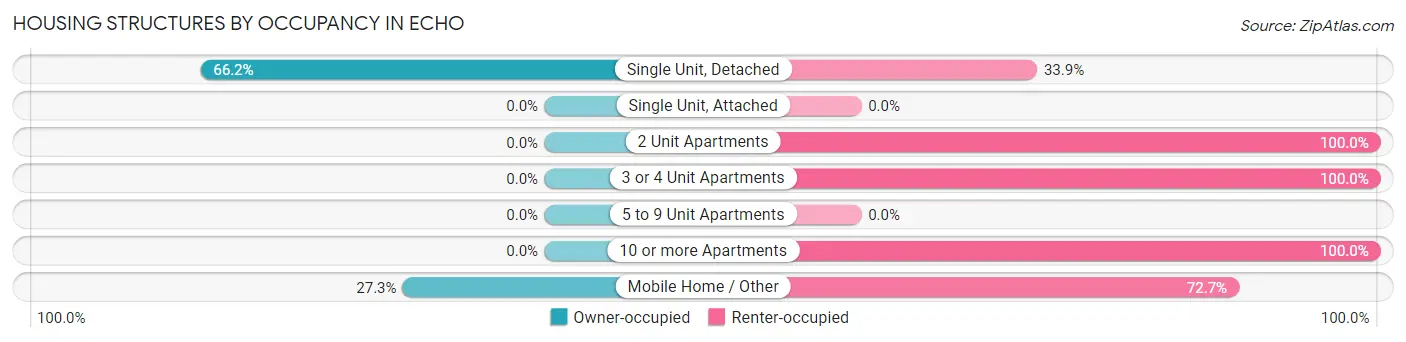
| Structure Type | Owner-occupied | Renter-occupied |
| Single Unit, Detached | 86 (66.1%) | 44 (33.9%) |
| Single Unit, Attached | 0 (0.0%) | 0 (0.0%) |
| 2 Unit Apartments | 0 (0.0%) | 14 (100.0%) |
| 3 or 4 Unit Apartments | 0 (0.0%) | 5 (100.0%) |
| 5 to 9 Unit Apartments | 0 (0.0%) | 0 (0.0%) |
| 10 or more Apartments | 0 (0.0%) | 14 (100.0%) |
| Mobile Home / Other | 12 (27.3%) | 32 (72.7%) |
| Total | 98 (47.3%) | 109 (52.7%) |
Housing Structures by Number of Rooms in Echo
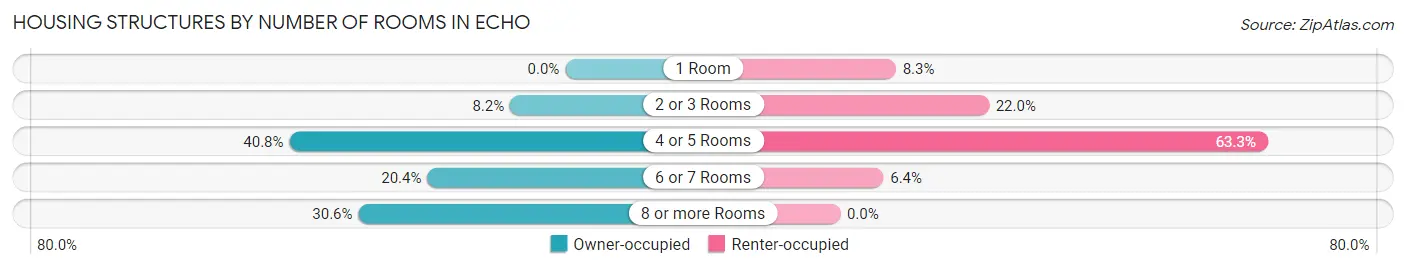
| Number of Rooms | Owner-occupied | Renter-occupied |
| 1 Room | 0 (0.0%) | 9 (8.3%) |
| 2 or 3 Rooms | 8 (8.2%) | 24 (22.0%) |
| 4 or 5 Rooms | 40 (40.8%) | 69 (63.3%) |
| 6 or 7 Rooms | 20 (20.4%) | 7 (6.4%) |
| 8 or more Rooms | 30 (30.6%) | 0 (0.0%) |
| Total | 98 (100.0%) | 109 (100.0%) |
Housing Structure by Heating Type in Echo
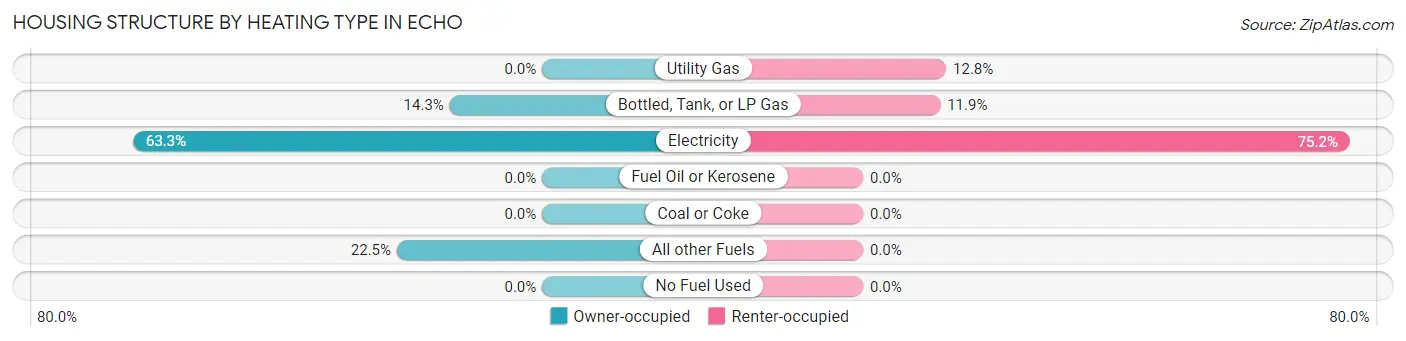
| Heating Type | Owner-occupied | Renter-occupied |
| Utility Gas | 0 (0.0%) | 14 (12.8%) |
| Bottled, Tank, or LP Gas | 14 (14.3%) | 13 (11.9%) |
| Electricity | 62 (63.3%) | 82 (75.2%) |
| Fuel Oil or Kerosene | 0 (0.0%) | 0 (0.0%) |
| Coal or Coke | 0 (0.0%) | 0 (0.0%) |
| All other Fuels | 22 (22.5%) | 0 (0.0%) |
| No Fuel Used | 0 (0.0%) | 0 (0.0%) |
| Total | 98 (100.0%) | 109 (100.0%) |
Household Vehicle Usage in Echo
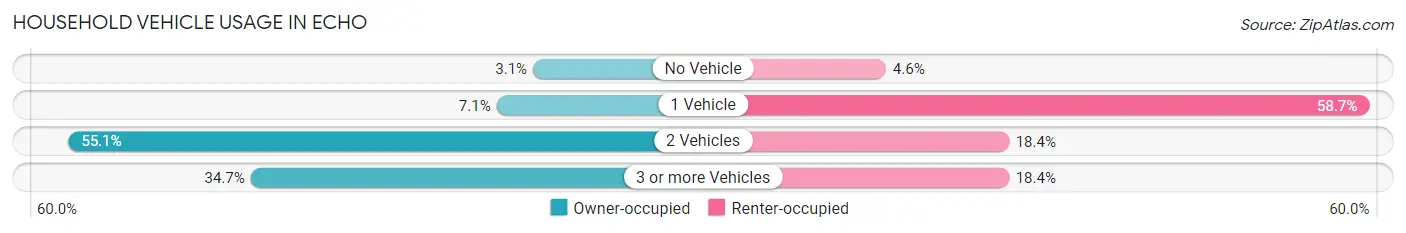
| Vehicles per Household | Owner-occupied | Renter-occupied |
| No Vehicle | 3 (3.1%) | 5 (4.6%) |
| 1 Vehicle | 7 (7.1%) | 64 (58.7%) |
| 2 Vehicles | 54 (55.1%) | 20 (18.3%) |
| 3 or more Vehicles | 34 (34.7%) | 20 (18.3%) |
| Total | 98 (100.0%) | 109 (100.0%) |
Real Estate & Mortgages in Echo
Real Estate and Mortgage Overview in Echo
| Characteristic | Without Mortgage | With Mortgage |
| Housing Units | 47 | 51 |
| Median Property Value | $157,800 | $140,600 |
| Median Household Income | $57,292 | $22 |
| Monthly Housing Costs | $424 | $0 |
| Real Estate Taxes | $1,446 | $0 |
Property Value by Mortgage Status in Echo
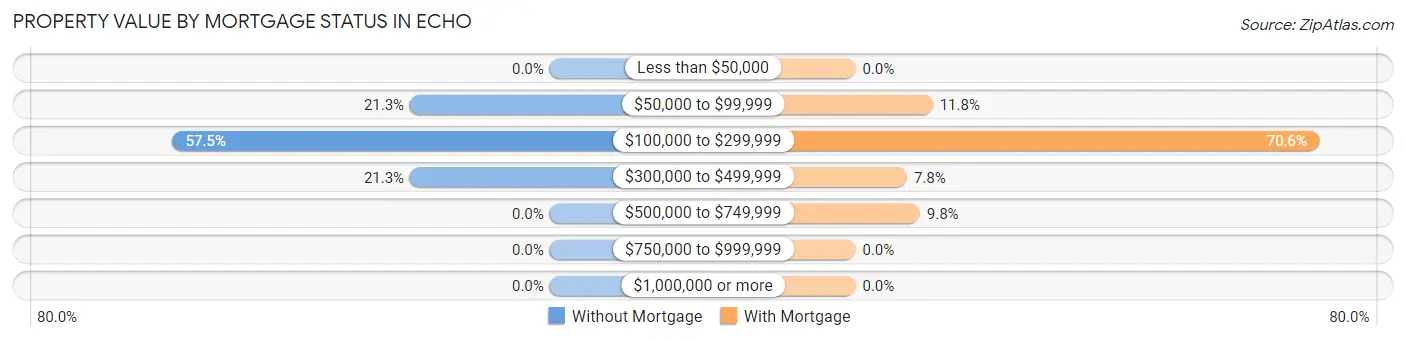
| Property Value | Without Mortgage | With Mortgage |
| Less than $50,000 | 0 (0.0%) | 0 (0.0%) |
| $50,000 to $99,999 | 10 (21.3%) | 6 (11.8%) |
| $100,000 to $299,999 | 27 (57.5%) | 36 (70.6%) |
| $300,000 to $499,999 | 10 (21.3%) | 4 (7.8%) |
| $500,000 to $749,999 | 0 (0.0%) | 5 (9.8%) |
| $750,000 to $999,999 | 0 (0.0%) | 0 (0.0%) |
| $1,000,000 or more | 0 (0.0%) | 0 (0.0%) |
| Total | 47 (100.0%) | 51 (100.0%) |
Household Income by Mortgage Status in Echo
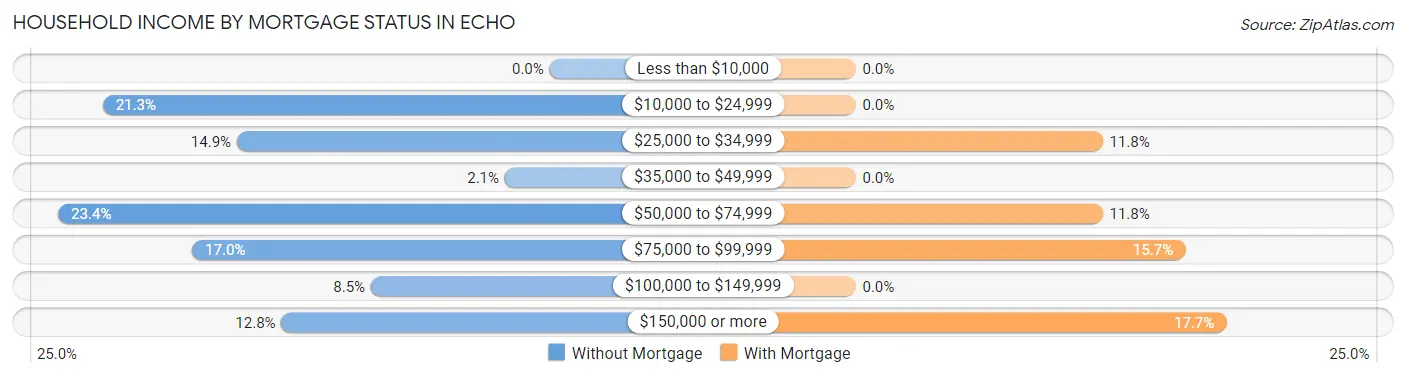
| Household Income | Without Mortgage | With Mortgage |
| Less than $10,000 | 0 (0.0%) | 0 (0.0%) |
| $10,000 to $24,999 | 10 (21.3%) | 0 (0.0%) |
| $25,000 to $34,999 | 7 (14.9%) | 6 (11.8%) |
| $35,000 to $49,999 | 1 (2.1%) | 0 (0.0%) |
| $50,000 to $74,999 | 11 (23.4%) | 6 (11.8%) |
| $75,000 to $99,999 | 8 (17.0%) | 8 (15.7%) |
| $100,000 to $149,999 | 4 (8.5%) | 0 (0.0%) |
| $150,000 or more | 6 (12.8%) | 9 (17.6%) |
| Total | 47 (100.0%) | 51 (100.0%) |
Property Value to Household Income Ratio in Echo
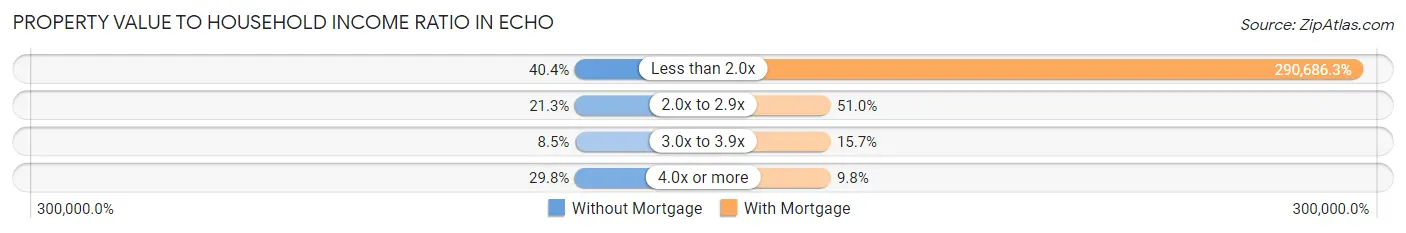
| Value-to-Income Ratio | Without Mortgage | With Mortgage |
| Less than 2.0x | 19 (40.4%) | 148,250 (290,686.3%) |
| 2.0x to 2.9x | 10 (21.3%) | 26 (51.0%) |
| 3.0x to 3.9x | 4 (8.5%) | 8 (15.7%) |
| 4.0x or more | 14 (29.8%) | 5 (9.8%) |
| Total | 47 (100.0%) | 51 (100.0%) |
Real Estate Taxes by Mortgage Status in Echo
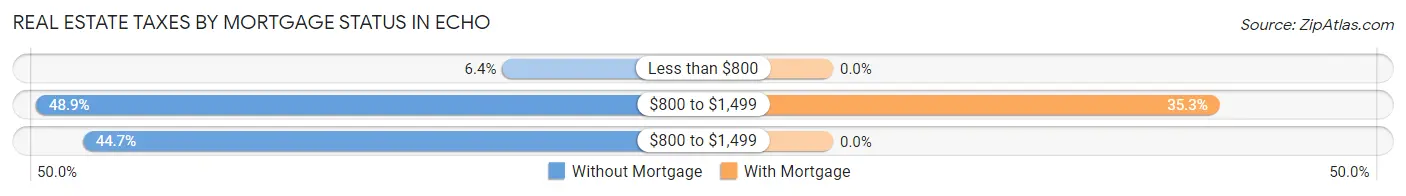
| Property Taxes | Without Mortgage | With Mortgage |
| Less than $800 | 3 (6.4%) | 0 (0.0%) |
| $800 to $1,499 | 23 (48.9%) | 18 (35.3%) |
| $800 to $1,499 | 21 (44.7%) | 0 (0.0%) |
| Total | 47 (100.0%) | 51 (100.0%) |
Health & Disability in Echo
Health Insurance Coverage by Age in Echo
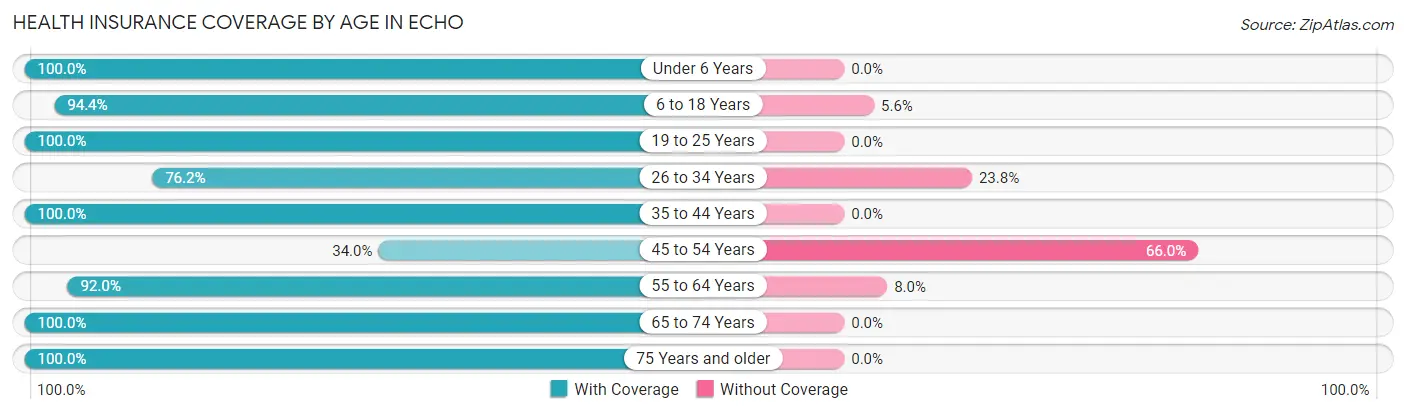
| Age Bracket | With Coverage | Without Coverage |
| Under 6 Years | 32 (100.0%) | 0 (0.0%) |
| 6 to 18 Years | 85 (94.4%) | 5 (5.6%) |
| 19 to 25 Years | 28 (100.0%) | 0 (0.0%) |
| 26 to 34 Years | 48 (76.2%) | 15 (23.8%) |
| 35 to 44 Years | 58 (100.0%) | 0 (0.0%) |
| 45 to 54 Years | 16 (34.0%) | 31 (66.0%) |
| 55 to 64 Years | 69 (92.0%) | 6 (8.0%) |
| 65 to 74 Years | 65 (100.0%) | 0 (0.0%) |
| 75 Years and older | 20 (100.0%) | 0 (0.0%) |
| Total | 421 (88.1%) | 57 (11.9%) |
Health Insurance Coverage by Citizenship Status in Echo
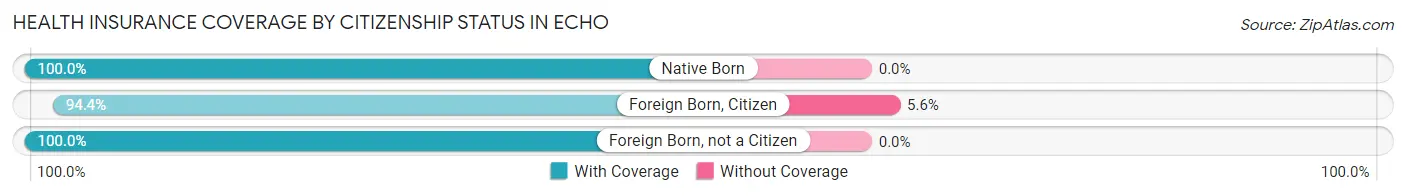
| Citizenship Status | With Coverage | Without Coverage |
| Native Born | 32 (100.0%) | 0 (0.0%) |
| Foreign Born, Citizen | 85 (94.4%) | 5 (5.6%) |
| Foreign Born, not a Citizen | 28 (100.0%) | 0 (0.0%) |
Health Insurance Coverage by Household Income in Echo
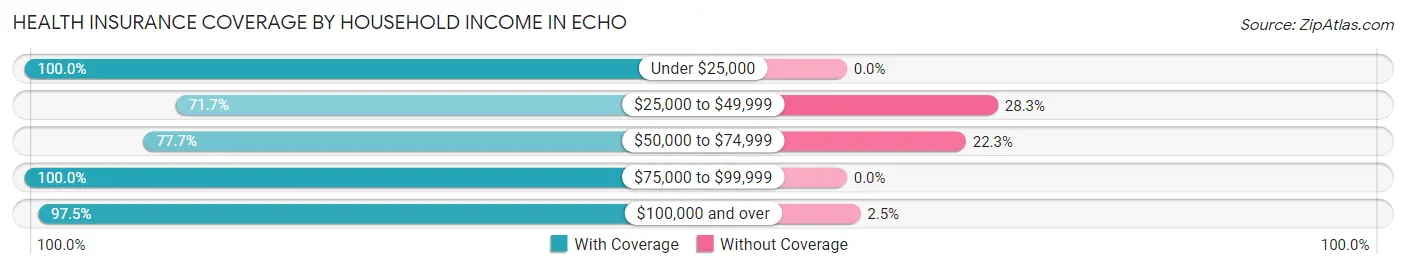
| Household Income | With Coverage | Without Coverage |
| Under $25,000 | 43 (100.0%) | 0 (0.0%) |
| $25,000 to $49,999 | 38 (71.7%) | 15 (28.3%) |
| $50,000 to $74,999 | 129 (77.7%) | 37 (22.3%) |
| $75,000 to $99,999 | 15 (100.0%) | 0 (0.0%) |
| $100,000 and over | 192 (97.5%) | 5 (2.5%) |
Public vs Private Health Insurance Coverage by Age in Echo
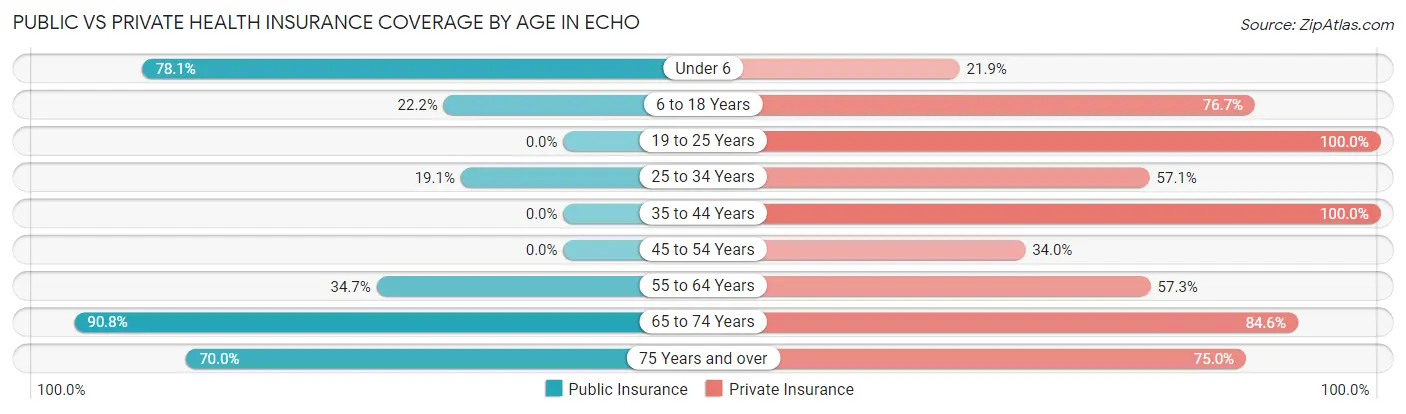
| Age Bracket | Public Insurance | Private Insurance |
| Under 6 | 25 (78.1%) | 7 (21.9%) |
| 6 to 18 Years | 20 (22.2%) | 69 (76.7%) |
| 19 to 25 Years | 0 (0.0%) | 28 (100.0%) |
| 25 to 34 Years | 12 (19.1%) | 36 (57.1%) |
| 35 to 44 Years | 0 (0.0%) | 58 (100.0%) |
| 45 to 54 Years | 0 (0.0%) | 16 (34.0%) |
| 55 to 64 Years | 26 (34.7%) | 43 (57.3%) |
| 65 to 74 Years | 59 (90.8%) | 55 (84.6%) |
| 75 Years and over | 14 (70.0%) | 15 (75.0%) |
| Total | 156 (32.6%) | 327 (68.4%) |
Disability Status by Sex by Age in Echo
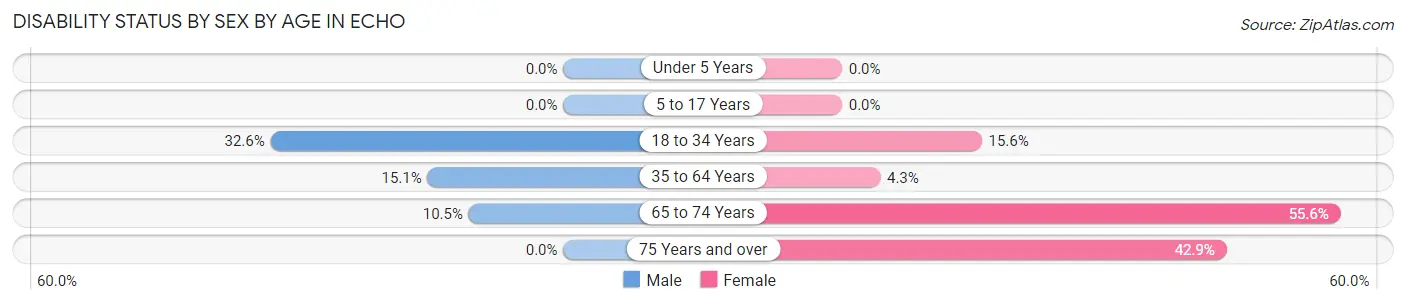
| Age Bracket | Male | Female |
| Under 5 Years | 0 (0.0%) | 0 (0.0%) |
| 5 to 17 Years | 0 (0.0%) | 0 (0.0%) |
| 18 to 34 Years | 15 (32.6%) | 7 (15.6%) |
| 35 to 64 Years | 13 (15.1%) | 4 (4.3%) |
| 65 to 74 Years | 4 (10.5%) | 15 (55.6%) |
| 75 Years and over | 0 (0.0%) | 6 (42.9%) |
Disability Class by Sex by Age in Echo
Disability Class: Hearing Difficulty
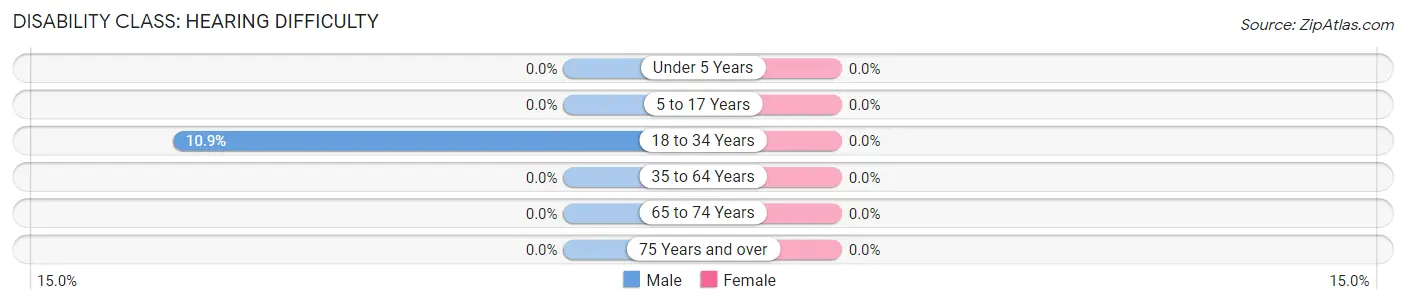
| Age Bracket | Male | Female |
| Under 5 Years | 0 (0.0%) | 0 (0.0%) |
| 5 to 17 Years | 0 (0.0%) | 0 (0.0%) |
| 18 to 34 Years | 5 (10.9%) | 0 (0.0%) |
| 35 to 64 Years | 0 (0.0%) | 0 (0.0%) |
| 65 to 74 Years | 0 (0.0%) | 0 (0.0%) |
| 75 Years and over | 0 (0.0%) | 0 (0.0%) |
Disability Class: Vision Difficulty
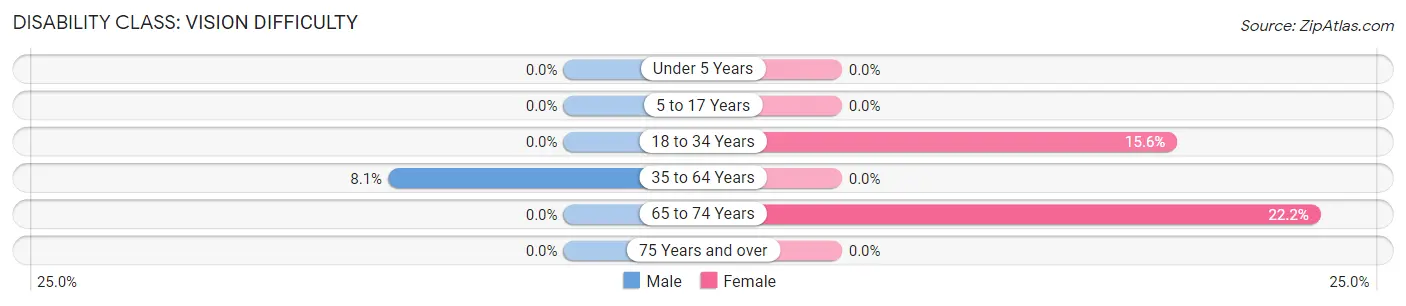
| Age Bracket | Male | Female |
| Under 5 Years | 0 (0.0%) | 0 (0.0%) |
| 5 to 17 Years | 0 (0.0%) | 0 (0.0%) |
| 18 to 34 Years | 0 (0.0%) | 7 (15.6%) |
| 35 to 64 Years | 7 (8.1%) | 0 (0.0%) |
| 65 to 74 Years | 0 (0.0%) | 6 (22.2%) |
| 75 Years and over | 0 (0.0%) | 0 (0.0%) |
Disability Class: Cognitive Difficulty
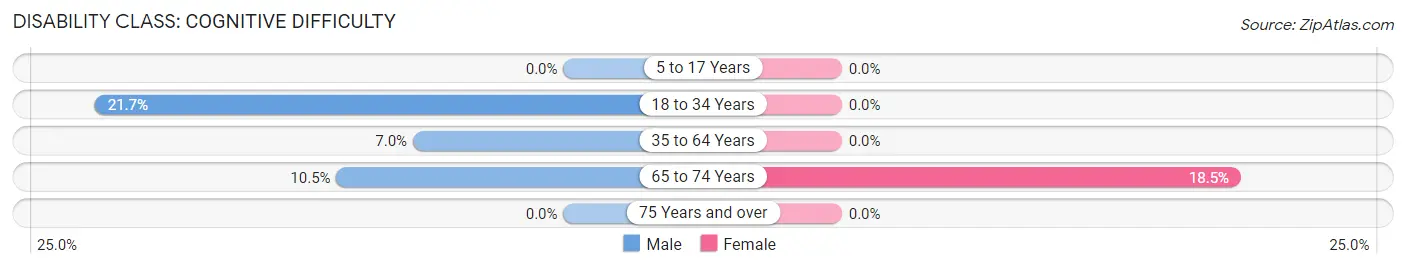
| Age Bracket | Male | Female |
| 5 to 17 Years | 0 (0.0%) | 0 (0.0%) |
| 18 to 34 Years | 10 (21.7%) | 0 (0.0%) |
| 35 to 64 Years | 6 (7.0%) | 0 (0.0%) |
| 65 to 74 Years | 4 (10.5%) | 5 (18.5%) |
| 75 Years and over | 0 (0.0%) | 0 (0.0%) |
Disability Class: Ambulatory Difficulty
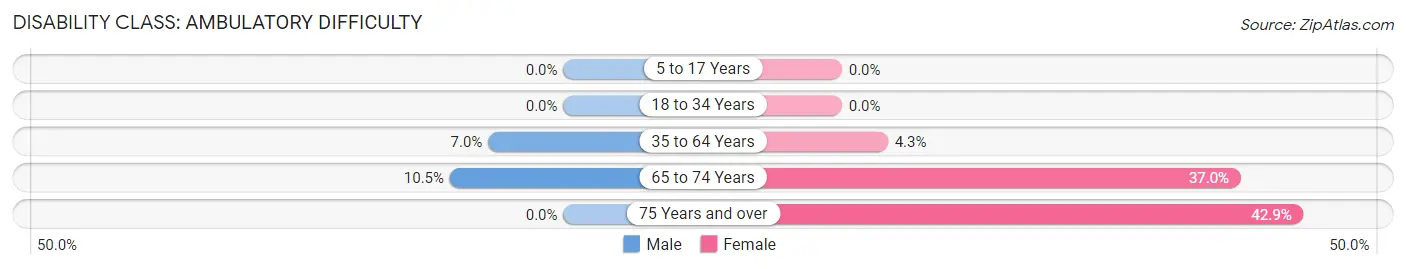
| Age Bracket | Male | Female |
| 5 to 17 Years | 0 (0.0%) | 0 (0.0%) |
| 18 to 34 Years | 0 (0.0%) | 0 (0.0%) |
| 35 to 64 Years | 6 (7.0%) | 4 (4.3%) |
| 65 to 74 Years | 4 (10.5%) | 10 (37.0%) |
| 75 Years and over | 0 (0.0%) | 6 (42.9%) |
Disability Class: Self-Care Difficulty
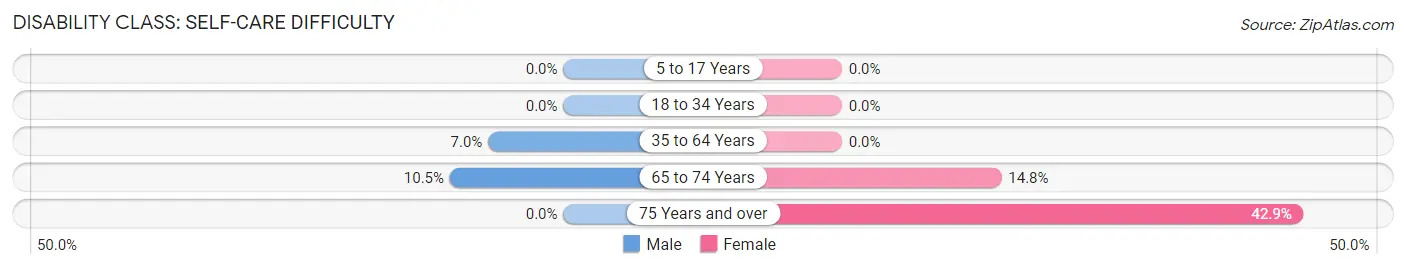
| Age Bracket | Male | Female |
| 5 to 17 Years | 0 (0.0%) | 0 (0.0%) |
| 18 to 34 Years | 0 (0.0%) | 0 (0.0%) |
| 35 to 64 Years | 6 (7.0%) | 0 (0.0%) |
| 65 to 74 Years | 4 (10.5%) | 4 (14.8%) |
| 75 Years and over | 0 (0.0%) | 6 (42.9%) |
Technology Access in Echo
Computing Device Access in Echo
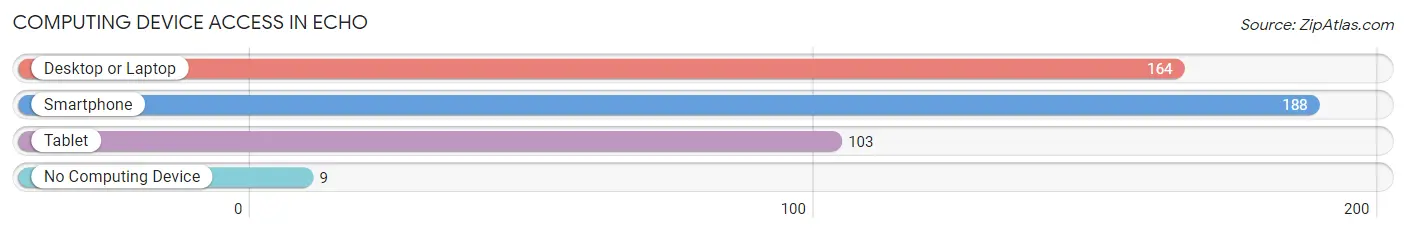
| Device Type | # Households | % Households |
| Desktop or Laptop | 164 | 79.2% |
| Smartphone | 188 | 90.8% |
| Tablet | 103 | 49.8% |
| No Computing Device | 9 | 4.3% |
| Total | 207 | 100.0% |
Internet Access in Echo
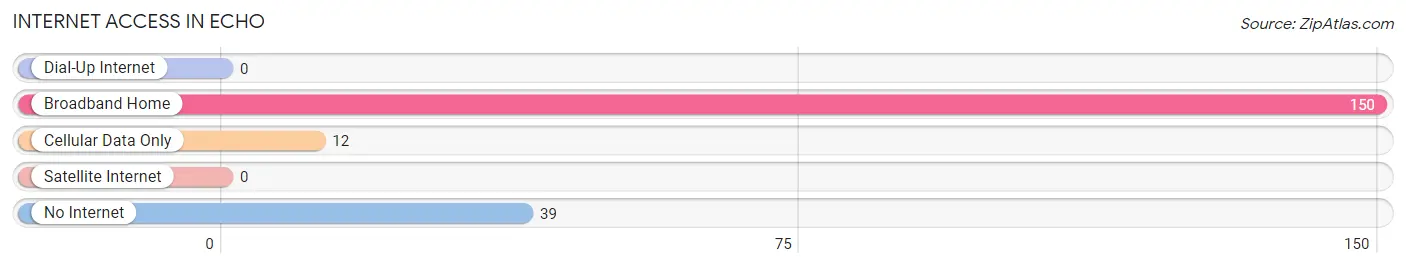
| Internet Type | # Households | % Households |
| Dial-Up Internet | 0 | 0.0% |
| Broadband Home | 150 | 72.5% |
| Cellular Data Only | 12 | 5.8% |
| Satellite Internet | 0 | 0.0% |
| No Internet | 39 | 18.8% |
| Total | 207 | 100.0% |
Echo Summary
History
Echo, Oregon is a small city located in Umatilla County in the northeastern part of the state. It was founded in 1883 by the Oregon Railway and Navigation Company, which was looking to build a railroad line from Portland to the Columbia River. The city was named after the Echo River, which runs through the area.
The first settlers in Echo were mostly farmers and ranchers, who were attracted to the area by its fertile soil and abundant water supply. The railroad line was completed in 1884, and the town quickly grew as a result. By the early 1900s, Echo had become a bustling center of commerce, with a variety of businesses, including a bank, a hotel, a general store, and a post office.
In the early 20th century, Echo was a major stop on the Oregon Trail, and many pioneers passed through the area on their way to the West Coast. The town also served as a supply center for the nearby mining towns of Sumpter and Granite.
Geography
Echo is located in the Blue Mountains of northeastern Oregon, about 50 miles east of Pendleton. The city is situated at the confluence of the Echo and Umatilla Rivers, and is surrounded by rolling hills and lush forests. The area is known for its mild climate and abundant wildlife, including deer, elk, and bighorn sheep.
The city covers an area of about 2.5 square miles, and has an elevation of 2,400 feet. The nearby Umatilla National Forest provides a variety of recreational opportunities, including camping, fishing, and hiking.
Economy
Echo’s economy is largely based on agriculture and tourism. The area is known for its production of wheat, barley, and hay, as well as its cattle and sheep ranches. The city also has a thriving tourism industry, with visitors coming to enjoy the area’s natural beauty and outdoor activities.
The city is home to several businesses, including a grocery store, a hardware store, and a variety of restaurants and cafes. There is also a small airport located just outside of town.
Demographics
As of the 2010 census, Echo had a population of 1,717 people. The racial makeup of the city was 94.3% White, 0.7% Native American, 0.3% Asian, 0.2% African American, and 4.5% from other races. The median household income was $37,917, and the median age was 39.7 years.
Echo is a small, close-knit community with a strong sense of pride and tradition. The city is home to a variety of churches, schools, and other organizations, and hosts a number of annual events, including the Echo Rodeo and the Echo Harvest Festival.
Common Questions
What is Per Capita Income in Echo?
Per Capita income in Echo is $33,634.
What is the Median Family Income in Echo?
Median Family Income in Echo is $71,442.
What is the Median Household income in Echo?
Median Household Income in Echo is $67,578.
What is Income or Wage Gap in Echo?
Income or Wage Gap in Echo is 74.5%.
Women in Echo earn 25.5 cents for every dollar earned by a man.
What is Inequality or Gini Index in Echo?
Inequality or Gini Index in Echo is 0.41.
What is the Total Population of Echo?
Total Population of Echo is 478.
What is the Total Male Population of Echo?
Total Male Population of Echo is 234.
What is the Total Female Population of Echo?
Total Female Population of Echo is 244.
What is the Ratio of Males per 100 Females in Echo?
There are 95.90 Males per 100 Females in Echo.
What is the Ratio of Females per 100 Males in Echo?
There are 104.27 Females per 100 Males in Echo.
What is the Median Population Age in Echo?
Median Population Age in Echo is 38.6 Years.
What is the Average Family Size in Echo
Average Family Size in Echo is 2.8 People.
What is the Average Household Size in Echo
Average Household Size in Echo is 2.3 People.
How Large is the Labor Force in Echo?
There are 245 People in the Labor Forcein in Echo.
What is the Percentage of People in the Labor Force in Echo?
67.1% of People are in the Labor Force in Echo.
What is the Unemployment Rate in Echo?
Unemployment Rate in Echo is 8.2%.