Zip Codes with the Highest Percentage of Population Employed in Administrative & Support Services in Eugene, OR
RELATED REPORTS & OPTIONS
Administrative & Support Services
Eugene
Compare Zip Codes
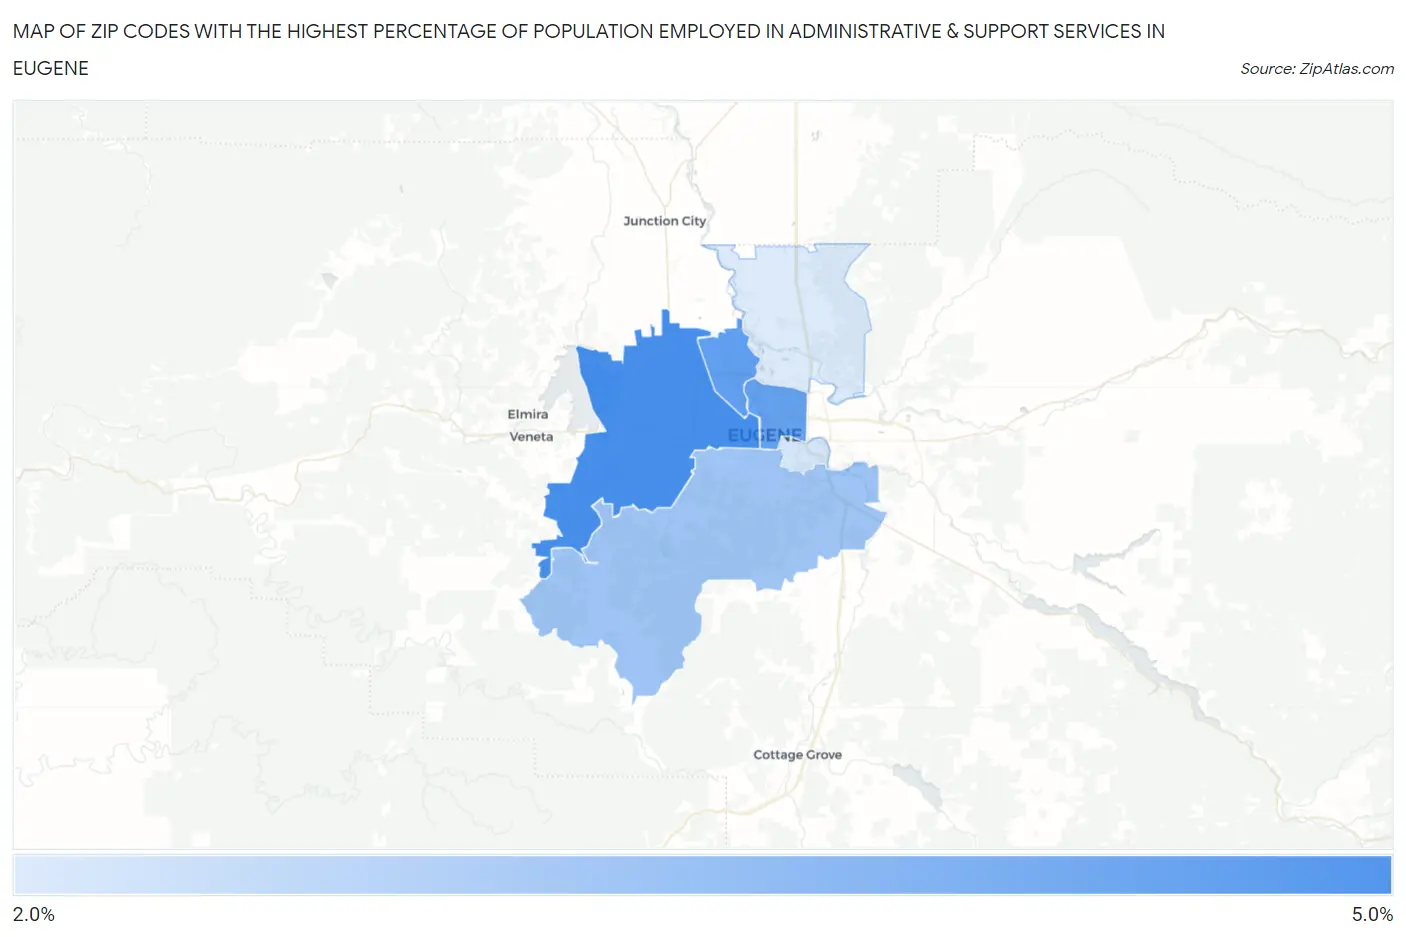
Map of Zip Codes with the Highest Percentage of Population Employed in Administrative & Support Services in Eugene
2.0%
4.6%
Zip Codes with the Highest Percentage of Population Employed in Administrative & Support Services in Eugene, OR
| Zip Code | % Employed | vs State | vs National | |
| 1. | 97402 | 4.6% | 3.9%(+0.668)#115 | 4.1%(+0.461)#8,334 |
| 2. | 97404 | 4.2% | 3.9%(+0.231)#138 | 4.1%(+0.024)#9,948 |
| 3. | 97401 | 4.1% | 3.9%(+0.149)#146 | 4.1%(-0.058)#10,272 |
| 4. | 97405 | 3.1% | 3.9%(-0.840)#211 | 4.1%(-1.05)#14,970 |
| 5. | 97403 | 2.1% | 3.9%(-1.81)#256 | 4.1%(-2.02)#20,003 |
| 6. | 97408 | 2.0% | 3.9%(-1.92)#266 | 4.1%(-2.12)#20,504 |
1
Common Questions
What are the Top 5 Zip Codes with the Highest Percentage of Population Employed in Administrative & Support Services in Eugene, OR?
Top 5 Zip Codes with the Highest Percentage of Population Employed in Administrative & Support Services in Eugene, OR are:
What zip code has the Highest Percentage of Population Employed in Administrative & Support Services in Eugene, OR?
97402 has the Highest Percentage of Population Employed in Administrative & Support Services in Eugene, OR with 4.6%.
What is the Percentage of Population Employed in Administrative & Support Services in Eugene, OR?
Percentage of Population Employed in Administrative & Support Services in Eugene is 3.8%.
What is the Percentage of Population Employed in Administrative & Support Services in Oregon?
Percentage of Population Employed in Administrative & Support Services in Oregon is 3.9%.
What is the Percentage of Population Employed in Administrative & Support Services in the United States?
Percentage of Population Employed in Administrative & Support Services in the United States is 4.1%.