Zip Codes with the Highest Percentage of Population Employed in Administrative & Support Services in Gresham, OR
RELATED REPORTS & OPTIONS
Administrative & Support Services
Gresham
Compare Zip Codes
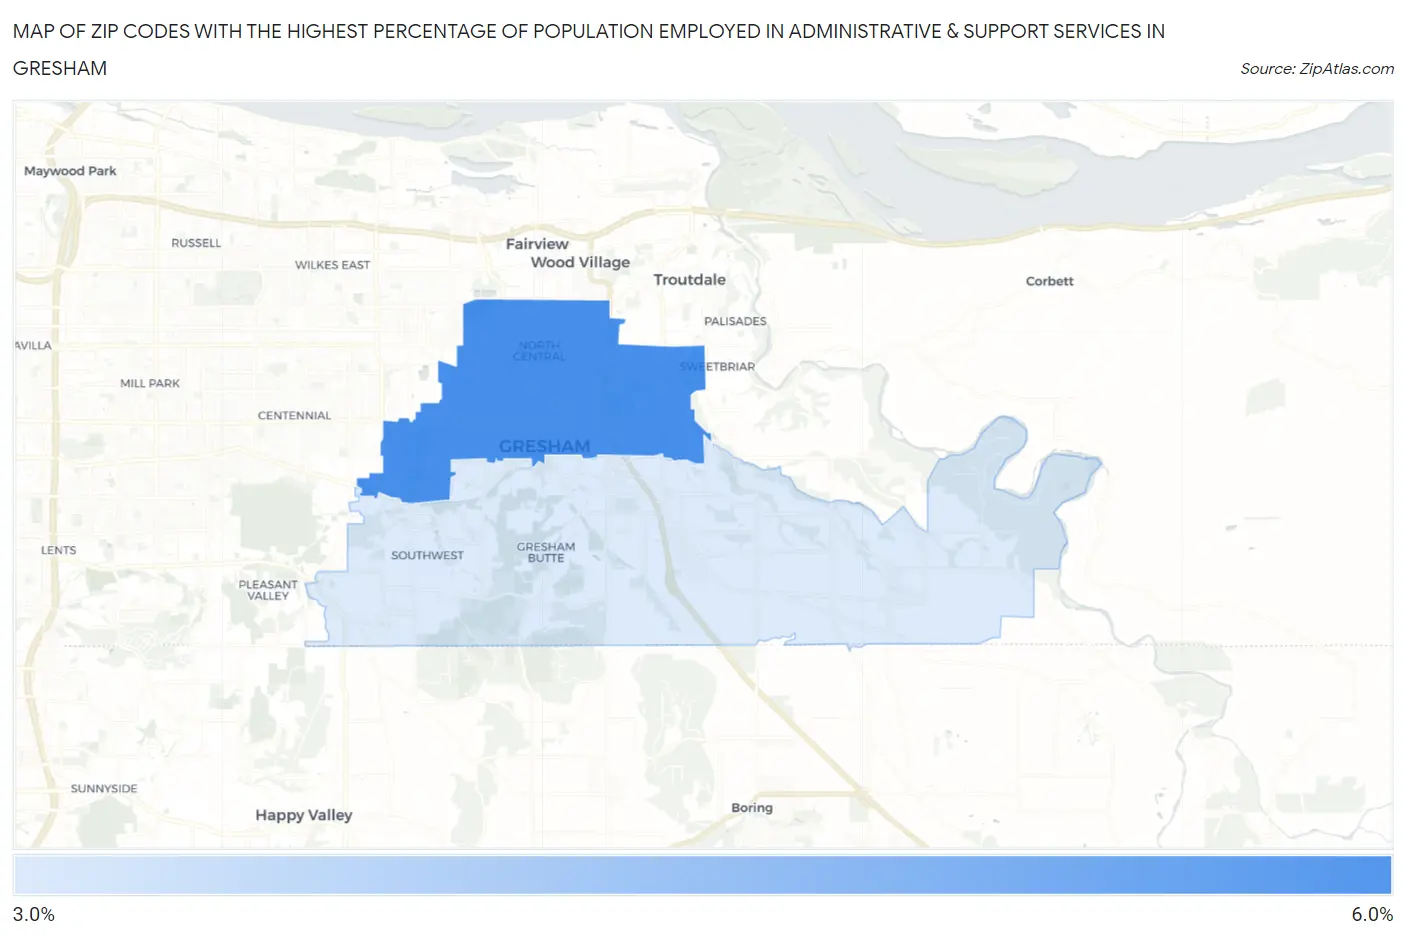
Map of Zip Codes with the Highest Percentage of Population Employed in Administrative & Support Services in Gresham
3.2%
5.4%
Zip Codes with the Highest Percentage of Population Employed in Administrative & Support Services in Gresham, OR
| Zip Code | % Employed | vs State | vs National | |
| 1. | 97030 | 5.4% | 3.9%(+1.49)#84 | 4.1%(+1.28)#5,999 |
| 2. | 97080 | 3.2% | 3.9%(-0.772)#204 | 4.1%(-0.978)#14,620 |
1
Common Questions
What are the Top Zip Codes with the Highest Percentage of Population Employed in Administrative & Support Services in Gresham, OR?
Top Zip Codes with the Highest Percentage of Population Employed in Administrative & Support Services in Gresham, OR are:
What zip code has the Highest Percentage of Population Employed in Administrative & Support Services in Gresham, OR?
97030 has the Highest Percentage of Population Employed in Administrative & Support Services in Gresham, OR with 5.4%.
What is the Percentage of Population Employed in Administrative & Support Services in Gresham, OR?
Percentage of Population Employed in Administrative & Support Services in Gresham is 5.3%.
What is the Percentage of Population Employed in Administrative & Support Services in Oregon?
Percentage of Population Employed in Administrative & Support Services in Oregon is 3.9%.
What is the Percentage of Population Employed in Administrative & Support Services in the United States?
Percentage of Population Employed in Administrative & Support Services in the United States is 4.1%.